zenon environmental, inc. - cross-flow pervaporation ...infohouse.p2ric.org/ref/07/06670.pdf · i...
TRANSCRIPT
i
EPA/540/R-95/511December 1998
ZENON Environmental, Inc.
Cross-Flow PervaporationTechnology
Innovative Technology Evaluation Report
National Risk Management Research LaboratoryOffice of Research and Development
U.S. Environmental Protection AgencyCincinnati, Ohio 45268
ii
Notice
The information in this document has been funded by the U. S. Environmental Protection Agency (EPA) under Contract No.68-C5-0037 to Tetra Tech EM Inc. It has been subjected to the Agency's peer and administrative reviews and has beenapproved for publication as an EPA document. Mention of trade names or commercial products does not constitute anendorsement or recommendation for use.
iii
Foreword
The U. S. Environmental Protection Agency (EPA) is charged by Congress with protecting the Nation's land, air, and waterresources. Under a mandate of national environmental laws, the Agency strives to formulate and implement actions leading toa compatible balance between human activities and the ability of natural systems to nurture life. To meet this mandate, EPA'sresearch program is providing data and technical support for solving environmental problems today and building a scienceknowledge base necessary to manage our ecological resources wisely, understand how pollutants affect our health, and preventor reduce environmental risks in the future.
The National Risk Management Research Laboratory is the Agency's center for investigation of technological and manage-ment approaches for reducing risks from threats to human health and the environment. The focus of the Laboratory's researchprogram is on methods for the prevention and control of pollution to air, land, water and subsurface resources; protection ofwater quality in public water systems; remediation of contaminated sites and groundwater; and prevention and control ofindoor air pollution. The goal of this research effort is to catalyze development and implementation of innovative, cost-effective environmental technologies; develop scientific and engineering information needed by EPA to support regulatory andpolicy decisions; and provide technical support and information transfer to ensure effective implementation of environmentalregulations and strategies.
This publication has been produced as part of the Laboratory's strategic long-term research plan. It is published and madeavailable by EPA's Office of Research and Development to assist the user community and to link researchers with their clients.
E. Timothy Oppelt, DirectorNational Risk Management Research Laboratory

iv
Abstract
The U.S. Environmental Protection Agency (EPA) has focused on policy, technical, and informational issues related toexploring and applying new technologies to Superfund site remediation. One EPA initiative to accelerate the development,demonstration, and use of innovative technologies for site remediation is the Superfund Innovative Technology Evaluation(SITE) Program.
The SITE Program evaluated the ZENON Environmental, Inc. (ZENON), Cross-Flow Pervaporation technology, a membrane-based process that removes volatile organic compounds (VOC) from aqueous matrices. The ZENON technology provides analternative approach to treating organic-contaminated water at sites where conventional treatment technologies are used, suchas air stripping or carbon adsorption. A full-scale demonstration of the technology was performed during February 1995 at aformer waste disposal area (Site 9) at Naval Air Station, North Island (NASNI), in Coronado, California. Groundwater at thesite contains a variety of contaminants, mainly trichloroethene (TCE).
The primary objectives of this demonstration were to (1) determine if the technology could remove TCE in groundwater tobelow the federal maximum contaminant levels (MCL) at varying flow rates, and (2) to determine the removal efficiency forTCE. A number of secondary objectives were also included in the demonstration, including the amount of TCE released fromthe technology to the outside air, the amount of concentrated waste (permeate) generated by the technology, and the costsassociated with its use. To achieve the demonstration objectives, samples of untreated influent, treated effluent, and vaporwere taken from the technology. Sampling and analytical procedures and quality assurance (QA) objectives for thedemonstration were specified in an EPA-approved quality assurance project plan (QAPP).
Lowering TCE concentrations to below MCLs may require multiple passes through the pervaporation module, which canprove impractical when compared to other technologies. The SITE evaluation demonstrated that the ZENON technology isbest suited for reducing high concentrations of VOCs to levels that can be reduced further and more economically byconventional treatment technologies.

v
Contents
Acronyms, Abbreviations, and Symbols ....................................................................................................... ix
Conversion Factors ........................................................................................................................................ xi
Acknowledgments ......................................................................................................................................... xii
Executive Summary ........................................................................................................................................ 1
1 Introduction .............................................................................................................................................. 6
1.1 The SITE Program............................................................................................................................ 6
1.2 Innovative Technology Evaluation Report ...................................................................................... 6
1.3 ZENON Cross-Flow Pervaporation Technology ............................................................................. 7
1.4 Pilot-Scale Demonstration .............................................................................................................. 10
1.5 Full-Scale Demonstration ............................................................................................................... 10
1.6 Key Contacts ................................................................................................................................... 10
2 Technology Applications Analysis ........................................................................................................ 11
2.1 Key Features of the ZENON Treatment Technology .................................................................... 11
2.2 Technology Applicability ............................................................................................................... 11
2.3 Technology Limitations .................................................................................................................. 11
2.4 Process Residuals ........................................................................................................................... 12
2.5 Site Support Requirements ............................................................................................................. 12
2.6 Availability and Transportability of Equipment ............................................................................ 13
2.7 Feasibility Study Evaluation Criteria ............................................................................................. 13
2.7.1 Overall Protection of Human Health and the Environment ............................................ 13
2.7.2 Compliance with Applicable or Relevant and Appropriate Requirements ..................... 13
2.7.3 Long-Term Effectiveness and Permanence ..................................................................... 13
2.7.4 Reduction of Toxicity, Mobility, or Volume Through Treatment .................................. 13
2.7.5 Short-Term Effectiveness................................................................................................. 16
2.7.6 Implementability .............................................................................................................. 16
2.7.7 Cost ................................................................................................................................... 16
2.7.8 State Acceptance .............................................................................................................. 16
2.7.9 Community Acceptance ................................................................................................... 16
2.8 Technology Performance Versus ARARs...................................................................................... 17
2.8.1 Comprehensive Environmental Response, Compensation, and Liability Act ................ 17

vi
2.8.2 Resource Conservation and Recovery Act ...................................................................... 17
2.8.3 Clean Water Act ............................................................................................................... 22
2.8.4 Safe Drinking Water Act ................................................................................................. 23
2.8.5 Clean Air Act ................................................................................................................... 23
2.8.6 Occupational Safety and Health Act ................................................................................ 24
3 Economic Analysis ................................................................................................................................ 25
3.1 Issues and Assumptions .................................................................................................................. 25
3.1.1 Site-Specific Factors ........................................................................................................ 25
3.1.2 Equipment and Operating Parameters ............................................................................. 26
3.1.3 Miscellaneous Factors ...................................................................................................... 26
3.2 Cost Categories ............................................................................................................................... 27
3.2.1 Site Preparation ................................................................................................................ 27
3.2.2 Permitting and Regulatory Costs ..................................................................................... 27
3.2.3 Mobilization and Startup ..................................................................................................29
3.2.4 Equipment Costs .............................................................................................................. 29
3.2.5 Labor ................................................................................................................................ 29
3.2.6 Supplies ............................................................................................................................ 29
3.2.7 Utilities ............................................................................................................................. 30
3.2.8 Effluent Treatment and Disposal Costs ........................................................................... 30
3.2.9 Residual Waste Shipping and Handling .......................................................................... 30
3.2.10 Analytical Services ........................................................................................................... 31
3.2.11 Equipment Maintenance .................................................................................................. 31
3.2.12 Site Demobilization .......................................................................................................... 31
3.3 Conclusions of Economic Analysis ................................................................................................ 31
4 Treatment Effectiveness ........................................................................................................................ 33
4.1 Background ..................................................................................................................................... 33
4.1.1 Naval Air Station North Island ........................................................................................ 33
4.1.2 Site 9 Features .................................................................................................................. 33
4.1.3 Bench-Scale Study ........................................................................................................... 36
4.1.4 Demonstration Objectives and Approach ........................................................................ 38
4.2 Demonstration Procedures .............................................................................................................. 39
4.2.1 Demonstration Preparation .............................................................................................. 39
4.2.2 ZENON System Configuration ........................................................................................ 39
4.2.3 Demonstration Delays ......................................................................................................40
4.2.4 Demonstration Design ......................................................................................................40
4.2.5 Analytical Methodology .................................................................................................. 43
Contents (continued)

vii
Contents (continued)
4.2.6 Quality Assurance and Quality Control Program ............................................................ 44
4.3 Demonstration Results and Conclusions ........................................................................................ 44
4.3.1 Operating Conditions and Parameters ............................................................................. 44
4.3.2 System Maintenance ........................................................................................................45
4.3.3 Results and Discussions ...................................................................................................45
4.3.4 Data Quality ..................................................................................................................... 54
4.3.5 Conclusions ...................................................................................................................... 56
5 ZENON Technology Status ................................................................................................................... 58
6 References .............................................................................................................................................. 59
Appendix
A Analytical Data Tables .......................................................................................................................... 61
Figures
1-1 ZENON Cross-Flow Pervaporation Module .................................................................................... 8
1-2 ZENON Cross-Flow Pervaporation System..................................................................................... 9
3-1 Fixed Costs ..................................................................................................................................... 32
3-2 Annual Variable Costs .................................................................................................................... 32
4-1 NASNI and Site 9 Location Map ................................................................................................... 34
4-2 Site 9 Demonstration Area ............................................................................................................. 35
Tables
ES-1 Feasibility Study Evaluation Criteria for the ZENON Technology ................................................ 4
2-1 Feasibility Study Evaluation Criteria for the ZENON Technology .............................................. 14
2-2 Federal and State ARARS .............................................................................................................. 18
3-1 Costs Associated with the ZENON Treatment Process ................................................................. 28
4-1 Analytical Results for Site 9 Groundwater .................................................................................... 37
4-2 Sampling Overview ........................................................................................................................ 42
4-3 Analytical Methods ........................................................................................................................ 43
4-4 Trichloroethene Concentration Summary ...................................................................................... 47
4-5 Mass Balance Figures ..................................................................................................................... 48
4-6 Estimated Permeate Generation ..................................................................................................... 51
4-7 TCE Concentrations in Vented Vapor ........................................................................................... 52
viii
Acronyms, Abbreviations, and Symbols
ARAR Applicable or Relevant and Appropriate Requirements
BACT Best Available Control Technologies
bgs Below ground surface
CAA Clean Air Act
CERCLA Comprehensive Environmental Response, Compensation, and Liability Act
CERI Center for Environmental Research Information
CFR Code of Federal Regulations
CWA Clean Water Act
DNAPL Dense Nonaqueous-Phase Liquid
EPA U.S. Environmental Protection Agency
gpm Gallons Per Minute
GC Gas Chromatograph
ITER Innovative Technology Evaluation Report
kWh Kilowatt-Hour
LDR Land Disposal Restrictions
LNAPL Light Nonaqueous-Phase Liquid
MCL Maximum Contaminant Level
MDL Method Detection Limit
mg/L Milligrams Per Liter
MS Matrix Spike
MSD Matrix Spike Duplicate
NELP Naval Environmental Leadership Program
NPDES National Pollutant Discharge Elimination System
ORD Office of Research and Development
OSHA Occupational Safety and Health Administration
PPE Personal Protective Equipment
PVC Polyvinyl Chloride
ppm Parts Per Million
psi Pounds Per Square Inch
psia Pounds Per Square Inch-Absolute
POTW Publicly Owned Treatment Works

ix
QA Quality Assurance
QAPP Quality Assurance Project Plan
QC Quality Control
RCRA Resource Conservation and Recovery Act
SARA Superfund Amendments and Reauthorization Act (of 1986)
SDWA Safe Drinking Water Act
SITE Superfund Innovative Technology Evaluation
SWDIV Southwest Division
SVOC Semivolatile Organic Compound
TCE Trichloroethene
TER Technical Evaluation Report
TRPH Total Recoverable Petroleum Hydrocarbons
TSS Total Suspended Solids
µg/L Micrograms Per Liter
ULC Upper Confidence Limit
VISITT Vendor Information System for Innovative Treatment Technologies
VOC Volatile Organic Compounds
"Hg Inches of Mercury
Acronyms, Abbreviations, and Symbols (continued)

x
Conversion Factors
To Convert From To Multiply By
Length inch centimeter 2.54
foot meter 0.305
mile kilometer 1.61
Area: square foot square meter 0.0929
acre square meter 4,047
Volume: gallon liter 3.78
cubic foot cubic meter 0.0283
Mass: pound kilogram 0.454
Energy: kilowatt-hour megajoule 3.60
Power: kilowatt horsepower 1.34
Temperature: (°Fahrenheit - 32) °Celsius 0.556
xi
Acknowledgments
This report was prepared under the direction of Mr. Ron Turner and Leland Vane, the U. S. Environmental Protection Agency(EPA) Superfund Innovative Technology Evaluation (SITE) Program project managers at the EPA Office of Research andDevelopment in Cincinnati, Ohio. Contributors and reviewers for this report were Mr. Chris Lipski and Mr. Mike Benson ofZENON Environmental, Inc. EPA and its contractor for this project, PRC Environmental Management, Inc. wish to thank thestaff of the Naval Environmental Leadership Program and the Naval Public Works Commission for their assistance inperforming the demonstration at Naval Air Station North Island.

1
This report summarizes the findings of an evaluation of thecross-flow pervaporation technology developed byZENON Environmental, Inc. (ZENON). This evaluationwas conducted under the U.S. Environmental ProtectionAgency (EPA) Superfund Innovative TechnologyEvaluation (SITE) Program. The ZENON pervaporationtechnology was demonstrated over a 5-day period inFebruary 1995 at Naval Air Station North Island (NASNI)in Coronado, California.
The purpose of this Innovative Technology EvaluationReport (ITER) is to provide information from the SITEdemonstration of the pervaporation technology that isuseful for remedial managers, environmental consultants,and other potential technology users implementing thetechnology at Superfund and Resource Conservation andRecovery Act (RCRA) hazardous waste sites. Section 1.0of the ITER presents an overview of the SITE Program,describes the ZENON technology, and lists key contacts.Section 2.0 discusses information relevant to thetechnology’s application, including an assessment of thetechnology related to the nine feasibility study evaluationcriteria, potential applicable environmental regulations,and operability and limitations of the technology. Section3.0 summarizes the costs associated with implementingthe technology. Section 4.0 presents the sitecharacterization, demonstration approach, demonstrationprocedures, and the results and conclusions of thedemonstration. Section 5.0 summarizes the technologystatus, and Section 6.0 contains a references list.Appendix A presents the analytical data tables.
The Cross-Flow Pervaporation Technology
According to ZENON, the pervaporation technology is amembrane-based process that removes volatile organic
compounds (VOC) from aqueous matrices. The ZENONcross-flow pervaporation technology uses an organophilicmembrane made of nonporous silicone rubber, which ispermeable to organic compounds but highly resistant todegradation. The composition of the membrane causesorganics in solution to adsorb to it; the organics thendiffuse through the membrane by a vacuum and condenseinto a highly concentrated liquid called permeate. Thepermeate separates into aqueous and organic phases. Theorganic phase can either be disposed of or sent off site forfurther processing to recover the organics. The aqueousphase is sent back to the pervaporation unit forretreatment, where remaining VOCs are removed alongwith those in untreated water.
The ZENON pervaporation technology effectivelyremoves most VOC contamination from groundwater andother aqueous waste streams. It is best suited for reducinghigh concentrations of VOCs to levels that can be reducedfurther and more economically by conventional treatmenttechnologies, such as carbon adsorption. The technologyis not practical for reducing VOC concentrations to mostregulatory limits, notably drinking water standards.According to the developer, once the ZENON technologyis installed and equilibrated, it requires minimal supportfrom on-site personnel.
Demonstration Objectives and Approach
The SITE demonstration for the ZENON technology wasdesigned with two primary and eight secondary objectivesto provide potential users of the technology with thenecessary information to assess the applicability of thepervaporation technology at other contaminated sites. Thefollowing primary and secondary objectives were selectedto evaluate the technology:
Executive Summary

2
Primary Objectives:
P1) Determine if the system can removetrichloroethene (TCE) in groundwater to below federalmaximum contaminant levels (MCL) at varying flowrates, at the 95 percent confidence level
P2) Determine the removal efficiency of the systemfor TCE
Secondary Objectives:
S1) Assess the pervaporation system’s ability toremove nontarget VOCs, semivolatile organic compounds(SVOC), and total recoverable petroleum hydrocarbons(TRPH) from contaminated groundwater
S2) Determine the volume of recovered liquidpermeate generated during each run
S3) Measure VOC emissions from the pervaporationsystem
S4) Determine requirements for anti-scaling additions,and monitor the potential scaling of the system byidentifying reductions in total suspended solids (TSS) andconcentrations of carbonate, fluoride, sulfate, silica,strontium, calcium, barium, magnesium, and iron intreated and untreated water
S5) Determine if the technology’s efficiency inremoving VOCs, SVOCs, and TRPH is reduced, and ifscaling due to the precipitation of the analytes listed undersecondary objective S4 occurs after a 3-week period
S6) Determine the physical effects the ZENONsystem has on treated groundwater
S7) Document the operating conditions of theZENON system
S8) Estimate the capital and operating costs of treatingcontaminated groundwater at NASNI Site 9 with full-scaleZENON pervaporation systems
The demonstration program objectives were achievedthrough the collection of untreated and treatedgroundwater samples, as well as air samples from avacuum vent of the system, over four 8-hour sampling
runs, and one 4-hour run. The fifth day run was shortenedbecause a seal on the pervaporation module failed andcould not be replaced in the field. To meet the objectives,samples were collected at set times throughout each run.Each day, the flow rate of the system and TCE influentconcentrations were changed to present a variety ofoperating conditions.
Demonstration Results
Based on the ZENON SITE demonstration, the followingconclusions may be drawn about the applicability of theZENON technology:
• The system significantly reduced TCE concentrationsin the groundwater from an average of 125 milligramsper liter (mg/L) to an average of 1.49 mg/L (1,490micrograms per liter [ µg/L]); however, the federalMCL of 5 µg/L was not achieved. From the limitednumber of sampling runs, the technology appearedmost efficient when operating at lower flow rates (2.1gallons per minute [gpm] to 5 gpm).
• Removal efficiencies for TCE averaged about 97.3percent. Sixteen of 18 comparisons of treated watersamples to untreated samples showed average TCEremoval efficiencies of 99.3 percent. Generally, thetechnology presented higher reduction percentages asthe concentration of TCE in the untreated groundwaterincreased.
• For other VOCs present in the groundwater at Site 9,the removal efficiency for the technology ranged froman overall average for the demonstration of 96.5percent for 1,1-dichloroethene to 16.0 percent for 2-butanone. Because of data quality flaws, namely VOCpresence in trip blanks and SVOC MS/MSD resultsoutside of QA objectives, the usefulness of the VOCand SVOC results is considered limited.
• Because of the failure of a condensate pump, theamount of permeate generated by a typical ZENONsystem could only be estimated. At NASNI, thesystem generated an average of about 2.9 gallons perhour (gph), totaling 23 gallons per 8-hour run. Theaverage amount of untreated groundwater passedthrough the system was 441 gph.
• VOC releases from the vacuum vent of the system,which allows the discharge of volatilized organiccompounds from the pervaporation module, increased
3
with higher VOC concentrations in the untreatedwater. The average concentration of TCE in vaporvented from the module was 53,889 milligrams percubic meter. As a percentage of total TCEcontaminant load, TCE in vapor discharged from themodule averaged 21.9 percent.
• No notable reductions of inorganic parameters occur-red during the treatment process. TSS appeared todeposit onto the pervaporation membranes. Scaling ofthe membranes proved to be a continual problemduring the demonstration.The addition ofantiscaling chemicals appeared effective in reducingthis; however, no long-term effects of scaling of themembranes or long-term success of antiscalents couldbe determined.
• The system’s VOC removal efficiency, and the effectsof scaling on treatment efficiency, were to bemonitored after allowing the technology to operatecontinuously for a 3-week period; however, becausethe technology failed during the fifth run, these factorscould not be evaluated.
• The average change in temperature between untreatedgroundwater (before entering the system) and treatedgroundwater (discharged groundwater) was 4.0 oC.The pH of the groundwater increased 0.56 by passingthrough the system.
• Estimated cost for operating a ZENON system atNASNI Site 9 at 8 gallons per minute for a period of 15years, treating 63 million gallons of groundwater, is$1,961,000. The total cost per 1,000 gallons of treatedgroundwater is $31, or roughly 3 cents per gallon. Ifoperational problems experienced during thedemonstration are not addressed by ZENON, thesecosts could rise dramatically.
Technology Evaluation Summary
The technology was analyzed to assess its advantages,disadvantages, and limitations, and was then evaluatedbased on the nine criteria used for decision-making in theSuperfund feasibility study process (see Table ES-1). Thisevaluation is presented in Section 2.0 of the ITER. Thetechnology as demonstrated is limited to treatment ofVOCs in the saturated zone. During the demonstrationsampling runs at NASNI, the pervaporation technologyproved to be effective in removing VOCs fromcontaminated groundwater. The demonstration results
indicate that the overall effectiveness of the systemdepends on a number of factors, including the influentflow rate through the system, the contaminantconcentrations, the volatility of the organics present in thewater, and the potential for scaling and fouling of thesystem based on the water characteristics. The technologymainly employs readily available equipment andmaterials. Material handling requirements and sitesupport requirements are minimal.
Although the technology was able to remove VOCs at ahigh rate during the sampling runs, continual failures ofvarious components of the system occurred throughout thedemonstration, eventually causing an early termination ofsampling. Modifications of equipment used inconjunction with the pervaporation modules, includingseals, filters, pumps, and various valves is necessarybefore the technology can be readily applied at otherremote groundwater sites. The remote location of Site 9,along with occasional severe weather, also causedlogistical problems during the demonstration.

4
Table ES-1. Feasibility Study Evaluation Criteria for the ZENON Technology

5
Table ES-1. Feasibility Study Evaluation Criteria for the ZENON Technology (continued)

6
This section provides background information about theU.S. Environmental Protection Agency’s (EPA) SuperfundInnovative Technology Evaluation (SITE) program,discusses the purpose of this Innovative TechnologyEvaluation Report (ITER) and describes the ZENONcross-flow pervaporation technology. Additionalinformation about the SITE program, the ZENONtechnology, and the demonstration is available from thekey individuals listed at the end of this section.
1.1 The Site Program
The SITE program is a formal program established byEPA’s Office of Solid Waste and Emergency Responseand Office of Research and Development (ORD) inresponse to the Superfund Amendments andReauthorization Act of 1986 (SARA). The SITEprogram’s primary purpose is to maximize the use ofalternatives in cleaning up hazardous waste sites byencouraging the development, demonstration, and use ofnew or innovative treatment and monitoring technologies.It has four major goals:
• Identify and remove obstacles to the development andcommercial use of alternate technologies
• Structurea development program that nurturesemerging technologies
• Demonstrate promising innovative technologies toestablish reliable performance and cost informationfor site characterization and cleanup decision-making
• Develop procedures and policies that encourage theselection of available alternative treatment remediesat Superfund sites, as well as other waste sites andcommercial facilities
Technologies are selected for the SITE DemonstrationProgram through annual requests for proposals. ORD staffreview the proposals to determine which technologiesshow the most promise for use at Superfund sites.Technologies chosen must be at the pilot- or full-scalestage, must be innovative, and must have some advantageover existing technologies. Mobile technologies are ofparticular interest.
Once EPA has accepted a proposal, cooperativeagreements between EPA and the developer establishresponsibilities for conducting the demonstration andevaluating the technology. The developer is responsiblefor demonstrating the technology at the selected site and isexpected to pay any costs for transport, operations, andremoval of the equipment. EPA is responsible for projectplanning, sampling and analysis, quality assurance andquality control, preparing reports, disseminatinginformation, and transporting and disposing of treatedwaste materials.
The results of the demonstration are published in twodocuments: the Technology Capsule and the ITER. TheTechnology Capsule provides relevant information on thetechnology, emphasizing key features of the results of theSITE demonstration. Both the Technology Capsule andthe ITER are intended for use by remedial managersmaking a detailed evaluation of the technology for aspecific site and waste.
1.2 Innovative Technology EvaluationReport
The ITER provides information on the ZENONtechnology and includes a comprehensive description ofthe demonstration and its results. The ITER is intended foruse by EPA remedial project managers, EPA on-scenecoordinators, contractors, and other decision-makers for
Section 1Introduction

7
implementing specific remedial actions. The ITER isdesigned to aid decision-makers in evaluating specifictechnologies for further consideration as an applicableoption in a particular cleanup operation.
To encourage the general use of demonstratedtechnologies, the ITER provides information regardingthe applicability of each technology to specific sites andwastes. The ITER includes information on cost and site-specific characteristics. It also discusses advantages,disadvantages, and limitations of the technology.
Each SITE demonstration evaluates the performance of atechnology in treating a specific material. Thecharacteristics of materials at one site may differ from thecharacteristics of materials at another site. Therefore,successful field demonstration of a technology at one sitedoes not necessarily ensure that it will be applicable atother sites. Data from the field demonstration may requireextrapolation for estimating the operating ranges in whichthe technology will perform satisfactorily. Only limitedconclusions can be drawn from a single fielddemonstration.
1.3 ZENON Cross-Flow PervaporationTechnology
The ZENON pervaporation technology is a membrane-based process that removes VOCs from aqueous matrices.The ZENON cross-flow pervaporation technology uses anorganophilic membrane made of nonporous siliconerubber, which is permeable to organic compounds buthighly resistant to degradation. The composition of themembrane causes organics in solution to adsorb to it; theorganics then diffuse through the membrane by a vacuumand condense into a highly concentrated liquid calledpermeate. The permeate separates into aqueous andorganic phases. The organic phase can either be disposedof or sent off site for further processing to recover theorganics. The water phase is sent back to thepervaporation unit for retreatment.
The ZENON technology removes organic contaminationfrom groundwater and other aqueous waste streams. Thetechnology is not practical for reducing VOC concentrationsto regulatory limits, most notably drinking waterstandards. It is best suited for reducing highconcentrations of VOCs to levels that can be reducedfurther and more economically by conventional treatmenttechnologies, such as carbon adsorption. According to the
developer, once the ZENON technology is installed andequilibrated, it requires minimal support from on-sitepersonnel.
The ZENON pervaporation technology involves modulescontaining dense polymeric membranes. Each membraneconsists of a nonporous organophilic polymer, similar tosilicone rubber, formed into capillary fibers measuringless than 1 millimeter in diameter. Silicone rubberexhibits high selectivity toward organic compounds and ishighly resistant to degradation. The capillary fibers arealigned in parallel on a plane and spaced slightly apart.This arrangement of capillary fibers forms a membranelayer.
Separate membrane layers are aligned in series, as shownin Figure 1-1, with the interior of the capillary fibersexposed to a vacuum (about 1 pound per square inchabsolute). The number of membranes used in a particularsystem depends on expected flow rates, contaminantconcentrations in the untreated water, and targetconcentrations for contaminants in the treated water.Process temperatures are elevated to improve treatment;however, temperatures are kept at or below 75 °C (165 °F).
The organophilic composition of the membrane causesorganics to adsorb into the capillary fibers. The organicsmigrate to the interior of the capillary fibers and are thenextracted from the membrane by the vacuum.
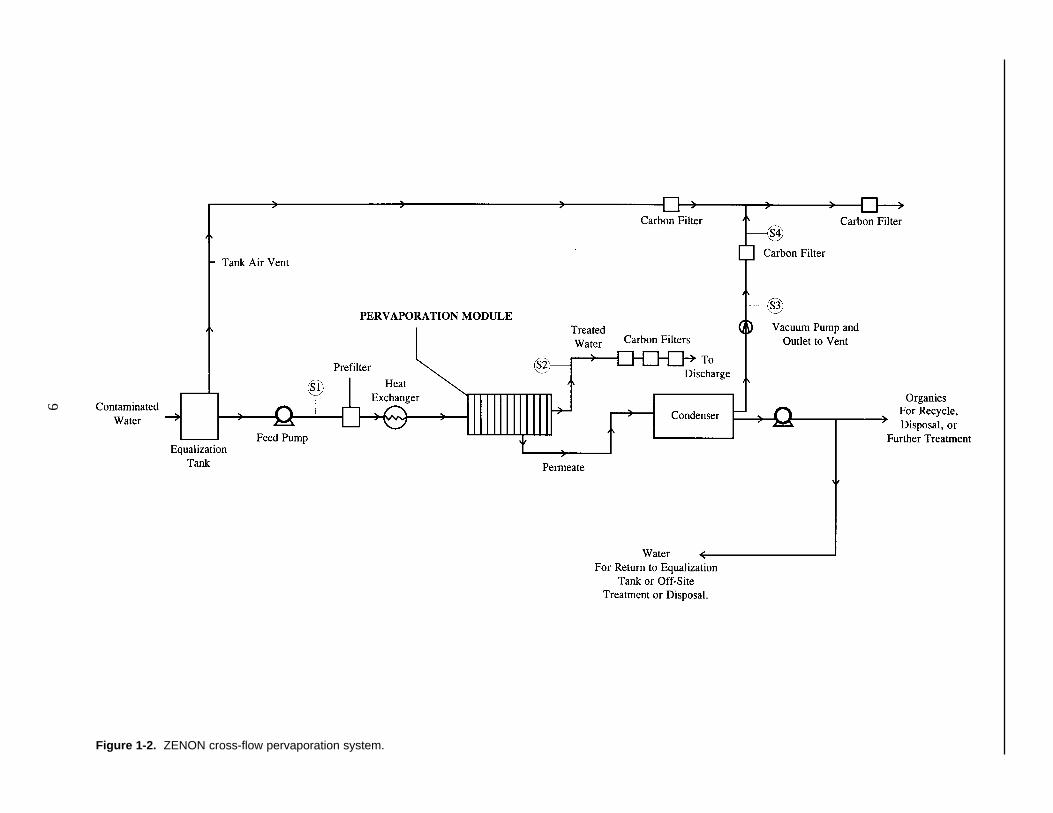
Figure 1-2 displays a schematic diagram of the ZENONcross-flow pervaporation system in a typical fieldapplication (sampling locations for the system aredesignated S1, S2, S3, and S4). Contaminated water ispumped from an equalization tank through a 200-micronprefilter to remove debris and silt particles, and then into aheat exchanger that raises the water temperature. Theheated contaminated water then flows into thepervaporation module. Organics and small amounts ofwater are extracted from the contaminated water, andtreated water exits the pervaporation module and isdischarged from the system after further treatment.
The extracted organics and small amount of water is calledpermeate. The permeate from the membranes is drawninto a condenser by the vacuum, where the organics andany water vapor are condensed. Because the vacuum isvented from the downstream side of the condenser, mostorganics are kept in solution, thus minimizing air releases.

8
Figure 1-1. ZENON cross-flow pervaporation module.
M EM BRANELAYER
UNTREATED
GROUNDWATER
TREATED
GROUNDWATER
PERM EATE
9
Figure 1-2. ZENON cross-flow pervaporation system.

10
Because condensed permeate contains highly concentratedorganic compounds, the liquid permeate generallyseparates into aqueous and organic phases, rendering theorganic fraction potentially recoverable. The organicphase permeate is pumped from the condenser to storage,while aqueous phase permeate, which contains lowerconcentrations of organics, can either be returned to thepervaporation module for further treatment or removed fordisposal.
Water containing exceedingly high concentrations ofcontaminants require multiple passes through the module.Although the system can treat light nonaqueous phaseliquids (LNAPL) and dense nonaqueous-phase liquids(DNAPL), they should be removed from water before itenters the system to decrease the number of passes.
1.4 Pilot-Scale Demonstration
A pilot-scale study of the ZENON pervaporationtechnology was performed in October 1993 at a formerpetroleum pumping station in Waterdown, Ontario,Canada. Samples of treated groundwater showed thatbenzene, toluene, ethylbenzene, and xylene (BTEX)concentrations were significantly reduced in treatedgroundwater samples compared to untreated samples. Theremoval efficiencies of BTEXs for the system ranged from96.8 to 99.3 percent. The average removal efficiency forbenzene was 98.0 percent; for toluene, ethylbenzene, andxylenes, the average removal efficiency was 98.4 percent.
1.5 Full-Scale Demonstration
This report summarizes the findings of an evaluation of theZENON cross-flow pervaporation technology by EPA’sSITE Program. The demonstration was conducted atNaval Air Station North Island (NASNI), in Coronado,California, as a cooperative effort between EPA and theNaval Environmental Leadership Program (NELP).Operations involving the technology were conducted fromSeptember 1994 through February 1995 at a former wastedisposal site (Site 9) at NASNI. The site was selected forthe demonstration following a bench-scale test ofcontaminated groundwater that was conducted byZENON in December 1993. SITE demonstrationsampling from the technology occurred over a period 5days in February 1995, with trichloroethene the primarycontaminant of concern.
1.6 Key Contacts
Additional information on the ZENON pervaporationtechnology and the SITE program are available from thefollowing sources:
ZENON Pervaporation TechnologyChris LipskiProcess EngineeringZenon Environmental, Inc.45 Harrington CourtBurlington, Ontario, Canada L7N 3P3905-639-6320FAX: 905-639-1812
SITE ProgramAnnette GatchettNational Risk Management Research LaboratoryU.S. Environmental Protection Agency26 West Martin Luther King DriveCincinnati, OH 45268513-569-7697
Information on the SITE program is available through thefollowing on-line information clearinghouse: the VendorInformation System for Innovative Treatment Technologies(VISITT) (Hotline: 800-245-4505) database containsinformation on 154 technologies offered by 97 developers.
Technical reports may be obtained by contacting U. S.EPA/NCEPI, P. O. Box 42419, Cincinnati, Ohio 45242-2419, or by calling 800-490-9198.

11
This section addresses the general applicability of theZENON pervaporation technology to contaminated wastesites. Information presented in this section is intended toassist decision-makers in screening specific technologiesfor a particular cleanup situation. This section presents theadvantages, disadvantages, and limitations of thetechnology and discusses factors that have a major impacton the performance and cost of the technology. Theanalysis is based on the demonstration results andavailable information from other applications of thetechnology.
2.1 Key Features of the ZenonTreatment Technology
ZENON claims that cross-flow pervaporation provides analternative approach to treating organic-contaminatedwater at hazardous waste sites and industrial facilitieswhere conventional air stripping or carbon adsorption arecurrently used. Pervaporation releases less volatileorganic compounds (VOC) to the outside air than airstripping. Because contaminants pass through thepervaporation membranes, the membranes can be used foryears before degradation requires replacement. Organiccontaminants removed from untreated water areconcentrated in recovered permeate, thus greatly reducingwaste volume.
A full-scale pervaporation unit measures about 8 feet by12 feet at its base, allowing transportation in a semitraileror a flat-bed truck. ZENON also claims that shakedowntime for a pervaporation unit averages about 2 weeks, andmanual operation and monitoring requirements arelimited. It is a stand- alone technology, but can be used inseries with other conventional technologies such as soilwashing, carbon adsorption, or flocculation with solidsremoval. Contaminated aqueous media can be pumpeddirectly to the pervaporation module; however, it is
recommended that water be equalized in a bulk tank beforeentering the system. Depending on local pretreatmentstandards, treated water exiting the ZENON system maybe discharged to a publicly owned treatment works(POTW). To comply with limitations imposed by theNational Pollutant Discharge Elimination System (NPDES)or the Safe Drinking Water Amendment (SDWA), furthertreatment with a separate technology is usually required.
2.2 Technology Applicability
The ZENON cross-flow pervaporation technologyremoves VOCs from aqueous matrices, such asgroundwater, wastewaters, and leachate. The technologycan treat a variety of concentrations; however, it is bestsuited for reducing high concentrations of VOCs to levelsthat can be reduced further and more economically byconventional treatment technologies, such as carbonadsorption. The technology can also remove a limitednumber of semivolatile organic compounds (SVOC) andpetroleum hydrocarbons. Both the pilot- and full-scaledemonstrations have evaluated the ZENON technology’streatment of contaminated groundwater.
2.3 Technology Limitations
A number of factors must be considered before usingpervaporation. The prefilter prevents solids from reachingthe pervaporation module and inhibiting the movement oforganics through the membrane. Solids can clog theprefilter, requiring frequent cleaning. Influent with a highalkalinity or high amounts of calcium or iron can cause thesystem to scale. In these cases, anti-scalents can be addedto the untreated water as a preventive measure.
The ZENON technology does not remove inorganiccontamination and can only remove only a limited numberof SVOCs and petroleum hydrocarbons. Heavy metals
Section 2Technology Applications Analysis

12
dissolved in groundwater have not adversely affected thetreatment ability of the technology.
VOCs with water solubilities of less than 2 percent weight(20,000 mg/L) are generally suited for removal bypervaporation. Highly soluble organics such as alcoholsare not effectively removed by a single-stage pervaporationprocess. Also, low-boiling VOCs such as vinyl chloridetend to remain in the vapor phase after moving through thecondenser, and can escape to the surrounding air throughthe vacuum vent. For elevated concentrations of mostlow-boiling VOCs, a carbon filter placed on the vacuumvent ensures that contaminants are not released to theoutside air.
The system has proven effective in reducing certain VOCconcentrations in groundwater to near federal maximumconcentration limits (MCL). However, loweringconcentrations to below MCLs may require multiplepasses through the pervaporation module, which canprove impractical when compared to other technologies,such as carbon adsorption. Water containing highconcentrations of contaminants, including LNAPLs andDNAPLs, also require multiple passes through themodule. To decrease the number of passes, LNAPLs andDNAPLs should be removed from water before it entersthe system.
Water quality standards normally will not allow waterexiting the ZENON system to be discharged directly intosurface water bodies. Depending on local standards,treated water may be acceptable for discharge to a localPOTW. During the SITE demonstration at NASNI, waterdischarged from the ZENON system required additionaltreatment through a series of two 1,000-pound carbonfilters for polishing. VOC concentrations in the waterwere then monitored with an on-site gas chromatograph(GC). The water was discharged to the sanitary sewer.
The ZENON system tested at NASNI could achieve amaximum flow rate of about 11 gallons per minute (gpm),which is the highest flow rate for the technology to date.Sites requiring treatment at higher flow rates will requiremultiple systems or additional pervaporation modules.
2.4 Process Residuals
The ZENON system generates two waste streams: treatedwater and concentrated permeate. During the SITE
to remove VOCs from emissions released from thevacuum vent of the system also required disposal. Treatedwater may require further treatment to meet local or site-specific discharge requirements.
Permeate usually separates into an organic and an aqueousphase. The organic phase permeate is pumped from thecondenser to storage and eventual recycling or disposal.Because of the high VOC concentrations expected withpermeate, it must normally be handled as a RCRAhazardous waste, and storage regulations must befollowed. Aqueous phase permeate can either be returnedto the pervaporation module for further treatment orremoved for disposal.
Depending on the application and local regulations,personal protective clothing and equipment, along withfield laboratory waste, may require disposal at a licenseddisposal facility. If monitoring and pumping wells will beinstalled as part of a remediation effort, contaminated soilcuttings may need to be stored in permitted areas anddisposed of in accordance with applicable regulations.
2.5 Site Support Requirements
The ZENON system is a self-supporting treatment unit,and as such, requires other basic site support elements. Ifwells are used as the groundwater source, pumps must beused to extract groundwater and direct it to the ZENONsystem. The pumping capacity of the system may limit theamount of groundwater it can pull from a series ofmonitoring wells.
Access roads at treatment sites are necessary because afull-scale pervaporation system is shipped to sites in asemi trailer or on flat-bed trucks. The ZENON system ismounted in a steel enclosure measuring about 12 feet by 8feet by 7 feet. The enclosure is designed to be moved witha large forklift or a small crane. The enclosure must beplaced on a hard surface, preferably an asphalt or concretepad, although packed soil will support it.
The ZENON system requires utility hookups forelectricity and water. A full-scale ZENON system capableof 11 gpm requires 460-volt, 3-phase, 15-ampere service.During shakedown, clean water is necessary to verify thatall components are operating correctly before contaminatedwater enters the system.
Clean water is also needed to decontaminate processequipment and for health and safety. Permeate must be
demonstration at NASNI, granular activated carbon used

13
stored in drums or bulk tanks, which under ResourceConservation and Recovery Act (RCRA) regulationsrequires secondary containment and possibly permits. Tomove drums of permeate at the site, a two-wheel drummover or forklift is advised. A receptacle for treatedwater, such as bulk tanks or sewer lines, is also necessary.A small office trailer, a telephone, and security fencing arerecommended for moderate- to long-term operations.
2.6 Availability And Transportation ofEquipment
The ZENON technology employs conventional,commercially available equipment and materials that areeasily transported in a semi trailer or on a flat-bed truck.On-site assembly and maintenance requirements areminimal. ZENON claims that the treatment system canbegin operating within 2 weeks of startup if all necessaryfacilities, utilities, and supplies are available.
Demobilization activities include decontaminating on-siteequipment, disconnecting utilities, disassemblingequipment, and transporting equipment off site. In agroundwater treatment scenario, wells used for theextraction of groundwater may require plugging andabandonment after project completion.
2.7 Feasibility Study EvaluationCriteria
This section presents an assessment of the ZENONpervaporation technology relative to the nine evaluationcriteria used for conducting detailed analyses of remedialalternatives in feasibility studies under the ComprehensiveEnvironmental Response, Compensation, and LiabilityAct (CERCLA) (EPA 1988b). Table 2-1 presents asummary of the pervaporation technology’s relation to thenine evaluation criteria.
2.7.1 Overall Protection of HumanHealth and the Environment
The ZENON technology provides both short- and long-term protection of human health and the environment byremoving contaminants from groundwater and bypreventing further migration of contaminants in thegroundwater. VOCs are removed from the groundwater inthe pervaporation module, condensed, and placed instorage. VOC releases to the surrounding air are
controlled by carbon filters. Although worker protectionis required when moving and handling the highlyconcentrated permeate, contaminants are removed fromthe groundwater with minimal exposures to on-siteworkers and the community. Heavy equipment isnecessary to unload and place the unit in a designatedlocation. Once in place and operating, heavy equipmentusage would be limited to the occasional movement ofdrums of permeate with a forklift.
2.7.2 Compliance with Applicable orRelevant and AppropriateRequirements
General and specific applicable or relevant andappropriate requirements (ARAR) identified for theZENON pervaporation technology are presented inSection 2.8. Compliance with chemical-, location-, andaction-specific ARARs should be determined on a site-specific basis; however, location-and action-specificARARs generally are achieved. Compliance withchemical-specific ARARs depends on (1) the efficiency ofthe ZENON system in removing contaminants from thegroundwater,(2) influent contaminant concentrations, (3)the amount of treated water recirculated in the system, and(4) postpervaporation treatment. To meet chemical-specific ARARs, contaminated groundwater may requiremultiple passes through the treatment system, along withposttreatment (such as carbon adsorption).
2.7.3 Long-Term Effectiveness andPermanence
The ZENON pervaporation technology provides aneffective long-term solution to aquifer remediation byremoving contaminants from the groundwater. Dependingon treatment requirements, some residual risk may exist ata given site after treatment. The magnitude of residual riskcan be controlled by extending the length of time that thesystem operates, or by allowing groundwater to recirculatethrough the treatment system in multiple passes.
2.7.4 Reduction of Toxicity, Mobility, orVolume Through Treatment
The ZENON system reduces the toxicity of contaminatedgroundwater by actively removing organic contaminantsthrough the membrane-based process. The membrane-based process reduces the volume of contaminated media

14
Table 2-1. Feasibility Study Evaluation Criteria for the ZENON Technology
15
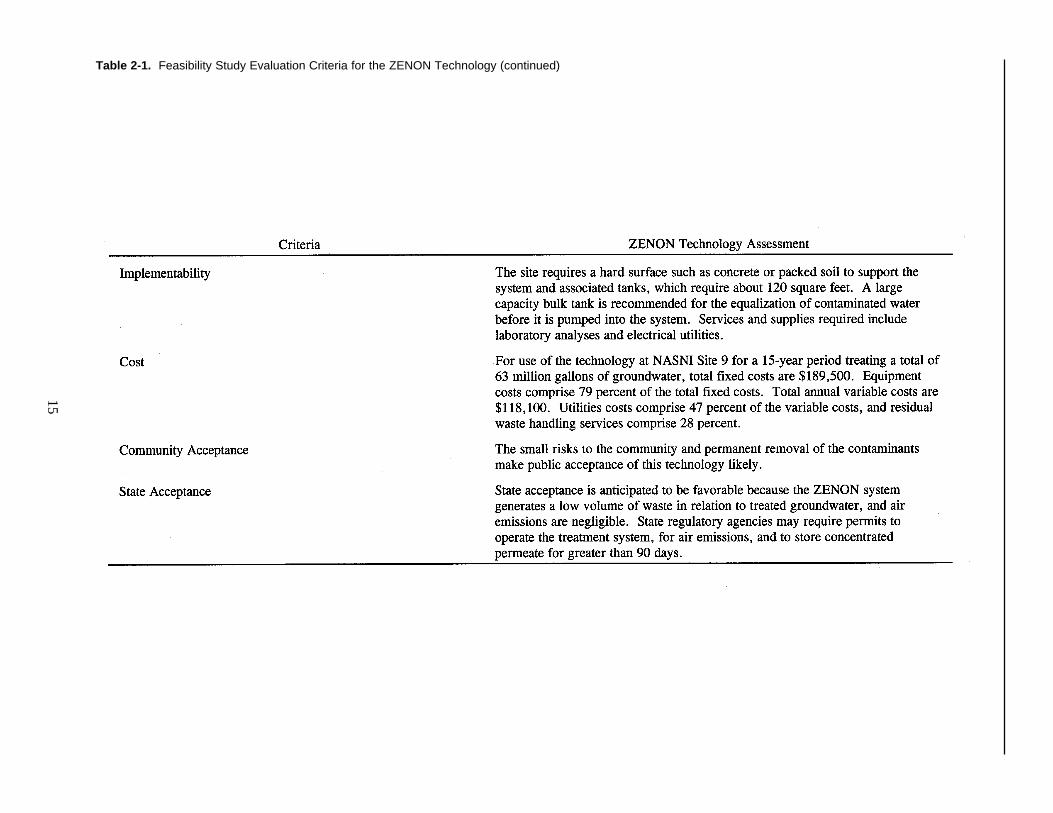
Table 2-1. Feasibility Study Evaluation Criteria for the ZENON Technology (continued)

16
by separating the organic contaminants from thegroundwater and concentrating them into a highlyconcentrated liquid permeate. This treatment results in asignificant volume reduction compared to the untreatedwater. The radius of influence of wells used to pumpinfluent to the system, the time frame of pumping, and theaquifer characteristics will determine the volume ofmaterial treated.
Treatment of the organic contaminants followed bydischarge of the treated water to a POTW or surface waterprevents further migration of contaminants and reducesthe volume of contaminated media. Water qualitystandards normally will not allow water exiting theZENON system to be discharged directly into surfacewater bodies, and further treatment is required. Results ofthe ZENON demonstration at NASNI, displayingcontaminant reductions, are presented in Section 4.3.
2.7.5 Short-Term Effectiveness
The pervaporation technology provides a long-termsolution to removing VOCs from contaminatedgroundwater or wastewaters. VOCs in untreated water arereduced immediately as the water passes through thesystem. Further treatment may be required depending onthe regulations applicable to individual sites.
2.7.6 Implementability
Site preparation and access requirements for thetechnology are minimal. As noted in Section 2.6, a givensite requires access roads large enough to allow passage ofa semi truck. The entire system occupies an area of about200 square meters. Installation and operation of theZENON system is anticipated to involve few administrativedifficulties. Operation and monitoring can be performedby a trained field technician and does not require aspecialist. However, system maintenance should beprovided by personnel familiar with operation of thesystem. Routine activities include monitoring targetcompound concentrations in the system influent andeffluent wells. Services and supplies required toimplement the ZENON system include bulk tanks forequalization and treated water storage, laboratory analysesto monitor the system performance, electrical and waterutilities, and carbon adsorption regeneration or disposal.
2.7.7 Cost
A complete analysis of costs to operate the ZENONpervaporation system is presented in Section 3.0. Theanalysis presents cost estimates for treating groundwaterat NASNI contaminated with TCE. In short, operatingconditions include treating the groundwater at 8 gpm for aperiod of 15 years. Total fixed costs are $189,500.Equipment costs comprise 79 percent of the total fixedcosts. Total annual variable costs are $118,100. Utilitiescosts comprise 47 percent of the variable costs, andresidual waste handling services comprise 28 percent.After operating for 15 years, the total cost of thegroundwater remediation scenario presented in thisanalysis is $1,961,000. Annual costs were not adjusted forinflation. A total of 63 million gallons of groundwaterwould be treated over this time period. The total cost per1,000 gallons treated is $31, or roughly 3 cents per gallon.During the demonstration, numerous equipment failuresoccurred, which caused extensive downtime. It is assumedthat the pervaporation system will be perfected byZENON thereby decreasing maintenance requirements. Iftechnical needs are not addressed by ZENON, the costsassociated with applying this system could be substantiallyhigher than those presented in this analysis.
2.7.8 State Acceptance
State acceptance is anticipated to be favorable because theZENON system is an advanced technology that generateslow relative residual waste. Also, the ZENON system issmall and relatively easy to transport, operate, andmanage. If remediation is conducted as part of RCRAcorrective actions, state regulatory agencies may requirethat permits be obtained before implementing the system,such as a permit to operate, an air emissions permit, and apermit to store permeate for greater than 90 days if theseitems are considered hazardous wastes.
2.7.9 Community Acceptance
The ZENON system has limited space requirements,minimal maintenance and monitoring, and a low noiselevel. Emissions are limited when the system is used inconjunction with carbon filters. Because an operatingZENON system requires only minor maintenance, trafficin and out of a particular site will be limited. Short-termrisks to the community are minimal, which includedelivery vehicle traffic to and from the site electricalconcerns during installation. Long-term benefits include

17
the permanent removal of organic contaminants fromgroundwater. These factors make this technologyfavorable to the public.
2.8 Technology Performance VersusARARs
This section discusses specific federal regulatoryrequirements pertinent to the treatment, storage, anddisposal of water and permeate, along with other materialsgenerated during the operation of the technology.Regulatory requirements that apply to a particularremediation activity will depend on the type ofremediation site and the type of waste being treated.Contaminated groundwater is usually not considered ahazardous waste unless it is withdrawn from the aquiferand placed in stand-alone containers or tanks. Contaminatedleachates and other waste streams considered hazardousmay be RCRA regulated. Table 2-2 provides a summaryof regulations discussed in this section. Remedial projectmanagers will have to address federal requirements, alongwith state and local regulatory requirements, which maybe more stringent.
2.8.1 Comprehensive EnvironmentalResponse, Compensation, andLiability Act
CERCLA, as amended by the Superfund Amendments andReauthorization Act (SARA) of 1986, authorizes thefederal government to respond to releases or potentialreleases of any hazardous substances into the environment,as well as to releases of pollutants or contaminants thatmay present an imminent or significant danger to publichealth and welfare or the environment. Remedialalternatives that significantly reduce the volume, toxicity,or mobility of hazardous materials and provide long-termprotection are preferred. Selected remedies must also becost effective and protect human health and theenvironment.
Contaminated water is treated on site, while residualwastes generated during the installation, operation, andmonitoring of the system may be treated either on- or off-site. CERCLA requires that on-site actions meet allsubstantive state and federal ARARs. Substantiverequirements pertain directly to actions or conditions inthe environment (such as, groundwater effluent and airemission standards). Off-site actions must comply withboth legally applicable substantive and administrative
ARARs. Administrative requirements, such as permitting,facilitate the implementation of substantive requirements.
ARARs are determined on a site-by-site basis and may bewaived under six conditions: (1) the action is an interimmeasure, and the ARAR will be met at completion; (2)compliance with the ARAR would pose a greater risk tohealth and the environment than noncompliance; (3) it istechnically impracticable to meet the ARAR; (4) thestandard of performance of an ARAR can be met by anequivalent method; (5) a state ARAR has not beenconsistently applied elsewhere; and (6) fund balancingwhere ARAR compliance would entail such cost inrelation to the added degree of protection or reduction ofrisk afforded by that ARAR that remedial action at othersites would be jeopardized. These waiver options applyonly to Superfund actions taken on site, and justificationfor the waiver must be clearly demonstrated. Off-siteremediations are not eligible for ARAR waivers, and allsubstantive and administrative applicable requirementsmust be met.
For the ZENON technology, treated groundwater andconcentrated permeate are the primary residual wastesgenerated from the treatment system. During the SITEdemonstration, spent granular activated carbon was alsogenerated from treatment of air emissions. CERCLArequires identification and consideration of environmentallaws that are ARARs for site remediation beforeimplementation of a remedial technology at a Superfundsite. Given these wastes (typical of operation of a ZENONsystem), the following additional regulations pertinent touse of a ZENON system were identified: (1) RCRA, (2)the Clean Water Act (CWA), (3) SDWA, (4) the Clean AirAct (CAA), and (5) the Occupational Safety and HealthAdministration (OSHA). These five regulatory authoritiesare discussed below. Specific ARARs under these actsthat were applicable to the SITE demonstration arepresented in Table 1.
2.8.2 Resource Conservation andRecovery Act
RCRA, as amended by the Hazardous and Solid WasteDisposal Amendments of 1984, regulates managementand disposal of municipal and industrial solid wastes. TheEPA and RCRA-authorized states [listed in Title 40 of theCode of Federal Regulations (CFR) Part 272] implementand enforce RCRA and state regulations. Some of theRCRA requirements under 40 CFR Part 264 apply at

18
Table 2-2. Federal and State ARARs

19
Table 2-2. Federal and State ARARs (continued)

20
Table 2-2. Federal and State ARARs (continued)

21
CERCLA sites that contain RCRA hazardous wastebecause remedial actions generally involve treatment,storage, or disposal of hazardous waste.
Contaminated water treated by the ZENON system willmost likely be hazardous or sufficiently similar tohazardous waste so that RCRA standards will apply. Tankstorage of contaminated water considered a hazardouswaste must meet the requirements of 40 CFR Part 264 or265, Subpart J. Pertinent RCRA requirements arediscussed below.
The presence of RCRA-defined hazardous wastedetermines whether RCRA regulations apply to theZENON technology. If wastes generated during theinstallation, monitoring, or operation of the technology aredetermined to be hazardous according to RCRA, allRCRA requirements regarding the management anddisposal of hazardous wastes will need to be addressed.RCRA regulations define hazardous wastes and regulatetheir transport, treatment, storage, and disposal. Wastesdefined as hazardous under RCRA include characteristicand listed wastes. Criteria for identifying characteristichazardous wastes are included in 40 CFR Part 261,Subpart C. Listed wastes from nonspecific and specificindustrial sources, off-specification products, spillcleanups, and other industrial sources are itemized in 40CFR Part 261, Subpart D.
If contaminated groundwater is determined to be ahazardous waste, and is extracted for treatment, storage, ordisposal, the requirements for a hazardous waste generatorwill be applicable. Requirements for hazardous wastegenerators are specified in 40 CFR Part 262. Theserequirements include obtaining an EPA identificationnumber, meeting waste accumulation standards, labelingwastes, and keeping appropriate records. Theserequirements also allow generators to store wastes up to 90days without a permit and without having interim status asa treatment, storage, or disposal facility. If the untreatedinfluent is a “listed waste,” or the treated effluent is a“characteristic waste,” and treatment residues are storedon site for 90 days or more, requirements in 40 CFR Part265 apply. If hazardous wastes are treated by the ZENONsystem, the owner or operator of the treatment or disposalfacility must obtain an EPA identification number and aRCRA permit from the EPA- or RCRA-authorized state.RCRA requirements for permits are specified in 40 CFRPart 270. In addition, to the permitting requirements,
owners and operators of facilities that treat hazardouswaste must comply with 40 CFR Part 264.
Use of the ZENON system would constitute treatment asdefined by RCRA. Therefore, treatment requirementsmay apply if the ZENON system is found to belong to atreatment category classification regulated under RCRA,and if it is used to treat a RCRA listed or characteristicwaste. Treatment requirements in 40 CFR Part 264,Subpart X, which regulate hazardous waste, treatment,and disposal in miscellaneous units, may be relevant to theZENON system. Subpart X requires that treatment inmiscellaneous units protect human health and theenvironment. Treatment requirements in 40 CFR Part265, Subpart Q (Chemical, Physical, and BiologicalTreatment), could also apply. Subpart Q includesrequirements for automatic influent shutoff, wasteanalysis, and trial tests. RCRA also contains specialstandards for ignitable or reactive wastes, incompatiblewastes, and special categories of waste (40 CFR Parts 264and 265, Subpart B). These standards may apply to theZENON system, depending on the waste to be treated.
Requirements for corrective action at RCRA-regulatedfacilities are provided in 40 CFR Part 264, Subparts F andS. These subparts also apply to remediation at Superfund(CERCLA) sites. Subparts F and S include requirementsfor initiating and conducting RCRA corrective actions,remediating groundwater, and ensuring that correctiveactions comply with other environmental regulations.Subpart S also details conditions under which particularRCRA requirements may be waived for temporarytreatment units operating at corrective action sites. Thus,RCRA mandates requirements similar to CERCLA, and asproposed, allows treatment units such as the ZENONtreatment system to operate without full permits.
Air emissions from operation of the ZENON are subject toRCRA regulations on air emissions from hazardous wastetreatment, storage, or disposal operations and areaddressed in 40 CFR Parts 264 and 265, Subparts AA, BB,and CC. Subpart AA regulations apply to process ventsassociated with specific treatment operations for wastescontaminated with organic constituents, which wouldapply to the ZENON system due to the vacuum vent.Subpart BB regulations apply to fugitive emissions, suchas equipment leaks, from hazardous waste treatment,storage, or disposal facilities that treat waste containingorganic concentrations of at least 10 percent by weight.These regulations address pumps, compressors, open-
22
ended valves or lines, and flanges. Subpart BB regulationswould normally not impact the ZENON system because oflower contaminant concentrations usually found inaffected aquifers. Any organic air emissions from storagetanks would be subject to the RCRA organic air emissionregulations in 40 CFR Parts 264 and 265, Subpart CC.These regulations address air emissions from hazardouswaste treatment, storage, or disposal facility tanks, surfaceimpoundments, and containers. The Subpart CCregulations were issued in December 1994 and becameeffective in July 1995 for facilities regulated under RCRA.Presently, EPA is deferring application of the Subpart CCstandards to waste management units used solely to treator store hazardous waste generated on site from remedialactivities required under RCRA corrective action orCERCLA response authorities (or similar state remediationauthorities). Therefore, Subpart CC regulations would notimmediately impact implementation of the ZENONsystem. The air emission standards are applicable totreatment, storage, or disposal units subject to the RCRApermitting requirements of 40 CFR Part 270 or hazardouswaste recycling units that are otherwise subject to thepermitting requirements of 40 CFR Part 270. The mostimportant air requirements are probably associated withthe Clean Air Act (CAA) and state air toxic programs (seeSection 2.8.5).
Concentrated permeate, spent granular activated carbon(if used), and possibly, contaminated soil cuttingsgenerated during the installation, operation, andmonitoring of the treatment system must be stored anddisposed of properly. If the untreated water is a listedhazardous waste, treatment residues will be considered ahazardous waste (unless RCRA delisting requirements aremet). If the untreated water is a characteristic hazardouswaste, treatment residues should be tested to determine ifthey are a RCRA characteristic hazardous waste. Ifactivated carbon and soil cutting residues are nothazardous and do not contain free liquids, they can bedisposed of at a nonhazardous waste landfill.
If the organic phase of the permeate, spent carbon, or soilcuttings is hazardous, RCRA standards may apply. Formost applications involving the removal of VOCs fromwater, concentrated permeate will normally be classifiedas a hazardous waste, requiring recycling or disposal at adesignated treatment facility. Any facility (on-site or off-site) designated for permanent disposal of hazardouswastes must comply with RCRA. Disposal facilities mustfulfill permitting, storage, maintenance, and closure
requirements contained in 40 CFR Parts 264 through 270.In addition, any authorized state RCRA requirements mustbe fulfilled. If treatment residues are disposed off site,transportation standards apply.
Water quality standards included in RCRA (such asgroundwater monitoring and protection standards), theCWA, and the SDWA are appropriate cleanup standardsand apply to discharges of treated water. The CWA andSDWA are discussed below.
2.8.3 Clean Water Act
The CWA is designed to restore and maintain thechemical, physical, and biological quality of navigablesurface waters by establishing federal, state, and localdischarge standards. Treated water, purge water, anddecontamination water generated from the system andduring monitoring of the system may be regulated underthe CWA if it is discharged to surface water bodies or aPOTW. On-site discharges to surface water bodies mustmeet substantive NPDES requirements, but do not requirean NPDES permit. A direct discharge of CERCLAwastewater would qualify as “on site” if the receivingwater body is in the area of contamination or in very closeproximity to the site and if the discharge is necessary toimplement the response action. Off-site discharges to asurface water body require a NPDES permit and mustmeet NPDES permit limits. Discharge to a POTW isconsidered an off-site activity, even if an on-site sewer isused. Therefore, compliance with substantive andadministrative requirements of the national pretreatmentprogram is required. General pretreatment regulations areincluded in 40 CFR Part 403. Any local or staterequirements, such as state antidegradation requirements,must also be identified and satisfied.
Any applicable local or state requirements, such as local orstate pretreatment requirements or water quality standards(WQS), must also be identified and satisfied. State WQSsare designed to protect existing and attainable surfacewater uses (for example, recreational and public watersupply). WQSs include surface water use classificationsand numerical or narrative standards (including effluenttoxicity standards, chemical-specific requirements, andbioassay requirements to demonstrate no observableeffect level from a discharge) (EPA 1988b). Thesestandards should be reviewed on a state- and location-specific basis before discharges are made to surface waterbodies. Bioassay tests may be required if the ZENON

23
system is implemented in particular states and if itdischarges treated water to surface water bodies.
2.8.4 Safe Drinking Water Act
The SDWA, as amended in 1986, requires EPA toestablish regulations to protect human health fromcontaminants in drinking water. The legislationauthorizes national drinking water standards and a jointfederal-state system for ensuring compliance with thesestandards. The SDWA also regulates undergroundinjection of fluids and sole-source aquifer and wellheadprotection programs.
The National Primary Drinking Water Standards are foundin 40 CFR Parts 141 through 149. SDWA primary orhealth-based, and secondary or aesthetic maximumcontaminant level (MCL) will generally apply as cleanupstandards for water that is, or may be, used for drinkingwater supply. In some cases, such as when multiplecontaminants are present, more stringent maximumcontaminant level goals (MCLG) may be appropriate. Inother cases, alternate concentration limits (ACL) based onsite-specific conditions may be used. CERCLA andRCRA standards and guidance should be used inestablishing ACLs (EPA 1987). During the demonstration,ZENON system performance was tested for compliancewith SDWA MCLs for TCE. Removal of TCE to belowthe MCL was not met and is discussed in Section 4.3.
If the treated water is reinjected into an aquifer, theZENON system may be interpreted by federal or stateagencies as underground injection since treated water isplaced into the subsurface. If this interpretation is applied,water discharged from the ZENON system will beregulated by the underground injection control programfound in CFR 40 Parts 144 and 145. Injection wells arecategorized in Classes I through V, depending on theirconstruction and use. Reinjection of treated waterinvolves Class IV (reinjection) or Class V (recharge) wellsand should meet requirements for well construction,operation, and closure. If after treatment, the groundwaterstill contains hazardous waste, its reinjection into theupper portion of the aquifer would be subject to 40 CFRPart 144.13, which prohibits Class IV wells. Technically,groundwater pumping wells used in conjunction with theZENON technology could be considered Class IV wellsbecause of the following definition found in 40 CFR Part144.6(d):
“(d) Class IV. (1) Wells used by generators of hazardouswaste or of radioactive waste, by owners or operators ofhazardous waste management facilities, or by owners oroperators of radioactive waste disposal sites to dispose ofhazardous waste or radioactive waste into a formationwhich within one-quarter (¼) mile of the well contains anunderground source of drinking water.
(2) Wells used by generators of hazardous waste or ofradioactive waste, by owners or operators of hazardouswaste management facilities, or by owners or operators ofradioactive waste disposal sites to dispose of hazardouswaste or radioactive waste above a formation which withinone-quarter (¼) mile of the well contains an undergroundsource of drinking water.
(3) Wells used by generators of hazardous waste orowners or operators of hazardous waste managementfacilities to dispose of hazardous waste, which cannot beclassified under paragraph (a)(1) or (d) (1) and (2) of thissection (e.g., wells used to dispose of hazardous waste intoor above a formation which contains an aquifer which hasbeen exempted pursuant to §146.04).”
The sole-source aquifer protection and wellheadprotection programs are designed to protect specificdrinking water supply sources. If such a source is to beremediated using the ZENON system, appropriateprogram officials should be notified, and any potentialregulatory requirements should be identified. Stategroundwater antidegradation requirements and WQSsmay also apply.
2.8.5 Clean Air Act
EPA has developed a guidance document for control ofemissions from air stripper operations at CERCLA sites.This document, entitled “Control of Air Emissions fromSuperfund Air Strippers at Superfund Groundwater Sites”(EPA 1989a), provides information relevant to ventedgases from the ZENON system. The EPA guidancesuggests that the sources most in need of controls are thosewith an actual emissions rate of total VOCs in excess of 3pounds per hour, or 15 pounds per day, or a potential(calculated) rate of 10 tons per year (EPA 1989b). Basedon air analysis from the demonstration, vapor dischargesfrom the ZENON system would be required to passthrough carbon filters to comply with the EPA guidance.

24
The CAA and the 1990 amendments establish primary andsecondary ambient air quality standards for protection ofpublic health as well as emission limitations for certainhazardous air pollutants. Permitting requirements underCAA are administered by each state as part of StateImplementation Plans developed to bring each state intocompliance with National Ambient Air Quality Standards(NAAQS). The ambient air quality standards for specificpollutants apply to the operation of the ZENON systembecause the technology ultimately results in an emissionfrom a point source to the ambient air. Allowable emissionlimits for operation of a ZENON system will beestablished on a site-by-site basis depending on the type ofwaste treated and whether or not the site is in an attainmentarea of the NAAQS. Allowable emission limits may be setfor specific hazardous air pollutants, particulate matter,hydrogen chloride, or other pollutants. A local StateImplementation Plan may include specific standards tocontrol air emissions of VOCs in ozone nonattainmentareas. Typically, an air abatement device such as a carbonadsorption unit will be required to remove VOCs from theZENON system’s process air stream before discharge tothe ambient air.
The ARARs pertaining to the CAA can only be determinedon a site-by-site basis. Remedial activities involving theZENON technology may be subject to the requirements ofPart C of the CAA for the prevention of significantdeterioration of air quality in attainment (or unclassified)areas. The PSD requirements will apply when theremedial activities involve a major source or modificationas defined in 40 CFR §52.21. Activities subject to PSDreview must ensure application of best available controltechnologies and demonstrate that the activity will notadversely impact ambient air quality.
2.8.6 Occupational Safety and HealthAdministration Requirements
CERCLA remedial actions and RCRA corrective actionsmust be performed in accordance with OSHA requirementsdetailed in 20 CFR Parts 1900 through 1926, especiallyPart 1910.120, which provides for the health and safety ofworkers at hazardous waste sites. On-site constructionactivities at Superfund or RCRA corrective action sitesmust be performed in accordance with Part 1926 ofOSHA, which provides safety and health regulations forconstructions sites. For example, electric utility hookupsfor the ZENON system must comply with Part 1926,Subpart K, Electrical. State OSHA requirements, which
may be significantly stricter than federal standards, mustalso be met. In addition, health and safety plans for siteremediations should address chemicals of concern andinclude monitoring practices to ensure that worker healthand safety is maintained.
All technicians operating the ZENON treatment systemare required to have completed an OSHA training courseand must be familiar with all OSHA requirements relevantto hazardous waste sites. For most sites, minimumpersonal protective equipment (PPE) for technicians willinclude gloves, hard hats, steel-toed boots, and coveralls.Depending on contaminant types and concentrations, andspecific operational activities, additional PPE may berequired. Noise levels should be monitored to ensure thatworkers are not exposed to noise levels above a time-weighted average of 85 decibels over an 8-hour day on theA-weighted scale.

25
This economic analysis presents cost estimates for usingthe ZENON cross-flow pervaporation technology to treatgroundwater contaminated with VOCs. Cost data werecompiled during the SITE demonstration at NASNI Site 9and from information obtained from independent vendors,R.S. Means Inc. (Means 1995), and ZENON. Costs havebeen placed in 12 categories applicable to typical cleanupactivities at Superfund and RCRA sites (Evans 1990).Costs, which are presented in 1995 dollars, are rounded tothe nearest 100 dollars, and are considered to be estimateswith an expected accuracy within 50 percent above and 30percent below the actual costs.
This economic analysis presents the costs associated withusing the ZENON pervaporation treatment system atNASNI Site 9 operating at 8 gpm continuously for 15years. Section 3.1 describes the issues and assumptionsthat form the basis of the economic analysis. Section 3.2discusses costs associated with using the ZENONtechnology to treat groundwater contaminated withVOCs, and Section 3.3 presents conclusions of theeconomic analysis.
3.1 Issues And Assumptions
This section summarizes major issues and assumptionsregarding site-specific factors, equipment, and operatingparameters used in this economic analysis. Issues andassumptions are presented in Subsections 3.2.1 through3.2.3. Assumptions are summarized in bullets followingeach section. Certain assumptions were made to accountfor variable site and waste parameters. Other assumptionswere made to simplify cost estimating for situations thatactually would require complex engineering or financialfunctions. In general, most ZENON system operatingissues and assumptions are based on information providedby ZENON and observations made during the SITEdemonstration.
3.1.1 Site-Specific Factors
Site-specific factors can affect the costs of using theZENON pervaporation treatment system. These factorscan be grouped into waste-related factors or site features.
Waste-related factors affecting costs include wastevolume, contaminant types and concentrations, andtreatment goals designated by regulatory agencies. Wastevolume affects total project costs because a larger volumetakes longer to remediate. However, economies of scalecan be realized with a larger-volume project because thefixed costs, such as equipment costs, are distributed overthe larger volume. The contaminant types and levels in thegroundwater and the treatment goals for the site determine(1) the appropriate number of ZENON pervaporationmodules, which affects capital equipment costs; (2) theflow rate at which treatment goals can be met, whichaffects the duration of the remediation; and (3) periodicsampling requirements, which affect analytical costs.
Site features affecting costs include geology, aquiferpermeability, groundwater chemistry (such as naturallyoccurring minerals in solution), and site geographiclocation. Site geology and soil characteristics such as totalorganic content and permeability also affect thegroundwater extraction rate and the required treatmentperiod. Overall, annual variable costs are relatively lowwith this technology. As a result, factors that affect theduration of remediation do not significantly impact totaltreatment costs.
Groundwater chemistry can affect the pervaporationsystem in several ways. Solids can clog the prefilter,requiring frequent cleaning. Influent with a high alkalinityor high amounts of calcium or iron can cause scaling of thesystem. Anti-scalents can be added to the untreated wateras a preventative measure. These factors would increase
Section 3Economic Analysis

26
the duration of remediation, affecting consumable andtime-related variable costs, or may impact maintenancecosts.
Geographic location will impact site preparation,mobilization, and demobilization costs. Mobilization anddemobilization costs are affected by the relative distancesthat system materials must be transported to the site. Sitepreparation costs are influenced by the availability ofaccess roads and utility lines.
Site-specific assumptions used for the economic analysisinclude the following:
• The groundwater is contaminated with TCE inconcentrations ranging from 30 to 250 milligrams perliter (mg/L) and is a hazardous waste
• Treated water will be discharged to a POTW
• Utilities, including electricity and water, along withother infrastructure features (for example, accessroads to the site) are readily available
• The groundwater remediation project involves atotal of 63 million gallons of contaminated water.This groundwater volume corresponds to the volumethat the system can treat operating continuously for 15years at an average flow rate of 8 gpm. Some down-time is expected for system maintenance and repair,and is not considered in this cost estimate
3.1.2 Equipment and OperatingParameters
ZENON will provide the appropriate system configuration,which includes pervaporation modules, condensers, andpiping. The configuration is based on site-specificconditions such as aquifer permeability and groundwatercontaminant types.
Depreciation of equipment is not considered in thisanalysis in order to simplify presenting the costs of thisanalysis. An additional assumption is that thepervaporation system will be perfected by ZENONthereby decreasing maintenance requirements. During thedemonstration, numerous equipment failures occurred,which caused extensive downtime and eventually requireddemonstration sampling to be shortened to 5 days (see
Section 4.2.3). If technical needs are not addressed byZENON, the costs associated with applying this systemcould be substantially higher than those presented in thisanalysis.
The equipment and operating parameter assumptionsinclude the following:
• A 100-square-foot concrete pad is needed for thepervaporation system
• The individual components of the treatment systemare mobilized to the site and assembled by ZENON
• Groundwater will be extracted from the contaminatedaquifer using existing wells
• The treatment system is operated 24 hours per day, 7days per week, 52 weeks per year for 15 years.Routine maintenance results in a down-time of about 2percent of this time and is not considered in thecalculations.
• The treatment system operates automatically withoutthe constant attention of an operator, with theexception of maintenance-related labor
• The treatment system is effective enough to allowtreated groundwater to be discharged to a POTW. Tocomply with NPDES or SDWA limitations, furthertreatment with a separate technology, such as carbonadsorption, may be required; however,postpervaporation carbon filters for water are notconsidered as part of this analysis.
• Air emissions monitoring is not needed based on the use of a carbon filter
3.1.3 Miscellaneous Factors
For this analysis, annual costs are not adjusted forinflation, and no net present value is calculated. Mostgroundwater remediation projects are long-term in nature,and usually a net present worth analysis is performed forcost comparisons. The variable costs for this technologyare relatively low. In addition, no other systemconfigurations or technologies are presented in thisanalysis for comparison.

27
Additional premises used for this economic analysis arethe following:
• The ZENON system is mobilized to the remediationsite from within 500 miles of the site
• Labor costs for operation, maintenance, and samplingare incurred by the client. ZENON performsmaintenance and modification activities that arepaid for by the client.
• Initial operator training is provided by ZENON a partof installation and startup services
3.2 Cost Categories
Table 3-1 presents cost breakdowns addressing the 12 costcategories. Cost data associated with the ZENONtechnology have been presented for the followingcategories: (1) site preparation, (2) permitting andregulatory, (3) mobilization and startup, (4) equipment,(5) labor, (6) supplies, (7) utilities, (8) effluent treatmentand disposal, (9) residual waste shipping and handling,(10) analytical services, (11) equipment maintenance, and(12) site demobilization. Each of these cost categories isdiscussed in the following sections.
3.2.1 Site Preparation
Site preparation costs include performing a treatabilitystudy, conducting engineering design activities, andpreparing the treatment area. A treatability study will takeabout 1 month to complete and cost between $1,000 and$3,000. After the study and a preliminary site assessment,ZENON will design the optimal system configuration fora particular site. System design costs are included in theequipment costs in Subsection 3.2.4.
Preparation of the treatment area includes installing a 100-square-foot concrete pad, fencing, and piping and pumpsto connect the wells to the system. Groundwater wellswith sufficient pumping and recovery rates are assumed tobe available, but piping will need to be installed to connectthe wells to the ZENON system and will cost about $10 perlinear foot to construct. For this analysis, it is assumed that500 feet of piping will be necessary to connect thegroundwater wells to the ZENON system. Total pipingcosts, including labor, are $5,000.
A concrete pad is preferred to support the ZENON system,although it is also possible to use packed soil. Theconcrete pad should be bermed, epoxy-coated, reinforced,and 6 inches thick. This pad can be constructed for $25 persquare foot for a total of $2,500. A 6-foot-high securityfence and one gate is needed to limit access to thetreatment system. Fencing costs about $21 per foot, whichincludes labor and supplies. This analysis assumes thefence will secure a 20-foot-by-20-foot area. Total fencingcosts, including labor and supplies, are $1,700.
Secondary containment for bulk storage of untreated andtreated water was required during the SITE demonstrationand may be required in other applications of thetechnology. Secondary containment for a 15-yeartreatment operation would probably require a sealedconcrete dike. An average of $5,000 has been used forsecondary containment.
Total site preparation costs are estimated to be $17,200.
3.2.2 Permitting and Regulatory Costs
Permitting and regulatory costs depend on whethertreatment is performed at a Superfund or a RCRAcorrective action site and on how disposal of treatedeffluent and any generated solid wastes occurs. Remedialactions at Superfund sites must be consistent with ARARsof environmental laws; ordinances; regulations; andstatutes, including federal, state, and local standards andcriteria. Remediation at RCRA corrective action sitesrequires additional monitoring and recordkeeping, whichcan increase the regulatory costs. In general, ARARs mustbe determined on a site-specific basis. This analysisassumes remediation at a Superfund site.
For this analysis, permitting and regulatory costs areassociated with discharging treated groundwater to aPOTW. The cost of all permits are based on thecharacteristics of the effluent and related receiving waterrequirements. An air permit is also necessary for therelease of VOCs that escape from the pervaporationsystem’s vacuum vent.
Total permitting and regulatory costs for this analysis areestimated to be $3,000.

28
Table 3-1. Costs Associated with the ZENON Treatment Process
29
3.2.3 Mobilization and Startup
Mobilization and startup costs include the costs ofdelivering the ZENON system components to the site fromthe suppliers, assembling the system, and performing theinitial shakedown of the treatment system. ZENONprovides trained personnel to assemble and shake downthe ZENON system. ZENON personnel are assumed to betrained in appropriate health and safety procedures, sohealth and safety training costs are not included as a directstartup cost. Initial operator training is needed to ensuresafe, economical, and efficient operation of the system.ZENON includes initial operator training to its customersin the cost of the capital equipment.
Transportation costs vary depending on the location of thesite in relation to the ZENON offices in Burlington,Ontario. The pervaporation system is mounted in a steelenclosure measuring about 12 feet by 8 feet by 7 feet, thatcan be shipped to sites in a semi trailer. The ZENONoffices are assumed to be located within 500 miles of thesite. Transportation costs are estimated to be $1,500 orabout $3 per mile.
Assembly costs include the costs of unloading deliveredequipment, assembling the ZENON system, pipingconnections, and electrical connections. A two-personcrew will work 10 8-hour days to unload and assemble thesystem and perform the initial shakedown. Working at awage rate of $25 per hour, which includes per diem,personnel costs for assembly are about $4,000. The onlyheavy equipment requirement is a forklift to move thepervaporation system from the semi-trailer to thetreatment location. A forklift would be necessary for thiswork for about 1 week. Forklift costs are estimated to be$600 for a weekly rental. Electricity connection costs willvary based on the site location and are estimated to be$4,000. Total assembly costs are estimated to be $8,600.
Clean water is used during the shakedown process toverify that all components are operating correctly beforethe contaminated water enters the system. Clean water isalso needed for decontaminating process equipment andfor site personnel. However, as the water requirements areminimal, no costs have been estimated.
Once the ZENON system is assembled and operational, aGC is needed to monitor the effectiveness of contaminantremoval from the effluent. The GC is necessary for about2 months for ZENON to ensure that the system is operating
at its optimum. Rental costs for the GC are estimated to be$4,000 per month, for a total cost of $8,000.
A trailer will be needed during mobilization to houseequipment, the GC, and as a meeting area. A 2-monthtrailer rental is about $1,200.
Total mobilization and startup costs are estimated to be$19,300.
3.2.4 Equipment Costs
Equipment costs consists of the costs of purchasing theZENON treatment system. ZENON configures thecomplete ZENON treatment system based on site-specificconditions. The components for this analysis and theirrespective costs include: the pervaporation system($140,000) and two 10,000-gallon steel bulk tanks($10,000 or $5,000 each) for equalization of thegroundwater. System design costs are included with thesecosts.
The equipment will be used for the duration of thegroundwater remediation project, which for this analysisis 15 years. The pervaporation modules have a potentialsalvage value of 25 percent of their original cost; however,because of the uncertainty of economic circumstances andmarket conditions, no salvage value was assumed for thisanalysis.
The total equipment costs of this treatment system are$150,000.
3.2.5 Labor
Once the system is functioning, it is assumed to operateunattended and continuously except during routineequipment monitoring. One operator, trained by ZENON,performs routine equipment monitoring and samplingactivities. Under normal operating conditions, an operatoris required to monitor the system about 4 hours per week.This labor could be contracted at about $45 per hour.
Total annual labor costs are estimated to be $7,000.
3.2.6 Supplies
Supplies that will be needed include carbon filters,disposable Level D PPE, waste drums, and sampling andfield analytical supplies.

30
To comply with air regulations, carbon filters forcapturing VOC releases from the vacuum vent of thesystem are a requirement in most applications of thistechnology. Two 55-gallon carbon canisters were usedduring the demonstration – one initial filter was as aprimary capturing measure, while the second was used asa precautionary measure, in the event VOCs escaped fromthe first filter. Carbon canisters cost about $250 each.Analytical results from the demonstration showed nobreakthrough to the second carbon filter over about fourmonths of off and on activity. It is estimated that eightfilters would be required each year initially, changed outquarterly. This number could change based on analysisresults and site conditions. Total cost for carbon canistersare about $2,000 per year.
Disposable PPE typically consists of latex inner gloves,nitrile outer gloves, and safety glasses. This PPE is neededduring monthly sampling activities that are assumed to beconducted by the contracted operator. Disposable PPE isassumed to cost about $200 per year for the operator.
Disposable PPE and concentrated permeate are assumedto be hazardous and need to be disposed of in a 55-gallonsteel drum. About four drums are assumed to be filledevery month, and each drum costs about $15. Total annualdrum costs are about $700.
Sampling supplies are usually provided free of charge bylaboratories and consist of sample bottles and containers,labels, shipping containers, and laboratory forms for off-site analyses. Costs for laboratory analyses and samplingcollection labor are presented in Subsection 3.2.10.
Total annual supply costs are estimated to be $2,900.
3.2.7 Utilities
Electricity and water are the utilities used by the ZENONsystem. Less than 2,000 gallons of water would benecessary during mobilization, so water costs areconsidered negligible. Based on observations madeduring the SITE demonstration, the system operating for24 hours draws about 1,680 kilowatt hours (kWh) ofelectricity per day. The total annual electrical energyconsumption is estimated to be about 613,200 kWh.Electricity is assumed to cost $0.09 per kWh, includingdemand and usage charges. The total annual electricitycosts are about $55,200.
3.2.8 Effluent Treatment and DisposalCosts
This analysis assumes that no further treatment is neededprior to releasing the treated effluent into the POTW.Permitting costs were presented under permitting andregulatory costs in Subsection 3.2.2. Actual disposal costsdepend on the concentrations of VOCs in the effluent andon the rates charged by a local POTW. Based on 1996industrial sewer rates for medium-sized cities, total annualeffluent treatment costs are $7,000 (PRC EnvironmentalManagement, Inc. [PRC] 1996a and 1996b).
3.2.9 Residual Waste Shipping andHandling
The residuals produced during operation of the ZENONsystem are spent carbon canisters, used PPE, andconcentrated permeate, all of which would be contained insteel drums. For purposes of this analysis, this waste isconsidered hazardous and requires disposal at a permittedfacility. It is also assumed that the drums will be removedevery 90 days in accordance with RCRA generatoraccumulation requirements. Carbon canister removal iscalculated separately from PPE and permeate.
The disposal of carbon canisters during the demonstrationequaled about $300 per drum. Transportation costs areestimated at $300 per shipment. Estimating the removal ofeight canisters per year over four trips, annual cost ofdisposing of the carbon canisters is $3,600.
PPE generation is estimated at two drums per year andcould be removed with the concentrated permeate.Because of mechanical problems with the ZENONtechnology during the demonstration, the amount ofpermeate generated could only be estimated. This analysisassumes that about 48 drums of concentrated permeatewould be generated annually. As a result, transportationcosts will be incurred four times a year. The cost ofhandling and transporting the drums is $300 per load, anddisposing of them at a hazardous waste disposal facility byincineration costs about $600 per drum. Annual drumdisposal costs will be about $30,000.
Total annual costs for the removal and disposal ofresiduals is about $33,600.

31
3.2.10 Analytical Services
Required sampling frequencies and number of samples aresite-specific and based on treatment goals andcontaminant concentrations. Analytical costs associatedwith a groundwater remediation project include the costsof laboratory analyses, data reduction, and qualityassurance/quality control (QA/QC). This analysisassumes that one sample of treated water, and anassociated QC sample (trip blank) will be collected andanalyzed monthly for the following two series ofparameters: VOCs ($195) and SVOCs ($370). Monthlyanalytical costs for these parameters are about $600. Also,to indicate evaluate contaminant breakthrough, one airsample should collected each quarter from the vacuumvent line, between the two carbon canisters. This could bedone with a SUMMA™ canister and analyzed for about$300 each. There is no charge for labor associated withsample collection because the operator who performs theroutine monitoring will also perform the samplingactivities. The total annual analytical costs are estimatedto be $8,400.
3.2.11 Equipment Maintenance
Maintenance labor is needed to check the pervaporationmodule prefilter for debris or biological build-up. If debrisor bacteria is found, it is manually scraped off of theprefilter membranes. Occasional acid washings arenecessary to clean scaled materials from the membranes.A neutralization chemical, such as sodium hydroxidewould have to be added to the acid solution beforedischarge to a POTW. Depending on the chemistry ofwater to be treated, an anti-scaling chemical may need tobe added to the influent. Costs for acid and anti-scalentsare determined on a site-by-site basis and can vary widely.ZENON considered the groundwater chemistry conditionsduring the demonstration to be atypical, presenting aworst-case scenario. It is estimated that $2,500 would bespent on anti-scalent chemicals per year. No additionalcharges for labor associated with equipment maintenanceare added because the operator performing the samplingand routine monitoring labor will also perform equipmentmaintenance.
Although the groundwater remediation is long-term,equipment replacement is expected to be minimal. Theonly replacement parts identified by ZENON that wouldrequire replacement are seals for the piping. However,other costs should be expected, and replacement part costsare estimated at an average of $1,500 per year.
Total annual equipment maintenance costs are estimatedto be $4,000.
3.2.12 Site Demobilization
Site demobilization includes treatment system shutdown,disassembly, and decontamination; site cleanup andrestoration; utility disconnection; and transportation of theZENON equipment off site. This analysis assumes that allequipment will be transported off site for overhaul ordisposal.
For this analysis, demobilization costs are assumed tooccur 15 years from the date of startup. Because of theuncertainty of economic circumstances and marketconditions, this analysis does not estimate the cost ofdemobilization or if the equipment has salvage value.
3.3 Conclusions of Economic Analysis
This analysis presents cost estimates for treatinggroundwater contaminated with TCE. Operatingconditions include treating the groundwater at 8 gpm for aperiod of 15 years. Table 3-1 shows the costs associatedwith the 12 cost categories presented in this analysis.
Total fixed costs are $189,500. Treatment equipmentcosts comprise 79 percent of the total fixed costs. Figure3-1 shows the distribution of fixed costs. Total annualvariable costs are $118,100. Utilities costs comprisenearly 50 percent of the variable costs, and residual wastehandling services comprise about 28 percent. Figure 3-2shows the distribution of variable costs.
After operating for 15 years, the total cost of thegroundwater remediation scenario presented in thisanalysis is $1,961,000. Annual costs were not adjusted forinflation. A total of 63 million gallons of groundwaterwould be treated over this time period. The total cost per1,000 gallons treated is $31, or roughly 3 cents per gallon.
As noted, it is assumed that the pervaporation system willbe perfected by ZENON thereby decreasing maintenancerequirements. During the demonstration, numerousequipment failures occurred, which caused extensivedowntime. If technical needs are not addressed byZENON, the costs associated with applying this systemcould be substantially higher than those presented in thisanalysis.

32
Figure 3-1. Fixed costs.
Figure 3-2. Annual variable costs.
Mobilizationand Startup Costs
$19,300(10.2%)
Site PreparationCosts $17,200
(9.1%)
PermittingCosts$3,000(1.6%)
Equipment Costs$150,000 (79.2%)
Labor Costs$7,000(5.9%)
AnalyticalServices Costs
$8,400(7.1%)
Utilitity Costs$55,200(46.7%)
Supply Costs$2,900(2.5%)
EquipmentMaintenance Costs
$4,000(3.4%)
ResidualWaste Costs
$33,600(28.5%)
EffluentDisposal Costs
$7,000(5.9%)

33
This section documents the background, field andanalytical procedures, results, and conclusions used toassesses the ability of the ZENON cross-flow pervaporationtechnology to remove VOCs from contaminatedgroundwater. This assessment is based on the activitiesconducted during the SITE demonstration at NASNI.Because the results of the SITE demonstration are ofknown quality, conclusions in this section are drawn onlyfrom the demonstration results.
4.1 Background
EPA conducted a SITE demonstration of the ZENONsystem at Site 9 at NASNI, which is located in Coronado,California (see Figure 4-1). A description of theenvironmental setting at NASNI and Site 9 are presentedin Subsections 4.1.1 and 4.1.2. An overview of thedemonstration objectives and approach is presented inSubsection 4.1.3.
4.1.1 Naval Air Station North Island
NASNI is located at the north end of the peninsula thatforms San Diego Bay and adjoins the city of Coronado.NASNI is accessible by land through Coronado by way ofthe San Diego - Coronado Bay Bridge or through ImperialBeach by way of the Silver Strand Highway, State Route75. Commissioned in November 1917, NASNI is anactive, 2,520-acre naval complex that supports navalaviation activities and units.
NASNI is currently conducting environmentalinvestigations under the Installation Restoration Programat 12 sites, one of which is Site 9. The Navy is expeditingcleanup of these sites through the Naval EnvironmentalLeadership Program (NELP). The main objective ofNELP is to demonstrate innovative technologies and focusmanagement to expedite compliance and remediation at
contaminated NASNI sites. Successful technologies maybe applied to contaminated sites at other naval facilities.
During mid-1993, the SITE program and NELP began todiscuss the potential for demonstrating innovativetechnologies at NASNI. The SITE program informedNELP of the treatment methodology of the ZENONtechnology and site requirements for a demonstration.NELP provided the SITE program with groundwater datafor Site 9, along with information regarding site access andavailable utilities. In March 1994, after verifying that itwas a suitable candidate for treatment with the ZENONtechnology, SITE 9 was selected for the demonstration.The demonstration of the technology at NASNI wasperformed under a cooperative agreement between NELPand the SITE Program, and was financed in part by EPA,the U.S. Navy, and ZENON.
4.1.2 Site 9 Features
Site 9 is a 4.7-acre area located on the western end ofNASNI. It is bordered to the north by an aircraft taxiway,a number of maintenance buildings, an open area; to theeast by small buildings and runways; to the south by anammunition storage area; and to the west by anammunition pier and a channel of San Diego Bay. Thedemonstration area at Site 9 and surrounding features areshown in Figure 4-2. Site 9 is relatively flat; however, justsouth of 3rd Street West, there is an immediate 7-foot riseof the land surface to a terrace.
Geology and Hydrogeology
Borings performed during previous investigationsindicate that formations underlying Site 9 consist ofvarying, unconsolidated layers of sand, silt, and clay, witha few lenses of shell beds. The Bay Point formationunderlies all of Site 9 at an average depth of about 25 to 30
Section 4Treatment Effectiveness

34
Figure 4-1. NASNI and Site 9 location map.

35
Figure 4-2. Site 9 demonstration area.

36
feet below ground surface (bgs). It is exposed east of thesite near the central portion of North Island and dipssharply at an undetermined gradient towards the west. TheBay Point formation is highly unconsolidated and consistsof micaceous, clayey, fossiliferous, very fine- to medium-grained, silty sand.
Overlying the Bay Point formation is a series of threeartificial fill layers. The fill was placed in 1936, 1976, and1978 from various island extension projects and dredging.Borings indicate that the fill consists of micaceous,fossiliferous, fine- to medium-grained sand and silty sand,with some areas containing gravel, wood chips, concrete,and asphalt debris. The layers are considered poorlygraded and unconsolidated (Southwest Division NavalFacilities [SWDIV] 1993).
The water table at Site 9 averages about 8 feet bgs, andgroundwater flow direction is west toward the shoreline.The saltwater-freshwater interface is about 60 feet bgs(SWDIV 1993). The Bay Point formation’s porosityranges from 33 to 47 percent; the hydraulic conductivityranges from 70 to 92 feet per day. Porosities of the filllayers range from 45 to 56 percent; hydraulicconductivities range from 8 to 16 feet per day.
Waste Disposal Practices
Waste disposal records from the mid-1970s indicate thatabout 300,000 to 800,000 gallons of liquid wastes weredisposed of annually at Site 9 (SWDIV 1993). Thesewastes included waste acids, waste solvents, waste paintmaterials, electroplating wastes, and various petroleumhydrocarbons.
Site 9 consists of three former waste disposal areas. Thefirst area is located just north of 3rd Street West. From the1940s or 1950s until 1968, various liquid wastes weredrained into a large, shallow pit. Waste materials havesince migrated through the groundwater to variousportions of the surrounding area. The second area islocated just south of 3rd Street West and consisted of fourparallel disposal pits oriented north to south. From anundetermined date to the mid-1970s, liquid wastes,including caustics, acids, and other hazardous materials,were segregated and disposed of in these separatetrenches. Contamination has migrated from the trenchesand entered the underlying groundwater. The third formerwaste disposal area is located south of 3rd Street West nearthe center of Site 9 extending to its southern boundary. It
was used periodically from the 1950s until 1978 for theburial of unidentified drummed chemical wastes.Groundwater contamination has been confirmed near thislocation (SWDIV 1993). Site 9 also contains a formerlow-level radioactive materials staging area. A 1977 landdevelopment map displays an area just south of the wastedisposal trenches as a radioactive materials disposal area;however, radioactive waste disposal has not beendocumented near this area.
No development of the Site 9 area has occurred since wastedisposal operations ended, and none is planned in the nearfuture. Under NASNI’s federal RCRA permit, Site 9 isrequired to undergo a RCRA facility investigation.Monitoring well installation; sampling and analysis ofsoils, sediments, and groundwater; and geophysicalsurveys have been performed as part of this investigation.
Demonstration Monitoring Wells
Monitoring wells installed as part of the RCRA FacilityInvestigation at Site 9 provided groundwater for theZENON demonstration. EPA’s SITE team and ZENONreviewed Site 9 monitoring well data, including the mostrecent analytical results, screened depths, and wellconstruction criteria. Because of logistical concerns,including pump capacity limitations, only monitoringwells within 500 feet of the proposed demonstration areawere considered for use during the demonstration.
The following four wells were selected as potentialsources of groundwater because of elevated concentrationsof TCE, as well as other VOC concentrations: 9-IMW-1,9-IMW-2, 9-DMW-1, and 9-CW-5. The well locations areshown on Figure 4-2; selected analytical results for thesefour wells from samples collected during the Spring of1994 are shown in Table 4-1.
4.1.3 Bench-Scale Study
In December 1993, ZENON performed a bench-scalestudy of the pervaporation technology using groundwatersampled from monitoring well 9-IMW-1 at NASNI Site 9.The study was mainly performed to determine if highsalinity and the presence of nontarget compounds ingroundwater at Site 9 would be detrimental to theperformance of a pervaporation system. The results of thebench-scale study indicated that salinity or othercharacteristics of the local groundwater did not affect thesystem’s ability to remove VOCs (ZENON 1994).

37
Table 4-1. Analytical Results for Site 9 Groundwater
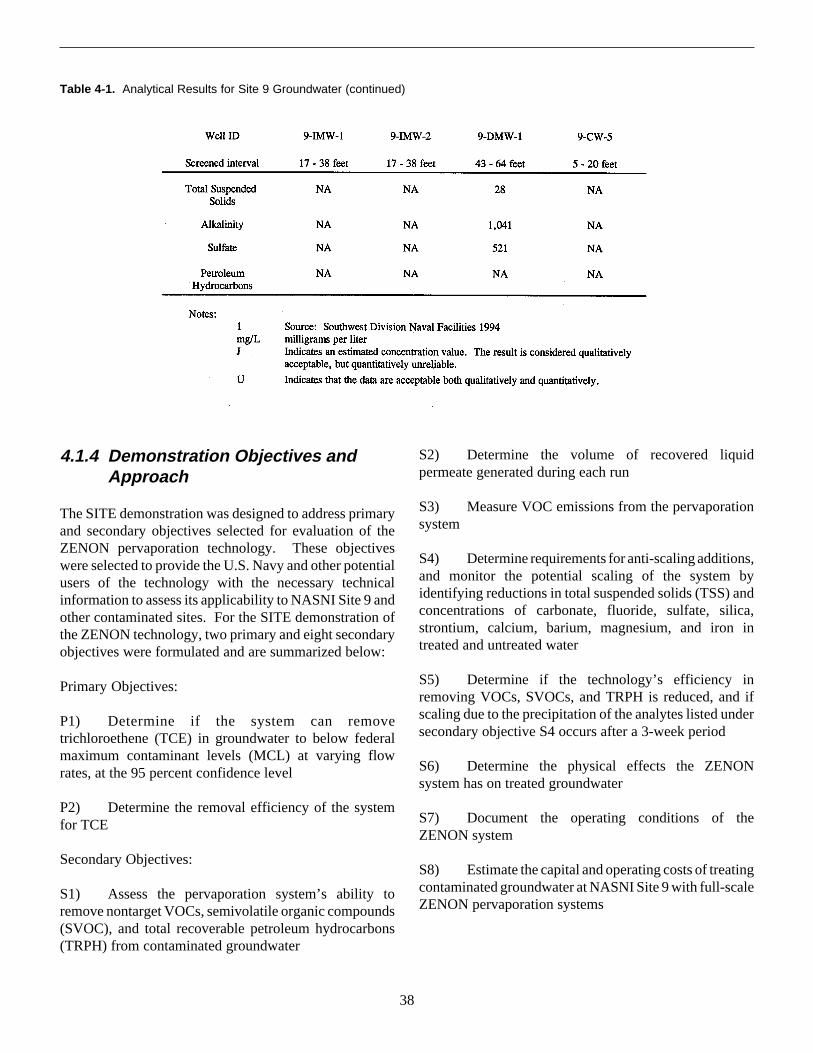
38
4.1.4 Demonstration Objectives andApproach
The SITE demonstration was designed to address primaryand secondary objectives selected for evaluation of theZENON pervaporation technology. These objectiveswere selected to provide the U.S. Navy and other potentialusers of the technology with the necessary technicalinformation to assess its applicability to NASNI Site 9 andother contaminated sites. For the SITE demonstration ofthe ZENON technology, two primary and eight secondaryobjectives were formulated and are summarized below:
Primary Objectives:
P1) Determine if the system can removetrichloroethene (TCE) in groundwater to below federalmaximum contaminant levels (MCL) at varying flowrates, at the 95 percent confidence level
P2) Determine the removal efficiency of the systemfor TCE
Secondary Objectives:
S1) Assess the pervaporation system’s ability toremove nontarget VOCs, semivolatile organic compounds(SVOC), and total recoverable petroleum hydrocarbons(TRPH) from contaminated groundwater
S2) Determine the volume of recovered liquidpermeate generated during each run
S3) Measure VOC emissions from the pervaporationsystem
S4) Determine requirements for anti-scaling additions,and monitor the potential scaling of the system byidentifying reductions in total suspended solids (TSS) andconcentrations of carbonate, fluoride, sulfate, silica,strontium, calcium, barium, magnesium, and iron intreated and untreated water
S5) Determine if the technology’s efficiency inremoving VOCs, SVOCs, and TRPH is reduced, and ifscaling due to the precipitation of the analytes listed undersecondary objective S4 occurs after a 3-week period
S6) Determine the physical effects the ZENONsystem has on treated groundwater
S7) Document the operating conditions of theZENON system
S8) Estimate the capital and operating costs of treatingcontaminated groundwater at NASNI Site 9 with full-scaleZENON pervaporation systems
Table 4-1. Analytical Results for Site 9 Groundwater (continued)

39
The demonstration objectives were achieved by collectingdata from analysis of untreated and treated groundwatersamples, along with vapor samples. To meet thedemonstration objectives, data were collected andanalyzed using the methods and procedures summarizedin Section 4.2. A more detailed description of thedemonstration procedures is provided in the final ZENONquality assurance project plan (QAPP) (PRC 1994c) andthe ZENON Technology Evaluation Report (PRC 1996c).
4.2 Demonstration Procedures
This section describes the methods and procedures used tocollect and analyze samples for the SITE demonstration ofthe ZENON technology. The field and analytical methodsand procedures used to collect and analyze samples wereconducted in accordance with the ZENON demonstrationQAPP. The activities associated with the SITEdemonstration included (1) demonstration preparation, (2)demonstration design, (3) groundwater sample collectionand analysis, (4) vapor sample collection, and (4) field andlaboratory QA/QC.
4.2.1 Demonstration Preparation
Predemonstration activities included preparing of thedemonstration QAPP, site specific health and safety plan(PRC 1994b), demonstration work plan (PRC 1994a), theacquisition of permits, and site preparation. The QAPP,site specific health and safety plan, and the demonstrationwork plan were submitted in May 1994 to various agenciesfor review. Final versions of these documents wereprepared in August and September 1994.
Three permits were required for the SITE demonstration atNASNI. The California EPA Division of Toxic SubstanceControl required a Hazardous Waste ResearchDevelopment and Demonstration Permit Variance for thedemonstration. This allowed the extraction, treatment,and discharge of contaminated groundwater, along withthe storage of hazardous waste at Site 9, to be performedunder NASNI’s RCRA permit. A permit was required bythe City of San Diego for the discharge of treated water toa sewer line at NASNI running to a POTW. The permitrequired analyses of the treated groundwater for variousorganic contaminants. A permit was also required by theSan Diego County Air Pollution Control District for therelease of vapors from the pervaporation system. Nosampling was required under this permit. Inspections atSite 9 by the above-mentioned agencies were required
before the demonstration could proceed. Because ofdelays in performing the demonstration, extensions of allthree permits were required (see Subsection 4.2.3).
Preparation activities conducted at Site 9 included thefollowing: (1) connecting of electrical power and freshwater to the site; (2) testing dedicated groundwater pumpsfor the monitoring wells identified for use during thedemonstration; (3) placing four 21,000-gallon steel bulktanks at the site; (4) constructing secondary containmentunits surrounding the bulk tanks and the pervaporationunit; (5) installing various groundwater pumping lines; (6)installing a GC unit for field sample analysis; and (7)installing carbon filters. Other requirements includedtemporary fencing, storage drums, an on-site trailer,sanitary facilities, sample containers, PPE, and laboratorysupplies (PRC 1994a).
4.2.2 ZENON System Configuration
A detailed description of the ZENON cross-flowpervaporation technology is provided in Section 1.3. Thefollowing explains the system configuration during theSITE demonstration at NASNI Site 9.
During the demonstration, previously installed monitoringwells were used to obtain all groundwater necessary fortesting and sampling. The monitoring wells wereequipped with dedicated pumps, usually capable of about8 gpm, depending on the depth of the pump. Control boxesfor regulating the pumps were supplied by EPA andplugged into the well head. Power for the wells wasprovided by direct electrical hookups installed for thedemonstration. Groundwater was pumped from the wellsto a manifold equipped with flow meters displaying theflow rate of groundwater pumped from each well (threemaximum), and a sampling port. The manifold served tocombine the flows and allowed the demonstration team toregulate the flow from each well, and in turn, TCE influentconcentrations. The manifold was also equipped with asampling port. The combined groundwater flows exitedthe manifold and entered a bulk tank for equalization.Because of problems with the bulk tanks (see Subsection4.2.3), the demonstration team eventually bypassed thetanks and pumped groundwater directly to the ZENONsystem. During the demonstration, untreated groundwaterwas pumped from the wells at 2.1 to about 11.2 gpm.Before entering the system, the untreated groundwaterwas passed through a 200-micron prefilter to remove anydebris or silt particles. It then entered a heat exchanger,

40
raising the temperature to about 165 °F (75 °C). From theheat exchanger, the water flowed into a series of twopervaporation modules for separation of VOCs from thegroundwater. The treated water exited the pervaporationmodules and was passed through a series of two 1,000-pound carbon filters to ensure the removal of SVOCs. Thetreated water then entered a steel 21,000-gallon bulk tankand was stored until it was discharged to the industrialsewer, located about 500 feet northeast of thedemonstration area.
The VOC-laden vapors from the pervaporation moduleswere passed through a condenser. Most aqueous phasepermeate was returned to the pervaporation modules,while organic phase permeate was contained in 55-gallondrums.
Heat for the heat exchanger was supplied by a steamcleaner converted to a boiler, and cool air for the condenserwas supplied by a chiller. Both the boiler and chiller wereseparate from the pervaporation unit. All electrical powerwas supplied by a direct hookup installed at the site by theNaval Public Works Center, San Diego.
4.2.3 Demonstration Delays
Demonstration sampling from the ZENON technologywas initially scheduled to occur during October 1994, andmobilization began in September 1994. As noted inSubsection 4.2.2, four 21,000-gallon steel bulk tanks werebrought to the site for storage of untreated and treatedgroundwater. Pumping of untreated groundwater from thebulk tanks began during middle October 1994, andZENON immediately began experiencing problems withrust particles from the bulk tanks mixing with thegroundwater. Larger particles tended to clog the 200-micron prefilter, and smaller particles fouled and scaledthe pervaporation module membranes, reducing treatmentefficiency. After several failed attempts to keep the filterclear, combined with frequent acid washings of themodules, the demonstration team began pumpinggroundwater directly from the monitoring wells to thesystem. Bypassing the tanks eliminated the filterclogging, along with fouling and scaling from the rustparticles; however, high concentrations of calciumbicarbonate in the groundwater continued to cause themembranes to become scaled and fouled. During lateNovember, after attempts with a variety of chemicals,ZENON selected an anti-scalent similar to zinc phosphate,which proved fairly effective.
During this time, ZENON also had difficulty regulatingsteam for the heat exchanger entering the system. Theboiler was composed of a rented steam cleaner modifiedfor the demonstration. ZENON eventually corrected thisproblem by altering a valve configuration on the system.
Other mechanical problems plagued the demonstration.The sight glass on the permeate collection tank leaked,which did not allow the system to maintain pressure insidethe tank. The drains on the pervaporation modules weretoo small and became plugged with sediment fines carriedby the groundwater. Sediment fines also partially pluggeda number of check valves, which allowed unwantedbackflow. Also, TCE continually coming in contact withthe pump seals caused premature degradation and eventualfailure of the pumps.
The natural conditions at Site 9 also caused variousproblems. Salty air caused a number of metal componentsto fail prematurely. Dusty conditions caused grit to buildup on some components. Heavy rains caused electricalshorts in the system control panel and in an electrical panelfor the boiler. The boiler pilot light was repeatedlyextinguished by strong winds prevalent in the area.
Because of continuing pump problems, pump shippingdelays, a GC malfunction, travel difficulties, anduncharacteristically poor weather conditions duringJanuary 1995, demonstration sampling was postponeduntil February 1995.
4.2.4 Demonstration Design
This section describes the sampling and analysis programand sample collection frequency and locations. Theobjective of the demonstration design was to collect andanalyze samples of known and acceptable quality toachieve the objectives in the QAPP.
Groundwater Pumping and Gas ChromatographAnalysis
To achieve various TCE concentrations, groundwater waspumped from combinations of monitoring wells. Thedemonstration team planned to use four monitoring wells;however, after pumping for about 10 minutes at 5 gpm,monitoring well 9-CW-5 was pumped dry and not usedduring the rest of the demonstration. Groundwater frommonitoring wells 9-DMW-1, 9-IMW-1, and 9-IMW-2

41
was used to provide all groundwater. Groundwatersamples were collected from a polyvinyl chloride (PVC)manifold combining the flows from each well, andanalyzed with an on-site GC. Based on the analyticalresults, which were available after about 40 minutes, theflow rates were adjusted to achieve desired TCEconcentrations. Also, during the first few hours ofpumping a particular well, the groundwater was analyzedfor chromium and cyanide with field test kits. Moderatelyelevated concentrations of these two analytes were foundduring past sampling events from well 9-IMW-2, causingdischarge concerns; however, negligible concentrationswere detected in the groundwater during the demonstration.
The GC was also used to determine the optimum operatingconditions for the system. Samples of untreated andtreated groundwater were analyzed, results werecompared, and the system was adjusted accordingly.Finally, samples of treated water, after it passed throughthe two 1,000-pound carbon filters, were analyzed with theGC to confirm that water discharged to the industrialsewer was within designated permit limits.
Groundwater Sampling and Analysis Program
After achieving a designated flow rate and sustainedconcentration of TCE, samples of untreated and treatedgroundwater were collected. As noted, untreated sampleswere collected from a port on the manifold (S1) thatcombined groundwater from the separate wells (see Figure1-2). Samples of treated groundwater were collected froma port on the discharge line of the ZENON system (S2).
The demonstration was composed of 4.5 days of sampling,with each day referred to as a sampling run. Four grabsamples of untreated water were collected per run, alongwith four samples of treated water. A sampling overviewis shown in Table 4-2.
The demonstration QAPP specified that most samplingfrom the system would occur at the start of thedemonstration. The system would then operate for a 3-week period with little maintenance. After the 3-weekperiod, additional sampling would occur. Beforedemonstration sampling began, the SITE team elected tonot run the system for 3 weeks and then resample because(1) component failures caused continual treatmentdifficulties with the pervaporation system, (2) adequateinformation pertaining to scaling (a primary reason for the3-week test period) was gathered before demonstration
sampling, and (3) cost concerns had arisen due to projectdelays. As explained in Subsection 4.2.3, problemsranging from temperature regulation difficulties topremature failure of seals on various pumps, interferedwith the treatment efficiency of the ZENON technology.After weighing several options, the demonstration teamelected to limit sampling to six 8-hour runs. When astainless tube on the pervaporation module failed,demonstration sampling ended 4 hours into the fifth run.
Vapor Samples and Sampling Methodology
Vapor samples were collected from the vacuum vent fromthe system (S3) and from the vent after the vapor passedthrough a single air carbon filter (S4). Samples at S3 werecollected to determine the amount of VOCs released fromthe vacuum vent relative to the concentrations ofcontaminants in groundwater treated by the system and theinfluent flow rate. The amount of VOCs released wouldprovide an indication of the amount of VOCs notconverted to liquid by the condenser. To comply with stateand local air regulations, two carbon filters were attachedto the vacuum vent to capture VOCs that would otherwisebe released to the outside air. Sampling point S4, locatedbetween the carbon filters, provided a verification that allVOCs not condensed in the ZENON system were capturedby the first carbon filter. Sampling point S4 was notintended to provide data on releases of VOCs from thevacuum vent of the ZENON system. Data from S4 wasonly intended to verify that VOCs were not released to theoutside air. Therefore, the data for sampling point S4 is notincluded with this document.
Vapor samples were collected in 6-liter SUMMA™polished stainless steel canisters. Two samples per 8-hourrun were collected, except for the fifth day, when only onesample was collected because the run was abbreviated.For vapor sampling, each SUMMA™ canister wasattached, via a male/female connector, directly to a shut-off valve that was connected to the vacuum vent. After thecanister was attached, the shut-off valve on the vacuumvent was opened. The valve on the SUMMA™ canisterwas then opened for about 5 seconds until the sound of thevacuum began to decrease. The SUMMA™ canistervalve was then closed, followed by the shut-off valve onthe vacuum vent. The SUMMA™ canister was thenremoved from the shut-off valve and packaged forshipment to the laboratory. Canister vacuum measurementswere not taken before and after sampling.

42
Table 4-2. Sampling Overview

43
4.2.5 Analytical Methodology
Liquid samples were analyzed for the required parametersby the methods specified in Table 4-3. TCE in untreatedand treated water was the only critical parameter for thisdemonstration. All air samples were analyzed by MethodTO-14 using gas chromatograph/mass spectrophotometer(GC/MS) full scan detection.
Method 8260, which was used to measure concentrationsof TCE and other VOCs, involves the use of a GC/MSsystem operated under recommended conditions. Thevolatile components of an aliquot of the sample areintroduced into the GC/MS system using a purge and trapprocedure with detection of analytes using a massspectrometer. Compounds are identified by comparingpeak retention times and mass fragmentation patterns tothe known retention times and known fragmentationpatterns of the target compounds. The concentration ofeach target compound detected is determined from thepeak response by comparison with the associated internalstandard and the external calibration standards.
For each analyte of interest, initial calibration wasperformed using calibration standards at a minimum offive concentrations. One of the initial calibrationstandards was at a concentration near, but above, theMDL. The other concentrations corresponded to theexpected range of sample concentrations or defined theworking range of the detector.
Each calibration standard was analyzed by the sametechnique used to introduce the samples into the GC. Peakor area responses were tabulated against the mass injected.The results were used to prepare a calibration curve foreach compound. In addition, the ratio of the response(relative to the internal standard) to the amountintroduced, or the relative response factor (RRF), wascalculated for each compound at each standardconcentration. If the percent relative standard deviation(%RSD) of the relative response factor met the methodcriteria of 30 percent over the working range, linearitythrough the origin can be assumed, and the average RRFcan be used in place of a calibration curve.
Table 4-3. Analytical Methods

44
4.2.6 Quality Assurance and QualityControl Program
QC checks and procedures were an integral part of theSITE demonstration to ensure that the QA objectives weremet. These checks and procedures focused on thecollection of representative samples absent of externalcontamination and the analysis of comparable data. TheQC checks and procedures conducted during thedemonstration were of two kinds: (1) checks of fieldactivities, such as sample collection and shipping, and (2)checks of laboratory activities, such as extraction andanalysis. These are discussed below. A data qualitysummary is provided in Section 4.3.4.
Field Quality Control Checks
As a check on the quality of field activities such as samplecollection, shipment, and handling, three types of field QCchecks (duplicate samples, field blanks, and trip blanks)were collected. In general, these QC checks assessedpossible contamination or the representativeness of thesamples. Any QC results that failed acceptance criteriaand could not readily be corrected in the laboratory werereported to the PRC project manager or PRC QA manageras soon as possible to effect corrective action. If a field QCcheck sample exceeded the established criteria for anyanalytical parameter, analytical results of that parameterfor all associated samples having the analyte concentrationabove the quantitation limit were flagged duringpostlaboratory validation.
Duplicate samples (DUP), separated aliquots of thesample analyzed by the same method, were collected toassess the laboratory’s precision. Field blanks werecollected to assess the potential for contamination of thesample from dust or other sources at the site during samplecollection. Trip blanks were prepared to determinewhether contamination was introduced through samplingcontainers or as a result of exposure during shipment.
Laboratory Quality Control Checks
Laboratory QC checks were designed to determineprecision and accuracy of the analyses, to demonstrate theabsence of interferences and contamination fromglassware and reagents, and to ensure the comparability ofdata. Laboratory-based QC checks consisted of methodblanks, MS/MSDs, surrogate spikes, blank spikes andblank spike duplicates, and other checks specified in the
analytical methods. The laboratory also performed initialcalibrations and continuing calibration checks accordingto the specified analytical methods.
Field and Laboratory Audits
EPA conducted internal and external system audits toevaluate field and laboratory QC procedures. Because ofdelays in performing the demonstration sampling, the fieldaudit was conducted before data collection and analysisactivities commenced. The laboratory audit wasperformed while samples from the demonstration wereanalyzed. The results of both EPA audits are presented inthe TER (PRC 1996).
4.3 Demonstration Results andConclusions
This section presents the operating conditions, systemmaintenance, results and discussion, data quality, andconclusions of the SITE demonstration of the ZENONtechnology. The demonstration results have beensupplemented by information provided by ZENON onother tests involving the technology.
4.3.1 Operating Conditions andParameters
This section summarizes the operating conditions andparameters for the system during the 5-day SITEdemonstration. During the demonstration, thepervaporation system was operated at conditionsdetermined by ZENON and EPA. To document thesystem’s operating conditions, untreated and treatedgroundwater, along with vapor released from the vacuumvent were monitored and sampled. The system operated 8hours per day for 4 days, and about 4 hours on the a fifthday. It was allowed to run for about 0.5 hour before thefirst sampling of a particular run to allow all componentsto reach normal operating temperatures. All samples wereshipped to the laboratory the same day they were collected.Untreated water flow rates through the system were variedfrom 2.10 to 11.23 gpm. Weather conditions during thesampling days were consistently clear with an averagetemperature of about 68 °F. Wind speed usually increasedduring the afternoons to about 10 miles per hour. After thefirst 2 days, sampling was delayed for 3 days due to severeweather at the work site, which did not allow the boiler toremain ignited.
45
The pervaporation system was continually monitored byZENON, and samples of untreated and treatedgroundwater, along with vented vapor, were collected toevaluate the system’s performance. The system operatingparameters monitored by the developer included heatexchanger temperature, module pressure, and groundwaterflow rates. VOC removal from the treated groundwaterwas monitored with the on-site GC to maintain systemefficiency.
4.3.2 System Maintenance
During the time spent at NASNI, ZENON performedfrequent chemical washings of the system to alleviatescale buildup on the pervaporation module membranes. Asodium metabisulfite solution was used to remove ironbuildup resulting from materials released from the bulktanks. High concentrations of calcium bicarbonate in thegroundwater led to calcium scaling on the membranes.This required frequent washings with a phosphoric acidsolution. During demonstration sampling, a phosphoricacid washing was performed on the system after 3 days ofoperation. Depending on the groundwater or processwater treated in future applications, frequent acidwashings of the membranes may be necessary to allowefficient removal of VOCs.
Biological buildup accumulated on system componentsduring downtime from early December to late January.This was alleviated with a sodium metabisulfite wash. Forfuture field applications, before a prolonged downtime thesystem may be subjected to a sodium metabisulfite wash toprevent biological buildup.
ZENON claims that a typical full-scale pervaporationsystem would require maintenance once every 1 or 2weeks. Maintenance requirements would mainly dependon the groundwater’s potential to foul and scale themembranes and other components of the system. Othercomponents, such as pumps, motors, and valves, typicallywould be checked two to four times per year, depending ona particular component’s service requirements.
While under a vacuum, the condensate pump operated atirregular intervals and could not be relied on to properlyremove permeate from a holding reservoir to storage.While operating at normal atmospheric conditions, thepump operated correctly. This malfunction required theZENON on-site operator to manually control the pump
during the demonstration. Because of the highconcentrations of TCE in the groundwater, seals of thecondensate pump degraded and failed prematurely,requiring frequent replacement by the developer. Theseals were replaced three times during the five days ofdemonstration runs. For a long-term field applicationinvolving high concentrations of TCE, seals composed ofa material able to withstand the TCE would be required toalleviate shutting down the system every few days.
4.3.3 Results and Discussion
This section presents the results of the SITE demonstrationof the ZENON technology. The results are presented byproject objective and have been interpreted in relation toeach objective. The specific primary and secondaryobjectives are shown at the top of each section in italicsfollowed by a discussion of the objective-specific results.Data quality and conclusions based on these results arepresented in Subsections 4.3.4 and 4.3.5. Appendix Apresents analytical data generated during the demonstration.
Primary Objectives
Primary objectives were considered critical for evaluatingthe ZENON pervaporation technology. Two primaryobjectives were selected for the SITE demonstration, andbecause of similarities, are discussed together.
P1) Determine if the ZENON technology can removeTCE from groundwater to below the federal MCL atvarying flow rates, at the 95 percent confidence level.
P2) Determine the removal efficiency of the system forTCE.
During the demonstration, TCE was present in varyingconcentrations in all four wells used to supplygroundwater to the pervaporation system. As noted, TCEinfluent concentrations were varied by altering the flowrates into the system from the selected wells.Demonstration objectives were achieved by collectingsamples of untreated and treated groundwater over four 8-hour and one four-hour sampling runs. Flow rates of thesystem ranged from about 2 to 11 gpm, and influent TCEconcentrations ranged from 33 to 240 mg/L. As noted, the

46
demonstration was scheduled for seven sampling runs;however, sampling ended after 4 hours into the fifth runbecause of a corroded stainless steel tube on thepervaporation module.
Analysis of groundwater for TCE was performed by EPAMethod 8260 (EPA 1987). Analytical results from thedemonstration indicate that the ZENON technology, whenoperating at optimum conditions, effectively removedTCE from the groundwater at NASNI Site 9. Analyticalresults for TCE in untreated and treated water are shown inTable 4-4. Removal efficiencies for TCE averaged 97.3percent. Sixteen of 18 comparisons of treated watersamples to untreated samples showed average TCEremoval efficiencies of 99.3 percent. The highest levels ofcontaminant removal expressed as a percentage wereachieved during the fourth run, when the system operatedat a flow rate of about 5.5 gpm with an influentconcentration of about 230 mg/L of TCE. Removalefficiencies were lowest during the first run, when thesystem operated at about 2.1 gpm with an influentconcentration of about 40 mg/L of TCE. Generally, thedata indicate that treatment efficiency increased slightlyafter the first run, which could be attributed to minoradjustments made to the system by ZENON. However,during the fourth run, treatment efficiency dropped due tothe high volume of groundwater processed by thetechnology.
Although the system significantly reduced TCEconcentrations in the groundwater to an average of 1.49mg/L (1,490 µg/L), the federal MCL of 5 µg/L was notachieved. The lowest concentration achieved during thedemonstration occurred during the second run, when thesystem was operating at about 5.2 gpm with a TCE influentconcentration of 44 mg/L. This effluent sample was takenafter operating the system for about 2.5 hours, andindicated that TCE was reduced to 0.09 mg/L(99.8 percent removal).
Because all comparisons of TCE concentrations inuntreated water to treated water were above the MCL, itwas not necessary to calculate the upper confidence level.
A mass balance was calculated for the demonstration datausing TCE contaminant concentrations for untreatedgroundwater, treated groundwater and vapor (see Table 4-5). The following equation (4-1) was used for thecalculation of water and vapor contaminant loads:
Flow Rate x Time x TCE Concentration x ConversionFactor = Contaminant Load per Sampling Run (4-1)
No analysis was performed on permeate generated by thesystem because of the high concentrations of TCEexpected compared to the untreated and treated water.Permeate TCE concentrations were estimated based onanalysis of untreated and treated water and vapor. TCElosses could have occurred from other portions of thesystem (valves, connectors, and piping).
When expressed as a percentage of total TCE load into thesystem, treated groundwater from the system averagedabout 2.6 percent TCE. For the second, third, and fourthruns, TCE load to treated water averaged 0.6 percent. Asdetailed in Table 4-5, the system was most efficient inremoving TCE from the groundwater during these threesampling runs. The highest release to treated wateroccurred during the first run and was 9.7 percent. Thisfigure corresponds to the poorest TCE removal efficiencyobtained during the demonstration.
Secondary Objectives
Secondary objectives provided additional information thatwas useful, but not critical for the evaluation of theZENON technology. Eight secondary objectives wereselected for the SITE demonstration. The results of eachsecondary objective are discussed in the followingsubsections.
S1) Assess the pervaporation system’s ability toremove nontarget VOCs, SVOCs, and TRPH fromcontaminated groundwater
Concentrations and removal percentages for VOCs otherthan TCE in groundwater at Site 9 varied considerably,and are presented in tabular format in the TER. Thefollowing VOCs other than TCE were detected in Site 9groundwater during the demonstration:
• vinyl chloride• 4-methyl-2-pentanone• 2-butanone• methylene chloride• 1,1,-dichloroethene• toluene• cis-1,2-dichloroethene
As expected, concentrations of particular contaminants in
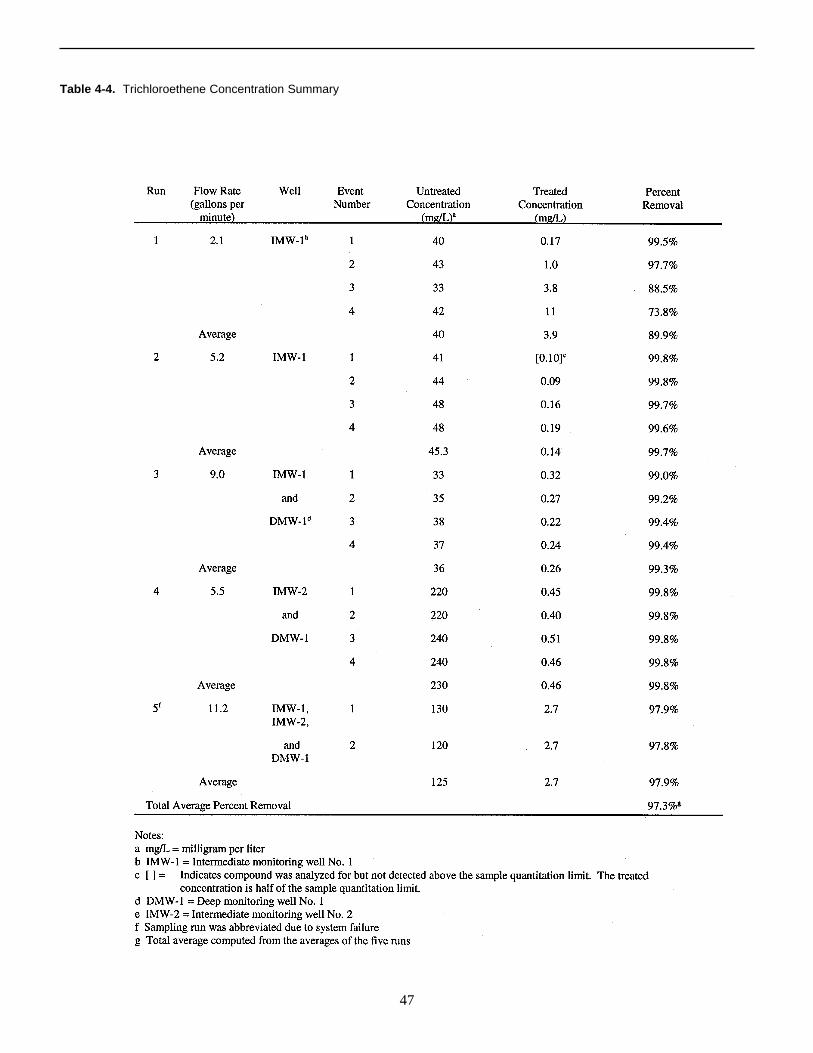
47
Table 4-4. Trichloroethene Concentration Summary

48
Table 4-5. Mass Balance Figures

49
untreated groundwater changed based on the wellconfigurations used for each run. For instance, methylenechloride and 1,1-dichloroethene were not detected untilmonitoring well IMW-2 was used, which occurred duringthe fourth and fifth runs. During the demonstration, theZENON system removed vinyl chloride, 1,1-dichloroethene, toluene, and cis-1,2-dichloroethene at anaverage above 90 percent. The highest average removalrate for a VOC other than TCE was that for toluene at 94.3percent. The highest removal for toluene occurred duringthe second run where the removal rate averaged 97.8percent while the system operated at about 5.18 gpm. Thelowest average removal rate for toluene was during thefirst run where removal averaged 84.3 percent while theflow rate was at about 2.12 gpm. As noted above, the dataindicate that treatment efficiency increased slightly afterthe first run, which could be attributed to minoradjustments made to the system by ZENON.
Detected VOCs removed at less than 90 percent included4-methyl-2-pentanone (49.1 percent), 2-butanone (18.2percent), and methylene chloride (80.6 percent). It shouldbe noted that 2-butanone is fairly soluble in water and hasa low Henry’s Law constant, thus making it similar to anSVOC and difficult to remove by pervaporation. Thesecompounds tend to remain in the aqueous phase after theinfluent is heated, and are thus not removed through themembrane.
Vinyl chloride was present in untreated groundwater at anaverage of 12.9 mg/L over the five sampling runs.Although it has a low Henry’s Law constant, it wasremoved by the ZENON technology at an average of 99.7percent, to 0.29 mg/L. The highest concentration of vinylchloride was detected at 120 mg/L in the fourth sample ofthe first run. The vinyl chloride concentration in thecorresponding treated sample was not detected above themethod detection limit of 250 µg/L, for greater than 99.9percent removal.
Removal of VOCs generally was best when the systemoperated at lower flow rates (2.1 to 5.2 gpm), allowinggreater retention time for groundwater passing through thepervaporation modules. Elevated VOC concentrationsappeared to have little effect on the treatment capability ofthe unit, as seen from the TCE analytical results.Analytical results for other VOCs is less conclusive. Itappears that variations in concentrations of VOCs, acrossthe concentration levels found in Site 9 groundwater, haslittle effect on the treatment capability of the technology.
SVOCs
As expected, SVOC removal efficiencies were muchlower than those for VOCs. SVOCs detected in Site 9groundwater during the demonstration included thefollowing:
• phenol• 2-methylphenol• 4-methylphenol• 2,4-dimethylphenol• 4-chloro-3-methylphenol• bis (2-ethylhexyl) phthalate
SVOC concentrations in groundwater at Site 9 proved tobe consistently lower than those for detected VOCs. Thehighest concentrations of SVOCs were for 4-methylphenol,averaging 7.4 mg/L. The highest influent concentrationfor this compound, which was the highest concentration ofa single SVOC during the demonstration, was during thefirst run at 19.3 mg/L. Because of the lower influentconcentrations, percent removals for SVOCs appear muchless dramatic than those for VOCs.
Removal rates for detected SVOCs ranged from a high of64.9 percent for bis(2-ethyhexyl) phthalate to a low of 7.4percent for 4-methylphenol. As with VOCs, treatmentefficiency generally decreased as groundwater flowthrough the system increased. For instance, with anaverage influent concentration of 5.9 mg/L, the averageremoval efficiency of phenol during the first run (averageof 2.1 gpm) was 17.7 percent. During the third run (flowrate of 9 gpm), with an average influent concentration of6.5 mg/L, the average removal percentage was 3.5 percent.
TRPH
The removal efficiency of TRPH was monitored duringthe demonstration because of the variety of contaminantsknown to be present at Site 9, and because of previoussuccess of the pervaporation system at removing thesematerials from contaminated groundwater. Four untreatedand four treated water samples were collected during eachrun and analyzed for TRPH. Analytical data are presentedin the TER.
Average TRPH removal during the demonstration was68.5 percent; however, the true removal efficiency of thetechnology may have been higher because about half of the

50
analytical results for treated groundwater were below thelaboratory’s lower analytical detection limit of 0.3 mg/L.This value was used in calculating removal for these runs.The highest TRPH removal rate occurred during the thirdrun (flow rate of 9 gpm) at an average efficiency of 80.5percent. The lowest average removal rate occurred duringthe fifth run (flow rate of 11.2 gpm) at 56.7 percent.Because both the highest and lowest removal efficienciesoccurred when groundwater flow rates were high, nocorrelation between removal of TRPH and flow rate can bedrawn. The highest average concentration of TRPH inuntreated groundwater was 3.18 mg/L occurring in thesecond run. The removal efficiency during this roundaveraged 60.4 percent.
S2) Monitor the volume of recovered liquid permeategenerated during each run
After exiting the pervaporation module of the ZENONsystem, VOCs are condensed to the liquid phase,producing permeate. The permeate generally separatesinto aqueous and organic phases. The aqueous phase canbe sent back to the pervaporation unit for retreatment,while the organic phase can either be disposed of or sentoff site for further processing to recover the organics.
During the demonstration, the amount of permeategenerated by the system during each run was determinedby the developer and provided to the SITE team. Much ofthe aqueous phase permeate generated during thedemonstration would normally have been returned to thesystem. However, problems involving the seals andpumping controls of the condensate pump did not alwaysallow aqueous phase permeate to be returned to the systemfor retreatment, and some was discharged with the organicphase permeate to a holding drum, along with a higher thennormal volume of water. Because of the failure of thecondensate pump, the amount of organic phase permeategenerated by a typical ZENON system could only beestimated. Table 4-6 displays the amount of organic phasepermeate generated per run in relation to the flow rate andTCE concentrations in untreated groundwater. Thesystem generated an average of about 2.9 gallons ofpermeate per hour, equaling 23 gallons per 8-hour run.The average amount of untreated groundwater passedthrough the system was 441 gallons per hour (gph) (about3,525 gallons per 8-hour run).
The mass balance calculation was used to determine TCEcontaminant loads in concentrated permeate. Becauseflow rates and contaminant concentrations were not
available for permeate, the following equation (4-2) wasused to provide a permeate figure:
Untreated Groundwater - Treated Groundwater -TCE Load TCE Load
Vapor TCE = Permeate TCE Load (4-2)Load
TCE concentrations in permeate, when expressed as apercentage of total TCE load into the system, averaged73.7 percent. TCE permeate load was highest during thesecond and fourth sampling runs, averaging 89.6 percentof the total TCE contaminant load. The lowest percentageof TCE load was occurred during the first run and was 41.1percent.
Variations in flow rates, influent contaminantconcentrations, or TCE treatment efficiency, appeared tohave no effect on the amount of permeate generated duringthe demonstration. When the condensate pump isoperating correctly, the amount of organic phase permeategenerated by a typical ZENON pervaporation systemshould be lower than the amount generated during thedemonstration. Also, total organic phase permeategeneration should rise with elevated influent contaminantconcentrations.
S3) Measure VOC vapor vented from the pervaporationsystem
Samples of vapor from the vacuum vent of the ZENONpervaporation technology were collected directly from thevent (S3) and after the vapor passed through a 55-galloncarbon canister (S4). Samples from S3 allowed thedetermination of the amount of VOCs removed fromuntreated groundwater but not captured by the condensingprocess. As noted in Section 4.2.4, samples from S4 werecollected to determine if VOCs were released to theatmosphere. Sampling point S4, which was between thetwo carbon filters, provided a verification that all VOCsnot condensed in the ZENON system were captured by thefirst carbon filter. Sampling point S4 was not intended toprovide data on releases of VOCs from the vacuum vent ofthe ZENON system – data from S4 was only intended toverify that VOCs were not released to the outside air.Therefore, the data for sampling point S4 is not includedwith this document.
Two samples from each location were collected duringeach run, except for the fifth run when only one sample

51
was collected. All samples were analyzed for VOCs byMethod TO-14.
Analytical results for TCE from vapor vented from thesystem (sampling point S3) are shown in Table 4-7. TCEconcentrations in the vented vapor ranged from 14,000milligrams per cubic meter (mg/m3), which occurredduring the second run, to 110,000 mg/m3 during the fourthand fifth runs. The rise in discharges of TCE vapor fromthe vacuum vent of the system correspond to higherconcentrations of TCE in the untreated groundwater.When considered as a percentage of contaminant load,releases from the vacuum vent were inconsistent, rangingfrom 10.3 to 49.2 percent. The mass balance calculationwas used to provide the percentage of TCE contaminantload released from the vacuum vent. Vapor releasevelocity (supplied by ZENON) from the vacuum vent wasused for the flow rate of equation 4-1. When thegroundwater flow rate through the system was near 5 gpm,the vapor flow rate was at about 0.30 cubic meters per hour(m3/hr); when the groundwater flow rate was near 9 gpm,the vapor flow rate was about 0.55 m3/hr. The averagerelease of TCE from the vacuum vent as a percentage oftotal TCE entering the system was 21.9 percent. Thelowest, 0.9 percent, occurred during the second run, whengroundwater flow through the system was 5.2 gpm. Thehighest TCE release from the vacuum vent whenexpressed as a percentage of total TCE was 49.2 percent,
during the first run.
For a few other VOCs, higher concentrations in untreatedwater provided higher concentrations of VOCs releasedfrom the vacuum vent. For instance, the second and fourthruns were conducted with varying concentrations atsimilar flow rates. During the second run, cis-1,2-dichloroethene was detected at 62.8 mg/L in untreatedgroundwater, and releases of this compound from thevacuum vent averaged 32,000 mg/m3. During the fourthrun, cis-1,2-dichloroethene was detected at 5.9 mg/L,while its concentration in vented vapor was 9,000 mg/m3.This general reduction of VOCs in vacuum vapor withlower influent concentrations also applied to 4-methyl-2-pentanone.
For the remaining VOCs detected during the demonstration,no clear removal characteristics could be gathered. Forinstance, during the second run 2-butanone was detected inuntreated groundwater at 93.8 mg/L, and releases of thiscompound from the vacuum vent averaged 6,500 mg/m3.During the fourth run, 2-butanone was detected at 108 mg/L, while concentrations of this compound in vented vaporaveraged 3,040 mg/m3.
Because some other compounds were not detected duringeach run, the analytical data available does not provide
Table 4-6. Estimated Permeate Generation

52
significant information to allow a definite conclusionconcerning VOCs other than TCE released with vacuumvapor in relation to concentrations of VOCs in the influentand changes in flow rates through the system. As noted,the monitoring wells used during the demonstration werevaried to provide varying concentrations of TCE.
S4) Determine requirements for anti-scaling additions,and monitor the potential of the system, by identifyingreductions in TSS, and concentrations of carbonate,fluoride, sulfate, silica, strontium, calcium, barium,magnesium, and iron in treated and untreated water
To identify significant removal or scaling of materialsfrom the groundwater at Site 9, samples of untreated andtreated groundwater were collected during runs one, three,and five, and analyzed for the above-listed materials. Datafor these analyses are presented in the TER. As detailed inprevious sections, scaling of the pervaporation modulemembranes reduced the system’s ability to correctlyfunction.
In comparing untreated to treated groundwater samples,no significant reductions in any of the materials werenoted, except in TSS. Untreated groundwater samples
collected during the first run contained 12.4 mg/L TSS,and the corresponding treated sampled contained TSS at aconcentration below the method detection limit of 4.0 mg/L. During the fifth run, untreated groundwater containedTSS at 3.67 mg/L, and the corresponding treated samplewas again below the detection limit of 4.0 mg/L. Nocorrelation could be made between changes in analyticalresults for the above-listed materials and scaling buildupon the pervaporation membranes.
ZENON attributed the scaling problems during thedemonstration to the deposition of magnesium andcalcium bicarbonate ions, which precipitated out of thegroundwater as it was heated. Magnesium concentrationsin the Site 9 groundwater averaged 468 mg/L, whilecalcium concentrations averaged about 201 mg/L. Tocounter this deposition, ZENON used two additivessimilar to zinc phosphate. These materials were steadilyadded to the untreated groundwater at from 5 to 20 mg/Land served to change the chemistry of the ions thatprevented their precipitation at the system operatingtemperatures used during the demonstration. After theadditive feed system was operating, scaling problemsdecreased substantially. According to ZENON, both ofthe additives performed well at lower temperatures,
Table 4-7. TCE Concentrations in Vented Vapor

53
though the second worked best at higher temperatures(ZENON 1996). Because the technology was operated foronly a limited time period, long-term effects of scalingcould not be assessed during the demonstration.
ZENON considered the groundwater conditions at NASNISite 9 to be atypical of most aquifers, presenting a worst-case scenario. Contaminants found in groundwater orwastewater at separate sites can vary tremendously.Therefore, if scaling is a problem, additives used to controlit may vary. Companies manufacturing anti-scalentmaterials can analyze a sample of the expected influentand determine the anti-scalent material best suited for thatparticular application. A determination of this sort wouldalways be made on a site-by-site basis.
S5) Determine if the technology’s efficiency inremoving VOCs, SVOCs, and TRPH is reduced after a3-week period, and if scaling occurs after a 3-week perioddue to the precipitation of the analytes listed undersecondary objective S4.
Before demonstration sampling began, the SITE teamelected not to run the system for 3 weeks and then resamplebecause (1) component failures caused continualtreatment difficulties with the pervaporation system and(2) cost concerns had arisen due to project delays.
At the start of sampling, the demonstration team wasconcerned that the technology would not operate for 3 fullweeks. Problems ranging from temperature regulationdifficulties to premature failure of seals on various pumpsinterfered with the treatment efficiency of the ZENONtechnology. Scaling of the pervaporation membranesproved to be a continuous problem that required frequentacid washings of the technology until an adequate anti-scaling additive was provided. According to ZENONrepresentatives, the company had a set budget to performthe demonstration at NASNI, and as difficulties continued,which required much more time in the field than wasexpected, budget problems became a concern. Withoutany of the above-listed problems, this objective could nothave been accomplished because of the failure of thestainless tube on the pervaporation module, which endeddemonstration sampling 4 hours into the fifth run.
As discussed in the results of Secondary Objective S4,scaling potential must be assessed on a site-by- site basis.After a proper anti-scaling additive is selected, frequentmonitoring of the performance of the technology is
necessary, especially during the initial period of atreatment job, to determine the necessity for acid washingsof the system. Once additional determinations have beenmade for monitoring requirements, a schedule of routinemaintenance involving washings can then be established.
S6) Determine the physical effects the ZENONtechnology has on treated groundwater
Samples of untreated and treated groundwater werecollected three times per run, and measurements oftemperature, pH, and conductivity were collected with amultitesting meter. The main purpose of this samplingwas to identify physical changes caused by heat from thepervaporation system or from additions of anti-scalingchemicals.
The average change in temperature between untreatedgroundwater (before entering the system) and treatedgroundwater (discharged groundwater) was 4.0 °C. Thegreatest daily average change in temperature was 11.7 °Cand occurred during the first run. During this run, waterwas passed through the system at 2.10 to 2.15 gpm, theslowest of the demonstration. The higher averagetemperature change can be attributed to the higherretention time of the groundwater in the system.Groundwater pH increased an average of 0.56 during thedemonstration. A change of 0.90, the highest of thedemonstration, occurred during the second run. Thechange in conductivity of treated groundwater comparedto untreated groundwater was negligible. Data tablescontaining this information are provided in the TER.
S7) Document the operating conditions of the ZENONtechnology
The particulate and scaling problems that delayed the startof the demonstration caused problems with manycomponents of the system, including sight glasses, valves,and several component surfaces. This complicated themonitoring of operating conditions of the system, andcaused difficulty in keeping all parameters withinspecified control limits. The various parameters recordedin the field, such as flow rates, temperature, and pressureare probably imprecise (due to varying interference). Noindependent measurements are available to verify theseresults. Therefore, data gathered for these parametersshould be used qualitatively. Data in this section wereprovided by ZENON (ZENON 1995).

54
Average daily values for the temperature of water enteringand exiting the pervaporation unit is presented underSecondary Objective S6; flow rates for the demonstrationare presented Table 4-5. Permeate was discharged fromthe unit in bulk, so flow rates for permeate do not apply.Values for feed pressure, vacuum, and chilled watertemperature were provided by ZENON and are presentedin the TER.
The highest feed pressure of water entering thepervaporation module during the demonstration occurredduring the fifth run at 10.9 pounds per square inch (psi);the lowest was during the second run and was 5.1 psi. Forwater exiting the module, the highest feed pressure wasduring the fifth run at 7.4 psi; the lowest was during thefirst run at 2.3 psi.
The pervaporation module is subjected to a vacuum thatremoves organics in the vapor phase. During thedemonstration, the vacuum on the module averaged 0.50psi. The vacuum was highest during the fifth run andaveraged 0.72 psi-absolute (psia). It was lowest during thethird run and averaged 0.40 psia. The vacuum during thefirst, second, and third runs were all near 0.41 psia.
The temperature of water entering the system from thechiller averaged 4 °C; the temperature of water returningto the chiller from the system varied between 4 °C and 5°C.
S8) Estimate the capital and operating costs oftreating contaminated groundwater at Site 9 with ZENONpervaporation systems identical to that used for thedemonstration
This objective was achieved by using capital costinformation provided by the developer, measuringelectricity consumption, and estimating labor requirements.A detailed estimate of the capital and operating costs ofconstructing a single treatment unit to remediategroundwater contaminated with TCE is presented inSection 3.0. Cost have been placed in 12 categoriesapplicable to typical cleanup activities at RCRA sites andinclude fixed and annual variable costs. Operatingconditions consist of treating the groundwater at 8 gpm fora period of 15 years. Total fixed costs are $189,500.Equipment costs comprise 79 percent of the total fixedcosts. Total annual variable costs are $118,100. Utilitycosts comprise 47 percent of the variable costs, andresidual waste handling services comprise 28 percent.
After operating for 15 years, the total cost of thegroundwater remediation scenario presented in thisanalysis is $1,961,000. Annual costs were not adjusted forinflation. A total of 63 million gallons of groundwaterwould be treated over this time period. The total cost per1,000 gallons treated is $31, or roughly 3 cents per gallon.
Based on the performance of the technology during thedemonstration at NASNI, a strong potential exists for atypical application to experience down-time frommechanical problems, including scaling difficulties, seal,pump, and valve failures, along with unknown difficultiesthat may be caused by extreme changes in weatherconditions (temperatures). Problems such as these over anextended period of time could increase treatment costssubstantially.
4.3.4 Data Quality
A data quality assessment was conducted to incorporatethe analytical data validation results with the field QCresults, evaluate the impact of all QC measures on theoverall data quality, and remove all unusable values fromthe investigation data set. The results of this assessmentwere used to produce the known, defensible informationemployed to define the investigation findings and drawconclusions. The QA objectives for this project wereestablished in the QAPP.
A data validation review of the analytical data forgroundwater and air samples collected during the ZENONSITE demonstration was conducted to ensure that alllaboratory data generated and processed are scientificallyvalid, defensible, and comparable. Data validation wasconducted using both field QC samples and laboratory QCanalyses. The field samples included field blanks and tripblanks. Laboratory samples included method blanks,surrogate recoveries, initial and continuing calibration,and MS/MSD results. Results from these samples wereused to calculate the precision, accuracy, representativeness,comparability, and completeness of the data. In general,all data quality indicators met the QA objectives specifiedin the QAPP, indicating that general data quality was goodand that the sample data are useable as reported.Conformance with data quality objectives for the criticaland non critical parameters, along with conformance withfield QA/QC procedures, calibration requirements, andinternal QC procedures, is discussed below.

55
Critical Parameter
The one critical parameter was the TCE concentrations inuntreated and treated groundwater. All QA objectives forTCE in groundwater were met except the TRL. Mostsamples were diluted ten-fold or more because ofconcentrations of TCE and other VOCs that exceeded thecalibration range for an undiluted sample, so the samplereporting levels in the data tables are generallycorrespondingly higher than the TRL. However, becausethe ZENON technology was not capable of reducing TCEto concentrations approaching the requirements ofPrimary Objective P1 (reduce TCE to below an MCL of 5µg/L), the TRL was not a factor.
Noncritical Parameters
The noncritical parameters include VOCs other than TCE,SVOC, various inorganic parameters (metals, fluoride,silica, sulfate, pH), and some collective parameters (totalpetroleum hydrocarbons, alkalinity, total suspendedsolids, conductivity). Most of the QA objectives for theseparameters were met.
Since TCE was analyzed by Method 8260, a number ofother VOC could be determined simultaneously. One ofthe precision objectives for these noncritical parameterswas not met. In the MS/MSD analysis of treated waterfrom Day 2, recovery of 2-butanone was 136 percent inboth the MS and MSD samples, slightly about theacceptance criterion of 70 to 130 percent. The 2-butanoneresults in that sample are considered qualified, but are stillusable.
There were greater problems with the SVOC MS/MSDanalyses. In all cases, the phenol results are not usablebecause the spike was much less than the native sampleconcentration. In seven of the eight spiked samples, therewas excessive recovery of 4-chloro-3-methylphenol.There was also excessive recovery of 2-chlorophenol inone untreated water MS/MSD pair and of pyrene in oneuntreated water and one treated water MS/MSD pair. Inaddition, there was a high relative percent difference ofrecoveries of acenaphthene and 4-nitrophenol in onetreated water MS/MSD pair. These results provideevidence of significant matrix interference with the acidicfraction (phenol and its derivatives, benzoic acid, and soon) of the SVOC analysis. This matrix effect is probablyassociated with the sample alkalinity. The acidic fractionresults in all samples should be used with caution.
The laboratory noted that most volatile organic analysis(VOA) vials had a pH exceeding 2 when they were opened.The samplers added a standard amount of hydrochloricacid to preserve each vial. However, the groundwatersamples had very high alkalinity, 1,184 to 1,740milligrams per liter as calcium carbonate. That standardamount of acid was insufficient to neutralize the actualalkalinity of the samples. This would not affect thesamples to a significant extent. The chemicals mostsusceptible to degradation in unpreserved samples are thearomatic hydrocarbons, which are minor constituents ofthese samples, if present at all. The high ionic strengthassociated with the alkalinity is also a reasonably effectivebacterial inhibitor (that is, preservative) which wouldsupplement the effects of the acid. Verifying the pH of apreserved VOC sample is not acceptable because thesample disturbance can cause outgassing and loss of VOCcontent.
All QA objectives for the air samples were met. Theseobjectives included laboratory (method) blanks, laboratoryduplicates, and MS/MSD for each batch of samples, plusholding times and surrogate spikes for each sample.
Conformance With Field QA/QC Procedures
During the demonstration, the sample collection and fieldmeasurement procedures described in Section 4.0 of theQAPP were generally followed. At least one VOC wasfound in at least one of the three blanks (field blanks foruntreated and treated water and trip blank) on each day ofsampling. Acetone was found in eight blanks on threedays at concentrations of 18 to 34 µµg/L. Methylenechloride was found in all three of the Day 4 blanks at 2.4 to3.1 µµg/L. 2-Butanone was found in two of the Day 1blanks at 4.7 and 5.2 µµg/L. Those three chemicals arefrequently found contaminants. In addition, one Day 2blank contained 5.5 µµg/L of chloromethane and one Day3 blank contained 15 µµg/L of 4-methyl-2-pentanone.Therefore, similar concentrations of these compounds areconsidered artifacts and the results flagged as “undetected.”No field blanks contained TCE. The laboratory (method)blanks were free of VOC contamination. These blankanalysis results are within the acceptable range. Theoverall results are not significantly affected.
Conformance With Calibration Requirements
Section 5.0 of the QAPP specifies the calibration

56
procedures and acceptance criteria for the demonstration.The only significant calibration problem was with somecontinuing calibration of the VOC analysis. In thoseinstances, the response factors for acetone and 2-hexanone, two of the well-known poorly responding targetcompounds, exceeded the percent difference criterion.Associated results for those noncritical compounds areconsidered estimates.
Conformance With Internal QC Procedures
Table 7-1 of the QAPP summarizes the internal QC andcorrective action procedures for the demonstration. Noneof the 19 VOC method blanks and five SVOC methodblanks contained any chemicals at or above the reportinglimits. All three BS/BSD and VOC analyses gave resultswithin the specified precision and accuracy limits. AllVOC surrogate recovery results were within theacceptance criteria. Therefore, no corrective actions bythe laboratory were required.
4.3.5 Conclusions
The ZENON cross-flow pervaporation system provides analternative approach to treating organic-contaminatedwater at sites where conventional treatment technologiesare used, such as air stripping or carbon adsorption.
Analytical results from the demonstration indicate that theZENON technology, when operating at optimumconditions, effectively removed TCE from the groundwaterat NASNI Site 9. Removal efficiencies for TCE averaged97.3 percent. Sixteen of 18 comparisons of treated watersamples to untreated samples showed average TCEremoval efficiencies of 99.3 percent. Although the systemsignificantly reduced TCE concentrations in thegroundwater to an average of 1.49 mg/L (1,490 µg/L), thefederal MCL of 5 µg/L was not achieved. Lowering TCEconcentrations to below MCLs may require multiplepasses through the pervaporation module, which canprove impractical when compared to other technologies,such as carbon adsorption. The technology is best suitedfor reducing high concentrations of VOCs to levels thatcan be reduced further and more economically byconventional treatment technologies. The ZENONsystem appeared to remove TCE from groundwater mostefficiently when the groundwater flow rate was just over 5gpm, achieving near 100 percent removal.
The technology proved effective in removing certain
VOCs other than TCE from the Site 9 groundwater,performing best on highly volatile compounds. VOCswith solubilities of greater than 2 percent are generally notsuited for removal by pervaporation. Removalefficiencies for SVOCs detected were 50 percent or less.Because of some data quality flaws, namely VOCpresence in trip blanks and SVOC MS/MSD resultsoutside of QA objectives, the usefulness of the VOC andSVOC results is considered limited. TRPH removal forthe demonstration averaged 68.5 percent and was fairlyconsistent over each sampling run.
Problems involving the seals and pumping controls of thecondensate pump did not always allow aqueous phasepermeate to be returned to the system for retreatment.Because of the failure of these items, the amount ofpermeate generated by a typical pervaporation systemcould only be estimated. ZENON estimated that thesystem at NASNI generated an average of 2.9 gallons ofpermeate per hour, equaling 23 gallons per 8-hour run. Theaverage amount of untreated groundwater passed throughthe system was 441 gph (about 3,525 gallons per 8-hourrun).
TCE contained in vapor discharged from the pervaporationmodule averaged 53,889 mg/m3. As a percentage of thetotal TCE contaminant load, volatilized TCE dischargedfrom the module averaged 21.7 percent. When the influentflow rate was near 5 gpm, TCE vapor releases averaged 0.9percent of the total TCE contaminant load. For highlyvolatile VOCs, the amount of these compounds releasedfrom the module generally appeared to increase in relationto higher concentrations of those particular contaminantsin the untreated groundwater. For VOCs that are lessvolatile, no clear removal similarities could be gathered.
Because of variations in water chemistry, potential scalingof the module membranes should be considered on a site-by-site basis. Treatability studies should be performed ongroundwater or wastewater to be treated to determine ifpervaporation can be applied. If necessary, a proper anti-scaling additive could then be selected. Scaling problemsduring the demonstration at NASNI were due to highconcentrations of magnesium and calcium in thegroundwater at Site 9, and its high salinity. To limitscaling of the membranes, ZENON eventually used ananti-scalent similar to zinc phosphate.
The average temperature of groundwater as it passedthrough the ZENON system was 4.0 °C. Groundwater pH
57
increased an average of 0.56, though changes inconductivity were negligible.
Estimated costs for operating a ZENON system at NASNISite 9 at 8 gallons per minute for a period of 15 years,treating 63 million gallons of groundwater, are $1,961,000. The total cost per $1,000 gallons of treatedgroundwater is $31, or about 3 cents per gallon.

58
The ZENON cross-flow pervaporation technology is amembrane-based process that removes VOCs fromaqueous matrices. The SITE demonstration at NASNIrepresents the first full-scale use of the ZENON cross-flowpervaporation technology. The unit was returned toZENON’s base office in Ontario immediately followingthe demonstration for refurbishing. An application of thetechnology was recently performed at a separate locationin California; however, analytical data and operationalinformation for that application is not available.
A number of bench-scale studies of the technologyinvolving varying types of VOC-contaminated influenthave been performed and can be acquired by contactingZENON at the address provided in Section 1.0. A pilot-scale study of the technology was conducted by EPA inlate 1993 at a former petroleum pumping station inBurlington, Ontario. The pilot-scale test was performed toassess the technology’s ability to remove low levels ofbenzene, toluene, ethylbenzene, and xylene (BETX) incontaminated groundwater. Sampling for the pilot-scaletest was performed over a single 8-hour period.
According to ZENON, pervaporation systems areavailable for immediate implementation, and requireminimal site preparation. Pervaporation is ideally suitedfor applications that require the removal of highconcentrations of VOC contamination to levels whereother, more cost-effective technologies could be used toreduce contamination levels to regulatory standards.Although the demonstration at NASNI dealt strictly withgroundwater, the technology is available for industrialapplications, as well as applications involving surfacewater.
Section 5ZENON Technology Status

59
Evans G. 1990. “Estimating Innovative TechnologyCosts for the SITE program.” Journal of Air and WasteManagement Assessment. Volume 40, Number 7.July
PRC Environmental Management, Inc. (PRC). 1994a.Field Work Plan for the ZENON Environmental, Inc.(ZENON) Cross-Flow Pervaporation Technology,Superfund Innovative Technology Evaluation (SITE)Program, Demonstration at NASNI Site 9, Coronado,CA. September 2.
PRC. 1994b. Health and Safety Plan for theDemonstration of the ZENON Technology, NASNISite 9, Coronado, California. September 8.
PRC. 1994c. ZENON Cross-Flow PervaporationTechnology, SITE Demonstration, Final QualityAssurance Project Plan. October 3.
PRC. 1996a. Telephone Communication. Between PeteZelinskas, PRC, and Gene Weil, Hamilton CountyMunicipal Sewer District Representative. May 30.
PRC. 1996b. Telephone Communication. Between PeteZelinskas, PRC, and Jessica Olson, City ofIndianapolis Water Division Representative. June 4.Representative. May 30.
PRC. 1996c. ZENON Cross-Flow PervaporationTechnology Evaluation Report. May.
Southwest Division Naval Facilities (SWDIV). 1993.RCRA Facility Investigation Report. Prepared byJacobs Engineering Group, Inc. (Jacobs). December22.
SWDIV. 1994. NASNI Technical Memorandum, Site 9,Chemical Waste Disposal Area. Prepared by Jacobs.April.
Section 6References
U.S. Environmental Protection Agency (EPA). 1987.Test Methods for Evaluating Solid Waste, VolumesIA-IC: Laboratory Manual, Physical/ChemicalMethods; and Volume II: Field Manual, Physical/Chemical Methods, SW-846. Third Edition. Office ofSolid Waste and Emergency Response. Washington,D.C.
EPA. 1988a. Compendium of Methods for theDetermination of Toxic Organic Compounds inAmbient Air, Second Edition, Atmospheric Researchand Exposure Assessment Laboratory. Office ofResearch and Development. EPA/600/4-89/017.
EPA. 1988b. Guidance for Conducting RemedialInvestigations and Feasibility Studies under CERCLA.EPA/540/G-89/004. October.
EPA. 1989a. Control of Air Emissions from SuperfundAir Stripping at Superfund Groundwater Sites. Officeof Solid Waste and Emergency Response (OSWER)Directive 9355.0-28. June 15.
EPA. 1989b. CERCLA Compliance with Other LawsManual: Part II. Clean Air Act and OtherEnvironmental Statutes and State Requirements.OSWER. EPA/540/G-89/006. August.
EPA. 1992. Test Methods for Evaluating Solid Waste.Volumes IA-IC: Laboratory Manual, Physical/Chemical Methods; and Volume II: Field Manual,Physical/Chemical Methods, SW-846. Third Edition(revision 2). Office of Solid Waste and EmergencyResponse. Washington, DC.
Means, R.S., Company, Inc. 1995. Means BuildingConstruction Cost Data for 1995. 53rd AnnualEdition.

60
ZENON. 1994. Bench-Scale Pervaporation TreatabilityTesting of Sample from NASNI Site 9. February 1.
ZENON. 1995. Letter Report Providing Monitoring Dataand Other Information from the SITE Demonstrationat NASNI. August 29.
ZENON. 1996. Letter Report to PRC Providing DataConcerning Anti-Scaling Additives. March 28.

61
Appendix AAnalytical Data Tables

62
Table A1. Groundwater Monitoring Well Dataa

63
Table A1. Groundwater Monitoring Well Data (continued)

64
Table A2. Trichloroethene Concentration Summary

65
Table A3. Vinyl Chloride Concentration Summary

66
Table A4. Acetone Concentration Summary

67
Table A5. 4-Methyl-2-Pentanone Concentration Summary
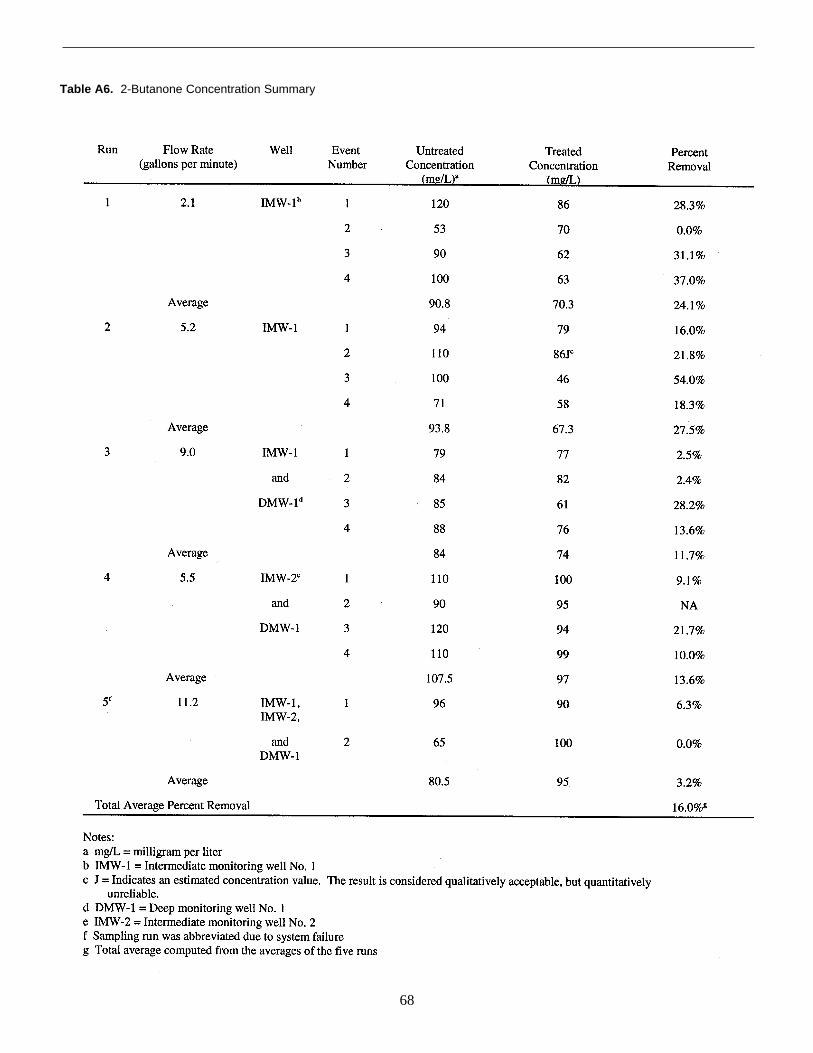
68
Table A6. 2-Butanone Concentration Summary

69
Table A7. Methylene Chloride Concentration Summary

70
Table A8. 1,1-Dichloroethene Concentration Summary

71
Table A9. Toluene Concentration Summary
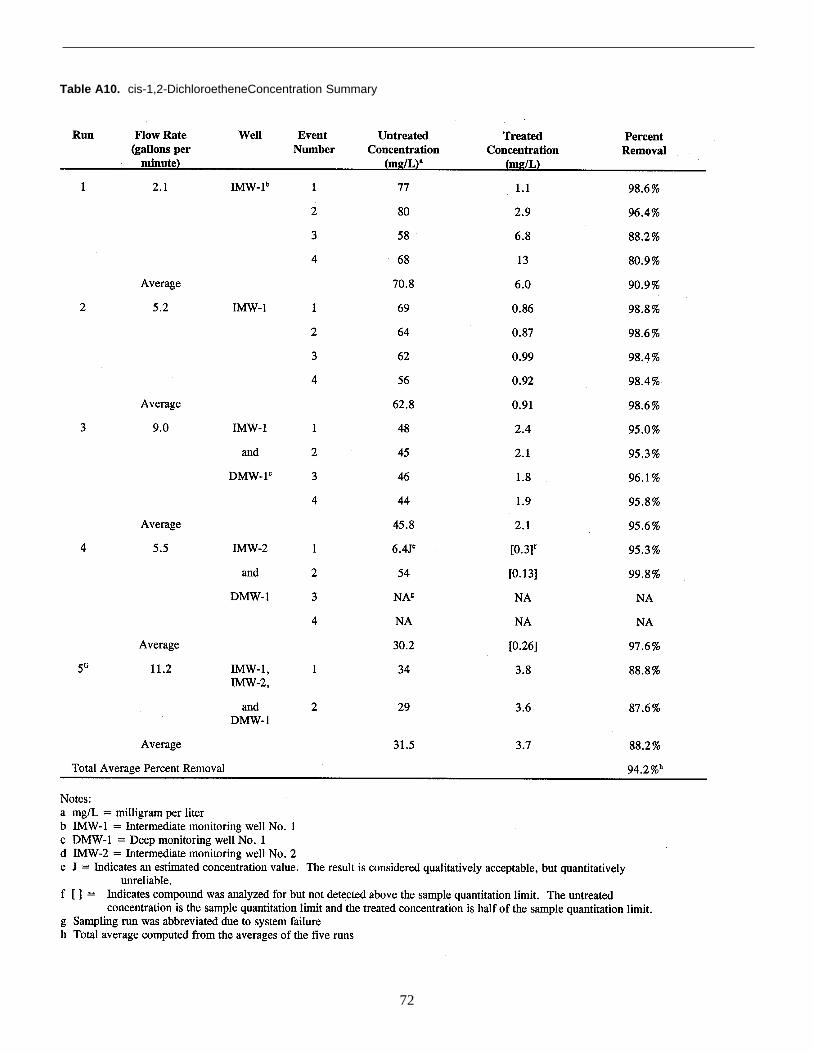
72
Table A10. cis-1,2-DichloroetheneConcentration Summary
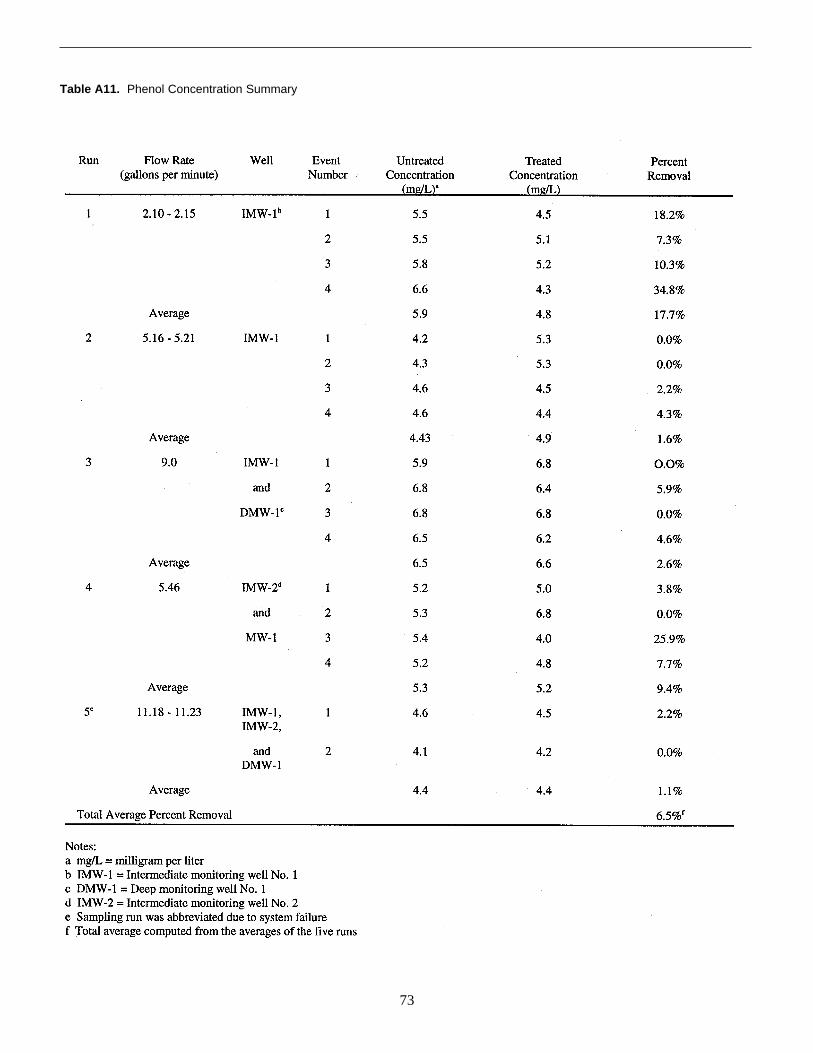
73
Table A11. Phenol Concentration Summary

74
Table A12. 2-Methylphenol Concentration Summary

75
Table A13. 4-Methylphenol Concentration Summary

76
Table A14. 2,4-Dimethylphenol Concentration Summary

77
Table A15. 4-Chloro-3-Methylphenol Concentration Summary

78
Table A16. bis (2-Ethylhexyl) Phthalate Concentration Summary

79
Table A17. Total Recoverable Petroleum Hydrocarbons Concentration Summary
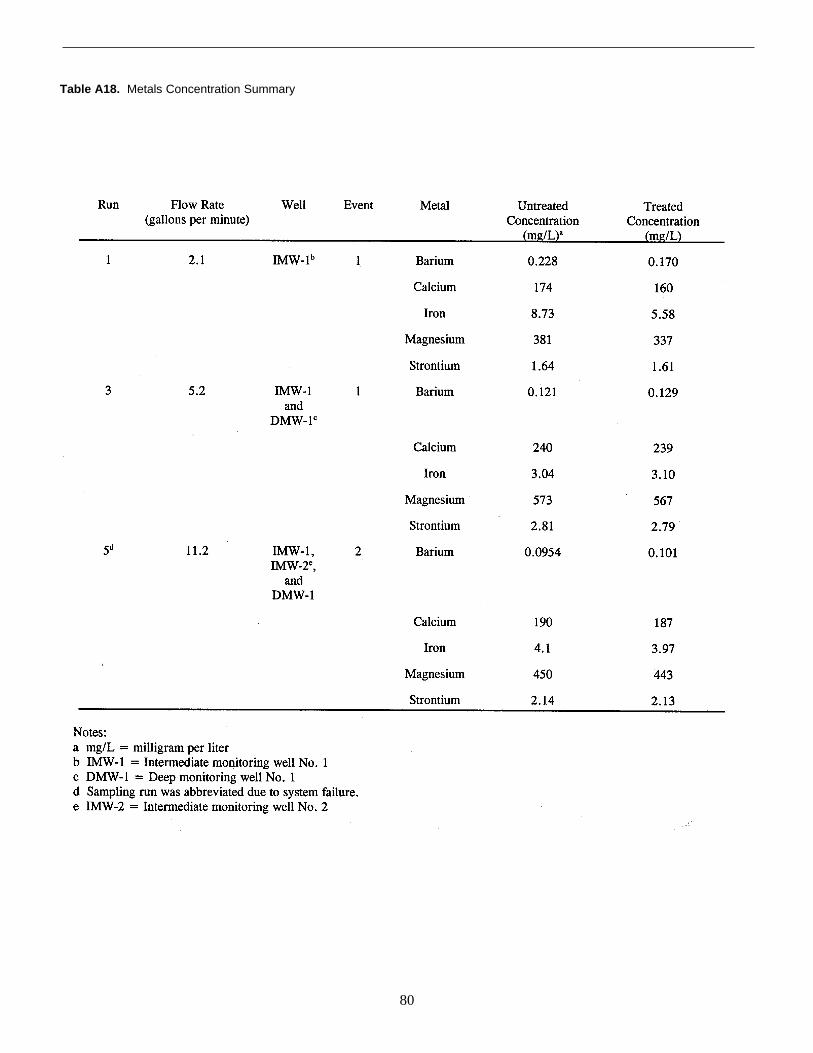
80
Table A18. Metals Concentration Summary

81
Table A19. General Chemistry Concentration Summary

82
Table A20. Trichloroethene Concentrations in Air

83
Table A21. Vinyl Chloride Concentrations in Air

84
Table A22. Acetone Concentrations in Air

85
Table A23. 4-Methyl-2-Pentanone Concentrations in Air

86
Table A24. 2-Butanone Concentrations in Air

87
Table A25. Methylene Chloride Concentrations in Air

88
Table A26. 1,1-Dichloroethene Concentrations in Air

89
Table A27. cis-1,2-Dichloroethene Concentrations in Air

90
Table A28. Carbon Disulfide Concentrations in Air

91
Table A29. Trichlorotrifluoroethane Concentrations in Air

92
Table A30. Aquifer Temperature, pH, Conductivity Summary

93
Table A31. ZENON System Operating Parameters

94
Table A31. ZENON System Operating Parameters (continued)

95
Table A31. ZENON System Operating Parameters (continued)