zenon kulpa 1. introduction the field of diagrammatic data and
TRANSCRIPT

Machine GRAPHICS & VISION vol. 3, nos. 1/2, 1994, pp. 77-103.
DIAGRAMMATIC REPRESENTATION AND REASONING
Zenon KulpaInstitute of Fundamental Technological Research, Polish Academy of Sciences,
00-049 Warsaw, PolandE-mail: zkulpa@ ippt.gov.pl
URL: http://www.ippt.gov.pl/~zkulpa
Abstract. The rapidly developing field of diagrammatic knowledge representation and reasoning issurveyed. The origins and rationale of the field, basic principles and methodologies, as well as selectedapplications are discussed. Closely related areas, like visual languages, data presentation, andvisualization are briefly introduced as well. Basic sources of material for further study are indicated.
Key words: diagrammatic representation, diagrammatic reasoning, visual languages, diagrams,visual programming, data presentation, visualization, knowledge representation, computer graphics,qualitative physics, geometry theorem proving.
1. Introduction
The field of diagrammatic data and knowledge representation and diagrammaticreasoning has recently become one of the most rapidly growing areas of researchin artificial intelligence and related fields of computer science and cognitivescience. It should not be surprising, since visual representation and thinking werefor long considered to be a widespread and effective mode of human thinking andproblem solving [2, 7, 8, 10, 12, 14]. What is more surprising is that it has growninto a respectable part of mainstream AI research so late [41].
The diagrammatic (visual) representation uses diagrams to represent data andknowledge, and diagrammatic reasoning uses direct manipulation and inspectionof a diagram as primary means of inference. Diagrams are a kind of analogical (ordirect) knowledge representation mechanism that is characterized by a parallel(though not necessarily isomorphic) correspondence between the structure of therepresentation and the structure of the represented. E.g., relative positions anddistances of certain marks on a map are in direct correspondence to relativepositions and distances of the cities they represent, whereas in a propositionalrepresentation, its parts or relationships between them need not correspondexplicitly to any parts and relations within the thing denoted. The analogicalrepresentation can be said to model or depict the thing represented, whereas thepropositional representation rather describes it. A similar distinction can be made

2 Diagrammatic representation and reasoning
Machine GRAPHICS & VISION vol. 3, nos. 1/2, 1994, pp. 77-103.
regarding the method of retrieving information from the representation. Theneeded information can usually be simply observed (or measured) in the diagram,whereas it must be inferred from the descriptions of the facts and axioms com-prising the propositional representation. Of course, in practice we are rarely con-fronted with pure cases, and the diagrammatic representation research recognizesthe fact, postulating hybrid representation schemes [3, 4, 11, 54, 71, 73].
It should be added that analogical representations, including diagrams, do notprovide any exceptional means for representing information that cannot be repre-sented in other ways, e.g., by propositional schemes (say, logical formulas). Theyusually represent the same information, only differently organized—in the wayfacilitating its use for certain tasks (e.g., for reasoning). The main advantages ofdiagrammatic representations can be summarized as follows:
– They permit explicit representation and direct retrieval of information (espe-cially structural and spatial relations) that can be represented only implicitlyin other types of representations and then has to be computed (or inferred),sometimes at great cost, to make it explicit for use.
– They permit effective control of the reasoning process, facilitating search bothin data and solution spaces, as it may be guided by explicit proximity or adja-cency relations between appropriate entities on the diagram.
– The reasoning process and its results are more natural and understandable tohumans (especially important in current man-machine interactive systems).
Moreover, as recent research has shown, it is quite possible to formalize diagram-matic reasoning so as to make it no less precise and formal than logical reasoning[54, 70, 71, 74].
Knowledge representation and reasoning schemes originating in logic (specifi-cally, predicate calculus), called propositional [8, 10, 13] were for long predomi-nant in AI, as opposed to analogical schemes [8, 10, 14] including diagrammaticrepresentations. This was only partially due to limitations of early computers andsoftware in handling visual (or graphical) data. Possibly even more importantcause was that most of the researchers in computer science and AI were (and stillare) of mathematical background. And mathematics has been generally ruled byan implicit dogma stating that propositional reasoning using logic is the ultimatetool of precise and formal thinking. Many mathematicians, especially logicians(but even researchers in geometry!), tend to use diagrams rarely, sometimes asheuristics to prompt certain trains of inference, but mostly only as informal aidsto understanding for uninitiated. On occasion, some of them explicitly stated thatthe diagram has no proper place in the proof as such.

Zenon Kulpa 3
Machine GRAPHICS & VISION vol. 3, nos. 1/2, 1994, pp. 77-103.
This state of affairs seems to change now. The number of important papers ondiagrammatic representations and reasoning grows rapidly. Scientific journalsand conferences are launched. The field undergoes broadening and diversificationinto a variety of specialized subfields. This survey is intended as a generalintroduction to this field of research. It covers the origins and rationale of thefield, its basic principles and methodologies, as well as introduces briefly itsselected applications. It is, however, not exhaustive, as it would require muchmore space to give proper credit to all diverse approaches and applicationsevolving in this rapidly broadening field.
2. Knowledge representation
One of the important early findings of artificial intelligence research has been therecognition of the importance of problem representation for finding its solution.Herbert Simon in his landmark book [17] summarized the finding as follows:"...solving a problem simply means representing it so as to make the solutiontransparent". Therefore, it is the main task of a designer of an AI system to deviseproper representation of the problem (i.e., the formulation of the problem andknowledge pertinent to its solution). The paper by Amarel [5] is considered to bethe first important work explicitly addressing this issue. It is often thought of as abeginning of the knowledge representation subfield of AI research. Amarel devisedthere a series of representations for the extended version of the classic"Missionaries & Cannibals" problem, starting from a predicate calculus represen-tation (augmented with a production system notation), and compared theireffectiveness in solving the problem. Interestingly, the subsequent, more efficientrepresentations designed by Amarel were increasingly diagrammatic in theirnature. It is therefore quite surprising that further research on knowledgerepresentation concentrated almost exclusively on logical (propositional) represen-tations—the Amarel's diagrams became practically forgotten for a long time [41].
Since then, little has been accomplished in automation of the representationdesign—in most cases, it is the program creator that must devise the properrepresentation for the class of problems the program is supposed to solve. How-ever, a promising step in this direction has been made recently by Van Baalen[68]. The automated representation design method proposed by him works withpredicate calculus formulas and as yet has not been applied to diagrammaticrepresentations.
An early result of knowledge representation research has been the discrimina-tion of two main types of representations: so-called analogical (or direct) represen-tations and propositional (or Fregean, or sentential) representations.
4 Diagrammatic representation and reasoning
Machine GRAPHICS & VISION vol. 3, nos. 1/2, 1994, pp. 77-103.
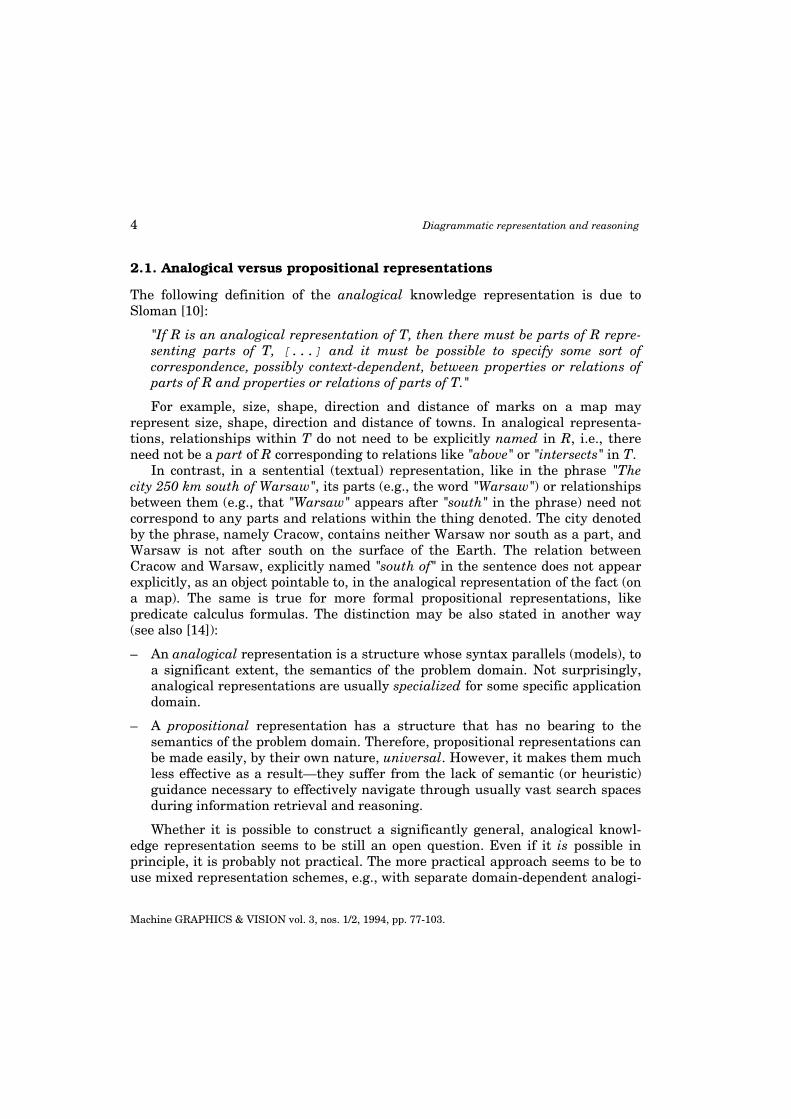
2.1. Analogical versus propositional representations
The following definition of the analogical knowledge representation is due toSloman [10]:
"If R is an analogical representation of T, then there must be parts of R repre-senting parts of T, [...] and it must be possible to specify some sort ofcorrespondence, possibly context-dependent, between properties or relations ofparts of R and properties or relations of parts of T."
For example, size, shape, direction and distance of marks on a map mayrepresent size, shape, direction and distance of towns. In analogical representa-tions, relationships within T do not need to be explicitly named in R, i.e., thereneed not be a part of R corresponding to relations like "above" or "intersects" in T.
In contrast, in a sentential (textual) representation, like in the phrase "Thecity 250 km south of Warsaw", its parts (e.g., the word "Warsaw") or relationshipsbetween them (e.g., that "Warsaw" appears after "south" in the phrase) need notcorrespond to any parts and relations within the thing denoted. The city denotedby the phrase, namely Cracow, contains neither Warsaw nor south as a part, andWarsaw is not after south on the surface of the Earth. The relation betweenCracow and Warsaw, explicitly named "south of" in the sentence does not appearexplicitly, as an object pointable to, in the analogical representation of the fact (ona map). The same is true for more formal propositional representations, likepredicate calculus formulas. The distinction may be also stated in another way(see also [14]):
– An analogical representation is a structure whose syntax parallels (models), toa significant extent, the semantics of the problem domain. Not surprisingly,analogical representations are usually specialized for some specific applicationdomain.
– A propositional representation has a structure that has no bearing to thesemantics of the problem domain. Therefore, propositional representations canbe made easily, by their own nature, universal. However, it makes them muchless effective as a result—they suffer from the lack of semantic (or heuristic)guidance necessary to effectively navigate through usually vast search spacesduring information retrieval and reasoning.
Whether it is possible to construct a significantly general, analogical knowl-edge representation seems to be still an open question. Even if it is possible inprinciple, it is probably not practical. The more practical approach seems to be touse mixed representation schemes, e.g., with separate domain-dependent analogi-

Zenon Kulpa 5
Machine GRAPHICS & VISION vol. 3, nos. 1/2, 1994, pp. 77-103.
cal representations linked by a universal propositional superstructure [54, 71, 73].Most working systems that use diagrammatic representations are hybrid, as werethe early systems [3, 4, 11].
The distinction between analogical and propositional representations is oftenwrongly interpreted. This sometimes leads to misunderstandings in discussionsbetween proponents of both approaches. The interested reader may find the listand discussion of the most common misrepresentations of the distinction in [10].
2.2. Diagrammatic representation terminology
The terms analogical and propositional were adequately discussed above. Theterm Fregean was introduced in [8] (in honor of Gottlob Frege, whose work laidfoundations for the predicate logic notation), but recently is replaced by proposi-tional (which term is used thorough this paper). Also, the term sentential wasproposed [31], but it seems less fitting, as it may lead to confusion of propositionalrepresentations with descriptions using sentences in some (natural) language.The analogical representations are also called direct [14]. Logical representationsare kinds of propositional representations using logical notations, usuallypredicate logic calculus and its numerous extensions, like modal logic ornonmonotonic logic [13]. The discussion and characterization of representationsthat might be propositional but not logical (or not wholly logical) lies outside thescope of this work, as is the place in this taxonomy of such well-known knowledgerepresentation schemes as semantic nets and frames.
The next group of terms is headed by the term visual. It is supposed to mean,in this context, perceivable by sight (i.e., "seeable"). Indirectly, it also follows thatthe visual representation is necessarily at least two-dimensional (even when theconcepts represented are one-dimensional, like time intervals, see [30]). Visualdoes not necessarily mean analogical—the visual/non-visual distinction is tolarge extent independent of the analogical/propositional distinction. It refers tosensual modality of the representation (in opposition to aural, tactile, etc.), not tothe structure of the encoding involved in the analogical/propositional distinction.Subspecies of visual are: graphic, pictorial, diagrammatic, and, in a sense,geometrical.
Whether visual representation is analogical or not depends on the representa-tion of what information it is, and how it represents this information. E.g., the setof logical formulas as written on paper (or computer screen) is a representation ofthe knowledge encoded with the formulas, but despite its visuality, it is not ananalogical representation of this knowledge. However, it is an analogical repre-sentation of the set of logical formulas! The graphical (geometrical) relations

6 Diagrammatic representation and reasoning
Machine GRAPHICS & VISION vol. 3, nos. 1/2, 1994, pp. 77-103.
between written graphical symbols directly correspond to the (syntactic) structureof the formulas, although rather not to the structure of the knowledge repre-sented by them. Note, however, that visual and essentially two-dimensionalrepresentations that are nevertheless propositional (like various kinds of mathe-matical notation) gain certain advantages (hence their origination and widespreadusage) in comparison to textual, purely one-dimensional representations (likelinear notations for mathematical expressions used in traditional high-levelprogramming languages). It stems from the fact that they are analogical withrespect to the structure of the expressions, though not (or to a significantly lesserdegree) with respect to the knowledge represented by the expressions.
An illustration of these distinctions is provided in Fig. 1. A knowledge aboutproportions of certain quantities is represented diagrammatically (Fig. 1a), thenpropositionally using "unadorned" predicate calculus (Fig. 1b). The "legend"(Fig. 1c) links corresponding symbols in both domains (being a part of thedefinition of the visual language used). The usual mathematical notation (Fig. 1d)is propositional with respect to the domain knowledge, but (partially) diagram-matic with respect to the structure of the formula in Fig. 1b.
Fig. 1. Diagrammatic versus propositional representations (see text).
Pictorial is supposed to mean here involving pictures. Pictures are consideredto be realistic (representational) images of the world objects and scenes, asopposed to more simplified, stylized or symbolic graphical images. Graphical issupposed to mean involving artificial, symbolic or simplified visual depiction ofobjects, notions and relations (as opposed to more realistic pictures). Historically,

Zenon Kulpa 7
Machine GRAPHICS & VISION vol. 3, nos. 1/2, 1994, pp. 77-103.
it also carried a connotation of restricted means of rendering (only black andwhite, with no intermediate tones or color, only line drawings, etc.), now mostlyirrelevant due to proliferation of advanced graphics techniques in art, design,printing industry, and computer graphics. Distinction between pictorial andgraphical is currently a matter of degree rather than principle. The distinctionpictorial/graphical as accepted here is different, though related to that made invisual arts between painting and graphics, where it corresponds more to the tech-nique of creation—the execution by hand producing only one original (painting)versus the use of more or less mechanical means of reproduction capable ofproducing multiple originals (graphics)—rather than to the specific visualfeatures of the artifact or the intent of its creation.
Geometrical means involving ideal mathematical objects as studied bygeometry, that is, points with no dimensions, lines with no thickness, ideallyround circles, etc. Geometrical objects may be rendered (approximated) bygraphical means on paper or screen. It should be kept in mind, however, thatgraphical attributes of these renderings like shading, various line thicknesses orstyles (dashed, dotted), textual labels, etc., are not geometrical entities, althoughthey may be used as elements of the visual language talking about geometricalelements (e.g., in geometry proofs). It is quite common practice, however, toidentify geometrical objects with their renderings (drawings), what maysometimes lead to confusion.
The term diagrammatic is central here. Diagram, by a vocabulary definition,is a visual means of representation of (not necessarily visual) information. Consid-ering this, the term diagrammatic representation translates somewhat awk-wardly as "representation involving visual means of representation". Anyway,this term seems to be best suited to denote what we are most interested in here.Although, logically speaking, visual is the wider term than diagrammatic, it ishard to point out a visual representation that could not be called a diagrammaticrepresentation. One candidate that comes to mind is a real-world picture, notartificially made with intent to represent some information. Thus, in the contextof man-made or machine-made forms, diagrammatic can be considered practicallysynonymical with visual (as it is treated by many authors, e.g. [74]). Diagram-matic representations may use both pictorial and graphical elements, thoughusually graphical means are the most common in diagrams.
To be exact, we should add that geometrical objects cannot be parts of adiagram by themselves, although their graphical renderings (approximations) arecommon building blocks of diagrams. Geometrical concepts also are obviousconceptual tools for analysis, construction and discussion of diagrammaticrepresentations.

8 Diagrammatic representation and reasoning
Machine GRAPHICS & VISION vol. 3, nos. 1/2, 1994, pp. 77-103.
3. Making it visible
3.1. Behold!
One might be tempted to start the presentation of origins of diagrammaticreasoning with the phrase "Already ancient Greeks...". One cannot, however: theorigins of diagrammatic (or, more broadly and less technically, pictorial) represen-tation of information are older still. It seems certain from available evidence thatthe very first human attempts at communication with other means than orallanguage—the first writings—were pictorial. As Chinese writing still containsvisible remnants of its pictorial origins (although, contrary to common impression,currently it is basically phonetic like other writings of the world), one shouldrather say "Already ancient Chinese...".
It seems that the use of diagrams to aid more scientific thinking also origi-nated in China. Not surprisingly, it was applied to explaining theorems ofgeometry. An old Chinese treatise, dated by some scholars at 600 B.C. [40],contains the visual proof of the Pythagoras Theorem, redrawn in Fig. 2a (withsome inessential changes, like translating Chinese labels into Latin alphabet). Asimilar diagram appeared in a treatise by an ancient Hindu mathematicianBhaskara, augmented only by a single word: "Behold!".
Fig. 2. A visual proof of the Pythagoras Theorem from an ancient Chinese treatise (a)and two algebraic derivations following directly from the diagram (b, c).

Zenon Kulpa 9
Machine GRAPHICS & VISION vol. 3, nos. 1/2, 1994, pp. 77-103.
To be fair, some (easy) algebraic calculations seem to be necessary to definitelycomplete the proof. It may be done in two different ways, depending on which partof the diagram is focused upon. The part inside the tilted square leads to thederivation in Fig. 2b, whereas disregarding the interior of the square leads to thederivation of Fig. 2c. Thus, the diagram in fact contains two different proofs of thetheorem! In various geometry texts usually only one of these versions is cited.Note, however, that the full diagram contains also a convincing visual demonstra-tion of the formula for an area of a right triangle (needed in the proof), thus it is amore self-contained example of diagrammatic proof of the theorem than either ofits two simplified versions.
Geometricians of ancient China and India used extensively this method ofvisual rather than propositional argument [7, 40]. Ancient Greeks, and westernmathematics after them, followed another path. Euclid's "Elements" containdrawings, but they in most part play a role of mere illustrations, helping tounderstand the statement of the problem, whereas the whole argument is pre-sented textually, in a formal, step-by-step sequence of logically connected proposi-tions. This practice laid foundations for development of formal deductive scientificmethod, but the possible advantages of direct visual grasp were put aside and allbut lost to generations of scholars in geometry and other sciences.
For example, Euclid's proof of the Pythagoras theorem is very intricate andnonintuitive. The accompanying diagram is very complicated and its major role isto help the reader in not becoming completely lost in the tangle of argument. Aninteresting attempt to "pictorialize" Euclid has been made by Byrne [1] in themiddle of the 19th century (see [40] for excerpts of some interesting fragments).Instead of textual labels marking points, lines, and figures in the drawings, Byrneused colour to code the elements and areas in the drawing, and insertedcorresponding coloured graphic symbols in appropriate places in the text.However, the structure and style of Euclid exposition remained unchanged. Notsurprisingly, the attempt seems hardly successful—the intricate proofs remainedintricate and the train of underlying reasoning obscure.
3.2. Visual languages
As the above example and numerous others indicate, propositional representa-tions cannot be translated into visual ones "word for word". Proper visual repre-sentation requires its own, distinct visual language, comprising both appropriatevisual vocabulary of graphical symbols and specifically "diagrammatic" rules oftheir composition into meaningful and effectively readable (or rather "seeable")representations. Not surprisingly, research on general aspects of visual languages

10 Diagrammatic representation and reasoning
Machine GRAPHICS & VISION vol. 3, nos. 1/2, 1994, pp. 77-103.
appears to be the main line of research in the field, as titles of books, conferencesand scientific journals signify [28, 51].
The fundamental knowledge on visual presentation methods has been accumu-lated by professionals of graphics design trade. It may be found in numerous oldand recent books on the subject. The most useful ones (to the field of visualrepresentation) are those concerned with presentation of (quantitative and quali-tative) data and information, e.g. [6, 15, 19, 22, 25, 40]. As we humans are lackinga sufficiently effective "picture effector" [20], for a long time production of visualpresentations was restricted to professionals of graphics design and visual arts, asthe task required considerable skill and training. Recently presentation graphicsis produced more and more frequently by non-professionals (and too often withvisually disastrous results), due to wide accessibility of computer programs aidingcreation of drawings, illustrations, graphical presentations and charts. The com-puter has become a kind of prosthesis for the lacking "picture effector".
More or less rigidly codified, specialized visual languages for various technicaldomains have been devised and used since long ago, e.g., in cartography,mechanical, construction and architectural drawing, electrical schemata, etc., aswell as in computer programming [27]. Other visual language systems, like roadsigns, international information signs, or iconic interfaces with personalcomputers, can be found in everyday life as well.
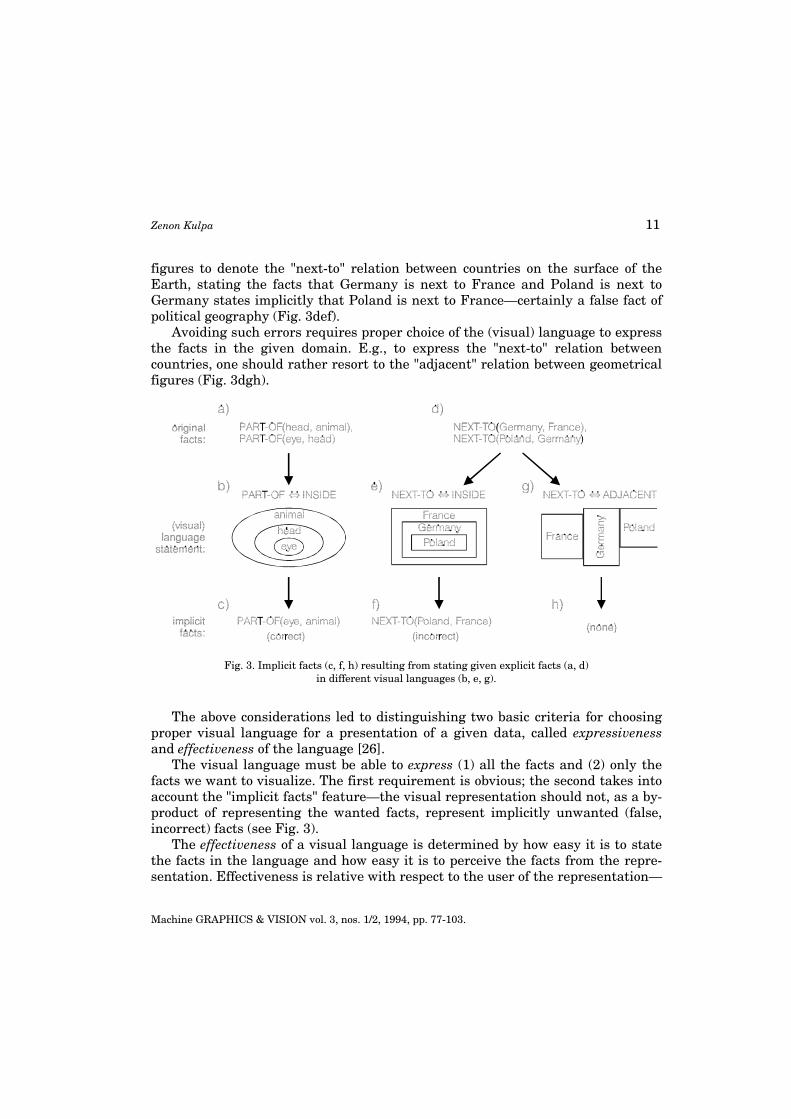
However, more formal codification of visual data presentation rules, to makethem suitable for computer implementation, has been attempted only recently[26]. The authors observed that some data representation languages, and espe-cially visual languages, have the property that when some collections of facts arestated explicitly, additional facts are stated implicitly. E.g., to express a "part-of"relation between entities of some domain one may use an "inside" relationbetween geometrical figures. Then, one may represent the facts that a head is apart of an animal and an eye is a part of a head by placing the "head" figure insidethe "animal" figure and the "eye" figure inside the "head" figure (see Fig. 3abc). Asa result of this construction, the "eye" figure turns out to be inside the "animal"figure on the diagram, thus an additional "implicit fact" that an eye is a part of ananimal is also stated.
The "implicit facts" phenomenon, known also as "emergent properties" featureof diagrams [65], may be a mixed blessing. On the one hand, it allows for moreefficient coding of a set of facts and helps to use the diagram in reasoning—theimplicit facts constitute a sort of automatic inferences provided by the diagram-matic representation at little or no cost (see Sec. 4.2 below). On the other hand,implicit facts may be not correct in the intended interpretation of the languagestatement. E.g., when one uses the same "inside" relation between geometrical
Zenon Kulpa 11
Machine GRAPHICS & VISION vol. 3, nos. 1/2, 1994, pp. 77-103.
figures to denote the "next-to" relation between countries on the surface of theEarth, stating the facts that Germany is next to France and Poland is next toGermany states implicitly that Poland is next to France—certainly a false fact ofpolitical geography (Fig. 3def).
Avoiding such errors requires proper choice of the (visual) language to expressthe facts in the given domain. E.g., to express the "next-to" relation betweencountries, one should rather resort to the "adjacent" relation between geometricalfigures (Fig. 3dgh).
Fig. 3. Implicit facts (c, f, h) resulting from stating given explicit facts (a, d)in different visual languages (b, e, g).
The above considerations led to distinguishing two basic criteria for choosingproper visual language for a presentation of a given data, called expressivenessand effectiveness of the language [26].
The visual language must be able to express (1) all the facts and (2) only thefacts we want to visualize. The first requirement is obvious; the second takes intoaccount the "implicit facts" feature—the visual representation should not, as a by-product of representing the wanted facts, represent implicitly unwanted (false,incorrect) facts (see Fig. 3).
The effectiveness of a visual language is determined by how easy it is to statethe facts in the language and how easy it is to perceive the facts from the repre-sentation. Effectiveness is relative with respect to the user of the representation—

12 Diagrammatic representation and reasoning
Machine GRAPHICS & VISION vol. 3, nos. 1/2, 1994, pp. 77-103.
other rules apply when it is to be used by humans, other when by computers.Human visual perception criteria are quite well known and codified in extensivehuman factors and graphic design literature [15, 19, 22, 25, 40]. E.g., it is wellknown that color and shading are far less effective in representing accuratelynumerical quantities than position on a scale or length of a line. Much less can besaid about the preferences of computers, although some results, both negative andpositive, are emerging [11, 18, 28, 44, 59, 74], see also Sec. 5.
Other authors [55, 59, 61] added to the above two criteria the presentationgoal criterion. It takes into account what kind of operations the user wants toperform with the representation, or what kind of tasks the representation will beused to aid. Examples of different goals might be, e.g., accurate value lookup(then representing the values as marks on a numerical scale is advisable) versusgeneral magnitude comparison (then representing the values by size of graphicalentities might be better).
Combining the above considerations and the traditional data presentationknowledge (esp. Cleveland's work [25]), several researchers implemented experi-mental computer programs for automatic presentation design [29, 55, 61].Interesting earlier work going in similar direction was done by Reilly and Roach[23]. They attempted, with some success, to use the then developing expert systemtechnology to build a graphic design advisor helping to design good graphicalinterfaces. Later on, Myers [34] used also a knowledge-based module in hissystem for interactive design of graphical user interfaces, and an interestinggraphic design advisor has been implemented by MacNeil [39, 50]. As, in general,there are no computationally tractable algorithms (i.e., of less than exponentialcomplexity) for finding "optimal" layout of complex diagrams (see, e.g. [21, 42]),using heuristic, or knowledge-based, approaches to automating graphic design isin fact a necessity.
Many other approaches to formalization of visual languages have beenpublished over the years. One of the most influential was that by Harel [33],further developed into an exact diagrammatic reasoning formalism by Hammer[70, 71]. For other approaches, see especially [28, 44, 46] and other generalsources on visual languages (see the last Section).
3.3. Uses of diagrams
Once created, the diagrammatic representation may be used in various ways.These ways can be classified along several dimensions. Main distinctions seem tobe: who created the diagram (a human, or a computer?); who is to use it (its creatoror someone else, and again, human or computer?); and in what kind of information
Zenon Kulpa 13
Machine GRAPHICS & VISION vol. 3, nos. 1/2, 1994, pp. 77-103.
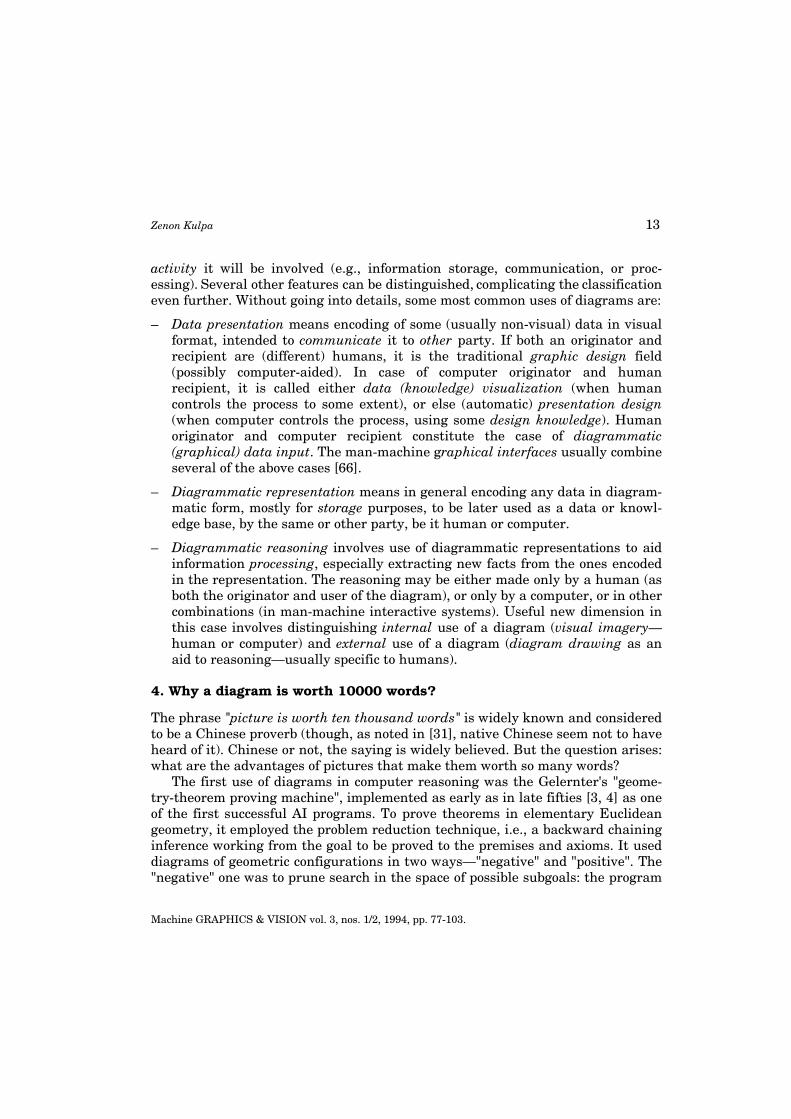
activity it will be involved (e.g., information storage, communication, or proc-essing). Several other features can be distinguished, complicating the classificationeven further. Without going into details, some most common uses of diagrams are:
– Data presentation means encoding of some (usually non-visual) data in visualformat, intended to communicate it to other party. If both an originator andrecipient are (different) humans, it is the traditional graphic design field(possibly computer-aided). In case of computer originator and humanrecipient, it is called either data (knowledge) visualization (when humancontrols the process to some extent), or else (automatic) presentation design(when computer controls the process, using some design knowledge). Humanoriginator and computer recipient constitute the case of diagrammatic(graphical) data input. The man-machine graphical interfaces usually combineseveral of the above cases [66].
– Diagrammatic representation means in general encoding any data in diagram-matic form, mostly for storage purposes, to be later used as a data or knowl-edge base, by the same or other party, be it human or computer.
– Diagrammatic reasoning involves use of diagrammatic representations to aidinformation processing, especially extracting new facts from the ones encodedin the representation. The reasoning may be either made only by a human (asboth the originator and user of the diagram), or only by a computer, or in othercombinations (in man-machine interactive systems). Useful new dimension inthis case involves distinguishing internal use of a diagram (visual imagery—human or computer) and external use of a diagram (diagram drawing as anaid to reasoning—usually specific to humans).
4. Why a diagram is worth 10000 words?
The phrase "picture is worth ten thousand words" is widely known and consideredto be a Chinese proverb (though, as noted in [31], native Chinese seem not to haveheard of it). Chinese or not, the saying is widely believed. But the question arises:what are the advantages of pictures that make them worth so many words?
The first use of diagrams in computer reasoning was the Gelernter's "geome-try-theorem proving machine", implemented as early as in late fifties [3, 4] as oneof the first successful AI programs. To prove theorems in elementary Euclideangeometry, it employed the problem reduction technique, i.e., a backward chaininginference working from the goal to be proved to the premises and axioms. It useddiagrams of geometric configurations in two ways—"negative" and "positive". The"negative" one was to prune search in the space of possible subgoals: the program

14 Diagrammatic representation and reasoning
Machine GRAPHICS & VISION vol. 3, nos. 1/2, 1994, pp. 77-103.
rejected any hypothesis (subgoal) that was not true in the diagram (it was esti-mated that about 99.5% of the possible subgoals were rejected in this way!). Thatis, the diagram was used to filter out hypotheses inconsistent with the data storedin the representation, in compensation for the inefficient, "blind" hypothesisgeneration algorithm. The "positive" use of a diagram allowed to shorten inferencepaths by assuming as true various facts (reliably) obvious from the diagram, buttiresome to prove from fundamental axioms, like that a certain point on a line liesbetween two others, or two angles share common arms and are therefore equal,etc. The latter use of a diagram obviously utilizes the "implicit facts" (or"emergent properties") feature of diagrammatic representations (see Sec. 3.2 and4.2), the former is also to a large extent dependent on this feature. Like severalother early attempts to implement diagrammatic reasoning in computers, theGelernter's work has been practically forgotten, and it did not start any seriousresearch on the possible advantages of diagrammatic representations.
Larkin and Simon in their seminal paper [31] tried to give a more preciseanswer to the question, from the point of view of cognitive science. Their mainconclusion has been that diagrams allow effective control of the reasoning process,facilitating search for the elements needed to make the next inference step, due toexplicit proximity or adjacency relations between appropriate entities on thediagram. With propositional (e.g., predicate calculus) representation, to find aninformation needed to apply some inference rule one must search the entire database to find the relevant entities and their properties. On the diagram, however,the relevant entities are usually placed just in the (topological or metrical) vicinityof the current "attention point" that has resulted from the previous reasoningstep. The diagram, as an analogical representation of the structure of theproblem, organizes the problem description in a way corresponding to theproblem's internal structure that should be followed in order to find the path tothe solution. The authors support their claim with appropriate calculation of thenumber of search steps needed to solve two example problems (from elementarymechanics and from geometry) using both representations.
4.1. Diagrammatic reasoning: an example
A reformulated version of the first of Larkin and Simon examples [31] illustratesthe point. Fig. 4 shows a predicate calculus formulation of some simple mechani-cal problem. First, the list of the entities involved, their properties and relationsholding between them is given. It comprises the set of (initial) facts. Then, thesolution goal is stated, i.e., a statement to be proven true with appropriatelyinstantiated variable (denoted ?n). The "physics" of the system is given by a set ofrules for derivation of new facts from the existing (known) facts. The set of (initial)

Zenon Kulpa 15
Machine GRAPHICS & VISION vol. 3, nos. 1/2, 1994, pp. 77-103.
facts and rules together comprises the knowledge base of the problem. The readeris kindly asked not to try to guess what kind of device is described here, nor tolook forward to the next page of text, before he/she tries to imagine how solving ofthe problem using only this representation might look like.
FACTS: structural description and parameters
WT(P), WT(Q)RP(p), RP(q), RP(s), RP(x), RP(y), RP(z), RP(t),PL(A), PL(B), PL(C),CL(T)
PLS(p, A, q), PLS(x, B, y), PLS(y, C, z),HNG(P, p), HNG(Q, q), HNG(Q, s), HNG(A, x), HNG(B, t),HNG(s, C), HNG(t, T), HNG(z, T)
VAL(P, 1)
GOAL:
VAL(Q, ?n)
RULES:
Rule 1: if WT(w1) & RP(r1) & HNG(w1, r1) & ~HNG(w1, r2) & VAL(w1, n1)then VAL(r1, n1)
Rule 2: if PL(p1) & RP(r1) & RP(r2) & PLS(r1, p1, r2) & VAL(r1, n1)then VAL(r2, n1)
Rule 3: if PL(p1) & RP(r1) & RP(r2) & RP(r3) & PLS(r1, p1, r2) &{HNG(r3, p1) ∨ HNG(p1, r3)} & VAL(r1, n1) & VAL(r2, n2)
then VAL(r3, n1+n2)
Rule 4: if WT(w1) & RP(r1) & RP(r2) &HNG(w1, r1) & HNG(w1, r2) & ~HNG(w1, r3) &VAL(r1, n1) & VAL(r2, n2)
then VAL(w1, n1+n2)
Fig. 4. A simple mechanical problem: predicate calculus formulation.
Without the guidance of any mental model of the mechanical system describedby the above set of formulas, one must make extensive search of the whole set offacts any time he/she tries to match a candidate rule with appropriate facts in theknowledge base, trying various possible variable instantiations on the way. E.g.,in Rule 3 there are 7·7·7·3 = 1029 possible instantiations of the variables p1, r1, r2and r3, with only three of them consistent with the whole store of facts. And real
16 Diagrammatic representation and reasoning
Machine GRAPHICS & VISION vol. 3, nos. 1/2, 1994, pp. 77-103.
problems that must be solved by expert systems involve usually thousands of factsand rules. To cope with the task, one must spend a large amount of computationaleffort or appropriately organize the knowledge base and reasoning procedure. VanBaalen's [68] representation design system in effect does just that—reorganizesthe knowledge base, reformulating it by using new predicates and functions con-structed to fit regularities detected in the original set of formulas.
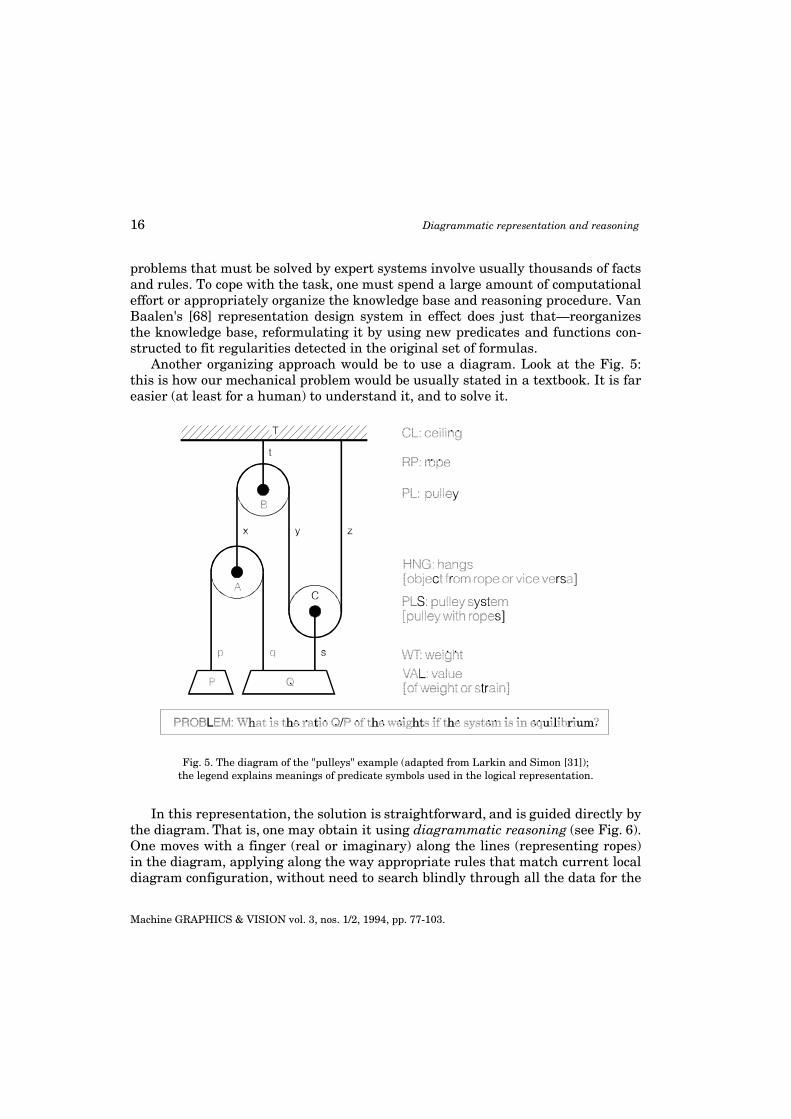
Another organizing approach would be to use a diagram. Look at the Fig. 5:this is how our mechanical problem would be usually stated in a textbook. It is fareasier (at least for a human) to understand it, and to solve it.
Fig. 5. The diagram of the "pulleys" example (adapted from Larkin and Simon [31]);the legend explains meanings of predicate symbols used in the logical representation.
In this representation, the solution is straightforward, and is guided directly bythe diagram. That is, one may obtain it using diagrammatic reasoning (see Fig. 6).One moves with a finger (real or imaginary) along the lines (representing ropes)in the diagram, applying along the way appropriate rules that match current localdiagram configuration, without need to search blindly through all the data for the

Zenon Kulpa 17
Machine GRAPHICS & VISION vol. 3, nos. 1/2, 1994, pp. 77-103.
facts matching the rule. The names (textual labels) of ropes and pulleys areunnecessary, as is the explicit naming of relations (like "hangs" or "pulleysystem"). This is how a human would solve the problem; how a computer mayimplement this kind of reasoning is explained in Sec. 5.
Fig. 6. Diagrammatic reasoning leading to the solution of the "pulleys" example;reasoning steps are numbered consecutively, and the legend lists rules used at every step.
4.2. Advantages of diagrammatic reasoning
The main sources of advantages of diagrammatic representations for reasoning,found by Larkin and Simon [31], have been further elaborated and extended byKoedinger [65]. Their findings can be summarized as follows:
– Locality aids knowledge and problem search: explicit adjacency or proximity(topological or metrical) of related problem entities on a diagram reducessearch for the data needed to make the next inference step, and search for theproper path through the problem space (e.g., a proof tree). This feature hasbeen illustrated by the "pulleys" example above, and it was used by Gelernterprogram [3, 4] to very efficiently prune the subgoals tree.
18 Diagrammatic representation and reasoning
Machine GRAPHICS & VISION vol. 3, nos. 1/2, 1994, pp. 77-103.
– Less necessity for symbolic labels: this is in fact a consequence of the previousfeature—related elements are usually grouped in proximity, avoiding the needto mark them with symbolic labels (like letter labels of weights, pulleys andropes in Figs. 4 and 5) and then search through the knowledge base for amatch. However, diagrams do not totally eliminate the use of symbolic labels—there are cases when they are still needed or even quite useful [65].
– Easy realization of perceptual inferences: humans possess a well-developed ap-paratus for making easy perceptual inferences on a diagram, but are far lessproficient in processing logical formulas or other propositional representations(compare the ease of following the route to the solution in Fig. 6 with searchfor matching predicates among the formulas of Fig. 4). It is probably true forhumans, although one may argue that humans may become equally proficientin processing formulas after appropriate practice. Unfortunately, this advan-tage hardly applies to computers, as they are better suited for symbolic ratherthan diagrammatic processing.
– Certain inferences are already present in a diagram: this feature is called an"emergent properties" phenomenon [65] and is discussed in more details below.The second use of diagrams in Gelernter's program [3, 4] was based on it, andthe feature was also extensively used by the DC program of Koedinger andAnderson [65].
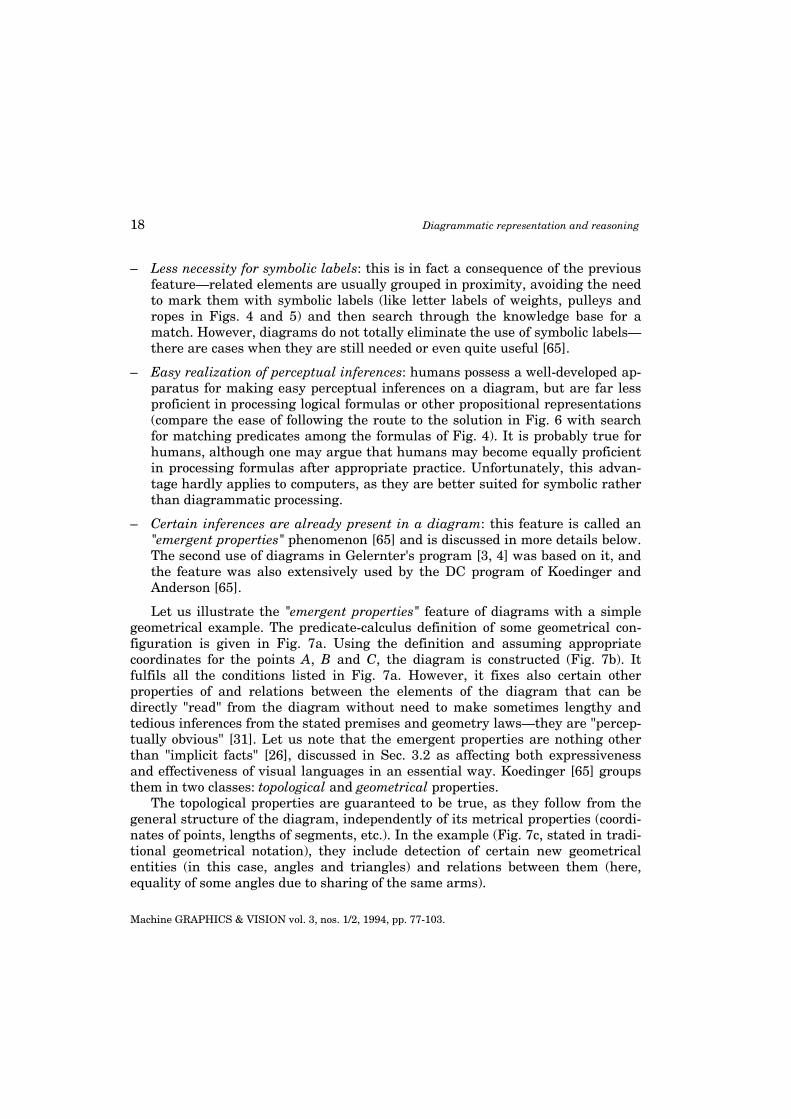
Let us illustrate the "emergent properties" feature of diagrams with a simplegeometrical example. The predicate-calculus definition of some geometrical con-figuration is given in Fig. 7a. Using the definition and assuming appropriatecoordinates for the points A, B and C, the diagram is constructed (Fig. 7b). Itfulfils all the conditions listed in Fig. 7a. However, it fixes also certain otherproperties of and relations between the elements of the diagram that can bedirectly "read" from the diagram without need to make sometimes lengthy andtedious inferences from the stated premises and geometry laws—they are "percep-tually obvious" [31]. Let us note that the emergent properties are nothing otherthan "implicit facts" [26], discussed in Sec. 3.2 as affecting both expressivenessand effectiveness of visual languages in an essential way. Koedinger [65] groupsthem in two classes: topological and geometrical properties.
The topological properties are guaranteed to be true, as they follow from thegeneral structure of the diagram, independently of its metrical properties (coordi-nates of points, lengths of segments, etc.). In the example (Fig. 7c, stated in tradi-tional geometrical notation), they include detection of certain new geometricalentities (in this case, angles and triangles) and relations between them (here,equality of some angles due to sharing of the same arms).

Zenon Kulpa 19
Machine GRAPHICS & VISION vol. 3, nos. 1/2, 1994, pp. 77-103.
Fig. 7. Emergent properties: propositional definition (a), the corresponding diagram (b), and thetopological (c) and geometrical (d) properties that can be directly "read" from the diagram.
The geometrical properties (Fig. 7d) are based on metrical data following fromthe particular point coordinates assumed during construction of the diagram.Thus, they may be not true in general, either due to "spurious coincidences"generated unwillingly when constructing the diagram, or measurement imperfec-tions in calculating, e.g., lengths of segments. Therefore, properties of this classcannot be used as steps in the reasoning. However, they can be still used to guideproblem search.
Note that "spurious coincidences" can lead to serious problems with diagram-matic reasoning when not taken properly into account. More detailed discussionof this subject lies outside the scope of this work, however.
5. Implementing diagrams
It is easy to say to a human: "Behold!". Humans are born with an excellent appa-ratus for extracting knowledge from pictures (including diagrams) and reasoningwith the help of them. It consists of perceptual part (the sense of vision) andinternal processing part (visual imagery). The visual perception mechanisms arecomparatively well understood, at least in their overall structure and some low-level technical details. The working of "visual thinking" [2, 7] is also understood ingeneral terms, though far less than perception, but details of its "implementation"in the brain are still a subject of hot debate among cognitive scientists [62]. Oneschool, lead by Kosslyn [12] claims we reason visually by generation andexamination of images on an "internal retina", using for reasoning essentially the
20 Diagrammatic representation and reasoning
Machine GRAPHICS & VISION vol. 3, nos. 1/2, 1994, pp. 77-103.
same brain apparatus as for perception. The opposing school, lead by Pylyshyn[16] claims the "pictorial" images we sometimes see in introspection duringreasoning are purely epiphenomenal and the "real" reasoning is essentiallypropositional. Recently, interesting models attempting a reconciliation of the twopositions were proposed [43]. Be it as it may, we certainly are able to reason withdiagrams, even if we may not clearly know how we do it.
It is quite another matter with computers. They must be endowed by us(humans) with appropriate programs able to model the visual perception andreasoning abilities. Computer vision systems are still far behind humans in theirperceptual abilities. "Intelligent" computer image interpretation of adequatelycomplex and arbitrary pictures still requires too much computing power andprocessing time to be practical as an input of diagrammatic representations to acomputer reasoner. Our knowledge about human visual imagery does not yetallow for using it as a direct model for computer programs. Luckily, advances incomputer vision and computer graphics do provide certain tools for implementa-tion of diagrammatic reasoning in machines.
Below, first the ways of diagram input to the machine are summarized. Thentwo essentially different ways the diagrams may be represented in a computer(specifically for use in reasoning) are discussed. The two methods parallel in away the distinction between raster and vector graphics known from computergraphics and image processing domains.
5.1. Putting diagrams inside
The main method of inputting diagrams to computers is to use interactive graphiceditors. In this way, the diagram is built from predefined primitives, either geo-metrical (lines, circles, rectangles, etc.) or specific to the domain (images ofpulleys, ropes and weights; electronic component symbols, etc.). The computerdoes not need to process the (usually noisy) input picture to extract and recognizeappropriate meaningful objects in it. This method is used in majority of practicalsystems, e.g., in probably the first commercially available visual programminglanguage Prograph [37]. For input of more complicated diagrams, systems of suchkind are often knowledge-aided like the interesting "designer's apprentice" namedTYRO [39, 50].
It is instructive to recall here the historical development of computer-aideddesign (CAD) systems. At the beginning, they were nothing more than draftingaids, to produce technical drawings from geometrical primitives, store them incomputer data banks, and plot them on paper. Growing computerization of draw-ing storage created a necessity to change into computer files the vast libraries ofhand-made paper drawings already accumulated by design and production compa-

Zenon Kulpa 21
Machine GRAPHICS & VISION vol. 3, nos. 1/2, 1994, pp. 77-103.
nies. Redrawing them with CAD programs was impractical for various reasons,therefore, a demand for automated "vectorization" systems (as they were called)ensued. Thanks to sufficiently regular structure of technical drawings, the combi-nation of powerful computer image processing and interactive human supervisionled to successful vectorization systems. The image processing research and theexperience gained with such systems bring closer the day of diagram inputsystems based on direct scanning of pictures or tracing the handwriting (or hand-waving) actions of humans. The work is under way since some time [18], and adevice like Apple Computer's Newton, though as yet not very reliable and possiblya little ahead of its time, marks the days of computers capable to really communi-cate with pictures.
In the meantime, a new direction in computer-aided design emerged, calledfeature-based design. Here, instead of purely geometrical primitives, the designsare assembled from (technologically) meaningful fragments, called "features", likeslots, holes, shafts, steps, grooves, etc. [47]. Soon the problem appeared—how totranslate the huge libraries of CAD drawings into feature-based format? Theresearch on automatic feature recognition and extraction from drawings has beenborn. The systems for doing this are usually knowledge-based, and have to resortto essentially diagrammatic reasoning [47].
5.2. Diagrams on a raster
The "raster-graphics" method represents diagrams as a raster image, i.e., as regu-lar, discrete, two-dimensional assembly of picture elements (pixels). Inspection ofthe diagram to extract needed information, and, possibly, writing down the inter-mediate results of reasoning, is done with appropriate image processing operators.As was mentioned above, the "pictorial" school of visual imagery [12] postulatesthat humans use just this method for diagrammatic representation and reasoning.However, taking into account the previous discussion of the limitations ofcontemporary computers, it is not surprising that there were very few attempts atusing this method for diagrammatic representation in computers.
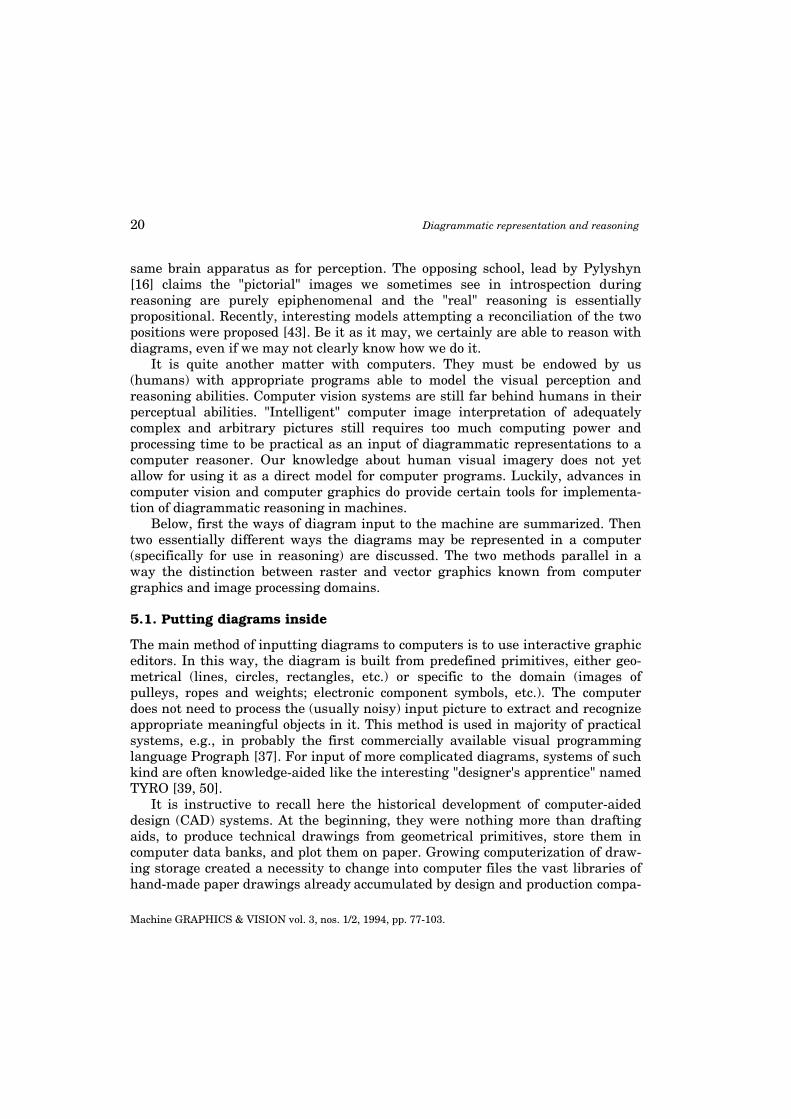
The first one was the system called WHISPER, implemented by Funt [11] inlate seventies. It is a mixed, vector/raster/propositional system. The overall struc-ture of WHISPER is shown in Fig. 8. The High Level Reasoner is a proceduralproblem-solving program embedding in its structure the qualitative physicalknowledge about motion and stability of rigid bodies acted upon by gravity (seeFig. 9 for an example configuration). To conduct the reasoning, the reasoner asksits "perceptual system" to "look at" the (vector) diagram with its (raster) "retina".Using the retina to locate objects and their supports, the reasoner checks thestability of each object shown in a diagram. Unstable objects may rotate or slide.
22 Diagrammatic representation and reasoning
Machine GRAPHICS & VISION vol. 3, nos. 1/2, 1994, pp. 77-103.
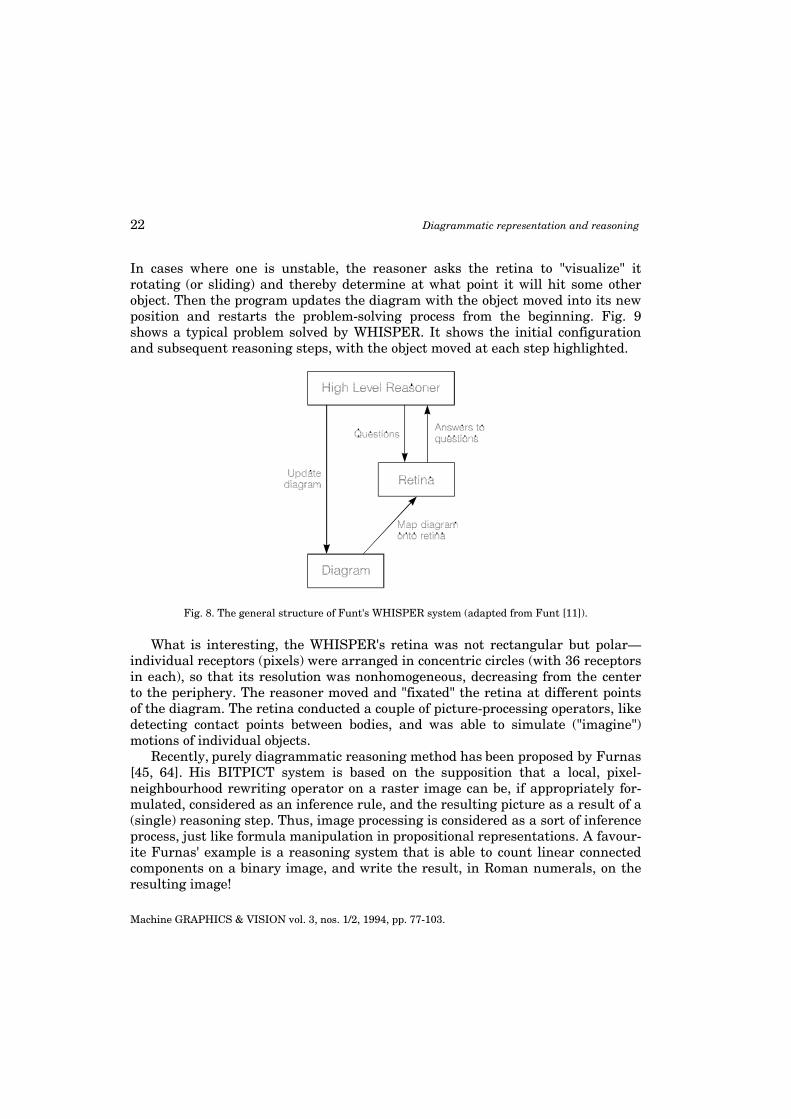
In cases where one is unstable, the reasoner asks the retina to "visualize" itrotating (or sliding) and thereby determine at what point it will hit some otherobject. Then the program updates the diagram with the object moved into its newposition and restarts the problem-solving process from the beginning. Fig. 9shows a typical problem solved by WHISPER. It shows the initial configurationand subsequent reasoning steps, with the object moved at each step highlighted.
Fig. 8. The general structure of Funt's WHISPER system (adapted from Funt [11]).
What is interesting, the WHISPER's retina was not rectangular but polar—individual receptors (pixels) were arranged in concentric circles (with 36 receptorsin each), so that its resolution was nonhomogeneous, decreasing from the centerto the periphery. The reasoner moved and "fixated" the retina at different pointsof the diagram. The retina conducted a couple of picture-processing operators, likedetecting contact points between bodies, and was able to simulate ("imagine")motions of individual objects.
Recently, purely diagrammatic reasoning method has been proposed by Furnas[45, 64]. His BITPICT system is based on the supposition that a local, pixel-neighbourhood rewriting operator on a raster image can be, if appropriately for-mulated, considered as an inference rule, and the resulting picture as a result of a(single) reasoning step. Thus, image processing is considered as a sort of inferenceprocess, just like formula manipulation in propositional representations. A favour-ite Furnas' example is a reasoning system that is able to count linear connectedcomponents on a binary image, and write the result, in Roman numerals, on theresulting image!
Zenon Kulpa 23
Machine GRAPHICS & VISION vol. 3, nos. 1/2, 1994, pp. 77-103.
Fig. 9. An example block configuration processed by Funt's WHISPER systemand "snapshots" of principal steps of its diagrammatic simulation.
5.3. Diagrams as graphs
The "vector-graphics-like" method of representing diagrams in a computer is morepopular and universal. Diagrams are here represented, generally, as varioustypes of structural or relational graphs. Methods of computer representation andprocessing of graphs are fairly well developed and their adaptation to diagram-matic reasoning is usually easy and straightforward. Nodes of the structuralgraphs represent appropriate elements (of the diagram or underlying semanticdomain), and edges represent various relations between them. A version of thismethod was employed in the first program that used diagrams to augment thecomputer reasoning—the Gelernter's "geometry-theorem proving machine" [3, 4].
In more complex cases, several structural graphs can be used simultaneouslyfor a given problem, each one modelling different aspect of it. E.g., one graph mayrepresent the structure of the problem situation, either only topological or elseaugmented with metrical (position) information, another the structure of itsformal model (a set of equations or a system of constraints linking the statevariables).
For example, the structural graph of the "pulleys" example (cf. Fig. 5) mightlook like that in Fig. 10a. Graphs of this type can be easily implemented in a

24 Diagrammatic representation and reasoning
Machine GRAPHICS & VISION vol. 3, nos. 1/2, 1994, pp. 77-103.
computer as linked lists of records. Reasoning with such a representation may beformulated as a set of graph rewriting rules (see Fig. 10b), directly correspondingto the predicate calculus implications of Fig. 4, and controlled by appropriatedomain heuristics. A full set of rewriting rules for the domain of pulley systemsshould be augmented by some more rules and additional notation to capture morecomplicated configurations and applicability conditions, omitted in the examplefor simplicity. E.g., the rule (1) has a version usable in the opposite direction; therules (1) and (4) should explicitly state that no more ropes are attached to theweight; the rules (3) and (4) should require that the ropes are parallel (otherwise,vector rather that scalar summation of forces would be necessary).
Fig. 10. The structural graph of the "pulleys" example, easy to implement within a computer (a)and a set of graph rewriting rules suitable for diagrammatic reasoning with it (b).
For graphical communication with human users, the internal representationsof structural graphs can be visualized in various ways, either using traditionalgraph notation (i.e., as sets of nodes linked with edges [59]), or after translationinto the semantic domain using appropriate visual language fitting the domain. Inthe "pulleys" example, the output translation of the structural graph might lookjust like in Fig. 5, possibly, if required, augmented with the visualization of thereasoning process itself (see Fig. 6).
Note that with this kind of representation one is not restricted to diagrams ofonly two dimensions. Moreover, one may represent arbitrary (analogical) repre-sentation schemes. It leads to a generalization of diagrammatic reasoning, calledmodel-based reasoning, which reasons by direct manipulation and inspection ofan arbitrary model (in logical model theory sense) of the problem [36, 57].

Zenon Kulpa 25
Machine GRAPHICS & VISION vol. 3, nos. 1/2, 1994, pp. 77-103.
6. Application areas
Diagrammatic representation and reasoning already find numerous applicationsin various fields of AI and other theoretical and applied research. In fact, theresearch in this field was fuelled mostly by developments in and demands ofvarious application areas. The main application areas are briefly surveyed below:
– Theorem proving: primarily, geometry theorem proving, with the first success-ful computer implementation by Gelernter [3, 4]; it is still a favourite field ofstudy [65]. Other early applications were in logic—let us recall Euler circlesand Venn diagrams. The first full system of formal diagrammatic reasoning inlogic was proposed by the philosopher and logician C.S. Peirce at the end of19th century [9, 24], and was later developed by Sowa [24] into a generalscheme of knowledge representation. Another exact logical formalism of dia-grammatic reasoning, based on Harel's "higraphs" [33], has been developed byBarwise, Etchemendy, and Hammer [54, 70, 71].
– Visual programming: already a wide field of research, with many publishedpapers and books [32, 35, 44, 46]. Some authors classify it as a part of thewider area called software visualization [51, 72] which includes also algorithmvisualization (static visualization and algorithm animation [32]) and programvisualization, including data and code visualization and animation. This fieldoriginated from various diagramming techniques (starting from the well-known flow-charts) devised as aids for programmers [27]. Further develop-ments, closely linked with visual languages research, led to elaborate systemsof algorithm animation [32] and large number of visual programming lan-guages [35, 44, 46], some of them exploring simultaneously novel programmingparadigms, like constraint satisfaction [49, 52], or combination of data flowand object orientation (the commercially available Prograph language [37]).
– Qualitative physics: also a considerably new area of AI research attempting tomodel the everyday, qualitative, non-numerical reasoning humans use to esti-mate (the range of) possible solutions to some real-world problems, especiallyin the case of inexact or incomplete data [38]. The qualitative reasoning is alsoa necessary foundation of the quantitative knowledge the engineer or designeruse in their understanding and construction of physical systems or structures.Traditional mechanical or construction design used extensively drawings fordocumentation purposes, as informal aids for reasoning, and even to solvecertain problems graphically. With the advent of computers, however, thepurely numerical methods started to predominate. Similarly, the qualitativephysics research has largely been dominated by formal algebraic methods,
26 Diagrammatic representation and reasoning
Machine GRAPHICS & VISION vol. 3, nos. 1/2, 1994, pp. 77-103.
despite the fact that one of the early working systems of diagrammatic reason-ing, namely WHISPER [11], was designated to solve qualitative physics prob-lems. Recently, however, diagrammatic reasoning is again becoming an impor-tant ingredient of qualitative physics approaches. The most obviousapplication of diagrams is the so-called spatial reasoning [56, 58, 60] whichuses them to reason about spatial configurations, relations, and interactions.In computational kinematics, for example, local interactions of mechanicalcomponents are represented in a configuration space defined by componentdegrees of freedom. The regions of allowed component states are then geomet-rically subdivided into subregions containing qualitatively equivalent statesand the partitioning graph is then used directly to control the reasoning aboutpossible behaviours of the whole mechanical assembly [56, 58]. Otherexamples of diagrammatic reasoning are an analysis of nonlinear systemsdynamics using their classic graphical representation, namely phase portraits[63] and analysis of frame structures [73]. The popular algebraic method ofqualitative simulation [38] may benefit from the use of diagrams to representand control the solution of constraint networks.
– Data presentation: closely related to diagrammatic representation and reason-ing domain, though usually considered as a separate field. Data presentationresearch provides much of the knowledge and insight needed to constructproper diagrammatic representations [19, 26, 53], and diagrammatic reasoningis often indispensable for automatic presentation design [55, 59, 61]. The fieldhas already been discussed in Sec. 3.2 and 3.3.
7. Suggestions for further study
Readers interested in further study of the subject are advised to consult the pro-vided references. Some general sources are briefly introduced below:
– Journal of Visual Languages and Computing: a quarterly journal published byAcademic Press (London), launched in 1990; concentrates on general issues ofvisual languages and their applications in computing.
– IEEE Workshops on Visual Languages: a series of annual conferences orga-nized by IEEE Computer Society; launched in 1987; concentrate on generalissues and applications of visual languages.
– IEEE Conferences on Visualization: a series of conferences organized by IEEEComputer Society; launched in 1990 [48]; concentrate on methods and exam-ples of (scientific) data visualization.

Zenon Kulpa 27
Machine GRAPHICS & VISION vol. 3, nos. 1/2, 1994, pp. 77-103.
– AAAI Spring Symposium on Reasoning with Diagrammatic Representations—Working Notes: edited by N. Hari Narayanan in 1992 [67]; materials of thefirst conference devoted to the subject of diagrammatic representations andreasoning; the comprehensive review of the symposium scope and results canbe found in [69].
– Visual Programming Environments: a large, two-volume collection of reprintscompiled by E.P. Glinert in 1990 [46]; concentrates mostly on visual program-ming, but contains also many papers of general significance, together withextensive source bibliography.
Also, many papers on the subject may be found scattered in journals andconference proceedings on artificial intelligence (esp. knowledge representation),computer graphics (esp. graphical interfaces, business and scientific data visuali-zation), software engineering (esp. visual programming), and cognitive science.
After the AAAI Symposium listed above, a diagrams discussion list has beenestablished on the Internet network. To subscribe, send an e-mail request to:< [email protected] >.
References
1847[1] Byrne O.: The First Six Books of the Elements of Euclid in Which Coloured Diagrams and Symbols
Are Used Instead of Letters for the Greater Ease of Learners. William Pickering, London.
1945[2] Hadamard J.: The Psychology of Invention in the Mathematical Field. Princeton University Press,
Princeton, NJ.
1959[3] Gelernter H.: Realization of a geometry-theorem proving machine. Proc. International Conf. on
Information Processing (ICIP). UNESCO House, Paris, 273-282. (Reprinted in: Feigenbaum E.A.,Feldman J. (Eds.): Computers and Thought. McGraw-Hill, New York, 1963, 134-152).
1960[4] Gelernter H., Hansen J.R., Loveland D.W.: Empirical explorations of the geometry-theorem proving
machine. Proc. of the Western Joint Computer Conf. (WJCC’60), Vol. 17, 143-147. (Reprinted in:Feigenbaum E.A., Feldman J. (Eds.): Computers and Thought. McGraw-Hill, New York, 1963,153-163).
1968[5] Amarel S.: On representations of problems of reasoning about actions. In: Michie D. (Ed.): Machine
Intelligence 3, Edinburgh University Press, Edinburgh, 131-171.[6] Bowman W.J.: Graphic Communication. J. Wiley, New York.
1969[7] Arnheim R.: Visual Thinking. University of California Press, Berkeley, CA.

28 Diagrammatic representation and reasoning
Machine GRAPHICS & VISION vol. 3, nos. 1/2, 1994, pp. 77-103.
1971[8] Sloman A.: Interactions between philosophy and A.I. – The role of intuition and non-logical
reasoning in intelligence. AI, 2, 209-225.
1973[9] Roberts D.D.: The Existential Graphs of Charles S. Peirce, Mouton, The Hague.
1975[10] Sloman A.: Afterthoughts on analogical representations. Proc. 1st Workshop on Theoretical Issues
in Natural Language Processing (TINLAP-1), Cambridge, MA, 164-171. (Reprinted in: BrachmanR.J., Levesque H.J. (Eds.): Readings in Knowledge Representation. Morgan Kaufmann, San Mateo,CA, 1985, 432-439).
1980[11] Funt B.V.: Problem-solving with diagrammatic representations. AI, 13(3), 201-230.[12] Kosslyn S.: Image and Mind. Harvard University Press, Cambridge, MA.[13] Nilsson N.J.: Principles of Artificial Intelligence. Tioga Publ. Co, Palo Alto, CA.
1981[14] Barr A., Feigenbaum E.A. (Eds.): The Handbook of Artificial Intelligence. Vol. 1, HeurisTek Press,
Stanford, CA and William Kaufmann, Los Altos, CA, 200-206.[15] Bertin J.: Graphics and Graphic Information Processing. Walter de Gruyter, Berlin.[16] Pylyshyn Z.W.: The imagery debate: analogue media versus tacit knowledge. Psychological Review,
88, 16-45.[17] Simon H.A.: The Sciences of the Artificial. (2nd ed.), MIT Press, Cambridge, MA.
1982[18] Hosaka M., Kimura F.: Using handwriting action to construct models of engineering objects. IEEE
Computer, 15(11), 35-47.
1983[19] Bertin J.: Semiology of Graphics: Diagrams, Networks, Maps. University of Wisconsin Press.[20] Kulpa Z.: Iconics: computer-aided visual communication. In: Levialdi S. (Ed.): Digital Image Analy-
sis. (Proc. 2nd Conference on Image Analysis and Processing. Fasano, Italy, 1982). Pitman, London,280-282.
[21] Supowit K.J., Reingold E.M.: The complexity of drawing trees nicely. Acta Informatica, 22, 377-392.[22] Tufte E.R.: The Visual Display of Quantitative Information. Graphics Press, Cheshire, CT.
1984[23] Reilly S.S., Roach J.W.: Improved visual design for graphic display. IEEE CG&A, 4(2), 42-51.[24] Sowa J.F.: Conceptual Structures: Information Processing in Mind and Machine. Addison Wesley,
Menlo Park, CA.
1985[25] Cleveland W.S.: The Elements of Graphing Data. Wadsworth, Monterey, CA.[26] Mackinlay J., Genesereth M.R.: Expressiveness and language choice. Data & Knowledge Engineer-
ing, 1, 17-29.[27] Martin J., McClure C.: Diagramming Techniques for Analysts and Programmers. Prentice Hall,
Englewood Cliffs, NJ.
1986[28] Chang S.-K., Ichikawa T., Ligomenides P.A. (Eds.): Visual Languages. Plenum Press, New York.[29] Mackinlay J.: Automating the design of graphical presentations of relational information. ACM
Trans. on Graphics, 5(2), 110-141.

Zenon Kulpa 29
Machine GRAPHICS & VISION vol. 3, nos. 1/2, 1994, pp. 77-103.
[30] Rit J.-F.: Propagating temporal constraints for scheduling. Proc. Fifth National Conf. on AI(AAAI-86), Morgan Kaufmann, Los Altos, CA, 383-388.
1987[31] Larkin J.H., Simon H.A.: Why a diagram is (sometimes) worth ten thousand words. Cognitive
Science, 11, 65-99.
1988[32] Brown M.H.: Algorithm Animation. MIT Press, Cambridge, MA.[33] Harel D.: On visual formalisms. Comm. ACM, 31(5), 514-530.[34] Myers B.A.: Creating User Interfaces by Demonstration. Academic Press, Boston, MA.[35] Shu N.-C.: Visual Programming. Van Nostrand Reinhold, New York.[36] Winslett M.: Reasoning about actions using a possible models approach. Proc. AAAI-88: Seventh
National Conf. on Artificial Intelligence. Morgan Kaufmann, San Mateo, CA, 89-93.
1989[37] Cox P.T., Giles F.R., Pietrzykowski T.: Prograph: a step towards liberating programming from
textual conditioning. Proc. 1989 IEEE Workshop on Visual Languages. IEEE Computer SocietyPress, Washington, D.C., 150-156.
[38] Kuipers B.: Qualitative reasoning: modelling and simulation with incomplete knowledge. Auto-matica, 25(4), 571-585.
[39] MacNeil R.: TYRO: a constraint-based graphic designer’s apprentice. Proc. 1989 IEEE Workshop onVisual Languages. IEEE Computer Society Press, Washington, D.C., 24-29.
[40] Tufte E.R.: Envisioning Information. Graphics Press, Cheshire, CT.
1990[41] Brachman R.J.: The future of knowledge representation – Extended abstract. Proc. 8th National
Conf. on AI (AAAI-90)., AAAI Press/The MIT Press, Menlo Park, CA/Cambridge, MA, 1082-1092.[42] Brandenburg F.J.: Nice drawings of graphs are computationally hard. In: Gorny P., Tauber M.J.
(Eds.): Visualization in Human-Computer Interaction. Springer-Verlag, Berlin, 1-15.[43] Chandrasekaran B., Narayanan N. Hari: Integrating imagery and visual representations. Proc. 12th
Annual Conf. of the Cognitive Science Society. Lawrence Erlbaum Associates, Hillsdale, NJ,670-677.
[44] Chang S.-K. (Ed.): Principles of Visual Programming Systems. Prentice Hall, Englewood Cliffs, NJ.[45] Furnas G.W.: Formal models for imaginal deduction. Proc. 12th Annual Conf. of the Cognitive
Science Society. Lawrence Erlbaum, Hillsdale, NJ, 662-669.[46] Glinert E.P. (Ed.): Visual Programming Environments, Vol. I: Paradigms and Systems, Vol. II:
Applications and Issues. IEEE Computer Society Press, Washington, DC.[47] Joshi S., Chang T.-C.: Feature extraction and feature based design approaches in the development
of design interface for process planning. J. of Intelligent Manufacturing 1(1), 1-15.[48] Kaufman A. (Ed.): Proc. First IEEE Conf. on Visualization (Visualization'90). IEEE Computer
Society Press, Los Alamitos, CA.[49] Kimura T.D., Choi J.W., Mack J.M.: Show and Tell: a visual programming language. In: Glinert E.P.
(Ed.): Visual Programming Environments, Vol. I: Paradigms and Systems. IEEE Computer SocietyPress, Washington, DC, 397-404.
[50] MacNeil R.: Adaptive perspectives: case-based reasoning with TYRO, the graphic designer’sapprentice, Proc. 1990 IEEE Workshop on Visual Languages. IEEE Computer Society Press,Washington, D.C., 138-142.
[51] Myers B.A.: Taxonomies of visual programming and program visualization, J. of Visual Languagesand Computing, 1(1), 97-123.
[52] Najork M.A., Golin E.: Enhancing Show and Tell with a polymorphic type system and higher-orderfunctions. Proc. 1990 IEEE Workshop on Visual Languages. IEEE Computer Society Press, Wash-ington, D.C., 215-220.
30 Diagrammatic representation and reasoning
Machine GRAPHICS & VISION vol. 3, nos. 1/2, 1994, pp. 77-103.
[53] Roth S.F., Mattis J.: Data characterization for intelligent graphics presentation. In: Human Factorsin Computing Systems - VII (Proc. of the Conf. on Computer-Human Interaction (CHI’90)). ACMPress, 193-200.
1991[54] Barwise J., Etchemendy J.: Visual information and valid reasoning. In: Zimmerman A., Cunningham
S. (Eds.): Visualization in Teaching and Learning Mathematics. Mathematical Assoc. of America,Washington, DC, 9-24.
[55] Casner S.M.: A task-analytic approach to the automated design of graphic presentations. ACMTrans. on Graphics, 10(2), 111-151.
[56] Forbus K.D., Nielsen P., Faltings B.: Qualitative spatial reasoning: the CLOCK project. AI, 51(1-3),417-471.
[57] Halpern J.Y., Yardi M.Y.: Model checking vs. theorem proving: a manifesto. In: Fikes A.R.,Sandewall E. (Eds.): Principles of Knowledge Representation and Reasoning. Morgan Kaufmann,San Mateo, CA.
[58] Joskowicz L., Sacks E.P.: Computational kinematics, AI, 51(1-3), 381-416.[59] Marks J.: A formal specification for network diagrams that facilitates automated design. J. of Visual
Languages and Computing, 2(4), 395-414.[60] Narayanan N. Hari, Chandrasekaran B.: Reasoning visually about spatial interactions. Proc. 12th
IJCAI. Morgan Kaufmann, Mountain View, CA.[61] Roth S.F., Mattis J.: Automating the presentation of information. Proc. IEEE Conf. on Artificial
Intelligence Applications, IEEE Press.[62] Tye M.: The Imagery Debate. MIT Press, Cambridge, MA.[63] Yip K.M.-K.: Understanding complex dynamics by visual and symbolic reasoning. AI, 51(1-3),
179-222.
1992[64] Furnas G.W.: Reasoning with diagrams only. In: Narayanan N. Hari (Ed.): AAAI Spring Symposium
on Reasoning with Diagrammatic Representations. AAAI, Stanford, CA.[65] Koedinger K.R.: Emergent properties and structural constraints: Advantages of diagrammatic
representations for reasoning and learning. In: Narayanan, N. Hari (Ed.): AAAI Spring Symposiumon Reasoning with Diagrammatic Representations. AAAI, Stanford, CA.
[66] Kulpa Z., Sobolewski M.: Knowledge-directed graphical and natural language interface with aknowledge-based concurrent engineering environment. Proc. CARs & FOF: 8th InternationalConference on CAD/CAM, Robotics and Factories of the Future. Metz, France, 238-248.
[67] Narayanan N. Hari (Ed.): AAAI Spring Symposium on Reasoning with Diagrammatic Representa-tions: Working Notes. AAAI, Stanford, CA.
[68] Van Baalen K.: Automated design of specialized representations. AI, 54, 121-198.
1993[69] Chandrasekaran B., Narayanan N. Hari, Iwasaki Y.: Reasoning with diagrammatic representations:
a report on the Spring Symposium. AI Magazine, 14(2).[70] Hammer E.: Representing relations diagrammatically. In: Allwein G., Barwise J. (Eds.): Working
Papers on Diagrams and Logic. Preprint IULG-93-24, Indiana Univ., Bloomington, IN, 77-119.[71] Hammer E.: Reasoning with sentences and diagrams. In: Allwein G., Barwise J. (Eds.): Working
Papers on Diagrams and Logic. Preprint IULG-93-24, Indiana Univ., Bloomington, IN, 120-143.[72] Price B.A, Baecker R.M., Small I.S.: A principled taxonomy of software visualization. J. Visual
Languages and Computing, 4(3), 211-266.[73] Tessler S., Iwasaki Y., Law K.H.: REDRAW – Diagrammatic reasoning system for qualitative
structural analysis. Third Internat. Conf. on the Application of AI to Civil and StructuralEngineering (submitted).
[74] Wang D., Lee J.R.: Visual reasoning: its formal semantics and applications. J. Visual Languages andComputing, 4(4), 327-356.