zero emission bay area (zeba) fuel cell bus demonstration … · 2015-07-01 · notice. this report...
TRANSCRIPT

NREL is a national laboratory of the U.S. Department of Energy Office of Energy Efficiency & Renewable Energy Operated by the Alliance for Sustainable Energy, LLC This report is available at no cost from the National Renewable Energy Laboratory (NREL) at www.nrel.gov/publications.
Contract No. DE-AC36-08GO28308
Zero Emission Bay Area (ZEBA) Fuel Cell Bus Demonstration Results: Fourth Report Leslie Eudy and Matthew Post National Renewable Energy Laboratory
Technical Report NREL/TP-5400-63719 July 2015

NREL is a national laboratory of the U.S. Department of Energy Office of Energy Efficiency & Renewable Energy Operated by the Alliance for Sustainable Energy, LLC This report is available at no cost from the National Renewable Energy Laboratory (NREL) at www.nrel.gov/publications.
Contract No. DE-AC36-08GO28308
National Renewable Energy Laboratory 15013 Denver West Parkway Golden, CO 80401 303-275-3000 • www.nrel.gov
Zero Emission Bay Area (ZEBA) Fuel Cell Bus Demonstration Results: Fourth Report Leslie Eudy and Matthew Post National Renewable Energy Laboratory
Prepared under Task No. HT12.8210
Technical Report NREL/TP-5400-63719 July 2015

NOTICE
This report was prepared as an account of work sponsored by an agency of the United States government. Neither the United States government nor any agency thereof, nor any of their employees, makes any warranty, express or implied, or assumes any legal liability or responsibility for the accuracy, completeness, or usefulness of any information, apparatus, product, or process disclosed, or represents that its use would not infringe privately owned rights. Reference herein to any specific commercial product, process, or service by trade name, trademark, manufacturer, or otherwise does not necessarily constitute or imply its endorsement, recommendation, or favoring by the United States government or any agency thereof. The views and opinions of authors expressed herein do not necessarily state or reflect those of the United States government or any agency thereof.
This report is available at no cost from the National Renewable Energy Laboratory (NREL) at www.nrel.gov/publications.
Available electronically at SciTech Connect http:/www.osti.gov/scitech
Available for a processing fee to U.S. Department of Energy and its contractors, in paper, from:
U.S. Department of Energy Office of Scientific and Technical Information P.O. Box 62 Oak Ridge, TN 37831-0062 OSTI http://www.osti.gov Phone: 865.576.8401 Fax: 865.576.5728 Email: [email protected]
Available for sale to the public, in paper, from:
U.S. Department of Commerce National Technical Information Service 5301 Shawnee Road Alexandria, VA 22312 NTIS http://www.ntis.gov Phone: 800.553.6847 or 703.605.6000 Fax: 703.605.6900 Email: [email protected]
Cover photos by Dennis Schroeder: (left to right) NREL 26173, NREL 18302, NREL 19758, NREL 29642, NREL 19795. Bus photo by Leslie Eudy, NREL.
NREL prints on paper that contains recycled content.

iii
This report is available at no cost from the National Renewable Energy Laboratory (NREL) at www.nrel.gov/publications.
Acknowledgments This evaluation at Alameda-Contra Costa Transit District (AC Transit) would not have been possible without the support and cooperation of many people. The authors thank the following individuals:
U.S. Department of Energy (DOE) Jason Marcinkoski
U.S. Department of Transportation Federal Transit Administration Christina Gikakis Sean Ricketson
DOE’s National Renewable Energy Laboratory Keith Wipke Jen Kurtz
AC Transit Salvador Llamas Chris Durant Roland Fecteau Jose Vega Sergio Moreno and many others
US Hybrid Abas Goodarzi Reza Sarhadi-Nia Matthew Riley
EnerDel Tomasz Poznar
Golden Gate Transit Steve Miller
Santa Clara Valley Transportation Authority Arthur Douwes Jim Wilhelm Christian Reif
San Mateo Transportation Agency David Olmeda Jerie Moeller
Linde Nitin Natesan Kyle McKeown
Center for Transportation and the Environment Erik Bigelow
Unless otherwise noted, all photos and illustrations by L. Eudy, NREL

iv
This report is available at no cost from the National Renewable Energy Laboratory (NREL) at www.nrel.gov/publications.
Acronyms and Abbreviations AC Transit Alameda-Contra Costa Transit District Ah amp-hours CARB California Air Resources Board DGE diesel gallon equivalent DOE U.S. Department of Energy FCEB fuel cell electric bus FCEV fuel cell electric vehicle FCPP fuel cell power plant ft feet FTA Federal Transit Administration GVWR gross vehicle weight rating hp horsepower HVAC heating, ventilation, and air conditioning in. inches kg kilograms kW kilowatts kWh kilowatt hours lb pounds MBRC miles between roadcalls mpg miles per gallon mph miles per hour NREL National Renewable Energy Laboratory PMI preventive maintenance inspection psi pounds per square inch RC roadcall SI International System of Units ZBus zero emission bus ZEBA Zero Emission Bay Area

v
This report is available at no cost from the National Renewable Energy Laboratory (NREL) at www.nrel.gov/publications.
Executive Summary This report presents results of a demonstration of fuel cell electric buses (FCEB) operating in Oakland, California. Alameda-Contra Costa Transit District (AC Transit) leads the Zero Emission Bay Area (ZEBA) demonstration, which includes 12 advanced-design fuel cell buses and two hydrogen fueling stations. The FCEBs in service at AC Transit are 40-foot, low-floor buses built by Van Hool with a hybrid electric propulsion system that includes a US Hybrid fuel cell power system and EnerDel lithium-based energy storage system. The buses began revenue service in May 2010.
The ZEBA demonstration is the largest FCEB demonstration in the United States and involves five participating transit agencies.1 The ZEBA partners are collaborating with the U.S. Department of Energy (DOE) and DOE’s National Renewable Energy Laboratory (NREL) to evaluate the buses in revenue service. NREL has been evaluating FCEBs under funding from DOE and the U.S. Department of Transportation’s Federal Transit Administration (FTA). NREL uses a standard data-collection and analysis protocol originally developed for DOE heavy-duty vehicle evaluations.2 NREL has published three previous reports—in August 2011,3 July 2012,4 and May 20145—describing operation of these buses. New results in this report provide an update covering data from November 2013 through December 2014.
The focus of this evaluation is to compare performance of the FCEBs to that of conventional technology and to track progress over time toward meeting the technical targets set by DOE and FTA. In the commercialization process that begins at technology readiness level (TRL) 1—basic research/concept—and ends at TRL 9—commercial deployment, NREL considers the ZEBA buses to be at TRL 7. At this point of development, the manufacturers’ goals for the demonstration are to verify that the FCEB performance meets the technical targets and identify any issues that need to be resolved. NREL collects data on two different conventional bus types for a baseline comparison at AC Transit: Van Hool diesel buses that are the same model as the FCEBs and newer Gillig diesel buses.
Since the last report, there have been multiple accomplishments.
• The FCEBs have operated 969,145 miles and 110,832 hours on the fuel cell power systems and have used 122,944 kg of hydrogen.
• The Oakland hydrogen station was completed and a portion of the fleet was moved to operate out of that division. The station, designed and built by Linde, features dispensers
1 Participating agencies include AC Transit, Golden Gate Transit, Santa Clara Valley Transportation Authority, San Mateo County Transit District, and San Francisco Municipal Transportation Agency. 2 Fuel Cell Transit Bus Evaluations: Joint Evaluation Plan for the U.S. Department of Energy and the Federal Transit Administration, NREL/MP-560-49342-1, November 2010, http://www.nrel.gov/docs/fy11osti/49342-1.pdf. 3 Zero Emission Bay Area (ZEBA) Fuel Cell Bus Demonstration: First Results Report, NREL/TP-5600-52015, August 2011, http://www.nrel.gov/docs/fy11osti/52015.pdf. 4 Zero Emission Bay Area (ZEBA) Fuel Cell Bus Demonstration: Second Results Report, NREL/TP-5600-55367, July 2012, http://www.nrel.gov/docs/fy12osti/55367.pdf. 5 Zero Emission Bay Area (ZEBA) Fuel Cell Bus Demonstration Results: Third Report, NREL/TP-5400-60527, May 2014, http://www.nrel.gov/docs/fy14osti/60527.pdf.
vi
This report is available at no cost from the National Renewable Energy Laboratory (NREL) at www.nrel.gov/publications.
in-line with the diesel fueling island, which allows the FCEBs to be integrated into the standard process for prepping buses for the next morning pull-out.
• The twelve fuel cell power plants (FCPP) continue to accumulate high hours of service. One FCPP has surpassed the DOE/FTA 2016 target of 18,000 hours, accumulating 18,299 hours by the end of the data period for the report. This is a record number of hours documented to date on a fuel cell in a transit application. Of the remaining FCPPs, 71% have surpassed 9,000 hours.
• AC Transit and its manufacturer partners continue to ramp up service of the FCEBs, including troubleshooting, maintenance, and training for all involved. The buses are now being operated on any route out of the two depots that are serviced by 40-foot buses (with the exception of commuter routes).
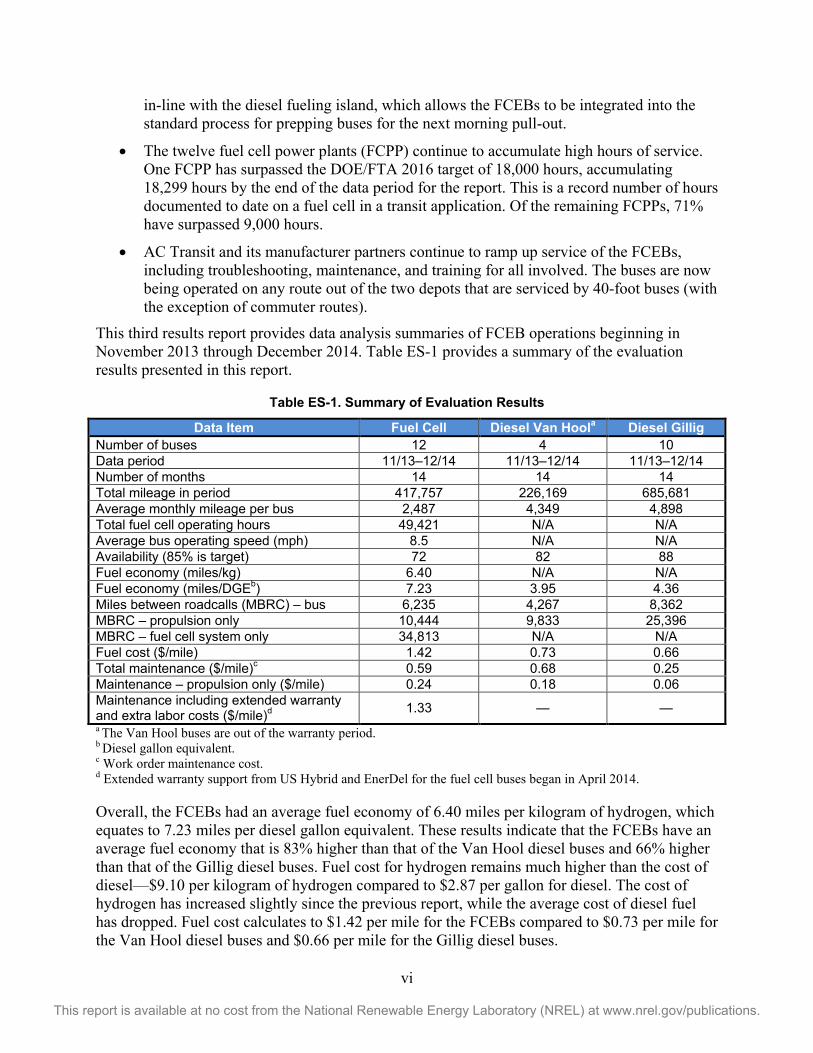
This third results report provides data analysis summaries of FCEB operations beginning in November 2013 through December 2014. Table ES-1 provides a summary of the evaluation results presented in this report.
Table ES-1. Summary of Evaluation Results
Data Item Fuel Cell Diesel Van Hoola Diesel Gillig Number of buses 12 4 10 Data period 11/13–12/14 11/13–12/14 11/13–12/14 Number of months 14 14 14 Total mileage in period 417,757 226,169 685,681 Average monthly mileage per bus 2,487 4,349 4,898 Total fuel cell operating hours 49,421 N/A N/A Average bus operating speed (mph) 8.5 N/A N/A Availability (85% is target) 72 82 88 Fuel economy (miles/kg) 6.40 N/A N/A Fuel economy (miles/DGEb) 7.23 3.95 4.36 Miles between roadcalls (MBRC) – bus 6,235 4,267 8,362 MBRC – propulsion only 10,444 9,833 25,396 MBRC – fuel cell system only 34,813 N/A N/A Fuel cost ($/mile) 1.42 0.73 0.66 Total maintenance ($/mile)c 0.59 0.68 0.25 Maintenance – propulsion only ($/mile) 0.24 0.18 0.06 Maintenance including extended warranty and extra labor costs ($/mile)d 1.33 — — a The Van Hool buses are out of the warranty period. b Diesel gallon equivalent. c Work order maintenance cost. d Extended warranty support from US Hybrid and EnerDel for the fuel cell buses began in April 2014.
Overall, the FCEBs had an average fuel economy of 6.40 miles per kilogram of hydrogen, which equates to 7.23 miles per diesel gallon equivalent. These results indicate that the FCEBs have an average fuel economy that is 83% higher than that of the Van Hool diesel buses and 66% higher than that of the Gillig diesel buses. Fuel cost for hydrogen remains much higher than the cost of diesel—$9.10 per kilogram of hydrogen compared to $2.87 per gallon for diesel. The cost of hydrogen has increased slightly since the previous report, while the average cost of diesel fuel has dropped. Fuel cost calculates to $1.42 per mile for the FCEBs compared to $0.73 per mile for the Van Hool diesel buses and $0.66 per mile for the Gillig diesel buses.

vii
This report is available at no cost from the National Renewable Energy Laboratory (NREL) at www.nrel.gov/publications.
The overall availability for the FCEBs has dropped compared to what was documented in the last report—72% compared to 82% from the previous data period. This is primarily due to extended downtime (not related to the fuel cell system) for two of the buses. The issues proved challenging to diagnose and resulted in the buses being out of service for much of the evaluation period presented in this report. The Van Hool diesel buses achieved an availability of 82% and the Gillig diesel buses had an availability of 88% during the period.
Reliability, measured as miles between roadcall (MBRC), continues to show improvement. When evaluating cumulative totals since the buses first went into service, the overall bus MBRC for the ZEBA buses is showing a slow increase over time and has surpassed the target of 4,000 miles. The fuel cell MBRC shows a steady increase and has passed the DOE/FTA 2016 target of 15,000 miles and is nearing the ultimate target of 20,000 miles.
In addition to the analysis of the FCEB performance, NREL provides a cost analysis and comparison. The current costs for FCEB technology—both capital and operating costs—are still much higher than the costs of conventional diesel technology. This is expected when comparing a very mature technology, like diesel, to new technologies in the development stage. The FCEBs are now out of the original warranty period resulting in an increase in operating costs. AC Transit has negotiated agreements with US Hybrid and EnerDel for extended warranty support.
Total maintenance costs per mile for the FCEBs during the reporting period were 13% lower than that of the Van Hool diesel buses. This is expected, considering the Van Hool buses are out of warranty and have accumulated a total mileage more than 4 times that of the FCEBs. The FCEB maintenance costs were more than 2 times higher than that of the new Gillig diesel buses. Throughout the demonstration, the ZEBA buses have incurred some costs that fall outside of the typical maintenance costs. These include labor for shuttling buses between depots, research/training activities, and fueling the buses. These are considered non-recurring costs for the FCEBs attributed primarily to the learning curve for maintenance staff. The non-recurring costs for the ZEBA fleet have dropped dramatically over the last year and add only $0.05 per mile to the operating cost of the buses for the evaluation period in this report. Once the Emeryville maintenance bay is completed, shuttling the buses between depots will not be necessary and the costs for all non-recurring activities should be completely eliminated. When factoring in the costs for the extended warranties and other costs, the current cost to operate the FCEBs comes to $1.33 per mile.
During the data period, one bus had a bus-related issue that kept it out of service for 14 months. The bus was repaired and went back into service in December 2014. The intermittent nature of the problem made diagnosis a challenge and resulted in the extended downtime. That bus accumulated fewer than 1,000 miles during the data period, resulting in performance that was not representative of that of the overall fleet. The performance indicators of monthly miles, availability, and costs were significantly affected by the downtime of this bus. If this bus is removed from the analysis results, the average monthly mileage increases from 2,487 to 2,707, the availability increases from 72% to 78%, and the maintenance cost decreases from $0.59 per mile to $0.48 per mile.

viii
This report is available at no cost from the National Renewable Energy Laboratory (NREL) at www.nrel.gov/publications.
Although the performance of FCEBs has improved over time, there are still challenges that must be addressed before the technology can be considered commercial. Challenges include the following:
• Increasing durability and reliability of components
• Improving systems integration and optimization
• Providing for adequate parts supply
• Lowering cost—both capital and operating.
DOE and FTA published performance and cost targets for FCEBs. These targets, established with industry input, include interim targets for 2016 and ultimate targets for commercialization. Table ES-2 summarizes the current performance results of the ZEBA buses compared to these targets.
Table ES-2. Summary of FCEB Performance Compared to DOE/FTA Targets6
Units This Reporta 2016
Target Ultimate Target
Bus lifetime years/miles 4/ 54,400–98,900b 12/500,000 12/500,000
Power plant lifetimec hours 7,800–18,300d 18,000 25,000 Bus availability % 72 85 90 Fuel fillse per day 1 1 (<10 min) 1 (<10 min) Bus costf $ 2,500,000g 1,000,000 600,000 Power plant costc,f $ N/Ah 450,000 200,000 Hydrogen storage cost $ N/Ah 75,000 50,000
Roadcall frequency (bus/fuel cell system)
miles between roadcalls
6,200/ 34,800
3,500/ 15,000
4,000/ 20,000
Operation time hours per
day/days per week
7–14/ 5–7 20/7 20/7
Scheduled and unscheduled maintenance costi
$/mile 0.59 0.75 0.40
Range miles 244j 300 300
Fuel economy miles per diesel gallon equivalent 7.23 8 8
a Summary of the results for the ZEBA buses in this report: data from November 2013 to December 2014. b Accumulated totals for the ZEBA buses through December 2014; these buses have not reached end of life; targets are for lifetime. c For the DOE/FTA targets, the power plant is defined as the fuel cell system and the battery system. The fuel cell system includes supporting subsystems such as the air, fuel, coolant, and control subsystems. Power electronics, electric drive, and hydrogen storage tanks are excluded. d The status for power plant hours is for the fuel cell system only; battery lifetime hours were not available.
6 Fuel Cell Technologies Program Record # 12012, September 12, 2012, http://www.hydrogen.energy.gov/pdfs/12012_fuel_cell_bus_targets.pdf.

ix
This report is available at no cost from the National Renewable Energy Laboratory (NREL) at www.nrel.gov/publications.
e Multiple sequential fuel fills should be possible without an increase in fill time. f Cost targets are projected to a production volume of 400 systems per year. This production volume is assumed for analysis purposes only and does not represent an anticipated level of sales. g AC Transit’s per-bus purchase price for the ZEBA buses. h Capital costs for subsystems are not currently reported by the manufacturers. i Excludes mid-life overhaul of the power plant. j Based on fuel economy and useful fuel tank capacity. AC Transit reports lower real-world range.

x
This report is available at no cost from the National Renewable Energy Laboratory (NREL) at www.nrel.gov/publications.
Table of Contents Introduction ................................................................................................................................................. 1
ZEBA Fuel Cell Bus Demonstration ...................................................................................................... 1 FCEB Development Process—Technology Readiness Levels .............................................................. 4 Bus Technology Descriptions ................................................................................................................... 6 Fueling and Maintenance Facilities ........................................................................................................... 8
Emeryville Hydrogen Station ................................................................................................................. 8 Oakland Seminary Division Hydrogen Fueling ................................................................................... 10 Maintenance Facilities .......................................................................................................................... 12 Summary of Fueling Data .................................................................................................................... 12
Implementation Experience ..................................................................................................................... 15 Operational Changes ............................................................................................................................ 15 Transition of Maintenance to Transit Staff .......................................................................................... 15 Extended Warranty Support ................................................................................................................. 15 Challenges ............................................................................................................................................ 17 Progress Toward Meeting Technical Targets for Fuel Cell Systems ................................................... 18
Evaluation Results .................................................................................................................................... 20 Route Assignments ............................................................................................................................... 20 Bus Use and Availability ...................................................................................................................... 20 Fuel Economy and Cost ....................................................................................................................... 24 Roadcall Analysis ................................................................................................................................. 27 Maintenance Analysis .......................................................................................................................... 28
Total Work Order Maintenance Costs ........................................................................................... 28 Work Order Maintenance Costs Categorized by System ............................................................... 32 Propulsion-Related Work Order Maintenance Costs ..................................................................... 33 Total Project Costs ......................................................................................................................... 35
What’s Next for ZEBA ............................................................................................................................... 37 Contacts ..................................................................................................................................................... 38 References and Related Reports ............................................................................................................. 39 Appendix A: TRL Guideline Table ........................................................................................................... 40 Appendix B: ZEBA Fleet Summary Statistics ........................................................................................ 41 Appendix C: ZEBA Fleet Summary Statistics—SI Units ....................................................................... 47 Appendix D: ZEBA Monthly Maintenance Analysis Graphs ................................................................. 48 Appendix E: Diesel Fleet Summary Statistics ....................................................................................... 50 Appendix F: Diesel Fleet Summary Statistics—SI Units ....................................................................... 55 Appendix G: Diesel Monthly Labor Hour Graphs .................................................................................. 56

1
This report is available at no cost from the National Renewable Energy Laboratory (NREL) at www.nrel.gov/publications.
Introduction Alameda-Contra Costa Transit District (AC Transit) is leading a demonstration of fuel cell electric buses (FCEBs) in the San Francisco Bay Area of California. The Zero Emission Bay Area (ZEBA) demonstration includes 12 advanced-design fuel cell buses and two hydrogen fueling stations. The buses began revenue service in May 2010.This is the largest FCEB demonstration in the United States.
Several Bay Area transit agencies—including Golden Gate Transit, Santa Clara Valley Transportation Authority, and San Mateo County Transit District—participate in the ZEBA demonstration. The agencies provide funding as well as participate in data sharing discussions and training activities. Golden Gate Transit also operated one of the ZEBA buses in its service for several months to gain experience with the technology.
The ZEBA partners are collaborating with the U.S. Department of Energy (DOE) and DOE’s National Renewable Energy Laboratory (NREL) to evaluate the buses in revenue service. NREL has been evaluating FCEBs under funding from DOE and the U.S. Department of Transportation’s Federal Transit Administration (FTA). NREL uses a standard data-collection and analysis protocol originally developed for DOE heavy-duty vehicle evaluations. This protocol was documented in a joint evaluation plan for transit bus evaluations.7 The objectives of these evaluations are to provide comprehensive, unbiased evaluation results of fuel cell bus development and performance compared to conventional baseline vehicles. NREL published three earlier reports on this demonstration in August 2011, July 2012, and May 2014.8 This report is an update to the previous reports and focuses on data from November 2013 through December 2014.
ZEBA Fuel Cell Bus Demonstration The California Air Resources Board’s (CARB) 2000 “Fleet Rule for Transit Agencies”9 has been the primary reason for demonstrations of FCEBs in the state of California. This rule set more stringent emission standards for new urban bus engines and promoted advances in the cleanest technologies, specifically zero-emission buses (ZBus). Under the rule, agencies with more than 200 buses must include ZBuses as 15% of new bus purchases. The effective date of this purchase requirement is currently under consideration by CARB and the decision will take into account cost and performance data from this and other FCEB demonstrations. There were two early-generation ZBus demonstrations that began in the mid-2000s and paved the way for the more advanced-design buses that are in service today.
In 2006, CARB updated the transit rule and added a requirement for an advanced zero-emission bus demonstration for the larger California agencies. As a result, the five largest transit agencies in the San Francisco Bay Area formed the ZEBA demonstration group. In addition to the four previously mentioned transit agencies, San Francisco Municipal Transit Authority is a voluntary 7 Fuel Cell Transit Bus Evaluations: Joint Evaluation Plan for the U.S. Department of Energy and the Federal Transit Administration, NREL/MP-560-49342-1, November 2010, http://www.nrel.gov/docs/fy11osti/49342-1.pdf. 8 See the “References and Related Reports” section for links to the three previous reports on the ZEBA Demonstration. 9 Fact Sheet: Fleet Rule for Transit Agencies: Urban Bus Requirements, California Air Resources Board, http://www.arb.ca.gov/msprog/bus/ub/ubfactsheet.pdf.
2
This report is available at no cost from the National Renewable Energy Laboratory (NREL) at www.nrel.gov/publications.
participant because the agency already owns and operates a large fleet of zero-emission electric trolley buses. The ZEBA partners’ operating areas are shown in Figure 1.
The ZEBA demonstration group is supported through funding and planning by the Metropolitan Transportation Commission, the Bay Area Air Quality Management District, CARB, the California Energy Commission, and the FTA (including early funding under the National Fuel Cell Bus Program). AC Transit was awarded a grant in the final round of the National Fuel Cell Bus Program funding. Managed through one of the non-profit consortia—the Center for Transportation and the Environment (CTE)—the $1.8 million award provides funds to support the continued operation of the FCEB fleet.
The goals for the ZEBA demonstration include the following:
• Operating performance: Demonstrate that FCEBs can fulfill or exceed the operating requirements and standards of baseline diesel buses from the perspective of drivers and passengers (i.e., schedule adherence, vehicle handling, and passenger acceptance).
• Fleet availability: Match the “A.M. Pullout” fleet availability percentages of baseline diesel buses with a minimum fleet size of 12 buses.
• Fleet reliability: Match the miles between roadcalls (MBRC) of diesel buses for the bus as a whole and for the propulsion system category with a minimum fleet size of 12 buses.
• Fuel economy: Exceed the fuel economy of baseline diesel buses.
• Infrastructure support: Develop renewable sources of hydrogen, and demonstrate safe fueling systems and throughput (fueling speeds) equivalent to diesel fueling.
• Maintenance costs: Track labor and material costs to compare with baseline diesel buses across applicable expense categories.

3
This report is available at no cost from the National Renewable Energy Laboratory (NREL) at www.nrel.gov/publications.
Figure 1. Map of ZEBA transit partner service areas

4
This report is available at no cost from the National Renewable Energy Laboratory (NREL) at www.nrel.gov/publications.
FCEB Development Process—Technology Readiness Levels In its 2012 annual FCEB status report,10 NREL introduced a guideline for assessing the technology readiness level (TRL) for FCEBs. This guideline was developed using a Technology Readiness Assessment Guide11 published by DOE in September 2011. Figure 2 provides a graphic representation of this process. (Appendix A provides the TRL guideline table tailored for FCEB commercialization.) The guideline considers the FCEB as a whole and does not account for differing TRLs for separate components or sub-systems. Some sub-systems may include off-the-shelf components that are considered commercial, while other sub-systems may feature newly designed components at an earlier TRL.
Figure 2. Graphic representation of the commercialization process developed for FCEBs
FCEB development is currently in the technology demonstration/commissioning phase that includes TRLs 6 through 8. This phase begins the iterative process to validate the design, analyze the results, and reconfigure or optimize the design as needed. The manufacturer typically works with a transit agency partner to conduct in-service tests on the bus. Updates to the design are made based on the performance results, and the buses go back into demonstration and through the cycle until the design meets the performance requirements. This can be a time-consuming process as manufacturers work through technical difficulties.
NREL considers the ZEBA buses to be at TRL 7 because the design of the bus was led by manufacturers experienced with FCEB development and the deployment includes the 12-bus ZEBA fleet. These buses represent a full-scale validation in a relevant environment. At this point in the development, FCEBs are not commercial products. The manufacturers’ goals for the demonstration are to verify that the FCEB performance meets the technical targets and identify any issues that need to be resolved. The current costs for FCEB technology—both capital and operating costs—are still much higher than that of conventional diesel technology. This is expected considering diesel is a very mature technology (TRL 9) and FCEBs are still in the development stage. Once an advanced technology, such as FCEBs, meets the performance
10 Fuel Cell Buses in U.S. Transit Fleets: Current Status 2012, NREL/TP-5600-56406, http://www.nrel.gov/docs/fy13osti/56406.pdf. 11 DOE Technology Readiness Assessment Guide, G 143.3-4a, https://www.directives.doe.gov/directives/0413.3-EGuide-04a/view.

5
This report is available at no cost from the National Renewable Energy Laboratory (NREL) at www.nrel.gov/publications.
targets, the industry can work to reduce costs. This was the case with both compressed natural gas and diesel-hybrid bus technologies when they were first developed.
NREL’s goal in evaluating FCEBs is to document the performance and track progress over time toward meeting the technical targets. NREL collects data on conventional buses at each demonstration site for a baseline comparison. This is important primarily because fuel economy is highly dependent on duty cycle, but also because maintenance practices can be different from site to site. The best comparisons need to include buses operated in similar service at the same operating division. The most accurate comparison would be between buses of the same manufacturer, model, production year, and mileage. In that case, the only difference between the FCEB and baseline buses would be the propulsion system. This type of baseline comparison is not always possible.
NREL collects data on two groups of baseline buses at AC Transit. The first group consists of four Van Hool diesel buses that are the same model as the FCEBs. These buses are the best physical match for the FCEBs; however, they are slightly older, have accumulated 4 times more miles than the FCEBs, and are no longer under warranty. These buses have reached mid-life, and maintenance records have begun to show increased cost typical of this period. The second group consists of ten 40-foot Gillig buses purchased in early 2013. These Gillig buses provide a comparison of the newest diesel technology to the FCEBs. The Gillig buses are younger; however, the mileage of each bus is closer to that of the FCEBs for the evaluation period presented in this report.
6
This report is available at no cost from the National Renewable Energy Laboratory (NREL) at www.nrel.gov/publications.
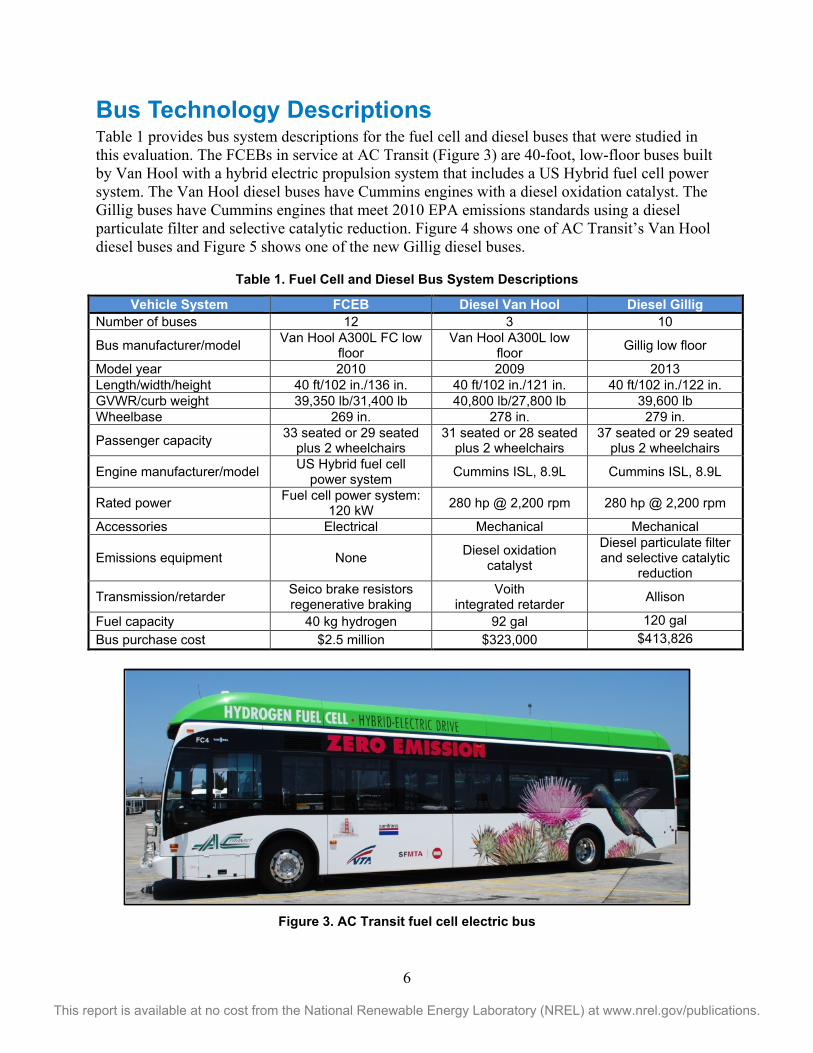
Bus Technology Descriptions Table 1 provides bus system descriptions for the fuel cell and diesel buses that were studied in this evaluation. The FCEBs in service at AC Transit (Figure 3) are 40-foot, low-floor buses built by Van Hool with a hybrid electric propulsion system that includes a US Hybrid fuel cell power system. The Van Hool diesel buses have Cummins engines with a diesel oxidation catalyst. The Gillig buses have Cummins engines that meet 2010 EPA emissions standards using a diesel particulate filter and selective catalytic reduction. Figure 4 shows one of AC Transit’s Van Hool diesel buses and Figure 5 shows one of the new Gillig diesel buses.
Table 1. Fuel Cell and Diesel Bus System Descriptions
Vehicle System FCEB Diesel Van Hool Diesel Gillig Number of buses 12 3 10
Bus manufacturer/model Van Hool A300L FC low floor
Van Hool A300L low floor Gillig low floor
Model year 2010 2009 2013 Length/width/height 40 ft/102 in./136 in. 40 ft/102 in./121 in. 40 ft/102 in./122 in. GVWR/curb weight 39,350 lb/31,400 lb 40,800 lb/27,800 lb 39,600 lb Wheelbase 269 in. 278 in. 279 in.
Passenger capacity 33 seated or 29 seated plus 2 wheelchairs
31 seated or 28 seated plus 2 wheelchairs
37 seated or 29 seated plus 2 wheelchairs
Engine manufacturer/model US Hybrid fuel cell power system Cummins ISL, 8.9L Cummins ISL, 8.9L
Rated power Fuel cell power system: 120 kW 280 hp @ 2,200 rpm 280 hp @ 2,200 rpm
Accessories Electrical Mechanical Mechanical
Emissions equipment None Diesel oxidation catalyst
Diesel particulate filter and selective catalytic
reduction
Transmission/retarder Seico brake resistors regenerative braking
Voith integrated retarder Allison
Fuel capacity 40 kg hydrogen 92 gal 120 gal Bus purchase cost $2.5 million $323,000 $413,826
Figure 3. AC Transit fuel cell electric bus

7
This report is available at no cost from the National Renewable Energy Laboratory (NREL) at www.nrel.gov/publications.
Figure 4. AC Transit Van Hool diesel bus at Emeryville Division
Figure 5. AC Transit Gillig diesel bus. Photo courtesy of AC Transit
Table 2 provides a description of some of the electric propulsion systems for the fuel cell buses. The diesel baseline buses are not hybrids and do not have regenerative braking or energy storage for the drive system. The FCEBs have a fuel cell dominant hybrid electric propulsion system in a series configuration. Van Hool fully integrated the hybrid design using a Siemens ELFA 2 hybrid system; US Hybrid fuel cell power system; and an advanced lithium-based energy storage system by EnerDel.
Table 2. Additional Electric Propulsion System Descriptions
Propulsion Systems Fuel Cell Bus Integrator Van Hool Hybrid type Series, charge sustaining Drive system Siemens ELFA Propulsion motor 2-AC induction, 85 kW each
Energy storage
Battery: EnerDel, lithium ion Rated energy: 21 kWh Rated capacity: 29 Ah Rated power: 76 to 125 kW
Fuel storage Eight roof mounted, Luxfer, type 3 tanks; 5,000 psi rated
Regenerative braking Yes

8
This report is available at no cost from the National Renewable Energy Laboratory (NREL) at www.nrel.gov/publications.
Fueling and Maintenance Facilities To supply hydrogen for the ZEBA demonstration, AC Transit constructed two hydrogen stations: one at the Emeryville Division and another at the Oakland Division. For the earlier FCEB demonstration, AC Transit modified a maintenance bay in the Oakland garage to allow safe maintenance of hydrogen-fueled buses. The agency is in the process of upgrading the garage at Emeryville to include a similar hydrogen-ready bay for maintenance. This section describes the stations at Emeryville and Oakland, outlines plans for the Emeryville maintenance bay upgrade, and provides a summary of fueling data from September 2011 through December 2014.
Emeryville Hydrogen Station AC Transit’s Emeryville hydrogen station, built by Linde LLC, was completed in July 2011 and fully commissioned by the end of August 2011. This station, shown in Figure 6, is a combined facility for light-duty fuel cell electric vehicles (FCEV) and FCEBs. AC Transit reports that engineering and construction costs for the station were $10 million. Funding from the state of California made the light-duty FCEV fueling access possible. Dispensers are available to fuel at 350 and 700 bar pressure.
Figure 6. The Linde hydrogen station at AC Transit’s Emeryville Division
Figure 7 provides a simple block diagram of the station and primary components. Hydrogen is provided from two sources: liquid hydrogen delivery and a solar-powered electrolyzer. Hydrogen from both sources feeds into high-pressure gaseous storage tubes for fueling buses and autos. The electrolyzer is capable of producing 65 kg of hydrogen per day. When combined with the delivered liquid hydrogen, the station has the capacity to dispense up to 600 kg of hydrogen per day.
The station uses two compressors: one is a high-pressure mechanical compressor and the other is an ionic compressor. The mechanical compressor (MF-90) handles the FCEV side of the station and is capable of filling at both 350 and 700 bar. The MF-90 boosts the pressure to 700 bar for the FCEVs that operate at the higher pressure. The station can fully fuel a light-duty vehicle in 3 to 5 minutes depending on vehicle tank capacity.

9
This report is available at no cost from the National Renewable Energy Laboratory (NREL) at www.nrel.gov/publications.
Figure 7. Block diagram of the Emeryville station
The bus fueling side of the station is handled by Linde’s ionic compressor (IC-50). The IC-50 uses a proprietary ionic liquid in place of a mechanical piston. The buses can be fueled quickly—30 kg in about 6 minutes. Figure 8 shows the bus fueling area and a picture of the primary bus dispenser. The station also has a back-up dispenser for the buses in case there are issues with the primary fueling dispenser. AC Transit has a maintenance contract with Linde for 3 years with options for extension. The annual cost for this maintenance and service agreement is approximately $142,000.
Figure 8. Bus fueling at the Emeryville hydrogen station: fueling area (left) and close-up of the bus
dispenser (right)

10
This report is available at no cost from the National Renewable Energy Laboratory (NREL) at www.nrel.gov/publications.
Oakland Seminary Division Hydrogen Fueling AC Transit also contracted with Linde for the newly completed station at the Seminary Division in Oakland. This station is similar in design to the one at Emeryville. The primary differences are as follows:
• The bus dispensers are installed in-line with the diesel fueling island.
• There is no public access for light-duty FCEV fueling because the station is at the back of the property.
• Hydrogen is available at 350 bar pressure only.
• Once installed, the on-site electrolyzer will be powered by a solid oxide fuel cell fueled with directed biogas.12
The Oakland station construction was completed in late 2014 and AC Transit commissioned the station in December. Figure 9 shows a simple block diagram of the primary components of the station. Currently the station is supplied with liquid hydrogen delivery and storage. Eventually, an electrolyzer will be installed to supplement the hydrogen supply. Figure 10 shows the station equipment installed at the Oakland Division as of February 2015.
Figure 9. Block diagram of the Oakland station (as of February 2015)
12 Directed biogas implies a process of injecting purified biomethane (methane/natural gas developed from decaying organic matter) into the natural gas pipeline. Designated customers of the biomethane do not use the identical biomethane but can take credit for using the biomethane when using natural gas from the pipeline.

11
This report is available at no cost from the National Renewable Energy Laboratory (NREL) at www.nrel.gov/publications.
Figure 10. Linde hydrogen station at the Oakland Division
The Oakland station includes one compressor for fueling the buses—a Linde IC-50 ionic compressor. The two dispensers are installed in-line with the diesel fuel island. This is an important step in integrating this new technology into standard transit practice. The ZEBA buses are fueled and prepped for the next day’s service along with all of the diesel buses at the depot. The station can handle back-to-back fuelings, but it does not allow simultaneous fueling from the two dispensers. Figure 11 shows the modified fueling island and extended canopy. Figure 12 shows an up-close picture of one of the dispensers.
Figure 11. Hydrogen dispensers in-line with the diesel fueling island

12
This report is available at no cost from the National Renewable Energy Laboratory (NREL) at www.nrel.gov/publications.
Figure 12. Hydrogen dispenser at the Oakland station
Maintenance Facilities In 2005, AC Transit converted one of the maintenance bays at the Oakland Seminary Division to accommodate hydrogen-fueled buses for the earlier demonstration. This bay is available for the FCEBs. While the fleet was operated out of the Emeryville Division, AC Transit maintenance staff had to shuttle the buses between the divisions, which resulted in additional labor charges. The agency has begun an upgrade at the Emeryville Division to convert two bays for safe maintenance of hydrogen-fueled buses. Once this modification is complete, all maintenance for the buses stationed at Emeryville will be handled there without the need to shuttle the buses between depots. AC Transit reports that the estimated cost to upgrade a maintenance bay is between $300,000 and $350,000.
Summary of Fueling Data The ZEBA buses have been fueled at the Emeryville station since it was commissioned in August 2011. AC Transit began using the Oakland station in December 2014. Figure 13 shows the average daily hydrogen dispensed (for days when hydrogen was dispensed; zero-use days were excluded) by month for the data period beginning in March 2013 through December 2014. The graph includes fuel dispensed from both stations. During this period, the buses were fueled 5,132 times for a total of 99,400 kg of hydrogen. The average amount per fueling was 19.4 kg. Figure 14 tracks the total hydrogen dispensed into the buses each month from March 2013

13
This report is available at no cost from the National Renewable Energy Laboratory (NREL) at www.nrel.gov/publications.
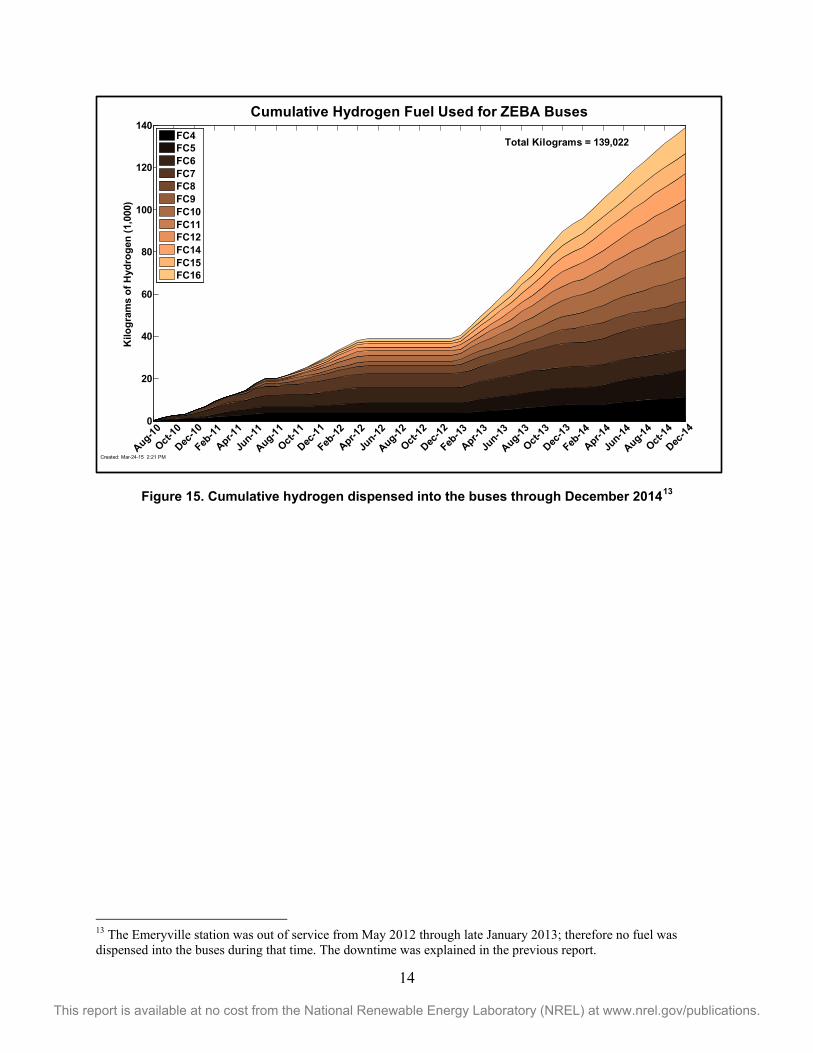
through December 2014. Figure 15 shows the cumulative hydrogen dispensed into the buses since the beginning of the demonstration. Nearly 140,000 kg of hydrogen has been dispensed into the buses since they first began service.
Figure 13. Average hydrogen dispensed per day at AC Transit’s hydrogen stations (excluding 0 kg days)
Figure 14. Total hydrogen dispensed per month at AC Transit’s hydrogen stations
0
20
40
60
80
100
120
140
160
180
200M
ar-1
3
Apr-1
3
May
-13
Jun-
13
Jul-1
3
Aug-
13
Sep-
13
Oct
-13
Nov
-13
Dec
-13
Jan-
14
Feb-
14
Mar
-14
Apr-1
4
May
-14
Jun-
14
Jul-1
4
Aug-
14
Sep-
14
Oct
-14
Nov
-14
Dec
-14
Aver
age
Dai
ly H
ydro
gen
Use
(kg)
0
1,000
2,000
3,000
4,000
5,000
6,000
Mar
-13
Apr-1
3
May
-13
Jun-
13
Jul-1
3
Aug-
13
Sep-
13
Oct
-13
Nov
-13
Dec
-13
Jan-
14
Feb-
14
Mar
-14
Apr-1
4
May
-14
Jun-
14
Jul-1
4
Aug-
14
Sep-
14
Oct
-14
Nov
-14
Dec
-14
Tota
l Hyd
roge
n us
e (k
g)
14
This report is available at no cost from the National Renewable Energy Laboratory (NREL) at www.nrel.gov/publications.
Figure 15. Cumulative hydrogen dispensed into the buses through December 201413
13 The Emeryville station was out of service from May 2012 through late January 2013; therefore no fuel was dispensed into the buses during that time. The downtime was explained in the previous report.
0
20
40
60
80
100
120
140K
ilogr
ams
of H
ydro
gen
(1,0
00)
Cumulative Hydrogen Fuel Used for ZEBA Buses
Aug-10
Oct-10
Dec-10
Feb-11
Apr-11
Jun-11
Aug-11
Oct-11
Dec-11
Feb-12
Apr-12
Jun-12
Aug-12
Oct-12
Dec-12
Feb-13
Apr-13
Jun-13
Aug-13
Oct-13
Dec-13
Feb-14
Apr-14
Jun-14
Aug-14
Oct-14
Dec-14
FC4FC5FC6FC7FC8FC9FC10FC11FC12FC14FC15FC16
Created: Mar-24-15 2:21 PM
Total Kilograms = 139,022

15
This report is available at no cost from the National Renewable Energy Laboratory (NREL) at www.nrel.gov/publications.
Implementation Experience This section focuses on the project partners’ experiences in implementing FCEBs into the fleet including the achievements and challenges encountered since the last report. Project partners include AC Transit and the manufacturers. Over the last year, AC transit has made several changes to the demonstration program to further test the capabilities of the technology.
Operational Changes The FCEB fleet was operated out of the Emeryville Division from August 2011 until November 2014. The new hydrogen station at the Oakland Division was completed in November 2014 and fully commissioned in December 2014. At that time, four buses were transferred from the Emeryville Division to the Oakland Division. Eventually the agency plans to split the fleet to operate eight FCEBs out of Oakland and four out of Emeryville. AC Transit reports that shifting some of the FCEBs back to the Oakland Division went well with very few issues. There were some minor problems with drivers not being familiar with the start-up and shut-down sequence for the buses. That has been addressed with driver training. The agency also plans to add decals to the buses with step-by-step instructions as a reminder for drivers who may not drive the FCEBs every day.
AC Transit continues to work toward full integration of the FCEBs into the standard operation of the fleet. The ultimate goal is to treat the FCEBs the same as the conventional diesel buses. The agency is now allowing the buses to be assigned to any route that 40-foot buses operate on with the exception of commuter routes. All drivers at both depots have been trained to operate the buses to facilitate this random dispatch for the buses.
Transition of Maintenance to Transit Staff The transition of knowledge from the manufacturers to the transit staff is essential to commercializing the technology. During the early stages of the demonstration, an on-site engineer from the fuel cell manufacturer handled preventive maintenance and repair of the more advanced components. This has changed over the last year. AC Transit staff has received training and taken on all preventive maintenance and repair work on the fuel cell buses. AC Transit has assigned a dedicated supervisor and mechanic at each depot to lead the work on the FCEBs. These employees handle the training and bring in other staff as needed. US Hybrid has developed the service and maintenance manual, wireless diagnostic tools, and resources that the agency can use to help troubleshoot issues and perform the repairs on-site. Most manufacturer support will be provided through remote diagnostics.
Extended Warranty Support The ZEBA buses were delivered beginning in 2010 and are now past the original manufacturer warranty period. AC Transit was awarded a $1.8 million grant in the final round of the National Fuel Cell Bus Program funding to support the continued operation of the FCEB fleet. The grant is managed through CTE. Over the last year, CTE has helped AC Transit negotiate agreements with US Hybrid and EnerDel for extended warranty support. AC Transit set up purchase orders with Siemens, VanHool, and Luxfer for parts as needed.
16
This report is available at no cost from the National Renewable Energy Laboratory (NREL) at www.nrel.gov/publications.
US Hybrid support agreement—AC Transit has entered into a 3-year agreement with US Hybrid for support on the fuel cell power plants (FCPPs). The total cost for the agreement is $499,971. US Hybrid provides on-site advisor support that includes monthly site visits to evaluate the FCPPs. During these visits, US Hybrid works with AC Transit staff to inspect and complete any work needed on the FCPPs. The agreement includes four primary tasks:
1. Diagnostics support—remote diagnostics and assistance as needed for issues relating to the FCPPs. US Hybrid developed a troubleshooting manual that includes a diagnostic flow chart to aid AC Transit staff in diagnosing any issues. This manual includes step-by-step instructions on how to retrieve trouble codes, identify failure reasons, and repair the issue. US Hybrid has equipped all of the buses with wireless modules that enable remote access to on-board FCPP diagnostics and data collection. These data are accessible by US Hybrid and AC Transit staff to aid in troubleshooting any issues.
2. Training—US Hybrid will provide two formal training sessions on FCPP diagnostics and safety training. US Hybrid has also provided two laptops with diagnostic software and interconnects to AC Transit to use during the duration of the agreement.
3. Parts and materials—US Hybrid will provide all balance of plant replacement parts needed to maintain each FCPP for revenue service. This includes maintaining an inventory of spare parts at the transit agency. The agreement does not cover the cost of replacing a fuel cell stack if that is needed.
4. Preventive maintenance—AC Transit is responsible for regular preventive maintenance inspections on the FCPPs. US Hybrid provided a schedule for preventive maintenance and trained AC Transit staff to perform tasks.
EnerDel support agreement—AC Transit has a 3-year agreement with EnerDel that covers quarterly field repairs for 13 hybrid system battery packs, on-site visits as needed, and non-warranty repairs or mechanical damage. EnerDel will conduct diagnostics to determine any issues, replace components, and test to verify repairs were successful. The total cost for this agreement is $690,000.
The warranty agreement includes reconditioning of each battery pack beginning in the second quarter of 2014 through the second quarter of 2015. The packs are shipped to EnerDel where they are disassembled and the sub-components are reconditioned and tested. Any units that do not meet specifications are replaced. The fully assembled and tested pack is shipped back to AC Transit to be reinstalled into a bus.
The agreement also includes remanufacturing of the battery packs from the third quarter of 2015 through the fourth quarter of 2016. The remanufacturing process includes replacing all of the cells in the pack, reassembly, and testing. To minimize downtime for the buses, EnerDel has provided a spare battery pack. This pack is owned by EnerDel with all service and maintenance covered at the company’s expense.
17
This report is available at no cost from the National Renewable Energy Laboratory (NREL) at www.nrel.gov/publications.
Challenges Advanced technology demonstrations typically experience challenges and issues that need to be resolved. A few of the issues and status of resolution are provided here.
• Maintenance training and learning curve—To fully integrate an advanced technology into a fleet, a transit agency needs to train all maintenance staff to handle scheduled and unscheduled work on the buses. AC Transit is making major progress in transitioning this work to agency staff. Training all maintenance staff is easier to justify as fleet sizes increase. Mechanics become more comfortable with new technology and procedures with time. Troubleshooting during this stage of development can be challenging, and it is often labor intensive as staff go through the learning curve. This added labor cost typically increases after transit staff takes over maintenance work but drops over time as they become more familiar with the technology.
• Parts supply—AC Transit has had issues in the past with bus components that have a long lead time for delivery, in some cases because they come from outside the United States. These components were not typically stocked and were only ordered when needed. This has changed over time as the project partners have learned what should be kept on hand. Although the parts supply issues have improved, they have not yet been completely resolved. The industry needs to further develop a robust supply chain for these advanced components for FCEBs (as well as other electric drive buses).
• Bus range—AC Transit has had issues with real-world bus range being lower than expected. The agency has reported multiple roadcalls when the low fuel light comes on while an FCEB is in service. This indicator is the same as the low fuel light on many cars and doesn’t necessarily mean the bus is out of fuel. In some cases, the roadcalls are because some drivers have expressed that they are uncomfortable when the low fuel light comes on. AC Transit has recently identified some issues with malfunctioning hydrogen tank valves that could be contributing to this problem. The agency is working with the tank manufacturer to replace the malfunctioning valves.
• Costs—At this point in the development of FCEB technology, costs continue to be high. Capital costs of the buses have dropped from that of early designs at more than $3 million, but they are still much higher than conventional diesel costs. Manufacturers project costs to decrease with larger orders of buses. Operating costs for the FCEBs are also higher due to several factors. As mentioned earlier, maintenance staff is still learning the new technology and spends more time troubleshooting advanced systems. Now that the buses are out of the original warranty period, parts costs have increased dramatically. The costs for advanced-technology parts are also much higher than that of conventional technology. AC Transit has purchased extended warranty agreements with the manufacturers that also add to the cost. This cost curve is typical of any new technology being introduced into the market and is expected to drop over time.
• Extended downtime—AC Transit has experienced issues with specific buses that resulted in long periods of downtime. FC6 was out of service for most of the data period. The issue was originally believed to be a problem with the hybrid system. Troubleshooting proved challenging, but the issue was eventually traced to the bus cooling system. The water pump in the cooling system caused a short in the high voltage
18
This report is available at no cost from the National Renewable Energy Laboratory (NREL) at www.nrel.gov/publications.
system. The bus has been repaired and is back in service. During this timeframe, there were limited technical resources for diagnosing the issue which further extended the downtime period. Another bus, FC8, has had propulsion-system issues that resulted in several failed inductors and caused extended downtime. AC Transit replaced the FCPP with a spare and changed out some hybrid system components and is not seeing the issue. The bus is currently operating with the spare FCPP; however this is not the optimal solution unless the original FCPP has reached the end of life. The agency is working with the manufacturers to identify what caused the issue and determine how to prevent the problem in the future.
Progress Toward Meeting Technical Targets for Fuel Cell Systems Increasing the durability and reliability of the fuel cell system to meet transit requirements continues to be a key challenge. FTA life cycle requirements for a full size transit bus are 12 years or 500,000 miles. Because transit agencies typically rebuild the diesel engines at approximately mid-life, an FCPP should be able to operate for at least half the life of the bus. DOE/FTA have set an early performance target of 4–6 years (or 20,000–30,000 hours) durability for the fuel cell propulsion system. The ZEBA buses continue to demonstrate some of the highest hours for FCEBs in service. As mentioned in previous reports, three of the FCPPs in the ZEBA buses had accumulated hours in service prior to being installed in the new buses. Those three FCPPs continue to operate and accumulate hours in service.
Figure 16 shows the cumulative hours on each FCPP through December 2014. The top FCPP has now achieved more than 18,000 hours of operation without major repair or cell replacements. This is the highest number of FCPP hours documented for a FCEB; it surpasses the 2016 target and moves the technology further toward meeting the ultimate target of 25,000 hours. In all, 64% of these FCPPs (9 out of 14) have surpassed 9,000 hours of operation. Table 3 provides the total hours accumulated on each of the FCPPs since they were installed. The table includes the hours for the spare FCPP as well as the 12 original FCPPs.

19
This report is available at no cost from the National Renewable Energy Laboratory (NREL) at www.nrel.gov/publications.
Figure 16. Cumulative FCPP hours on the ZEBA buses
Table 3. Total Hours Accumulated on the FCPPs
FCPP Date of FCPP Installation
FCPP Hours at Installation
Total Hours through
December 2014 1 8/22/10 59 8,641 2 8/20/10 20 9,869 3 8/1/10 2,915 9,954 4 8/29/10 7,727 18,299 5 11/15/10 6,806 11,909 6 2/22/11 34 9,763 7 3/1/11 20 11,071 8 5/5/11 0 9,969 9 5/12/11 0 9,810 10 8/17/11 0 10,327 11 8/15/11 0 7,839 12 9/30/11 0 9,168
13 (spare) 4/3/14 23 1,419
0
20
40
60
80
100
120
140H
ours
of O
pera
tion
(1,0
00)
Fuel Cell Power Plant Hours of Operation for ZEBA Buses
Aug-10
Oct-10
Dec-10
Feb-11
Apr-11
Jun-11
Aug-11
Oct-11
Dec-11
Feb-12
Apr-12
Jun-12
Aug-12
Oct-12
Dec-12
Feb-13
Apr-13
Jun-13
Aug-13
Oct-13
Dec-13
Feb-14
Apr-14
Jun-14
Aug-14
Oct-14
Dec-14
FCPP 1FCPP 2FCPP 3FCPP 4FCPP 5FCPP 6FCPP 7FCPP 8FCPP 9FCPP 10FCPP 11FCPP 12FCPP 13FCPP 14
Created: Mar-24-15 2:21 PM
Total Hours = 128,635

20
This report is available at no cost from the National Renewable Energy Laboratory (NREL) at www.nrel.gov/publications.
Evaluation Results The results presented in this section are focused on data from November 2013 through December 2014. During that data period, the FCEBs operated 417,757 miles over 49,421 hours of fuel cell operation. This indicates an overall operational speed of 8.5 mph. As mentioned previously, FC6 had an issue that kept it out of service for 14 months. The bus was repaired and went back into service in December 2014. The intermittent nature of the problem made diagnosis a challenge and resulted in the extended downtime. FC6 accumulated fewer than 1,000 miles during the data period, resulting in performance that was not representative of that of the overall fleet. The performance indicators of monthly miles, availability, and costs were significantly affected by the downtime of this bus. The analysis results presented in this section include the overall fleet average as well as the adjusted average with this outlier bus removed.
The diesel baseline buses include four Van Hool buses that are the same model as the FCEBs and ten newer Gillig buses in operation at AC Transit.
Route Assignments The FCEBs have been operating from AC Transit’s Emeryville Division for the majority of the evaluation period presented here. Four buses were transferred to the Oakland Division toward the end of the evaluation period once its fueling station was operational. Earlier in the demonstration, AC Transit operated the fuel cell and Van Hool diesel study buses on a specific set of route blocks on the 18 and 51B local routes. AC Transit has now increased service of the FCEBs to include most routes out of Emeryville, with the exception of any commuter routes such as Transbay service. The buses at the Oakland Division are also randomly dispatched on any of the local routes serviced by 40-foot buses. This is the common practice for most transit agencies. Operating the FCEBs on any route from a depot contributes to full commercialization because it means the technology is closer to being able to replace a conventional diesel bus with little to no operational or service modifications.
The Emeryville Division has 12 local routes that are served by 40-foot buses and the Oakland division has 16. Table 4 provides a summary of the local routes that the FCEBs could be operated on at each of the depots. The data include deadhead as well as in-service time. The average speed at the two depots is similar at around 10 mph.
Table 4. Summary of Local Routes for ZEBA Buses
Depot Routes Blocks Time (h)
Distance (mi)
Average Speed (mph)
Emeryville 12 73 1,095.3 10,888 9.94 Oakland 16 83 957.8 9,946 10.38
Bus Use and Availability Bus use and availability are indicators of reliability. Lower bus usage may indicate downtime for maintenance or purposeful reduction of planned work for the buses. This section summarizes bus usage and availability for the FCEBs and baseline buses.

21
This report is available at no cost from the National Renewable Energy Laboratory (NREL) at www.nrel.gov/publications.
Table 5 summarizes average monthly mileage for the study buses for the data period. Currently, the average monthly operating mileage for the FCEBs is 2,487 miles, which is 43% less than that of the Van Hool diesel buses and 49% less than that of the Gillig diesel buses. If you remove the outlier bus from the calculation, the average monthly mileage rises to 2,707. Figure 17 shows the average monthly mileage for the FCEBs and diesel buses since November 2013 and includes the adjusted data without FC6. The monthly mileage for the FCEBs was consistently over 2,000 per month during the data period with the exception of February 2014. The Emeryville station was out of service for almost two weeks during that month, which resulted in the buses being temporarily pulled from service. The buses need to increase operation to meet a general transit target of 3,000 miles per month.
Table 5. Average Monthly Mileage (Evaluation Period)
Bus Starting Hubodometer
Ending Hubodometer
Total Mileage Months
Average Monthly Mileage
FC4 50,676 78,710 29,103 14 2,079 FC5 52,899 89,892 40,028 14 2,859 FC6 63,740 64,664 924 14 66 FC7 66,128 98,960 32,832 14 2,345 FC8 37,669 54,379 16,710 14 1,194 FC9 40,544 82,595 42,051 14 3,004
FC10 48,343 88,802 40,459 14 2,890 FC11 43,189 84,309 41,120 14 2,937 FC12 39,841 87,352 47,511 14 3,394 FC14 45,331 92,724 47,393 14 3,385 FC15 37,538 69,678 32,140 14 2,296 FC16 35,881 83,367 47,486 14 3,392
Total ZEBA 417,757 168 2,487 ZEBA adjusted (w/o FC6) 416,833 154 2,707
1208 217,599 274,721 40,048 10 4,005 1209 220,257 281,945 61,520 14 4,394 1210 201,820 263,249 61,429 14 4,388 1211 79,648 143,084 63,172 14 4,512
Total VH Diesel 226,169 52 4,349 1338 25,555 91,456 66,143 14 4,725 1339 26,604 95,103 69,676 14 4,977 1340 26,178 98,348 72,170 14 5,155 1341 27,435 98,610 71,175 14 5,084 1342 27,597 98,659 71,062 14 5,076 1343 26,920 87,523 60,609 14 4,329 1344 27,105 98,357 72,243 14 5,160 1345 23,736 90,464 67,820 14 4,844 1346 20,200 87,237 67,215 14 4,801 1347 13,575 81,143 67,568 14 4,826
Total Gillig Diesel 685,681 140 4,898

22
This report is available at no cost from the National Renewable Energy Laboratory (NREL) at www.nrel.gov/publications.
Figure 17. Monthly average miles for the ZEBA FCEBs and diesel buses
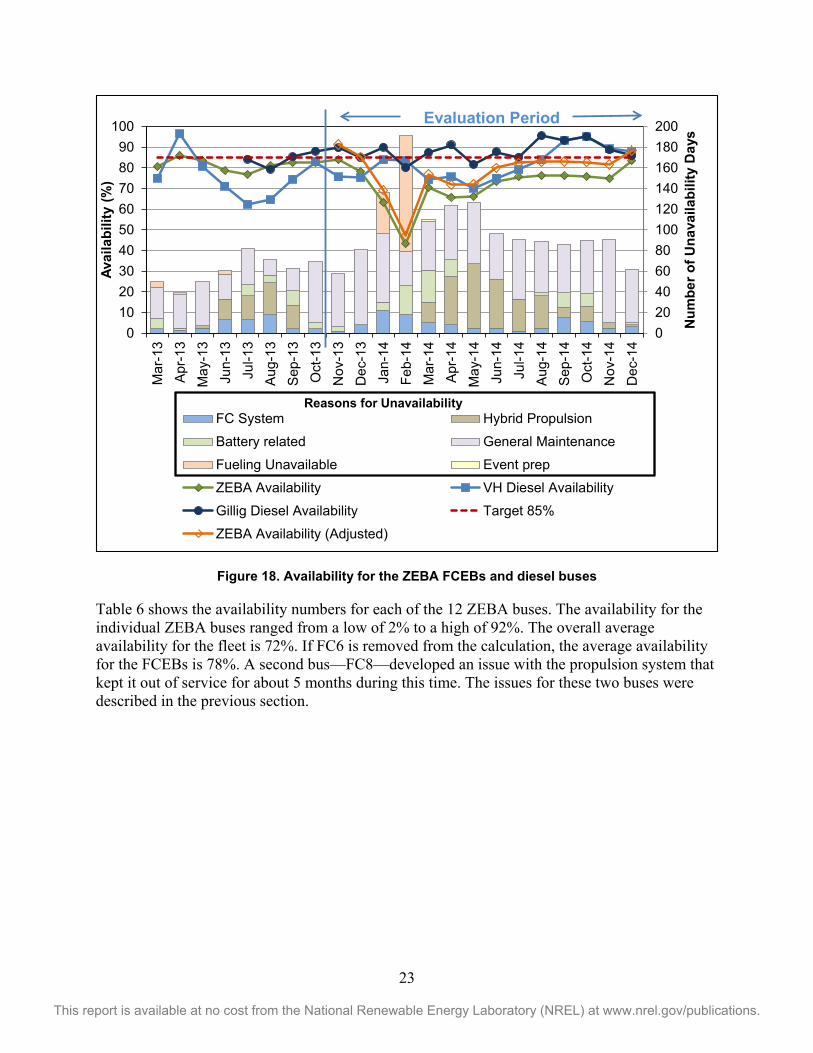
Another measure of reliability is availability—the percentage of days the buses are actually available out of days that the buses are planned for operation. Figure 18 shows availability for the FCEBs (green line) and diesel buses (medium blue line for the Van Hool buses, dark blue line for the Gillig buses) from March 2013 through December 2014. The adjusted average availability for the ZEBA buses without FC6 is also shown in the graph (orange line) to indicate how the extended downtime affected the data. The ZEBA availability for the data period was 72% but it is showing a general upward trend. The figure also provides an indication of the reasons for unavailability. The stacked bars for each month show the number of days the FCEBs were not available by six categories. The unavailability of the Emeryville hydrogen station in late January and early February 2014 lowered the availability of the buses during those two months.
0
1,000
2,000
3,000
4,000
5,000
6,000
Mar
-13
Apr-1
3
May
-13
Jun-
13
Jul-1
3
Aug-
13
Sep-
13
Oct
-13
Nov
-13
Dec
-13
Jan-
14
Feb-
14
Mar
-14
Apr-1
4
May
-14
Jun-
14
Jul-1
4
Aug-
14
Sep-
14
Oct
-14
Nov
-14
Dec
-14
Mon
thly
Mile
s
ZEBA VH Diesel Gillig Diesel ZEBA Adjusted Target
Evaluation Period
23
This report is available at no cost from the National Renewable Energy Laboratory (NREL) at www.nrel.gov/publications.
Figure 18. Availability for the ZEBA FCEBs and diesel buses
Table 6 shows the availability numbers for each of the 12 ZEBA buses. The availability for the individual ZEBA buses ranged from a low of 2% to a high of 92%. The overall average availability for the fleet is 72%. If FC6 is removed from the calculation, the average availability for the FCEBs is 78%. A second bus—FC8—developed an issue with the propulsion system that kept it out of service for about 5 months during this time. The issues for these two buses were described in the previous section.
020406080100120140160180200
0102030405060708090
100
Mar
-13
Apr
-13
May
-13
Jun-
13Ju
l-13
Aug
-13
Sep
-13
Oct
-13
Nov
-13
Dec
-13
Jan-
14Fe
b-14
Mar
-14
Apr
-14
May
-14
Jun-
14Ju
l-14
Aug
-14
Sep
-14
Oct
-14
Nov
-14
Dec
-14
Num
ber o
f Una
vaila
bilit
y D
ays
Avai
labi
lity
(%)
FC System Hybrid Propulsion
Battery related General Maintenance
Fueling Unavailable Event prep
ZEBA Availability VH Diesel Availability
Gillig Diesel Availability Target 85%
ZEBA Availability (Adjusted)
Reasons for Unavailability
Evaluation Period

24
This report is available at no cost from the National Renewable Energy Laboratory (NREL) at www.nrel.gov/publications.
Table 6. Summary of ZEBA Availability by Bus (Evaluation Period)
Bus Planned Days
Available Days
Percent Availability
FC4 426 316 74% FC5 426 339 80% FC6 426 10 2% FC7 426 317 74% FC8 426 158 37% FC9 426 367 86%
FC10 426 394 92% FC11 426 379 89% FC12 426 355 83% FC14 426 387 91% FC15 426 278 65% FC16 426 382 90%
Total ZEBA 5,112 3,682 72% ZEBA adjusted (w/o FC6) 4,686 3,672 78%
Table 7 summarizes the reasons for unavailability for the fuel cell and diesel buses. During this reporting period, the average availability was 72% for the FCEBs, 82% for the Van Hool diesel buses, and 88% for the Gillig buses. Bus-related maintenance (separate from the fuel cell, hybrid, and traction battery systems) is the reason for the highest percentage of unavailability for the ZEBA buses. The availability data for the diesel buses has not been detailed enough to separate out specific reasons for unavailability until around August 2014. NREL should have sufficient data to separate the reasons for the diesel bus unavailability in future reports.
Table 7. Summary of Availability and Unavailability of Buses for Service (Evaluation Period)
Category ZEBA # Days
ZEBA %
VH Diesel # Days
VH Diesel
%
Gillig Diesel # Days
Gillig Diesel
% Planned work days 5,112 1,492 4,260 Days available 3,682 72 1,222 82 3,762 88 Unavailable 1,430 100 270 100 498 100 Fuel cell propulsion 122 6.4 Hybrid propulsion 270 14.1 Traction battery issues 118 6.2 Bus maintenance 766 40.0 270 100 498 100 Fuel unavailable 152 7.9 Event prep 2 0.1
Fuel Economy and Cost As discussed above, hydrogen fuel is provided by two fueling stations designed and constructed by Linde. The Emeryville station was responsible for fueling the buses throughout the data period. The Oakland station began fueling buses in November 2014. For both stations, hydrogen is dispensed at up to 350 bar (5,000 psi). AC Transit employees perform all fueling services for the hydrogen-fueled vehicles. NREL collects fueling records from three sources: electronic

25
This report is available at no cost from the National Renewable Energy Laboratory (NREL) at www.nrel.gov/publications.
records from AC Transit’s Fleet Watch system, electronic fueling records from Linde, and manual logs from AC Transit. These records are merged for the analysis.
Table 8 shows hydrogen and diesel fuel consumption and fuel economy for the study buses during the reporting period. The FCEBs had an overall average fuel economy of 6.40 miles per kilogram of hydrogen, which equates to 7.23 miles per diesel gallon equivalent (DGE). The energy conversion from kilograms of hydrogen to DGE appears at the end of Appendix B. (Appendices B through G contain summary statistics for the ZEBA and diesel buses.) These results indicate that the FCEBs have an average fuel economy that is 83% higher than that of the Van Hool diesel buses and 66% higher than that of the Gillig diesel buses.
Figure 19 shows monthly average fuel economy for the FCEBs and diesel buses in miles per DGE. The average monthly high temperature is included in the graph to track any seasonal variations in the fuel economy due to heating or cooling of the bus, which might require additional energy use.
Table 8. Fuel Use and Economy (Evaluation Period)
Bus Mileage (fuel base)
Hydrogen (kg)
Miles per kg
Diesel (DGE)
Miles per DGE
FC4 26,909 4,531 5.94 4,010 6.71 FC5 35,193 5,277 6.67 4,670 7.54 FC6 924 153 6.04 135 6.82 FC7 27,436 4,488 6.11 3,971 6.91 FC8 14,883 2,436 6.11 2,156 6.90 FC9 39,183 5,883 6.66 5,206 7.53
FC10 38,187 6,154 6.21 5,446 7.01 FC11 38,271 6,092 6.28 5,391 7.10 FC12 44,301 6,485 6.83 5,739 7.72 FC14 45,648 6,709 6.80 5,937 7.69 FC15 29,458 4,838 6.09 4,281 6.88 FC16 43,667 6,940 6.29 6,142 7.11
ZEBA Total 384,060 59,986 6.40 53,085 7.23 1208 36,351 9,094 4.00 1209 58,901 15,589 3.78 1210 58,093 14,230 4.08 1211 60,030 15,123 3.97
VH Diesel Total 213,374 54,037 3.95 1338 60,547 14,440 4.19 1339 65,401 15,095 4.33 1340 69,684 16,052 4.34 1341 69,085 15,674 4.41 1342 69,574 15,771 4.41 1343 57,327 13,294 4.31 1344 67,716 15,448 4.38 1345 62,944 14,308 4.40 1346 63,992 14,504 4.41 1347 64,961 14,825 4.38
Gillig Diesel Total 651,233 149,411 4.36

26
This report is available at no cost from the National Renewable Energy Laboratory (NREL) at www.nrel.gov/publications.
Figure 19. Average fuel economy for the fuel cell and diesel buses (evaluation period)
Table 9 provides the summary of fuel costs for the ZEBA and diesel baseline buses for the evaluation period. The cost of hydrogen production as dispensed during this period was $9.10 per kilogram, not including the capital cost of the station. The hydrogen fuel cost per mile calculates to $1.42. Diesel fuel cost during the reporting period was $2.87 per gallon, which calculates to $0.73 per mile for the Van Hool diesel buses and $0.66 per mile for the Gillig diesel buses.
Table 9. Summary of Fuel Cost for ZEBA and Diesel Buses (Evaluation Period)
ZEBA Van Hool Gillig Cost per unit (kg or gal) $9.10 $2.87 $2.87 Total miles (fuel base) 384,060 213,374 651,233 Total fuel (kg or gal) 59,986 54,037 149,411 Fuel cost ($) $546,040 $154,918 $428,346 Fuel cost per mile ($) $1.42 $0.73 $0.66
0
10
20
30
40
50
60
70
80
90
100
0
1
2
3
4
5
6
7
8
9
Mar
-13
Apr
-13
May
-13
Jun-
13Ju
l-13
Aug
-13
Sep
-13
Oct
-13
Nov
-13
Dec
-13
Jan-
14Fe
b-14
Mar
-14
Apr
-14
May
-14
Jun-
14Ju
l-14
Aug
-14
Sep
-14
Oct
-14
Nov
-14
Dec
-14
Aver
age
Hig
h Te
mpe
ratu
re (F
)
Fuel
Eco
nom
y (m
i/DG
E)
ZEBA VH Diesel Gillig Diesel Average High Temp
Evaluation Period

27
This report is available at no cost from the National Renewable Energy Laboratory (NREL) at www.nrel.gov/publications.
Roadcall Analysis A roadcall or revenue vehicle system failure (as named in the National Transit Database14) is defined as a failure of an in-service bus that causes the bus to be replaced on route or causes a significant delay in schedule.15 If the problem with the bus can be repaired during a layover and the schedule is kept, this is not considered a roadcall. The analysis described here includes only roadcalls that were caused by “chargeable” failures. Chargeable roadcalls include systems that can physically disable the bus from operating on route, such as interlocks (doors, air system), engine, or things that are deemed to be safety issues if operation of the bus continues. They do not include roadcalls for things such as problems with radios, fareboxes, or destination signs.
The transit industry measures reliability as mean distance between failures, also documented as miles between roadcall (MBRC). Table 10 provides the MBRC for the FCEBs and diesel buses categorized by bus roadcalls and propulsion-related-only roadcalls. Propulsion-related-only roadcalls include all roadcalls due to propulsion-related systems including the fuel cell system (or engine for a conventional bus), electric drive, fuel, exhaust, air intake, cooling, non-lighting electrical, and transmission systems. The fuel-cell-related roadcalls and MBRC are included for the FCEBs. The fuel cell system MBRC includes any roadcalls due to issues with the fuel cell stack or associated balance of plant. Figure 20 presents the cumulative MBRC by category for the FCEBs and diesel baseline buses. The bus MBRC for the ZEBA buses is showing a slow increase over time and has surpassed the target of 4,000 miles. The fuel cell MBRC shows a steady increase and has passed the DOE/FTA 2016 target of 15,000 miles and is nearing the ultimate target of 20,000 miles.
Table 10. Roadcalls and MBRC (Cumulative and Evaluation Period)
ZEBA
Cumulative Total
ZEBA Evaluation
Period
Van Hool Diesel
Cumulative Total
Van Hool Diesel
Evaluation Period
Gillig Diesel
Cumulative Total
Gillig Diesel
Evaluation Period
Dates 9/11–12/14 11/13–12/14 9/11–12/14 11/13–
12/14 6/13–12/14 11/13–12/14
Mileage 843,242 417,757 430,147 226,169 872,487 685,681 Bus roadcalls 193 67 124 53 125 82 Bus MBRC 4,369 6,235 3,469 4,267 6,980 8,362 Propulsion roadcalls 120 40 55 23 42 27
Propulsion MBRC 7,027 10,444 7,821 9,833 20,774 25,396
Fuel cell roadcalls 43 12 N/A N/A N/A N/A
Fuel cell MBRC 19,610 34,813 N/A N/A N/A N/A
14 National Transit Database website: www.ntdprogram.gov/ntdprogram/. 15 AC Transit defines a significant delay as 6 or more minutes.

28
This report is available at no cost from the National Renewable Energy Laboratory (NREL) at www.nrel.gov/publications.
Figure 20. Cumulative MBRC for the FCEBs and diesel buses
Maintenance Analysis All work orders for the study buses were collected and analyzed for this evaluation. For consistency, the maintenance labor rate was kept at a constant $50 per hour; this does not reflect an average rate for AC Transit. Costs for accident-related repair, which are extremely variable from bus to bus, were eliminated from the analysis. This section first covers total maintenance costs and then maintenance costs by bus system. Warranty costs are not included in the cost-per-mile calculations. As mentioned previously, the Van Hool buses are no longer under warranty, which has resulted in increased maintenance costs since the last report. The ZEBA buses are now beyond the term for the original warranty. As mentioned previously, AC Transit has entered into extended warranty agreements with US Hybrid and EnerDel. The cost of these agreements was funded through a grant from FTA as part of the National Fuel Cell Bus Program. The cost for the agreements is outlined in the summary costs at the end of this section.
Total Work Order Maintenance Costs Total maintenance costs include the price of parts and labor rates at $50 per hour. Cost per mile is calculated as follows:
Cost per mile = [(labor hours * 50) + parts cost] / mileage
Table 11 shows total maintenance costs for the fuel cell and diesel buses. Scheduled and unscheduled maintenance cost per mile is provided for each bus and study group of buses. Since the last report, AC Transit has continued to transition all maintenance to its staff. During the earlier part of the demonstration, the FCEB maintenance was supported by an on-site engineer from US Hybrid. The labor hours for this engineer were not included in the data set. AC Transit
0
5,000
10,000
15,000
20,000
25,000
Mar
-13
Apr-1
3
May
-13
Jun-
13
Jul-1
3
Aug-
13
Sep-
13
Oct
-13
Nov
-13
Dec
-13
Jan-
14
Feb-
14
Mar
-14
Apr-1
4
May
-14
Jun-
14
Jul-1
4
Aug-
14
Sep-
14
Oct
-14
Nov
-14
Dec
-14
Mile
sZEBA MBRC Bus ZEBA MBRC Propulsion
ZEBA MBRC Fuel Cell VH Diesel MBRC Bus
VH Diesel MBRC Propulsion Gillig Diesel MBRC Bus
Gillig Diesel MBRC Propulsion
Evaluation Period

29
This report is available at no cost from the National Renewable Energy Laboratory (NREL) at www.nrel.gov/publications.
has two mechanics/trainers assigned to maintain the FCEBs and provide maintenance training for other AC Transit staff. By the end of 2014, all regular maintenance tasks had been transitioned to AC Transit staff. The manufacturers provide support as needed with any issues that are encountered with the buses. By February 2015, US Hybrid had trained 22 AC Transit maintenance technicians on diagnostics, service and maintenance of the FCEBs.
During the reporting period, the FCEBs had a 13% lower cost per mile for maintenance when compared to the Van Hool diesel buses. The Van Hool buses have accumulated more than 4 times the miles of the FCEBs and are at the mid-life point where buses typically have increased costs. The FCEB maintenance costs were more than 2 times higher than the maintenance costs of the Gillig diesel buses.
Table 11. Total Work Order Maintenance Costs (Evaluation Period)
Bus Mileage Parts ($) Labor Hours
Total Cost per Mile
($)
Scheduled Cost per Mile ($)
Unscheduled Cost per Mile
($) FC4 29,103 3,540 216.2 0.49 0.22 0.28 FC5 40,028 2,431 253.1 0.38 0.17 0.20 FC6 924 26,999 280.8 44.42 0.11 44.31 FC7 32,832 5,163 296.9 0.61 0.19 0.42 FC8 16,710 3,086 269.0 0.99 0.22 0.77 FC9 42,051 10,792 290.7 0.60 0.22 0.38
FC10 40,459 15,146 195.4 0.62 0.13 0.49 FC11 41,120 8,447 239.0 0.50 0.16 0.34 FC12 47,511 2,233 206.9 0.26 0.13 0.13 FC14 47,393 12,067 277.1 0.55 0.22 0.33 FC15 32,140 2,920 219.6 0.43 0.17 0.26 FC16 47,486 2,440 269.1 0.33 0.16 0.18
Total ZEBA 417,757 95,264 3,013.6 0.59 0.18 0.41 ZEBA adjusted 416,833 68,265 2,732.8 0.49 0.18 0.31
1208 40,045 11,306 417.6 0.80 0.16 0.64 1209 61,520 13,197 511.5 0.63 0.13 0.50 1210 61,429 19,457 540.2 0.76 0.16 0.60 1211 63,172 13,596 452.4 0.57 0.15 0.42
Total VH Diesel 226,166 57,556 1,921.7 0.68 0.15 0.53 1338 66143 2,020 238 0.21 0.12 0.09 1339 69676 3,803 259 0.24 0.11 0.13 1340 72170 5,220 235 0.23 0.12 0.12 1341 71175 1,917 272 0.22 0.13 0.09 1342 71062 2,978 267 0.23 0.11 0.12 1343 60609 2,846 315 0.31 0.13 0.18 1344 72243 4,556 266 0.25 0.12 0.13 1345 67820 5,074 271 0.27 0.12 0.15 1346 67215 3,832 275 0.26 0.13 0.14 1347 67568 3,590 272 0.25 0.12 0.14
Total Gillig Diesel 685,681 35,836 2,670 0.25 0.12 0.13

30
This report is available at no cost from the National Renewable Energy Laboratory (NREL) at www.nrel.gov/publications.
The monthly scheduled and unscheduled cost per mile for the ZEBA buses is shown in Figure 21. Figure 22 provides the same information for the Van Hool buses and Figure 23 shows the Gillig buses’ monthly costs. Issues with the ZEBA buses resulted in higher costs for several months during the evaluation period. Problems included issues with bus air compressors, cooling systems, and a DC-DC converter. The high cost of parts was the primary factor for the increases. The figure includes the adjusted cost per mile by month without FC6. The Van Hool diesel buses experienced a number of issues that are typical for buses at this level of mileage. Costs were accrued for work on brakes, axles, fire suppression systems, cooling systems, HVAC, and turbochargers. The Gillig buses show a consistent increase in costs over time. This is expected as the buses accumulate mileage. The higher cost for December 2014 was attributed to maintenance on brakes, charging system, fire suppression system, and a window replacement.
Figure 21. Monthly scheduled and unscheduled costs per mile for the ZEBA buses (evaluation period)
$0.00
$0.20
$0.40
$0.60
$0.80
$1.00
$1.20
$1.40
$1.60
$1.80
Labo
r Hou
rs
Unscheduled Scheduled Unscheduled (adjusted) Scheduled (adjusted)

31
This report is available at no cost from the National Renewable Energy Laboratory (NREL) at www.nrel.gov/publications.
Figure 22. Monthly scheduled and unscheduled costs per mile for the Van Hool diesel buses
(evaluation period)
Figure 23. Monthly scheduled and unscheduled costs per mile for the Gillig diesel buses
(evaluation period)
$0.00
$0.20
$0.40
$0.60
$0.80
$1.00
$1.20
$1.40
$1.60
$1.80C
ost p
er m
ile
Unscheduled Scheduled
$0.00
$0.20
$0.40
$0.60
$0.80
$1.00
$1.20
$1.40
$1.60
$1.80
Cos
t per
mile
Unscheduled Scheduled

32
This report is available at no cost from the National Renewable Energy Laboratory (NREL) at www.nrel.gov/publications.
Work Order Maintenance Costs Categorized by System Table 12 shows maintenance costs by vehicle system and bus study group (without warranty costs). The table provides the total ZEBA bus costs and the adjusted costs without FC6. The vehicle systems shown in the table are as follows:
• Cab, body, and accessories: Includes body, glass, and paint repairs following accidents; cab and sheet metal repairs on seats and doors; and accessory repairs such as hubodometers and radios
• Propulsion-related systems: Repairs for exhaust, fuel, engine, electric motors, fuel cell modules, propulsion control, non-lighting electrical (charging, cranking, and ignition), air intake, cooling, and transmission
• Preventive maintenance inspections (PMI): Labor for inspections during preventive maintenance
• Brakes
• Frame, steering, and suspension
• Heating, ventilation, and air conditioning (HVAC)
• Lighting
• Air system, general
• Axles, wheels, and drive shaft
• Tires.
Table 12. Work Order Maintenance Cost per Mile by System (Evaluation Period)
System
ZEBA ZEBA Adjusted Van Hool Diesel Gillig Diesel Cost per Mile ($)
Percent of Total
(%)
Cost per Mile ($)
Percent of Total
(%)
Cost per Mile ($)
Percent of Total
(%)
Cost per Mile ($)
Percent of Total
(%)
Propulsion-related 0.24 41 0.18 37 0.18 27 0.06 25 Cab, body, and accessories 0.11 19 0.11 22 0.17 25 0.10 41
PMI 0.09 16 0.09 19 0.06 9 0.05 21 Brakes 0.01 2 0.01 3 0.08 12 0.01 4 Frame, steering, and suspension 0.02 4 0.02 4 0.03 5 0.00 1
HVAC 0.01 1 0.01 2 0.07 10 0.01 4 Lighting 0.01 1 0.01 1 0.01 2 0.00 1 Air, general 0.09 15 0.06 12 0.02 4 0.00 1 Axles, wheels, and drive shaft 0.00 0 0.00 0 0.03 5 0.00 1
Tires 0.00 0 0.00 0 0.00 0 0.00 0 Total 0.59 100 0.49 100 0.68 100 0.25 100
The systems with the highest percentage of maintenance costs for the fuel cell buses were propulsion-related; cab, body, and accessories; and PMI. For the Van Hool diesel buses the

33
This report is available at no cost from the National Renewable Energy Laboratory (NREL) at www.nrel.gov/publications.
systems with the highest percentage of maintenance costs were cab, body, and accessories; propulsion-related; and brakes. The Gillig diesel bus systems with the highest percentage of maintenance costs were cab, body, and accessories; propulsion-related; and PMI. Figure 24 shows the monthly cost per mile by category for the ZEBA buses. Appendix D provides additional graphs showing the monthly labor hours and maintenance costs by system for the ZEBA buses and Appendix G provides monthly maintenance graphs for the diesel buses.
Figure 24. Monthly cost per mile by category for the ZEBA buses (evaluation period)
Propulsion-Related Work Order Maintenance Costs Propulsion-related vehicle systems include the exhaust, fuel, engine, electric propulsion, air intake, cooling, non-lighting electrical, and transmission systems. These systems have been separated to highlight maintenance costs most directly affected by the advanced propulsion system changes for the buses. Table 13 shows the propulsion-related system repairs by category for the three study groups during the reporting period. During the data period, the propulsion-related maintenance costs for the FCEBs were 30% higher than that of the Van Hool diesel buses. When compared to the new Gillig buses, the FCEBs’ propulsion-related maintenance costs were nearly 4 times higher. Removing the FC6 data lowers the propulsion costs for the ZEBA buses to $0.18 per mile.
Electric propulsion system maintenance costs accounted for 41% of the total propulsion cost for the FCEBs. Power plant system repairs accounted for only 15% of the total propulsion system costs. Issues with the electric drive system (29% of total propulsion system costs) and the cooling system (26%) contributed most to the cost. The majority of the propulsion costs for the Van Hool diesel buses were for the exhaust system and cooling system. The majority of the propulsion costs for the Gillig diesel buses were for the power plant. Appendix D and Appendix G provide figures showing the monthly labor and maintenance costs for the propulsion systems by sub-category.
$0.00
$0.20
$0.40
$0.60
$0.80
$1.00
$1.20
$1.40
$1.60
Cos
t per
mile
Tires
General airsystem repairsAxles, wheels,and drive shaftLighting
HVAC
Frame, steering,and suspensionBrakes
PMI
Propulsion-relatedCab, body, andaccessories
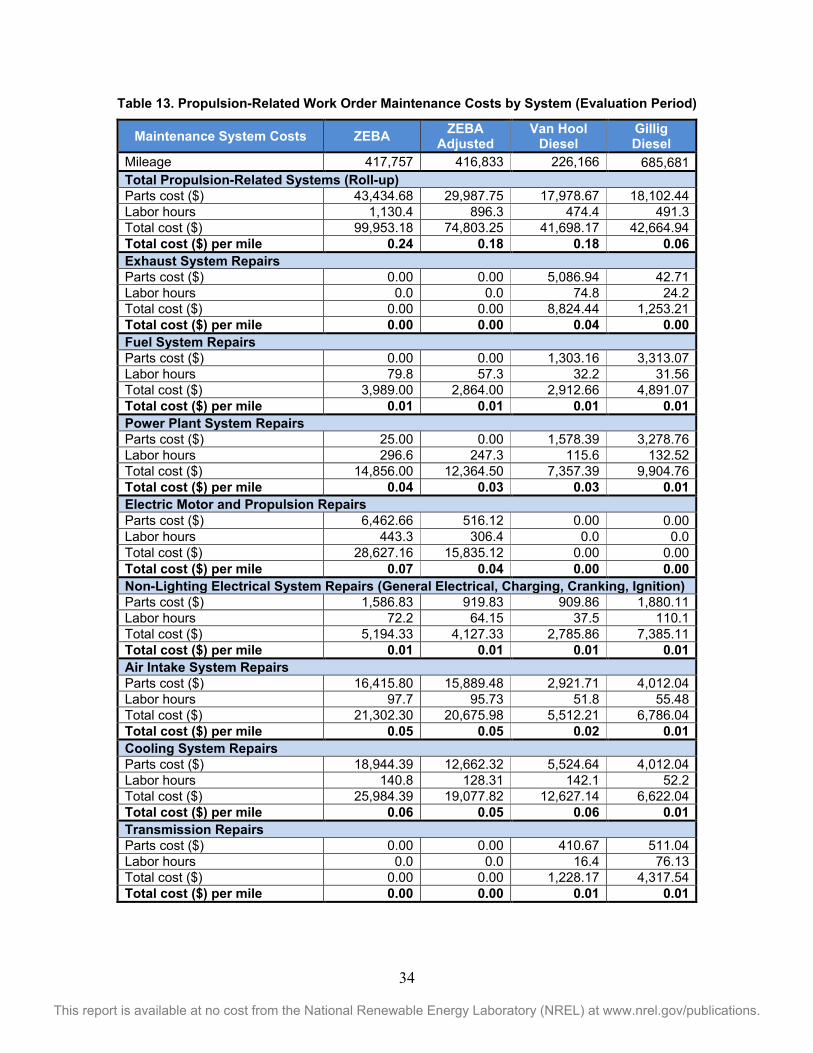
34
This report is available at no cost from the National Renewable Energy Laboratory (NREL) at www.nrel.gov/publications.
Table 13. Propulsion-Related Work Order Maintenance Costs by System (Evaluation Period)
Maintenance System Costs ZEBA ZEBA Adjusted
Van Hool Diesel
Gillig Diesel
Mileage 417,757 416,833 226,166 685,681 Total Propulsion-Related Systems (Roll-up) Parts cost ($) 43,434.68 29,987.75 17,978.67 18,102.44 Labor hours 1,130.4 896.3 474.4 491.3 Total cost ($) 99,953.18 74,803.25 41,698.17 42,664.94 Total cost ($) per mile 0.24 0.18 0.18 0.06 Exhaust System Repairs Parts cost ($) 0.00 0.00 5,086.94 42.71 Labor hours 0.0 0.0 74.8 24.2 Total cost ($) 0.00 0.00 8,824.44 1,253.21 Total cost ($) per mile 0.00 0.00 0.04 0.00 Fuel System Repairs Parts cost ($) 0.00 0.00 1,303.16 3,313.07 Labor hours 79.8 57.3 32.2 31.56 Total cost ($) 3,989.00 2,864.00 2,912.66 4,891.07 Total cost ($) per mile 0.01 0.01 0.01 0.01 Power Plant System Repairs Parts cost ($) 25.00 0.00 1,578.39 3,278.76 Labor hours 296.6 247.3 115.6 132.52 Total cost ($) 14,856.00 12,364.50 7,357.39 9,904.76 Total cost ($) per mile 0.04 0.03 0.03 0.01 Electric Motor and Propulsion Repairs Parts cost ($) 6,462.66 516.12 0.00 0.00 Labor hours 443.3 306.4 0.0 0.0 Total cost ($) 28,627.16 15,835.12 0.00 0.00 Total cost ($) per mile 0.07 0.04 0.00 0.00 Non-Lighting Electrical System Repairs (General Electrical, Charging, Cranking, Ignition) Parts cost ($) 1,586.83 919.83 909.86 1,880.11 Labor hours 72.2 64.15 37.5 110.1 Total cost ($) 5,194.33 4,127.33 2,785.86 7,385.11 Total cost ($) per mile 0.01 0.01 0.01 0.01 Air Intake System Repairs Parts cost ($) 16,415.80 15,889.48 2,921.71 4,012.04 Labor hours 97.7 95.73 51.8 55.48 Total cost ($) 21,302.30 20,675.98 5,512.21 6,786.04 Total cost ($) per mile 0.05 0.05 0.02 0.01 Cooling System Repairs Parts cost ($) 18,944.39 12,662.32 5,524.64 4,012.04 Labor hours 140.8 128.31 142.1 52.2 Total cost ($) 25,984.39 19,077.82 12,627.14 6,622.04 Total cost ($) per mile 0.06 0.05 0.06 0.01 Transmission Repairs Parts cost ($) 0.00 0.00 410.67 511.04 Labor hours 0.0 0.0 16.4 76.13 Total cost ($) 0.00 0.00 1,228.17 4,317.54 Total cost ($) per mile 0.00 0.00 0.01 0.01

35
This report is available at no cost from the National Renewable Energy Laboratory (NREL) at www.nrel.gov/publications.
Total Project Costs Throughout the demonstration, the ZEBA buses have incurred some costs that fall outside of the typical maintenance costs reported above. These costs were not included in the analysis presented in the previous maintenance cost sections. The following three activities have been handled primarily by AC Transit’s maintenance staff assigned to the FCEBs:
• Research and training: In the early stages of implementing a new technology, it takes time for maintenance staff to learn how to maintain and troubleshoot problems with advanced components and systems. AC Transit tracks these costs as “research and training.” These costs have dropped over time as the maintenance staff has become familiar with the technology and taken over more of the maintenance work. During the evaluation period for the report, only 47 hours were attributed to research activities.
• Shuttling FCEBs between depots: For the majority of the demonstration AC Transit has operated the buses out of the Emeryville depot. Because the facility did not have a maintenance bay that was equipped to allow work on a hydrogen-fueled bus, AC Transit staff had to shuttle the buses to the Oakland depot where there is a maintenance bay outfitted for the FCEBs. This added to the labor costs for the buses and is tracked separately in the work orders. The agency is currently retrofitting one of the Emeryville maintenance bays similar to what was done at the Oakland depot. Once the retrofit is complete, this activity will no longer be necessary. Occasionally, the baseline diesel buses were also shuttled from one depot to another for maintenance repair. For a fair comparison, NREL also removed the costs for shuttling the diesel buses from the analysis.
• Fueling and cleaning: In the early stage of the demonstration, AC Transit had maintenance staff assigned specifically to the FCEBs for fueling and cleaning the buses. These activities for buses at a depot are typically handled by different staff during the evenings when all buses are prepared for the next morning pullout. Over the evaluation period for the report, the FCEBs have been worked into the overall process. There were only 20 hours attributed to this activity and they occurred during the first two months of the evaluation period.
These costs are considered non-recurring costs for the FCEBs; however, they add to the current cost per mile of the ZEBA buses.
Table 14 shows the breakdown of these costs and how they affect the total cost per mile of the project. The table shows the non-recurring costs during three periods to show the decrease over time. The first time period was during the extended hydrogen station downtime (as described in the previous report) when the buses were not operating and therefore not accumulating miles. The second period was the evaluation period from the previous report, and the third is the evaluation period that is the focus of this report. The non-recurring costs for the ZEBA fleet have dropped dramatically over the last year and add only $0.05 per mile to the operating cost of the buses for the evaluation period in this report. Once the Emeryville maintenance bay is completed, these costs should be completely eliminated.

36
This report is available at no cost from the National Renewable Energy Laboratory (NREL) at www.nrel.gov/publications.
Table 14. Maintenance Costs Including Non-Recurring Labor
Mileage Labor Hours
Total Cost
Cost per Mile
Station Downtime Period (May 2012–Feb 2013) Shuttle FCEBs 19,296 118.5 5,925 0.31 Research/training 19,296 1,703 85,169 4.41 Fuel and clean 19,296 908 45,412 2.35 Total 19,296 2,730 136,506 7.07 Evaluation Period (Mar 2013–Oct 2013) Shuttle FCEBs 259,065 211 10,537 0.04 Research/training 259,065 321 16,075 0.06 Fuel and clean 259,065 75 3,765 0.01 Total 259,065 608 30,376 0.12 Evaluation Period (Nov 2013–Dec 2014) Shuttle FCEBs 417,757 332 16,597 0.04 Research/training 417,757 47 2,350 0.01 Fuel and clean 417,757 20 975 0.00 Total 417,757 398 19,922 0.05
Costs for AC Transit’s extended warranty agreements with US Hybrid and EnerDel began in April 2014. While the cost for these agreements is covered through the FTA grant, other interested agencies should understand the current costs for FCEBs outside the initial warranty period. Table 15 summarizes the total costs for the ZEBA and diesel baseline buses including the extra labor and extended warranty during the evaluation period. The cost for shuttling the diesel buses between depots adds less than one cent to the total cost per mile.
Table 15. Total Maintenance Cost per Mile Including Extra Labor and Extended Warranty (Evaluation Period)
ZEBA Van Hool Gillig Maintenance labor hours 3,013.6 1,921.7 2,669.7 Extra labor hours 398.4 4.0 25.9 Total labor hours 3,412.1 1,925.7 2,695.7 Total parts cost $95,264 $57,556 $35,836 Extended warranty cost $287,790 — — Total cost per mile $1.33 $0.68 $0.25

37
This report is available at no cost from the National Renewable Energy Laboratory (NREL) at www.nrel.gov/publications.
What’s Next for ZEBA AC Transit’s plans for the ZEBA demonstration are to continue operating four buses out of the Emeryville Division and eight buses at the Oakland Division. NREL will continue to evaluate the buses and will collect data and experience from the other operators should they decide to put the buses in service.

38
This report is available at no cost from the National Renewable Energy Laboratory (NREL) at www.nrel.gov/publications.
Contacts DOE 1000 Independence Ave., SW Washington, DC 20585
Jason Marcinkoski, Technology Development Manager, Fuel Cell Technologies Office Phone: 202-586-7466 Email: [email protected]
NREL 15013 Denver West Parkway Golden, CO 80401
Leslie Eudy, Senior Project Leader Phone: 303-275-4412 Email: [email protected]
AC Transit 1700 Franklin Street Oakland, CA 94612
Salvador Llamas, Director of Maintenance Phone: 510-577-8803 Email: [email protected]
US Hybrid Corporation 445 Maple Avenue Torrance, CA 90503
Reza Sarhadi-Nia, Fuel Cell Service and Support Phone: 310-212-1200, Ext. 127 Email: [email protected]
EnerDel Inc. 15425 Herriman Blvd. Noblesville, IN 46060
Tomasz Posnar, Vice President, Transportation and Aftermarket Phone: 954-401-0338 Email: [email protected]
Van Hool Bernard Van Hoolstraat 58 B-2500 Lier Koningshooikt, Belgium
Paul Jenné, Automotive Relations Phone: +32 (3) 420 22 10 Email: [email protected]
Linde, LLC 2389 Lincoln Avenue Hayward, CA 94545
Nitin Natesan, Engineering Manager, Alternative Energy Projects Phone: 510-786-5931 Email: [email protected]

39
This report is available at no cost from the National Renewable Energy Laboratory (NREL) at www.nrel.gov/publications.
References and Related Reports All NREL hydrogen and fuel cell-related evaluation reports can be downloaded from the following website: www.nrel.gov/hydrogen/proj_fc_bus_eval.html.
AC Transit Eudy, L.; Post, M. (2014). Zero Emission Bay Area (ZEBA) Fuel Cell Bus Demonstration Results: Third Report. NREL/TP-5400-60527. Golden, CO: National Renewable Energy Laboratory.
Eudy, L.; Chandler, K. (2012). Zero Emission Bay Area (ZEBA) Fuel Cell Bus Demonstration: Second Results Report. NREL/TP-5600-55367. Golden, CO: National Renewable Energy Laboratory.
Chandler, K.; Eudy, L. (2011). Zero Emission Bay Area (ZEBA) Fuel Cell Bus Demonstration: First Results Report. NREL/TP-5600-52015. Golden, CO: National Renewable Energy Laboratory.
General Eudy, L.; Post, M.; Gikakis, C. (2014). Fuel Cell Buses in U.S. Transit Fleets: Current Status 2014. NREL/TP-5400-62683. Golden, CO: National Renewable Energy Laboratory.
Eudy, L.; Gikakis, C. (2013). Fuel Cell Buses in U.S. Transit Fleets: Current Status 2013. NREL/TP-5400-60490. Golden, CO: National Renewable Energy Laboratory.
Chandler, K.; Eudy, L. (2012). FTA Fuel Cell Bus Program: Research Accomplishments through 2011. FTA Report No. 0014. Washington, DC: Federal Transit Administration.
Eudy, L. (2010). Fuel Cell Transit Bus Evaluations, Joint Evaluation Plan for the U.S. Department of Energy and the Federal Transit Administration. NREL/TP-560-49342. Golden, CO: National Renewable Energy Laboratory.

40
This report is available at no cost from the National Renewable Energy Laboratory (NREL) at www.nrel.gov/publications.
Appendix A: TRL Guideline Table Technology Readiness Levels for FCEB Commercialization
Relative Level of Technology Development
Technology Readiness
Level TRL Definition Description
Deployment TRL 9
Actual system operated over the full
range of expected conditions
The technology is in its final form. Deployment, marketing, and support begin for the first fully commercial products.
Technology Demonstration/ Commissioning
TRL 8
Actual system completed and
qualified through test and demonstration
The last step in true system development. Demonstration of a limited production of 50 to 100 buses at a small number of locations. Beginning the transition of all maintenance to transit staff.
TRL 7 Full-scale validation in relevant environment
A major step up from TRL 6 by adding larger numbers of buses and increasing the hours of service. Full-scale demonstration and reliability testing of 5 to 10 buses at several locations. Manufacturers begin to train larger numbers of transit staff in operation and maintenance.
TRL 6 Engineering/pilot-scale validation in relevant
environment
First tests of prototype buses in actual transit service. Field testing and design shakedown of one to two prototypes. Manufacturers assist in operation and typically handle all maintenance. Begin to introduce transit staff to technology.
Technology Development
TRL 5
Laboratory scale, similar system
validation in relevant environment
Integrated system is tested in a laboratory under simulated conditions based on early modeling. System is integrated into an early prototype or mule platform for some on-road testing.
TRL 4 Component and
system validation in laboratory environment
Basic technological components are integrated into the system and begin laboratory testing and modeling of potential duty cycles.
Research to Prove Feasibility
TRL 3
Analytical and experimental critical
function and/or proof of concept
Active research into components and system integration needs. Investigate what requirements might be met with existing commercial components.
TRL 2 Technology concept and/or application
formulated
Research technology needed to meet market requirements. Define strategy for moving through development stages. Basic
Technology Research TRL 1 Basic principles
observed and reported Scientific research and early development of FCEB concepts.
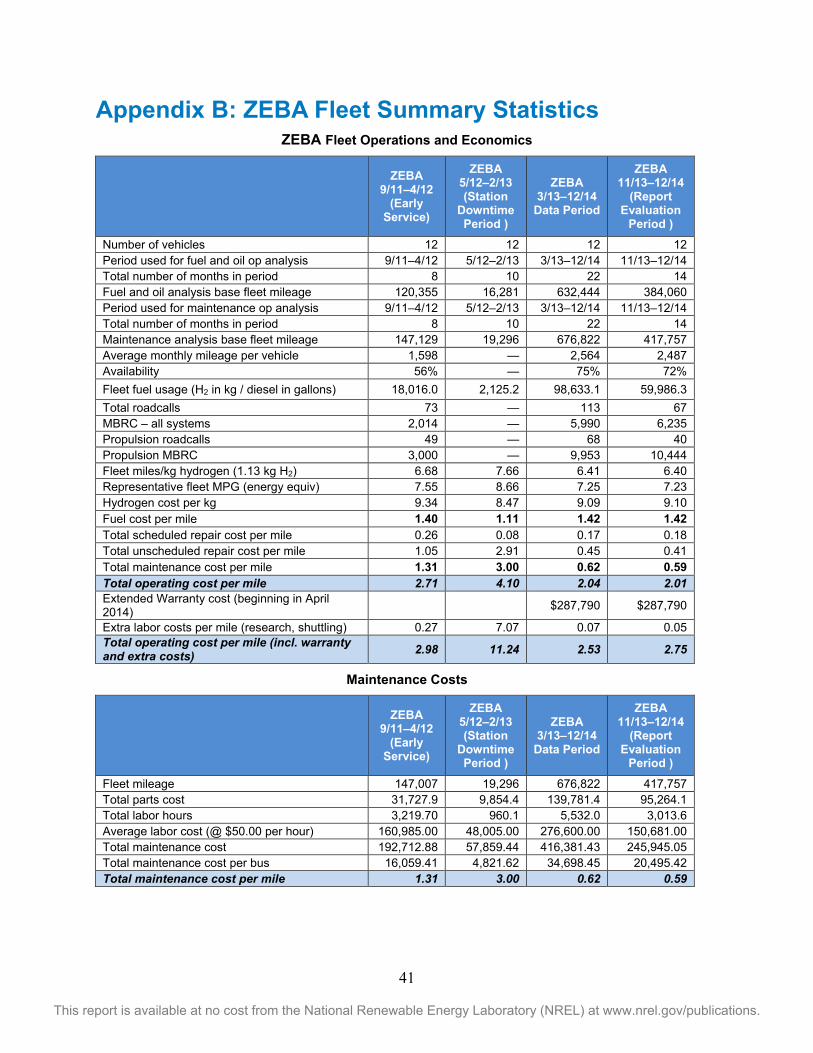
41
This report is available at no cost from the National Renewable Energy Laboratory (NREL) at www.nrel.gov/publications.
Appendix B: ZEBA Fleet Summary Statistics ZEBA Fleet Operations and Economics
ZEBA
9/11–4/12 (Early
Service)
ZEBA 5/12–2/13 (Station
Downtime Period )
ZEBA 3/13–12/14
Data Period
ZEBA 11/13–12/14
(Report Evaluation
Period ) Number of vehicles 12 12 12 12 Period used for fuel and oil op analysis 9/11–4/12 5/12–2/13 3/13–12/14 11/13–12/14 Total number of months in period 8 10 22 14 Fuel and oil analysis base fleet mileage 120,355 16,281 632,444 384,060 Period used for maintenance op analysis 9/11–4/12 5/12–2/13 3/13–12/14 11/13–12/14 Total number of months in period 8 10 22 14 Maintenance analysis base fleet mileage 147,129 19,296 676,822 417,757 Average monthly mileage per vehicle 1,598 — 2,564 2,487 Availability 56% — 75% 72% Fleet fuel usage (H2 in kg / diesel in gallons) 18,016.0 2,125.2 98,633.1 59,986.3 Total roadcalls 73 — 113 67 MBRC – all systems 2,014 — 5,990 6,235 Propulsion roadcalls 49 — 68 40 Propulsion MBRC 3,000 — 9,953 10,444 Fleet miles/kg hydrogen (1.13 kg H2) 6.68 7.66 6.41 6.40 Representative fleet MPG (energy equiv) 7.55 8.66 7.25 7.23 Hydrogen cost per kg 9.34 8.47 9.09 9.10 Fuel cost per mile 1.40 1.11 1.42 1.42 Total scheduled repair cost per mile 0.26 0.08 0.17 0.18 Total unscheduled repair cost per mile 1.05 2.91 0.45 0.41 Total maintenance cost per mile 1.31 3.00 0.62 0.59 Total operating cost per mile 2.71 4.10 2.04 2.01 Extended Warranty cost (beginning in April 2014) $287,790 $287,790
Extra labor costs per mile (research, shuttling) 0.27 7.07 0.07 0.05 Total operating cost per mile (incl. warranty and extra costs) 2.98 11.24 2.53 2.75
Maintenance Costs
ZEBA
9/11–4/12 (Early
Service)
ZEBA 5/12–2/13 (Station
Downtime Period )
ZEBA 3/13–12/14
Data Period
ZEBA 11/13–12/14
(Report Evaluation
Period ) Fleet mileage 147,007 19,296 676,822 417,757 Total parts cost 31,727.9 9,854.4 139,781.4 95,264.1 Total labor hours 3,219.70 960.1 5,532.0 3,013.6 Average labor cost (@ $50.00 per hour) 160,985.00 48,005.00 276,600.00 150,681.00 Total maintenance cost 192,712.88 57,859.44 416,381.43 245,945.05 Total maintenance cost per bus 16,059.41 4,821.62 34,698.45 20,495.42 Total maintenance cost per mile 1.31 3.00 0.62 0.59

42
This report is available at no cost from the National Renewable Energy Laboratory (NREL) at www.nrel.gov/publications.
Breakdown of Maintenance Costs by Vehicle System
ZEBA
9/11–4/12 (Early
Service)
ZEBA 5/12–2/13 (Station
Downtime Period )
ZEBA 3/13–12/14
Data Period
ZEBA 11/13–12/14
(Report Evaluation
Period ) Fleet mileage 147,007 19,296 676,822 417,757 Total Engine/Fuel-Related Systems (ATA VMRS 27, 30, 31, 32, 33, 41, 42, 43, 44, 45, 46, 65) Parts cost 5,957.71 8,597.79 78,177.83 43,434.68 Labor hours 1,012.7 611.9 2,211.0 1,130.4 Average labor cost 50,633.50 30,595.50 110,550.00 56,518.50 Total cost (for system) 56,591.21 39,193.29 188,727.83 99,953.18 Total cost (for system) per bus 4,715.93 3,266.11 15,727.32 8,329.43 Total cost (for system) per mile 0.38 2.03 0.28 0.24 Exhaust System Repairs (ATA VMRS 43) Parts cost 0.00 0.00 0.00 0.00 Labor hours 0.0 0.0 0.0 0.0 Average labor cost 0.00 0.00 0.00 0.00 Total cost (for system) 0.00 0.00 0.00 0.00 Total cost (for system) per bus 0.00 0.00 0.00 0.00 Total cost (for system) per mile 0.00 0.00 0.00 0.00 Fuel System Repairs (ATA VMRS 44) Parts cost 15.47 0.00 26.75 0.00 Labor hours 166.7 30.4 161.6 79.8 Average labor cost 8,335.00 1,520.50 8,080.50 3,989.00 Total cost (for system) 8,350.47 1,520.50 8,107.25 3,989.00 Total cost (for system) per bus 695.87 126.71 675.60 332.42 Total cost (for system) per mile 0.06 0.08 0.01 0.01 Power Plant (Engine) Repairs (ATA VMRS 45) Parts cost 260.89 145.88 259.96 25.00 Labor hours 204.0 172.1 590.8 296.6 Average labor cost 10,200.50 8,606.50 29,538.50 14,831.00 Total cost (for system) 10,461.39 8,752.38 29,798.46 14,856.00 Total cost (for system) per bus 871.78 729.37 2,483.21 1,238.00 Total cost (for system) per mile 0.07 0.45 0.04 0.04 Electric Propulsion Repairs (ATA VMRS 46) Parts cost 1,251.77 0.00 26,048.55 6,462.66 Labor hours 458.5 313.3 830.4 443.3 Average labor cost 22,924.00 15,663.00 41,520.00 22,164.50 Total cost (for system) 24,175.77 15,663.00 67,568.55 28,627.16 Total cost (for system) per bus 2,014.65 1,305.25 5,630.71 2,385.60 Total cost (for system) per mile 0.16 0.81 0.10 0.07

43
This report is available at no cost from the National Renewable Energy Laboratory (NREL) at www.nrel.gov/publications.
Breakdown of Maintenance Costs by Vehicle System (continued)
ZEBA
9/11–4/12 (Early
Service)
ZEBA 5/12–2/13 (Station
Downtime Period )
ZEBA 3/13–12/14
Data Period
ZEBA 11/13–12/14
(Report Evaluation
Period )
Electrical System Repairs (ATA VMRS 30-Electrical General, 31-Charging, 32-Cranking, 33-Ignition) Parts cost 1,747.91 2023.98 3675.76 1586.83 Labor hours 81.3 33.7 125.9 72.2 Average labor cost 4,064.50 1,687.00 6,293.50 3,607.50 Total cost (for system) 5,812.41 3,710.98 9,969.26 5,194.33 Total cost (for system) per bus 484.37 309.25 830.77 432.86 Total cost (for system) per mile 0.04 0.19 0.01 0.01 Air Intake System Repairs (ATA VMRS 41) Parts cost 2,152.28 6096.88 25288.54 16415.80 Labor hours 8.7 13.6 271.9 97.7 Average labor cost 435.50 678.00 13,594.50 4,886.50 Total cost (for system) 2,587.78 6,774.88 38,883.04 21,302.30 Total cost (for system) per bus 215.65 564.57 3,240.25 1,775.19 Total cost (for system) per mile 0.02 0.35 0.06 0.05 Cooling System Repairs (ATA VMRS 42) Parts cost 529.39 331.06 22878.26 18944.39 Labor hours 93.5 48.8 230.5 140.8 Average labor cost 4,674.00 2,440.50 11,523.00 7,040.00 Total cost (for system) 5,203.39 2,771.56 34,401.26 25,984.39 Total cost (for system) per bus 433.62 230.96 2,866.77 2,165.37 Total cost (for system) per mile 0.04 0.14 0.05 0.06 Hydraulic System Repairs (ATA VMRS 65) Parts cost 0.00 0.00 0.00 0.00 Labor hours 0.0 0.0 0.0 0.0 Average labor cost 0.00 0.00 0.00 0.00 Total cost (for system) 0.00 0.00 0.00 0.00 Total cost (for system) per bus 0.00 0.00 0.00 0.00 Total cost (for system) per mile 0.00 0.00 0.00 0.00 General Air System Repairs (ATA VMRS 10) Parts cost 3,875.75 0.00 34937.74 32040.70 Labor hours 66.4 10.3 146.0 101.0 Average labor cost 3,321.50 516.00 7,299.00 5,049.00 Total cost (for system) 7,197.25 516.00 42,236.74 37,089.70 Total cost (for system) per bus 599.77 43.00 3,519.73 3,090.81 Total cost (for system) per mile 0.05 0.03 0.06 0.09
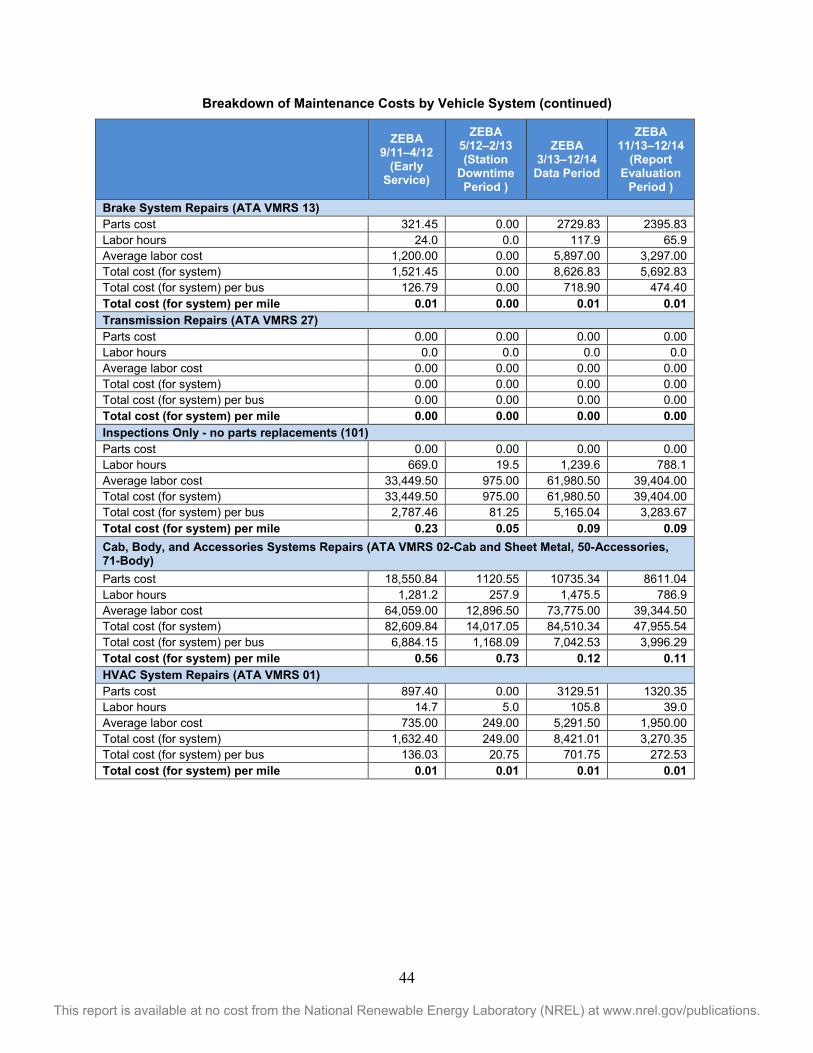
44
This report is available at no cost from the National Renewable Energy Laboratory (NREL) at www.nrel.gov/publications.
Breakdown of Maintenance Costs by Vehicle System (continued)
ZEBA
9/11–4/12 (Early
Service)
ZEBA 5/12–2/13 (Station
Downtime Period )
ZEBA 3/13–12/14
Data Period
ZEBA 11/13–12/14
(Report Evaluation
Period )
Brake System Repairs (ATA VMRS 13) Parts cost 321.45 0.00 2729.83 2395.83 Labor hours 24.0 0.0 117.9 65.9 Average labor cost 1,200.00 0.00 5,897.00 3,297.00 Total cost (for system) 1,521.45 0.00 8,626.83 5,692.83 Total cost (for system) per bus 126.79 0.00 718.90 474.40 Total cost (for system) per mile 0.01 0.00 0.01 0.01 Transmission Repairs (ATA VMRS 27) Parts cost 0.00 0.00 0.00 0.00 Labor hours 0.0 0.0 0.0 0.0 Average labor cost 0.00 0.00 0.00 0.00 Total cost (for system) 0.00 0.00 0.00 0.00 Total cost (for system) per bus 0.00 0.00 0.00 0.00 Total cost (for system) per mile 0.00 0.00 0.00 0.00 Inspections Only - no parts replacements (101) Parts cost 0.00 0.00 0.00 0.00 Labor hours 669.0 19.5 1,239.6 788.1 Average labor cost 33,449.50 975.00 61,980.50 39,404.00 Total cost (for system) 33,449.50 975.00 61,980.50 39,404.00 Total cost (for system) per bus 2,787.46 81.25 5,165.04 3,283.67 Total cost (for system) per mile 0.23 0.05 0.09 0.09 Cab, Body, and Accessories Systems Repairs (ATA VMRS 02-Cab and Sheet Metal, 50-Accessories, 71-Body) Parts cost 18,550.84 1120.55 10735.34 8611.04 Labor hours 1,281.2 257.9 1,475.5 786.9 Average labor cost 64,059.00 12,896.50 73,775.00 39,344.50 Total cost (for system) 82,609.84 14,017.05 84,510.34 47,955.54 Total cost (for system) per bus 6,884.15 1,168.09 7,042.53 3,996.29 Total cost (for system) per mile 0.56 0.73 0.12 0.11 HVAC System Repairs (ATA VMRS 01) Parts cost 897.40 0.00 3129.51 1320.35 Labor hours 14.7 5.0 105.8 39.0 Average labor cost 735.00 249.00 5,291.50 1,950.00 Total cost (for system) 1,632.40 249.00 8,421.01 3,270.35 Total cost (for system) per bus 136.03 20.75 701.75 272.53 Total cost (for system) per mile 0.01 0.01 0.01 0.01

45
This report is available at no cost from the National Renewable Energy Laboratory (NREL) at www.nrel.gov/publications.
Breakdown of Maintenance Costs by Vehicle System (continued)
ZEBA
9/11–4/12 (Early
Service)
ZEBA 5/12–2/13 (Station
Downtime Period )
ZEBA 3/13–12/14
Data Period
ZEBA 11/13–12/14
(Report Evaluation
Period )
Lighting System Repairs (ATA VMRS 34) Parts cost 290.00 27.62 1317.14 330.30 Labor hours 24.4 3.3 82.0 51.5 Average labor cost 1,220.50 165.50 4,099.50 2,577.00 Total cost (for system) 1,510.50 193.12 5,416.64 2,907.30 Total cost (for system) per bus 125.88 16.09 451.39 242.28 Total cost (for system) per mile 0.01 0.01 0.01 0.01 Frame, Steering, and Suspension Repairs (ATA VMRS 14-Frame, 15-Steering, 16-Suspension) Parts cost 1,751.91 108.48 8751.43 7131.14 Labor hours 103.2 52.2 139.7 46.3 Average labor cost 5,161.00 2,607.50 6,982.50 2,316.00 Total cost (for system) 6,912.91 2,715.98 15,733.93 9,447.14 Total cost (for system) per bus 576.08 226.33 1,311.16 787.26 Total cost (for system) per mile 0.05 0.14 0.02 0.02 Axle, Wheel, and Drive Shaft Repairs (ATA VMRS 11-Front Axle, 18-Wheels, 22-Rear Axle, 24-Drive Shaft) Parts cost 5.48 0.00 2.61 0.00 Labor hours 22.6 0.0 13.5 4.5 Average labor cost 1,131.50 0.00 675.00 225.00 Total cost (for system) 1,136.98 0.00 677.61 225.00 Total cost (for system) per bus 94.75 0.00 56.47 18.75 Total cost (for system) per mile 0.01 0.00 0.00 0.00 Tire Repairs (ATA VMRS 17) Parts cost 0.00 0.00 0.00 0.00 Labor hours 0.0 0.0 1.0 0.0 Average labor cost 0.00 0.00 50.00 0.00 Total cost (for system) 0.00 0.00 50.00 0.00 Total cost (for system) per bus 0.00 0.00 4.17 0.00 Total cost (for system) per mile 0.00 0.00 0.00 0.00

46
This report is available at no cost from the National Renewable Energy Laboratory (NREL) at www.nrel.gov/publications.
Notes 1. To compare the hydrogen fuel dispensed and fuel economy to diesel, the hydrogen dispensed was also converted into diesel energy equivalent gallons. Actual energy content will vary by locations, but the general energy conversions are as follows:
Lower heating value (LHV) for hydrogen = 51,532 Btu/lb
LHV for diesel = 128,400 Btu/lb
1 kg = 2.205 lb
51,532 Btu/lb * 2.205 lb/kg = 113,628 Btu/kg
Diesel/hydrogen = 128,400 Btu/gal / 113,628 Btu/kg = 1.13 kg/diesel gal
2. The propulsion-related systems were chosen to include only those systems of the vehicles that could be affected directly by the selection of a fuel/advanced technology.
3. ATA VMRS coding is based on parts that were replaced. If there was no part replaced in a given repair, then the code was chosen by the system being worked on.
4. In general, inspections (with no part replacements) were included only in the overall totals (not by system). Category 101 was created to track labor costs for PM inspections.
5. ATA VMRS 02-Cab and Sheet Metal represents seats, doors, etc.; ATA VMRS 50-Accessories represents things like fire extinguishers, test kits, etc.; ATA VMRS 71-Body represents mostly windows and windshields.
6. Average labor cost is assumed to be $50 per hour.
7. Warranty costs are not included.

47
This report is available at no cost from the National Renewable Energy Laboratory (NREL) at www.nrel.gov/publications.
Appendix C: ZEBA Fleet Summary Statistics—SI Units ZEBA Fleet Operations and Economics
ZEBA
9/11–4/12 (Early
Service)
ZEBA 5/12–2/13 (Station
Downtime Period )
ZEBA 3/13–12/14
Data Period
ZEBA 11/13–12/14
(Report Evaluation
Period ) Number of vehicles 12 12 12 12 Period used for fuel and oil op analysis 9/11–4/12 5/12–2/13 3/13–12/14 11/13–12/14 Total number of months in period 8 10 22 14 Fuel and oil analysis base fleet kilometers 193,687 26,201 1,017,792 618,068 Period used for maintenance op analysis 9/11–4/12 5/12–2/13 3/13–12/14 11/13–12/14 Total number of months in period 8 10 22 14 Maintenance analysis base fleet kilometers 236,775 31,053 1,089,210 672,296 Average monthly kilometers per vehicle 2,572 — 4,126 4,002 Availability 1 — 1 1 Fleet fuel usage (H2 in kg / diesel in liters) 18,016 2,125 98,633 59,986 Total roadcalls 73 — 113 67 KMBRC – all systems 3,243 — 9,639 10,034 Propulsion roadcalls 49 — 68 40 Propulsion KMBRC 4,832 — 16,018 16,807 Fleet kg hydrogen/100 km (1.13 kg H2) 9.30 8.11 9.69 9.71 Rep. fleet fuel consumption (L/100 km) 31.16 27.17 32.46 32.51 Hydrogen cost per kg 9.34 8.47 9.09 9.10 Fuel cost per kilometer 0.87 0.69 0.88 0.88 Total scheduled repair cost per kilometer 0.01 0.05 0.10 0.11 Total unscheduled repair cost per kilometer 0.25 1.81 0.28 0.26 Total maintenance cost per kilometer 0.26 1.86 0.38 0.37 Total operating cost per kilometer 1.13 2.55 1.26 1.25 Extended Warranty cost (beginning in April 2014) $287,790 $287,790 Extra labor costs per kilometer (research, shuttling) 0.17 4.40 0.05 0.03 Total operating cost per kilometer (incl. warranty and extra costs) 1.30 6.99 1.57 1.71
Maintenance Costs
ZEBA
9/11–4/12 (Early
Service)
ZEBA 5/12–2/13 (Station
Downtime Period )
ZEBA 3/13–12/14
Data Period
ZEBA 11/13–12/14
(Report Evaluation
Period ) Fleet mileage 236,775 31,053 1,089,210 672,296 Total parts cost 31,727.9 9,854.4 139,781.4 95,264.1 Total labor hours 3,219.70 960.10 5,532.00 3,013.62 Average labor cost (@ $50.00 per hour) 160,985.00 48,005.00 276,600.00 150,681.00 Total maintenance cost 192,712.88 57,859.44 416,381.43 245,945.05 Total maintenance cost per bus 16,059.41 4,821.62 34,698.45 20,495.42 Total maintenance cost per kilometer 0.81 1.86 0.38 0.37

48
This report is available at no cost from the National Renewable Energy Laboratory (NREL) at www.nrel.gov/publications.
Appendix D: ZEBA Monthly Maintenance Analysis Graphs
Figure D-1. Monthly labor hours by category for the ZEBA buses
Figure D-2. Monthly propulsion system labor hours by sub-category for the ZEBA buses
0
2
4
6
8
10
12
14
16
Labo
r Hou
rs p
er 1
,000
mile
s
Tires
General airsystem repairsAxles, wheels,and drive shaftLighting
HVAC
Frame, steering,and suspensionBrakes
PMI
Propulsion-relatedCab, body, andaccessories
0
1
2
3
4
5
6
7
8
Labo
r Hou
rs p
er 1
,000
mile
s
Hybrid SystemFuel SystemCoolingAir IntakeCranking/ChargingElectricalFC
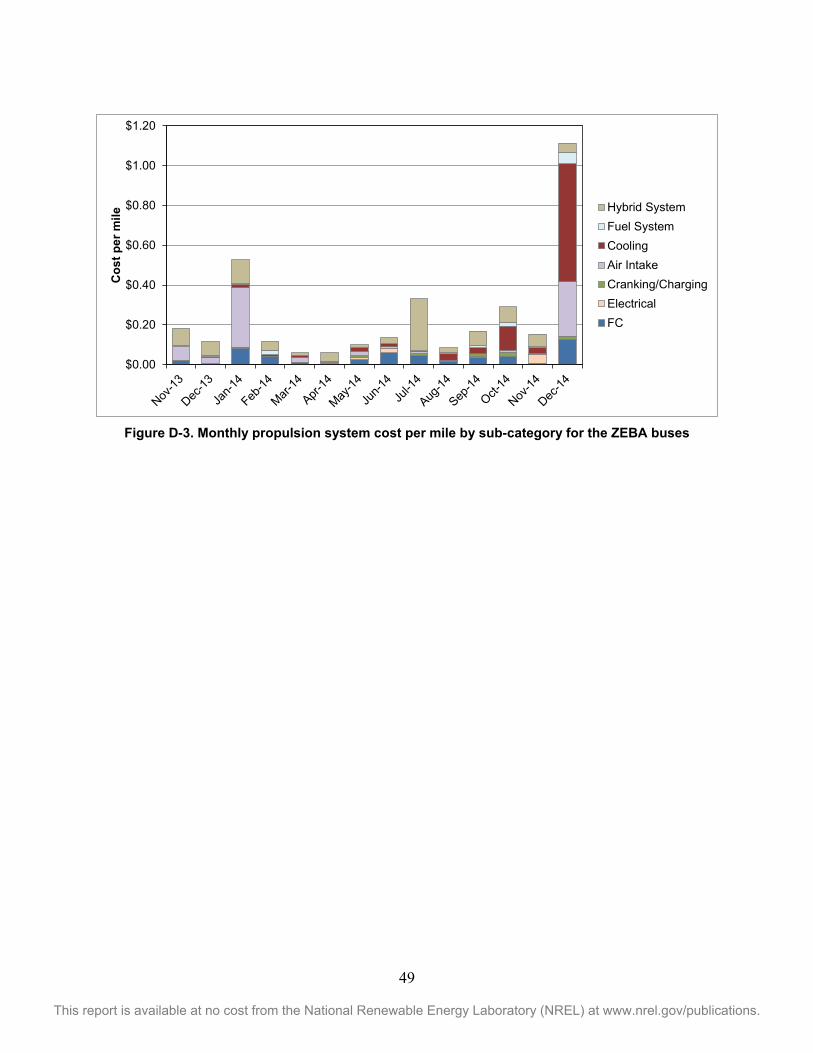
49
This report is available at no cost from the National Renewable Energy Laboratory (NREL) at www.nrel.gov/publications.
Figure D-3. Monthly propulsion system cost per mile by sub-category for the ZEBA buses
$0.00
$0.20
$0.40
$0.60
$0.80
$1.00
$1.20C
ost p
er m
ile
Hybrid SystemFuel SystemCoolingAir IntakeCranking/ChargingElectricalFC
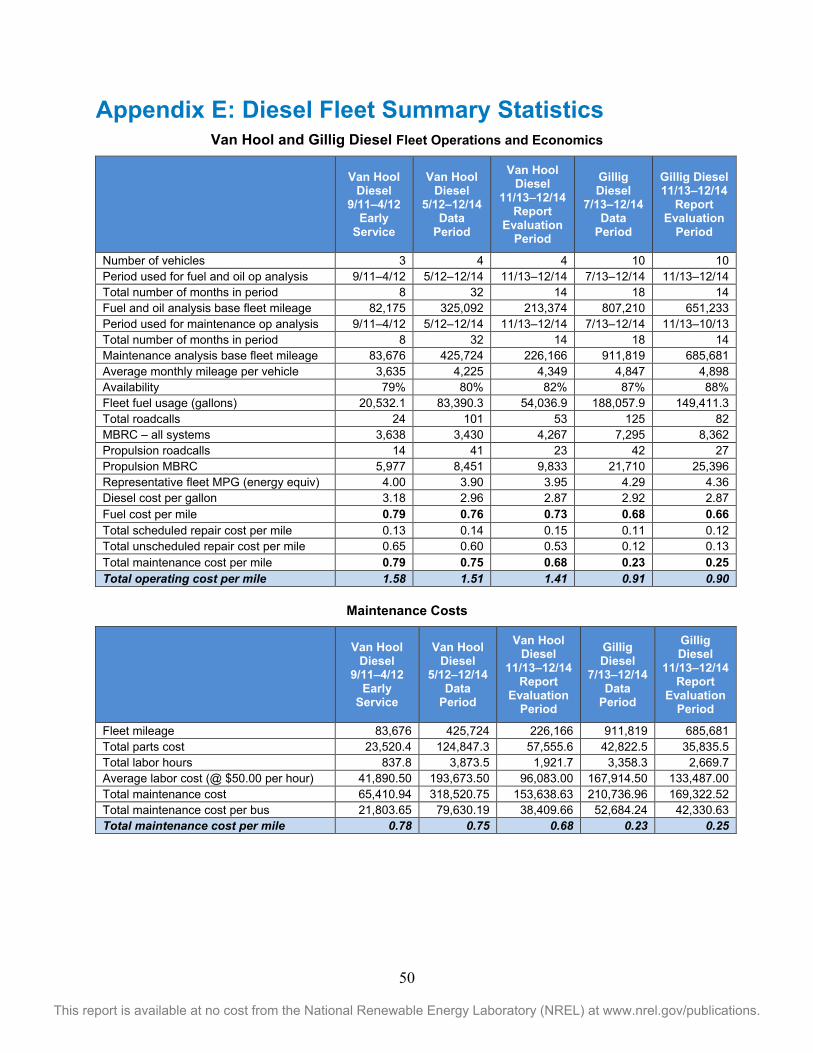
50
This report is available at no cost from the National Renewable Energy Laboratory (NREL) at www.nrel.gov/publications.
Appendix E: Diesel Fleet Summary Statistics Van Hool and Gillig Diesel Fleet Operations and Economics
Van Hool Diesel
9/11–4/12 Early
Service
Van Hool Diesel
5/12–12/14 Data
Period
Van Hool Diesel
11/13–12/14 Report
Evaluation Period
Gillig Diesel
7/13–12/14 Data
Period
Gillig Diesel 11/13–12/14
Report Evaluation
Period
Number of vehicles 3 4 4 10 10 Period used for fuel and oil op analysis 9/11–4/12 5/12–12/14 11/13–12/14 7/13–12/14 11/13–12/14 Total number of months in period 8 32 14 18 14 Fuel and oil analysis base fleet mileage 82,175 325,092 213,374 807,210 651,233 Period used for maintenance op analysis 9/11–4/12 5/12–12/14 11/13–12/14 7/13–12/14 11/13–10/13 Total number of months in period 8 32 14 18 14 Maintenance analysis base fleet mileage 83,676 425,724 226,166 911,819 685,681 Average monthly mileage per vehicle 3,635 4,225 4,349 4,847 4,898 Availability 79% 80% 82% 87% 88% Fleet fuel usage (gallons) 20,532.1 83,390.3 54,036.9 188,057.9 149,411.3 Total roadcalls 24 101 53 125 82 MBRC – all systems 3,638 3,430 4,267 7,295 8,362 Propulsion roadcalls 14 41 23 42 27 Propulsion MBRC 5,977 8,451 9,833 21,710 25,396 Representative fleet MPG (energy equiv) 4.00 3.90 3.95 4.29 4.36 Diesel cost per gallon 3.18 2.96 2.87 2.92 2.87 Fuel cost per mile 0.79 0.76 0.73 0.68 0.66 Total scheduled repair cost per mile 0.13 0.14 0.15 0.11 0.12 Total unscheduled repair cost per mile 0.65 0.60 0.53 0.12 0.13 Total maintenance cost per mile 0.79 0.75 0.68 0.23 0.25 Total operating cost per mile 1.58 1.51 1.41 0.91 0.90
Maintenance Costs
Van Hool Diesel
9/11–4/12 Early
Service
Van Hool Diesel
5/12–12/14 Data
Period
Van Hool Diesel
11/13–12/14 Report
Evaluation Period
Gillig Diesel
7/13–12/14 Data
Period
Gillig Diesel
11/13–12/14 Report
Evaluation Period
Fleet mileage 83,676 425,724 226,166 911,819 685,681 Total parts cost 23,520.4 124,847.3 57,555.6 42,822.5 35,835.5 Total labor hours 837.8 3,873.5 1,921.7 3,358.3 2,669.7 Average labor cost (@ $50.00 per hour) 41,890.50 193,673.50 96,083.00 167,914.50 133,487.00 Total maintenance cost 65,410.94 318,520.75 153,638.63 210,736.96 169,322.52 Total maintenance cost per bus 21,803.65 79,630.19 38,409.66 52,684.24 42,330.63 Total maintenance cost per mile 0.78 0.75 0.68 0.23 0.25

51
This report is available at no cost from the National Renewable Energy Laboratory (NREL) at www.nrel.gov/publications.
Breakdown of Maintenance Costs by Vehicle System
Van Hool Diesel
9/11–4/12 Early
Service
Van Hool Diesel
5/12–12/14 Data
Period
Van Hool Diesel
11/13–12/14 Report
Evaluation Period
Gillig Diesel
7/13–12/14 Data
Period
Gillig Diesel 11/13–12/14
Report Evaluation
Period Fleet mileage 83,676 425,724 226,166 911,819 685,681 Total Engine/Fuel-Related Systems (ATA VMRS 27, 30, 31, 32, 33, 41, 42, 43, 44, 45, 46, 65) Parts cost 8,142.90 47,153.10 17,930.50 22,574.86 18,102.44 Labor hours 201.9 1,112.3 474.4 597.0 491.3 Average labor cost 10,092.50 55,614.50 23,719.50 29,850.00 24,562.50 Total cost (for system) 18,235.40 102,767.60 41,650.00 52,424.86 42,664.94 Total cost (for system) per bus 6,078.47 25,691.90 10,412.50 13,106.21 10,666.24 Total cost (for system) per mile 0.22 0.24 0.18 0.06 0.06 Exhaust System Repairs (ATA VMRS 43) Parts cost 217.32 16,597.70 5,086.94 42.71 42.71 Labor hours 3.4 182.4 74.8 24.2 24.2 Average labor cost 170.00 9,117.50 3,737.50 1,210.50 1,210.50 Total cost (for system) 387.32 25,715.20 8,824.44 1,253.21 1,253.21 Total cost (for system) per bus 129.11 6,428.80 2,206.11 313.30 313.30 Total cost (for system) per mile 0.00 0.06 0.04 0.00 0.00 Fuel System Repairs (ATA VMRS 44) Parts cost 692.04 3,742.44 1,303.16 4,341.37 3,313.07 Labor hours 9.6 108.3 32.2 51.5 31.6 Average labor cost 480.00 5,414.50 1,609.50 2,573.00 1,578.00 Total cost (for system) 1,172.04 9,156.94 2,912.66 6,914.37 4,891.07 Total cost (for system) per bus 390.68 2,289.23 728.17 1,728.59 1,222.77 Total cost (for system) per mile 0.01 0.02 0.01 0.01 0.01 Power Plant (Engine) Repairs (ATA VMRS 45) Parts cost 3,767.42 5,205.46 1,530.22 4,973.59 3,278.76 Labor hours 100.0 307.6 115.6 167.7 132.5 Average labor cost 5,000.00 15,379.00 5,779.00 8,386.00 6,626.00 Total cost (for system) 8,767.42 20,584.46 7,309.22 13,359.59 9,904.76 Total cost (for system) per bus 2,922.47 5,146.11 1,827.31 3,339.90 2,476.19 Total cost (for system) per mile 0.10 0.05 0.03 0.01 0.01 Electric Propulsion Repairs (ATA VMRS 46)
Parts cost 0.00 0.00 0.00 0.00 0.00 Labor hours 0.0 0.0 0.0 0.0 0.0 Average labor cost 0.00 0.00 0.00 0.00 0.00 Total cost (for system) 0.00 0.00 0.00 0.00 0.00 Total cost (for system) per bus 0.00 0.00 0.00 0.00 0.00 Total cost (for system) per mile 0.00 0.00 0.00 0.00 0.00

52
This report is available at no cost from the National Renewable Energy Laboratory (NREL) at www.nrel.gov/publications.
Breakdown of Maintenance Costs by Vehicle System (continued)
Van Hool Diesel
9/11–4/12 Early
Service
Van Hool Diesel
5/12–12/14 Data
Period
Van Hool Diesel
11/13–12/14 Report
Evaluation Period
Gillig Diesel
7/13–12/14 Data
Period
Gillig Diesel 11/13–12/14
Report Evaluation
Period Electrical System Repairs (ATA VMRS 30-Electrical General, 31-Charging, 32-Cranking, 33-Ignition) Parts cost 51.63 3,410.72 909.86 2,021.99 1,880.11 Labor hours 20.7 76.0 37.5 134.9 110.1 Average labor cost 1,032.50 3,801.00 1,876.00 6,745.00 5,505.00 Total cost (for system) 1,084.13 7,211.72 2,785.86 8,766.99 7,385.11 Total cost (for system) per bus 361.38 1,802.93 696.46 2,191.75 1,846.28 Total cost (for system) per mile 0.01 0.02 0.01 0.01 0.01 Air Intake System Repairs (ATA VMRS 41) Parts cost 801.89 3,988.27 2,921.71 4,828.69 4,012.04 Labor hours 16.9 112.9 51.8 59.3 55.5 Average labor cost 845.00 5,645.50 2,590.50 2,964.00 2,774.00 Total cost (for system) 1,646.89 9,633.77 5,512.21 7,792.69 6,786.04 Total cost (for system) per bus 548.96 2,408.44 1,378.05 1,948.17 1,696.51 Total cost (for system) per mile 0.02 0.02 0.02 0.01 0.01 Cooling System Repairs (ATA VMRS 42) Parts cost 1,484.11 11,773.15 5,524.64 4,807.48 4,445.32 Labor hours 48.0 241.3 142.1 58.8 52.2 Average labor cost 2,400.00 12,062.50 7,102.50 2,937.50 2,610.00 Total cost (for system) 3,884.11 23,835.65 12,627.14 7,744.98 7,055.32 Total cost (for system) per bus 1,294.70 5,958.91 3,156.79 1,936.24 1,763.83 Total cost (for system) per mile 0.05 0.06 0.06 0.01 0.01 Hydraulic System Repairs (ATA VMRS 65) Parts cost 0.00 1,807.22 243.29 786.72 619.40 Labor hours 0.0 45.3 4.1 9.3 9.1 Average labor cost 0.00 2,267.00 207.00 462.50 452.50 Total cost (for system) 0.00 4,074.22 450.29 1,249.22 1,071.90 Total cost (for system) per bus 0.00 1,018.56 112.57 312.31 267.98 Total cost (for system) per mile 0.00 0.01 0.00 0.00 0.00 General Air System Repairs (ATA VMRS 10) Parts cost 723.46 3,921.57 1,927.47 50.77 50.77 Labor hours 35.7 166.7 71.1 20.8 19.8 Average labor cost 1,785.00 8,336.50 3,556.50 1,041.00 991.00 Total cost (for system) 2,508.46 12,258.07 5,483.97 1,091.77 1,041.77 Total cost (for system) per bus 836.15 3,064.52 1,370.99 272.94 260.44 Total cost (for system) per mile 0.03 0.03 0.02 0.00 0.00
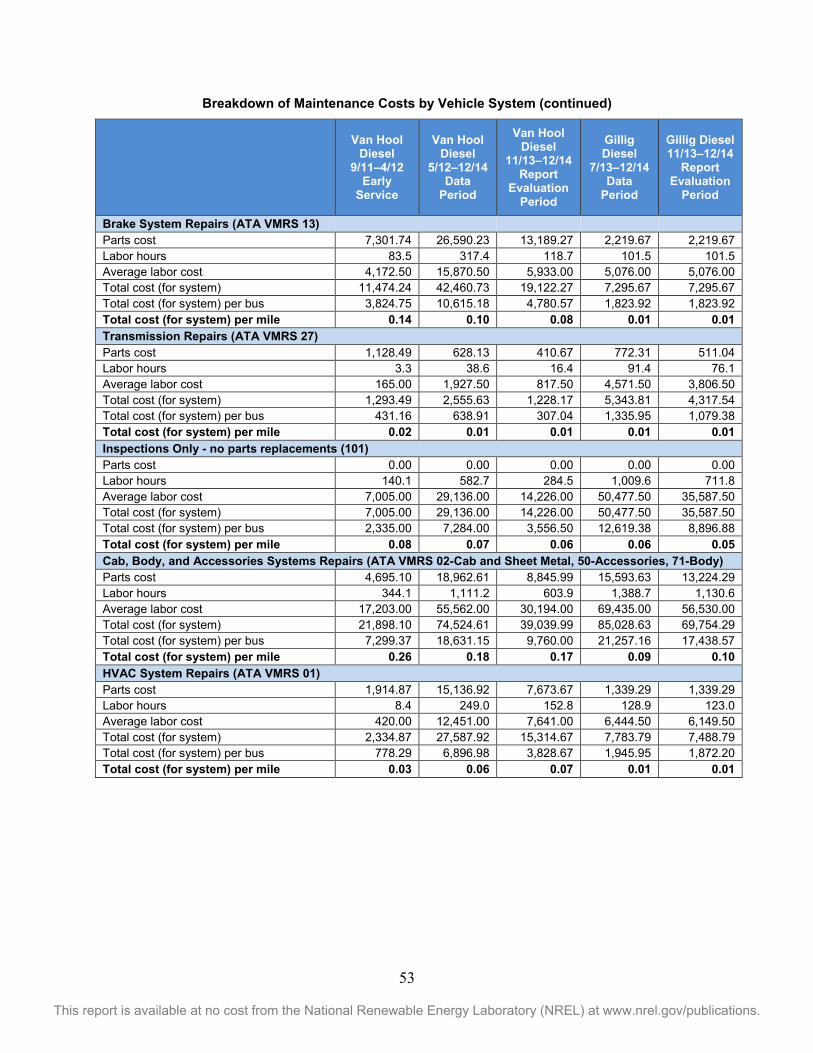
53
This report is available at no cost from the National Renewable Energy Laboratory (NREL) at www.nrel.gov/publications.
Breakdown of Maintenance Costs by Vehicle System (continued)
Van Hool Diesel
9/11–4/12 Early
Service
Van Hool Diesel
5/12–12/14 Data
Period
Van Hool Diesel
11/13–12/14 Report
Evaluation Period
Gillig Diesel
7/13–12/14 Data
Period
Gillig Diesel 11/13–12/14
Report Evaluation
Period
Brake System Repairs (ATA VMRS 13) Parts cost 7,301.74 26,590.23 13,189.27 2,219.67 2,219.67 Labor hours 83.5 317.4 118.7 101.5 101.5 Average labor cost 4,172.50 15,870.50 5,933.00 5,076.00 5,076.00 Total cost (for system) 11,474.24 42,460.73 19,122.27 7,295.67 7,295.67 Total cost (for system) per bus 3,824.75 10,615.18 4,780.57 1,823.92 1,823.92 Total cost (for system) per mile 0.14 0.10 0.08 0.01 0.01 Transmission Repairs (ATA VMRS 27) Parts cost 1,128.49 628.13 410.67 772.31 511.04 Labor hours 3.3 38.6 16.4 91.4 76.1 Average labor cost 165.00 1,927.50 817.50 4,571.50 3,806.50 Total cost (for system) 1,293.49 2,555.63 1,228.17 5,343.81 4,317.54 Total cost (for system) per bus 431.16 638.91 307.04 1,335.95 1,079.38 Total cost (for system) per mile 0.02 0.01 0.01 0.01 0.01 Inspections Only - no parts replacements (101) Parts cost 0.00 0.00 0.00 0.00 0.00 Labor hours 140.1 582.7 284.5 1,009.6 711.8 Average labor cost 7,005.00 29,136.00 14,226.00 50,477.50 35,587.50 Total cost (for system) 7,005.00 29,136.00 14,226.00 50,477.50 35,587.50 Total cost (for system) per bus 2,335.00 7,284.00 3,556.50 12,619.38 8,896.88 Total cost (for system) per mile 0.08 0.07 0.06 0.06 0.05 Cab, Body, and Accessories Systems Repairs (ATA VMRS 02-Cab and Sheet Metal, 50-Accessories, 71-Body) Parts cost 4,695.10 18,962.61 8,845.99 15,593.63 13,224.29 Labor hours 344.1 1,111.2 603.9 1,388.7 1,130.6 Average labor cost 17,203.00 55,562.00 30,194.00 69,435.00 56,530.00 Total cost (for system) 21,898.10 74,524.61 39,039.99 85,028.63 69,754.29 Total cost (for system) per bus 7,299.37 18,631.15 9,760.00 21,257.16 17,438.57 Total cost (for system) per mile 0.26 0.18 0.17 0.09 0.10 HVAC System Repairs (ATA VMRS 01) Parts cost 1,914.87 15,136.92 7,673.67 1,339.29 1,339.29 Labor hours 8.4 249.0 152.8 128.9 123.0 Average labor cost 420.00 12,451.00 7,641.00 6,444.50 6,149.50 Total cost (for system) 2,334.87 27,587.92 15,314.67 7,783.79 7,488.79 Total cost (for system) per bus 778.29 6,896.98 3,828.67 1,945.95 1,872.20 Total cost (for system) per mile 0.03 0.06 0.07 0.01 0.01

54
This report is available at no cost from the National Renewable Energy Laboratory (NREL) at www.nrel.gov/publications.
Breakdown of Maintenance Costs by Vehicle System (continued)
Van Hool Diesel
9/11–4/12 Early
Service
Van Hool Diesel
5/12–12/14 Data
Period
Van Hool Diesel
11/13–12/14 Report
Evaluation Period
Gillig Diesel
7/13–12/14 Data
Period
Gillig Diesel 11/13–12/14
Report Evaluation
Period Lighting System Repairs (ATA VMRS 34) Parts cost 71.59 1,224.45 613.43 592.47 587.16 Labor hours 1.3 68.5 48.5 35.7 33.2 Average labor cost 62.50 3,423.00 2,423.00 1,786.50 1,661.50 Total cost (for system) 134.09 4,647.45 3,036.43 2,378.97 2,248.66 Total cost (for system) per bus 44.70 1,161.86 759.11 594.74 562.17 Total cost (for system) per mile 0.00 0.01 0.01 0.00 0.00 Frame, Steering, and Suspension Repairs (ATA VMRS 14-Frame, 15-Steering, 16-Suspension) Parts cost 375.92 6,539.18 4,554.35 218.39 89.20 Labor hours 10.5 112.1 64.0 35.5 21.5 Average labor cost 525.00 5,603.00 3,198.00 1,773.00 1,073.00 Total cost (for system) 900.92 12,142.18 7,752.35 1,991.39 1,162.20 Total cost (for system) per bus 300.31 3,035.54 1,938.09 497.85 290.55 Total cost (for system) per mile 0.01 0.03 0.03 0.00 0.00 Axle, Wheel, and Drive Shaft Repairs (ATA VMRS 11-Front Axle, 18-Wheels, 22-Rear Axle, 24-Drive Shaft) Parts cost 294.86 5,310.44 2,772.77 233.39 222.70 Labor hours 12.5 150.5 101.8 23.8 21.3 Average labor cost 625.00 7,527.00 5,092.00 1,189.50 1,064.50 Total cost (for system) 919.86 12,837.44 7,864.77 1,422.89 1,287.20 Total cost (for system) per bus 306.62 3,209.36 1,966.19 355.72 321.80 Total cost (for system) per mile 0.01 0.03 0.03 0.00 0.00 Tire Repairs (ATA VMRS 17) Parts cost 0.00 0.00 0.00 0.00 0.00 Labor hours 0.00 8.0 2.0 16.8 15.8 Average labor cost 0.00 400.00 100.00 841.50 791.50 Total cost (for system) 0.00 400.00 100.00 841.50 791.50 Total cost (for system) per bus 0.00 100.00 25.00 210.38 197.88 Total cost (for system) per mile 0.00 0.00 0.00 0.00 0.00
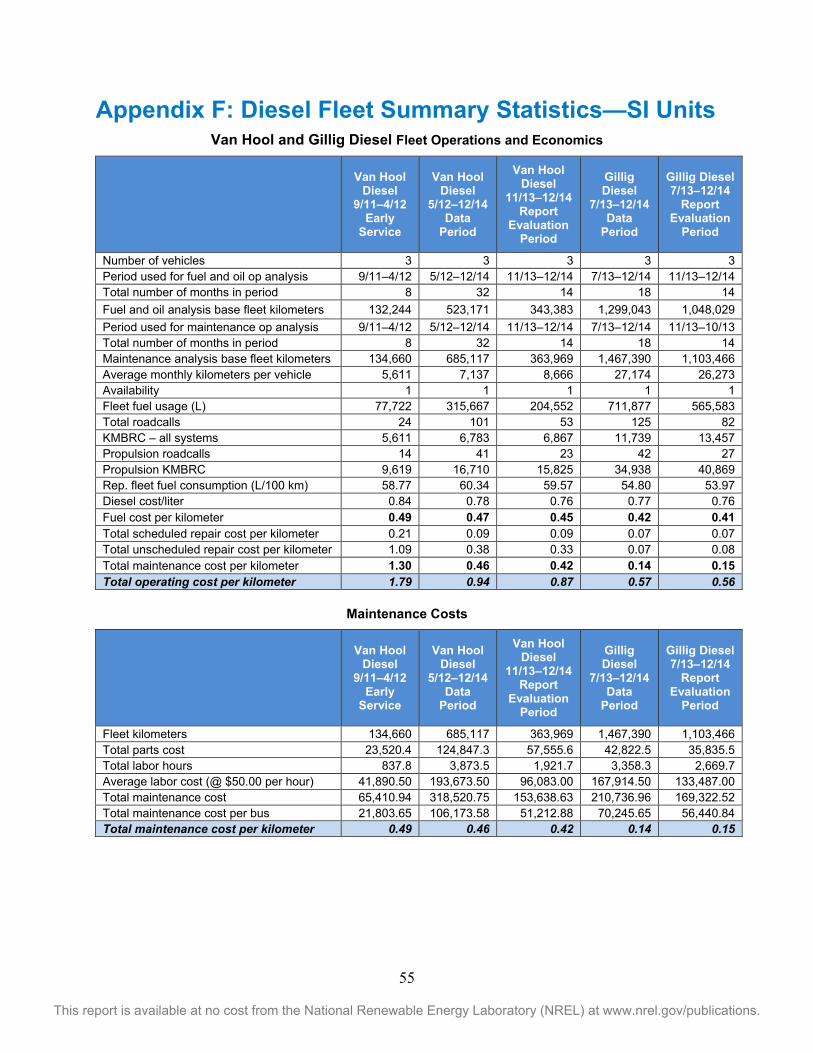
55
This report is available at no cost from the National Renewable Energy Laboratory (NREL) at www.nrel.gov/publications.
Appendix F: Diesel Fleet Summary Statistics—SI Units Van Hool and Gillig Diesel Fleet Operations and Economics
Van Hool Diesel
9/11–4/12 Early
Service
Van Hool Diesel
5/12–12/14 Data
Period
Van Hool Diesel
11/13–12/14 Report
Evaluation Period
Gillig Diesel
7/13–12/14 Data
Period
Gillig Diesel 7/13–12/14
Report Evaluation
Period
Number of vehicles 3 3 3 3 3 Period used for fuel and oil op analysis 9/11–4/12 5/12–12/14 11/13–12/14 7/13–12/14 11/13–12/14 Total number of months in period 8 32 14 18 14 Fuel and oil analysis base fleet kilometers 132,244 523,171 343,383 1,299,043 1,048,029 Period used for maintenance op analysis 9/11–4/12 5/12–12/14 11/13–12/14 7/13–12/14 11/13–10/13 Total number of months in period 8 32 14 18 14 Maintenance analysis base fleet kilometers 134,660 685,117 363,969 1,467,390 1,103,466 Average monthly kilometers per vehicle 5,611 7,137 8,666 27,174 26,273 Availability 1 1 1 1 1 Fleet fuel usage (L) 77,722 315,667 204,552 711,877 565,583 Total roadcalls 24 101 53 125 82 KMBRC – all systems 5,611 6,783 6,867 11,739 13,457 Propulsion roadcalls 14 41 23 42 27 Propulsion KMBRC 9,619 16,710 15,825 34,938 40,869 Rep. fleet fuel consumption (L/100 km) 58.77 60.34 59.57 54.80 53.97 Diesel cost/liter 0.84 0.78 0.76 0.77 0.76 Fuel cost per kilometer 0.49 0.47 0.45 0.42 0.41 Total scheduled repair cost per kilometer 0.21 0.09 0.09 0.07 0.07 Total unscheduled repair cost per kilometer 1.09 0.38 0.33 0.07 0.08 Total maintenance cost per kilometer 1.30 0.46 0.42 0.14 0.15 Total operating cost per kilometer 1.79 0.94 0.87 0.57 0.56
Maintenance Costs
Van Hool Diesel
9/11–4/12 Early
Service
Van Hool Diesel
5/12–12/14 Data
Period
Van Hool Diesel
11/13–12/14 Report
Evaluation Period
Gillig Diesel
7/13–12/14 Data
Period
Gillig Diesel 7/13–12/14
Report Evaluation
Period
Fleet kilometers 134,660 685,117 363,969 1,467,390 1,103,466 Total parts cost 23,520.4 124,847.3 57,555.6 42,822.5 35,835.5 Total labor hours 837.8 3,873.5 1,921.7 3,358.3 2,669.7 Average labor cost (@ $50.00 per hour) 41,890.50 193,673.50 96,083.00 167,914.50 133,487.00 Total maintenance cost 65,410.94 318,520.75 153,638.63 210,736.96 169,322.52 Total maintenance cost per bus 21,803.65 106,173.58 51,212.88 70,245.65 56,440.84 Total maintenance cost per kilometer 0.49 0.46 0.42 0.14 0.15

56
This report is available at no cost from the National Renewable Energy Laboratory (NREL) at www.nrel.gov/publications.
Appendix G: Diesel Monthly Labor Hour Graphs
Figure G-1. Monthly labor hours by category for the Van Hool diesel buses
Figure G-2. Monthly cost per mile by category for the Van Hool diesel buses
0
2
4
6
8
10
12
14
16
Labo
r Hou
rs p
er 1
,000
mile
s
Tires
General airsystem repairsAxles, wheels,and drive shaftLighting
HVAC
Frame, steering,and suspensionBrakes
PMI
Propulsion-relatedCab, body, andaccessories
$0.00
$0.20
$0.40
$0.60
$0.80
$1.00
$1.20
$1.40
$1.60
Cos
t per
mile
Tires
General airsystem repairsAxles, wheels,and drive shaftLighting
HVAC
Frame, steering,and suspensionBrakes
PMI
Propulsion-relatedCab, body, andaccessories

57
This report is available at no cost from the National Renewable Energy Laboratory (NREL) at www.nrel.gov/publications.
Figure G-3. Monthly propulsion system labor hours by sub-category for the Van Hool diesel buses
Figure G-4. Monthly propulsion system cost per mile by sub-category for the Van Hool diesel
buses
0
1
2
3
4
5
6
7
8La
bor H
ours
per
1,0
00 m
iles
TransmissionFuel SystemCoolingAir IntakeCranking/ChargingElectricalEngine
$0.00
$0.20
$0.40
$0.60
$0.80
$1.00
$1.20
Cos
t per
mile
HydraulicTransmissionFuel SystemExhaustCoolingAir IntakeCranking/ChargingElectricalEngine

58
This report is available at no cost from the National Renewable Energy Laboratory (NREL) at www.nrel.gov/publications.
Figure G-5. Monthly labor hours by category for the Gillig diesel buses
Figure G-6. Monthly cost per mile by category for the Gillig diesel buses
0
2
4
6
8
10
12
14
16La
bor H
ours
per
1,0
00 m
iles
Tires
General airsystem repairsAxles, wheels,and drive shaftLighting
HVAC
Frame, steering,and suspensionBrakes
PMI
Propulsion-relatedCab, body, andaccessories
$0.00
$0.20
$0.40
$0.60
$0.80
$1.00
$1.20
$1.40
$1.60
Cos
t per
mile
Tires
General airsystem repairsAxles, wheels,and drive shaftLighting
HVAC
Frame, steering,and suspensionBrakes
PMI
Propulsion-relatedCab, body, andaccessories

59
This report is available at no cost from the National Renewable Energy Laboratory (NREL) at www.nrel.gov/publications.
Figure G-7. Monthly propulsion system labor hours by sub-category for the Gillig diesel buses
Figure G-8. Monthly propulsion system cost per mile by sub-category for the Gillig diesel buses
0
1
2
3
4
5
6
7
8La
bor H
ours
per
1,0
00 m
iles
TransmissionFuel SystemCoolingAir IntakeCranking/ChargingElectricalEngine
$0.00
$0.20
$0.40
$0.60
$0.80
$1.00
$1.20
Cos
t per
mile
HydraulicTransmissionFuel SystemExhaustCoolingAir IntakeCranking/ChargingElectricalEngine