zh 33251263
TRANSCRIPT
American Journal of Engineering Research (AJER) 2014
w w w . a j e r . o r g
Page 251
American Journal of Engineering Research (AJER)
e-ISSN : 2320-0847 p-ISSN : 2320-0936
Volume-03, Issue-03, pp-251-263
www.ajer.org
Research Paper Open Access
Perceptron system to assist in decision making and monitoring of
quality of software development in Information Technology
environments
Chau Sen Shia, Ivanir Costa Doctor, Production Engineering, Department of Postgraduate Production Engineering, University Paulista
UNIP. São Paulo, SP - Brazil,
Doctor, Production Engineering, Department of Postgraduate Production Engineering, University Paulista
UNIP. São Paulo, SP - Brazil,
Abstract: - Classical methods for software development require high costs and problems of communication
between development teams, project risks and delays in the delivery of its services.
In this work, the aim is to develop a perceptron model to demonstrate the ability to control, service quality
assessment and decision-making in IT (Information Technology). For this, we used perceptron network techniques, standards of service quality measures and risk analysis model of applied projects in software
engineering.
With the network perceptron model implementation was possible to simulate the application of development in
several requests for applications for software, in order to meet the management of schedules in all phases of the
life cycle of the projects carried out. The tests with the perceptron model were applied in it environments to
meet service requests from various fields. The results and analyses presented in these projects demonstrate that
communication between development teams were more consistent. It was also possible to predict with more
accuracy the delivery of services, decision making and risk reduction projects.
Keywords: - software quality, measurement of services, indicator of quality of software, perceptron network.
I. INTRODUCTION Requests for services are often held for several consultancies and many of these processes requests are evaluated negatively, not satisfying the needs of its customers, (SANTOS, 2000). This shows that to meet
customer needs, we need to identify the main risk factors that may contribute to the delay of projects and scale
qualitative values to improve the preparation of solicitation of business proposals.
A competitive company focused on customer satisfaction should consider the participation and
integration of its customers from the initial stages of the development process of its products (AGUIRRE
CARLOS GONZALEZ and TOLEDO, 2012).
Aiming to improve the quality in service delivery, the proposed model of software allowed teams to
better integrate various areas of the IT environment, as well as track the life cycle of a project from its initial
phase. Constantly knowledge base perceptron network and service quality indicator were compared with the
proposed phases of requirements gathering schedule.
The main objective of this work is the development of a perceptron model to assist in decision making in the provision of software services environments. In this form is possible to aim for better control the quality and the
interaction of all the teams involved by computing and managing the lifecycle of a software project.
II. THEORETICAL REFERENCE This section describes the main aspects related to the concepts and rationale for building the system proposed in
this paper.
2.1. The role of quality and services
American Journal of Engineering Research (AJER) 2014
w w w . a j e r . o r g
Page 252
The importance of the quality and value of the service is the measure of the degree of customer satisfaction in
relation to the requirements of price, reliability, durability, aesthetics, timeliness, taste, comfort. As the value of the service, can be quantified by the weighted sum of grades that are assigned by the data collection by weight
assignments to the notes in this way good or service receives a value, while the quality is established during the
design phase (COAST; EPPRECHIT and CARPINETTI, 2008).
To ISO 9126, the fundamental attributes of software quality can be classified into:
a) Functionality: is the degree to which the software meets the stated needs as indicated by attributes:
suitability, accuracy, interoperability, compliance and security.
b) Reliability: is the amount of time the software is available for use as indicated by the attributes: maturity,
fault tolerance, ease of retrieval.
c) Usability: is the ease of use of the software as indicated by the attributes: ease of understanding, learning,
and operability.
d) Efficiency: the degree of optimization of the use, software, system resources as attributes: behavior over
time and in relation to resources. e) Ease of Maintenance: is the ease with which a correction can be made in software as attributes: ease of
analysis, implementation of change, stability, testability.
f) Portability: the ease with which software can be transposed from one environment to another as attributes:
adaptability, ease of installation, compliance, eases of replacement.
2.2. The Likert scale The measurement based on a Likert type scale (created in 1932 by American educator and social
psychologist Likert Rensis) is an instrument that features a cast of sentences for which the respondent expresses
their degree of agreement , indicating values on a scale such as: (1) fully disagree , (2) disagree, (3) neither
agree nor disagree (4) agree, (5) fully agree. The Likert scale has several advantages: a) it is easy formulation
and implementation, b) is more objective, c) is more homogeneous and increases the probability of measuring unit attitudes. As a disadvantage, the scale turns out to quantify and standardize responses, making it impossible
to detect nuances and subtleties of attitudes, which in turn are perceived in interviews and open questionnaires
(SCOLARIS , 2009) .
On the Likert scale responses for each item varies according to the degree of intensity. This scale with
ordered, equally spaced categories and with the same number of items in all categories , is widely used in
organizational research investigating the practices of TQM (Total Quality Management) (SARAPH , 1989) ,
(BADRI , 1995) , (TAMIMI , 1995) and (ALEXANDRE , 1995).
2.3. The dividing line or boundary decision Conform to Tan, Steinbach and Kumar (2006), the limit being two border regions of different classes is
known as decision limit. The test condition involves only one attribute; the decision boundaries are straight,
parallel to the coordinate axes. There are many metrics that can be used to determine the best way to break the records. These metrics are defined in terms of the distribution of the class of the registers before and after the
division. According to Medeiros (2006), if a problem can be separated by a straight line, representing the
division between classes, says that such a problem is linearly separable, otherwise it is not told linearly
separable.
2.4. The GQM (Goal-Question-Metric) method The difficulties of obtaining measurements for the software are varieties of aspects and the presence of
many intangibles. In software projects, measurements can already be used in the requirements analysis (stage of
development) to determine how the software should work. Another way to measure is the software application
of GQM method (Goal -Question -Metric), consisting in organizing planning a software measurement in stages:
a) goals that are established according to the needs of stakeholders and must be fixed depending on the software requirements (time , number of users employed to test) , b ) issues that are set to perform work measurement
and that the questions should bring useful information to improve the product , c ) categories that divide the set,
d) forms that drive the work of evaluators ( KOSCIANSKI and SOARES, 2006) .
As Basilis and Weiss (1984), the method GQM (Goal -Question -Metric) is an organized way of
dealing with the planning work of a measurement. The method organizes the planning of a software
measurement in steps, with each step defines the following elements: a) objectives, b) questions, c) categories,
d) forms.
American Journal of Engineering Research (AJER) 2014
w w w . a j e r . o r g
Page 253
2.4.1. The SQuaRE norm The square model based on ISO / IEC 25000 defines the quality and focuses on a specific problem of measuring the quality of software products. This standard contains several examples of external and internal
metrics that can be used as a starting point for building a system of quality assessment software (KOSCIANKI
and SOARES , 2006) .
The square norm (Software Product Quality Requirement and Evaluation - Quality Requirements and
Evaluation of Software Products), according Koscianski and Soares (2006), is an evolution of ISO / IEC 9126
and ISO / IEC 14598 standards. According to Garcia (2009), the norm square reunites the processes of software
quality (ISO standard 9126) and product evaluation (default 14598) using as a base the measure of quality. The
advantages offered by Square are: a) to coordinate measures and evaluation of software quality , b ) provide a
guide for specifying requirements of software quality , c ) harmonize the existing rules with respect to ISO /
IEC 15939 , by the reference model for measuring quality belonging to the ISO / IEC 25020 standard.
2.4.2. The spiral software development model Proposed by Boehm (1988), the spiral model of evolutionary process is software that couples the
iterative nature of a prototype system aspects and controlled cascade model. Provides potential for rapid
development and increasingly more complete versions of software. The main features of the spiral model are
described as:
a) is a generator of different processes directed to scratches and is used to guide the engineering software
intensive systems, which occurs concurrently and has multiple involved.
b) It is a cyclic approach toward expanding incrementally, the degree of definition and implementation of a
system, while decreasing its degree of risk. It is a series of anchor points of control to ensure the
involvement of stakeholders as to find solutions for systems that are mutually satisfactory and practicable.
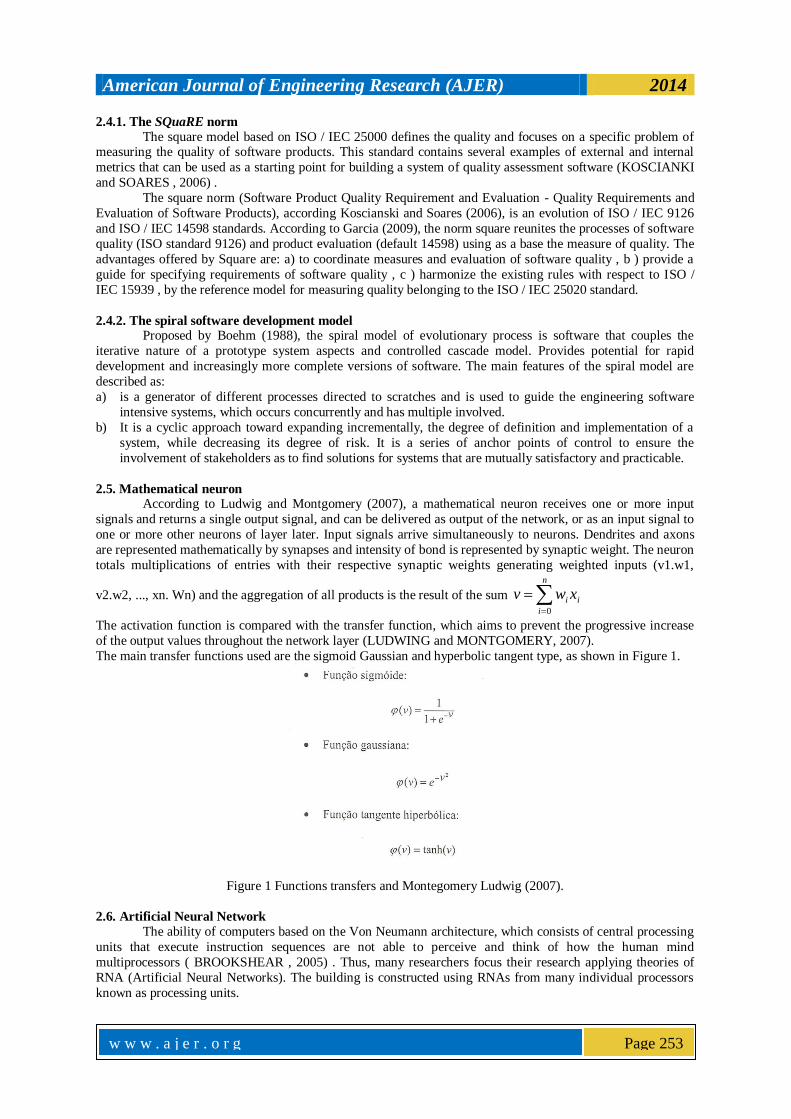
2.5. Mathematical neuron According to Ludwig and Montgomery (2007), a mathematical neuron receives one or more input
signals and returns a single output signal, and can be delivered as output of the network, or as an input signal to
one or more other neurons of layer later. Input signals arrive simultaneously to neurons. Dendrites and axons
are represented mathematically by synapses and intensity of bond is represented by synaptic weight. The neuron
totals multiplications of entries with their respective synaptic weights generating weighted inputs (v1.w1,
v2.w2, ..., xn. Wn) and the aggregation of all products is the result of the sum
n
i
ii xwv0
The activation function is compared with the transfer function, which aims to prevent the progressive increase
of the output values throughout the network layer (LUDWING and MONTGOMERY, 2007).
The main transfer functions used are the sigmoid Gaussian and hyperbolic tangent type, as shown in Figure 1.
Figure 1 Functions transfers and Montegomery Ludwig (2007).
2.6. Artificial Neural Network
The ability of computers based on the Von Neumann architecture, which consists of central processing
units that execute instruction sequences are not able to perceive and think of how the human mind
multiprocessors ( BROOKSHEAR , 2005) . Thus, many researchers focus their research applying theories of
RNA (Artificial Neural Networks). The building is constructed using RNAs from many individual processors
known as processing units.
American Journal of Engineering Research (AJER) 2014
w w w . a j e r . o r g
Page 254
Its basic function is similar to the biological network systems, composed of cell dendrites that are responsible
for the information and axon inputs that are outputs of the information generated. To Palma Neto and Nicoletti (2005), Neural Networks is a general and practical approach for learning the functions of examples method. Can
be characterized as:
a) Basic processors called neurons.
b) The activation function (representing the state of the neuron).
c) The existing pattern of connections between neurons.
d) For its training algorithm (or learning algorithm).
According to Nunes da Silva, and Spatti Flauzino (2010), the strategy of supervised training is to have
affordable, considering each sample of the input signals, their desired outputs, where each training sample is
composed of the input signals and their corresponding outputs. The synaptic weights and thresholds are then
continuously adjusted by applying comparative actions executed by the learning algorithm itself, which oversee
the discrepancy between the responses produced by the network in relation to those desired, and this difference
was used in the fitting procedure. Described below are the principal features of neural network adapted (LUDWING and Montgomery 2007).
a. A RNA should have an input layer or distribution, however has no neuron, only a number of nodes with the
same number of input signals in the network. No computation is performed in this layer.
b. Should contain a layer, zero or more hidden layers and consist of one or more hidden neurons. These layers
allow the network to extract statistics and represent problems that are not linearly separable.
c. Should contain a layer that has a number of neurons equal to the number of output signals from the network.
d. Should allow adjustment of the values of its synaptic weights, because that way the network is able to
memorize the relationships among the input data with the output, thus represented an associative memory.
2.7. Perceptron learning algorithm A neural network typically has two processing stages: the learning and use. These two moments of operation are distinct and applied in different periods.
Learning is a process of adjusting the weights of connections in response to stimuli presented to the network
(the properties are modified due to the need to learn the information presented). The process of use is the way in
which the network responds to a stimulus input occurs without changes in their structure. The models of
artificial neural networks manipulate information by the interaction of a large number of basic processing units
(AGUIAR and OLIVEIRA JUNIOR, 2007). The architecture of an artificial neural network defines how many
neurons are arranged in relation to each other. These arrangements are essentially structured to directing
synaptic connections from neurons (NUNES SILVA, SPATTI and FLAUZINO, 2010).
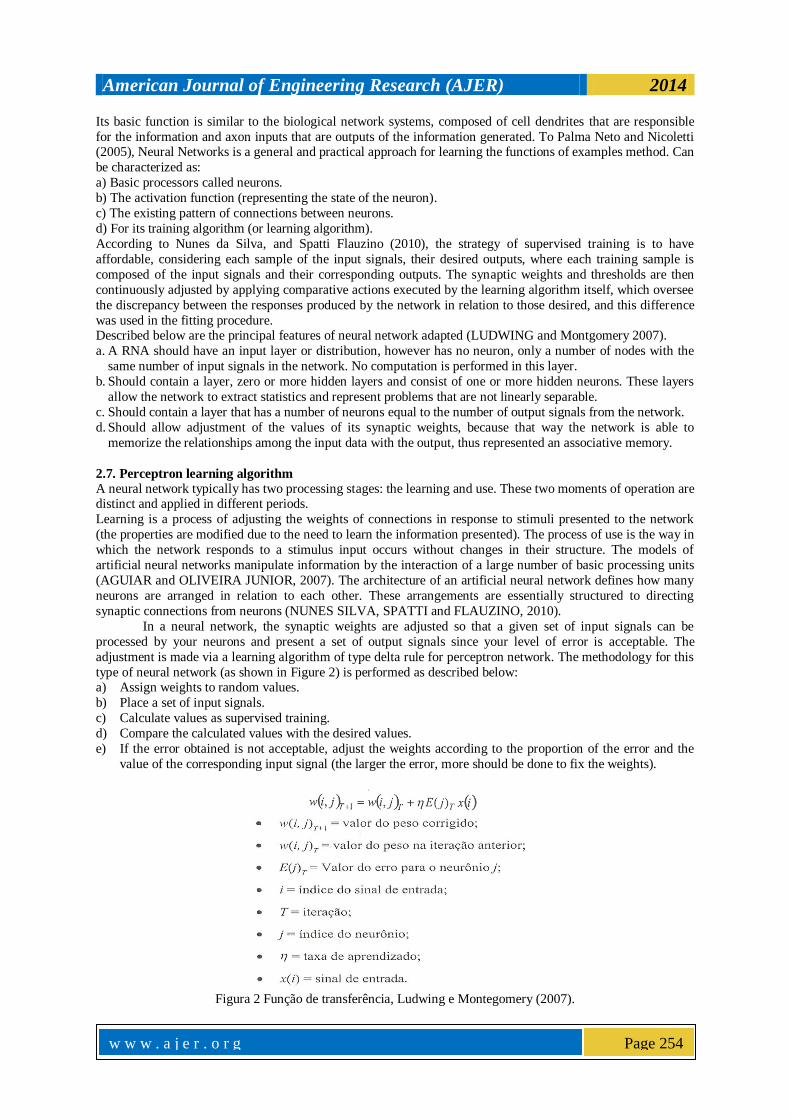
In a neural network, the synaptic weights are adjusted so that a given set of input signals can be
processed by your neurons and present a set of output signals since your level of error is acceptable. The
adjustment is made via a learning algorithm of type delta rule for perceptron network. The methodology for this
type of neural network (as shown in Figure 2) is performed as described below: a) Assign weights to random values.
b) Place a set of input signals.
c) Calculate values as supervised training.
d) Compare the calculated values with the desired values.
e) If the error obtained is not acceptable, adjust the weights according to the proportion of the error and the
value of the corresponding input signal (the larger the error, more should be done to fix the weights).
Figura 2 Função de transferência, Ludwing e Montegomery (2007).
American Journal of Engineering Research (AJER) 2014
w w w . a j e r . o r g
Page 255
The error E (j) is the difference between the output signal (desired) to neuron j, represented by d (j). As y (j) is
the output signal calculated by the neuron network for that, as shown in Equation 2. For the average error of all
the neurons of the output layer interaction T is: , where n equals the number of neurons of the
output layer. The average error for the entire training set is: .
The value of the mean error (as shown in Figure 3) can be used as a reference for termination of training and
assessment for fine tuning the network.
; ; Figure 3 Transfer function, Montegomery and Ludwig (2007).
According to Aguiar and Oliveira Jr. (2007), the type of training can be supervised or unsupervised.
Training is supervised when the parameter setting is done on presentation of a set of pairs of inputs and outputs
standard. In this process, a default entry is presented to the network and an output is calculated. You
unsupervised learning the set of training patterns has only entries. In this process, there is no standard output is
not shown to the network a known standard. To Nunes da Silva, and Spatti Fauzino (2010), the process of
training a neural network consists of the application of ordered steps that are necessary for synchronization of
synaptic weights and thresholds of their neurons, with the ultimate goal to generalize solutions to be produced
by their exits and their responses are representative of the physical system that are called mapping and learning
algorithm.
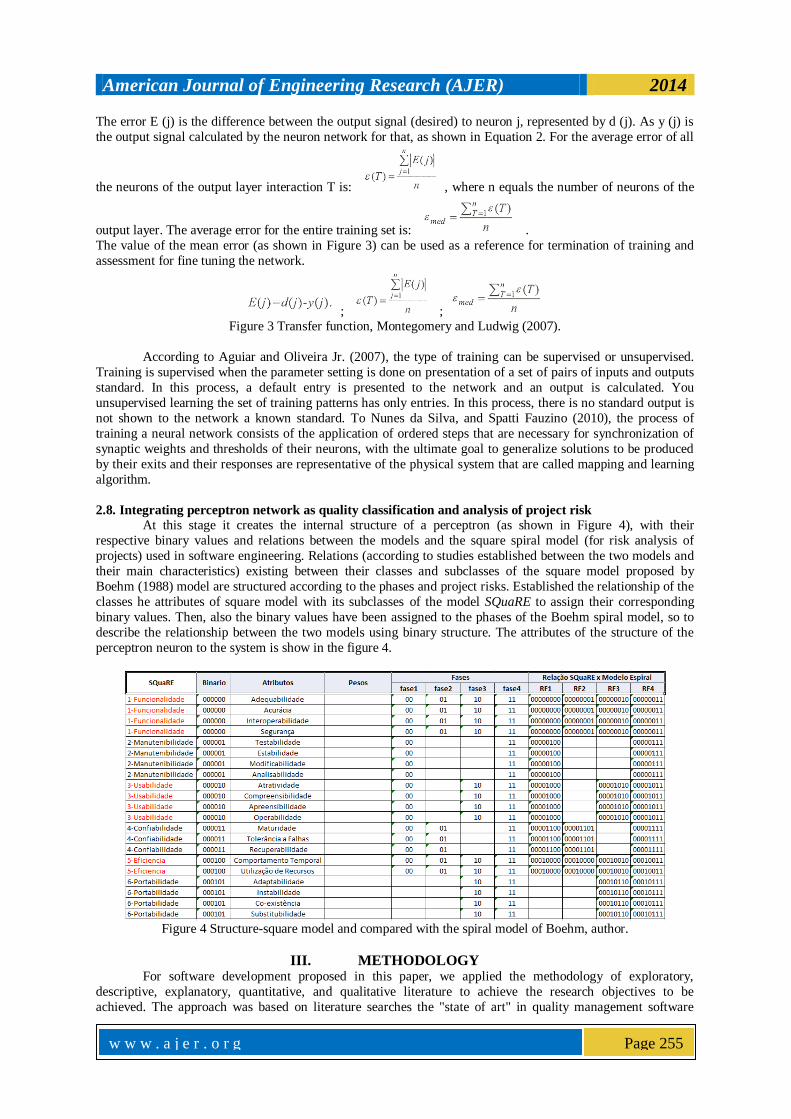
2.8. Integrating perceptron network as quality classification and analysis of project risk
At this stage it creates the internal structure of a perceptron (as shown in Figure 4), with their
respective binary values and relations between the models and the square spiral model (for risk analysis of
projects) used in software engineering. Relations (according to studies established between the two models and
their main characteristics) existing between their classes and subclasses of the square model proposed by
Boehm (1988) model are structured according to the phases and project risks. Established the relationship of the
classes he attributes of square model with its subclasses of the model SQuaRE to assign their corresponding
binary values. Then, also the binary values have been assigned to the phases of the Boehm spiral model, so to
describe the relationship between the two models using binary structure. The attributes of the structure of the
perceptron neuron to the system is show in the figure 4.
Figure 4 Structure-square model and compared with the spiral model of Boehm, author.
III. METHODOLOGY For software development proposed in this paper, we applied the methodology of exploratory,
descriptive, explanatory, quantitative, and qualitative literature to achieve the research objectives to be
achieved. The approach was based on literature searches the "state of art" in quality management software
American Journal of Engineering Research (AJER) 2014
w w w . a j e r . o r g
Page 256
development services, software measures, standards Square, Boehm spiral model of software and technical
network perceptron. After the literature review, the risk factors of projects were identified, the negative evaluation process of service requests and software problems in measurements of impacts.
Upon approach , we identified the main characteristics of measuring quality of software product
proposed by the international standard ISO / IEC 25000 , the spiral model proposed by Boehm (1988 ) , for risk
analysis software design , technical network perceptron to assist in project risk analysis , using as a basis the
opinions of experts , transforming the data collected by checklist form the basis of learning for risk assessment
of projects aided by the perceptron network capacity rating risk impacts project (OLIVEIRA JUNIOR , 2007) .
Was applied in this work, a list of issues with the quality attributes presented by Square model are:
functionality, maintainability, usability, reliability, efficiency and portability. Data collection was performed
using the experiences of experts in the field of development consisting of a project manager, a system analyst
and software developer.
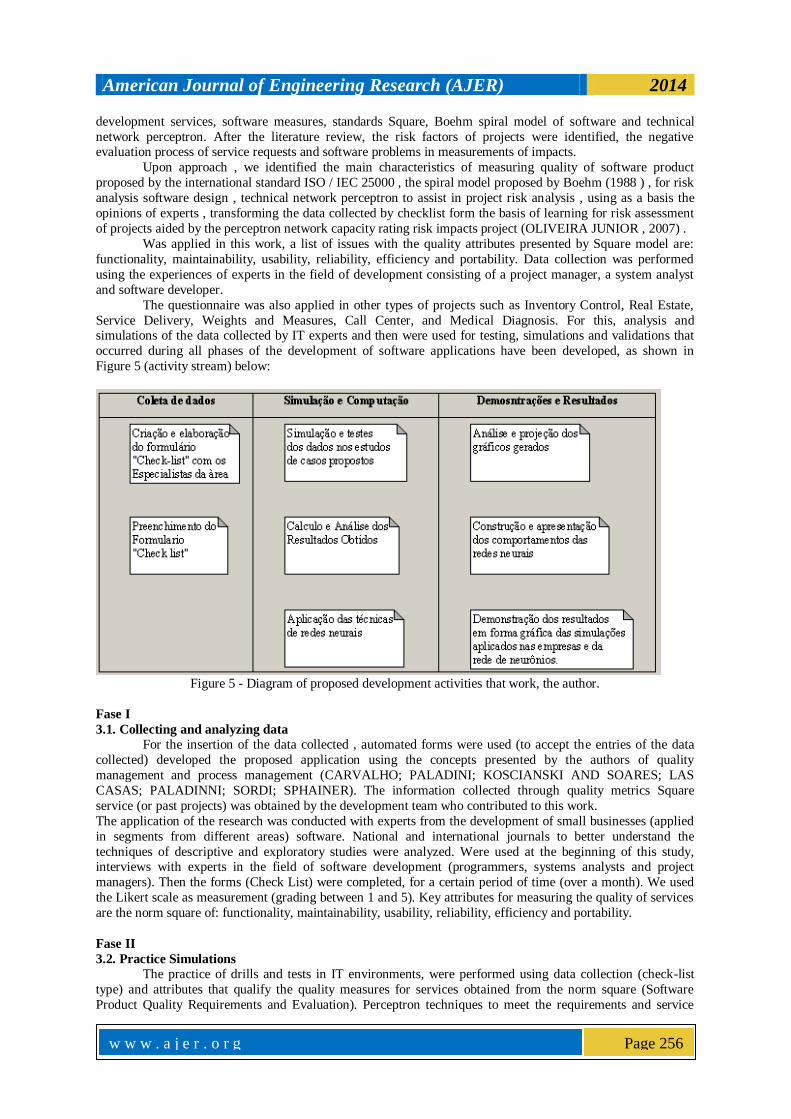
The questionnaire was also applied in other types of projects such as Inventory Control, Real Estate,
Service Delivery, Weights and Measures, Call Center, and Medical Diagnosis. For this, analysis and simulations of the data collected by IT experts and then were used for testing, simulations and validations that
occurred during all phases of the development of software applications have been developed, as shown in
Figure 5 (activity stream) below:
Figure 5 - Diagram of proposed development activities that work, the author.
Fase I
3.1. Collecting and analyzing data For the insertion of the data collected , automated forms were used (to accept the entries of the data
collected) developed the proposed application using the concepts presented by the authors of quality
management and process management (CARVALHO; PALADINI; KOSCIANSKI AND SOARES; LAS
CASAS; PALADINNI; SORDI; SPHAINER). The information collected through quality metrics Square
service (or past projects) was obtained by the development team who contributed to this work.
The application of the research was conducted with experts from the development of small businesses (applied
in segments from different areas) software. National and international journals to better understand the
techniques of descriptive and exploratory studies were analyzed. Were used at the beginning of this study, interviews with experts in the field of software development (programmers, systems analysts and project
managers). Then the forms (Check List) were completed, for a certain period of time (over a month). We used
the Likert scale as measurement (grading between 1 and 5). Key attributes for measuring the quality of services
are the norm square of: functionality, maintainability, usability, reliability, efficiency and portability.
Fase II
3.2. Practice Simulations
The practice of drills and tests in IT environments, were performed using data collection (check-list
type) and attributes that qualify the quality measures for services obtained from the norm square (Software
Product Quality Requirements and Evaluation). Perceptron techniques to meet the requirements and service
American Journal of Engineering Research (AJER) 2014
w w w . a j e r . o r g
Page 257
requests in IT network environments were applied. During the risk assessment project we used the spiral model
proposed by Boehm with the participation of specialists of IT field for analysis and management of software projects. The following describes the main techniques and resources used to develop the proposed application of
this work.
3.2.1. The application of the perceptron network with the square model The structure of Multilayer Perceptron network was used for the integration of attributes that define the
square model for assessing the quality of services. The attributes of entries are: functionality (000000),
maintainability (000001), usability (000010), reliability (000011), efficiency (000100) and portability (000101),
which has their corresponding binary values. As Medeiros (2006), in a multilayer perceptron model can contain
many internal layers, besides the input and output layers. Weight values, bias, and references to settings and
shots of the transfer functions of neurons as the values of the weighted sums thresholds are assigned. The
functions used for the thresholds of shots are the step type:
0,1
0,1
x
xxfy .
Fase III
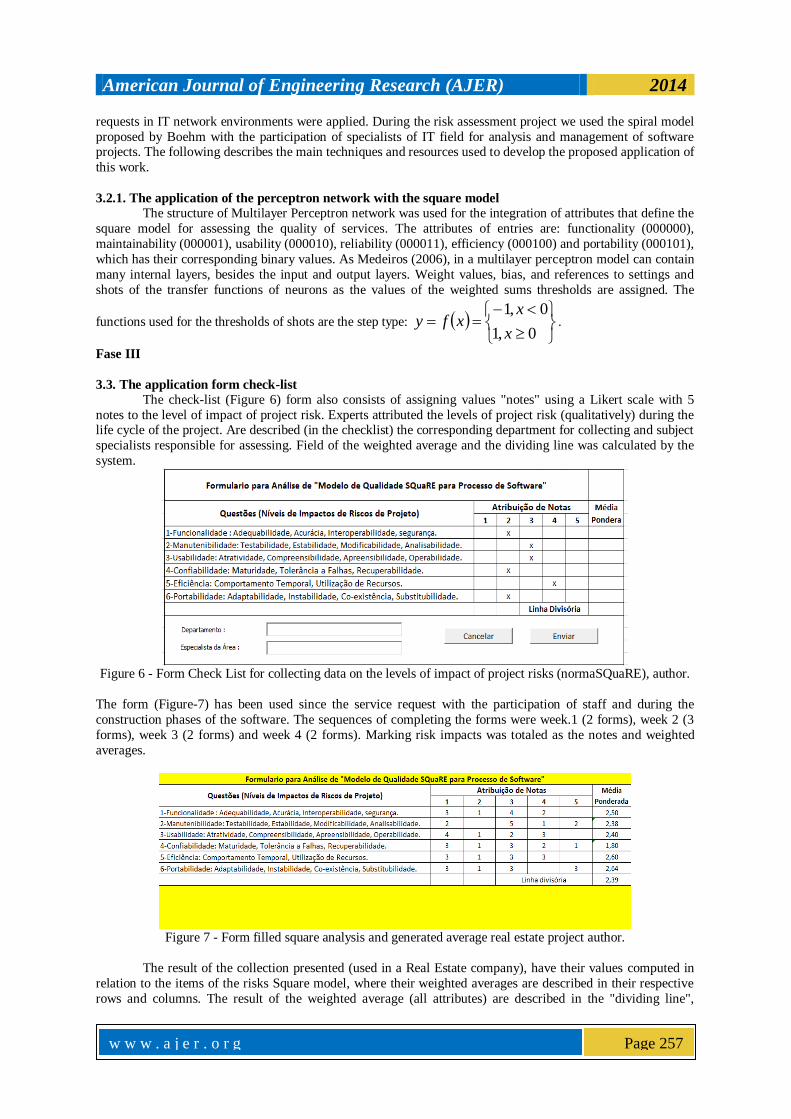
3.3. The application form check-list The check-list (Figure 6) form also consists of assigning values "notes" using a Likert scale with 5
notes to the level of impact of project risk. Experts attributed the levels of project risk (qualitatively) during the life cycle of the project. Are described (in the checklist) the corresponding department for collecting and subject
specialists responsible for assessing. Field of the weighted average and the dividing line was calculated by the
system.
Figure 6 - Form Check List for collecting data on the levels of impact of project risks (normaSQuaRE), author.
The form (Figure-7) has been used since the service request with the participation of staff and during the
construction phases of the software. The sequences of completing the forms were week.1 (2 forms), week 2 (3
forms), week 3 (2 forms) and week 4 (2 forms). Marking risk impacts was totaled as the notes and weighted
averages.
Figure 7 - Form filled square analysis and generated average real estate project author.
The result of the collection presented (used in a Real Estate company), have their values computed in
relation to the items of the risks Square model, where their weighted averages are described in their respective
rows and columns. The result of the weighted average (all attributes) are described in the "dividing line",
American Journal of Engineering Research (AJER) 2014
w w w . a j e r . o r g
Page 258
representing an overview of project risk with the value of 2.35 (below the average level of the impact of risk
was set at a value 2.5 by the experts as the Likert scale).
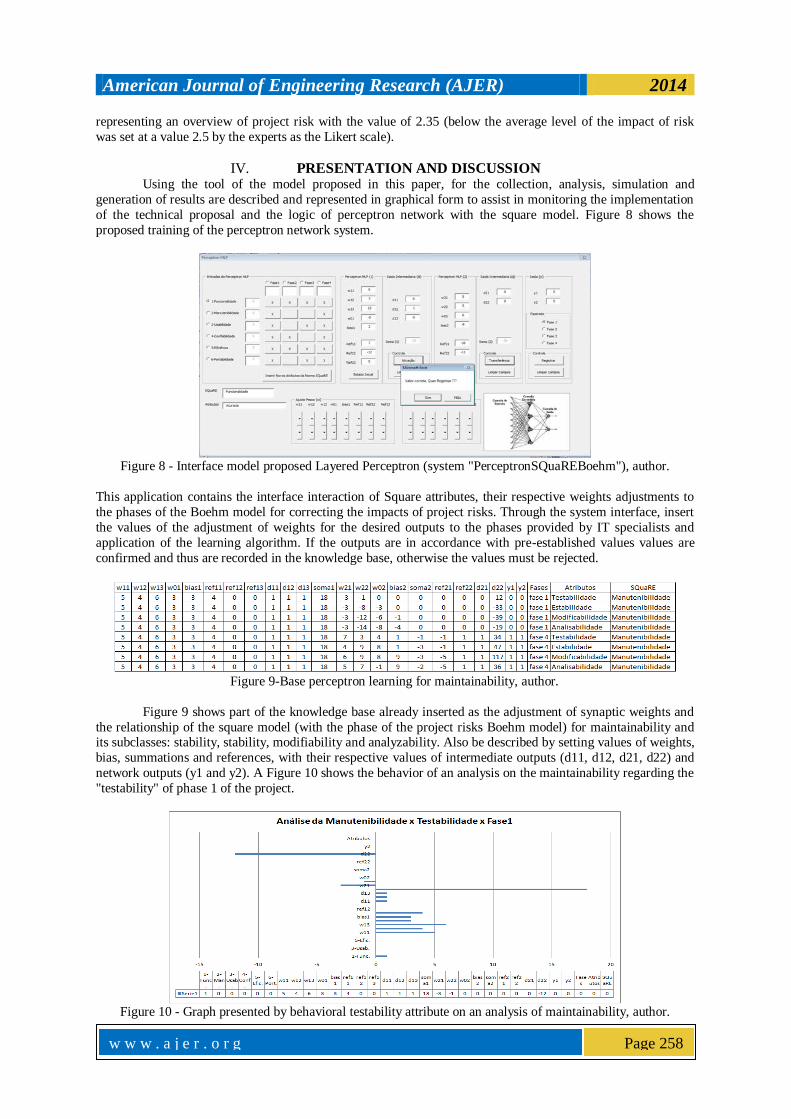
IV. PRESENTATION AND DISCUSSION Using the tool of the model proposed in this paper, for the collection, analysis, simulation and
generation of results are described and represented in graphical form to assist in monitoring the implementation
of the technical proposal and the logic of perceptron network with the square model. Figure 8 shows the
proposed training of the perceptron network system.
Figure 8 - Interface model proposed Layered Perceptron (system "PerceptronSQuaREBoehm"), author.
This application contains the interface interaction of Square attributes, their respective weights adjustments to
the phases of the Boehm model for correcting the impacts of project risks. Through the system interface, insert
the values of the adjustment of weights for the desired outputs to the phases provided by IT specialists and
application of the learning algorithm. If the outputs are in accordance with pre-established values values are
confirmed and thus are recorded in the knowledge base, otherwise the values must be rejected.
Figure 9-Base perceptron learning for maintainability, author.
Figure 9 shows part of the knowledge base already inserted as the adjustment of synaptic weights and
the relationship of the square model (with the phase of the project risks Boehm model) for maintainability and its subclasses: stability, stability, modifiability and analyzability. Also be described by setting values of weights,
bias, summations and references, with their respective values of intermediate outputs (d11, d12, d21, d22) and
network outputs (y1 and y2). A Figure 10 shows the behavior of an analysis on the maintainability regarding the
"testability" of phase 1 of the project.
Figure 10 - Graph presented by behavioral testability attribute on an analysis of maintainability, author.
American Journal of Engineering Research (AJER) 2014
w w w . a j e r . o r g
Page 259
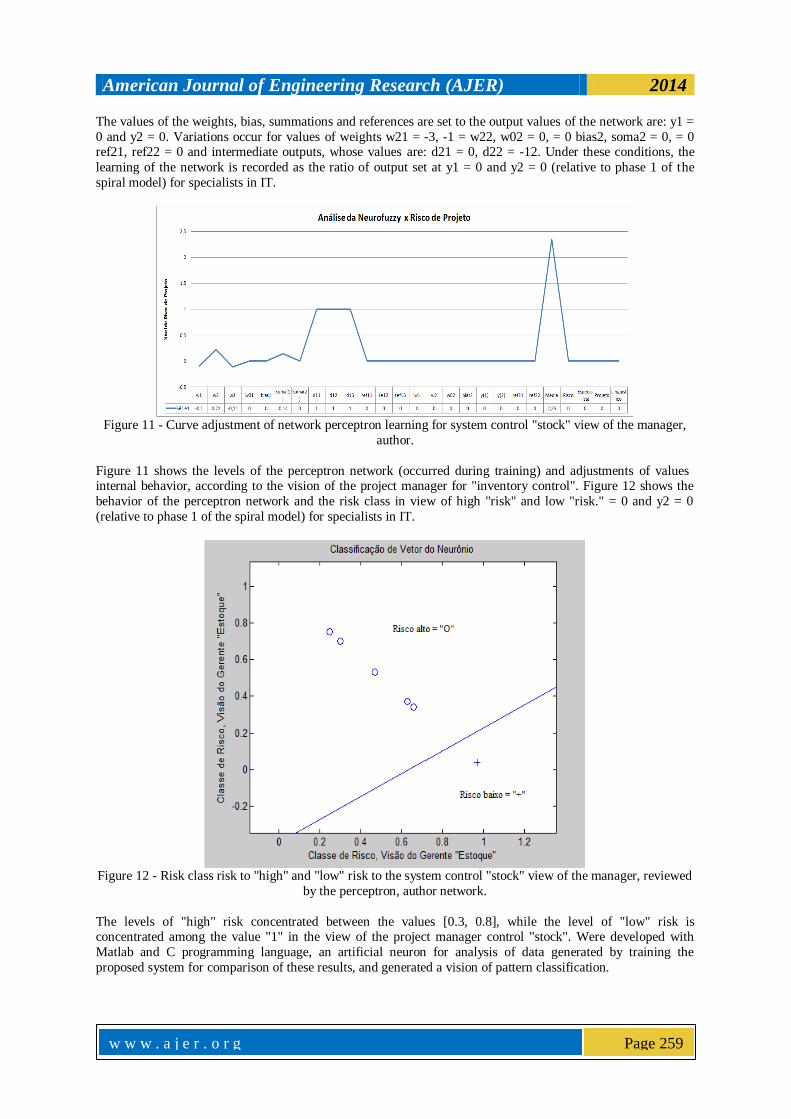
The values of the weights, bias, summations and references are set to the output values of the network are: y1 =
0 and y2 = 0. Variations occur for values of weights w21 = -3, -1 = w22, w02 = 0, = 0 bias2, soma2 = 0, = 0 ref21, ref22 = 0 and intermediate outputs, whose values are: d21 = 0, d22 = -12. Under these conditions, the
learning of the network is recorded as the ratio of output set at y1 = 0 and y2 = 0 (relative to phase 1 of the
spiral model) for specialists in IT.
Figure 11 - Curve adjustment of network perceptron learning for system control "stock" view of the manager,
author.
Figure 11 shows the levels of the perceptron network (occurred during training) and adjustments of values internal behavior, according to the vision of the project manager for "inventory control". Figure 12 shows the
behavior of the perceptron network and the risk class in view of high "risk" and low "risk." = 0 and y2 = 0
(relative to phase 1 of the spiral model) for specialists in IT.
Figure 12 - Risk class risk to "high" and "low" risk to the system control "stock" view of the manager, reviewed
by the perceptron, author network.
The levels of "high" risk concentrated between the values [0.3, 0.8], while the level of "low" risk is concentrated among the value "1" in the view of the project manager control "stock". Were developed with
Matlab and C programming language, an artificial neuron for analysis of data generated by training the
proposed system for comparison of these results, and generated a vision of pattern classification.
American Journal of Engineering Research (AJER) 2014
w w w . a j e r . o r g
Page 260
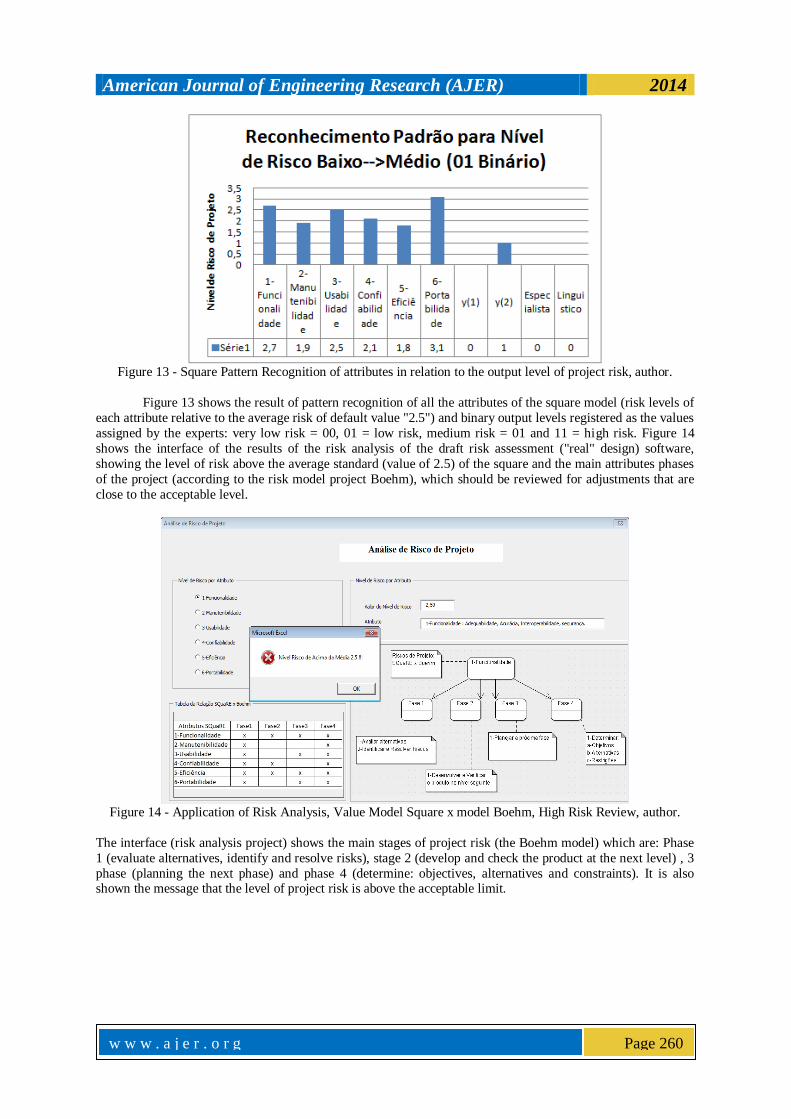
Figure 13 - Square Pattern Recognition of attributes in relation to the output level of project risk, author.
Figure 13 shows the result of pattern recognition of all the attributes of the square model (risk levels of
each attribute relative to the average risk of default value "2.5") and binary output levels registered as the values
assigned by the experts: very low risk = 00, 01 = low risk, medium risk = 01 and 11 = high risk. Figure 14
shows the interface of the results of the risk analysis of the draft risk assessment ("real" design) software,
showing the level of risk above the average standard (value of 2.5) of the square and the main attributes phases
of the project (according to the risk model project Boehm), which should be reviewed for adjustments that are
close to the acceptable level.
Figure 14 - Application of Risk Analysis, Value Model Square x model Boehm, High Risk Review, author.
The interface (risk analysis project) shows the main stages of project risk (the Boehm model) which are: Phase
1 (evaluate alternatives, identify and resolve risks), stage 2 (develop and check the product at the next level) , 3
phase (planning the next phase) and phase 4 (determine: objectives, alternatives and constraints). It is also shown the message that the level of project risk is above the acceptable limit.
American Journal of Engineering Research (AJER) 2014
w w w . a j e r . o r g
Page 261
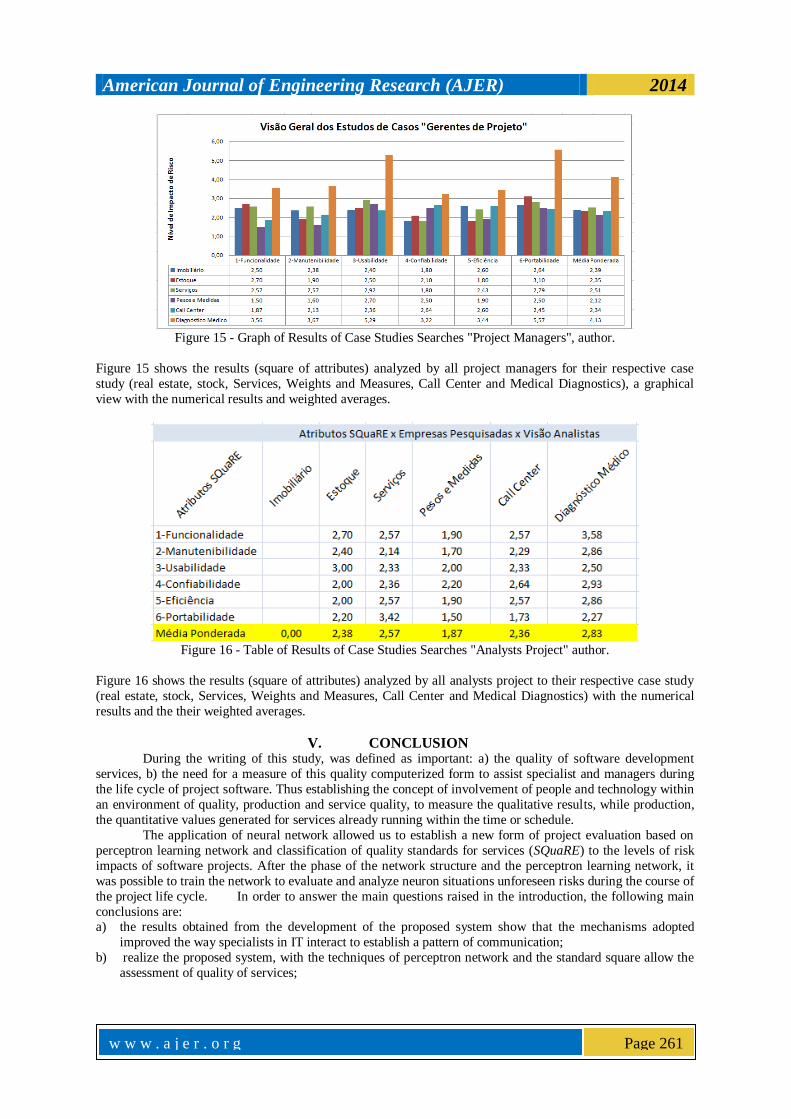
Figure 15 - Graph of Results of Case Studies Searches "Project Managers", author.
Figure 15 shows the results (square of attributes) analyzed by all project managers for their respective case
study (real estate, stock, Services, Weights and Measures, Call Center and Medical Diagnostics), a graphical
view with the numerical results and weighted averages.
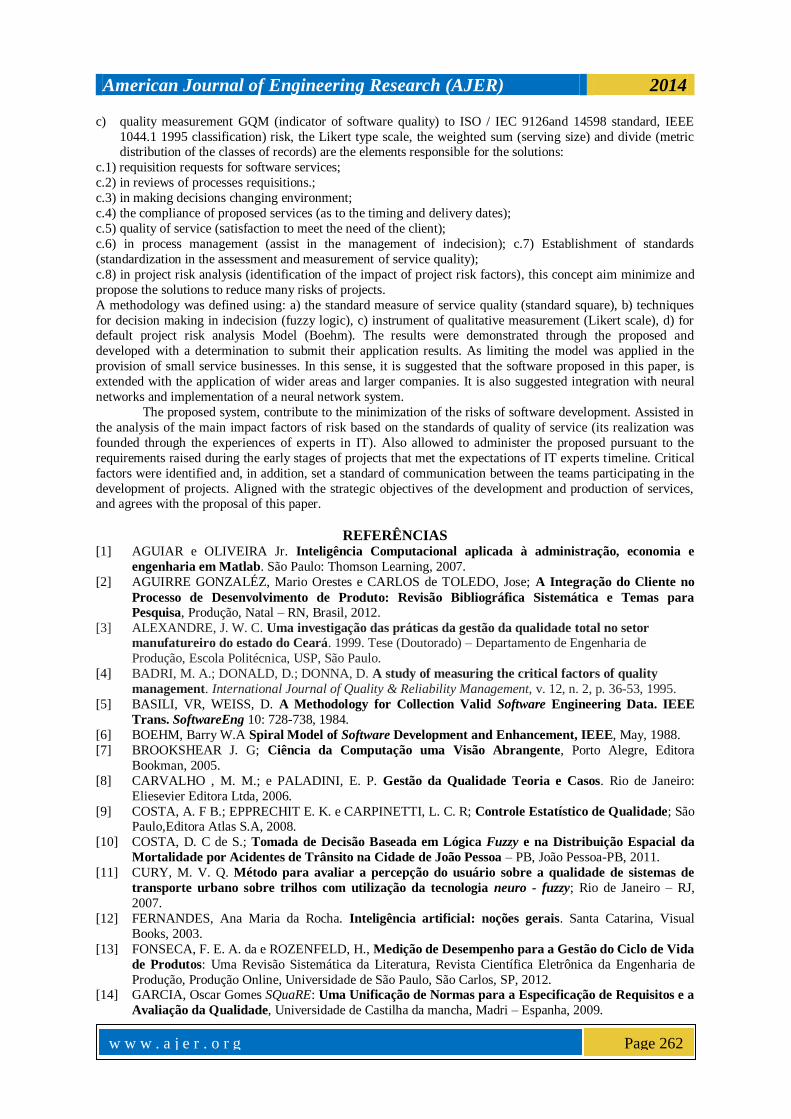
Figure 16 - Table of Results of Case Studies Searches "Analysts Project" author.
Figure 16 shows the results (square of attributes) analyzed by all analysts project to their respective case study
(real estate, stock, Services, Weights and Measures, Call Center and Medical Diagnostics) with the numerical
results and the their weighted averages.
V. CONCLUSION During the writing of this study, was defined as important: a) the quality of software development
services, b) the need for a measure of this quality computerized form to assist specialist and managers during
the life cycle of project software. Thus establishing the concept of involvement of people and technology within
an environment of quality, production and service quality, to measure the qualitative results, while production,
the quantitative values generated for services already running within the time or schedule.
The application of neural network allowed us to establish a new form of project evaluation based on
perceptron learning network and classification of quality standards for services (SQuaRE) to the levels of risk
impacts of software projects. After the phase of the network structure and the perceptron learning network, it
was possible to train the network to evaluate and analyze neuron situations unforeseen risks during the course of
the project life cycle. In order to answer the main questions raised in the introduction, the following main
conclusions are: a) the results obtained from the development of the proposed system show that the mechanisms adopted
improved the way specialists in IT interact to establish a pattern of communication;
b) realize the proposed system, with the techniques of perceptron network and the standard square allow the
assessment of quality of services;
American Journal of Engineering Research (AJER) 2014
w w w . a j e r . o r g
Page 262
c) quality measurement GQM (indicator of software quality) to ISO / IEC 9126and 14598 standard, IEEE
1044.1 1995 classification) risk, the Likert type scale, the weighted sum (serving size) and divide (metric distribution of the classes of records) are the elements responsible for the solutions:
c.1) requisition requests for software services;
c.2) in reviews of processes requisitions.;
c.3) in making decisions changing environment;
c.4) the compliance of proposed services (as to the timing and delivery dates);
c.5) quality of service (satisfaction to meet the need of the client);
c.6) in process management (assist in the management of indecision); c.7) Establishment of standards
(standardization in the assessment and measurement of service quality);
c.8) in project risk analysis (identification of the impact of project risk factors), this concept aim minimize and
propose the solutions to reduce many risks of projects.
A methodology was defined using: a) the standard measure of service quality (standard square), b) techniques
for decision making in indecision (fuzzy logic), c) instrument of qualitative measurement (Likert scale), d) for default project risk analysis Model (Boehm). The results were demonstrated through the proposed and
developed with a determination to submit their application results. As limiting the model was applied in the
provision of small service businesses. In this sense, it is suggested that the software proposed in this paper, is
extended with the application of wider areas and larger companies. It is also suggested integration with neural
networks and implementation of a neural network system.
The proposed system, contribute to the minimization of the risks of software development. Assisted in
the analysis of the main impact factors of risk based on the standards of quality of service (its realization was
founded through the experiences of experts in IT). Also allowed to administer the proposed pursuant to the
requirements raised during the early stages of projects that met the expectations of IT experts timeline. Critical
factors were identified and, in addition, set a standard of communication between the teams participating in the
development of projects. Aligned with the strategic objectives of the development and production of services, and agrees with the proposal of this paper.
REFERÊNCIAS [1] AGUIAR e OLIVEIRA Jr. Inteligência Computacional aplicada à administração, economia e
engenharia em Matlab. São Paulo: Thomson Learning, 2007.
[2] AGUIRRE GONZALÉZ, Mario Orestes e CARLOS de TOLEDO, Jose; A Integração do Cliente no
Processo de Desenvolvimento de Produto: Revisão Bibliográfica Sistemática e Temas para
Pesquisa, Produção, Natal – RN, Brasil, 2012.
[3] ALEXANDRE, J. W. C. Uma investigação das práticas da gestão da qualidade total no setor
manufatureiro do estado do Ceará. 1999. Tese (Doutorado) – Departamento de Engenharia de
Produção, Escola Politécnica, USP, São Paulo.
[4] BADRI, M. A.; DONALD, D.; DONNA, D. A study of measuring the critical factors of quality
management. International Journal of Quality & Reliability Management, v. 12, n. 2, p. 36-53, 1995.
[5] BASILI, VR, WEISS, D. A Methodology for Collection Valid Software Engineering Data. IEEE
Trans. SoftwareEng 10: 728-738, 1984.
[6] BOEHM, Barry W.A Spiral Model of Software Development and Enhancement, IEEE, May, 1988.
[7] BROOKSHEAR J. G; Ciência da Computação uma Visão Abrangente, Porto Alegre, Editora
Bookman, 2005.
[8] CARVALHO , M. M.; e PALADINI, E. P. Gestão da Qualidade Teoria e Casos. Rio de Janeiro:
Eliesevier Editora Ltda, 2006.
[9] COSTA, A. F B.; EPPRECHIT E. K. e CARPINETTI, L. C. R; Controle Estatístico de Qualidade; São Paulo,Editora Atlas S.A, 2008.
[10] COSTA, D. C de S.; Tomada de Decisão Baseada em Lógica Fuzzy e na Distribuição Espacial da
Mortalidade por Acidentes de Trânsito na Cidade de João Pessoa – PB, João Pessoa-PB, 2011.
[11] CURY, M. V. Q. Método para avaliar a percepção do usuário sobre a qualidade de sistemas de
transporte urbano sobre trilhos com utilização da tecnologia neuro - fuzzy; Rio de Janeiro – RJ,
2007.
[12] FERNANDES, Ana Maria da Rocha. Inteligência artificial: noções gerais. Santa Catarina, Visual
Books, 2003.
[13] FONSECA, F. E. A. da e ROZENFELD, H., Medição de Desempenho para a Gestão do Ciclo de Vida
de Produtos: Uma Revisão Sistemática da Literatura, Revista Científica Eletrônica da Engenharia de
Produção, Produção Online, Universidade de São Paulo, São Carlos, SP, 2012. [14] GARCIA, Oscar Gomes SQuaRE: Uma Unificação de Normas para a Especificação de Requisitos e a
Avaliação da Qualidade, Universidade de Castilha da mancha, Madri – Espanha, 2009.
American Journal of Engineering Research (AJER) 2014
w w w . a j e r . o r g
Page 263
[15] ISO/IEC 14598-1:1999, Information technology - Software product evaluation - part 1: General
overview. Technical report, International Organization for Standardization, Geneva, Switzerland, 1999. [16] ISO/IEC 25000:2005 http://iso.org./iso/catalogue detail?csnumber=35683 acessado em 10/09/2012.
[17] ISO/IEC 9126-1:2001, Software engineering - Product quality - Part 1: Quality model. Technical
report, International Organization for Standardization, Geneva, Switzerland, 2001.
[18] KOSCIANSKI, A. e SOARES M. dos SANTOS Qualidade de software: Aprenda as metodologias e
técnicas mais modernas para o desenvolvimento de software, São Paulo, editora NovatecLtda, 2006.
[19] LAS CASAS, ALEXANDRE L. Qualidade Total em Serviços, São Paulo, Editora Atlas, 2007.
[20] LIKERT, Rensis; LIKERT, Jane Gibson. Administração de conflitos: novas abordagens. São
Paulo: Mcgraw-Hill, 1979.
[21] LUDWING Jr., O. e MONTGOMERY E., Redes Neurais Fundamentos e Aplicações com Programas
em C, Rio de Janeiro – RJ, Editora Ciência Moderna Ltda, 2007.
[22] MORAES, O. B. Método de Análise de Dados para Avaliação de Áreas Urbanas Recuperadas –
Uma Abordagem – Utilizando a Lógica Fuzzy, São Paulo – SP, 2008. [23] MORAES, O. B. Método de Análise de Dados para Avaliação de Áreas Urbanas Recuperadas –
Uma Abordagem – Utilizando a Lógica Fuzzy, São Paulo – SP, 2008.
[24] NASCIMENTO Jr., C. L., YONEYAMA, T. (2000). Inteligência Artificial em Controle e Automação,
São Paulo – SP, Editora Edgard Blücher, 2004.
[25] OLIVEIRA JUNIOR, W. Estudo comparativo entre modelos lineares e redes neurais artificiais
como tecnologias geradoras de previsões de valores financeiros. 2007. Dissertação (Mestrado em
Gestão do Conhecimento e Tecnologia da Informação) – UCB, Brasília.
[26] OLIVEIRA JUNIOR, W. Estudo comparativo entre modelos lineares e redes neurais artificiais
como tecnologias geradoras de previsões de valores financeiros. 2007. Dissertação (Mestrado em
Gestão do Conhecimento e Tecnologia da Informação) – UCB, Brasília.
[27] OLIVEIRA, Francisco Correia de; SANTOS, Carlos Augusto Parente Neiva. Terceirização no processo
de desenvolvimento de sistemas de informações. In: XXIV ENCONTRO NACIONAL DA
ASSOCIAÇÃO NACIONAL DOS PROGRAMAS DE PÓS-GRADUAÇÃO EM ADMINISTRAÇÃO,
2000, Florianópolis. Anais. Rio de Janeiro: ANPAD, 2000. 1 CD-ROM.
[28] PALADINI E. P; Gestão Estratégica da Qualidade Princípios, Métodos e Processos; Editora Atlas
S.A; São Paulo – SP, 2008.
[29] SANTOS, Joel J. Análise de custos: Remodelando com ênfase para custo marginal, relatórios e
estudos de casos. 3. ed. São Paulo: Atlas, 2000.
[30] SARAPH, J. V.; BENSON, P. G.; SCHROEDER, R. G. An instrument for measuring the critical
factors of quality management. Decision Sciences, v. 20, n. 4, p. 810-829, 1989.
[31] SCHILDT, H., Inteligência Artificial Utilizando Linguagem C – Tradução de Cláudio Gaiger Silveira,
São Paulo – SP, Editora McGraw – Hill, São Paulo – SP, 1989.
[32] SCOARIS, Raquel Carmen de Oliveira; PEREIRA BENEVIDES, Ana Maria Teresa e SANTIN, Filho Ourides, Elaboração e validação de um instrumento de avaliação de atitudes frente ao uso de
história da ciência no ensino de ciências, Revista Electrónica de Enseñanza de las Ciencias, Vol.8 Nº3 ,
2009.
[33] SHAW I. S. e SIMÕES, M. G. Controle e Modelagem Fuzzy, São Paulo – SP, Blücher Ltda, 2004.
[34] SILVA, Ivan Nunes; SPATTI, Danilo Hernane; FLAUZINO, Rogério Andrade, Redes Neurais
Artificiais para Engenharia e Ciências Aplicadas – Curso Prático, São Paulo – SP, Editora
ARTLIBER EDITORA LTDA, 2010.
[35] SORDI, J. O. Gestão por Processos uma abordagem da moderna administração, São Paulo – SP,
Editora Saraiva, 2005.
[36] SPHAIER, A. A. Adaptação de um Modelo para Avaliação da Qualidade de Serviços Prestados por
uma Empresa de Tecnologia da Informação, Rio de Janeiro – RJ, 2009. [37] TAMIMI, N.; GERSHON, M. A tool foi assessing industry TQM practice versus the Deming
philosophy. Production and Inventory Management Journal, first quarter, v. 36, n. 1, p. 27-32, 1995.
[38] TAN, Pang-Ning; STEINBACH, Michael e KUMAR, Vipin, Introdução ao DATA MINING, Rio de
Janeiro – RJ, Editora Ciência Moderna, 2006.
[39] WEBER, L.; KLEIN, P.A.T., Aplicação da lógica fuzzy em software e hardware. 1.ed, Canoas: Ulbra,
2003.