zilla parishad elections in maharashtra: a data based ... parishad... · zilla parishad elections...
TRANSCRIPT
ZILLA PARISHAD ELECTIONS IN
MAHARASHTRA : A DATA ANALYSIS (1994-2013)
Rajas K. Parchure
Manasi V. Phadke
Dnyandev C. Talule
GOKHALE INSTITUTE OF POLITICS AND ECONOMICS (Deemed to be a University)`
Pune (India), 411 001

Rajas K. Parchure : Team Leader
Manasi V. Phadke
Dnyandev C. Talule
: Project Co-ordinator
Project Co-ordinator
Rajesh R. Bhatikar : Editorial Desk
Anjali Phadke : Statistical Assistant
Ashwini Velankar
Vaishnavi Dande
: Research Assistant
Research Assistant
Vilas M. Mankar : Technical Assistance
STUDY TEAM

ZILLA PARISHAD ELECTIONS IN MAHARASHTRA : A
DATA ANALYSIS (1994-2013) 2016
Gokhale Institute of Politics and Economics, Pune i
TABLE OF CONTENTS
CHAPTER
NO.
CONTENT PAGE
NO.
Foreword vi
Acknowledgements vii
1 A Historical Perspective on Local Governance 1
2 Defining Variables and Research Questions 14
3 Data Analysis: Behaviour of Main Variables
Across Different Rounds of Elections
21
4 Data Analysis: Correlations Between Key
Variables
59
5 Conclusion 67
References 70
Appendix – A Data on VT, POL, SCST and REVERSE COMP
Across Rounds of Elections
Appendix – B Average Values of VT, POL, RESERVE COMP
and IND
Appendix – C Cluster Analysis of VT, POL, REVERSE COMP,
IND and RES
Appendix – D Councils Relevant for Immediate Launch of Voter
Awareness Programs
Appendix – E Councils Relevant for MCC Implementation

ZILLA PARISHAD ELECTIONS IN MAHARASHTRA : A
DATA ANALYSIS (1994-2013) 2016
Gokhale Institute of Politics and Economics, Pune ii
LIST OF TABLES
Tables
No.
Content Page
No.
3.1 Trends in VT across Successive Rounds of Elections 21
3.2 ZPs Belonging to the high and low VT Cluster in Each
Round of Elections
24
3.3 Re-arrangement of high VT Zilla Parishads into Divisional
Clusters
26
3.4 Re-arrangement of low VT Zilla Parishads into Divisional
Clusters
28
3.5 Divisional Aggregates for VT 29
3.6 Correlation Matrix for VT 30
3.7 High Voter Turnout Cluster 31
3.8 Medium Voter Turnout Cluster 32
3.9 Low Voter Turnout Cluster 34
3.10 VT and POL in Select Zilla Parishads 35
3.11 Trends in POL in Successive Rounds of Election 36
3.12 Zilla Parishads Showing Zero Political Alignment with
State Government from 1995 to 2014 37
3.13 List of ZPs showing complete alignment with State
Government from 1995 to 2014
38
3.14 INC-NCP Strongholds with High VT 40
3.15 List of Swing Zilla Parishads(with Low
REVERSECOMPValues)
42
3.16 List of Zilla Parishads with Low Competition Amongst
Political Parties (High REVERSECOMP values)
43
ZILLA PARISHAD ELECTIONS IN MAHARASHTRA : A
DATA ANALYSIS (1994-2013) 2016
Gokhale Institute of Politics and Economics, Pune iii
3.17 Parties That Have been in Power in low Competition ZPs 44
3.18 Trends in IND across Successive Rounds of Elections 45
3.19 List of Zilla Parishads in R2, R3 and R4 where no Seats
were won by Independents
46
3.20 Zilla Parishads Belonging to Low IND Cluster 47
3.21 Zilla Parishads Belonging to Medium IND Cluster 48
3.22 Zilla Parishads belonging to high IND Cluster 49
3.23 ZPs with High Proportion of SC and ST Population 49
3.24 ZPs with Medium Proportion of SC and ST Population 50
3.25 ZPs with Low Proportion of SC and ST Population 51
3.26 Comparison of Average of SCST Population Proportion
and Reservation Proportion across Different Rounds of
Elections of ZPs
52
3.27 Zilla Parishads belonging to high RES Cluster 53
3.28 Zilla Parishads Belonging to Medium RES Cluster 53
3.29 Zilla Parishads Belonging to Low RES Cluster 54
3.30 Low Income Cluster in the Districts in Maharashtra 56
3.31 Medium Income Cluster in the Districts in Maharashtra 57
3.32 High Income Cluster in the Districts in Maharashtra 57
4.1 Correlation Co-Efficients Between Key Electoral
Variables and Implications for Electoral Policy
59
4.2 Summary of Correlations in key Election Variables 66
ZILLA PARISHAD ELECTIONS IN MAHARASHTRA : A
DATA ANALYSIS (1994-2013) 2016
Gokhale Institute of Politics and Economics, Pune iv
LIST OF FIGURES
Figure
No.
Content Page
No.
1.1 Administrative Structure and Decentralisation of Power
(73rd
and 74th Amendements – 1992)
4
1.2 1.2: Local Self Government
(Decentralization of Power) 5
2.1 Data Available with SECM 16
LIST OF GRAPHS
Figure
No.
Content Page
No.
3.1 Administrative Structure and Decentralisation of Power
(73rd
and 74th
Amendements – 1992) 29
ZILLA PARISHAD ELECTIONS IN MAHARASHTRA : A
DATA ANALYSIS (1994-2013) 2016
Gokhale Institute of Politics and Economics, Pune v
ABBREVIATIONS
AV Average
AvVT Average Voter Turnout
BCC Backward Category of Citizens
BJP Bharatiya Janata Party
REVERSE COMP Proxy measure for Level of Competition
Between Different Political Parties
DEV Development quotient of a district
GDP Gross Domestic Product
INC Indian National Congress
IND Proportion of Votes Garnered by Independent
Candidates
MCC Model Code of Conduct
NCP Nationalist Congress Party
POL Political Alignment
R1 Round One of Elections
R2 Round Two of Elections
R3 Round Three of Elections
R4 Round Four of Elections
RES Proportion of Seats Reserved in a Council
SC Scheduled Castes
SECM State Election Commission of Maharashtra
SS Shiv Sena
ST Scheduled Tribes
VT Voter Turnout

ZILLA PARISHAD ELECTIONS IN MAHARASHTRA : A
DATA ANALYSIS (1994-2013) 2016
Gokhale Institute of Politics and Economics, Pune vi
FOREWORD
1. The landmark 73rd
and 74th Constitutional Amendments gave
constitutional status to local bodies in India. In accordance with the
same, Maharashtra has worked assiduously towards restoring the rightful
place of the local bodies in the political governance. This is evident from
the conduct of free, fair and transparent elections by the State Election
Commission since its inception in 1994 following the amendments to the
Constitution of nearly 28,000 local bodies (26 Municipal Corporations,
340 Municipal Councils and Nagar Panchayats, 34 Zilla Parishads, 351
Panchayat Samitis and approx. 27,781 Gram Panchayats).
2. Collection and preservation of data of all the elections is necessary not
only for understanding the dynamics of politics and but also for making
improvements in the subsequent elections. It is unfortunate that very
little data has been preserved of previous elections. Only data pertaining
to number of reserved seats, voter turnout and seats won by different
political parties is available and that too for Zilla Parishads, Panchayat
Samitis, Municipal Councils and Municipal Corporations only.
3. State Election Commission, Maharashtra proposes to collect and
preserve relevant data of all the elections from now onwards pertaining
to the following broad categories:
i. Arrangements done e.g. number of wards (with reservation), polling
stations, polling personnel, vehicles etc.
ii. Details given by candidates in nomination papers and affidavit e.g.
Age, educational qualification, assets and liabilities, criminal
background etc.
iii. Activities during elections: e.g. violation of Model Code of Conduct,
incidents of violence, re-poll etc.
iv. Post elections e.g. expenditure incurred by the local bodies /
candidates / political parties, profile of winning candidates etc.

ZILLA PARISHAD ELECTIONS IN MAHARASHTRA : A
DATA ANALYSIS (1994-2013) 2016
Gokhale Institute of Politics and Economics, Pune vii
4. I am happy that Gokhale Institute of Politics and Economics, Pune has
done analysis as directed by State Election Commission, Maharashtra of
all the elections of Zilla Parishads held in the State between 1994-2013
with the available, scanty data. A team of 7 researchers led by Smt.
Manasi Phadke and Prof. Dnyandev Talule of YASHADA analyzed the
data over a period of four months from July to October 2016, the main
findings of which are as below:
i. Average voter turnout in Zilla Parishads and Panchayat Samitis over all elections is 69 per cent.
ii. The voter turnout in Zilla Parishad and Panchayat Samiti elections has been falling over successive rounds of elections.
iii. Higher voter turnout is linked to higher political competition
amongst different parties.
iv. Higher the voter turnout, higher is the proportion of seats won by independent candidates.
v. Identification of Zilla Parishads with historically low voter turnout
vi. Identification of Zilla Parishads where fierce competition between
political parties is expected
Above findings have great implications for undertaking various programs like
voter awareness program and effective implementation of Model code of
Conduct.
5. I take this opportunity to congratulate Smt. Manasi Phadke and Dr. Rajas
Parchure of Gokhale Institute of Politics and Economics, Prof. Dnyandev
Talule and Director General of YASHADA and Department of Rural
Development, Government of Maharashtra for making this analytical
study possible.
6. I am further pleased to learn that Gokhale Institute is publishing this
analysis in a book form, elucidating the methodology, analysis,
suggestions and recommendations for future elections. I am sure that this
will greatly help all the stakeholders in ensuring maximum peoples’
participation in a free, fair and transparent manner.
Shri. J. Saharia
State Election Commission
Maharashtra

ZILLA PARISHAD ELECTIONS IN MAHARASHTRA : A
DATA ANALYSIS (1994-2013) 2016
Gokhale Institute of Politics and Economics, Pune viii
ACKNOWLEDGMENT
I am very pleased to present this report titled “Zilla Parishad Elections in
Maharashtra: A Data Analysis (1994-2013)” to the readers and scholars of
decentralization. As the discerning reader must be aware, the State Election
Commission of Maharashtra has been conducting local body elections in
Maharashtra from 1994. Data pertaining to 4 rounds of elections held so far has
been maintained by the SECM. This data contains a mine of information, the
analysis of which would yield important insights for the SECM, especially from
a policy making perspective. For example, voter awareness programs have to be
given priority in the conduct of elections. This is an important issue for the
SECM. However, should voter awareness programs be run with equal intensity
across all parts of Maharashtra? Are there zones where voter turnout rates tend to
be low? Can we identify these? If we can, then special attention can be given to
these zones whilst planning the voter awareness drive. Careful analysis of data
helps us to create these insights which would be relevant for policy making.
Gokhale Institute of Politics and Economics was given the task of analyzing the
data available with the SECM in order to bring out important insights that may
aid the direction of electoral policy. The data pertains to elections held in
Municipal Councils, Municipal Corporations, Zilla Parishads as well as
Panchayat Samitis. This publication brings out the analysis pertaining to election
data of Zilla Parishads only. The analysis of data of the other local bodies is
presented in other reports. Our team at the Institute has worked hard in terms of
cleaning up the database, enhancing it with other variables to draw insights and
reporting the observable trends contained in the data with accuracy. The report
carries interesting insights on all variables important for electoral policy
direction.
Let me express my gratitude to Shri Jageshwar Saharia, State Election
Commissioner, Maharashtra, for granting this interesting study project to the
Gokhale Institute of Politics and Economics. Shri K. Suryarishnamurty, Assistant
Commissioner, State Election Commission, Maharashtra, was a mentor for our
team and guided and supported us at every stage of the project right from the
data analysis to writing the report.

ZILLA PARISHAD ELECTIONS IN MAHARASHTRA : A
DATA ANALYSIS (1994-2013) 2016
Gokhale Institute of Politics and Economics, Pune ix
I am thankful to the Rural Development Department, Government of
Maharashtra which funded the project completely. We are especially thankful to
the Yashada officials, who were not only involved in the project as funding
agency officials, but guided us through the entire timeline of the project. I must
express special gratitude towards Prof. Dnyandeo Talule, Yashada, who
generously lent a lot of time and effort to this project, and enriched our insights.
Mrs. Manasi Phadke has been the chief co-ordinator of this project and has been
driving the processes right from data management to writing the report
meticulously. I congratulate her as well as Prof. Talule for coming out with a
timely and insightful publication. Mrs. Anjali Phadke was instrumental in
helping us with the statistical part of the analysis. Together with her, I also
acknowledge the sincere effort put into the project by Ms. Ashwini Velankar and
Ms. Vaishnavi Dande, our young and enthusiastic research assistants. Mr. Vilas
Mankar gave us all the technical assistance needed for this project extremely
sincerely.
This project helped us to gain deep insights into the dynamics of local body
elections of Zilla Parishads, all of which have been duly presented in the report. I
am sure that the report will serve as a useful addition to the existing literature on
the subject.
Prof. Rajas Parchure
RBI Professor and Offg. Director
Gokhale Institute of Politics and Economics
Pune

ZILLA PARISHAD ELECTIONS IN MAHARASHTRA: A DATA
BASED ANALYSIS (1994-2013) 2016
Gokhale Institute of Politics and Economics, Pune, 411 004 1
CHAPTER - I
A HISTORICAL PERSPECTIVE ON LOCAL GOVERNANCE
EVOLUTION OF LOCAL SELF GOVERNANCE IN INDIA
In the Indian society, the village has traditionally been the unit of social and
economic activity. In the anthropological perspective, the village is termed as
“the natural unit of living”. Obviously, the villages traditionally enjoyed a kind
of self-rule with regard to local affairs that also included judicial functions. In the
course of time, the village bodies took the form of Panchayats which then started
to oversee the common affairs of the villagers without any interference from
outside. Even in the early nineteenth century, Panchayats did exist in some parts
of India, leading Sir Charles Metcalfe, the then-provisional Governor General of
India (1835-36), to characterize them as „little republics‟ (George Mathew,
2004)1. After the establishment of direct rule of the Crown in 1858, it was not
possible for colonial rulers to turn a blind eye to the innumerable villages in the
country, which provided the broad platform for expansion ofBritish trade and
commerce. Therefore in 1870, the government adopted a policy to setup local
self-government institutions (LSGI) in rural India. It is in this context that Lord
Ripon, the then-Viceroy of India, passed the 1882 Resolution that paved the way
for the establishment of LSGI in British India. This Resolution, for the first time,
put forth a comprehensive theory of local government. Ripon‟s Resolution led to
enactment of new local self-government legislations in various provinces
between 1883 and 1885. For a long time thereafter, there was no attempt to
change the status quo, even though a Royal Commission on decentralization, in
its report submitted in 1909, strongly advocatedthe need to associate local people
in the task of local administration. In 1918, while introducing constitutional
reforms, the recommendations of Royal Commission were taken seriously. As a
result, under the newly amended local self-government acts that were enacted in
different provinces following the reforms, various self-governing institutions
were established at the district, intermediate and village levels. These institutions
lasted not only during the remaining period of the British rule, but also left
1George Mathew (2004), Local Democracy and Empowerment of the Underprivileged-An Analysis
of Democratic Decentralization in India, Institute of Social Sciences, A Case Study-30826,
Ministry of Rural Development, GoI, New Delhi.

ZILLA PARISHAD ELECTIONS IN MAHARASHTRA: A DATA
BASED ANALYSIS (1994-2013) 2016
Gokhale Institute of Politics and Economics, Pune, 411 004 2
behind their legacy in the post-Independence period, which in fact established
three tier decentralized democratic governance at the district level (Ibid).
ZILLA PARISHADS
The roots of local governance in ancient India date back to the period of Rig-
Veda (1700 BC). However, local governance in contemporary India owes its
genesis to the establishment of various Municipal Corporations/Zilla Parishads in
the country during the British era. A Zilla Parishad, in a federal state like India,
is an administering local body that oversees the development of an entire district.
Zilla Parishad is a body created to oversee the governance and developmental
aspects of the entire district which may comprise an equally large number of
PanchayatSamitis. Village development through TalukPanchayatSamitis is
facilitated by the Zilla Parishad. The first major attempt to institutionalize the
Panchayats came from the Report of Balwantrai Mehta Committee which was
mainly set up to assess the performance of community development
programmes. The Committeeadvocated democratic decentralization and
recommended the constitution of a three tier structure of Panchayats with Gram
Panchayat at thevillage level, PanchayatSamitis at the block level and Zilla
Parishad at the district level (GoI 1957)2.This was further bolstered by the
government enthusiastically adoptingthe proposal for the three-tier Panchayat
system in rural India, and re-christened it as Panchayati Raj. By 1959 almost all
States in the country had passed Panchayati Raj Acts and by the mid-1960s most
of the States, including Maharashtra which emerged in the frorefront to
implement the proposal, had in place the three tier Panchayati Raj system,
DEMOCRATIC GOVERNANCE AND ZILLA PARISHADS
The purpose of Zilla Parishad governance and strategic rural planning in a
country is to create effective, responsive, democratic and accountable local
government framework for about 6.2 lakh villages spread across the nation. Both
in India and abroad democracy and decentralization take the place of
preponderance in local governance. The idea of local governance continues to
2Balwantrai Mehta (1957), Chairman, Balwantray Mehta, GoI.

ZILLA PARISHAD ELECTIONS IN MAHARASHTRA: A DATA
BASED ANALYSIS (1994-2013) 2016
Gokhale Institute of Politics and Economics, Pune, 411 004 3
quietly sweep the world. From Bolivia to Bulgaria and from West Africa to
South Asia, several countries have been strengthening their local governments
and working to make them more responsive and effective (USAID 2000)3.
Decentralization promotes democracy in myriad ways. Decentralization brings
government closer to citizens and allows people to participate more effectively in
local issues concerning development by identifying community priorities (Ibid).
This also facilitates the gain of democratic experience of people and elected
representatives. Therefore, for the last twenty five years, the concept of
„participation‟ has been widely used in the development discourse. Democratic
governance implies participation in the process of formulation, passage and
implementation of public policies (Perry Mosley and Day, 1992)4
. Local
elections provide citizens with an opportunity to vote in or vote out parties from
power, thereby making local bodies vibrant and democracy, stronger.
ADMINISTRATIVE STRUCTURE AND DECENTRALIZATION OF
POWER AT ZILLA PARISHAD
The Chief Executive Officer (CEO) of Zilla Parishad, who is an IAS officer,
heads the administrative machinery.He may also be the district magistrate in
some states. The CEO supervises the divisions of the Parishad and executes its
development schemes. The pattern of administration can be understood from the
following diagram.
3 Centre for Democracy and Governance, Decentralization and Democratic Local Governance
Handbook, USAID, 20523-3100, PP. 05-06. 4Parry, G., Mosley, G. and Day N. (1992), Political Participation and Democracy in Britain.
Cambridge: Cambridge University Press.

ZILLA PARISHAD ELECTIONS IN MAHARASHTRA: A DATA
BASED ANALYSIS (1994-2013) 2016
Gokhale Institute of Politics and Economics, Pune, 411 004 4
Figure No. 1.1: Administrative Structure and Decentralisation of Power
(73rd
and 74th
Amendements – 1992)
The following diagram elucidates the post 73rd
constitutional amendment (1992)
decentralization of power through the structure of local self-government in India.
This is inclusive of both the democratic and administrative structure of local self-
government and decentralization of power.
Government of India
State Government
Division(s)
Block(s) Tehsils Municipal
Corporations
Municipality City Council
Gram Panchayat Ward
District(s) (Zilla-Parishad)

ZILLA PARISHAD ELECTIONS IN MAHARASHTRA: A DATA
BASED ANALYSIS (1994-2013) 2016
Gokhale Institute of Politics and Economics, Pune, 411 004 5
1.2: Local Self Government
(Decentralization of Power)
ELECTIONS TO ZILLA PARISHADS
Democratic pattern of governance and elections are by no means new to the
modern world. In ancient Greece and Rome, and throughout the medieval period,
rulers such as the Holy Roman Emperor and the Pope were elected
(Encyclopedia Britannica). In the Vedic period of India, the raja of a gana was
apparently elected by the gana (tribal group). The gana members had the final
say in his election.In modern democracy, an election is a formal process by
73rd Amendment – 1992 (Rural)
Gram Panchayat Taluk Panchayat ZillaPanchayat
Chairman Chair person Sarpanch
Deputy Chairman Deputy Chairperson Vice-Sarpanch
Chief Executive
Officer
Block Development
Officer Village Secretary

ZILLA PARISHAD ELECTIONS IN MAHARASHTRA: A DATA
BASED ANALYSIS (1994-2013) 2016
Gokhale Institute of Politics and Economics, Pune, 411 004 6
which citizens choose their representative to hold public office. Elections have
been the fulcrum of modern democracy since the 17th century. Like the
parliamentary elections in India, elections to local bodies such as Zilla Parhishad
are also held every five years. Very often the ruling party or local alliance elected
to power at the local district, taluka or panchayat level is in alignment with the
party or combine ruling at the State level even though in Zilla Parishad and
Panchayat Samiti elections local issues are likely to be more dominant than the
party philosophy or policies and programmes that the party may adopt at the
broader State level.
In Maharashtra, the State Election Commission conducts elections to the local
bodies including Zilla Parishad. Elections to Zilla Parishad and Panchayat
Samitis are conducted simultaneously. Since its inception in 1994 the State
Election Commission of Maharashtra has been electing approximately 2.5 lakh
“people representatives” in nearly 28,000 local bodies which comprise 26
Municipal Corporations, 340 Municipal Councils and Nagar Panchayats, 34 Zilla
Parishads, 351 Panchayat Samitis and approximately 27, 781 Gram Panchayats
respectively (J. Saharia, 2016)5.
THEORETICAL PERSPECTIVE AND THE GLOBAL EXPERIENCE OF
VOTER TURNOUT AT THE LOCAL ELECTIONS
Low voter turnout in elections is not the concern of Indian democracy alone.
Even American democracy has repeatedly experienced the concern of low voter
participation in federal elections (Bannett and Resnick, 1990)6
and(Sidney
Verba, Schlozman and Brady 1995)7. Almost half of the eligible voters of
America do not exercise their franchise in presidential elections, which can
broadly be termed as an “evidence of crises in country‟s democracy” (Ruy A.
Texeira, 1992)8 and(Rosenstone and Hansen, 1993)
9. In recent decades, a few
5 J.Saharia (2016), Data Based Analysis of Municipal Elections in Maharashtra-1994-2013
(Foreword), R. K. Parchure, ManasiPhadke and Dnyandev Talule, GIPE, Pune, A Study for the
State Election Commission of Maharashtra. 6Bennett and Resnick (1990), The Implications of Nonvoting for Democracy in the United States,
American Journal of Political Science 34:771-802; Verba, Schlozman and Brady (1995), Voice and
Equity: Civic Voluntarism in American Politics, Cambridge, MA: Harvard Uni. Press 7Sidney Verba, Schlozman and Brady 1995), Voice and Equality, Cambridge, Mass: Harvard
University Press. 8 Ruy A. Teixeira (1992), The Disappearing American Voter, Washington DC: Brooking
Institutions; Rosenstone S. J. and J. M. Hansen (1993), Mobilization, Participation and Democracy
in America, New York: Macmillan.

ZILLA PARISHAD ELECTIONS IN MAHARASHTRA: A DATA
BASED ANALYSIS (1994-2013) 2016
Gokhale Institute of Politics and Economics, Pune, 411 004 7
studies have attempted to look comprehensively at Municipal level voter turnout
in the US. These studies suggest that voter turnout in Municipal elections may
average half that of national elections, with turnout in some cities falling below a
quarter of the voting age population(Alford and Lee, 1968)10
, (R. L .Morlan,
1984)11
and (Ruby Bridges, 1997)12
. However, the voter turnout at elections to
rural local bodies like Zilla Parishads in different states of India is often observed
to be higher than the turnout at parliamentary elections. Low voter turnout in
Municipal elections raises a number of concerns, the most serious being that the
voice of the people in Municipal elections is likely to be severely distorted.
Disadvantaged segments of the society, racial and ethnic minorities, the poor,
illiterates tend to vote significantly less regularly than others in democratic
contests (Rosenstone and Hansen, 1993)13
and (Sidney Verba, Schlozman and
Brady 1995)14
. And therefore, with low voter turnout, this bias is likely to
become more pronounced(Wattenberg, 1998)15
.
At the local level then, there is a risk that non-participation in the democratic
process and consequent low voter turnout may actually distort people‟s
representation. Therefore, increase in turnout in local urban or rural elections is a
challenge for strengthening democracy and designing and implementing people-
oriented policies and programmes at the local level. Voting in local elections in
fact provides citizens with an opportunity to learn about and engage in a
democratic process beginning with the grassroots level. Given the proximity of
the local government and its relatively small size, it is in many ways easier for
citizens to acquire crucial democratic skills and become familiar with the public
9 Rosenstone S. J. and J. M Hansen (1993), Mobilization, Participation and Democracy in America,
New York: Macmillan; Verba, Schlozman and Brady (1995), Voice and Equity: Civic Voluntarism
in American Politics, Cambridge, MA: Harvard Uni. Press. 10 Alford R. R. and E. C. Lee (1968), Voting Turnout in American Cities, American Political
Science Review 62:796-813 11 Morlan R. L. (1984), Municipal Versus National Election Voter Turnout: Europe and the United
States, Political Science Quarterly 99:457-70. 12Ruby Bridges A. (1997), Morning Glories: Municipal Reform in the Southwest, Princeton, NJ:
Princeton Uni. Press 13 Rosenstone S. J. and J. M Hansen (1993), Mobilization, Participation and Democracy in
America, New York: Macmillan; Verba, Schlozman and Brady (1995), Voice and Equity: Civic
Voluntarism in American Politics, Cambridge, MA: Harvard Uni. Press 14Sidney Verba, Schlozman and Brady 1995), Voice and Equality, Cambridge, Mass: Harvard
University Press. 15 Wattenberg M. P. (1998), Turnout Decline in the US and Other Advanced Industrial
Democracies. Irvine, CA: Centre for the Study of Democracy.
ZILLA PARISHAD ELECTIONS IN MAHARASHTRA: A DATA
BASED ANALYSIS (1994-2013) 2016
Gokhale Institute of Politics and Economics, Pune, 411 004 8
realm at the local level (Zoltan Hajnal,P. G. Lewis and Hugh Louch, 2002)16
.
Election timing is also observed as a vital determinant of voter turnout which
matters the most. This is because voter turnout is observed to be much lower in
off-cycle than in on-cycle elections.Looking at California, for example, it was
found that average voter turnout in an off-cycle election is 35 per cent lower than
turnout when city elections are held at the same time as presidential elections
(Sarah F. Anzia 2014)17
.
“Social capital” is believed to play a dominant rolein increasing voter turnout,
which in turn improves political representation both at the national and local
levels of governance (Mathew D. Atkinson and Anthony Fowler, 2012)18
. Voting
requires time and information and there is little chance that one vote will change
the election outcome; hence the turnout poses a classic collective action problem
(MancurOlson, 1965)19
. It is argued that social capital may provide a solution to
the collective action problem of voter turnout which is defined as “Citizen
Engagement in community Affairs” (Robert Putnam, 1995, P.664)20
. Social
capital can increase voter turnout by increasing the flow of political information
through a community. Recent field experiences demonstrate that societal
pressure could lead to an increase in voter turnout to the extent of 30 to 38per
cent (Gerber et al, 2008)21
. However, a contrary view points out that social
connectedness may actually lead to decrease in voter turnout in cases where an
individual social network creates a force which does not rely on voting to make
its voice heard. (Diana C. Mutz, 2002)22
. Also an increase in social capital in
heterogeneous communities leads to uncertainty about political views and
reduces the voter turnout (Ibid). In a nutshell, there are good reasons to believe
16ZoltaHajnal, Paul George Lewis and Hugh Louch (2002), Municipal Elections in California:
Turnout, Timing and Competition, Public Policy Institute of California. 17 Sarah F. Anzia (2014), Timing and Turnout: How Off-Cycle Elections Favor Organized Groups,
University of Chicago Press. 18Mathew D. Atkinson and Anthony Fowler (2012), The Effect of Social Capital on Voter Turnout:
Evidence from Saint‟s Day Fiestas in Mexico, University of California, Los Angeles and Harvard
University. 19MancurOlson (1965), The Logic of Collective Action, HUP. 20Robert Putnam (1995, Tuning In, Tuning Out; The Strange Disappearances of Social Capital in
America. PS: Political Science and Politics 28(4): 664-683. 21 Gerber, Alan, Donald Green and C. Larimer (2008), Social Pressure and Voter Turnout:
Evidence from a Large-Scale Field Experiment: American Political Science Review, 102(1): 33-
48. 22Diana C. Mutz (2002), The Consequences of Cross-Cutting Networks for Political Participation,
American Journal of Political Science, 46(4):838-855.

ZILLA PARISHAD ELECTIONS IN MAHARASHTRA: A DATA
BASED ANALYSIS (1994-2013) 2016
Gokhale Institute of Politics and Economics, Pune, 411 004 9
that social capital may have positive or negative effects on voter turnout at every
level of democracy, irrespective of rural or urban.
Voter turnout, which refers to the percentage of voters who exercise their
franchise at an election, out of the total number of eligible voters, is one
significant measure of citizen participation in democratic politics. Worldwide,
voter turnout during the period 1945–2001 shows a notable decline, with major
decline taking place since the mid-1980s(Rafael Lopez Pintor, 2002)23
and
(MariaGratschew and Kate Sullivan, 2002)24
. Africa witnessed a pronounced
increase in democratic participation during the 1980s when several African
nations were riding the wave of democratization. Turnout in North and South
American countries during the same period was observed to be stable, as was
that of Oceania and Western Europe.During the same period, the Middle East
recorded varied turnout while Asia witnessed the most pronounced variations in
democratic participation (Ibid). Average turnout from 1990 to 2001 peaked at
79per cent in Oceania which was just ahead of Western Europe with turnout
proportion of 78 per cent. Both Asia and Central and Eastern European region
for the same period had an average voter turnout of 72 per cent while the average
in Central and South America was 69 per cent, North America and the Caribbean
– 65 per cent. Africa‟s average turnout was the lowest at 64 per cent which, by
all standards, is higher than the voter turnout at most of India‟s Parliamentary
elections (Ibid). The comparison of voter turnout across nations further
elucidates a wide range of variations. For example 93 per cent voter turnout in a
country like Liechtenstein in Western Europeagainst 56 per cent in
neighboringSwitzerland can be attributed to compulsory voting in Liechtenstein.
On the contrary, a country like Bahamas where voting is not compulsory,
recordsa turnout of 92 per cent compared with the Haitian average of 47 per cent
(Ibid). Since the 1970s established democracies of the world have recorded a
slow but steady declinein voter turnout; however during the same period, several
other nations where participative democratic processes strengthened, recorded
vast increase in turnout, peaking at about 80 per cent (Ibid).
23Rafael Lopez Pintor (2002), Voter Turnout Since 1945: A Global Report, Stockholm, Sweden:
International Institute of Democracy and Electoral Assistance. 24 Maria Gratschew and Kate Sullivan (2002), Compulsory Voting, ARENA, Association of
Electoral Administrators, OxonianRewley Press Ltd. United Kingdom.
ZILLA PARISHAD ELECTIONS IN MAHARASHTRA: A DATA
BASED ANALYSIS (1994-2013) 2016
Gokhale Institute of Politics and Economics, Pune, 411 004 10
There is no doubt that the capacity to read and write, female literacy ratio (FLR),
Per Capita Income (PCI), etc. do not necessarily translate into an ability to make
coherent and informed political decisions.In fact, it is observed that while voter
turnout does increase initially with increase in literacy, it tends to decline in
societies where literacy exceeds 90 per cent (Ibid).
There are 9 major electoral systems within parliamentary elections used around
the world. Alternative vote used in Australia, Fiji and Nauru demonstrate an
average turnout of 91 per cent while Jordan and Vanuatu with single non-
transferable vote system have an average turnout of 43 per cent. The other
systems do not have such a large deviation, with single transferable vote at 80
per cent and two round system at 63 per cent. An interesting result is the
relatively small difference between the two most widely used systems.
Very often the reason cited for low voter turnout is that for many people today
democracy has become synonymous with elections and political parties;(other
than voting once every five years, ordinary citizens are more likely to remain
detached from the issues of governance.It is a fact that voter participation has
decreased and the established democracies of the world have experienced what is
termed as crises of political parties.
The United Nations General Assembly Convention 1979 which seeks to
eliminate all forms of discrimination against women also emphasizes the
importance of equal participation of women in public life.However, the question
remains as to whether women participation in the overall voter turnout has
actually increased.Various studies on voting pattern in Western Europe and
North America establish the fact that gender, along with age, education and
social class, was one of the standard demographic and social characteristics used
to predict levels of civic engagement, political activism and electoral turnout
(Tingsten, 1937)25
,(Almond and Verba, 1963)26
,(Stein Rokkan, 1970)27
and(Verba Sidney N, and Norman H. Nie, 1972)28
.The studies also reveal that
gender differences were narrowing even in the 1950s in advanced industrialized
25Tingsten H.L.G. (1937), Political Behaviour, Studies in Election Statistics: London: P.S. King. 26Almond G. A. and S Verba (19630, The Civic Culture, Political Attitude and Democracy in Five
Nations, Princeton, N.J. Princeton University Press. 27Stein Rokkan (1970), Citizens, Elections, Parties: Approaches to the Comparative Study of the
Processes of Development Oslo: Universitesforiaget. 28Verba Sidney N, and Norman H. Nie(1972), Participation and Social Equality, Cambridge, Mass:
Harvard University Press.

ZILLA PARISHAD ELECTIONS IN MAHARASHTRA: A DATA
BASED ANALYSIS (1994-2013) 2016
Gokhale Institute of Politics and Economics, Pune, 411 004 11
societies such as the Sweden (Martin Lipset, 1960)29
. In most societies,when it
comes to political activity, men are found to be more active than women (Verba,
Sidney N, NieLekajcieSieand KimCattreal 1978)30
. Such gender differences have
persisted in spite of significant advances in the levels of education Usually,
women are found to be less involved in unconventional forms of democratic
participation such as strikes and protest movements, thereby leading to lower
participation of women also in conventional democratic processes (Barnes and
Kaase, 1979)31
.However, this finding has been visibly challenged by the female
voting pattern in recent times. In the US for example, in the Presidential elections
held post 1980, the proportion of eligible female adults who exercised their
franchise exceeded the proportion of eligible male adults.The same phenomenon
was evident in non-presidential mid-term elections since 1986 (CAWP, 2000)32
.
Overall percentage of female voter turnout inthe US outnumbers themale
electorate implying that the number of female voters has exceeded the number
of male voters in every Presidential election (retain). Similar trends are evident in
Britain where the gender gap in turnout reversed in 1979 so that by 1997
elections an estimated 17.79 million women voted compared with about 15.8
million men(Rafael Lopez Pintor, Maria Gratschew and Kate Sullivan, 2002)33
.
This indicates that the patterns of voter turnout can be influenced by a legal
framework that draws citizens towards meaningful political activity (Ibid). In
nations like Barbados and Sweden it is observed that the number of femalevoters
consistently exceeds male voters. Conscious attempts to bring women into
political framework can potentially lead to increase in the voter turnout.
Other important factors that may influence voter turnout include the proportion
of youth voters to total voters, internet voting, extended polling, and perhaps
even compulsory voting. Compulsory voting is not a new idea; countries like
29Martin Lipset (1960), Political Man: the Social Bases of Politics, Garden City, New York,
Doubleday. 30 Verba, Sidney N, NieLekajcieSieandKimCattreal(1978), Participation and Social Equality,
Cambridge, Mass: Harvard University Press and Verba SK and N, Nie (1972), Politicization in
America, Political Democracy and Social Equity, New York, Harper and Raw. 31Barnes S and Kaase M (1979), Political Action, Mass Participation in Few Western Democracies,
Beverly Hills, Calif: Sage. 32 CAWP (2000), Women in State Legislature, Center for American Women and Politics, Eagleton
Institute of Politics, Rutgers, The State University of New Jersey, 919, Ryders Lane, New
Brunswick, NJ 08901 (732) 932-9384: www.cawp.rutgers.edu 33Rafael Lopez Pintor, Maria Gratschew and Kate Sullivan (2002),Compulsory Voting, ARENA,
Association of Electoral Administrators, OxonianRewley Press Ltd. United Kingdom.

ZILLA PARISHAD ELECTIONS IN MAHARASHTRA: A DATA
BASED ANALYSIS (1994-2013) 2016
Gokhale Institute of Politics and Economics, Pune, 411 004 12
Belgium (1892), Argentina (1914) and Australia (1924) were among the first
countries to introduce compulsory voting laws (Ibid).
ZILLA PARISHAD VOTER TURNOUT IN INDIA AND
MAHARASHTRA
Even though the State of Maharashtra is not an exception to low voter turnout at
Municipal Corporation elections, the voting behaviour at its closest rural
counterpart, i.e., the Zilla Parishad elections is always observed to be higher. The
voter turnout at Municipal elections in the State is observed to be lower while the
same for Gram Panchayats, Block Panchayat Samitis and Zilla Parishads has
been higher. Elections to the Municipal Councils and Municipal Corporations in
Maharashtra have recorded a voter turnout of less than 45 per cent;even larger
city corporations like Mumbai and Thane have not been an exception (ToI,
2012)34
. This is an evidence of low engagement of citizens in community affairs
(OlsonMancur, 1965)35
. With this background, the voter turnout at the elections
to the Zilla Parishads and Block Panchayat Samitis presents a far better picture of
citizen participation. A large number of districts have recorded voter turnout of
70 per cent at Zilla Parishad elections and in many districts it was between 75
and 80 per cent (The Pioneer, 2016)36
. This phenomenon can be observed across
States in India. In Andhra Pradesh the voter turnout at Zilla Parishad elections is
often higher than 80 to 85 per cent (Business Standard, 2014)37
, whereas in
Mysore it was 75.65 per cent (Deccan Herald, 2016)38
. In Dakshina Kannada
Zilla Parishad 69 per cent voter turnout was recorded (Coastaldigest.com)39
while
other parts of Karnataka such as Sullia, Puttur, Bantwal, Mangaluru and
Belthangady have recorded a voter turnout of 74.15, 71.40, 69.48, 65.58 and
64.82 per cent respectively (Ibid).
Though voter turnout in elections to Zilla Parishads in Maharashtra is
substantially higher than the turnout at Municipal elections, there is still scope
for further increase in the voter turnout. Voter turnout at local elections in
Maharashtra poses a classic collective action problem. Only high voter turnout
34Times of India, 16.02.2012: Retrieved: 26.09.2016. 35Olson Mancur (1965), The Logic of Collective Action, Harvard University Press, US. 36The Pioneer, 07.10.2016, Retrieved: 07.10.2016. 37Business Standard, 11.04.2016, Retrieved: 07.10.2016. 38 Deccan Herald, 07.10.2016 Retrieved: 07.10.2016. 39Coastaldigest.com: Retrieved: 07.10.2016.

ZILLA PARISHAD ELECTIONS IN MAHARASHTRA: A DATA
BASED ANALYSIS (1994-2013) 2016
Gokhale Institute of Politics and Economics, Pune, 411 004 13
can ensure a truly participative democracy and serve the larger public interest by
designing policies and programmes that are in sync with public aspirations.
In order to formulate policies to increase voter turnout, it is important to analyze
the data of preceding elections to understand the trends in voter turnout. Once the
trends are understood, it would be possible to target certain areas more
intensively for increasing the voter turnout in such areas.
It is with this objective that the study of election data analysis on Zilla Parishad
elections held between 1994 and 2013 was commissioned to Gokhale Institute of
Politics and Economics, Pune at the initiative of the State Election Commission
of Maharashtra.
ZILLA PARISHAD ELECTIONS IN MAHARASHTRA: A DATA
BASED ANALYSIS (1994-2013) 2016
Gokhale Institute of Politics and Economics, Pune, 411 004 14
CHAPTER- 2
DEFINING VARIABLES AND RESEARCH QUESTIONS
INTRODUCTION
The 73rd
Amendment to the Constitution, which gave constitutional status to the
Panchyat Raj Institutions (PRI), was passed in 1992. The same amendment
provided for the creation of the State Election Commission of Maharashtra for
conduct of elections in urban and rural local self-governance bodies. All urban
and rural local body elections in Maharashtra since 1994 have been conducted by
the SECM. While urban bodies include Municipal Corporations, Municipal
Councils and Nagar Panchayats, rural bodies encompass Zilla Parishads,
Panchayat Samitis and Gram Panchayats.
In Maharashtra State, at the time of establishment of the SECM, some of the
local bodies rural as well as urban, were already in existence and were
functioning with elected members. It was decided to allow the local bodies to
continue with their existence and hold elections in these local bodies as and when
a 5-year period of their working came to a close. Thus, in Maharashtra, all local
bodies do not go into a state of election at the same time. Different local bodies,
urban and rural, go into a state of elections as and when the 5-year period of their
existence comes to a close.
Since its establishment, the SECM has conducted 4 rounds of elections in all the
local bodies. The first round was from 1994-98, the second round was from
1999-2003, the third round was from 2004-08 and the fourth one was from 2009-
13. From 2014 onwards, the fifth round of elections is being conducted by the
SECM across all rural and urban local bodies in Maharashtra. Whilst some
bodies have already had their fifth round of elections since 2014, in nearly 26 out
of 36 districts in Maharashtra, all urban and rural bodies will go into a state of
elections from November 2016 to March 2017.
The SECM has maintained some basic data on a few electoral variables for each
round of elections held since 1994. This data is on the following variables:
a. Population which will be governed by the local body
ZILLA PARISHAD ELECTIONS IN MAHARASHTRA: A DATA
BASED ANALYSIS (1994-2013) 2016
Gokhale Institute of Politics and Economics, Pune, 411 004 15
b. Proportion of SC population within the total population
c. Proportion of ST population within the total population
d. Total number of wards created within the area governed by the local
body
e. Number of seats contested for the local body
f. Number of seats reserved for SC, ST, BCC categories
g. Number of seats that fall under General Category
h. Number of seats reserved for women under General, SC, ST, BCC
categories
i. Number of voters within the population
j. Number of male and female voters
k. Number of votes cast
l. Number of valid votes cast
m. Voter Turnout Ratio (defined as number of valid votes/ number of
eligible voters in the population)
n. Proportion of votes received by different political parties, coalitions and
independent candidates
o. Distribution of seats won by different political parties, coalitions and
independent candidates
The following graph shows a pictorial representation of the data available
with the SECM across four rounds of elections, referred to as R1, R2, R3 and
R4 hereafter. For some of the local bodies, data on Voter Turnout is missing
for R1. But, data on all variables is definitely available for R2, R3 and R4.
This data is available for Municipal Corporations, Municipal Councils,
Nagar Pachayats, Zilla Parishads and Panchayat Samitis. Data has not been
maintained for Gram Panchayats.
ZILLA PARISHAD ELECTIONS IN MAHARASHTRA: A DATA
BASED ANALYSIS (1994-2013) 2016
Gokhale Institute of Politics and Economics, Pune, 411 004 16
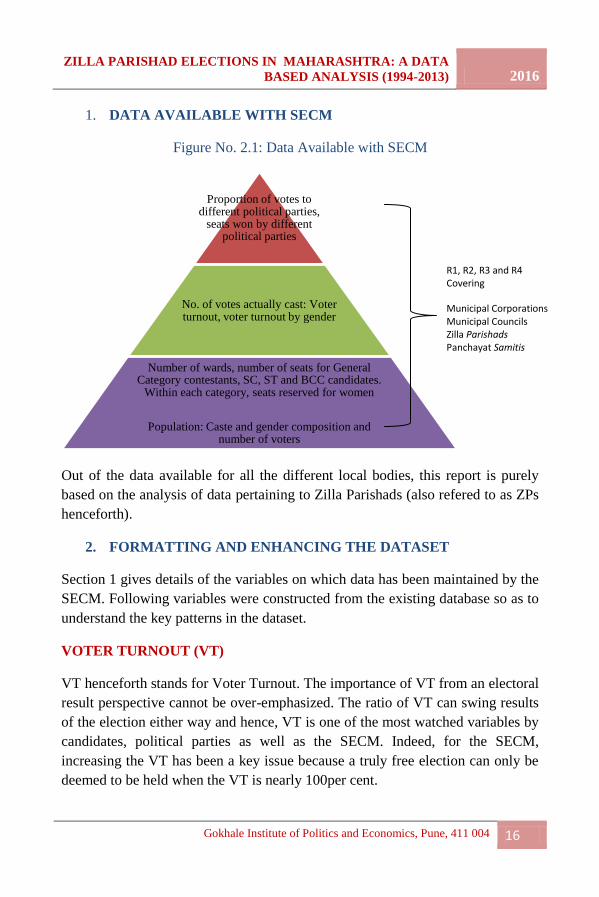
1. DATA AVAILABLE WITH SECM
Figure No. 2.1: Data Available with SECM
Out of the data available for all the different local bodies, this report is purely
based on the analysis of data pertaining to Zilla Parishads (also refered to as ZPs
henceforth).
2. FORMATTING AND ENHANCING THE DATASET
Section 1 gives details of the variables on which data has been maintained by the
SECM. Following variables were constructed from the existing database so as to
understand the key patterns in the dataset.
VOTER TURNOUT (VT)
VT henceforth stands for Voter Turnout. The importance of VT from an electoral
result perspective cannot be over-emphasized. The ratio of VT can swing results
of the election either way and hence, VT is one of the most watched variables by
candidates, political parties as well as the SECM. Indeed, for the SECM,
increasing the VT has been a key issue because a truly free election can only be
deemed to be held when the VT is nearly 100per cent.
Proportion of votes to different political parties,
seats won by different political parties
No. of votes actually cast: Voter turnout, voter turnout by gender
Number of wards, number of seats for General Category contestants, SC, ST and BCC candidates.
Within each category, seats reserved for women
Population: Caste and gender composition and number of voters
R1, R2, R3 and R4
Covering
Municipal Corporations
Municipal Councils
Zilla Parishads Panchayat Samitis

ZILLA PARISHAD ELECTIONS IN MAHARASHTRA: A DATA
BASED ANALYSIS (1994-2013) 2016
Gokhale Institute of Politics and Economics, Pune, 411 004 17
In the report too, VT is treated to be a key variable. Patterns in VT across
different Zilla Parishads as well as across different rounds of elections have been
highlighted. Correlations between VT and various other variables have been
explored so as to draw meaningful conclusions for conduct of future elections.
PROPORTION OF SCST (SCST)
The proportion of SC and ST population to the total population of the area
governed by the local body is hereafter referred to as SCST. SCST can have an
impact on VT and hence it is important to analyze this variable.
The proportion of SC and ST population to the total population as declared by
the Census for the particular area is taken as a reference while deciding the
number of seats to be reserved within a Zilla Parishad by the SECM. The
reservation of seats too impacts VT. In fact, rather than use SCST as a causal
variable to explain the trends in VT, it would be more pertinent to look at the
patterns in reservations. Patterns in the reservations are captured in the variable
RES, which is described next.
PROPORTION OF SEATS RESERVED (RES)
As has been mentioned above, the proportion of SC and ST in the population is
declared in the Census report; since the Census is released every decade, the
proportion of SC/ST to total population within Corporation limits is considered
as fixed for one decade. However, in the same decade, two elections are
conducted to any local body. Now, since the seats are reserved on a rotation
basis, a very interesting pattern emerges. Even if the SC/ST population for the
Zilla Parishad is frozen for a decade as per the Census, reservation of seats in
different constituencies of the ZP undergoes rotation in the same decade. And
this change in reservation affects voter behavior.
RES is defined to be the proportion of reserved seats to the total number of seats
in any ZP. This has been used as a causal variable to check whether changes in
the proportion of seats under reservation bring about a change in the VT ratios in
different Zilla Parishads.

ZILLA PARISHAD ELECTIONS IN MAHARASHTRA: A DATA
BASED ANALYSIS (1994-2013) 2016
Gokhale Institute of Politics and Economics, Pune, 411 004 18
PROPORTION OF SEATS WON BY INDEPENDENT CANDIDATES
(IND)
IND henceforth refers to the proportion of votes garnered by independent
candidates in a Zilla Parishad. IND is interesting because it identifies those areas
wherein the voters are giving higher votes to independent candidates.
Apart from these variables which have been created out of the existing dataset,
some additional variables were created in order to explore the data patterns more
deeply. Thus, the existing data has not only been used to identify certain key
variables, but it has also been enhanced by introducing new variables. Following
were the new variables added to the dataset.
POLITICAL ALIGNMENT (POL)
POL is a dummy variable which stands for “Political Alignment.” If the party
winning maximum number of seats at the local level is the same as the party in
power at the State level, then the dummy variable POL takes value 1, otherwise
0. This variable was added to identify clusters of areas that normally show higher
alignment to the State Government.
PROXY FOR COMPETITION BETWEEN THE PARTIES (REVERSE
COMP)
REVERSE COMP is a variable that helps to understand the level of competition
between different political parties. The dataset contained data on the distribution
of seats to different political parties. Lesser is the standard deviation in the
distribution of seats, it would imply that different parties were in neck to neck
competition.
Thus, REVERSE COMP was defined to be the standard deviation of the
distribution of seats between political parties. Lower the value of REVERSE
COMP, more would be the level of competition between the parties. Areas with
high degree of competition between political parties show a high level of
“swing” i.e. the elections can swing the outcome in favour of any one party.
Hence, those areas with low REVERSE COMP values could be now identified as
areas wherein the swing quotient would be quite high and the contest would be
close.

ZILLA PARISHAD ELECTIONS IN MAHARASHTRA: A DATA
BASED ANALYSIS (1994-2013) 2016
Gokhale Institute of Politics and Economics, Pune, 411 004 19
DEVELOPMENT INDEX (DEV)
Political outcomes show distinct patterns vis-à-vis development ratios. Normally,
in more developed areas, casting a vote is normally not the only way in which
the residents can signal their approval or disapproval for the party or elected
member in power. In fact, in more developed areas, there would be different
options (newspapers with an open culture, TV debates and social media) of
signaling the issues to the Government and accordingly, the voter turnout could
become lower. Similarly, in more developed areas, one may witness higher
participation of women both as voters as well as contestants. Thus, the level of
development of an area (DEV) could be a key factor in determining voter
behavior in general and voter turnout in particular. It would be thus necessary to
develop a proxy for DEV, without which VT may not be explained satisfactorily.
The 2011 Census carries data on per capita income at district level, which can be
used as a district level development indicator. DEV is constructed in the
following fashion. The proportion of per capita income of a particular district to
the per capita income of all districts (in Maharashtra) together is defined as DEV.
However, since this data is only available in the 2011 Census, it is not possible to
trace the effect that economic development has on political dynamics across
time. However, the correlations between economic development and political
variables have been worked out in a static sense in the study.
The following section highlights the research questions on Zilla Parishads that
were handled using the enhanced data sets.
3. IDENTIFYING THE RESEARCH QUESTIONS
Following is a list of the research questions around which the data analysis is
structured.
1. What is the behavior of Voter Turnout in successive rounds of elections
in Zilla Parishads? Has the average VT changed across successive
rounds?
2. Do certain ZPs have a history of higher VT?
3. Do ZPs with high VTs cluster together geographically?
4. Do Zilla Parishads with higher proportion of seats reserved for SC and
ST population proportions show higher VT?
ZILLA PARISHAD ELECTIONS IN MAHARASHTRA: A DATA
BASED ANALYSIS (1994-2013) 2016
Gokhale Institute of Politics and Economics, Pune, 411 004 20
5. Do ZPs of better developed districts show a lower VT?
6. Which Zilla Parishads in Maharashtra are “swing” ZPs i.e. Zilla
Parishads in which the elections are closely contested and can potentially
swing in favor of any one party?
7. Similarly, which are the ZPs in which the swing is extremely low? That
is, which are the ZPs which show single party dominance?
8. Are swing Zilla Parishads also those which exhibit a higher VT level?
9. Is there a correlation in development quotient and the swing behavior?
10. Which are the ZPs that show a high degree of political alignment to the
State Government?
11. Has the proportion of seats won by independent candidates in ZPs
increased over a period of time?
12. Is it the case that proportion of ZP seats won by independent candidates
is higher in more well-developed areas?
These are the main research questions around which the data analysis has been
designed. A focal point of data analysis is to aid developing crucial insights into
the trends in Zilla Parishad elections so that some strategies can be designed for
the upcoming elections.

ZILLA PARISHAD ELECTIONS IN MAHARASHTRA: A DATA
BASED ANALYSIS (1994-2013) 2016
Gokhale Institute of Politics and Economics, Pune, 411 004 21
CHAPTER - 3
DATA ANALYSIS: BEHAVIOUR OF MAIN VARIABLES ACROSS
DIFFERENT ROUNDS OF ELECTIONS
Zilla Parishad and Panchayat Samiti elections are held at the same time. Thus,
every voter casts two votes on the day of elections, one for the Zilla Parishad
representative, and one for the Panchayat Samiti (refered to as ZP and PS
respectively hereafter) representative. Thus, the voter turnout rate for ZP and PS
is identical. However, trends in other variables such as distribution of reserved
category seats in the local body, political alignment of the local bodies,
proportion of seats won by independent candidates, etc.could be different in Zilla
Parishads and Panchayat Samitis.
This chapter highlights the trends in the different variables as observed in the ZP
elections.
3.1 VOTER TURNOUT
As has been mentioned in Chapter 2, Voter Turnout is a crucial variable for the
SECM. A higher VT is a policy objective, and indicates that the democratic
forces are indeed operative at the grassroots level. A higher VT truly invokes
higher competition amongst political parties and independent candidates alike.
Following are the summary statistics for VT across four rounds of ZP Elections.
Table No. 3.1: Trends in VT across Successive Rounds of Elections
VT R1 R2 R3 R4
Mean 70.162 69.438 69.236 67.54
Std. Deviation 5.895 5.032 4.429 3.81
Minimum 56.910 56.422 59.300 58.24
Maximum 79.730 79.148 78.600 75.37

ZILLA PARISHAD ELECTIONS IN MAHARASHTRA: A DATA
BASED ANALYSIS (1994-2013) 2016
Gokhale Institute of Politics and Economics, Pune, 411 004 22
There are three worrisome observations about the voter turnout at ZP elections.
1. The overall VT average across all rounds of elections stands at 69.09 per
cent.As has been mentioned in the beginning of this chapter, ZP and PS
elections are held simultaneously. Hence, the average VT for both ZP as
well as PS elections is 69.09 per cent. The average voter turnout for
Municipal Corporation elections in Maharashtra is 56 per cent whereas
that for Municipal Councils and Nagar Panchayats is 71 per cent.
2.
It is worrisome to note that the VT in ZP and PS elections is lower as
compared to the VT in Municipal Council and Nagar Panchayat
elections. This implies that a higher proportion of the population votes at
the Municipal Councils and Nagar Panchayats, which govern small
urban or sub-urban areas, as compared to the proportion of population
which votes for ZPs and PSs, which govern the rural parts of districts
and blocks respectively.
This is truly surprising because it has been a common observation across
countries, states and local areas that rural areas have higher VT as
compared to urban areas. This is because the urban voter does not
exclusively rely on his vote to voice his opinion. He uses social media,
newspapers, citizen groups and NGOs to voice his opinion on social
issues. However, these options are not available to the rural voter or to
the urban voter in small townships. Hence, one would normally expect
the average VT to increase as one moves from Municipal Corporations
to Municipal Councils and from Councils to ZPs. The average VT for
Municipal Corporations in Maharashtra stands at 56.31 per cent;for ZP
and PS it stands at 69.09 per cent and for Municipal Councils and Nagar
Panchayats it stands at 70.77 per cent. Data trends belie intuition.
Thus, the average VT in ZP and PS elections has in fact been lower than
that in the Municipal Council elections. One of the reasons that could be
a contributing factor to this trend could be migration. If the level of
migration from rural to urban areas is higher as compared to that from
semi-urban areas to urban areas, then it may reflect in lower VT in the
rural body elections.
ZILLA PARISHAD ELECTIONS IN MAHARASHTRA: A DATA
BASED ANALYSIS (1994-2013) 2016
Gokhale Institute of Politics and Economics, Pune, 411 004 23
This trend also highlights the fact that urbanization and migration could
well become a central policy issue for the SECM over a period of time.
More thought will have to be given to how migrating voters may be
allowed to cast their vote from distant locations.
3. The second worrisome observation is that the voter turnout has been
continually falling over the four rounds of elections held so far. In the
Municipal Council as well as Municipal Corporation elections, the voter
turnout has increased in R3 i.e. in the elections held during the period
2004-08. However, in the ZP election data, there is almost a linear
decrease in the voter turnout with every election. Clearly, the enthusiasm
in the urban voters in R3 has not beenobserved in rural voters.
4. There is a rather interesting, but again worrisome story in the variability
of the VT. A look at the standard deviations tells us that the standard
deviations in the VT are falling across successive rounds of elections.
The standard deviation is a measure of variability. It tells us how much
variability is there in the data pertaining to VT in different rounds of
elections. A reduction in the standard deviation tells us that even though
the average VT has been falling, it does seem to be the case that the
diversity in the voting patterns across various ZPs is reducing. Thus, in
R1, there may be ZPs with extremely high and/or low values; however
these extremities are getting replaced by a more uniform pattern of
voting across successive rounds of elections. A lower standard deviation
and a lower average implies that from R1 to R4, lesser number of voters
are casting their votes and this is becoming a more uniform trend across
all ZPs. An increasing average with a lower standard deviation is
desirable; but a lower VT with more uniformity indicates a rather
discouraging trend.
The same point comes across more clearly when one considers the
behaviour of the minimum and maximum numbers in different rounds of
elections. The minimum VT has increased across time and the maximum
has reduced across time; these two put together imply that the standard
deviation or variability in data will reduce. However, the increment in
minimum is lower as compared to the reduction in maximum; this causes
the average VT to fall across successive rounds of election.
ZILLA PARISHAD ELECTIONS IN MAHARASHTRA: A DATA
BASED ANALYSIS (1994-2013) 2016
Gokhale Institute of Politics and Economics, Pune, 411 004 24
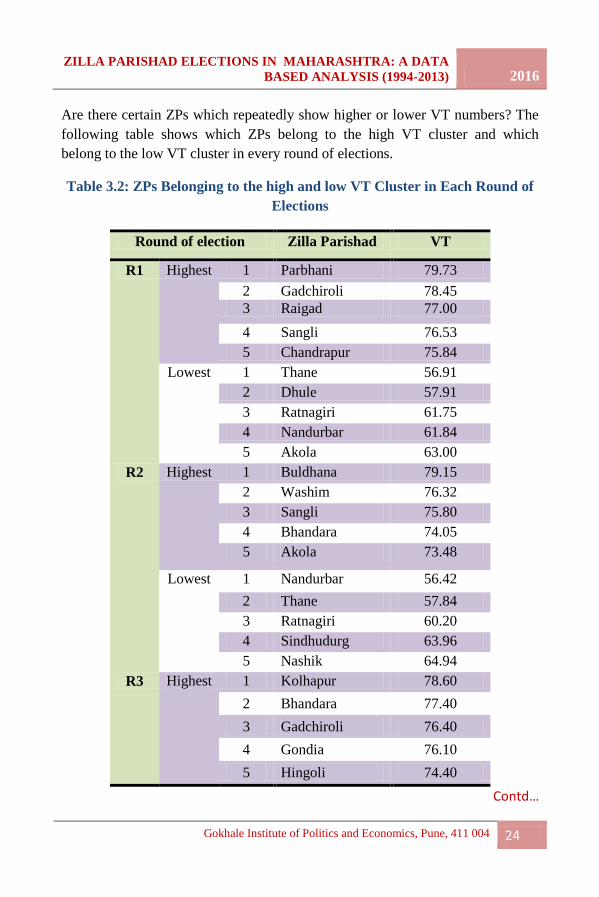
Are there certain ZPs which repeatedly show higher or lower VT numbers? The
following table shows which ZPs belong to the high VT cluster and which
belong to the low VT cluster in every round of elections.
Table 3.2: ZPs Belonging to the high and low VT Cluster in Each Round of
Elections
Round of election Zilla Parishad VT
R1 Highest 1 Parbhani 79.73
2 Gadchiroli 78.45
3 Raigad 77.00
4 Sangli 76.53
5 Chandrapur 75.84
Lowest 1 Thane 56.91
2 Dhule 57.91
3 Ratnagiri 61.75
4 Nandurbar 61.84
5 Akola 63.00
R2 Highest 1 Buldhana 79.15
2 Washim 76.32
3 Sangli 75.80
4 Bhandara 74.05
5 Akola 73.48
Lowest 1 Nandurbar 56.42
2 Thane 57.84
3 Ratnagiri 60.20
4 Sindhudurg 63.96
5 Nashik 64.94
R3 Highest 1 Kolhapur 78.60
2 Bhandara 77.40
3 Gadchiroli 76.40
4 Gondia 76.10
5 Hingoli 74.40
Contd…

ZILLA PARISHAD ELECTIONS IN MAHARASHTRA: A DATA
BASED ANALYSIS (1994-2013) 2016
Gokhale Institute of Politics and Economics, Pune, 411 004 25
Round of election Zilla Parishad VT
Lowest 1 Thane 59.30
2 Nashik 61.90
3 Dhule 62.70
4 Ratnagiri 63.90
5 Jalgaon 64.50
R4 Highest 1 Gondia 75.37
2 Kolhapur 75.24
3 Bhandara 72.96
4 Hingoli 72.27
5 Chandrapur 71.46
Lowest 1 Thane 58.24
2 Nagpur 62.79
3 Solapur 63.24
4 Osmanabad 63.47
5 Ratnagiri 63.52
The above table shows that certain ZPs such as Bhandara, Gadchiroli, Gondia,
Sangli, Kolhapur repeatedly occur in the high VT cluster. A re-arrangement of
the ZPs with high VTs into divisional clusters shows some interesting trends.

ZILLA PARISHAD ELECTIONS IN MAHARASHTRA: A DATA
BASED ANALYSIS (1994-2013) 2016
Gokhale Institute of Politics and Economics, Pune, 411 004 26
Table 3.3: Re-arrangement of high VT Zilla Parishads into Divisional
Clusters
Divisional
Clusters
R1 R2 R3 R4
Amravati Buldhana
Washim
Akola
Aurangabad Parbhani Hingoli Hingoli
Nagpur Gadchiroli Bhandara Bhandara Bhandara
Chandrapur Gadchiroli Chandrapur
Gondia Gondia
Pune Sangli Sangli Kolhapur Kolhapur
Konkan Raigad
There are 5 divisions which repeatedly occur in the high VT cluster, namely
Aurangabad, Amravati, Chandrapur, Pune and Konkan. None of the districts in
Nashik division show very high VTs. Now, one can easily see how the trends in
VT have changed across time.
Districts in Amravati division only exhibit high VTs in R2. It is interesting to
note that all three districts namely Akola, Washim and Buldhana score extremely
low on the development index variable (DEV) as shown in the report later.
In Aurangabad division, the epicentre of high VTs has moved gently from
Parbhani to Hingoli. Again, Parbhani and Hingoli show very low development
levels.
Chandrapur and Pune divisions are special because districts in these divisions
have been consistently showing high VTs in all 4 rounds of elections. In
Chandrapur division, one can see that the epicentre of high VTs has moved from
Gadchiroli towards the northern districts of Bhandara and Gondia. In these
districts again, development quotients have persistently remained low and hence,
these districts may be consistently showing higher VTs. In Pune division too, one
finds the epicentre of high VT moving from Sangli towards Kolhapur. However,
districts in the Pune division boast of some of the highest development quotients
ZILLA PARISHAD ELECTIONS IN MAHARASHTRA: A DATA
BASED ANALYSIS (1994-2013) 2016
Gokhale Institute of Politics and Economics, Pune, 411 004 27
in Maharashtra. Then how is it that Sangli and Kolhapur show such high levels
of VT?
High VT could undoubtedly be a reflection of low development;however, there
are some areas with a “culture” of political activism and voting. Kolhapur district
is an area wherein VT is high across all local bodies, i.e., Muncipal Corporation
of Kolhapur, Muncipal Councils and Nagar Panchayats in the Kolhapur District,
as well as the Zilla Parishad of Kolhapur We could thus conclude that Sangli-
Kolhapur is that part of Maharashtra wherein the voter is very sensitized to
elections and hence, these areas have an interesting and entrenched voting
culture and voter awareness.
Only Raigad district in Konkan division shows a high VT in R1. However, one
finds that districts in Konkan division get eased out of the high VT cluster in
successive rounds of elections. There could be three reasons for this trend. The
first could be of course the fact that development has occurred rapidly with
Mumbai as an epi-centre of growth and hence, districts in Konkan may not be
showing higher VT. Secondly, there is heavy migration from all areas in Konkan
to Mumbai; this itself may be contributing to the lower VT. A third angle to this
is that there are 3 districts in Maharashtra which are completely urbanized and
hence do not have a ZP at all. These are Mumbai, Mumbai sub-urban and Thane
and all these districts occur in the Konkan division. Thus, there could be a
cultural issue of contagion wherein urban voters, who exhibit urban apathy,
indirectly have a cultural impact on the neighboring sub-urban, semi-urban and
eventually rural areas, contributing to low VT in the division.
Which are those ZPs which historically show low VTs across successive rounds
of elections? Re-arrangement of the ZPs shows some interesting patterns. See
table below.
ZILLA PARISHAD ELECTIONS IN MAHARASHTRA: A DATA
BASED ANALYSIS (1994-2013) 2016
Gokhale Institute of Politics and Economics, Pune, 411 004 28
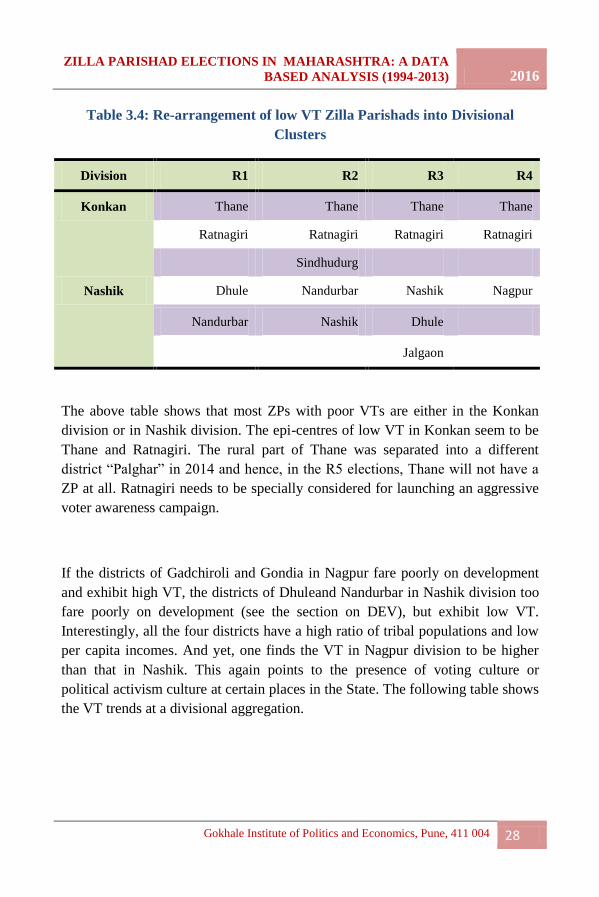
Table 3.4: Re-arrangement of low VT Zilla Parishads into Divisional
Clusters
Division R1 R2 R3 R4
Konkan Thane Thane Thane Thane
Ratnagiri Ratnagiri Ratnagiri Ratnagiri
Sindhudurg
Nashik Dhule Nandurbar Nashik Nagpur
Nandurbar Nashik Dhule
Jalgaon
The above table shows that most ZPs with poor VTs are either in the Konkan
division or in Nashik division. The epi-centres of low VT in Konkan seem to be
Thane and Ratnagiri. The rural part of Thane was separated into a different
district “Palghar” in 2014 and hence, in the R5 elections, Thane will not have a
ZP at all. Ratnagiri needs to be specially considered for launching an aggressive
voter awareness campaign.
If the districts of Gadchiroli and Gondia in Nagpur fare poorly on development
and exhibit high VT, the districts of Dhuleand Nandurbar in Nashik division too
fare poorly on development (see the section on DEV), but exhibit low VT.
Interestingly, all the four districts have a high ratio of tribal populations and low
per capita incomes. And yet, one finds the VT in Nagpur division to be higher
than that in Nashik. This again points to the presence of voting culture or
political activism culture at certain places in the State. The following table shows
the VT trends at a divisional aggregation.

ZILLA PARISHAD ELECTIONS IN MAHARASHTRA: A DATA
BASED ANALYSIS (1994-2013) 2016
Gokhale Institute of Politics and Economics, Pune, 411 004 29
Table 3.5: Divisional Aggregates for VT
DIVISION Average of VT Mean Std.
Deviation R1 R2 R3 R4
Nagpur 74.88 70.26 73.25 70.24 72.04 3.80
Aurangabad 72.66 71.79 70.04 68.14 70.59 3.25
Pune 72.79 72.21 69.42 67.82 70.56 4.30
Amravati 69.46 72.46 69.62 66.96 69.62 4.34
Nashik 64.22 64.47 65.66 65.95 65.08 3.79
Konkan 64.91 62.46 65.38 64.66 64.35 5.46
Total 70.16 69.44 69.24 67.54 69.08 4.87
Graph No. 3.1:
The graph above shows that a gap exists between VT in Nashik and Konkan and
the VT in other divisions. Nagpur, Pune and Aurangabad seem to be the high VT
divisions in Maharashtra. But the earlier analysis shows that divisional
aggregation may not always be a good idea because any kind of aggregation
masks the underlying trends. For example, Pune division shows good VT largely
because Kolhapur and Sangli ZPs are included in that division.
56.00
58.00
60.00
62.00
64.00
66.00
68.00
70.00
72.00
74.00
76.00
R1 R2 R3 R4
NAGPUR
AURANGABAD
PUNE
AMRAVATI
NASHIK
KONKAN

ZILLA PARISHAD ELECTIONS IN MAHARASHTRA: A DATA
BASED ANALYSIS (1994-2013) 2016
Gokhale Institute of Politics and Economics, Pune, 411 004 30
Thus, it does seem to be the case that there are certain districts, rather than
certain divisions, wherein voting is steeped in the culture and community living
of the place. In such places, higher VT is observed. If this is indeed the case, then
a ZP with high VT in one round of elections ought to also exhibit high VT in the
earlier rounds. Similarly, a ZP with low VT in one round of elections ought to
also exhibit high VT in the earlier rounds. Statistically speaking, this implies that
the correlation co-efficient between VT in two successive rounds would be
positive. The next section checks for correlation between VT in successive
rounds.
4.1.1 DOES VT DEPEND ON PAST PERIOD VT?
Voter turnout may not only be dependent on the level of propaganda done by
candidates, or the amount of hype created during elections or even on
expenditure incurred by the Government on voter awareness programs. It could
simply be the case that there is a history or culture of voting associated with
certain areas.
Does the VT witnessed in a Zilla Parishad in a particular round show some level
of positive correlation with the VT in the past rounds? If yes, then it would imply
that ZPs which show high VT continue to show high numbers for the next
elections as well. Similarly, the positive correlation coefficient would imply that
ZPs with a low ratio continue to exhibit low ratios in the next rounds too. The
following table shows the correlation matrix for VT in the different election
rounds.
Table 3.6: Correlation Matrix for VT
VT_R1 VT_R2 VT_R3 VT_R4
VT_R1 1.000
VT_R2 0.697** 1.000
VT_R3 0.665** 0.541** 1.000
VT_R4 0.553** 0.471** 0.835** 1.000
** indicate significance at 5per centl.o.s.
All correlation co-efficients are positive and significant. This implies that a ZP
with a high VT in one round typically tends to exhibit high VT in the next round
ZILLA PARISHAD ELECTIONS IN MAHARASHTRA: A DATA
BASED ANALYSIS (1994-2013) 2016
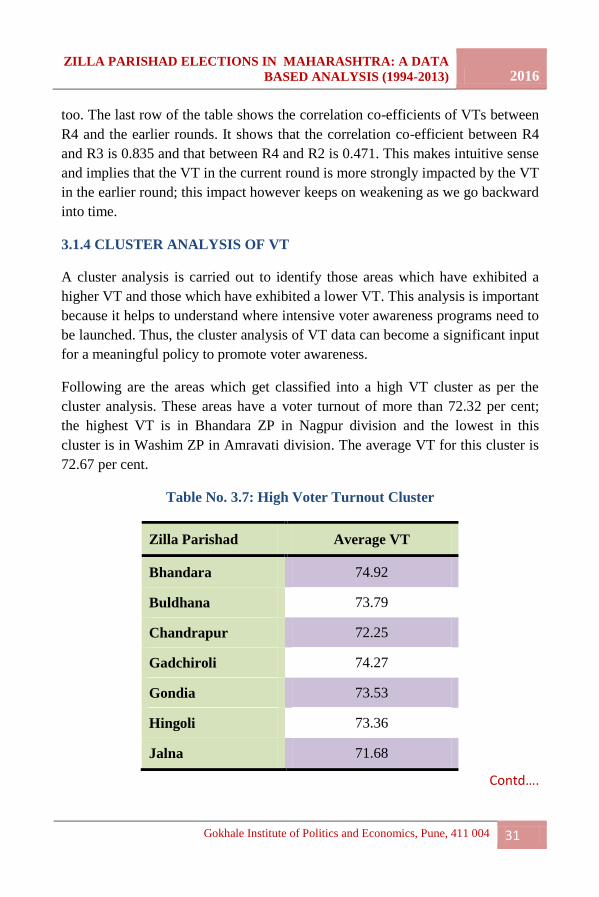
Gokhale Institute of Politics and Economics, Pune, 411 004 31
too. The last row of the table shows the correlation co-efficients of VTs between
R4 and the earlier rounds. It shows that the correlation co-efficient between R4
and R3 is 0.835 and that between R4 and R2 is 0.471. This makes intuitive sense
and implies that the VT in the current round is more strongly impacted by the VT
in the earlier round; this impact however keeps on weakening as we go backward
into time.
3.1.4 CLUSTER ANALYSIS OF VT
A cluster analysis is carried out to identify those areas which have exhibited a
higher VT and those which have exhibited a lower VT. This analysis is important
because it helps to understand where intensive voter awareness programs need to
be launched. Thus, the cluster analysis of VT data can become a significant input
for a meaningful policy to promote voter awareness.
Following are the areas which get classified into a high VT cluster as per the
cluster analysis. These areas have a voter turnout of more than 72.32 per cent;
the highest VT is in Bhandara ZP in Nagpur division and the lowest in this
cluster is in Washim ZP in Amravati division. The average VT for this cluster is
72.67 per cent.
Table No. 3.7: High Voter Turnout Cluster
Zilla Parishad Average VT
Bhandara 74.92
Buldhana 73.79
Chandrapur 72.25
Gadchiroli 74.27
Gondia 73.53
Hingoli 73.36
Jalna 71.68
Contd….
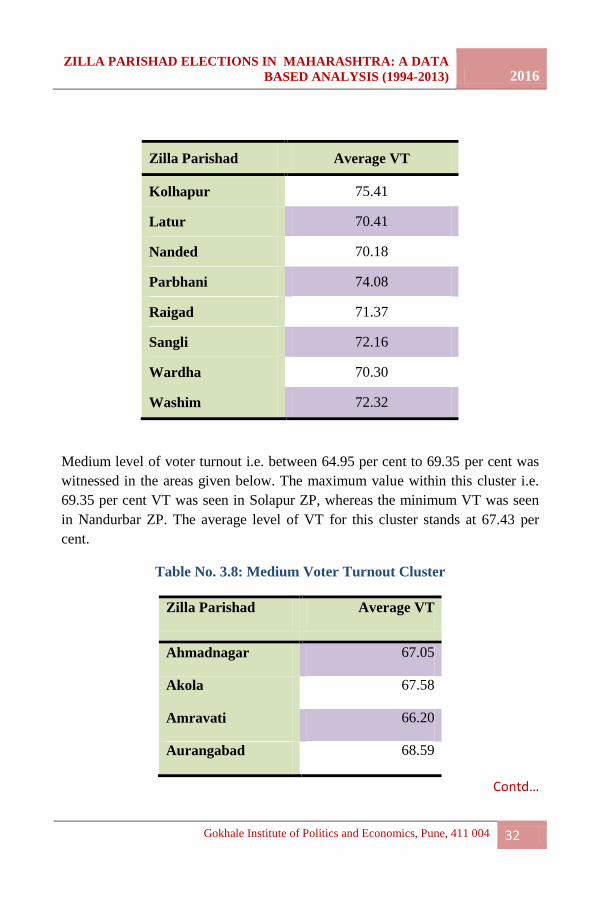
ZILLA PARISHAD ELECTIONS IN MAHARASHTRA: A DATA
BASED ANALYSIS (1994-2013) 2016
Gokhale Institute of Politics and Economics, Pune, 411 004 32
Zilla Parishad Average VT
Kolhapur 75.41
Latur 70.41
Nanded 70.18
Parbhani 74.08
Raigad 71.37
Sangli 72.16
Wardha 70.30
Washim 72.32
Medium level of voter turnout i.e. between 64.95 per cent to 69.35 per cent was
witnessed in the areas given below. The maximum value within this cluster i.e.
69.35 per cent VT was seen in Solapur ZP, whereas the minimum VT was seen
in Nandurbar ZP. The average level of VT for this cluster stands at 67.43 per
cent.
Table No. 3.8: Medium Voter Turnout Cluster
Zilla Parishad Average VT
Ahmadnagar 67.05
Akola 67.58
Amravati 66.20
Aurangabad 68.59
Contd…
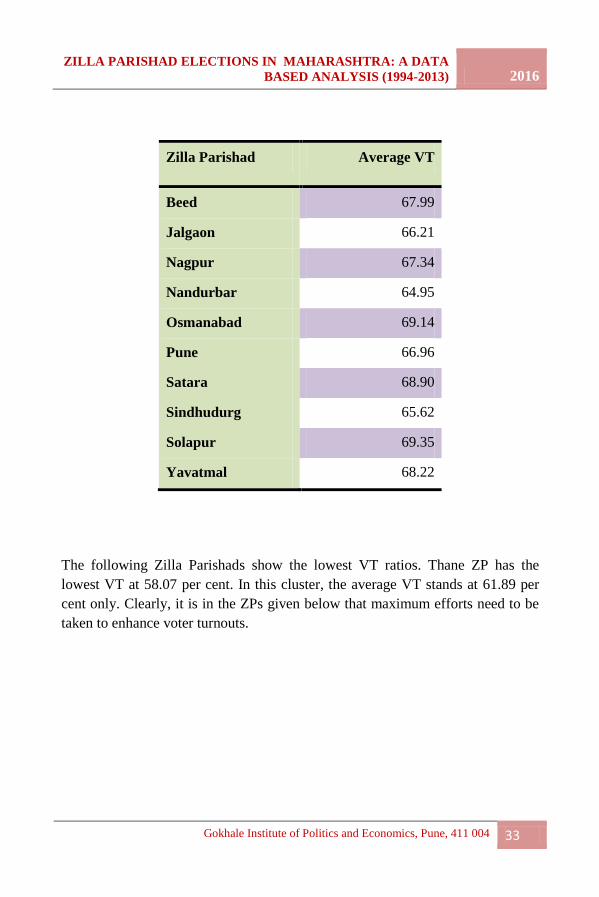
ZILLA PARISHAD ELECTIONS IN MAHARASHTRA: A DATA
BASED ANALYSIS (1994-2013) 2016
Gokhale Institute of Politics and Economics, Pune, 411 004 33
Zilla Parishad Average VT
Beed 67.99
Jalgaon 66.21
Nagpur 67.34
Nandurbar 64.95
Osmanabad 69.14
Pune 66.96
Satara 68.90
Sindhudurg 65.62
Solapur 69.35
Yavatmal 68.22
The following Zilla Parishads show the lowest VT ratios. Thane ZP has the
lowest VT at 58.07 per cent. In this cluster, the average VT stands at 61.89 per
cent only. Clearly, it is in the ZPs given below that maximum efforts need to be
taken to enhance voter turnouts.

ZILLA PARISHAD ELECTIONS IN MAHARASHTRA: A DATA
BASED ANALYSIS (1994-2013) 2016
Gokhale Institute of Politics and Economics, Pune, 411 004 34
Table No. 3.9: Low Voter Turnout Cluster
Zilla Parishad VT
Dhule 63.36
Nashik 63.81
Ratnagiri 62.34
Thane 58.07
Thus, the high, medium and low VT clusters have average values of 72.67 per
cent, 67.43 per cent and 61.89 per cent respectively. These average values,
around which the cluster is arranged, are called as centroids of the cluster. Thus,
there are three distinct centroids for the VT cluster process; the high and medium
centroids are closer to each other, but the low VT centroid at 61.89 per cent is
farther off. It is here that voter awareness programs can make a true difference.
3.2 POLITICAL ALIGNMENT
As mentioned in Chapter 2, the variable political alignment POL has been
created to enhance the data-set.
If a Zilla Parishad has the same party in power as the party in the State
Government, political alignment i.e. POL takes value 1, otherwise 0. Political
alignment helps to show alignment patterns of ZPs with State Government. The
objective of creating this variable is to examine if rural areas of certaindistricts
have a relationship with the government at the State. This variable highlights the
effect of a change in the State Governments on local goverance tiers. One may
well look at it as a “political trickle down” effect.
Following is a snapshot of how the data looks once POL is constructed.

ZILLA PARISHAD ELECTIONS IN MAHARASHTRA: A DATA
BASED ANALYSIS (1994-2013) 2016
Gokhale Institute of Politics and Economics, Pune, 411 004 35
Table No. 3.10: VT and POL in Select Zilla Parishads
The various patterns in POL such as 1-0-0-0, 1-1-1-0, 1-0-1-0, 0-1-0-1, 0-1-1-1
etc. are extremely interesting and reveal different political dynamics. If a ZP
exhibits a pattern such as 0-1-0-1 or 1-0-1-0, it indicates that there have been a
lot of fluctuations in the political alignment. A pattern such as 0-0-1-1 indicates a
recent move towards alignment. If an average of political alignment is
considered, the average number will obviously lie between 0 and 1. A ZP whose
average across all rounds is 0 shows zero alignment to the State Government
from 1995 to 2014. A ZP whose average across all rounds is 1 shows maximum
influence of State Government over local political forces.
Assume that two Zilla Parishads get an average score of 0.5 which indicates that
they‟ve been aligned with the State Government for 2 rounds each. However, the
underlying political forces could be very different. One ZP could be showing a
pattern of 1-1-0-0 which means that it was aligned with the SS-BJP State
Division Zilla
Parishad
VT_R1 VT_R2 VT_R3 VT_R4 POL1 POL2 POL3 POL_4
Amravati Buldhana 74.74 79.15 71.60 69.68 0 1 1 1
Amravati Yavatmal 72.84 68.22 67.10 64.72 0 1 1 1
Amravati Washim 69.09 76.32 73.90 69.98 0 1 1 1
Amravati Amravati 67.63 65.12 67.00 65.07 0 1 1 1
Amravati Akola 63.00 73.48 68.50 65.35 0 0 0 0
Aurangabad Parbhani 79.73 72.78 72.50 71.32 0 0 1 1
Aurangabad Latur 74.35 73.31 68.70 65.29 0 1 1 1
Aurangabad Jalna 73.96 71.93 70.60 70.25 0 0 0 0
Aurangabad Nanded 73.06 72.09 68.10 67.46 0 1 1 1
Aurangabad Osmanabad 72.34 71.47 69.30 63.47 0 1 1 1
Aurangabad Aurangabad 67.82 70.77 67.60 68.17 0 0 0 1
Aurangabad Beed 67.37 68.59 69.10 66.90 0 1 0 1

ZILLA PARISHAD ELECTIONS IN MAHARASHTRA: A DATA
BASED ANALYSIS (1994-2013) 2016
Gokhale Institute of Politics and Economics, Pune, 411 004 36
Government in R1 and with the INC-NCP State Government in R2, but in the
recent two elections, it does not show any alignment with the INC-NCP
government. Another ZP may show a pattern of 0-0-1-1 which means that it was
not aligned with the SS-BJP Government in R1 and with the INC-NCP State
Government in R2, but recently has become aligned with INC-NCP State
Government in R3 and R4.
Thus, different political equations with the parties in power at State level will
create different alignment patterns in POL.
Table No. 3.11: Trends in POL in Successive Rounds of Election
Mean Std.
Deviation
Median Minimum Maximum
POL1
(R1?)
.06 .250 .000 0 1
POL2 .73 .452 1.000 0 1
POL3 .76 .435 1.000 0 1
POL4 .79 .415 1.000 0 1
While in R1, only 6 per cent Zilla Parishads are aligned, in R4, 79 per cent of the
ZPs are aligned. Clearly, alignment of ZPs with the state government has
increased over a period of time. What does this indicate? In the first round of
elections for Zilla Parishads, Shiv Sena- BJP was in power at the state level. In
this round, it is observed that the political alignment with the State is minimal.
However, this increases significantly with successive rounds. When the 2nd
, 3rd
and 4th round of ZP elections were held, INC-NCP government was in power at
the State level. The higher political alignment of ZPs with the State in these
rounds implies that the ZPs have been mostly dominated by INC and/or NCP in
Maharashtra.
Further, it is observed that the jump in alignment is very large from R1 to R2.
The State Government changed between R1 and R2. If it is true that the INC-
NCP combination dominates the Zilla Parishads, then the jump in political
alignment gets explained quite well with a change in the State Government.
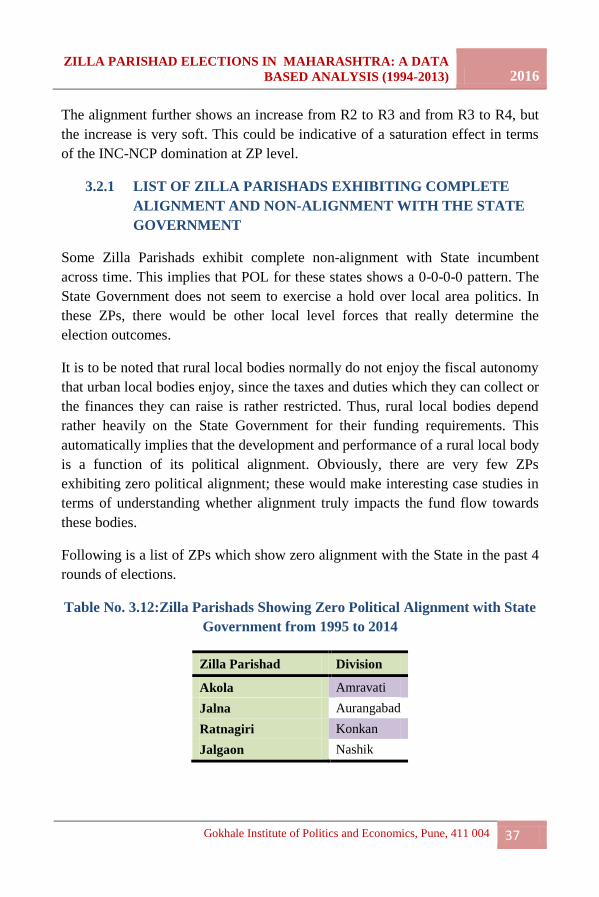
ZILLA PARISHAD ELECTIONS IN MAHARASHTRA: A DATA
BASED ANALYSIS (1994-2013) 2016
Gokhale Institute of Politics and Economics, Pune, 411 004 37
The alignment further shows an increase from R2 to R3 and from R3 to R4, but
the increase is very soft. This could be indicative of a saturation effect in terms
of the INC-NCP domination at ZP level.
3.2.1 LIST OF ZILLA PARISHADS EXHIBITING COMPLETE
ALIGNMENT AND NON-ALIGNMENT WITH THE STATE
GOVERNMENT
Some Zilla Parishads exhibit complete non-alignment with State incumbent
across time. This implies that POL for these states shows a 0-0-0-0 pattern. The
State Government does not seem to exercise a hold over local area politics. In
these ZPs, there would be other local level forces that really determine the
election outcomes.
It is to be noted that rural local bodies normally do not enjoy the fiscal autonomy
that urban local bodies enjoy, since the taxes and duties which they can collect or
the finances they can raise is rather restricted. Thus, rural local bodies depend
rather heavily on the State Government for their funding requirements. This
automatically implies that the development and performance of a rural local body
is a function of its political alignment. Obviously, there are very few ZPs
exhibiting zero political alignment; these would make interesting case studies in
terms of understanding whether alignment truly impacts the fund flow towards
these bodies.
Following is a list of ZPs which show zero alignment with the State in the past 4
rounds of elections.
Table No. 3.12:Zilla Parishads Showing Zero Political Alignment with State
Government from 1995 to 2014
Zilla Parishad Division
Akola Amravati
Jalna Aurangabad
Ratnagiri Konkan
Jalgaon Nashik

ZILLA PARISHAD ELECTIONS IN MAHARASHTRA: A DATA
BASED ANALYSIS (1994-2013) 2016
Gokhale Institute of Politics and Economics, Pune, 411 004 38
Some ZPs exhibit complete alignment with the State Government i.e. the POL in
these districts exhibits a 1-1-1-1 pattern. This implies that the State incumbent
has a lot of control over local area rural politics in these districts.
It is extremely interesting to note that there are no ZPs showing complete
alignment with the State incumbent from R1 to R4.
The following districts show complete alignment with the State incumbent in all
four rounds of elections.
Table 3.13: List of ZPs showing complete alignment with State Government
from 1995 to 2014
Zilla Parishad Division
Buldhana Amravati
Yavatmal Amravati
Washim Amravati
Amravati Amravati
Latur Aurangabad
Nanded Aurangabad
Osmanabad Aurangabad
Thane Konkan
Gadchiroli Nagpur
Chandrapur Nagpur
Wardha Nagpur
Gondia Nagpur
Ahmednagar Nashik
Nashik Nashik
Contd…
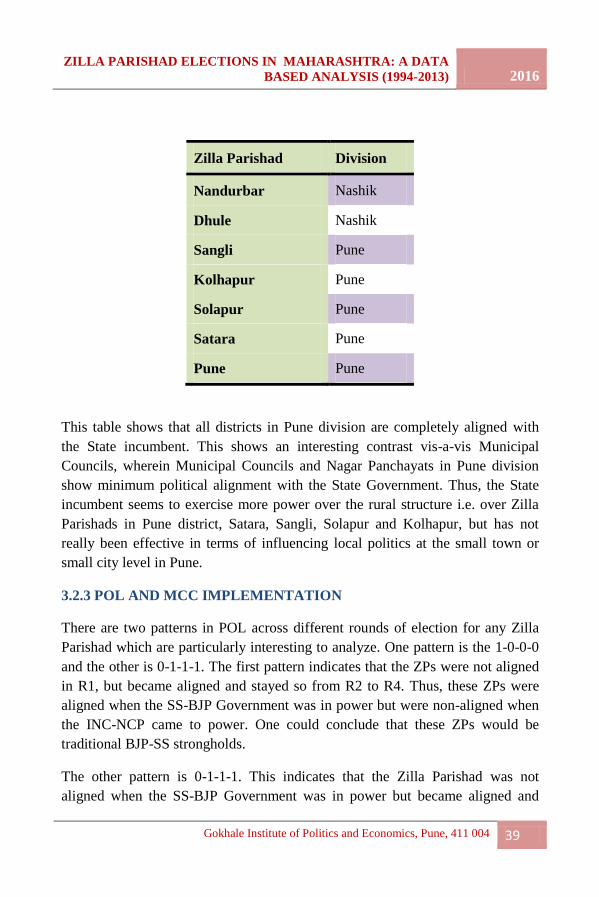
ZILLA PARISHAD ELECTIONS IN MAHARASHTRA: A DATA
BASED ANALYSIS (1994-2013) 2016
Gokhale Institute of Politics and Economics, Pune, 411 004 39
Zilla Parishad Division
Nandurbar Nashik
Dhule Nashik
Sangli Pune
Kolhapur Pune
Solapur Pune
Satara Pune
Pune Pune
This table shows that all districts in Pune division are completely aligned with
the State incumbent. This shows an interesting contrast vis-a-vis Municipal
Councils, wherein Municipal Councils and Nagar Panchayats in Pune division
show minimum political alignment with the State Government. Thus, the State
incumbent seems to exercise more power over the rural structure i.e. over Zilla
Parishads in Pune district, Satara, Sangli, Solapur and Kolhapur, but has not
really been effective in terms of influencing local politics at the small town or
small city level in Pune.
3.2.3 POL AND MCC IMPLEMENTATION
There are two patterns in POL across different rounds of election for any Zilla
Parishad which are particularly interesting to analyze. One pattern is the 1-0-0-0
and the other is 0-1-1-1. The first pattern indicates that the ZPs were not aligned
in R1, but became aligned and stayed so from R2 to R4. Thus, these ZPs were
aligned when the SS-BJP Government was in power but were non-aligned when
the INC-NCP came to power. One could conclude that these ZPs would be
traditional BJP-SS strongholds.
The other pattern is 0-1-1-1. This indicates that the Zilla Parishad was not
aligned when the SS-BJP Government was in power but became aligned and

ZILLA PARISHAD ELECTIONS IN MAHARASHTRA: A DATA
BASED ANALYSIS (1994-2013) 2016
Gokhale Institute of Politics and Economics, Pune, 411 004 40
remained so once the INC-NCP came to power at the State level. Thus, these
could be traditional INC-NCP strongholds.
There is only one ZP, which is such that it shows alignment with the State only
in R1 and shows no alignment in the other rounds. This is the Ratnagiri ZP. We
could conclude that this has been a SS- BJP stronghold. By contrast, there are 20
INC-NCP strongholds, showing alignment only in R2, R3 and R4.
If there is a party stronghold with a low VT, the other party has lower chances of
breaking that stronghold. However, if there is high VT in party bastions, the
other party would campaign fiercely to break the dominance of the opposite
party and hence, such ZPs would be likely to witness strong bitter contests
among rival parties. Thus, a combination of a party stronghold together with high
VT in a ZP would increase chances of political activism from political parties.
Now, if the high VT cluster is matched with the BJP-SS as well as INC-NCP
strongholds, it is possible to understand where the maximum competition will
happen. It is in these areas that it is really necessary to put extra effort in terms of
implementation of Model Code of Conduct (MCC).
There is only one ZP, namely Ratnagiri which shows a pro-BJP alignment POL
pattern of 1-0-0-0. As section 3.1.4 shows, Ratnagiri (with a VT of 62.34 per
cent) belongs to the low VT cluster. Hence, the chances of Ratnagiri showing
very high level of political party competition seem to be low in the upcoming R5
elections. The following table shows the list of INC-NCP strongholds together
with the VTs in those areas.
Table No. 3.14: INC-NCP Strongholds with High VT
District Division Average
VT
POL R1 POL R2 POL R3 POL R4
Thane Konkan 58.07 0 1 1 1
Dhule Nashik 63.36 0 1 1 1
Nashik Nashik 63.81 0 1 1 1
Nandurbar Nashik 64.95 0 1 1 1
Contd…

ZILLA PARISHAD ELECTIONS IN MAHARASHTRA: A DATA
BASED ANALYSIS (1994-2013) 2016
Gokhale Institute of Politics and Economics, Pune, 411 004 41
District Division Average
VT
POL R1 POL R2 POL R3 POL R4
Amravati Amravati 66.2 0 1 1 1
Pune Pune 66.96 0 1 1 1
Ahmednagar Nashik 67.05 0 1 1 1
Yavatmal Amravati 68.22 0 1 1 1
Satara Pune 68.9 0 1 1 1
Osmanabad Aurangabad 69.14 0 1 1 1
Solapur Pune 69.35 0 1 1 1
Nanded Aurangabad 70.18 0 1 1 1
Wardha Nagpur 70.3 0 1 1 1
Latur Aurangabad 70.41 0 1 1 1
Sangli Pune 72.16 0 1 1 1
Chandrapur Nagpur 72.25 0 1 1 1
Washim Amravati 72.32 0 1 1 1
Buldhana Amravati 73.79 0 1 1 1
Gadchiroli Nagpur 74.27 0 1 1 1
Kolhapur Pune 75.41 0 1 1 1
In the above table, Zilla Parishads of Wardha, Latur, Sangli, Chandrapur,
Washim, Buldhana, Gadchiroli and Kolhapur are completely aligned to the INC-
NCP State Government and belong to the high VT cluster; these are likely to be
fiercely contested and hence are relevant in terms of paying special attention for
MCC implementation.
3.3 COMPETITION AMONGST POLITICAL PARTIES (REVERSE
COMP) AND IDENTIFICATION OF “SWING” ZILLA PARISHADS
REVERSE COMP is a variable that helps to understand the level of competition
between different political parties. It is computed as the standard deviation of
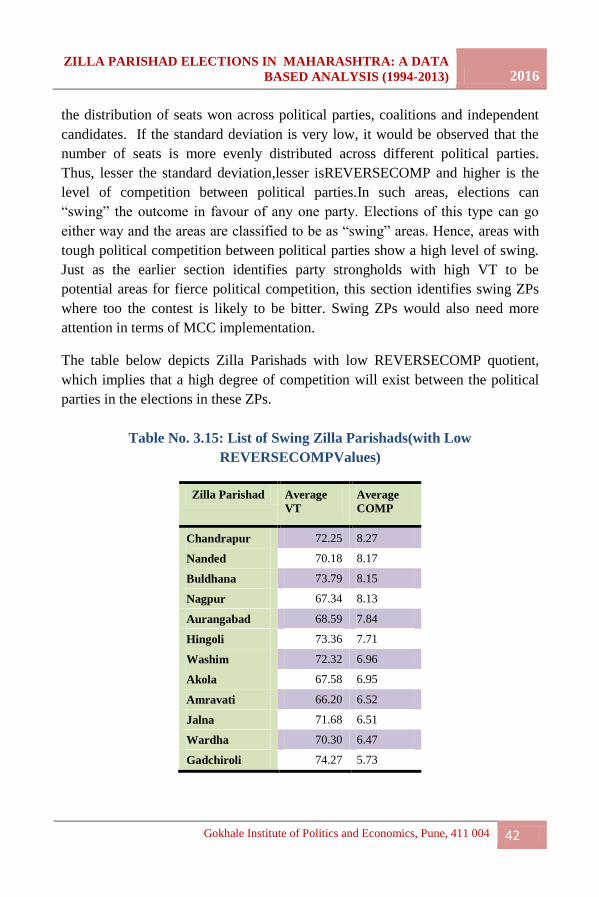
ZILLA PARISHAD ELECTIONS IN MAHARASHTRA: A DATA
BASED ANALYSIS (1994-2013) 2016
Gokhale Institute of Politics and Economics, Pune, 411 004 42
the distribution of seats won across political parties, coalitions and independent
candidates. If the standard deviation is very low, it would be observed that the
number of seats is more evenly distributed across different political parties.
Thus, lesser the standard deviation,lesser isREVERSECOMP and higher is the
level of competition between political parties.In such areas, elections can
“swing” the outcome in favour of any one party. Elections of this type can go
either way and the areas are classified to be as “swing” areas. Hence, areas with
tough political competition between political parties show a high level of swing.
Just as the earlier section identifies party strongholds with high VT to be
potential areas for fierce political competition, this section identifies swing ZPs
where too the contest is likely to be bitter. Swing ZPs would also need more
attention in terms of MCC implementation.
The table below depicts Zilla Parishads with low REVERSECOMP quotient,
which implies that a high degree of competition will exist between the political
parties in the elections in these ZPs.
Table No. 3.15: List of Swing Zilla Parishads(with Low
REVERSECOMPValues)
Zilla Parishad Average
VT
Average
COMP
Chandrapur 72.25 8.27
Nanded 70.18 8.17
Buldhana 73.79 8.15
Nagpur 67.34 8.13
Aurangabad 68.59 7.84
Hingoli 73.36 7.71
Washim 72.32 6.96
Akola 67.58 6.95
Amravati 66.20 6.52
Jalna 71.68 6.51
Wardha 70.30 6.47
Gadchiroli 74.27 5.73

ZILLA PARISHAD ELECTIONS IN MAHARASHTRA: A DATA
BASED ANALYSIS (1994-2013) 2016
Gokhale Institute of Politics and Economics, Pune, 411 004 43
In the above table, 8 out of 12 ZPs have a Voter Turnout of more than 70 per
cent; thus, nearly 67 per cent of the ZPs are high VT ZPs. In fact, higher
competition between parties only exists in higher VT areas. Areas with high VT
numbers are ripe for witnessing higher level of competition, because it is only
with higher VT numbers that a lesser dominant party gets a true chance at
breaking the dominant party‟s stronghold.
The following table shows higher REVERSECOMP quotient, which implies
lower degree of political competition.
Table No. 3.16: List of Zilla Parishads with Low Competition Amongst
Political Parties (High REVERSECOMP values)
Zilla Parishad Average VT Average
COMP
Pune 66.96 14.756
Satara 68.90 14.512
Nandurbar 64.95 14.314
Sangli 72.16 14.111
Dhule 63.36 12.801
Ratnagiri 62.34 12.681
Sindhudurg 65.62 12.498
Solapur 69.35 12.496
Ahmadnagar 67.05 12.288
Kolhapur 75.41 12.058
Latur 70.41 11.982
Osmanabad 69.14 11.333
In the above table, it can be seen that only 3 out of 12 ZPs i.e. only 25 per cent
have high VT ratios. Most of the ZPs have VT ratios of less than 70 per cent.
This again supports the observation made earlier that higher political competition
normally seems to happen in areas where the VT is high. Areas with lower voter
turnout normally do not show a very high level of competition between political
parties; in fact a single party dominance may be observed in areas with lower
VT.

ZILLA PARISHAD ELECTIONS IN MAHARASHTRA: A DATA
BASED ANALYSIS (1994-2013) 2016
Gokhale Institute of Politics and Economics, Pune, 411 004 44
In order to check this, the above table with low competition amongst political
parties is re-done below, without including Sangli, Kolhapur and Latur, which
are the high VT areas. The table shows the political parties that have been in
power from 1994 to 2014.
Table No. 3.17: Parties That Have been in Power in low Competition ZPs
Division Zilla Parishad R1 R2 R3 R4
Pune Pune INC NCP NCP NCP
Pune Satara INC NCP NCP NCP
Nashik Nandurbar INC INC NCP INC
Nashik Dhule INC INC INC INC
Konkan Ratnagiri SS SS SS SS
Konkan Sindhudurg SS SS INC INC
Pune Solapur INC NCP NCP NCP
Nashik Ahmednagar INC NCP INC NCP
Aurangabad Osmanabad INC NCP INC INC
The table shows a very interesting trend. Except in Sindhudurg and Ahmednagar,
the same party has won the majority in at least 3 rounds of elections. This
implies that low competition ZPs with low voter turnout are actually perfect
areas wherein one gets to witness single- party dominance. Of course, the fact
that there is a single party dominance does not imply that the same party
dominates in the elections. There is one more observation to be made here,
which ties up with the arguments made whilst discussing political alignment. Just
by observing this table, it is very easy to see how deeply entrenched the INC-
NCP coalition is in the ZPs of Maharashtra. In the section on political alignment,
it has been shown that once the State Government changed from SS-BJP in R1 to
INC-NCP in R2, the jump in political alignment is huge. Thus, INC-NCP is
definitely present in the high competition areas together with other political

ZILLA PARISHAD ELECTIONS IN MAHARASHTRA: A DATA
BASED ANALYSIS (1994-2013) 2016
Gokhale Institute of Politics and Economics, Pune, 411 004 45
parties. But it is also the most dominant party/ coalition in ZPs where single
party dominance is observed.
3.4 SEATS WON BY INDEPENDENT CANDIDATES (IND)
The variable IND describes the proportion of seats won by independent
candidates in Zilla Parishad elections. Following are the summary statistics for
IND across 4 rounds of elections.
Table No. 3.18:Trends in IND across Successive Rounds of Elections
IND_R1 IND_R2 IND_R3 IND_R4
Mean 9.42 4.40 7.25 4.51
Std. Deviation 9.40 5.70 6.56 4.52
Minimum 0.00 0.00 0.00 0.00
Maximum 36.84 31.37 23.53 19.61
No. of ZPs in
which no seats
were won by
IND Candidate
7.00 7.00 7.00 7.00
No. of ZPs in
which all seats
were won by
IND Candidate
0.00 0.00 0.00 0.00
The above table shows the summary statistics describing the variable IND. The
proportion of seats won by independent candidates in ZPs shows a cyclical
pattern. It is high in R1 and R3 but lower in R2 and R4. Across all 4 rounds of
elections, the average proportion of seats held by independent candidates is
around 6.39 per cent. In contrast, the average proportion of seats won by
independent candidates in Municipal Councils and Nagar Panchayats is nearly
triple and stands at 17 per cent. Thus, thereis a much lesser proportion of
independent candidates winning ZP elections as compared to Municipal Council
elections.
The table above further indicates that the minimum value of IND is 0 for all four
rounds of elections. This implies that in every round, there are constituencies in
which not a single seat is won by independents.

ZILLA PARISHAD ELECTIONS IN MAHARASHTRA: A DATA
BASED ANALYSIS (1994-2013) 2016
Gokhale Institute of Politics and Economics, Pune, 411 004 46
Most interestingly, the maximum value in none of the rounds is 100, indicating
that there are no ZPs in which all seats are captured by independents.
The following tables give a list of ZPs in every round wherein there are no seats
won by independents and wherein all seats are won by independents.
Table No. 3.19:List of Zilla Parishads in R2, R3 and R4 where no Seats were
won by Independents
R1 R2 R3 R4
Akola Beed Jalna Chandrapur
Dhule Gondia Latur Jalgaon
Nandurbar Hingoli Nandurbar Kolhapur
Ratnagiri Nashik Nashik Latur
Sangli Raigad Raigad Nandurbar
Sindhudurg Satara Satara Osmanabad
Washim Sindhudurg Sindhudurg Sindhudurg
It is only in Sindhudurg that not even a single seat has been won by independent
candidates in any of the 4 rounds of elections.
3.4.1 CLUSTER ANALYSIS OF IND
We apply the cluster analysis on the IND variable in order to identify those Zilla
Parishads wherein proportion of independents is high, medium and low. The
cluster classification is given below. The tables (3.28 to 3.30) show that there are
17ZPs which fall in the “low” independent representation, 15ZPs which have a
medium level of the same and only 1 ZP (Gadchiroli) which has a high
proportion of independent candidates winning the elections. Zilla Parishads, in
which less than 5.72 per cent of seats have been won by independents, belong to
the low IND cluster. It is interesting to note that the average value of IND for
Sindhudurg is 0, implying thereby that no independent candidate has won a seat
in any of the successive rounds of elections in Sindhudurg. Those ZPs, in which
6 per cent to 11.75 per cent of seats belong to independent candidates, are in the
medium IND cluster. Gadchiroli ZP, with 25.6 per cent seats belonging to
independent candidates, is the only ZP getting classified as belonging to the high
IND cluster.

ZILLA PARISHAD ELECTIONS IN MAHARASHTRA: A DATA
BASED ANALYSIS (1994-2013) 2016
Gokhale Institute of Politics and Economics, Pune, 411 004 47
Is there a relationship between IND and VT values? The following tables show
that only 33 per cent of the ZPs belonging to low IND cluster show high VTs.
55per cent of the ZPs belonging to the medium IND cluster show high VTs.
Finally, Gadchiroli ZP, which is the only ZP getting classified as having high
IND, belongs to the high VT cluster. Thus, 100 per cent of ZPs in high IND
cluster also have high VT.
This implies that IND and VT seem to have a direct relationship with each other.
As we move from low IND cluster to the high IND cluster, the numbers of ZPs
showing high VTs keep on rising.
This goes to indicate a powerful result. It is only in high VT areas that
independent candidates have a higher chance of winning. Thus, higher VT is
important, not only because it brings out people‟s choice correctly, but also
because it creates a true level playing field between independent candidates and
those with party tickets.
Table No. 3.20: Zilla Parishads Belonging to Low IND Cluster
Zilla Parishad Average
VT
Average
IND
Sindhudurg 65.62 0.000
Raigad 71.37 1.251
Latur 70.41 1.293
Nandurbar 64.95 1.415
Jalgaon 66.21 1.471
Gondia 73.53 1.923
Sangli 72.16 2.433
Contd…
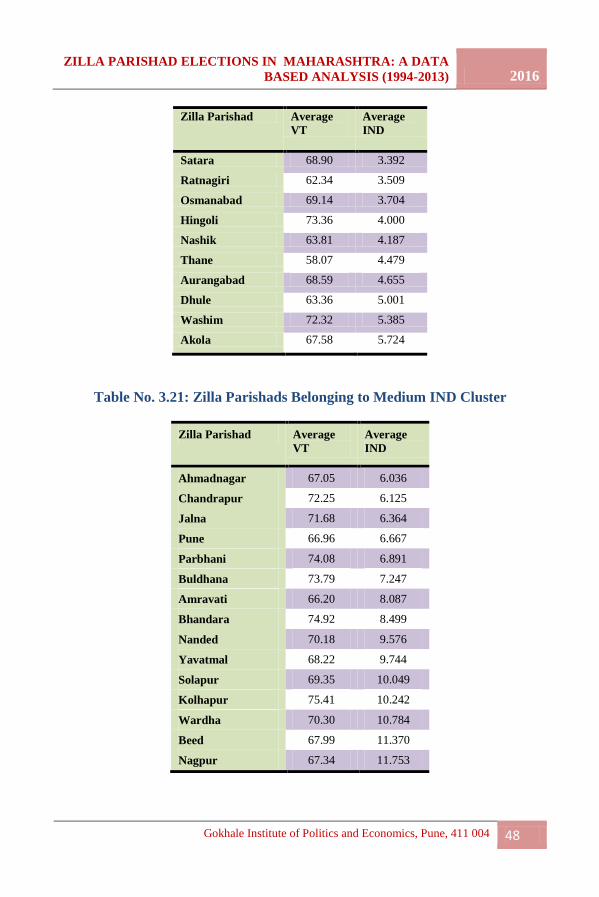
ZILLA PARISHAD ELECTIONS IN MAHARASHTRA: A DATA
BASED ANALYSIS (1994-2013) 2016
Gokhale Institute of Politics and Economics, Pune, 411 004 48
Zilla Parishad Average
VT
Average
IND
Satara 68.90 3.392
Ratnagiri 62.34 3.509
Osmanabad 69.14 3.704
Hingoli 73.36 4.000
Nashik 63.81 4.187
Thane 58.07 4.479
Aurangabad 68.59 4.655
Dhule 63.36 5.001
Washim 72.32 5.385
Akola 67.58 5.724
Table No. 3.21: Zilla Parishads Belonging to Medium IND Cluster
Zilla Parishad Average
VT
Average
IND
Ahmadnagar 67.05 6.036
Chandrapur 72.25 6.125
Jalna 71.68 6.364
Pune 66.96 6.667
Parbhani 74.08 6.891
Buldhana 73.79 7.247
Amravati 66.20 8.087
Bhandara 74.92 8.499
Nanded 70.18 9.576
Yavatmal 68.22 9.744
Solapur 69.35 10.049
Kolhapur 75.41 10.242
Wardha 70.30 10.784
Beed 67.99 11.370
Nagpur 67.34 11.753

ZILLA PARISHAD ELECTIONS IN MAHARASHTRA: A DATA
BASED ANALYSIS (1994-2013) 2016
Gokhale Institute of Politics and Economics, Pune, 411 004 49
Table No. 3.22: Zilla Parishads belonging to high IND Cluster
ZiilaParishad Average
VT
Average
IND
Gadchiroli 74.27 24.627
3.5 PROPORTION OF SC AND ST IN THE POPULATION (SCST)
The proportion of SC and ST population (SCST) in the relevant areas is given in
the Census and hence is taken as a basis for reservation considerations for 10
years, in which typically 2 rounds of elections are held. In areas governed by
most Zilla Parishads, SCST does not show much variation across time. The
average SC and ST population proportion in Maharashtra for areas governed by
ZPs in every round has more or less remained at 25 per cent. The following
tables use a cluster analysis to group ZPs into clusters having high, medium and
low SCST ratios.
The cluster analysis places only the Nandurbar Zilla Parishad, with SCST at
80.28 per cent, in the cluster with high proportion of SCST.
Table No. 3.23: ZPs with High Proportion of SC and ST Population
Division Zilla Parishad SCST_R4
Nashik Nandurbar 80.28
The medium SCST cluster contains a minimum value of 26.7 per cent and a
maximum value of 51.19 per cent. The average SCST value for this cluster is
35.27, which is very distant from the Nandurbar value of 80.28 per cent.

ZILLA PARISHAD ELECTIONS IN MAHARASHTRA: A DATA
BASED ANALYSIS (1994-2013) 2016
Gokhale Institute of Politics and Economics, Pune, 411 004 50
Table No. 3.24: ZPs with Medium Proportion of SC and ST Population
Division Zilla Parishad SCST_R4
Amravati Akola 31.15
Amravati Amravati 37.53
Amravati Washim 28.16
Amravati Yavatmal 32.20
Aurangabad Nanded 29.16
Konkan Thane 45.57
Nagpur Bhandara 26.70
Nagpur Chandrapur 34.83
Nagpur Gadchiroli 51.19
Nagpur Gondia 31.18
Nagpur Nagpur 31.37
Nagpur Wardha 26.74
Nashik Dhule 45.92
Nashik Nashik 42.13
The low SCST cluster contains a minimum value of 2.59 in Ratnagiri and 23.26
in Jalgaon. The average for the low SCST cluster stands at 15.05 per cent. Thus,
the low, medium and high SCST clusters have centroids at 15.05 per cent, 35.27
per cent and 80.28 per cent respectively.
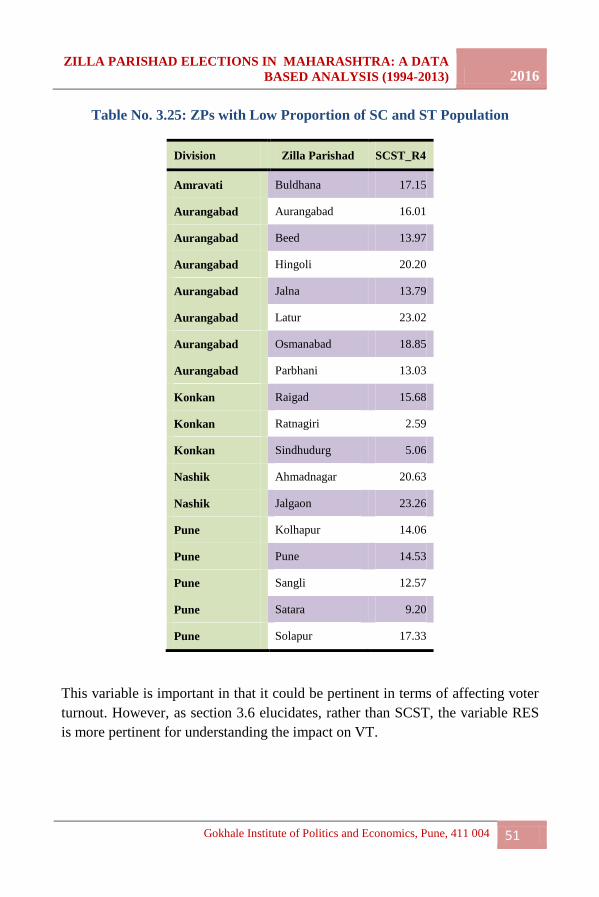
ZILLA PARISHAD ELECTIONS IN MAHARASHTRA: A DATA
BASED ANALYSIS (1994-2013) 2016
Gokhale Institute of Politics and Economics, Pune, 411 004 51
Table No. 3.25: ZPs with Low Proportion of SC and ST Population
Division Zilla Parishad SCST_R4
Amravati Buldhana 17.15
Aurangabad Aurangabad 16.01
Aurangabad Beed 13.97
Aurangabad Hingoli 20.20
Aurangabad Jalna 13.79
Aurangabad Latur 23.02
Aurangabad Osmanabad 18.85
Aurangabad Parbhani 13.03
Konkan Raigad 15.68
Konkan Ratnagiri 2.59
Konkan Sindhudurg 5.06
Nashik Ahmadnagar 20.63
Nashik Jalgaon 23.26
Pune Kolhapur 14.06
Pune Pune 14.53
Pune Sangli 12.57
Pune Satara 9.20
Pune Solapur 17.33
This variable is important in that it could be pertinent in terms of affecting voter
turnout. However, as section 3.6 elucidates, rather than SCST, the variable RES
is more pertinent for understanding the impact on VT.
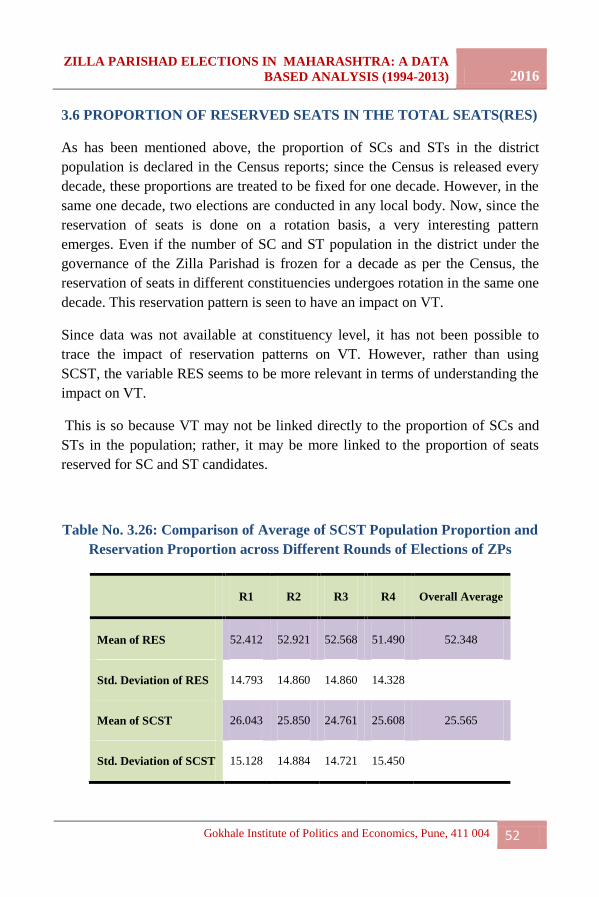
ZILLA PARISHAD ELECTIONS IN MAHARASHTRA: A DATA
BASED ANALYSIS (1994-2013) 2016
Gokhale Institute of Politics and Economics, Pune, 411 004 52
3.6 PROPORTION OF RESERVED SEATS IN THE TOTAL SEATS(RES)
As has been mentioned above, the proportion of SCs and STs in the district
population is declared in the Census reports; since the Census is released every
decade, these proportions are treated to be fixed for one decade. However, in the
same one decade, two elections are conducted in any local body. Now, since the
reservation of seats is done on a rotation basis, a very interesting pattern
emerges. Even if the number of SC and ST population in the district under the
governance of the Zilla Parishad is frozen for a decade as per the Census, the
reservation of seats in different constituencies undergoes rotation in the same one
decade. This reservation pattern is seen to have an impact on VT.
Since data was not available at constituency level, it has not been possible to
trace the impact of reservation patterns on VT. However, rather than using
SCST, the variable RES seems to be more relevant in terms of understanding the
impact on VT.
This is so because VT may not be linked directly to the proportion of SCs and
STs in the population; rather, it may be more linked to the proportion of seats
reserved for SC and ST candidates.
Table No. 3.26: Comparison of Average of SCST Population Proportion and
Reservation Proportion across Different Rounds of Elections of ZPs
R1 R2 R3 R4 Overall Average
Mean of RES 52.412 52.921 52.568 51.490 52.348
Std. Deviation of RES 14.793 14.860 14.860 14.328
Mean of SCST 26.043 25.850 24.761 25.608 25.565
Std. Deviation of SCST 15.128 14.884 14.721 15.450
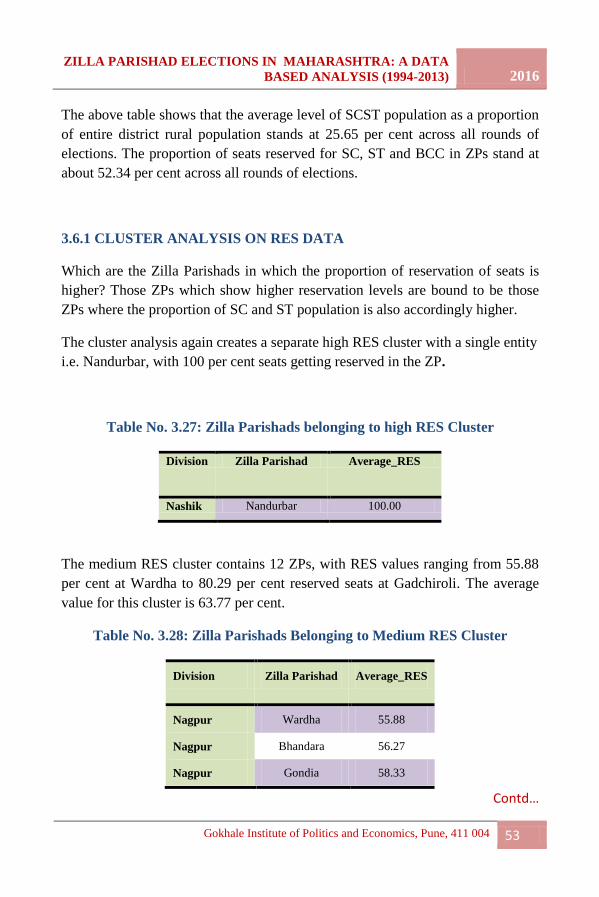
ZILLA PARISHAD ELECTIONS IN MAHARASHTRA: A DATA
BASED ANALYSIS (1994-2013) 2016
Gokhale Institute of Politics and Economics, Pune, 411 004 53
The above table shows that the average level of SCST population as a proportion
of entire district rural population stands at 25.65 per cent across all rounds of
elections. The proportion of seats reserved for SC, ST and BCC in ZPs stand at
about 52.34 per cent across all rounds of elections.
3.6.1 CLUSTER ANALYSIS ON RES DATA
Which are the Zilla Parishads in which the proportion of reservation of seats is
higher? Those ZPs which show higher reservation levels are bound to be those
ZPs where the proportion of SC and ST population is also accordingly higher.
The cluster analysis again creates a separate high RES cluster with a single entity
i.e. Nandurbar, with 100 per cent seats getting reserved in the ZP.
Table No. 3.27: Zilla Parishads belonging to high RES Cluster
Division Zilla Parishad Average_RES
Nashik Nandurbar 100.00
The medium RES cluster contains 12 ZPs, with RES values ranging from 55.88
per cent at Wardha to 80.29 per cent reserved seats at Gadchiroli. The average
value for this cluster is 63.77 per cent.
Table No. 3.28: Zilla Parishads Belonging to Medium RES Cluster
Division Zilla Parishad Average_RES
Nagpur Wardha 55.88
Nagpur Bhandara 56.27
Nagpur Gondia 58.33
Contd…
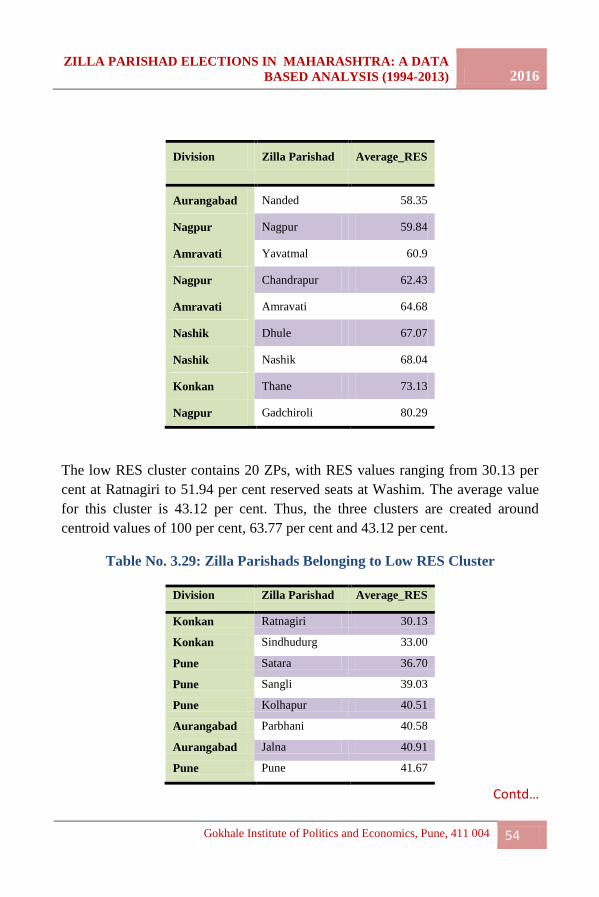
ZILLA PARISHAD ELECTIONS IN MAHARASHTRA: A DATA
BASED ANALYSIS (1994-2013) 2016
Gokhale Institute of Politics and Economics, Pune, 411 004 54
Division Zilla Parishad Average_RES
Aurangabad Nanded 58.35
Nagpur Nagpur 59.84
Amravati Yavatmal 60.9
Nagpur Chandrapur 62.43
Amravati Amravati 64.68
Nashik Dhule 67.07
Nashik Nashik 68.04
Konkan Thane 73.13
Nagpur Gadchiroli 80.29
The low RES cluster contains 20 ZPs, with RES values ranging from 30.13 per
cent at Ratnagiri to 51.94 per cent reserved seats at Washim. The average value
for this cluster is 43.12 per cent. Thus, the three clusters are created around
centroid values of 100 per cent, 63.77 per cent and 43.12 per cent.
Table No. 3.29: Zilla Parishads Belonging to Low RES Cluster
Division Zilla Parishad Average_RES
Konkan Ratnagiri 30.13
Konkan Sindhudurg 33.00
Pune Satara 36.70
Pune Sangli 39.03
Pune Kolhapur 40.51
Aurangabad Parbhani 40.58
Aurangabad Jalna 40.91
Pune Pune 41.67
Contd…

ZILLA PARISHAD ELECTIONS IN MAHARASHTRA: A DATA
BASED ANALYSIS (1994-2013) 2016
Gokhale Institute of Politics and Economics, Pune, 411 004 55
Division Zilla Parishad Average_RES
Konkan Raigad 41.81
Aurangabad Beed 42.02
Aurangabad Aurangabad 43.71
Pune Solapur 44.45
Amravati Buldhana 45.53
Aurangabad Osmanabad 46.30
Aurangabad Hingoli 48.00
Nashik Jalgaon 48.16
Nashik Ahmadnagar 48.84
Aurangabad Latur 49.14
Amravati Akola 49.96
Amravati Washim 51.94
3.7 DEVELOPMENT SCORE (DEV)
DEV refers to the development quotient of an area. It is calculated as the
proportion of the per capita income of a district to the total per capita income of
all districts in Maharashtra.
The main limitation of using DEV as a development proxy is that data on per
capita income at district level is only available in Census 2011 and hence, there
is no way in which the effect of economic development on political or electoral
variables can be captured across time. Thus, the analysis of DEV in this study
has a static interpretation.
Cluster analysis tools have been applied to group districts of Maharashtra into
high, medium and low income groups. Following tables show the clustering.

ZILLA PARISHAD ELECTIONS IN MAHARASHTRA: A DATA
BASED ANALYSIS (1994-2013) 2016
Gokhale Institute of Politics and Economics, Pune, 411 004 56
Table No. 3.30:Low Income Cluster in the Districts in Maharashtra
District DEV
Washim 0.01
Gadchiroli 0.01
Latur 0.02
Nanded 0.02
Hingoli 0.02
Osmanabad 0.02
Buldhana 0.02
Nandurbar 0.02
Dhule 0.02
Beed 0.02
Jalna 0.02
Amravati 0.02
Parbhani 0.02
Akola 0.02
Yeotmal 0.02
Gondia 0.02

ZILLA PARISHAD ELECTIONS IN MAHARASHTRA: A DATA
BASED ANALYSIS (1994-2013) 2016
Gokhale Institute of Politics and Economics, Pune, 411 004 57
Table No. 3.31: Medium Income Cluster in the Districts in Maharashtra
District DEV
Wardha 0.03
Bhandara 0.03
Jalgaon 0.03
Chandrapur 0.03
Solapur 0.03
Ratnagiri 0.03
Sangli 0.03
Satara 0.03
Sindhudurg 0.03
Ahmednagar 0.03
Aurangabad 0.03
Table No. 3.32: High Income Cluster in the Districts in Maharashtra
District DEV
Nashik 0.04
Kolhapur 0.04
Raigad 0.04
Nagpur 0.04
Thane 0.05
Pune 0.05

ZILLA PARISHAD ELECTIONS IN MAHARASHTRA: A DATA
BASED ANALYSIS (1994-2013) 2016
Gokhale Institute of Politics and Economics, Pune, 411 004 58
Based on the clusters of high, medium and low income districts, it will now be
pertinent and interesting to examine whether these clusters correspond to a
particular type of VT. Similarly, does development have an effect on political
alignment? Or can it affect the proportion of seats which independent candidates
can win? These and other correlations are explored in the next chapter.

ZILLA PARISHAD ELECTIONS IN MAHARASHTRA: A DATA
BASED ANALYSIS (1994-2013) 2016
Gokhale Institute of Politics and Economics, Pune, 411 004 59
CHAPTER - 4
DATA ANALYSIS: CORRELATIONS BETWEEN KEY
VARIABLES
Chapter 2 defined the variables which would be of interest in terms of analyzing
Zilla Parishad elections. Chapter 3 analyzed the trends in each of these variables
and also arranged the variables into clusters for better understanding of the same.
In the present chapter, correlations between these key variables have been
worked out. Thus, this chapter brings out the effects that different political
variables are bound to exert on one another. It also comments on policy
implications of these relationships.
The following table shows the correlation co-efficients between the main
electoral variables defined and analyzed in Chapter 3.
Table No. 4.1: Correlation Co-Efficients Between Key Electoral Variables
and Implications for Electoral Policy
Variables Correlation
co-efficient
Interpretation Implication
VT and
REVERSE
COMP
-0.28* Higher VT is
observed in swing
districts: Contest will
be extreme
Culturally, high VT districts
are important for MCC
implementation
VT and
IND
0.3* Independents win
more when VT is high
Creating more voter
awareness and increasing
VT is the best way of
assuring a level playing field
to independent candidates
Contd…
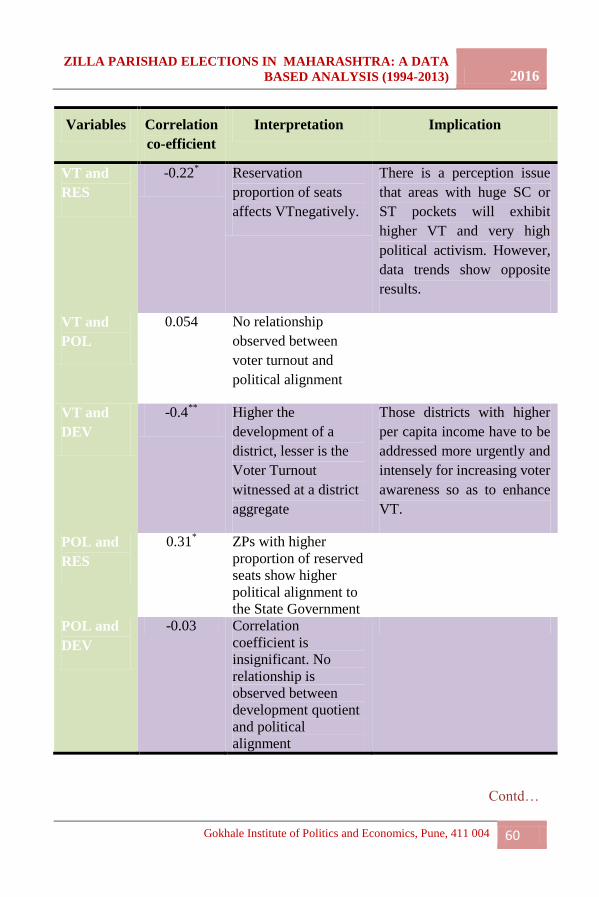
ZILLA PARISHAD ELECTIONS IN MAHARASHTRA: A DATA
BASED ANALYSIS (1994-2013) 2016
Gokhale Institute of Politics and Economics, Pune, 411 004 60
Variables Correlation
co-efficient
Interpretation Implication
VT and
RES
-0.22* Reservation
proportion of seats
affects VTnegatively.
There is a perception issue
that areas with huge SC or
ST pockets will exhibit
higher VT and very high
political activism. However,
data trends show opposite
results.
VT and
POL
0.054 No relationship
observed between
voter turnout and
political alignment
VT and
DEV
-0.4**
Higher the
development of a
district, lesser is the
Voter Turnout
witnessed at a district
aggregate
Those districts with higher
per capita income have to be
addressed more urgently and
intensely for increasing voter
awareness so as to enhance
VT.
POL and
RES
0.31* ZPs with higher
proportion of reserved
seats show higher
political alignment to
the State Government
POL and
DEV
-0.03 Correlation
coefficient is
insignificant. No
relationship is
observed between
development quotient
and political
alignment
Contd…
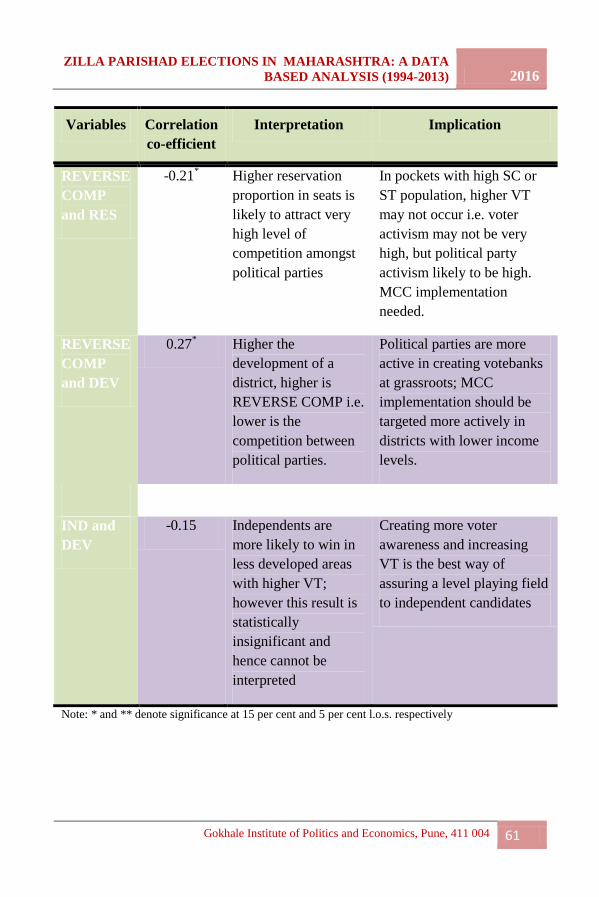
ZILLA PARISHAD ELECTIONS IN MAHARASHTRA: A DATA
BASED ANALYSIS (1994-2013) 2016
Gokhale Institute of Politics and Economics, Pune, 411 004 61
Variables Correlation
co-efficient
Interpretation Implication
REVERSE
COMP
and RES
-0.21* Higher reservation
proportion in seats is
likely to attract very
high level of
competition amongst
political parties
In pockets with high SC or
ST population, higher VT
may not occur i.e. voter
activism may not be very
high, but political party
activism likely to be high.
MCC implementation
needed.
REVERSE
COMP
and DEV
0.27* Higher the
development of a
district, higher is
REVERSE COMP i.e.
lower is the
competition between
political parties.
Political parties are more
active in creating votebanks
at grassroots; MCC
implementation should be
targeted more actively in
districts with lower income
levels.
IND and
DEV
-0.15 Independents are
more likely to win in
less developed areas
with higher VT;
however this result is
statistically
insignificant and
hence cannot be
interpreted
Creating more voter
awareness and increasing
VT is the best way of
assuring a level playing field
to independent candidates
Note: * and ** denote significance at 15 per cent and 5 per cent l.o.s. respectively
ZILLA PARISHAD ELECTIONS IN MAHARASHTRA: A DATA
BASED ANALYSIS (1994-2013) 2016
Gokhale Institute of Politics and Economics, Pune, 411 004 62
4.1: Interpretation of correlations with VT
4.1.1: VT and the REVERSE COMP
VT and REVERSE COMP show a negative correlation to one another. What is
the interpretation of this correlation co-efficient?
A high VT goes hand-in-hand with a low REVERSE COMP. A low value of
REVERSECOMP implies lower standard deviation in the distribution of seats
won by different political partiesi.e it implies higher competition between
political parties. Thus, a high VT is consistent with higher competition between
political parties and hence, with a higher swing quotient. When the VT in a ZP is
high, the elections can potentially swing either way and hence, all the ZPs which
belong to the high VT cluster are potentially important for implementation of
Model Code of Conduct. It is here that political activism comes into its own and
there is a bitterly fought contest between political rivals.
4.1.2: VT and IND
A high level of VT not only has an implication for political parties, but also for
candidates who want to contest independently. The correlation coefficient
between VT and IND stands at 0.3, indicating that higher VT is consistent with a
higher proportion of seats being won by independent candidates. Thus, it is in the
high VT ZPs that independent candidates truly stand a chance of winning.
One of the chief concerns of the SECM has been to create a level playing field
between independent candidates and those contesting on a party ticket. There are
many ways in which candidates contesting on a party ticket have a better chance
of winning as compared to independent candidates. The best intervention that the
SECM can offer to truly create a level playing field is take big strides in terms of
enhancing voter turnout. A higher voter turnout gives a true chance of winning to
the independent candidates.
4.1.3: VT and RES
It is a popular perception that voter turnout would be affected by how the seats
get reserved in different constituencies. However, the data shows that proportion
of reserved seats within a constituency is negatively correlated to voter turnout at
all (Correlation co-efficient between VT and RES is -0.22).
ZILLA PARISHAD ELECTIONS IN MAHARASHTRA: A DATA
BASED ANALYSIS (1994-2013) 2016
Gokhale Institute of Politics and Economics, Pune, 411 004 63
There could be an underlying design issue that causes this correlation to be
negative. As has been said earlier, SCST proportion is declared under the
Census. In the next two elections, the same proportion is assumed to prevail and
reservation is done accordingly. In the first election after the new proportions are
declared, suppose there are 5 constituencies where there is a significantly high
proportion of SCs and STs. Then the reserved seats are allotted to those 5
constituencies. Suppose that the VT is also quite high in these constituencies,
giving a positive correlation between VT and RES.
In the next round of elections, the reserved seats get allotted to the next 5
constituencies due to the rotation system in Maharashtra, where actually the SC
and ST population is a little lower. The VT is accordingly lower since the seats
get reserved for candidates whose vote bank by caste does not exist in that
constituency. Hence, the correlation between VT and RES turns negative. If the
negative correlation is higher than the positive correlation in the earlier round of
elections, then, the overall correlation co-efficient may show a negative sign.
4.1.4: VT and POL
The correlation co-efficient between VT and POL stands at 0.054, and is
statistically insignificant. For all practical purposes, this means that there is no
relationship observed between VT and POL. Thus, for the ZP data, there is no
relationship observed between voter turnout in areas and the political alignment
of the same with the state government.
4.1.5 VT and DEV
Higher is the development of a district, more are the ways in which voters
express their “voice” and hence lesser is the importance given to elections as a
mode of expression. Hence, voters‟ apathy is typically an issue that is relevant
for well-developed districts. The correlation co-efficient accordingly exhibits a
negative sign (the correlation between VT and DEV is-0.4) and is statistically
significant.
Thus, higher voter turnout areas normally exhibit a high level of competition
between political parties, a higher swing factor and a higher chance of winning
for independents. Voter turnout does not seem to be associated with political

ZILLA PARISHAD ELECTIONS IN MAHARASHTRA: A DATA
BASED ANALYSIS (1994-2013) 2016
Gokhale Institute of Politics and Economics, Pune, 411 004 64
alignment shown by the ZP to the State Government. Higher the proportion of
seats reserved for SC, ST or BCC candidates in a ZP, lower seems to be the VT.
4.2: Interpretation of correlations with POL
4.2.1: POL and RES
The data trends reveal that those ZPs in which the proportion of reserved seats to
the total number of seats is higher tend to exhibit a higher political alignment to
the State Government. It is to be noted that there is again no theoretical construct
that helps in understanding why this could be the case; this data trend would
have some value when forecasting studies are undertaken to understand which
ZPs would be more likely to get State incumbents in power at the local level.
4.2.2 POL and DEV
Political alignment shows a negative correlation with development index. This
could be interpreted to mean that the State incumbent plays a more active role in
influencing local politics of the less developed areas as compared to the more
well developed areas.
Thus, higher political alignment is witnessed in districts with lower development,
with higher proportion of SC and ST population.
4.3: Interpretation of correlations with REVERSE COMP
4.3.1: REVERSECOMP and RES
This is an extremely interesting result. The correlation co-efficient between
REVERSE COMP and RES stands at -0.21. Thus, when the proportion of
reserved seats is high in a constituency, REVERSECOMP tends to be low there
i.e. political competition tends to be very high. Through a reserved seat, a
political party can gain quick access to a large number of votes based on the
simple emotional lure that a reservation offers. Hence, political parties tend to
have more bitterly fought contests when the proportion of seats reserved for SC,
ST or BCC candidates is higher.
ZILLA PARISHAD ELECTIONS IN MAHARASHTRA: A DATA
BASED ANALYSIS (1994-2013) 2016
Gokhale Institute of Politics and Economics, Pune, 411 004 65
4.3.2. REVERSE COMP AND DEV
REVERSE COMP and DEV show a positive correlation co-efficient (stands at
0.27). REVERSE COMP captures the standard deviation in the distribution of
seats won by political parties and hence, higher the REVERSE COMP, lesser is
the competition between different political parties. This result implies that
districts with higher development quotients typically exhibit lower competition
between political parties. Political parties vie more to get to the votebank at the
grassroots and thus, the real “swing” districts, where there will be bitter contests
amongst political parties, will be seen more in the districts with a lower
development quotient. Thus, from a perspective of MCC implementation, more
scrutiny has to be done on the districts with lower development characteristics.
Thus, higher competition amongst political parties will be witnessed in ZPs with
higher reservations and with lower development quotients.
4.4 Interpretation of correlations with IND
4.4.1: IND and VT
This is already discussed above. Independent candidates stand a higher chance of
winning elections in areas with higher voter turnout.
4.4.2: IND and DEV
Independent candidates win higher proportion of seats in less developed districts
with higher VTs. This is the interpretation of a positive correlation coefficient.
However, the correlation co-efficient is insignificant, which implies that no
relationship exists between these two variables.
Thus, independent candidates stand a higher chance to win elections in ZPs
governing less developed districts with high voter turnouts.
The following table summarizes the interpretations of the correlation co-
efficients.

ZILLA PARISHAD ELECTIONS IN MAHARASHTRA: A DATA
BASED ANALYSIS (1994-2013) 2016
Gokhale Institute of Politics and Economics, Pune, 411 004 66
Table No. 4.2:Summary of Correlations in key Election Variables
Variable Summary of Correlations
VT Higher voter turnout areas normally exhibit a high level of
competition between political parties, a higher swing factor and a
higher chance of winning for independents.
There is no observed correlation between voter turnout and
political alignment.
Higher Voter turnout is observed in ZPs with lower proportion of
seats reserved for SC, ST or BCC candidates.
More the development of a district, lesser is the voter turnout
experienced in the ZP elections.
POL Ditricts with higher proportion of reserved seats are seen to be
more politically aligned with the State Government.
More well developed a district, lesser is the political alignment
with the State Government.
REVERSE
COMP
Competition amongst political parties is higher in areas with
higher proportion of reservations.
Political parties are more active in the grassroots; lesser developed
a district; more is the competition amongst political parties to have
a presence in that district.
IND Independent candidates stand a higher chance of winning elections
in areas with higher voter turnout.
ZILLA PARISHAD ELECTIONS IN MAHARASHTRA: A DATA
BASED ANALYSIS (1994-2013) 2016
Gokhale Institute of Politics and Economics, Pune, 411 004 67
CHAPTER - 5
CONCLUSION
This report summarizes and analyzes the past data of Zilla Parishad elections in
Maharashtra to bring out important insights into the behavior of several
variables. This not only helps in understanding the patterns in key electoral
variables better, but also has immense value in terms of planning relevant
policies for the upcoming ZP elections. Following are the main findings of the
study:
1. Average voter turnout for ZP elections across all rounds of elections
stands at about 69 per cent. The voter turnout percentage has kept on
decreasing with every successive round of elections; this should be the
cause of some worry for the SECM.
2. The average VT in ZP elections at 69 per cent is lower as compared to
the average VT in Municipal Councils, which are the closest urban
counterparts to ZPs. Average VT in Municipal Councils is 70.7 per cent.
This is a surprising result, because it is normally observed that rural local
body elections in Indian states normally bring about higher VTs.
3. The lower VT could be a reflection of the huge level of migration that is
happening from rural to urban areas. In fact, urbanization and migration
could well be the two main issues that SECM will have to focus on in the
coming years.
4. High VT is observed in developed and developing districts alike. This
implies that VT depends on the voting culture in specific areas.
5. An observation which supports the above point is that the correlation
coefficient between VT in a round of elections and the previous round
tends to be positive. Thus, a ZP with a high turnout in the last round of
elections is likely to show higher turnouts in the next round too. Thus, in
influencing voter turnouts, it is important to acknowledge the role of the
“voting culture” of that area.
ZILLA PARISHAD ELECTIONS IN MAHARASHTRA: A DATA
BASED ANALYSIS (1994-2013) 2016
Gokhale Institute of Politics and Economics, Pune, 411 004 68
6. The study uses a cluster approach to identify those ZPs where voter
turnout is likely to be low. A list of such ZPs is given in Appendix D.
7. Around 52 per cent of seats are reserved for SC, ST and BCC candidates
across all Zilla Parishads. It is a popular perception that voter turnout
gets affected by how the seats get reserved in different constituencies.
However, the data shows that proportion of reserved seats within a
constituency has a very mild impact if at all, and that too negative.
8. However, even if reservation of seats does not bring about political
activism from perspective of voters, it does bring about higher levels of
political activism from perspective of political parties. Political parties
tend to engage in greater level of competition in those ZPs where the
reservation of seats for SC, ST and BCC candidates is higher.
9. Political parties also engage in more tightly fought contests when the
voter turnout is high. With a lower voter turnout, chances of a single
party dominating the distribution of seats is higher. Hence, if a political
party has a stronghold over a Zilla Parishad, and if the voter turnout in
that ZP tends to be low, there is a chance for the competitor party to try
and break the stronghold of the former. Hence, it is in such ZPs that
there will be bitter contests amongst political parties. The study identifies
those ZPs wherein such patterns prevail; it is in these ZPs that
implementation of the Model Code of Conduct will be very important.
10. Data also shows that political parties engage in tougher competition over
seats in areas with lower development quotients. This implies that
political parties try more to connect with the voter to the grassroot level.
Thus, high voter turnout areas in less developed areas with higher level
of reservations for SC, ST and BCC candidates are the obvious
contenders for witnessing bitterly contested elections between political
parties. It is here that the MCC machinery should be concentrated.
11. A separate appendix is given to highlight those ZPs where bitter contests
will be fought between parties.

ZILLA PARISHAD ELECTIONS IN MAHARASHTRA: A DATA
BASED ANALYSIS (1994-2013) 2016
Gokhale Institute of Politics and Economics, Pune, 411 004 69
12. Around 6.39 per cent of the seats in Zilla Parishads are held by
independent candidates.In comparison, 17 per cent of seats are won by
independent candidates in the Municipal Council and Nagar Panchayat
elections. Independent candidates stand a higher chance of winning
elections in ZPs governing less developed districts with high voter
turnouts.
Thus, the study creates numerous insights pertaining to voter turnout, political
alignment, competition amongst political parties, dynamics of reservation of
seats for SC, ST and BCC candidates, dynamics of seats won by independent
candidates etc. While this analysis is definitely relevant for posterity, it aims to
fill in the gaps of information so that the SECM is aided in crafting electoral
policies. This report only presents the findings of the study on Zilla Parishads.
Separate data analysis reports pertaining to Municipal Councils, Municipal
Corporations and Panchayat Samitis have been created too.
ZILLA PARISHAD ELECTIONS IN MAHARASHTRA: A DATA
BASED ANALYSIS (1994-2013) 2016
Gokhale Institute of Politics and Economics, Pune, 411 004 70
REFERENCES
1. Alford R. R. and E. C. Lee (1968), Voting Turnout in American Cities,
American Political Science Review 62:796-813
2. Almond G. A. and S Verba (19630, The Civic Culture, Political Attitude
and Democracy in Five Nations, Princeton, N.J. Princeton University
Press.
3. Balwantray Mehta (1957), Chairman, Balwantray Mehta, GoI.
4. Barnes S and Kaase M (1979), Political Action, Mass Participation in
Few Western Democracies, Beverly Hills, Calif: Sage.
5. Bennett and Resnick (1990), The Implications of Nonvoting for
Democracy in the United States, American Journal of Political Science
34:771-802; Verba, Schlozman and Brady (1995), Voice and Equity:
Civic Voluntarism in American Politics, Cambridge, MA: Harvard Uni.
Press
6. Business Standard, 11.04.2016, Retrieved: 07.10.2016.
7. CAWP (2000), Women in State Legislature, Center for American
Women and Politics, Eagleton Institute of Politics, Rutgers, The State
University of New Jersey, 919, Ryders Lane, New Brunswick, NJ 08901
(732) 932-9384: www.cawp.rutgers.edu
8. Centre for Democracy and Governance, Decentralization and
Democratic Local Governance Handbook, USAID, 20523-3100, PP. 05-
06.
9. Coastaldigest.com: Retrieved: 07.10.2016.
10. Deccan Herald, 07.10.2016 Retrieved: 07.10.2016.
11. Diana C. Mutz (2002), The Consequences of Cross-Cutting Networks for
Political Participation, American Journal of Political Science, 46(4):838-
855.
12. George Mathew (2004), Local Democracy and Empowerment of the
Underprivileged-An Analysis of Democratic Decentralization in India,
Institute of Social Sciences, A Case Study-30826, Ministry of Rural
Development, GoI, New Delhi.
13. Gerber, Alan, Donald Green and C. Larimer (2008), Social Pressure and
Voter Turnout: Evidence from a Large-Scale Field Experiment:
American Political Science Review, 102(1): 33-48.

ZILLA PARISHAD ELECTIONS IN MAHARASHTRA: A DATA
BASED ANALYSIS (1994-2013) 2016
Gokhale Institute of Politics and Economics, Pune, 411 004 71
14. J.Saharia (2016), Data Based Analysis of Municipal Elections in
Maharashtra-1994-2013 (Foreword), R. K. Parchure, ManasiPhadke and
Dnyandev Talule, GIPE, Pune, A Study for the State Election
Commission of Maharashtra.
15. MancurOlson (1965), The Logic of Collective Action, HUP.
16. Maria Gratschew and Kate Sullivan (2002), Compulsory Voting,
ARENA, Association of Electoral Administrators, OxonianRewley Press
Ltd. United Kingdom.
17. Martin Lipset (1960), Political Man: the Social Bases of Politics, Garden
City, New York, Doubleday.
18. Mathew D. Atkinson and Anthony Fowler (2012), The Effect of Social
Capital on Voter Turnout: Evidence from Saint‟s Day Fiestas in Mexico,
University of California, Los Angeles and Harvard University.
19. Morlan R. L. (1984), Municipal Versus National Election Voter Turnout:
Europe and the United States, Political Science Quarterly 99:457-70.
20. Olson Mancur (1965), The Logic of Collective Action, Harvard
University Press, US.
21. Parry, G., Mosley, G. and Day N. (1992), Political Participation and
Democracy in Britain. Cambridge: Cambridge University Press.
22. Rafael Lopez Pintor (2002), Voter Turnout Since 1945: A Global
Report, Stockholm, Sweden: International Institute of Democracy and
Electoral Assistance.
23. Rafael Lopez Pintor, Maria Gratschew and Kate Sullivan
(2002),Compulsory Voting, ARENA, Association of Electoral
Administrators, OxonianRewley Press Ltd. United Kingdom.
24. Robert Putnam (1995, Tuning In, Tuning Out; The Strange
Disappearances of Social Capital in America. PS: Political Science and
Politics 28(4): 664-683.
25. Rosenstone S. J. and J. M Hansen (1993), Mobilization, Participation
and Democracy in America, New York: Macmillan; Verba, Schlozman
and Brady (1995), Voice and Equity: Civic Voluntarism in American
Politics, Cambridge, MA: Harvard Uni. Press.
26. Rosenstone S. J. and J. M Hansen (1993), Mobilization, Participation
and Democracy in America, New York: Macmillan; Verba, Schlozman
and Brady (1995), Voice and Equity: Civic Voluntarism in American
Politics, Cambridge, MA: Harvard Uni. Press
ZILLA PARISHAD ELECTIONS IN MAHARASHTRA: A DATA
BASED ANALYSIS (1994-2013) 2016
Gokhale Institute of Politics and Economics, Pune, 411 004 72
27. Ruby Bridges A. (1997), Morning Glories: Municipal Reform in the
Southwest, Princeton, NJ: Princeton Uni. Press
28. Ruy A. Teixeira (1992), The Disappearing American Voter, Washington
DC: Brooking Institutions; Rosenstone S. J. and J. M. Hansen (1993),
Mobilization, Participation and Democracy in America, New York:
Macmillan.
29. Sarah F. Anzia (2014), Timing and Turnout: How Off-Cycle Elections
Favor Organized Groups, University of Chicago Press.
30. Sidney Verba, Schlozman and Brady 1995), Voice and Equality,
Cambridge, Mass: Harvard University Press.
31. Sidney Verba, Schlozman and Brady 1995), Voice and Equality,
Cambridge, Mass: Harvard University Press.
32. Stein Rokkan (1970), Citizens, Elections, Parties: Approaches to the
Comparative Study of the Processes of Development Oslo:
Universitesforiaget.
33. The Pioneer, 07.10.2016, Retrieved: 07.10.2016.
34. Times of India, 16.02.2012: Retrieved: 26.09.2016.
35. Tingsten H.L.G. (1937), Political Behaviour, Studies in Election
Statistics: London: P.S. King.
36. Verba Sidney N, and Norman H. Nie(1972), Participation and Social
Equality, Cambridge, Mass: Harvard University Press.
37. Verba, Sidney N, NieLekajcieSieand Kim Cattreal (1978), Participation
and Social Equality, Cambridge, Mass: Harvard University Press and
Verba SK and N, Nie (1972), Politicization in America, Political
Democracy and Social Equity, New York, Harper and Raw.
38. Wattenberg M. P. (1998), Turnout Decline in the US and Other
Advanced Industrial Democracies. Irvine, CA: Centre for the Study of
Democracy.
39. ZoltaHajnal, Paul George Lewis and Hugh Louch (2002), Municipal
Elections in California: Turnout, Timing and Competition, Public Policy
Institute of California.


ZILLA PARISHAD ELECTIONS IN MAHARASHTRA : A
DATA ANALYSIS (1994-2013) 2016
Gokhale Institute of Politics and Economics, Pune 75
APPENDIX B
AVERAGE VALUES OF VT, POL, RESERVE COMP AND IND
ZP Average
VT
Average
_SCST
Average
_RES
Average
POL
Average
COMP
Average
IND
Akola 67.58 22.77 49.96 0.00 6.95 5.72
Amravati 66.20 38.10 64.68 0.75 6.52 8.09
Buldhana 73.79 17.55 45.53 0.75 8.15 7.25
Washim 72.32 24.89 51.94 0.75 6.96 5.38
Yavatmal 68.22 33.45 60.90 0.75 10.04 9.74
Aurangabad 68.59 16.56 43.71 0.25 7.84 4.66
Beed 67.99 14.44 42.02 0.50 9.78 11.37
Hingoli 73.36 20.44 48.00 0.33 7.71 4.00
Jalna 71.68 14.69 40.91 0.00 6.51 6.36
Latur 70.41 22.59 49.14 0.75 11.98 1.29
Nanded 70.18 30.96 58.35 0.75 8.17 9.58
Osmanabad 69.14 18.62 46.30 0.75 11.33 3.70
Parbhani 74.08 14.66 40.58 0.50 8.99 6.89
Raigad 71.37 16.02 41.81 0.25 8.69 1.25
Ratnagiri 62.34 2.75 30.13 0.25 12.68 3.51
Sindhudurg 65.62 5.34 33.00 0.75 12.50 0.00
Thane 58.07 45.93 73.13 0.75 8.31 4.48
Bhandara 74.92 29.08 56.27 0.50 8.84 8.50
Chandrapur 72.25 36.94 62.43 0.75 8.27 6.13
Gadchiroli 74.27 51.82 80.29 0.75 5.73 24.63
Contd…

ZILLA PARISHAD ELECTIONS IN MAHARASHTRA : A
DATA ANALYSIS (1994-2013) 2016
Gokhale Institute of Politics and Economics, Pune 76
ZP Average
VT
Average
_SCST
Average
_RES
Average
POL
Average
COMP
Average
IND
Gondia 73.53 32.16 58.33 1.00 9.39 1.92
Nagpur 67.34 33.69 59.84 0.25 8.13 11.75
Wardha 70.30 29.34 55.88 0.75 6.47 10.78
Ahmadnagar 67.05 21.93 48.84 0.75 12.29 6.04
Dhule 63.36 40.51 67.07 0.75 12.80 5.00
Jalgaon 66.21 22.25 48.16 0.00 9.91 1.47
Nandurbar 64.95 76.56 100.00 0.75 14.31 1.42
Nashik 63.81 41.29 68.04 0.75 9.44 4.19
Kolhapur 75.41 14.01 40.51 0.75 12.06 10.24
Pune 66.96 14.64 41.67 0.75 14.76 6.67
Sangli 72.16 12.75 39.03 0.75 14.11 2.43
Satara 68.90 9.75 36.70 0.75 14.51 3.39
Solapur 69.35 17.29 44.45 0.75 12.50 10.05

ZIL
LA
PR
ISH
AD
EL
EC
TIO
NS
IN
M
AH
AR
AS
HT
RA
: A
DA
TA
AN
AL
YS
IS
(19
94
-201
3)
20
16
Go
kh
ale
Inst
itu
te o
f P
oli
tics
an
d E
con
om
ics,
Pu
ne
77
AP
PE
ND
IX C
CL
US
TE
R A
NA
LY
SIS
OF
VT
, P
OL
, R
EV
ER
SE
CO
MP
, IN
D A
ND
RE
S
ZP
Aver
age
VT
ZP
P
OL
ZP
Aver
age
CO
MP
ZP
Aver
age
IND
ZP
Aver
age
RE
S
Bhan
dar
a 7
4.9
2
Am
ravati
0
.75
Pune
14
.756
Gad
chir
oli
2
4.6
2
Nan
durb
ar
10
0.0
0
Buld
han
a
73
.79
Buld
han
a
0.7
5
Sat
ara
14
.512
Nag
pur
11
.75
Gad
chir
oli
8
0.2
9
Chand
rap
ur
72
.25
Was
him
0
.75
Nan
durb
ar
14
.314
Bee
d
11
.37
Than
e 7
3.1
3
Gad
chir
oli
7
4.2
7
Yav
atm
al
0.7
5
San
gli
1
4.1
11
War
dha
10
.78
Nas
hik
6
8.0
4
Go
nd
ia
73
.53
Lat
ur
0.7
5
Dh
ule
1
2.8
01
Ko
lhap
ur
10
.24
Dh
ule
6
7.0
7
Hin
go
li
73
.36
Nan
ded
0
.75
Rat
nagir
i 1
2.6
81
So
lap
ur
10
.05
Am
ravati
6
4.6
8
Jaln
a 7
1.6
8
Osm
anab
ad
0.7
5
Sin
dhud
urg
1
2.4
98
Yav
atm
al
9.7
4
Chand
rap
ur
62
.43
Ko
lhap
ur
75
.41
Sin
dhud
urg
0
.75
So
lap
ur
12
.496
Nan
ded
9
.58
Yav
atm
al
60
.90
Lat
ur
70
.41
Than
e 0
.75
Ah
mad
nagar
1
2.2
88
Bhan
dar
a 8
.5
Nag
pur
59
.84
Contd…

ZIL
LA
PR
ISH
AD
EL
EC
TIO
NS
IN
M
AH
AR
AS
HT
RA
: A
DA
TA
AN
AL
YS
IS
(19
94
-201
3)
20
16
Go
kh
ale
Inst
itu
te o
f P
oli
tics
an
d E
con
om
ics,
Pu
ne
78
ZP
Aver
age
VT
ZP
P
OL
ZP
Aver
age
CO
MP
ZP
Aver
age
IND
ZP
Aver
age
RE
S
Nan
ded
7
0.1
8
Chand
rap
ur
0.7
5
Ko
lhap
ur
12
.058
Am
ravati
8
.09
Nan
ded
5
8.3
5
Par
bhan
i 7
4.0
8
Gad
chir
oli
0
.75
Lat
ur
11
.982
Buld
han
a
7.2
5
Go
nd
ia
58
.33
Rai
gad
7
1.3
7
War
dha
0.7
5
Osm
anab
ad
11
.333
Par
bhan
i 6
.89
Bhan
dar
a 5
6.2
7
San
gli
7
2.1
6
Nan
durb
ar
0.7
5
Yav
atm
al
10
.036
Pune
6.6
7
War
dha
55
.88
War
dha
70
.30
Nas
hik
0
.75
Jalg
aon
9
.91
2
Jaln
a 6
.36
Was
him
5
1.9
4
Was
him
7
2.3
2
Ko
lhap
ur
0.7
5
Bee
d
9.7
77
Chand
rap
ur
6.1
3
Ako
la
49
.96
So
lap
ur
69
.35
Pune
0.7
5
Nas
hik
9
.43
5
Ah
mad
nagar
6
.04
Lat
ur
49
.14
Osm
anab
ad
69
.14
San
gli
0
.75
Go
nd
ia
9.3
93
Ako
la
5.7
2
Ah
mad
nagar
4
8.8
4
Sat
ara
68
.90
Sat
ara
0.7
5
Par
bhan
i 8
.98
9
Was
him
5
.38
Jalg
aon
4
8.1
6
Aura
ngab
ad
68
.59
Ako
la
0.0
0
Bhan
dar
a 8
.83
9
Dh
ule
5
Hin
go
li
48
.00
Yav
atm
al
68
.22
Aura
ngab
ad
0.2
5
Rai
gad
8
.69
2
Aura
ngab
ad
4.6
6
Osm
anab
ad
46
.30
Contd…
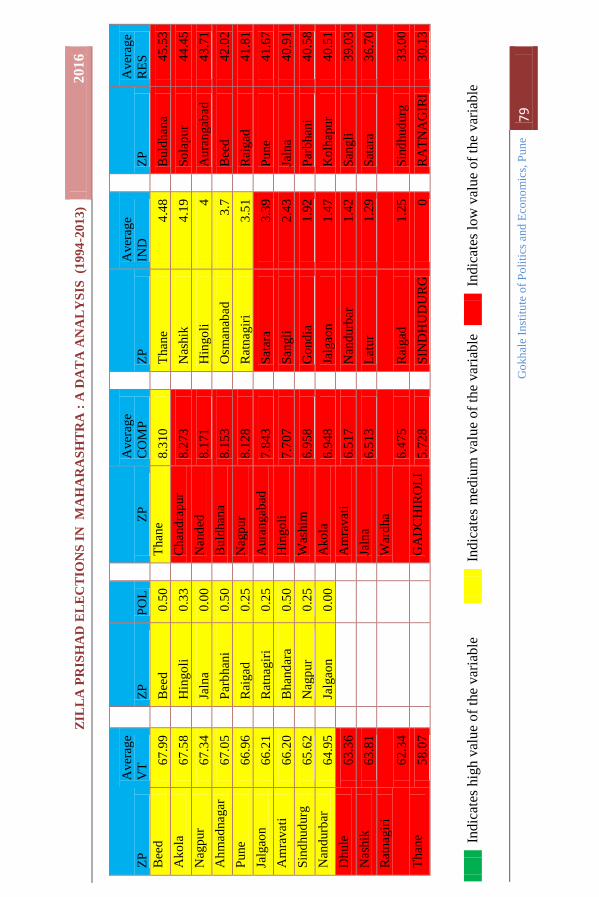
ZIL
LA
PR
ISH
AD
EL
EC
TIO
NS
IN
M
AH
AR
AS
HT
RA
: A
DA
TA
AN
AL
YS
IS
(19
94
-201
3)
20
16
Go
kh
ale
Inst
itu
te o
f P
oli
tics
an
d E
con
om
ics,
Pu
ne
79
ZP
Aver
age
VT
ZP
P
OL
ZP
Aver
age
CO
MP
ZP
Aver
age
IND
ZP
Aver
age
RE
S
Bee
d
67
.99
Bee
d
0.5
0
Than
e 8
.31
0
Than
e 4
.48
Buld
han
a
45
.53
Ako
la
67
.58
Hin
go
li
0.3
3
Chand
rap
ur
8.2
73
Nas
hik
4
.19
So
lap
ur
44
.45
Nag
pur
67
.34
Jaln
a 0
.00
Nan
ded
8
.17
1
Hin
go
li
4
Aura
ngab
ad
43
.71
Ah
mad
nagar
6
7.0
5
Par
bhan
i 0
.50
Buld
han
a
8.1
53
Osm
anab
ad
3.7
Bee
d
42
.02
Pune
66
.96
Rai
gad
0
.25
Nag
pur
8.1
28
Rat
nagir
i 3
.51
Rai
gad
4
1.8
1
Jalg
aon
6
6.2
1
Rat
nagir
i 0
.25
Aura
ngab
ad
7.8
43
Sat
ara
3.3
9
Pune
41
.67
Am
ravati
6
6.2
0
Bhan
dar
a 0
.50
Hin
go
li
7.7
07
San
gli
2
.43
Jaln
a 4
0.9
1
Sin
dhud
urg
6
5.6
2
Nag
pur
0.2
5
Was
him
6
.95
8
Go
nd
ia
1.9
2
Par
bhan
i 4
0.5
8
Nan
durb
ar
64
.95
Jalg
aon
0
.00
Ako
la
6.9
48
Jalg
aon
1
.47
Ko
lhap
ur
40
.51
Dh
ule
6
3.3
6
Am
ravati
6
.51
7
Nan
durb
ar
1.4
2
San
gli
3
9.0
3
Nas
hik
6
3.8
1
Jaln
a 6
.51
3
Lat
ur
1.2
9
Sat
ara
36
.70
Rat
nagir
i
62
.34
War
dha
6.4
75
Rai
gad
1
.25
Sin
dhud
urg
3
3.0
0
Than
e 5
8.0
7
GA
DC
HIR
OL
I 5
.72
8
SIN
DH
UD
UR
G
0
RA
TN
AG
IRI
30
.13
In
dic
ates
hig
h v
alu
e o
f th
e var
iable
Indic
ates
med
ium
val
ue
of
the
var
iable
In
dic
ates
lo
w v
alu
e of
the
var
iab
le

ZIL
LA
PA
RIS
HA
D E
LE
CT
ION
S I
N
MA
HA
RA
SH
TR
A :
A D
AT
A A
NA
LY
SIS
(1
99
4-2
013
) 2
01
6
Go
kh
ale
Inst
itu
te o
f P
oli
tics
an
d E
con
om
ics,
Pu
ne
80
AP
PE
ND
IX D
CO
RP
OR
AT
ION
RE
LE
VA
NT
FO
R I
MM
ED
IAT
E L
AU
NC
H O
F V
OT
ER
AW
AR
EN
ES
S P
RO
GR
AM
S
ZP
Aver
age
VT
ZP
A
ver
age
VT
Osm
anab
ad
69.1
4
Ja
lgao
n
66
.21
Sat
ara
68.9
0
A
mra
vat
i 6
6.2
0
Au
rangab
ad
68.5
9
S
indhudurg
6
5.6
2
Yav
atm
al
68.2
2
N
andurb
ar
64
.95
Bee
d
67.9
9
D
hule
6
3.3
6
Ako
la
67.5
8
N
ashik
6
3.8
1
Nag
pur
67.3
4
R
atnag
iri
62
.34
Ah
mad
nag
ar
67.0
5
T
han
e 5
8.0
7
Pu
ne
66.9
6
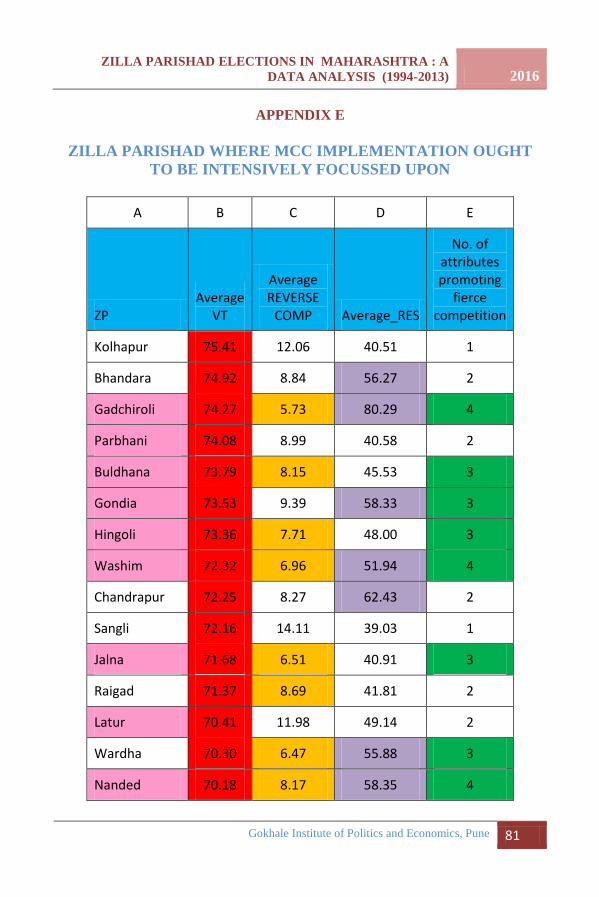
ZILLA PARISHAD ELECTIONS IN MAHARASHTRA : A
DATA ANALYSIS (1994-2013) 2016
Gokhale Institute of Politics and Economics, Pune 81
APPENDIX E
ZILLA PARISHAD WHERE MCC IMPLEMENTATION OUGHT
TO BE INTENSIVELY FOCUSSED UPON
A B C D E
ZP Average
VT
Average REVERSE
COMP Average_RES
No. of attributes promoting
fierce competition
Kolhapur 75.41 12.06 40.51 1
Bhandara 74.92 8.84 56.27 2
Gadchiroli 74.27 5.73 80.29 4
Parbhani 74.08 8.99 40.58 2
Buldhana 73.79 8.15 45.53 3
Gondia 73.53 9.39 58.33 3
Hingoli 73.36 7.71 48.00 3
Washim 72.32 6.96 51.94 4
Chandrapur 72.25 8.27 62.43 2
Sangli 72.16 14.11 39.03 1
Jalna 71.68 6.51 40.91 3
Raigad 71.37 8.69 41.81 2
Latur 70.41 11.98 49.14 2
Wardha 70.30 6.47 55.88 3
Nanded 70.18 8.17 58.35 4
ZILLA PARISHAD ELECTIONS IN MAHARASHTRA : A
DATA ANALYSIS (1994-2013) 2016
Gokhale Institute of Politics and Economics, Pune 82
How to read the table:
1. The table above shows list of Zilla Parishads that could witness bitterly
contested elections. These ZPs are basically those which show more than
average voter turnout. Thus, voter activism is high in these areas.
2. The study shows that VT is positively correlated with competition and
hence, there will be a tough contest amongst political parties in these
areas.
3. Thus, these ZPs are expected to show high level of political activism,
both from the voters as well as political parties.
4. High VT normally occurs in lesser developed districts. Political parties
try to connect to the voter at the grassroot level and hence, it is in these
districts that fierce competition will be witnessed. Those districts
belonging to the low development cluster are highlighted in column A.
5. Where the REVERSE COMP is low, the competition between political
parties will be high. Such ZPs have been highlighted in Column C.
6. The study shows that political competition tends to be bitter where the
proportion of reserved seats is higher. Such Councils, which belong to
the high reservation of seats cluster, have been highlighted in Column D.
7. Thus, elections will be fiercely contested when the VT is high,
development quotient is low, and where the reservation proportion is
high.
8. Columns A to D actually highlight the different attributes that promote
fierce competition amongst political parties. In Column E, one can see
how many of these attributes are possessed by the chosen ZPs.
9. Those ZPs possessing at least 3 attributes should be the ones targeted for
better management, vigilance, scrutiny and MCC implementation from a
policy perspective.
10. Thus, more focus on MCC implementation should be kept whilst
conducting elections of ZPs in Gadchiroli, Washim, Nanded, Buldhana,
Gondia, Hingoli, Jalna and Wardha.