zoe covid study
TRANSCRIPT
ZOE COVID Study
Daily COVID Infections Report
16 November 2021
Analysis by ZOE and King's College London
covid.joinzoe.com

Contents
1. Incidence estimates
1.1. Incidence map and headline figures
1.2. Daily new cases in the UK by vaccination status
1.3. Daily new cases in England
1.4. Daily incidence rates by nation and administrative region
1.5. Daily new cases of people living with Long Covid
2. Prevalence estimates
2.1. Prevalence map and headline figures
2.2. Prevalence rates by sociodemographic characteristics
2.3. Daily active cases by nation and administrative region
2.4. Daily prevalence rates by nation and administrative region
2.5. Daily prevalence rates by age group
4. Local authorities' watch list
5. Non-COVID respiratory illnesses
5.1. Cold-like illness incidence estimates
6. Raw figures
6.1. Number of users logging feeling well/unwell
6.2. Location of positive PCR tests results
7. Changelog
•
◦
◦
◦
◦
◦
•
◦
◦
◦
◦
◦
•
•
◦
•
◦
◦
•
Incidence estimates
(based on 2 weeks up to 12 November 2021)

Daily new cases of symptomatic COVID
We estimate there have been 64810 daily new cases of symptomatic COVID in the UK on
average over the two weeks up to 12 November 2021. This is based on the number of
newly symptomatic app users per day, and the proportion of these who give positive
swab tests.
Daily new cases of COVID per 100,000 (12 November 2021) [1]
Daily new cases per 100,000 R
East Midlands 88 - 119 0.9 (0.8 - 1.0)
East of England 93 - 116 0.9 (0.8 - 1.0)
England 84 - 110 0.9 (0.8 - 1.0)
London 65 - 84 0.9 (0.8 - 1.0)
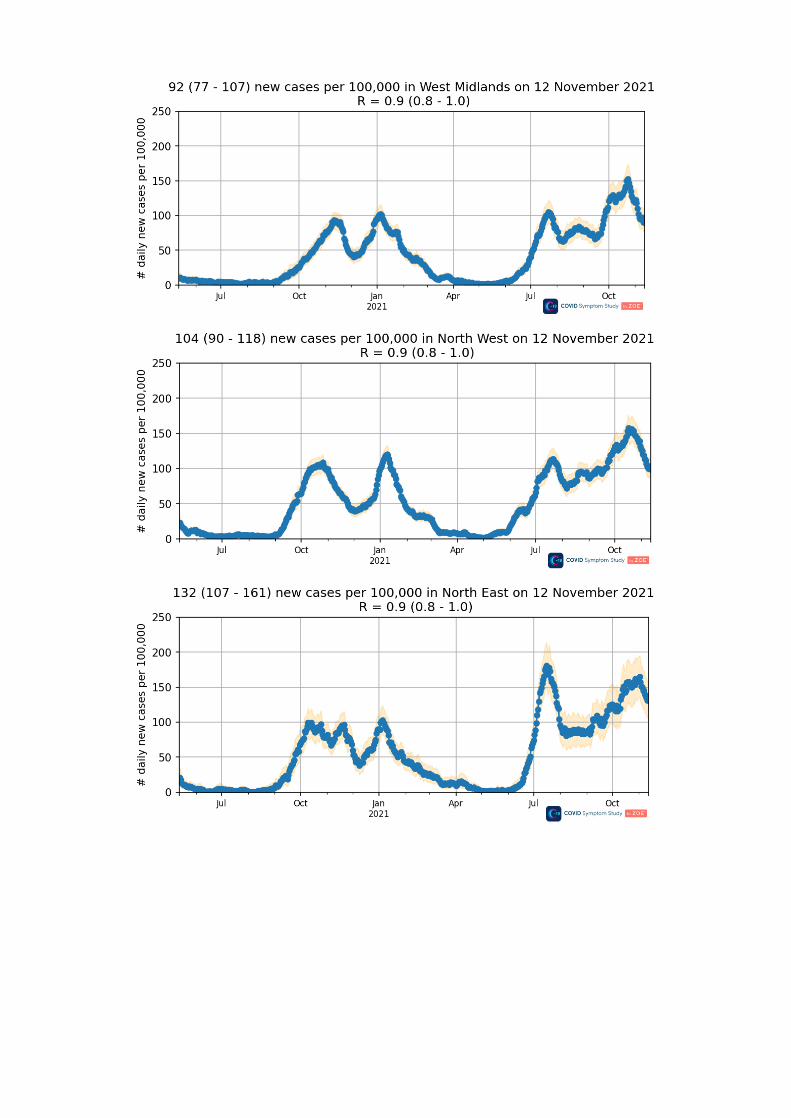
North East 107 - 161 0.9 (0.8 - 1.0)
North West 90 - 118 0.9 (0.8 - 1.0)
Northern Ireland 71 - 185 0.9 (0.7 - 1.0)
Scotland 71 - 100 1.0 (1.0 - 1.1)
South East 89 - 106 0.9 (0.8 - 1.0)
South West 87 - 109 0.9 (0.7 - 1.0)
Wales 109 - 150 0.9 (0.8 - 1.0)
West Midlands 77 - 107 0.9 (0.8 - 1.0)
Yorkshire and The Humber 79 - 109 0.9 (0.7 - 1.0)
UK 84 - 113 0.9 (0.8 - 1.0)
[1] Please refer to the publication by Varsavsky at al. (2020) for details on how R values are calculated

Daily new cases in the UK by vaccination status
Daily new cases in England
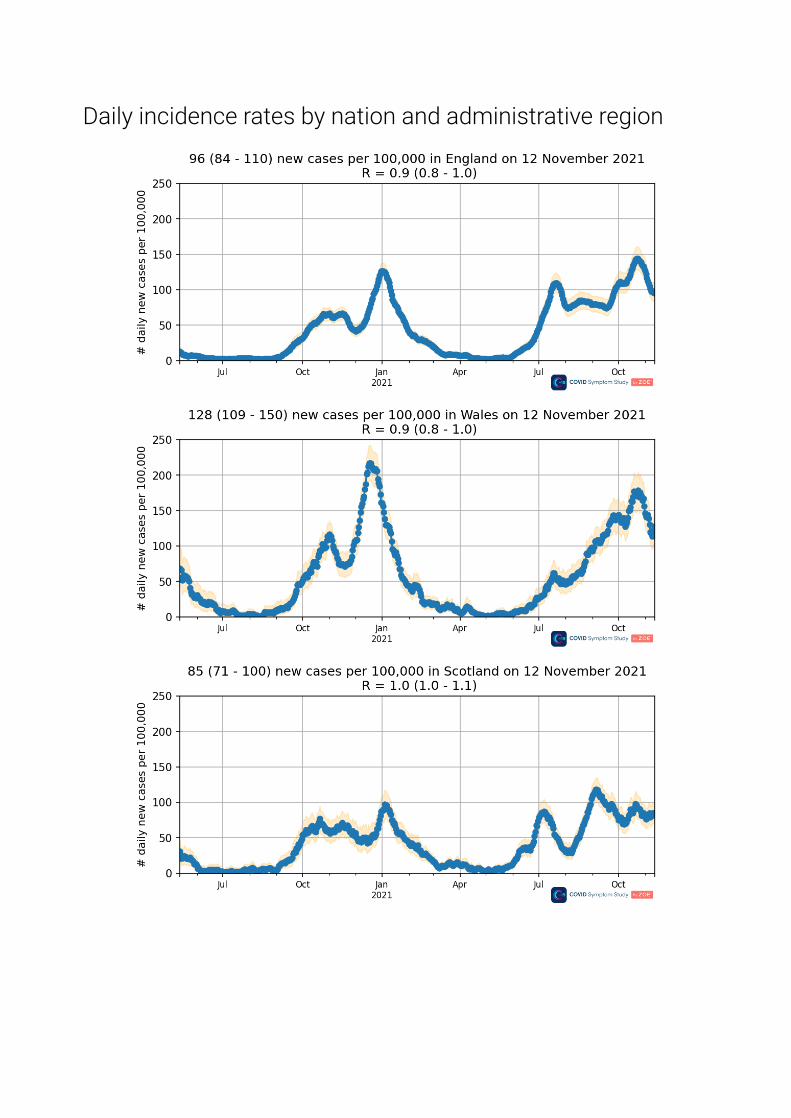
Daily incidence rates by nation and administrative region


Daily new cases of people living with Long Covid
This subsection includes estimates on new daily cases of people living with Long Covid.
This estimate refers to the number of people in the UK who fell ill on a specific day and
are predicted to have COVID-like symptoms for more than 12 weeks [2].
[2] Please refer to the publication by Thompson at al. (2021) for details on how long covid rates in the population are modelled
Prevalence estimates
(up to 15 November 2021)
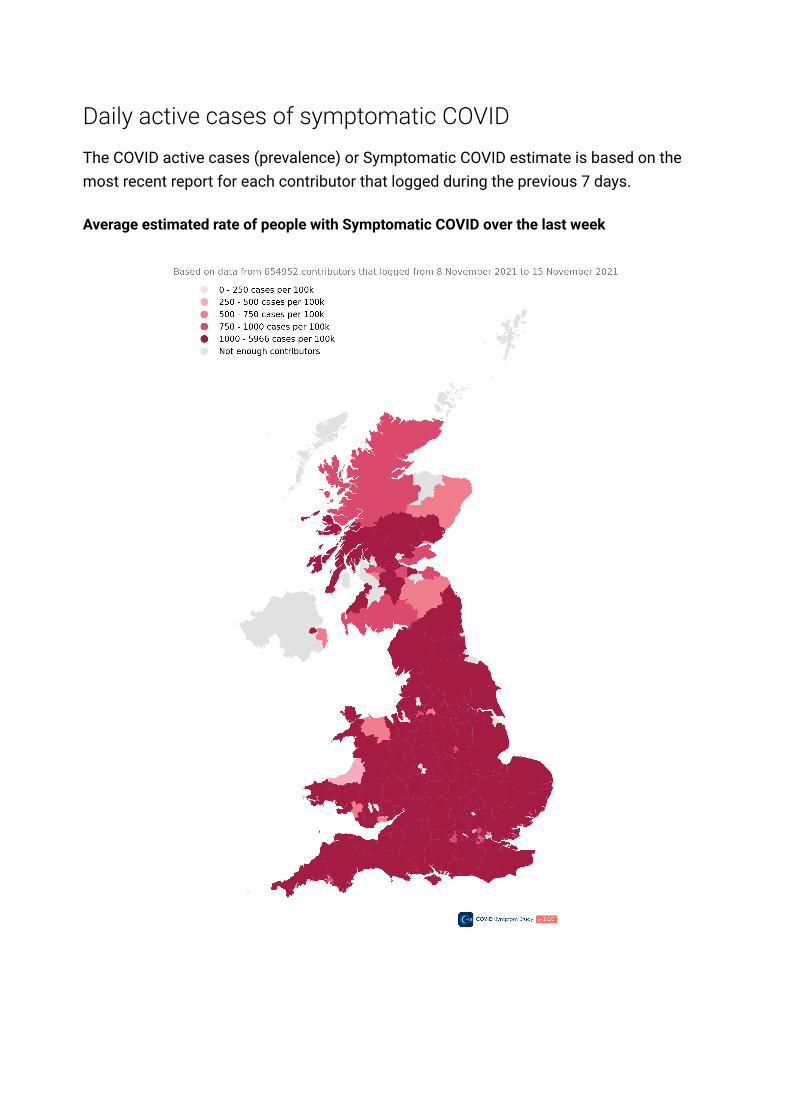
Daily active cases of symptomatic COVID
The COVID active cases (prevalence) or Symptomatic COVID estimate is based on the
most recent report for each contributor that logged during the previous 7 days.
Average estimated rate of people with Symptomatic COVID over the last week
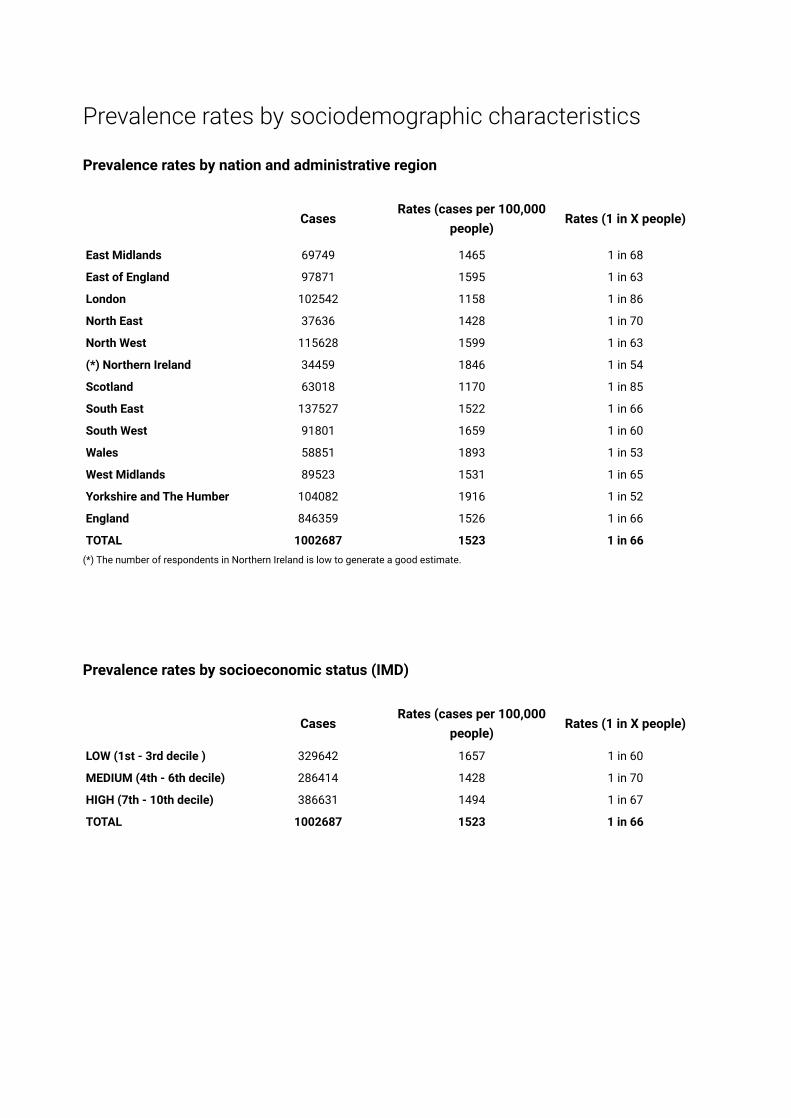
Prevalence rates by sociodemographic characteristics
Prevalence rates by nation and administrative region
CasesRates (cases per 100,000
people)Rates (1 in X people)
East Midlands 69749 1465 1 in 68
East of England 97871 1595 1 in 63
London 102542 1158 1 in 86
North East 37636 1428 1 in 70
North West 115628 1599 1 in 63
(*) Northern Ireland 34459 1846 1 in 54
Scotland 63018 1170 1 in 85
South East 137527 1522 1 in 66
South West 91801 1659 1 in 60
Wales 58851 1893 1 in 53
West Midlands 89523 1531 1 in 65
Yorkshire and The Humber 104082 1916 1 in 52
England 846359 1526 1 in 66
TOTAL 1002687 1523 1 in 66
(*) The number of respondents in Northern Ireland is low to generate a good estimate.
Prevalence rates by socioeconomic status (IMD)
CasesRates (cases per 100,000
people)Rates (1 in X people)
LOW (1st - 3rd decile ) 329642 1657 1 in 60
MEDIUM (4th - 6th decile) 286414 1428 1 in 70
HIGH (7th - 10th decile) 386631 1494 1 in 67
TOTAL 1002687 1523 1 in 66
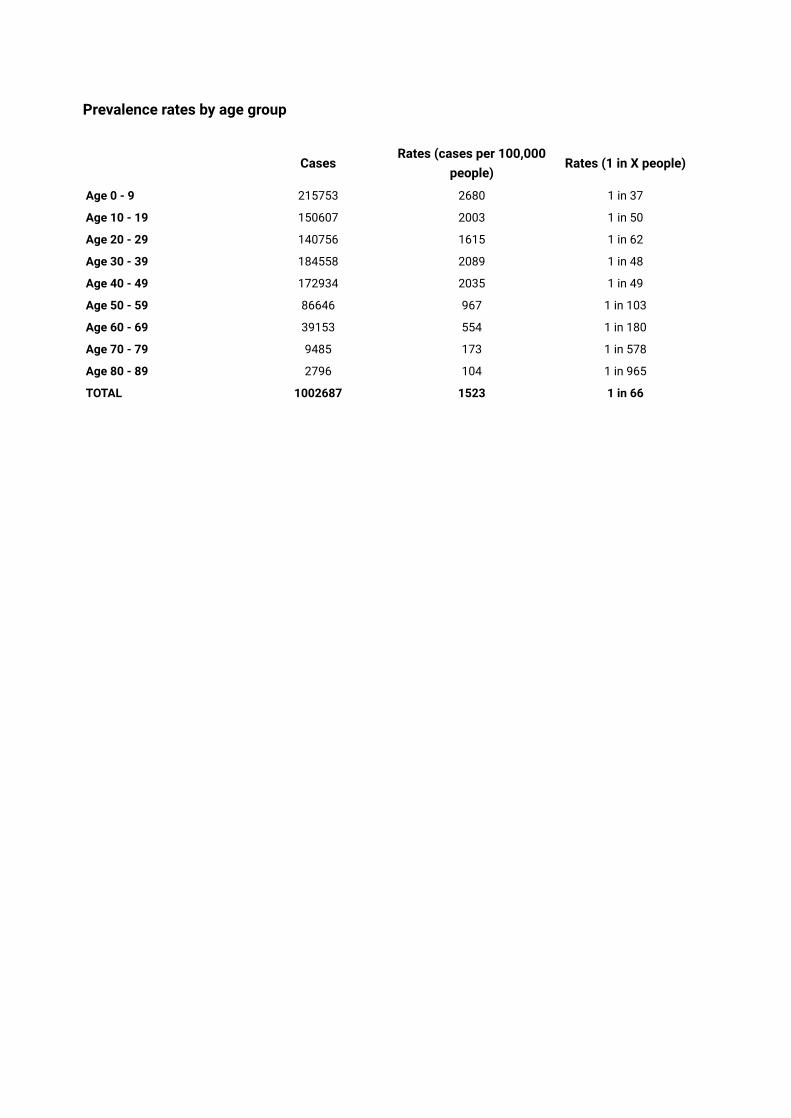
Prevalence rates by age group
CasesRates (cases per 100,000
people)Rates (1 in X people)
Age 0 - 9 215753 2680 1 in 37
Age 10 - 19 150607 2003 1 in 50
Age 20 - 29 140756 1615 1 in 62
Age 30 - 39 184558 2089 1 in 48
Age 40 - 49 172934 2035 1 in 49
Age 50 - 59 86646 967 1 in 103
Age 60 - 69 39153 554 1 in 180
Age 70 - 79 9485 173 1 in 578
Age 80 - 89 2796 104 1 in 965
TOTAL 1002687 1523 1 in 66
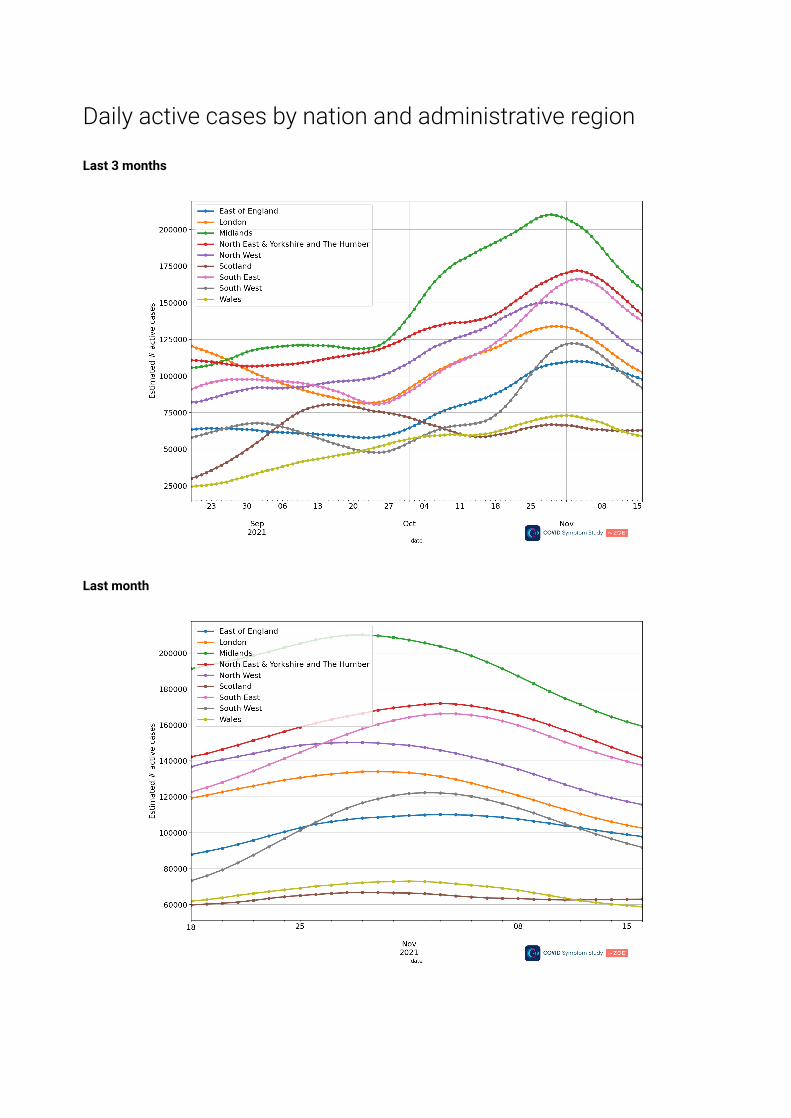
Daily active cases by nation and administrative region
Last 3 months
Last month
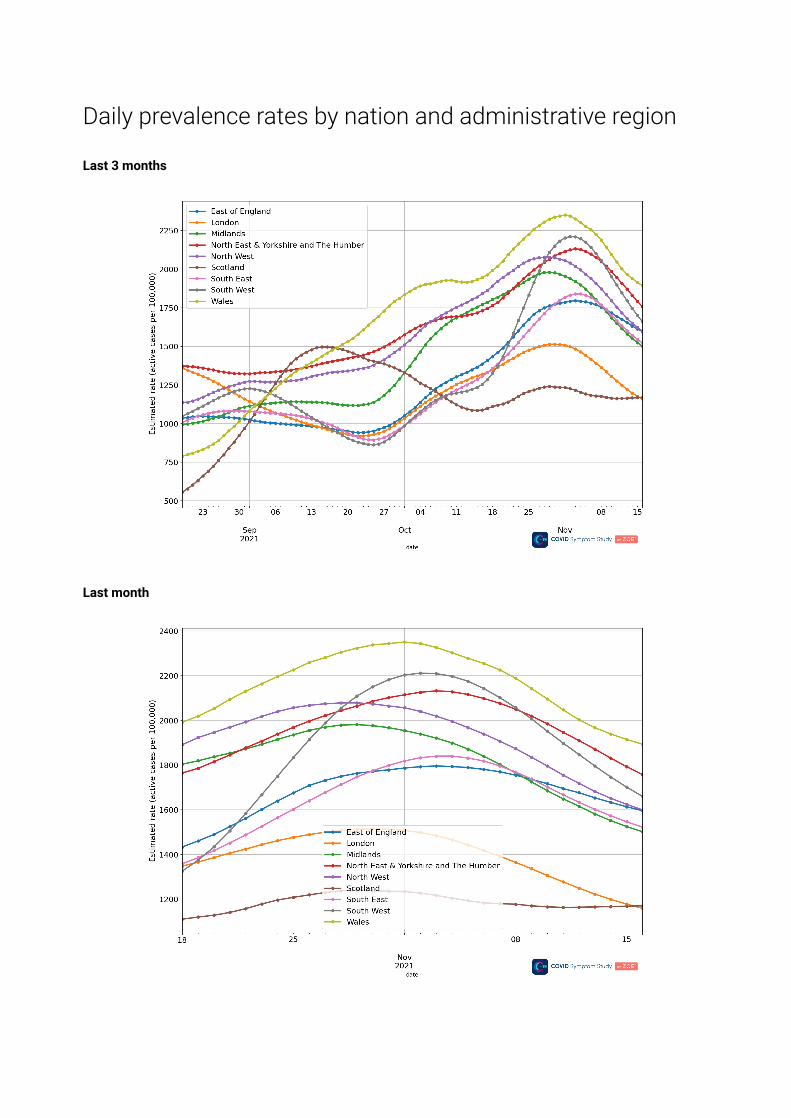
Daily prevalence rates by nation and administrative region
Last 3 months
Last month

Daily prevalence rates by age group
Last 3 months
Last month
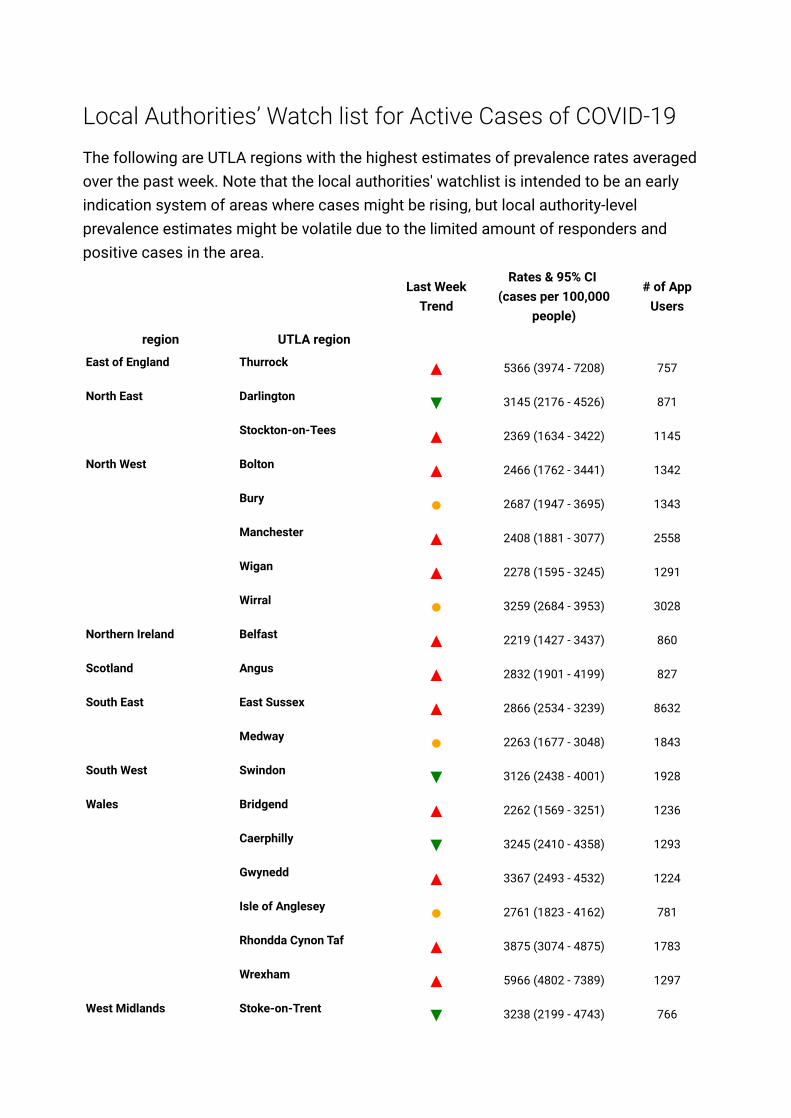
Local Authorities’ Watch list for Active Cases of COVID-19
The following are UTLA regions with the highest estimates of prevalence rates averaged
over the past week. Note that the local authorities' watchlist is intended to be an early
indication system of areas where cases might be rising, but local authority-level
prevalence estimates might be volatile due to the limited amount of responders and
positive cases in the area.
Last Week
Trend
Rates & 95% CI
(cases per 100,000
people)
# of App
Users
region UTLA region
East of England Thurrock ▲ 5366 (3974 - 7208) 757
North East Darlington ▼ 3145 (2176 - 4526) 871
Stockton-on-Tees ▲ 2369 (1634 - 3422) 1145
North West Bolton ▲ 2466 (1762 - 3441) 1342
Bury ● 2687 (1947 - 3695) 1343
Manchester ▲ 2408 (1881 - 3077) 2558
Wigan ▲ 2278 (1595 - 3245) 1291
Wirral ● 3259 (2684 - 3953) 3028
Northern Ireland Belfast ▲ 2219 (1427 - 3437) 860
Scotland Angus ▲ 2832 (1901 - 4199) 827
South East East Sussex ▲ 2866 (2534 - 3239) 8632
Medway ● 2263 (1677 - 3048) 1843
South West Swindon ▼ 3126 (2438 - 4001) 1928
Wales Bridgend ▲ 2262 (1569 - 3251) 1236
Caerphilly ▼ 3245 (2410 - 4358) 1293
Gwynedd ▲ 3367 (2493 - 4532) 1224
Isle of Anglesey ● 2761 (1823 - 4162) 781
Rhondda Cynon Taf ▲ 3875 (3074 - 4875) 1783
Wrexham ▲ 5966 (4802 - 7389) 1297
West Midlands Stoke-on-Trent ▼ 3238 (2199 - 4743) 766

Last Week
Trend
Rates & 95% CI
(cases per 100,000
people)
# of App
Users
region UTLA region
Telford and Wrekin ▼ 3161 (2262 - 4400) 1052
Yorkshire and The Humber Barnsley ▲ 2292 (1566 - 3342) 1126
Calderdale ▲ 2286 (1683 - 3097) 1752
Kingston upon Hull, City of ● 3135 (2116 - 4622) 766
North Lincolnshire ● 2971 (2054 - 4279) 920
▲ implies an increase in prevalence in the past week
● implies that prevalence has been fairly constant in the past week
▼ implies a decrease in prevalence in the past week
Non-COVID respiratory illnesses
(up to 12 November 2021)
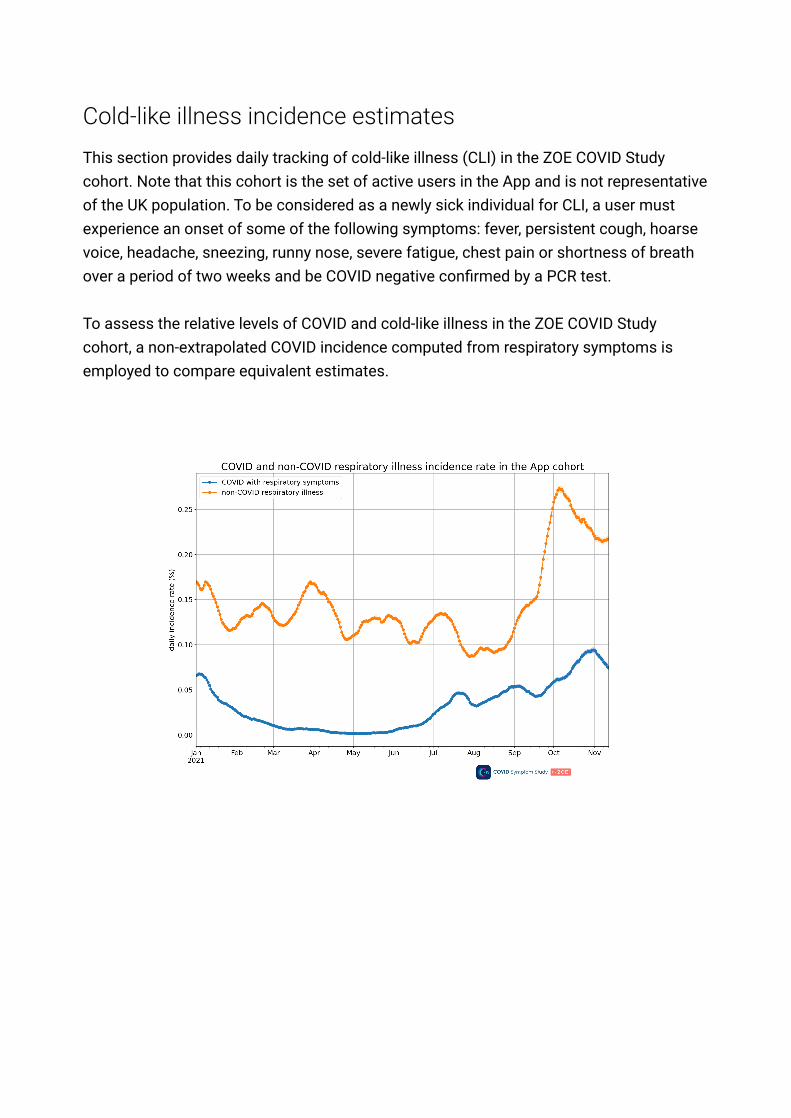
Cold-like illness incidence estimates
This section provides daily tracking of cold-like illness (CLI) in the ZOE COVID Study
cohort. Note that this cohort is the set of active users in the App and is not representative
of the UK population. To be considered as a newly sick individual for CLI, a user must
experience an onset of some of the following symptoms: fever, persistent cough, hoarse
voice, headache, sneezing, runny nose, severe fatigue, chest pain or shortness of breath
over a period of two weeks and be COVID negative confirmed by a PCR test.
To assess the relative levels of COVID and cold-like illness in the ZOE COVID Study
cohort, a non-extrapolated COVID incidence computed from respiratory symptoms is
employed to compare equivalent estimates.

Raw Figures
(up to 15 November 2021)
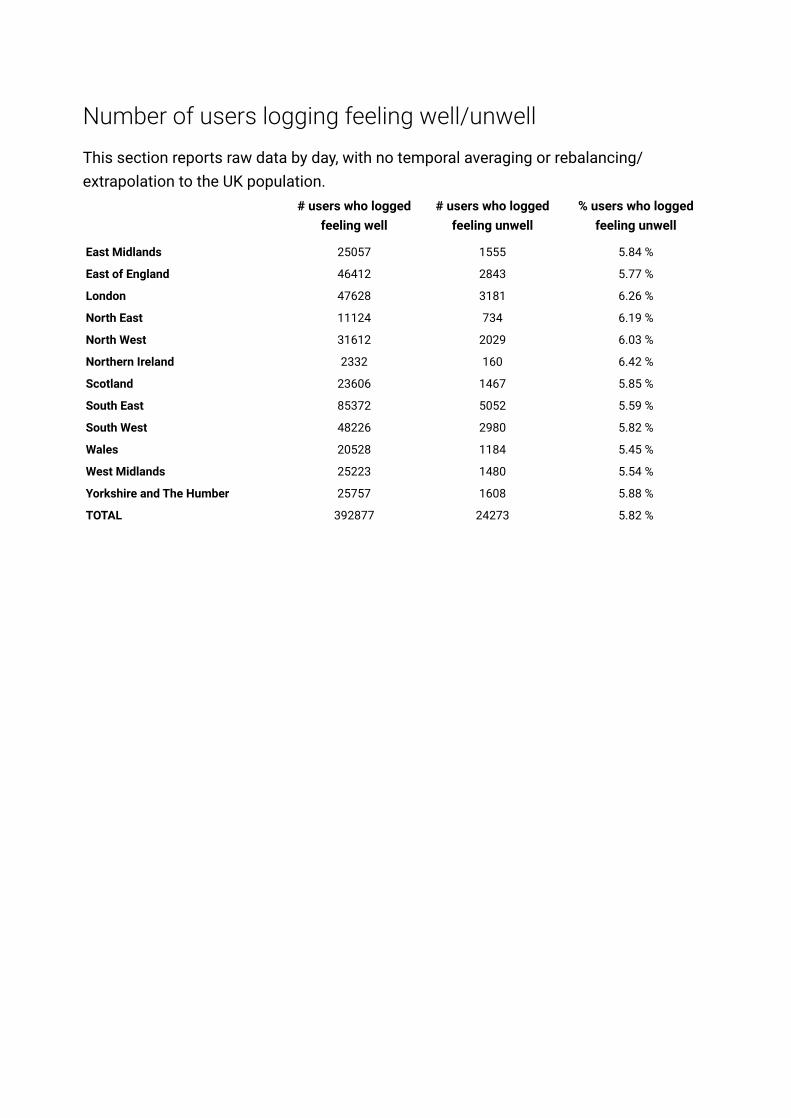
Number of users logging feeling well/unwell
This section reports raw data by day, with no temporal averaging or rebalancing/
extrapolation to the UK population.
# users who logged
feeling well
# users who logged
feeling unwell
% users who logged
feeling unwell
East Midlands 25057 1555 5.84 %
East of England 46412 2843 5.77 %
London 47628 3181 6.26 %
North East 11124 734 6.19 %
North West 31612 2029 6.03 %
Northern Ireland 2332 160 6.42 %
Scotland 23606 1467 5.85 %
South East 85372 5052 5.59 %
South West 48226 2980 5.82 %
Wales 20528 1184 5.45 %
West Midlands 25223 1480 5.54 %
Yorkshire and The Humber 25757 1608 5.88 %
TOTAL 392877 24273 5.82 %

Location of positive PCR tests results

Changelog
[...]
2021-05-12: Changed methodology to adjust for vaccination status (see blog post)
2021-05-26: Updated infection report format and included contents and changelog
pages
2021-06-08: Incidence figures are now smoothed over a 7-day rolling window
2021-06-09: Included UK incidence trend by vaccination status
2021-06-10: Fixed bug in the local authorities' watch list which prevented authorities
with rates above 1000 per 100k to be displayed.
2021-06-17: Changes in the local authorities' watch list: Included confidence
intervals around the prevalence estimate. Reformatted the table. Extra paragraph
explaining that the watchlist is an early indication system.
2021-07-16: Removed incidence graph by vaccination status from the report as
there are very few unvaccinated users in the infection survey, the Confidence
Intervals are very wide and the trend for unvaccinated people is no longer
representative.
2021-07-21: Released the latest version of incidence. This new estimate adjusts for
the decreasing number of unvaccinated users in our initial cohort by relaxing the
inclusion criteria of newly sick and incorporating LFTs. An age weighting was also
employed to have a reliable representation of the UK population in our estimates
over all age segments. Incidence figures broken down by vaccination status were
also rolled out. We have written a comprehensive blog on this to help explain this
change further, read more here.
2021-07-29: Replaced absolute incidence figures by vaccination status with
incidence rates.
2021-08-26: Changed the incidence by vaccination status plot to show estimates
only on the whole and the fully vaccinated populations. Added a plot depicting daily
estimates of Long Covid incidence.
2021-09-08: Changed the incidence plot for England to show the rate of new daily
cases rather than the absolute figure.
2021-09-14: Added a plot on the daily new cases in England.
2021-09-23: Changed the prevalence map and the hotspot table to use 14-days
smoothed prevalence estimates.
2021-10-07: Released the latest version of incidence which accounts for the
diminishing number of unvaccinated users across age groups. Read more here.
2021-10-14: Fixed a minor bug affecting population figures across vaccination
status.
•
•
•
•
•
•
•
•
•
•
•
•
•
•
•
•

2021-11-11: Added a new Section on non-COVID respiratory illness incidence
estimates in the ZOE COVID Study cohort.
•