zoelefkofridi alexiakatsanidoumay2017 tables and...
TRANSCRIPT

1
Transnational Party Competition?
Transnational Political Groups’ Positions and Ideological Coherence TABLES AND FIGURES
Zoe Lefkofridi
University of Salzburg [email protected]
and
Alexia Katsanidou GESIS -‐ Leibniz Institute for the Social Sciences
Presented at Workshop “Rejected Europe. Beloved Europe. Cleavage Europe?”
Robert Schuman Centre for Advanced Studies, European University Institute, May 18 -‐19, 2017.

2
Table 1: Standard deviation of the policy positions of Transnational Groups
Transnational Party Group EPP Socialist ALDE Greens ECR GUE/NGL EFD/EFFD Alliance/ ENF
Year
Policy
2009 2014 2009 2014 2009 2014 2009 2014 2009 2014 2009 2014 2009 2014 2009 2014
Social programs vs. higher taxes 1.2 1.1 0.8 0.9 1.2 1.0 0.7 0.8 1.4 1.2 1.1 0.5 1.5 1.5 0.7
Reduce Government spending to cut
taxes
1.1 1.0 1.2 1.3 1.2 1.0 0.9 0.8 1.7 1.3 1.6 0.8 1.6 1.1 0.5
Reduce workers' protection regulations to fight unemployment
1.4 1.2 0.9 0.5 1.3 1.2 1.0 0.3 1.5 1.4 0.4 0.3 1.5 1.5 1.3
European integration is a good thing 0.7 0.6 0.3 0.5 0.6 0.7 1.2 0.7 0.6 1.1 1.2 0.9 1.5 0.6 0.8
Individual member states of the EU less veto power
1.3 1.1 0.7 1.2 1.1 1.2 1.2 1.0 0.5 1.0 1.58 0.6 0.4 0 0.5
EU should strengthen its security and defense policy
0.8 0.8 0.6 1.0 0.6 0.6 1.3 1.2 1.8 1.7 1.3 0.8 1.5 0 1.3
EU should speak with one voice on foreign policy
0.7 0.9 0.4 0.9 0.9 0.5 1.2 1.3 0.5 1.5 1.9 1.3 0.5 1.7 1.6
The EU should acquire its own tax raising powers
1.3 1.3 1.4 1.4 1.4 1.6 1.4 1.3 0.8 0.9 1.4 1.5 0.4 0.6 0
Immigration should be made more restrictive
1.4 1.2 1.0 1.2 1.3 1.2 0.8 0.6 1.4 1.3 1.3 1.0 0.8 1.7 1.2
Immigrants required to accept our culture and values
1 1.1 1.1 1.4 1.1 1.3 1.3 1.1 0.5 1.0 1.1 0.8 0 0 1.2
The legalization of same sex marriages is a good thing
1.1 1.1 0.9 0.8 1.1 1.0 1.0 0.9 0.5 0.8 1.4 0.9 0.4 0.6 0
Criminals should be punished more severely
1.2 1.4 1.1 1.3 1.5 1.4 0.3 0.8 2.1 1.7 0 1.1 1.2 1.5 1.2
Green taxes for promotion of public transport
1.1 1.2 1 1.0 1.3 1.3 1 1.1 1.6 1.1 0.5 1.3 0.5 2.1 1.3
Renewable sources of energy should be supported even at higher energy costs
1 1.1 0.7 0.7 1.1 1.3 0.6 0.8 1.5 1.2 0.7 1.3 1.2 2 0.9
Mean Standard Deviation 1.1 1.1 0.9 1.0 1.1 1.1 1.0 0.9 1.2 1.2 1.1 0.9 0.9 1.1 n/a 0.9

3
Table 2: Results of the logistic regression explaining transnational party choice ***<0.001, **< 0.01, *<0.05, + <0.10
Transnational Party Group
Socialists EPP ALDE Greens ECR GUE/NGL EFD/EFFD ENF
Year 2009 2014 2009 2014 2009 2014 2009 2014 2009 2014 2009 2014 2009 2014 n/a 2014 Constant -‐4.83*** -‐6.46*** -‐3.5*** -‐9.1*** -‐1.87** -‐5.3 -‐3.43*** -‐6.32** -‐1.71+ -‐1.02 -‐1.66+ 2.82 -‐1.28 -‐10.1 -‐5.08
Economic Dimension
-‐0.99*** -‐0.99** 0.72*** 1.1*** 0.70*** 0.7** -‐0.75* -‐0.9* 0.73* 0.1 -‐0.71+ -‐1.61* -‐0.62 2.23 1.33+
EU Dimension
0.93*** 1.07*** 0.56** 1.44*** 0.17 0.66* 0.25 0.66* -‐0.53 -‐0.48+ -‐0.73** -‐1.69*** -‐1.34+ -‐3.4* -‐1.68+
Immigration Dimension
0.06 0.64* -‐0.2 0.22 -‐0.09 -‐0.73** -‐0.45+ -‐0.64 -‐0.07 0.34 -‐0.27 -‐0.38 0.41 0.94 0.20
Sociocultural Dimension
0.1 -‐0.34* 0.38*** 0.55*** -‐0.18+ -‐0.12 0.54*** -‐0.15 -‐0.03 0.04 -‐0.08 -‐0.14 0.61* 0.12 0.83+
Environment 0.04 -‐0.18 0.05 0.27 -‐0.11 -‐0.71* 0.12 0.84+ -‐0.05 -‐0.29 0.26* 0.16 -‐0.31 2.2+ 0.57 N 149 151 149 151 149 151 149 151 149 151 149 151 149 151 151 Pseudo R-‐sq 0.24 0.28 0.23 0.37 0.13 0.2 0.38 0.39 0.13 0.16 0.31 0.58 0.51 0.53 0.49 BIC 138.85 133.81 159.40 137.17 155.22 133.66 103.01 97.86 83.95 116.04 84.39 71.4 57.63 43.79 55.59 Correctly classified
82.55% 82.12% 79.87% 82.12% 81.88% 88.08% 85.91% 90.7% 94.63% 88.08% 93.29% 93.4% 95.3% 98.68% 96.03%
4
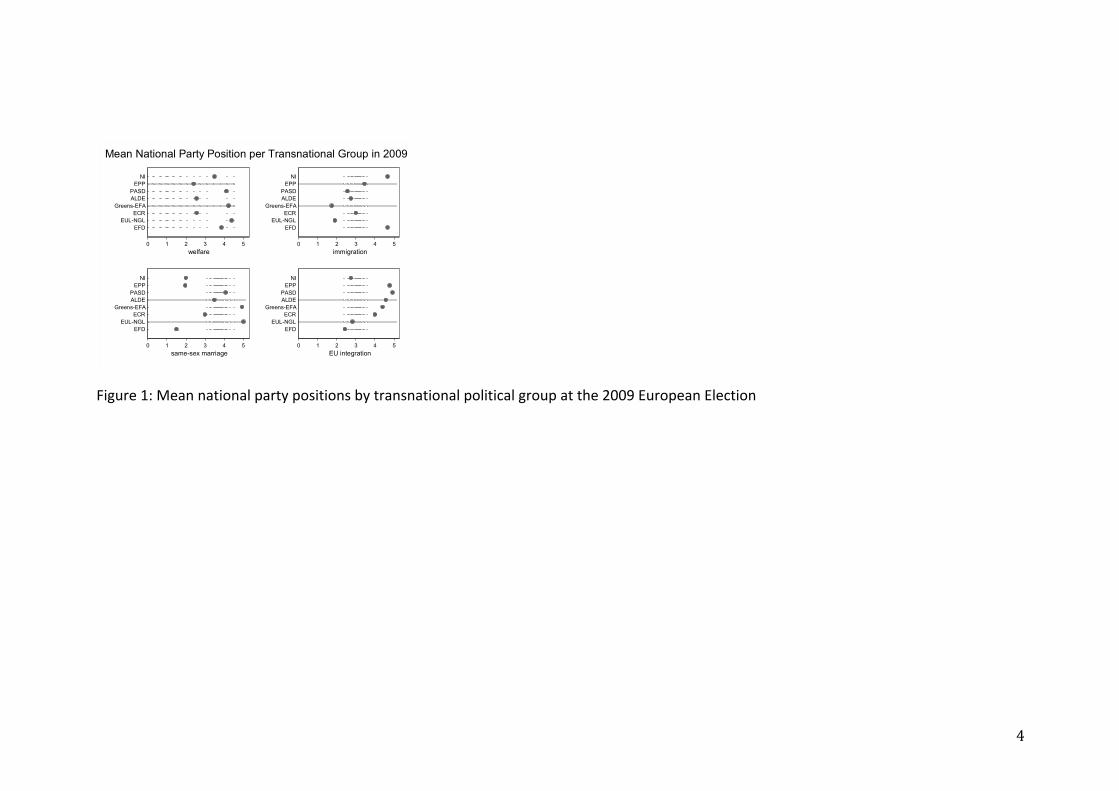
Figure 1: Mean national party positions by transnational political group at the 2009 European Election
0 1 2 3 4 5welfare
EFDEUL-NGL
ECRGreens-EFA
ALDEPASD
EPPNI
0 1 2 3 4 5immigration
EFDEUL-NGL
ECRGreens-EFA
ALDEPASD
EPPNI
0 1 2 3 4 5same-sex marriage
EFDEUL-NGL
ECRGreens-EFA
ALDEPASD
EPPNI
0 1 2 3 4 5EU integration
EFDEUL-NGL
ECRGreens-EFA
ALDEPASD
EPPNI
Mean National Party Position per Transnational Group in 2009

5
Figure 2: Mean national party positions by transnational political group at the 2014 European Election
0 1 2 3 4 5welfare
ENFEFFD
EUL-NGLECR
Greens-EFAALDEPASD
EPPNI
0 1 2 3 4 5immigration
ENFEFFD
EUL-NGLECR
Greens-EFAALDEPASD
EPPNI
0 1 2 3 4 5same-sex marriage
ENFEFFD
EUL-NGLECR
Greens-EFAALDEPASD
EPPNI
0 1 2 3 4 5EU integration
ENFEFFD
EUL-NGLECR
Greens-EFAALDEPASD
EPPNI
Mean National Party Position per Transnational Group in 2014

6
SUPPLEMENT
In this appendix we provide a visual guide to transnational party group cohesion to help readers visualize the data presented in table 1 of the paper. We group national parties on the basis of which group they have chosen in the beginning of the electoral cycle and we present their positions in two dimensional graphs: one graph capturing the positions on welfare and on European integration and a second graph capturing positions on same sex marriage and immigration. Each national party is presented with a bubble. The size of the bubble depicts the number of MEPs elected by this party. Thus, a bigger bubble represents a bigger party, while a small bubble stands for a smaller party.
National party positions in 2009
12
34
56
Euro
pean
Inte
grat
ion
1 2 3 4 5More welfare even at cost of higher taxes?
Figure 1: Positions of National Parties within EPP in 2009
12
34
56
Imm
igra
tion
1 2 3 4 5Same sex marriage
Figure 2: Positions of National Parties within EPP in 2009

7
12
34
56
Euro
pean
Inte
grat
ion
1 2 3 4 5More welfare even at cost of higher taxes?
Figure 3: Positions of National Parties within PASD in 2009
12
34
56
Imm
igra
tion
1 2 3 4 5Same sex marriage
Figure 4: Positions of National Parties within PASD in 2009
12
34
56
Euro
pean
Inte
grat
ion
1 2 3 4 5More welfare even at cost of higher taxes?
Figure 5: Positions of National Parties within ALDE in 2009
12
34
56
Imm
igra
tion
1 2 3 4 5Same sex marriage
Figure 6: Positions of National Parties within ALDE in 2009

8
12
34
56
Euro
pean
Inte
grat
ion
1 2 3 4 5More welfare even at cost of higher taxes?
Figure 7: Positions of National Parties within Greens-EFA in 2009
12
34
56
Imm
igra
tion
1 2 3 4 5Same sex marriage
Figure 8: Positions of National Parties within Greens-EFA in 2009
12
34
56
Euro
pean
Inte
grat
ion
1 2 3 4 5More welfare even at cost of higher taxes?
Figure 9: Positions of National Parties within ECR in 20091
23
45
6
Imm
igra
tion
1 2 3 4 5Same sex marriage
Figure 10: Positions of National Parties within ECR in 2009

9
12
34
56
Euro
pean
Inte
grat
ion
1 2 3 4 5More welfare even at cost of higher taxes?
Figure 11: Positions of National Parties within EUL-NGL in 2009
12
34
56
Imm
igra
tion
1 2 3 4 5Same sex marriage
Figure 10: Positions of National Parties within EUL-NGL in 2009
12
34
56
Euro
pean
Inte
grat
ion
1 2 3 4 5More welfare even at cost of higher taxes?
Figure 11: Positions of National Parties within EFD in 2009
12
34
56
Imm
igra
tion
1 2 3 4 5Same sex marriage
Figure 12: Positions of National Parties within EFD in 2009

10
National party positions in 2014
12
34
56
Euro
pean
Inte
grat
ion
1 2 3 4 5More welfare even at cost of higher taxes?
Figure 13: Positions of National Parties within EPP in 2014
12
34
56
Imm
igra
tion
1 2 3 4 5Same sex marriage
Figure 14: Positions of National Parties within EPP in 2014
12
34
56
Euro
pean
Inte
grat
ion
1 2 3 4 5More welfare even at cost of higher taxes?
Figure 15: Positions of National Parties within PASD in 2014
12
34
56
Imm
igra
tion
1 2 3 4 5Same sex marriage
Figure 16: Positions of National Parties within PASD in 2014

11
12
34
56
Euro
pean
Inte
grat
ion
1 2 3 4 5More welfare even at cost of higher taxes?
Figure 17: Positions of National Parties within ALDE in 2014
12
34
56
Imm
igra
tion
1 2 3 4 5Same sex marriage
Figure 18: Positions of National Parties within ALDE in 2014
12
34
56
Euro
pean
Inte
grat
ion
1 2 3 4 5More welfare even at cost of higher taxes?
Figure 19: Positions of National Parties within Greens-EFA in 20141
23
45
6
Imm
igra
tion
1 2 3 4 5Same sex marriage
Figure 20: Positions of National Parties within Greens-EFA in 2014

12
12
34
56
Euro
pean
Inte
grat
ion
1 2 3 4 5More welfare even at cost of higher taxes?
Figure 21: Positions of National Parties within ECR in 2014
12
34
56
Imm
igra
tion
1 2 3 4 5Same sex marriage
Figure 22: Positions of National Parties within ECR in 2014
12
34
56
Euro
pean
Inte
grat
ion
1 2 3 4 5More welfare even at cost of higher taxes?
Figure 23: Positions of National Parties within EUL-NGL in 20141
23
45
6
Imm
igra
tion
1 2 3 4 5Same sex marriage
Figure 24: Positions of National Parties within EUL-NGL in 2014

13
12
34
56
Euro
pean
Inte
grat
ion
1 2 3 4 5More welfare even at cost of higher taxes?
Figure 25: Positions of National Parties within EFFD in 2014
12
34
56
Imm
igra
tion
1 2 3 4 5Same sex marriage
Figure 26: Positions of National Parties within EFFD in 2014
12
34
56
Euro
pean
Inte
grat
ion
1 2 3 4 5More welfare even at cost of higher taxes?
Figure 27: Positions of National Parties within ENF in 20141
23
45
6
Imm
igra
tion
1 2 3 4 5Same sex marriage
Figure 28: Positions of National Parties within ENF in 2014

14