zurich open repository and main library year: 20162016)-asbmb-1670.full.pdfralph schlapbach**,...
TRANSCRIPT

Zurich Open Repository andArchiveUniversity of ZurichMain LibraryStrickhofstrasse 39CH-8057 Zurichwww.zora.uzh.ch
Year: 2016
Natural genetic variation differentially affects the proteome andtranscriptome in Caenorhabditis elegans
Kamkina, Polina; Snoek, L Basten; Grossmann, Jonas; Volkers, Rita J M; Sterken, Mark G; Daube,Michael; Roschitzki, Bernd; Fortes, Claudia; Schlapbach, Ralph; Roth, Alexander; von Mering,
Christian; Hengartner, Michael O; Schrimpf, Sabine P; Kammenga, Jan E
Abstract: Natural genetic variation is the raw material of evolution and influences disease developmentand progression. An important question is how this genetic variation translates into variation in proteinabundance. To analyze the effects of the genetic background on gene and protein expression in thenematode Caenorhabditis elegans, we quantitatively compared the two genetically highly divergent wild-type strains N2 and CB4856. Gene expression was analyzed by microarray assays, and proteins werequantified using stable isotope labeling by amino acids in cell culture. Among all transcribed genes,we found 1,532 genes to be differentially transcribed between the two wild types. Of the total 3,238quantified proteins, 129 proteins were significantly differentially expressed between N2 and CB4856.The differentially expressed proteins were enriched for genes that function in insulin-signaling and stress-response pathways, underlining strong divergence of these pathways in nematodes. The protein abundanceof the two wild-type strains correlates more strongly than protein abundance versus transcript abundancewithin each wild type. Our findings indicate that in C. elegans only a fraction of the changes in proteinabundance can be explained by the changes in mRNA abundance. These findings corroborate with theobservations made across species.
DOI: https://doi.org/10.1074/mcp.M115.052548
Posted at the Zurich Open Repository and Archive, University of ZurichZORA URL: https://doi.org/10.5167/uzh-124841Journal ArticlePublished Version
Originally published at:Kamkina, Polina; Snoek, L Basten; Grossmann, Jonas; Volkers, Rita J M; Sterken, Mark G; Daube,Michael; Roschitzki, Bernd; Fortes, Claudia; Schlapbach, Ralph; Roth, Alexander; von Mering, Chris-tian; Hengartner, Michael O; Schrimpf, Sabine P; Kammenga, Jan E (2016). Natural genetic variationdifferentially affects the proteome and transcriptome in Caenorhabditis elegans. Molecular CellularProteomics, 15(5):1670-1680.DOI: https://doi.org/10.1074/mcp.M115.052548

Natural Genetic Variation Differentially Affectsthe Proteome and Transcriptome inCaenorhabditis elegans*□S
Polina Kamkina‡§¶, L. Basten Snoek¶�, Jonas Grossmann**, Rita J. M. Volkers�,Mark G. Sterken�, Michael Daube‡, Bernd Roschitzki**, Claudia Fortes**,Ralph Schlapbach**, Alexander Roth‡, Christian von Mering‡, Michael O. Hengartner‡,Sabine P. Schrimpf‡ ‡‡, and Jan E. Kammenga�‡‡
Natural genetic variation is the raw material of evolutionand influences disease development and progression. Animportant question is how this genetic variation translatesinto variation in protein abundance. To analyze the effectsof the genetic background on gene and protein expres-sion in the nematode Caenorhabditis elegans, we quanti-tatively compared the two genetically highly divergentwild-type strains N2 and CB4856. Gene expression wasanalyzed by microarray assays, and proteins were quan-tified using stable isotope labeling by amino acids in cellculture. Among all transcribed genes, we found 1,532genes to be differentially transcribed between the twowild types. Of the total 3,238 quantified proteins, 129 pro-teins were significantly differentially expressed betweenN2 and CB4856. The differentially expressed proteinswere enriched for genes that function in insulin-signalingand stress-response pathways, underlining strong diver-gence of these pathways in nematodes. The protein abun-dance of the two wild-type strains correlates morestrongly than protein abundance versus transcript abun-dance within each wild type. Our findings indicate that inC. elegans only a fraction of the changes in protein abun-dance can be explained by the changes in mRNA abun-dance. These findings corroborate with the observationsmade across species. Molecular & Cellular Proteomics15: 10.1074/mcp.M115.052548, 1670–1680, 2016.
Natural genetic variation in gene expression shapes thediversity in phenotypic traits and is the raw material for evo-lutionary processes (1). Variation in gene expression can bevery extensive across individuals with different genotypes.The additive effects (narrow-sense heritability) of independent
loci on gene expression variation can reach 35% in humans(2). The broad-sense heritable variation in gene expressionhas been estimated to be up to 70% in the nematodeCaenorhabditis elegans (3, 4) and up to 80% in yeast (5). Thishigh heritability and the ability to construct genetically segre-gating populations facilitate mapping of gene expression reg-ulation and subsequent detection of expression quantitativetrait loci (eQTL)1 (5–11). eQTLs are genomic regions contain-ing a polymorphism associated with variation in transcriptabundance between genotypes (12). eQTL analysis providesinsight into the underlying genetic architecture of complextraits and is valuable for the identification of pathways andgene networks (10, 13–15). A key question is whether geneexpression variation is translated into variation at the pro-teome level and whether it affects functionally relevant pro-teins. Genetic model species provide an ideal platform toexplore the relationship between gene expression variationand variation at the proteome level due to their tractability.Although it is well established that there is a correlation be-tween transcript and protein abundances, the relationshipbetween natural variation in gene expression and variation inprotein abundance is less well understood. The proteomeprovides information required to understand the functioning ofcells (16), and combined with natural genetic variation, itallows for mapping of protein expression regulators (17). Inyeast, gene expression variation in 354 genes between ge-netically different strains was found to lead to variation inprotein abundance for a limited set of proteins reflectingmainly transcription-independent mechanisms (18). In mice,the natural variation of transcript abundance and protein lev-els among inbred strains correlates slightly (0.27) (19). Overhalf of the identified eQTLs in yeast contributed to changes inprotein levels of regulated genes, but several protein-QTLsdid not correlate with their cognate transcript levels (20).
From the ‡Institute of Molecular Life Sciences, University of Zurich,8057 Zurich, Switzerland; §Ph.D. Program in Molecular Life SciencesZurich, 8057 Zurich, Switzerland; �Laboratory of Nematology, Wage-ningen University, Wageningen 6708 PB, The Netherlands; **Func-tional Genomics Center Zurich, University of Zurich and Swiss Fed-eral Institute of Technology Zurich, 8057 Zurich, Switzerland
Received June 10, 2015, and in revised form, February 22, 2016Published, MCP Papers in Press, March 4, 2016, DOI 10.1074/
mcp.M115.052548
1 The abbreviations used are: eQTL, expression quantitative traitloci; FDR, false discovery rate; GO, gene ontology; iBAQ, intensity-based absolute quantification; L4, larval stage 4; SILAC, stable iso-tope labeling by amino acids in cell culture; ACN, acetonitrile.
Research© 2016 by The American Society for Biochemistry and Molecular Biology, Inc.This paper is available on line at http://www.mcponline.org
crossmark
1670 Molecular & Cellular Proteomics 15.5

C. elegans is an ideal model organism to analyze the effectof the genetic background on its transcriptome (8, 9, 21–23)and proteome because comprehensive proteome catalogueshave been generated (24, 25). The quantitative proteomecomparison in C. elegans and Drosophila melanogastershowed that the interspecies’ protein abundance correlationwas higher than the intraspecies’ correlation between proteinand mRNA abundance. This suggests that protein levels areunder evolutionary selection acting post-transcriptionally (26).In a recent interspecies comparison of the two nematodes C.elegans and Caenorhabditis briggsae, the protein and tran-script changes were found to be conserved throughout de-velopment (27).
To complete these comparative interspecies expressionanalyses with an intraspecies analysis and to investigate theeffect of natural genetic variation from the transcriptome tothe proteome, the genetically highly divergent C. eleganswild-type strains, N2 (isolated in Bristol, UK) and CB4856(from Hawaii), were compared quantitatively. Transcriptomedata were acquired by microarray analysis, and for quantita-tive proteome analysis, the SILAC labeling method was used,which was recently established for C. elegans (28, 29). Weanalyzed animals at the developmental larval stage 4 (L4),because at this stage the largest differences in gene expres-sion levels were detected between N2 and CB4856 (3, 4,30–32). The genomes of these two wild-type strains, as wellas polymorphisms between them, have been characterizedextensively (33–40). These genetic polymorphisms often leadto gene expression differences, which are playing a role in awhole range of phenotypic differences between N2 andCB4856, such as life history traits (4, 41–44), behavior (40,45–49), and life span (9, 41, 50). Here, we asked whethernatural genetic variation causes variation in protein levelsbetween N2 and CB4856 and whether it is related to variationin transcript abundance.
Using SILAC on three independent biological replicates, wequantified a total of 3,238 proteins, 2,485 proteins were iden-tified in at least two biological replicates. We found 129 pro-teins to be significantly differentially expressed between N2and CB4856 with at least a 1.3-fold change in abundance anda p value � 0.000457. They were enriched for genes thatfunction in insulin-signaling and stress-response pathways,underlining strong divergence of these pathways in nema-todes. The protein abundance of the two wild-type strainscorrelated more strongly than the protein abundance versustranscript abundance within each wild type.
EXPERIMENTAL PROCEDURES
C. elegans Strains and Culture Conditions—The two C. eleganswild-type strains N2 (Bristol) and CB4856 (Hawaii) were grown at20 °C on 9-cm NGM agar plates without peptone (3 g/liter NaCl, 20g/liter bacto-agar, 5 mg/liter cholesterol, 25 mM K2PO4, 1 mM MgSO4,1 mM CaCl2) and with a lawn of Escherichia coli (OP50 strain) bacteria.
Transcriptome Comparison—For RNA isolation we used aMaxwell� 16 AS2000 instrument with a Maxwell� 16 LEV simplyRNA
tissue kit (both from Promega Corp., Madison, WI). The mRNA isola-tion was preceded by a modified lysis step. In short, 200 �l ofhomogenization buffer, 200 �l of lysis buffer, and 10 �l of a 20 mg/mlstock solution of proteinase K were added to each sample. Thesamples were then incubated for 10 min at 65 °C, 1000 rpm in aThermomixer (Eppendorf, Hamburg, Germany). After cooling on icefor 1 min, the samples were pipetted into the cartridges, and theprotocol as recommended by Promega was continued. After mRNAisolation, the “Two-color Microarray-based Gene Expression Analy-sis, Low Input Quick Amp Labeling” protocol, version 6.0, was fol-lowed, starting from step 5 (4, 30, 31).
The microarrays used were C. elegans (V2) Gene Expression Mi-croarray 4�44K slides, manufactured by Agilent Technologies, SantaClara, CA. mRNA isolation, labeling with cyanine-3 and cyanine-5,and hybridization were performed as recommended by Agilent. Themicroarrays were scanned using an Agilent High Resolution C Scan-ner, using the settings as recommended. Data were extracted withthe Agilent Feature Extraction Software version 10.5, following themanufacturer’s guidelines.
For processing the data of the RNA microarrays, the “Limma”package for the “R” environment was used. No background correc-tion of the RNA-array data was performed as recommended by Ref.51. For the “within-array normalization of the RNA-array data” theLoess method was used, and for the “between-array normalization”the Quantile method was used. The obtained normalized intensitieswere used for further analysis.
SILAC Labeling—E. coli AT713 strain (lysine/arginine auxotrophic;E. coli Genetic Stock Center, CGSC number 4529, Yale) was grown inM9 Minimal Salts Medium (30.0 g of Na2HPO4, 15.0 g of KH2PO4,2.5 g of NaCl, 5.0 g of NH4Cl, H2O to 1 liter) supplemented with 150mg/liter of either light (Arg-0, Lys-0) or heavy amino acids (Arg-10,Lys-8; Cambridge Isotope Laboratories). The cultures were kept for 2days at 37 °C on a Lab-Therm Kuhner orbital shaker at 230 rpm witha shaking diameter of 5 cm and harvested at an A600 between 1.5 and3.0. Bacteria were pelleted at 1,800 � g for 15 min at 4 °C; thesupernatant was aspirated, and aliquots of 50 ml were frozen at�20 °C.
Adult N2 and CB4856 worms were bleached, and �20,000 larvalstage 1 animals were transferred to NGM plates freshly seeded withlight or heavy labeled bacteria at 20 °C. For the first biological repli-cate, CB4856 animals were fed with heavy labeled AT713. For thesecond and third replicates, N2 animals were fed with heavy labeledAT713. Nematode populations were grown for two generations, andproteins were isolated from animals at L4. To determine the labelingefficiency, N2 heavy protein extracts were analyzed on an LTQ Or-bitrap XL mass spectrometer (Thermo Scientific). The mgf files weresearched against the C. elegans 6,239 database (07/03/2010, data-base (07/03/2010, Functional Genomics Center Zurich), using theMascot software. The library was downloaded from the UniProtdatabase, contains 24,362 entries, and was supplemented in-house with 259 common MS contaminants. In total, 3,908 assignedpeptide spectrum matches were analyzed with a score higher than30, which yielded 1,562 peptides. Of these, 1,552 (99.6%) peptideswere heavy labeled.
Protein Isolation, SDS-PAGE, Protein Digestion—To extract pro-teins, worm samples were homogenized with glass beads (G1277acid-washed beads, diameter of 212–300 �m, Sigma-Aldrich) infreshly prepared cell lysis buffer (8 M urea, 5% 1 M Tris-HCl, pH 8.3)in a ratio of 1:1:2 (worms/beads/buffer) at 4 °C for 30 s at 5 m/s fourtimes (FastPrep�-24, MP Biomedicals). The lysates were centrifugedthree times at 20,000 � g for 10 min at room temperature to removedebris. Protein concentration in the supernatant was determined us-ing the Bradford reagent (Sigma-Aldrich), and 1 �g of each proteinsample was checked for equimolarity by SDS-PAGE.
N2 and CB4856 Proteome and Transcriptome Comparison
Molecular & Cellular Proteomics 15.5 1671

The L4 animal lysates of N2 and CB4856 were combined in a 1:1ratio. Protein disulfide bridges were reduced with 5 mM dithiothreitol(DTT) at 60 °C for 30 min and alkylated with 15 mM iodoacetamide inthe dark at 37 °C for 1 h. 600 �g of proteins were digested with trypsin(modified sequencing grade porcine, Promega) in a ratio of 1:50 w/wovernight at 37 °C. Samples were kept frozen at �20 °C until furtherprocessing.
HPLC Fractionation of Peptides and ZipTip C18 Sample CleanUp—Peptide samples were dried in a SpeedVac concentrator andresuspended in solvent A (5% ACN, 20 mM K2HPO4, pH 11) to a finalurea concentration below 2 M. The pH was adjusted to 11 with 20%KOH, and the peptides were loaded on a 150 � 4.6-mm YMC TriartC18 column filled with 5 �m of silica beads (YMC Europe GmbH) at aflow rate of 1 ml/min using an Agilent 1100 liquid chromatographysystem (Agilent Technologies Inc.). Peptides were separated by alinear gradient from 2 to 50% of solvent B (50% ACN, 20 mM K2HPO4,pH 11) within 50 min. In total, 47 fractions were collected and pooledinto 10 fractions based on the intensity measured by a UV-lightdetector at 214 nm. The reproducibility of the separation was con-trolled by running twice a self-mixed standard peptide mixture(adrenocorticotropin(1–16), angiotensinogen(1–14), bradykinin(2–9), leu-enkephalin, substance P, and vasopressin). Pooled fractionswere vacuum-centrifuged until complete dryness and resuspendedin 50 �l of 5% ACN, 0.1% TFA. Salts were removed using ZipTipC18 pipette tips (Millipore Corp.), and the peptides were eluted with15 �l of 60% ACN, 0.1% TFA. Samples were dried and re-dissolvedin 12 �l of 3% ACN, 0.1% formic acid to a final peptide concen-tration of 0.4 �g/�l.
LC-MS/MS Analysis—LC-MS/MS was performed on a reversed-phase nano-LC system (Eksigent) at pH 3. Peptides were separatedon a self-packed reverse-phase column (75 �m � 10 cm) packedwith C18 beads (Magic C18, AQ, 3 �m, 200 Å, Bischoff GmbH,Leonberg, Germany) at a flow rate of 200 nl/min. The column wasequilibrated with 95% solvent A (0.1% formic acid in water) and 5%solvent B (0.1% formic acid in ACN). Peptides were eluted using thefollowing gradient: 0–1 min; 5–9% B, 1–56 min; 9–40% B, 56–60min; 40–50% B and 60–64 min; 50–95% B. Peptides were ana-lyzed on an LTQ Orbitrap XL mass spectrometer in the data-de-pendent acquisition mode. High accuracy mass spectra were ac-quired in the mass range of 300–1,800 m/z. In parallel, up to sixdata-dependent MS/MS were recorded in the linear ion trap of themost intense ions with charge state 2�, 3�, and 4� using collision-induced dissociation. Target ions already selected for MS/MS weredynamically excluded for 60 s. Each sample was measured twice.The second analysis was performed with an exclusion list contain-ing all precursor values of the first analysis with an elution timewindow of �2.5 min.
MaxQuant Analysis—Data acquired on the LTQ Orbitrap XL MSwere analyzed with MaxQuant version 1.3.0.5 (Max Planck Institute ofBiochemistry Munich (52), searching the C. elegans 6,239 database atthe Functional Genomics Center Zurich, Zurich. Search parameterswere as follows: cysteine carbamidomethylation as fixed modifica-tion, protein N-terminal acetylation and methionine oxidation as vari-able modifications; SILAC labeling (Arg-10, Lys-8) as heavy labels;enzyme trypsin; two missed cleavages were allowed; and a minimumof six amino acids per identified peptide were required. The precursorion mass tolerance was set to 20 ppm, and the fragment masstolerance was set to 0.5 Da. The peptide FDR was set to 1%; proteinFDR was set to 5%. In total, 40 raw data files were generated for everybiological replicate and combined for database searching with thematch between runs set to 2 min. Proteins with all shared peptideswere combined into one protein group. The “Majority Protein IDs”column was used for protein assignments. The annotated MS/MSspectra with the lowest posterior error probability for single peptide
identifications were extracted from 2,485 protein dataset using Rpackage protViz (53) and are shown in supplemental Figs. S3–S5. Thelists of corresponding single peptides are included in supplementalTables S6–S8 for all three replicates.
Correction of Arginine-to-Proline Conversion—To estimate the ef-fect of the arginine-to-proline conversion, all raw files were analyzedwith the Progenesis QI for Proteomics software (Nonlinear Dynamics).The MS1 m/z feature maps filtered for the charge states from 2 to 7were generated using the automatic method for peak picking with asensitivity value of 5. The number of fragment ion counts was limitedto 200, and deisotoping and charge deconvolution were applied. Thegenerated mgf files were searched against the C. elegans databasewith Mascot for the identification of heavy proline peaks. The precur-sor mass tolerance was set to 10 ppm, and the fragment ion masstolerance was set to 0.6 Da. Only fully tryptic termini with two missedcleavages were considered. The isotopic labeling of arginine (Arg-10)and lysine (Lys-8), heavy proline (Pro-6), heavy glutamate (Glu-6)labels and methionine oxidation were set as variable modifications.Cysteine carbamidomethylation was set as fixed modification. Theanalysis yielded 301 peptides with heavy proline and heavy arginineand/or heavy lysine. Based on this, the contribution of the heavyproline signal to the heavy arginine-lysine signal was estimated to20% on average for peptides carrying one proline (supplemental Fig.1A). This contribution to the signal intensity was proportional to thenumber of prolines per peptide (supplemental Fig. 1, A and B). Usinga Perl script kindly provided by Jacob D. Jaffe (Broad Institute,Cambridge, MA), new protein group log2 heavy/light (H/L) ratios werecalculated. In a first step, the intensity values of heavy peptides withprolines were corrected by adding to the measured signal intensity avalue, which corresponds to 20% � n of heavy peptides abundance,where n is the number of prolines in the peptide. In a second step,adjusted peptide log2 H/L ratios were built and combined into theprotein groups based on the MaxQuant protein group identifications.For each protein group median log2 H/L ratios were calculated. Theprotein group log2 H/L median ratios were calculated separately foreach biological replicate; median was normalized to 1 and used forfurther analysis (supplemental Table 2). The effect of the arginine-to-glutamate conversion was negligible, because only 15 peptides iden-tified had a heavy glutamate with heavy arginine and/or heavy lysine.Corrected peptide intensity values were used to calculate the cor-rected iBAQ values (intensity-based absolute quantification). The C.elegans database was digested in silico with trypsin using the Skylinesoftware (version 1305, MacCoss Lab (54)), and the number of trypticpeptides per protein was extracted. The length of the peptides rangedfrom 6 to 30 amino acids; the N-terminal amino acids and potentialragged ends were not excluded. Using an in-house R function, cor-rected intensities of peptides per protein were summed up and di-vided by the corresponding number of tryptic peptides. Heavy andlight iBAQ values were calculated separately and normalized using anintersect of 0 and slopes of 1.01896, 1.00456, and 1.00487 for thefirst, second, and third replicates, respectively. The proline correctedlog2 iBAQ and protein abundance ratios correlated well with theuncorrected ratios (0.66 and 0.71, respectively), and the correlationsfor the differentially expressed proteins were even stronger (�0.9,supplemental Fig. 1, C and D). Proline corrected heavy and lightpeptide intensities correlated well between the replicates (r �0.74,see supplemental Fig. 2).
Experimental Design and Statistical Rationale—mRNAs were quan-tified in three biological replicates. In total, six worm samples wereanalyzed, three for each strain (N2 and CB4856). Gene expressiondifferences between the genotypes were determined by a linearmodel using “log2 hybridization intensities � genotype � error.”Correction for multiple testing was done using a permutation deter-mined threshold (3, 4, 31, 55). For each probe the values were
N2 and CB4856 Proteome and Transcriptome Comparison
1672 Molecular & Cellular Proteomics 15.5

permuted once and analyzed by the same model. The FDR rate wasset to a ratio of false to true positives of 0.013, which occurred atp � � 0.0032 (�log10(p) � 2.5). False positive was the number ofgenes with a significant p value from the permuted set, and truepositives were the number of genes with significant values from theoriginal set. Proteins were quantified in three biological replicates,including label switching. For every biological replicate, two biochem-ical and two technical replicates were analyzed. In total, six combinedprotein samples were measured. To identify proteins that are differ-entially expressed between N2 and CB4856, SILAC data were filteredfor proteins that were quantified at least twice with at least a 1.3-folddifference in abundance (the biological significance of the 1.3-foldchange cutoff has been shown by Ref. 56, and a p value � 0.000457(z-test, permutation determined threshold with the FDR cutoff of0.05)).
Enrichment Analysis—The enrichment analyses were undertakenusing the following databases with annotations. Gene ontologieswere downloaded from Ensemble (version 83) using the BioMartpackage in R. The enrichment of GO terms was analyzed using thetopGO package from the bioconductor suite in R (58). GO terms withless than two annotated genes were excluded from the analysis. Theenrichments were computed using the Fisher test. The elim algorithmwas applied to account for the underlying GO graph topology (57).The anatomy terms, protein domains, and gene classes were ob-tained via WormMart of the WS220 WormBase release. Genes fromWormBook chapters were obtained from the 2012 version of Worm-Book. eQTLs (8, 9) were obtained from WormQTL (21–23). KEGGpathways were obtained from release 65.0 of the Kyoto Encyclopediaof Genes and Genomes. These were tested for the enrichments by ahypergeometric test using R. Specific gene sets were obtained fromsupplementary data of the following papers: the aging set (59);DAF-16 sets (60, 61); and the DAF-16/PQM-1 set (62). The enrich-ments for specific gene sets were performed using Benjamini-Hoch-berg multiple testing corrected two-sided Fisher exact (aging andDAF-16 datasets) and hypergeometric tests (DAF-16/PQM-1 data-set). Note that the hypergeometric test and one-sided Fisher exacttest are basically the same tests (63).
Data Storage—The transcript profiles and protein levels werestored in WormQTL (21–23) and can be accessed on line.
The MS proteomics data have also been deposited to the Pro-teomeXchange Consortium (64) via the PRIDE partner repository withthe dataset identifier PXD002010.
RESULTS
Transcriptome Comparison—As the strongest mRNA ex-pression differences between N2 and CB4856 were observedat stage L4 (3, 4, 30–32), we measured the genome-widetranscription levels of three biological replicates of L4 stagesynchronized larvae using microarrays. We found 1,532 genesto be differentially expressed (7.4%, �log10(p) 2.5; FDR �
0.013) of which 712 showed higher expression in CB4856 and820 higher expression levels in N2 (Fig. 1). Differentially ex-pressed genes were enriched for groups of genes involved inbinding of proteins, sugars, and DNA, like f-box, math/bath/btb, clec, and nhr genes (supplemental Table 4) as observedpreviously (3, 4, 32). These groups of genes are highly poly-morphic between wild isolates (4, 33, 34). No major differ-ences in genes linked to L4 development (30) could be de-tected between CB4856 and N2. We identified specificenrichments between the genes expressed higher in N2 com-pared with CB4856 (supplemental Table 4). For example, the
GO-term “monooxygenase activity” was specifically enrichedfor genes expressed higher in CB4856. Because many of thegene expression differences between CB4856 and N2 arecaused by their genetic differences, most of these will alsobe present in recombinant offspring. The loci causal for geneexpression differences can be observed as eQTLs, whichyield information about the genetic and regulatory architec-ture of gene expression. As expected, the group of 1,532genes differentially expressed between CB4856 and N2 washighly enriched for genes with eQTLs that were previouslyidentified in these recombinant inbred line populations (6, 8, 9)(928/1,532; p �� 10�100 (8), 431/1,532; p �� 10�100 (9)). Toinvestigate whether these mRNA expression level differencesare also found on the protein level, we measured proteinabundance in both strains.
Protein Abundances Are Very Similar in N2 and CB4856—We quantitatively compared protein abundances between thetwo C. elegans wild-type strains N2 and CB4856 in the L4stage using SILAC and mass spectrometry. Protein extractswere analyzed in three biological replicates, including labelswitching. Almost complete labeling (99.6%) of the secondgeneration L4 worms was observed. In total, we quantified3,238 distinct proteins, ranging from 2,536 to 2,622 proteins
0
1
2
3
4
5
6
7
8
-9 -7 -5 -3 -1 1 3 5 7 9
p < 0.0032
mRNA ovelapping with protein dataset (2,467)Other mRNA quantified (18,347)
Sig
nific
ance
( -
log 10
(p
- va
lue)
)
log2 CB4856/N2 mRNA abundance ratio-8 -6 -4 -2 0 2 4 6 8
FIG. 1. Volcano plot of mRNAs abundance differences be-tween N2 and CB4856. Differentially expressed mRNAs (1,532;7.4%) are shown in solid gray and green dots (threshold: p � 0.003,FDR � 0.013, indicated by the violet line). Unique mRNAs overlap-ping with the protein dataset (2,467; 11.9%) are shown in green,and genes for which only mRNA was quantified (18,347; 88.1%) areshown in gray.
N2 and CB4856 Proteome and Transcriptome Comparison
Molecular & Cellular Proteomics 15.5 1673

per SILAC experiment. 2,002 proteins (61.8%) were quantifiedin all three biological replicates and 2,485 proteins in at leasttwo (protein FDR 5%, Fig. 2A, and supplemental Table 1). Wecompared our SILAC data to the integrated PaxDB dataset(65), which includes protein abundance data generated us-
ing various fractionation methods. We quantified 24.5% ofthe C. elegans proteins presented in PaxDB (13,224) in N2and CB4856, distributed over 6 orders of magnitude, with aclear bias for high abundance proteins (Fig. 2B). Proteinabundance between the two strains correlated very strongly
Nu
mb
er
of p
rote
ins
0
100
200
300
400
500
600
700
800
log2 protein abundance (ppm)
PaxDBSILAC data
291 224
156
154173
2,002
238
1st biol. repl. (∑ = 2,622)3rd biol. repl. (∑ = 2,567)
2nd biol. repl. (∑ = 2,536)> 1 biol. repl. (∑ = 2,485)
∑ prot. total = 3,238
A B
−10 −8 −6 −4 −2 0 2 4 6 8 10 12 14 16
C
0
15
30
45
60
75
90
105
120
135
150
165
180
195
210
225
240
255
270
285
300
315
330
-5 -4 -3 -2 -1 0 1 2 3 4 5
p < 0.000457
|FC| > 1.3
Significant changes (129)Non-significant changes (2,356)
0
5
10
15
20
25
30
35
40
-5 -2 0 2 4-4 -3 -1 1 3 5
log2 CB4856/N2 protein abundance ratio
Sig
nific
ance
( -
log 10
(p
- va
lue)
)
FIG. 2. Proteins quantified in three CB4856/N2 SILAC experiments. A, Venn diagram of the quantified proteins in three biologicalreplicates. In total 3,238 proteins were quantified, and 2,002 (61.8%) proteins were quantified in all three biological replicates. Proteinsquantified in at least two biological replicates (2,485; 76.7%) in the pink sections were used for further analysis. B, log2 MS intensity distributionof the proteins quantified at least twice (pink section) compared with the entire C. elegans proteome. C, volcano plot of protein abundancedifferences between N2 and CB4856. Differentially expressed proteins (129; 5.2%) are shown in violet (threshold: p � 0.000457, fold-change1.3), and non-significant changes (2,356; 94.8%) are shown in gray. Inset represents the enlarged area from a p value of 0.95 to e�40. Proteinswith a p value of 0 were set to e�290 for plotting.
N2 and CB4856 Proteome and Transcriptome Comparison
1674 Molecular & Cellular Proteomics 15.5

(r � 0.99, Fig. 3C). To identify proteins that are differentiallyexpressed between N2 and CB4856, the combined SILACdata (3,238 proteins) were filtered for proteins that were
quantified at least twice (2,485 proteins) with at least a1.3-fold difference in abundance and a p value � 0.000457(z-test, FDR � 0.05, Fig. 2C). Using these criteria, 129
FIG. 3. Correlations of mRNA and protein abundance between and within N2 and CB4856. A, mRNA versus protein abundance. CB4856in yellow and N2 in green, orange, and dark green dots represent the 129 differentially expressed proteins in CB4856 and N2. B, mRNAabundance of N2 compared with CB4856. The 129 differentially expressed proteins are shown in violet; 2,338 genes for which other uniquemRNAs overlap with proteins are shown in yellow, and 18,347 genes for which only mRNA levels were quantified are shown in gray. C, proteinabundance of N2 compared with CB4856. The 129 differentially expressed proteins are shown in violet, and other 2,356 quantified proteinsare shown in gray. D, protein/mRNA ratio of N2 compared with CB4856. The 129 differentially expressed proteins are shown in violet, and other2,352 quantified proteins (isoforms included) overlapping with mRNA dataset are shown in gray. r129 is the Pearson correlation coefficient forthe 129 differentially expressed proteins; r2,338 is the Pearson correlation coefficient for other unique mRNAs overlapping with the proteindataset. For different protein isoforms, the same mRNA value was used for plotting. rT is the Pearson correlation coefficient for all genesquantified at mRNA and/or protein levels. (a.u., arbitrary units).
N2 and CB4856 Proteome and Transcriptome Comparison
Molecular & Cellular Proteomics 15.5 1675
proteins (5.2%) were found to be differentially expressedbetween the strains distributed over 5 orders of magnitudein expression. 70 proteins were up-regulated, and 59 pro-teins were down-regulated (Fig. 5).
Local and Distant Regulation of the Conserved mRNA andProtein Expression—In total, 2,481 quantified proteins (14proteins with two isoforms each included) overlapped with2,467 corresponding unique mRNAs in both strains (supple-mental Table 3). The mRNA and protein expression patternsof N2 and CB4856 were very similar, whereas the correlationbetween mRNA and protein abundances within the strainswas quite variable (r � 0.54 for both, Fig. 3A). By contrast,mRNA abundance, protein abundance, as well as protein-to-mRNA ratios correlated strongly between the strains (r 0.97,Fig. 3, B–D). This suggests that for the detected genes bothtranscriptional and translational regulation of gene expressionare well conserved between N2 and CB4856. The conserva-tion of protein expression was also observed between dis-tantly related species (26).
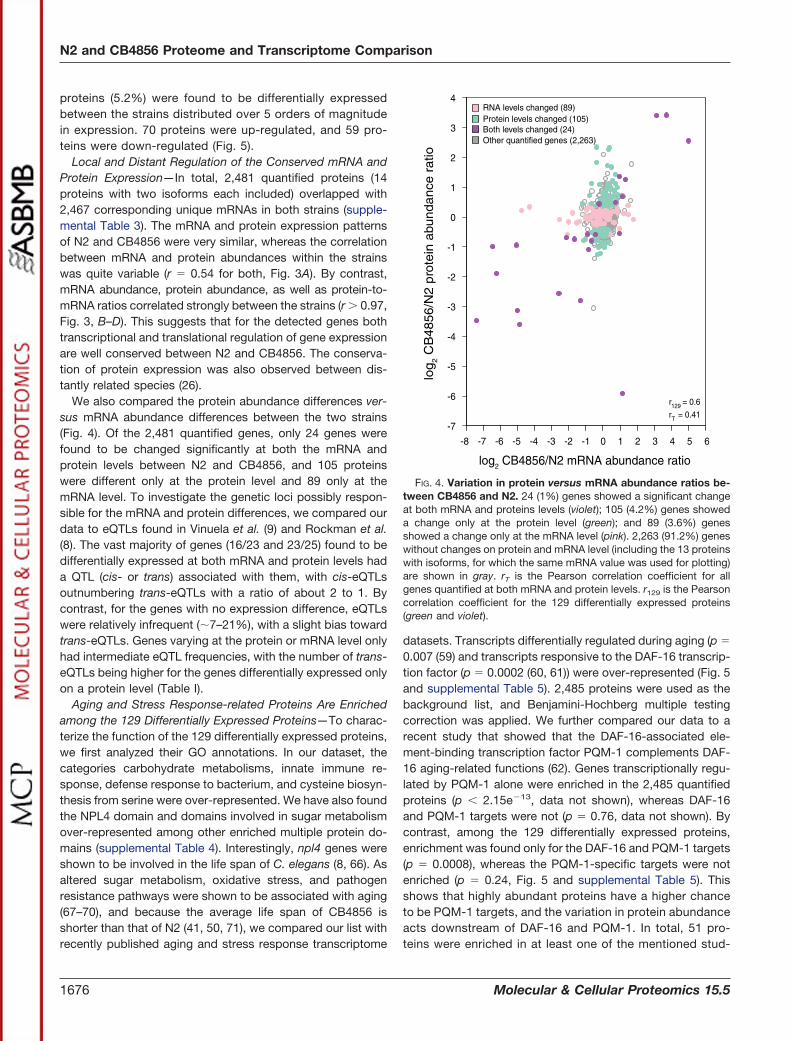
We also compared the protein abundance differences ver-sus mRNA abundance differences between the two strains(Fig. 4). Of the 2,481 quantified genes, only 24 genes werefound to be changed significantly at both the mRNA andprotein levels between N2 and CB4856, and 105 proteinswere different only at the protein level and 89 only at themRNA level. To investigate the genetic loci possibly respon-sible for the mRNA and protein differences, we compared ourdata to eQTLs found in Vinuela et al. (9) and Rockman et al.(8). The vast majority of genes (16/23 and 23/25) found to bedifferentially expressed at both mRNA and protein levels hada QTL (cis- or trans) associated with them, with cis-eQTLsoutnumbering trans-eQTLs with a ratio of about 2 to 1. Bycontrast, for the genes with no expression difference, eQTLswere relatively infrequent (�7–21%), with a slight bias towardtrans-eQTLs. Genes varying at the protein or mRNA level onlyhad intermediate eQTL frequencies, with the number of trans-eQTLs being higher for the genes differentially expressed onlyon a protein level (Table I).
Aging and Stress Response-related Proteins Are Enrichedamong the 129 Differentially Expressed Proteins—To charac-terize the function of the 129 differentially expressed proteins,we first analyzed their GO annotations. In our dataset, thecategories carbohydrate metabolisms, innate immune re-sponse, defense response to bacterium, and cysteine biosyn-thesis from serine were over-represented. We have also foundthe NPL4 domain and domains involved in sugar metabolismover-represented among other enriched multiple protein do-mains (supplemental Table 4). Interestingly, npl4 genes wereshown to be involved in the life span of C. elegans (8, 66). Asaltered sugar metabolism, oxidative stress, and pathogenresistance pathways were shown to be associated with aging(67–70), and because the average life span of CB4856 isshorter than that of N2 (41, 50, 71), we compared our list withrecently published aging and stress response transcriptome
datasets. Transcripts differentially regulated during aging (p �
0.007 (59) and transcripts responsive to the DAF-16 transcrip-tion factor (p � 0.0002 (60, 61)) were over-represented (Fig. 5and supplemental Table 5). 2,485 proteins were used as thebackground list, and Benjamini-Hochberg multiple testingcorrection was applied. We further compared our data to arecent study that showed that the DAF-16-associated ele-ment-binding transcription factor PQM-1 complements DAF-16 aging-related functions (62). Genes transcriptionally regu-lated by PQM-1 alone were enriched in the 2,485 quantifiedproteins (p � 2.15e�13, data not shown), whereas DAF-16and PQM-1 targets were not (p � 0.76, data not shown). Bycontrast, among the 129 differentially expressed proteins,enrichment was found only for the DAF-16 and PQM-1 targets(p � 0.0008), whereas the PQM-1-specific targets were notenriched (p � 0.24, Fig. 5 and supplemental Table 5). Thisshows that highly abundant proteins have a higher chanceto be PQM-1 targets, and the variation in protein abundanceacts downstream of DAF-16 and PQM-1. In total, 51 pro-teins were enriched in at least one of the mentioned stud-
-7
-6
-5
-4
-3
-2
-1
0
1
2
3
4
-8 -6 -4 -2 0 1 2 3 4 5 6-7 -5 -3 -1
log2 CB4856/N2 mRNA abundance ratio
log
2 C
B4856/N
2 p
rote
in a
bundance
ratio
RNA levels changed (89)Protein levels changed (105)Both levels changed (24)Other quantified genes (2,263)
r = 0.6129
r = 0.41T
FIG. 4. Variation in protein versus mRNA abundance ratios be-tween CB4856 and N2. 24 (1%) genes showed a significant changeat both mRNA and proteins levels (violet); 105 (4.2%) genes showeda change only at the protein level (green); and 89 (3.6%) genesshowed a change only at the mRNA level (pink). 2,263 (91.2%) geneswithout changes on protein and mRNA level (including the 13 proteinswith isoforms, for which the same mRNA value was used for plotting)are shown in gray. rT is the Pearson correlation coefficient for allgenes quantified at both mRNA and protein levels. r129 is the Pearsoncorrelation coefficient for the 129 differentially expressed proteins(green and violet).
N2 and CB4856 Proteome and Transcriptome Comparison
1676 Molecular & Cellular Proteomics 15.5

ies, and 18 proteins were identified in at least two of them(Fig. 5 and supplemental Table 5). Together, these observa-tions suggest that the 129 differentially expressed proteinsmight contribute to the differences in life span of CB4856and N2.
The 129 differentially expressed proteins were also en-riched for eQTLs identified in aging worms (9) (47 proteins,p �� 1e�16) and for stage-specific eQTLs (8) (62 proteins,
p �� 1e�16) (Table I). Eleven proteins were found to have aneQTL under mildly stressful conditions of 24 °C (Y37A1B.5,Y48G1A.4, SSP-16, GRSP-3, MCE-1, MPPB-1, TATN-1,T06F4.1a, NDX-4, SPDS-1, and LEC-8) (6). Combined, theseeQTL enrichments provide further evidence suggesting that atleast part of the protein expression level differences can beexplained by mRNA expression level differences betweenCB4856 and N2, and they might play a role in aging.
TABLE 1Summary of the enriched eQTLs for the genes differentially expressed at mRNA and/or protein levels
Study/eQTL No differencemRNA levels
changedProtein levels
changedBoth levels
changed
Vinuela et al. 2010 all present in dataset
2,270 91 10 3
Vinuela et al. 2010 cis -eQTLs
23 (1%) 11 (12.1%) 8 (7.8%) 11 (47.8%)
Vinuela et al. 2010trans -eQTLs
130 (5.7%) 9 (9.9%) 20 (19.4%) 5 (21.7%)
Rockman et al. 2010all present in dataset
2,288 86 10
3 2
9 25
Rockman et al. 2010cis -eQTLs
209 (9.1%) 40 (46.5%) 20 (18.3%) 18 (72%)
Rockman et al. 2010trans -eQTLs
266 (11.6%) 13 (15.1%) 28 (25.7%) 5 (20%)
F0
7B
7.2
C3
6C
5.1
4R
03
H1
0.6
C42D
4.3
F1
5E
11
.1 (
PU
D−2
.1)
F1
5E
11
.13
(P
UD−1
.1)
C0
4G
2.4
(M
SP−3
6)
F4
9H
12
.5F
43
D9
.4 (
SIP−1
)E
04
F6
.8R
08
E5
.2a
(C
YS
L−3
)Y
53
F4
B.3
3 (
GS
T−3
9)
F4
5D
11
.14
F5
5C
10
.2 (
CO
L−1
54
)Y
51
H4
A.7
F5
8B
4.5
D1
05
4.8
Y5
3F
4B
.18
M0
2D
8.4
a (
AS
NS−2
)K
10
H1
0.2
(C
YS
L−2
)T
27
A3
.3 (
SS
P−1
6)
ZK
63
7.1
3 (
GL
B−1
)F
22
F7
.5 (
CK
B−4
)F
55
H1
2.4
C5
2E
4.1
(C
PR−1
)T
15
B7
.1D
20
63
.1R
09
B3
.1a
(E
XO−3
)Y
37
H9
A.6
(N
DX−4
)Z
K84.1
K0
8B
4.6
(C
PI−
1)
F2
7C
8.4
(S
PP−1
8)
C3
4D
4.1
1 (
GR
SP−3
)W
07
E1
1.1
F5
8B
3.3
(LY
S−6
)C
28
G1
.5b
C1
2C
8.2
a (
CB
L−1
)D
20
30
.5 (
MC
E−1
)Z
K8
56
.7F
42
F1
2.4
T1
1F
9.9
(C
OL−1
57
)R
07
B1
.10
(L
EC−8
)F
44
C4
.3 (
CP
R−4
)F
52
G2
.1b
(D
CA
P−2
)F
08
F8
.7Y
46
G5
A.1
9b
(S
PD
S−1
)C
42
C1
.11
aR
10
7.7
(G
ST− 1
)K
11
H3
.1b
(G
PD
H−2
)Y
38
F1
A.6
Y1
7G
7B
.7 (
TP
I−1
)W
01
B1
1.6
aF
28
A1
0.6
(A
CD
H−9
)F
32
D8
.12
aF
55
A1
2.8
(N
AT
H−1
0)
C1
8G
1.4
a (
PG
L−3
)Y
54
G2
A.2
3T
28
C6
.4 (
CO
L−1
17
)E
GA
P2
.3 (
PH
O−1
)T
12
F5
.3 (
GL
H−4
)C
47
F8
.8 (
NH
R−8
1)
Y6
2E
10
A.1
3b
F1
9B
10
.11
C2
9F
4.1
(C
OL−1
25
)T
06
F4
.1a
K0
7A
3.1
(F
BP−1
)F
52
D1
.1 (
AA
GR−4
)F
46
E1
0.1
0a
(M
DH−1
)Y
73
F4
A.1
D1
02
2.4
T1
9H
12
.9 (
UG
T−1
2)
Y4
8G
1A
.4F
38
A5
.2a
F5
7C
2.5
F2
0D
1.3
F5
5F
10
.1Y
73
B6
BL
.9a
(H
IL−2
)C
34
D4
.14
(H
EC
D−1
)T
14
G1
0.7
(H
PO−5
)T
01
H3
.1 (
VH
A−4
)C
28
H8
.11
a (
TD
O−2
)K
12
H4
.7a
B0
25
0.5
Y6
5B
4B
L.5
(A
CS−1
3)
T1
3C
5.5
(B
CA−1
)C
47
B2
.6b
(G
AL
E−1
)F
55
F8
.3C
36
B7
.6Y
32
G9
A.8
(O
IG−6
)Z
K1
00
5.1
a (
TAN
K−1
)B
00
35
.10
(H
IS−4
5)
F3
2A
7.4
C3
5D
10
.1F
20
D1
2.4
(C
ZW−1
)Z
C4
10
.2 (
MP
PB− 1
)R
08
E5
. 3Z
C5
13
.4 (
VA
RS−1
)F
59
E1
2.4
b (
NP
L−4
.1)
C0
1G
10
.8F
42
D1
.2 (
TAT
N−1
)F
41
C3
.4F
38
A5
.7 (
SU
P−3
6)
Y5
4G
11
A.6
(C
TL−1
)Y
66
D1
2A
.9Y
37
A1
B.5
B0
36
5.6
(C
LE
C−4
1)
F2
7C
1.8
(D
PY−5
)T
19
D1
2.4
aT
19
B4
.3F
32
A5
.5a
(A
QP−1
)F
37
B4
.7 (
FO
LT−2
)D
20
45
.2T
01
B1
1.2
aC
01
A2
.3 (
OX
A−1
)F
54
D5
.3F
19
B1
0.1
0Y
53
F4
B.3
0 (
GS
T−2
7)
C1
4F
11
.6F
37
A4
.1T
10
H9
.5a
(P
MP−5
)Z
K6
.10
(D
OD−1
9)
H2
3N
18
.5F
54
E2
.1T
09
F5
.9 (
CL
EC−4
7)
ZK
6.1
1a
F2
1F
8.4
(A
SP−1
2)
Y9
4H
6A
.10
C1
7B
7.1
1 (
FB
XA−6
5)
F1
4D
2.4
a (
BA
TH−2
9)
-7
-6
-5
-4
-3
-2
-1
0
1
2
3
4
log2
pro
tein
abu
ndan
ce r
atio
(C
B48
56/N
2)
Aging (p = 0.007)DAF-16 transcriptional targets (p = 0.0002)DAF-16 and PQM-1 transcriptional targets (p = 0.0008)Other quantified proteins
FIG. 5. Functional categorization of the 129 differentially expressed proteins. Differentially expressed proteins were significantly enrichedin genes that are transcriptionally regulated during aging (yellow (59)), by the DAF-16 transcription factor (green (60, 61)), or by the PQM-1 andDAF-16 transcription factors (violet (62)) based on Benjamini-Hochberg-corrected two-sided Fisher exact and hypergeometric tests. Valuesshown at average � S.D. of at least two biological replicates.
N2 and CB4856 Proteome and Transcriptome Comparison
Molecular & Cellular Proteomics 15.5 1677

Genes with eQTLs on the npr-1 Locus Are Enriched amongthe 129 Proteins—CB4856 favors lower oxygen concentra-tions, mainly caused by an allelic difference in NPR-1 (39, 40),and this is reflected in its clumping behavior (72, 73). Wefound an enrichment for genes with an eQTL on the npr-1locus in the 129 candidates, suggesting that at least part ofthe gene expression differences lead to differences in proteinlevels. Furthermore, two cysteine synthases, CYSL-2 andCYSL-3, proposed sensors of cellular H2S levels upon hy-poxia (74), showed up-regulated protein levels in CB4856 (Fig.5). The oxygen-binding protein GLB-1, the transcript of whichis up-regulated under hypoxic conditions and in hif-1 mutants(75, 76), was also up-regulated in CB4856 (Fig. 5), as well asthe oxygen-sensing globin protein GLB-5 (72, 73). These dif-ferences on protein level might contribute to the differentoxygen responses of N2 and CB4856.
DISCUSSION
In this paper, we analyzed the influence of genetic back-ground and natural variation on the proteome and the tran-scriptome in two genetically highly divergent C. elegans wild-type strains, N2 (Bristol) and CB4856 (Hawaii). Using SILAC,we quantified in total 3,238 distinct proteins in three biologicalreplicates; 2,485 proteins were quantified in at least two rep-licates. These numbers are comparable with other SILACstudies in C. elegans. More than 1,400 proteins were reliablyquantified in worm samples using size exclusion chromatog-raphy (28), and 3,470 proteins were quantified using LysCdigestion followed by hydrophilic interaction liquid chroma-tography separation of the peptides (29). Between 1,461 and4,072 proteins were identified in different developmentalstages of C. elegans and C. briggsae after separation on SDSgels (27). To quantify less abundant proteins, additional sep-aration methods would be required, as was done for thequantitative comparison of distantly related species (26). Inour study, primarily highly expressed proteins were quantified.These show relatively little variation between N2 and CB4856,also at the transcript level.
Among the 2,485 quantified proteins, 129 (5.2%) proteinsdistributed over 5 orders of magnitude in expression weredifferentially expressed between N2 and CB4856. By con-trast, of all the genes, 1,532 genes (7.4%) were differentiallyexpressed at the mRNA level. Of the 2,481 genes for whichproteins were detected and that overlapped with the mRNAdataset, only 113 (4.6%) were different at the mRNA level. Theoverall correlations for both protein and mRNA abundanceswere close to one between the strains. This is consistent withthe quantitative comparison of C. elegans and C. briggsae(27), but it is different for C. elegans and D. melanogaster,where the conservation in expression was found only onprotein level (26). Thus, in this intraspecies comparison, weobserved a strong selective pressure to maintain protein lev-els, an effect that was also shown for closely (27) and evendistantly related species (26).
The 129 differentially expressed proteins were strongly en-riched for downstream targets of the insulin-signaling path-way (DAF-16 and PQM-1 targets) (60, 61, 62). An increasedexpression divergence of DAF-16 targets was also observedin a quantitative comparison of gene expression between thetwo nematode species C. briggsae and C. elegans (27). Theseresults imply that differential regulation of the insulin-signalingdownstream targets can be observed already between strainsof the same species, underlining the strong divergence of thissignaling pathway in nematodes. Importantly, the genes dif-ferentially expressed between N2 and CB4856 were alsostrongly enriched in eQTLs associated with aging. These re-sults suggest that at least a subset of our differentially ex-pressed genes might contribute to the longevity differencesbetween N2 and CB4856.
Acknowledgments—We thank Xiaoxue Li and Xue Zheng for car-rying out pre-experiments in proteomics and Peter Hunziker forvaluable advice. We thank Nikolaus Rajewsky and Nadine Thier-felder for kindly providing the SILAC labeling protocol and Jacob D.Jaffe for help with the correction of arginine-to-proline conversion.We also thank Morris Swertz and Joeri van der Velde for help inmaking the data accessible through WormQTL. We thank ChristianPanse for help with MS/MS spectra annotation of the single peptideidentifications.
* This work was supported by European Community Health Sev-enth Framework Programme FP7/2007-2013 under Grant PANACEA222936, the Swiss National Science Foundation, and the Kanton ofZurich. L.B.S. was supported by Netherlands Organization for Scien-tific Research Project 823.01.001. R.J.M.V. was supported by theNWO-ALW Project 855.01.151. M.G.S. was funded by the GraduateSchool Production Ecology and Resource Conservation. The authorsdeclare that they have no conflicts of interest with the contents of thisarticle.
□S This article contains supplemental material.‡‡ To whom correspondence should be addressed: Laboratory of
Nematology, Wageningen Universiteit, Droevendaalsesteeg 1, NL-6708 PB, Wageningen, The Netherlands. Tel.: 31-317-482998/482197; Fax: 31-317-484254; E-mail: [email protected] orInstitute of Molecular Life Sciences, University of Zurich, Win-terthurerstrasse 190, CH-8057 Zurich, Switzerland. Tel.: 41-44-6353112; E-mail: [email protected].
¶ Both authors contributed equally to this work.
REFERENCES
1. Oleksiak, M. F., Churchill, G. A., and Crawford, D. L. (2002) Variation in geneexpression within and among natural populations. Nat. Genet. 32,261–266
2. Gaffney, D. J. (2013) Global properties and functional complexity of humangene regulatory variation. PlOS Genet. 9, e1003501
3. Vinuela, A., Snoek, L. B., Riksen, J. A., and Kammenga, J. E. (2012) Aginguncouples heritability and expression-QTL in Caenorhabditis elegans. G32, 597–605
4. Volkers, R. J., Snoek, L. B., Hubar, C. J., Coopman, R., Chen, W., Yang, W.,Sterken, M. G., Schulenburg, H., Braeckman, B. P., and Kammenga, J. E.(2013) Gene-environment and protein-degradation signatures character-ize genomic and phenotypic diversity in wild Caenorhabditis eleganspopulations. BMC Biol. 11, 93
5. Brem, R. B., Yvert, G., Clinton, R., and Kruglyak, L. (2002) Genetic dissec-tion of transcriptional regulation in budding yeast. Science 296, 752–755
6. Li, Y., Alvarez, O. A., Gutteling, E. W., Tijsterman, M., Fu, J., Riksen, J. A.,Hazendonk, E., Prins, P., Plasterk, R. H., Jansen, R. C., Breitling, R., and
N2 and CB4856 Proteome and Transcriptome Comparison
1678 Molecular & Cellular Proteomics 15.5
Kammenga, J. E. (2006) Mapping determinants of gene expression plas-ticity by genetical genomics in C. elegans. PlOS Genet. 2, e222
7. Li, Y., Breitling, R., Snoek, L. B., van der Velde, K. J., Swertz, M. A., Riksen,J., Jansen, R. C., and Kammenga, J. E. (2010) Global genetic robustnessof the alternative splicing machinery in Caenorhabditis elegans. Genetics186, 405–410
8. Rockman, M. V., Skrovanek, S. S., and Kruglyak, L. (2010) Selection atlinked sites shapes heritable phenotypic variation in C. elegans. Science330, 372–376
9. Vinuela, A., Snoek, L. B., Riksen, J. A., and Kammenga, J. E. (2010)Genome-wide gene expression regulation as a function of genotype andage in C. elegans. Genome Res. 20, 929–937
10. Snoek, L. B., Terpstra, I. R., Dekter, R., Van den Ackerveken, G., andPeeters, A. J. (2012) Genetical genomics reveals large scale genotype-by-environment interactions in Arabidopsis thaliana. Front. Genet. 3, 317
11. King, E. G., Sanderson, B. J., McNeil, C. L., Long, A. D., and Macdonald,S. J. (2014) Genetic dissection of the Drosophila melanogaster femalehead transcriptome reveals widespread allelic heterogeneity. PLoSGenet. 10, e1004322
12. Jansen, R. C., and Nap, J. P. (2001) Genetical genomics: the added valuefrom segregation. Trends Genet. 388–391
13. Bing, N., and Hoeschele, I. (2005) Genetical genomics analysis of a yeastsegregant population for transcription network inference. Genetics 170,533–542
14. Keurentjes, J. J., Fu, J., Terpstra, I. R., Garcia, J. M., van den Ackerveken,G., Snoek, L. B., Peeters, A. J., Vreugdenhil, D., Koornneef, M., andJansen, R. C. (2007) Regulatory network construction in Arabidopsis byusing genome-wide gene expression quantitative trait loci. Proc. Natl.Acad. Sci. U.S.A. 104, 1708–1713
15. Terpstra, I. R., Snoek, L. B., Keurentjes, J. J., Peeters, A. J., and van denAckerveken, G. (2010) Regulatory network identification by geneticalgenomics: signaling downstream of the Arabidopsis receptor-like kinaseERECTA. Plant Physiol. 154, 1067–1078
16. Cox, J., and Mann, M. (2007) Is proteomics the new genomics? Cell 130,395–398
17. Albert, F. W., Treusch, S., Shockley, A. H., Bloom, J. S., and Kruglyak, L.(2014) Genetics of single-cell protein abundance variation in large yeastpopulations. Nature 506, 494–497
18. Foss, E. J., Radulovic, D., Shaffer, S. A., Goodlett, D. R., Kruglyak, L., andBedalov, A. (2011) Genetic variation shapes protein networks mainlythrough non-transcriptional mechanisms. PLoS Biol. 9, e1001144
19. Ghazalpour, A., Bennett, B., Petyuk, V. A., Orozco, L., Hagopian, R., Mun-grue, I. N., Farber, C. R., Sinsheimer, J., Kang, H. M., Furlotte, N., Park,C. C., Wen, P. Z., Brewer, H., Weitz, K., Camp, D. G., et al. (2011)Comparative analysis of proteome and transcriptome variation in mouse.PLoS Genet. 7, e1001393
20. Parts, L., Liu, Y. C., Tekkedil, M. M., Steinmetz, L. M., Caudy, A. A., Fraser,A. G., Boone, C., Andrews, B. J., and Rosebrock, A. P. (2014) Heritabilityand genetic basis of protein level variation in an outbred population.Genome Res. 24, 1363–1370
21. Snoek, L. B., Van der Velde, K. J., Arends, D., Li, Y., Beyer, A., Elvin, M.,Fisher, J., Hajnal, A., Hengartner, M. O., Poulin, G. B., Rodriguez, M.,Schmid, T., Schrimpf, S., Xue, F., Jansen, R. C., et al. (2013)WormQTL–public archive and analysis web portal for natural variationdata in Caenorhabditis spp. Nucleic Acids Res. 41, D738–D743
22. Snoek, L. B., Joeri van der Velde, K., Li, Y., Jansen, R. C., Swertz, M. A.,and Kammenga, J. E. (2014) Worm variation made accessible: take yourshopping cart to store, link, and investigate! Worm 3, e28357
23. van der Velde, K. J., de Haan, M., Zych, K., Arends, D., Snoek, L. B.,Kammenga, J. E., Jansen, R. C., Swertz, M. A., and Li, Y. (2014)WormQTLHD–a web database for linking human disease to natural var-iation data in C. elegans. Nucleic Acids Res. 42, D794–D801
24. Merrihew, G. E., Davis, C., Ewing, B., Williams, G., Kall, L., Frewen, B. E.,Noble, W. S., Green, P., Thomas, J. H., and MacCoss, M. J. (2008) Useof shotgun proteomics for the identification, confirmation, and correctionof C. elegans gene annotations. Genome Res. 18, 1660–1669
25. Schrimpf, S. P., and Hengartner, M. O. (2010) A worm rich in protein:quantitative, differential, and global proteomics in Caenorhabditis el-egans. J. Proteomics 73, 2186–2197
26. Schrimpf, S. P., Weiss, M., Reiter, L., Ahrens, C. H., Jovanovic, M., Malm-strom, J., Brunner, E., Mohanty, S., Lercher, M. J., Hunziker, P. E.,
Aebersold, R., von Mering, C., and Hengartner, M. O. (2009) Comparativefunctional analysis of the Caenorhabditis elegans and Drosophila mela-nogaster proteomes. PLoS Biol. 7, e48
27. Grun, D., Kirchner, M., Thierfelder, N., Stoeckius, M., Selbach, M., andRajewsky, N. (2014) Conservation of mRNA and protein expressionduring development of C. elegans. Cell Rep. 6, 565–577
28. Larance, M., Bailly, A. P., Pourkarimi, E., Hay, R. T., Buchanan, G., Coul-thurst, S., Xirodimas, D. P., Gartner, A., and Lamond, A. I. (2011) Stable-isotope labeling with amino acids in nematodes. Nat. Methods 8,849–851
29. Fredens, J., Engholm-Keller, K., Giessing, A., Pultz, D., Larsen, M. R.,Højrup, P., Møller-Jensen, J., and Færgeman, N. J. (2011) Quantitativeproteomics by amino acid labeling in C. elegans. Nat. Methods 8,845–847
30. Snoek, L. B., Sterken, M. G., Volkers, R. J., Klatter, M., Bosman, K. J.,Bevers, R. P., Riksen, J. A., Smant, G., Cossins, A. R., and Kammenga,J. E. (2014) A rapid and massive gene expression shift marking adoles-cent transition in C. elegans. Sci. Rep. 4, 3912
31. van der Bent, M. L., Sterken, M. G., Volkers, R. J., Riksen, J. A., Schmid, T.,Hajnal, A., Kammenga, J. E., and Snoek, L. B. (2014) Loss-of-function of�-catenin bar-1 slows development and activates the Wnt pathway inCaenorhabditis elegans. Sci. Rep. 4, 4926
32. Capra, E. J., Skrovanek, S. M., and Kruglyak, L. (2008) Comparative de-velopmental expression profiling of two C. elegans isolates. PLoS One 3,e4055
33. Thompson, O., Edgley, M., Strasbourger, P., Flibotte, S., Ewing, B., Adair,R., Au, V., Chaudhry, I., Fernando, L., Hutter, H., Kieffer, A., Lau, J., Lee,N., Miller, A., Raymant, G., et al. (2013) The million mutation project: anew approach to genetics in Caenorhabditis elegans. Genome Res. 23,1749–1762
34. Thompson, O. A., Snoek, L. B., Nijveen, H., Sterken, M. G., Volkers, R. J.,Brenchley, R., Van’t Hof, A., Bevers, R. P., Cossins, A. R., Yanai, I.,Hajnal, A., Schmid, T., Perkins, J. D., Spencer, D., Kruglyak, L., et al.(2015) Remarkably divergent regions punctuate the genome assembly ofthe C. elegans Hawaiian strain CB4856. Genetics 200, 975–989
35. Barriere, A., and Felix, M. A. (2005) High local genetic diversity and lowoutcrossing rate in Caenorhabditis elegans natural populations. Curr.Biol. 15, 1176–1184
36. Andersen, E. C., Gerke, J. P., Shapiro, J. A., Crissman, J. R., Ghosh, R.,Bloom, J. S., Felix, M. A., and Kruglyak, L. (2012) Chromosome-scaleselective sweeps shape Caenorhabditis elegans genomic diversity. Nat.Genet. 44, 285–290
37. Barriere, A., and Felix, M. A. (2005) Natural variation and population genet-ics of Caenorhabditis elegans. WormBook 2005, 1–19
38. Maydan, J. S., Flibotte, S., Edgley, M. L., Lau, J., Selzer, R. R., Richmond,T. A., Pofahl, N. J., Thomas, J. H., and Moerman, D. G. (2007) Efficienthigh-resolution deletion discovery in Caenorhabditis elegans by arraycomparative genomic hybridization. Genome Res. 17, 337–347
39. Sterken, M. G., Snoek, L. B., Kammenga, J. E., and Andersen, E. C. (2015)The laboratory domestication of Caenorhabditis elegans. Trends Genet.31, 224–231
40. Andersen, E. C., Bloom, J. S., Gerke, J. P., and Kruglyak, L. (2014) A variantin the neuropeptide receptor npr-1 is a major determinant of Caenorh-abditis elegans growth and physiology. PLoS Genet. 10, e1004156
41. Stastna, J. J., Snoek, L. B., Kammenga, J. E., and Harvey, S. C. (2015)Genotype-dependent lifespan effects in peptone deprived Caenorhab-ditis elegans. Sci. Rep. 5, 16259
42. Schmid, T., Snoek, L. B., Frohli, E., van der Bent, M. L., Kammenga, J., andHajnal, A. (2015) Systemic regulation of RAS/MAPK signaling by theserotonin metabolite 5-HIAA. PLoS Genet. 11, e1005236
43. Green, J. W., Snoek, L. B., Kammenga, J. E., and Harvey, S. C. (2013)Genetic mapping of variation in dauer larvae development in growingpopulations of Caenorhabditis elegans. Heredity 111, 306–313
44. Duveau, F., and Felix, M. A. (2012) Role of pleiotropy in the evolution of acryptic developmental variation in Caenorhabditis elegans. PLoS Biol.10, e1001230
45. Reddy, K. C., Andersen, E. C., Kruglyak, L., and Kim, D. H. (2009) Apolymorphism in npr-1 is a behavioral determinant of pathogen suscep-tibility in C. elegans. Science 323, 382–384
46. Glauser, D. A., Chen, W. C., Agin, R., Macinnis, B. L., Hellman, A. B.,Garrity, P. A., Tan, M. W., and Goodman, M. B. (2011) Heat avoidance is
N2 and CB4856 Proteome and Transcriptome Comparison
Molecular & Cellular Proteomics 15.5 1679

regulated by transient receptor potential (TRP) channels and a neuro-peptide signaling pathway in Caenorhabditis elegans. Genetics 188,91–103
47. Gaertner, B. E., Parmenter, M. D., Rockman, M. V., Kruglyak, L., andPhillips, P. C. (2012) More than the sum of its parts: a complex epistaticnetwork underlies natural variation in thermal preference behavior inCaenorhabditis elegans. Genetics 192, 1533–1542
48. Bendesky, A., Pitts, J., Rockman, M. V., Chen, W. C., Tan, M. W., Kruglyak,L., and Bargmann, C. I. (2012) Long-range regulatory polymorphismsaffecting a GABA receptor constitute a quantitative trait locus (QTL) forsocial behavior in Caenorhabditis elegans. PLoS Genet. 8, e1003157
49. Bendesky, A., Tsunozaki, M., Rockman, M. V., Kruglyak, L., and Bargmann,C. I. (2011) Catecholamine receptor polymorphisms affect decision-making in C. elegans. Nature 472, 313–318
50. Rodriguez, M., Snoek, L. B., Riksen, J. A., Bevers, R. P., and Kammenga,J. E. (2012) Genetic variation for stress-response hormesis in C. eleganslifespan. Exp. Gerontol. 47, 581–587
51. Zahurak, M., Parmigiani, G., Yu, W., Scharpf, R. B., Berman, D., Schaeffer,E., Shabbeer, S., and Cope, L. (2007) Pre-processing agilent microarraydata. BMC Bioinformatics 8, 142
52. Cox, J., and Mann, M. (2008) MaxQuant enables high peptide identificationrates, individualized p.p.b.-range mass accuracies and proteome-wideprotein quantification. Nat. Biotechnol. 26, 1367–1372
53. Panse, C. G., Grossman, J., and Oesterreicher, S. B. (2013) protViz: Visu-alizing and analyzing mass spectrometry related data in proteomics. RPackage, version 3.0.2, Functional Genomics Center Zurich, Zurich
54. MacLean, B., Tomazela, D. M., Shulman, N., Chambers, M., Finney, G. L.,Frewen, B., Kern, R., Tabb, D. L., Liebler, D. C., and MacCoss, M. J.(2010) Skyline: an open source document editor for creating and ana-lyzing targeted proteomics experiments. Bioinformatics 26, 966–968
55. Vinuela, A., Snoek, L. B., Riksen, J. A., and Kammenga, J. E. (2010)Genome-wide gene expression analysis in response to organophospho-rus pesticide chlorpyrifos and diazinon in C. elegans. PLoS One 5,e12145
56. Blagoev, B., Kratchmarova, I., Ong, S. E., Nielsen, M., Foster, L. J., andMann, M. (2003) A proteomics strategy to elucidate functional protein-protein interactions applied to EGF signaling. Nat. Biotechnol. 21,315–318
57. Alexa, A., Rahnenfuhrer, J., and Lengauer, T. (2006) Improved scoring offunctional groups from gene expression data by decorrelating GO graphstructure. Bioinformatics 22, 1600–1607
58. Alexa, A., and Rahnenfuhrer, J. (2010) topGO: Enrichment analysis for geneontology. R package, Version 2.23.0., Saarbrucken.
59. Budovskaya, Y. V., Wu, K., Southworth, L. K., Jiang, M., Tedesco, P.,Johnson, T. E., and Kim, S. K. (2008) An elt-3/elt-5/elt-6 GATA transcrip-tion circuit guides aging in C. elegans. Cell 134, 291–303
60. McElwee, J., Bubb, K., and Thomas, J. H. (2003) Transcriptional outputs ofthe Caenorhabditis elegans forkhead protein DAF-16. Aging Cell 2,111–121
61. Murphy, C. T., McCarroll, S. A., Bargmann, C. I., Fraser, A., Kamath, R. S.,Ahringer, J., Li, H., and Kenyon, C. (2003) Genes that act downstream ofDAF-16 to influence the lifespan of Caenorhabditis elegans. Nature 424,277–283
62. Tepper, R. G., Ashraf, J., Kaletsky, R., Kleemann, G., Murphy, C. T., andBussemaker, H. J. (2013) PQM-1 complements DAF-16 as a key tran-
scriptional regulator of DAF-2-mediated development and longevity. Cell154, 676–690
63. Rivals, I., Personnaz, L., Taing, L., and Potier, M. C. (2007) Enrichment ordepletion of a GO category within a class of genes: which test? Bioin-formatics 23, 401–407
64. Vizcaíno, J. A., Deutsch, E. W., Wang, R., Csordas, A., Reisinger, F., Ríos,D., Dianes, J. A., Sun, Z., Farrah, T., Bandeira, N., Binz, P. A., Xenarios,I., Eisenacher, M., Mayer, G., Gatto, L., Campos, A., Chalkley, R. J.,Kraus, H. J., Albar, J. P., Martinez-Bartolome, S., Apweiler, R., Omenn,G. S., Martens, L., Jones, A. R., and Hermjakob, H. (2014) Proteome-Xchange provides globally coordinated proteomics data submission anddissemination. Nat. Biotechnol. 32, 223–226
65. Wang, M., Weiss, M., Simonovic, M., Haertinger, G., Schrimpf, S. P.,Hengartner, M. O., and von Mering, C. (2012) PaxDb, a database ofprotein abundance averages across all three domains of life. Mol. Cell.Proteomics 11, 492–500
66. Samuelson, A. V., Carr, C. E., and Ruvkun, G. (2007) Gene activities thatmediate increased life span of C. elegans insulin-like signaling mutants.Genes Dev. 21, 2976–2994
67. Lee, S. J., Murphy, C. T., and Kenyon, C. (2009) Glucose shortens the lifespan of C. elegans by downregulating DAF-16/FOXO activity and aqua-porin gene expression. Cell Metab. 10, 379–391
68. Priebe, S., Menzel, U., Zarse, K., Groth, M., Platzer, M., Ristow, M., andGuthke, R. (2013) Extension of life span by impaired glucose metabolismin Caenorhabditis elegans is accompanied by structural rearrangementsof the transcriptomic network. PLoS One 8, e77776
69. Garsin, D. A., Villanueva, J. M., Begun, J., Kim, D. H., Sifri, C. D., Calder-wood, S. B., Ruvkun, G., and Ausubel, F. M. (2003) Long-lived C. elegansdaf-2 mutants are resistant to bacterial pathogens. Science 300, 1921
70. Papp, D., Csermely, P., and Soti, C. (2012) A role for SKN-1/Nrf in pathogenresistance and immunosenescence in Caenorhabditis elegans. PLoSPathog. 8, e1002673
71. Doroszuk, A., Snoek, L. B., Fradin, E., Riksen, J., and Kammenga, J. (2009)A genome-wide library of CB4856/N2 introgression lines of Caenorhab-ditis elegans. Nucleic Acids Res. 37, e110
72. McGrath, P. T., Rockman, M. V., Zimmer, M., Jang, H., Macosko, E. Z.,Kruglyak, L., and Bargmann, C. I. (2009) Quantitative mapping of adigenic behavioral trait implicates globin variation in C. elegans sensorybehaviors. Neuron 61, 692–699
73. Persson, A., Gross, E., Laurent, P., Busch, K. E., Bretes, H., and de Bono,M. (2009) Natural variation in a neural globin tunes oxygen sensing in wildCaenorhabditis elegans. Nature 458, 1030–1033
74. Qabazard, B., Ahmed, S., Li, L., Arlt, V. M., Moore, P. K., and Sturzenbaum,S. R. (2013) C. elegans aging is modulated by hydrogen sulfide and thesulfhydrylase/cysteine synthase cysl-2. PLoS One 8, e80135
75. Geuens, E., Hoogewijs, D., Nardini, M., Vinck, E., Pesce, A., Kiger, L., Fago,A., Tilleman, L., De Henau, S., Marden, M. C., Weber, R. E., Van Doors-laer, S., Vanfleteren, J., Moens, L., Bolognesi, M., and Dewilde, S. (2010)Globin-like proteins in Caenorhabditis elegans: in vivo localization, ligandbinding and structural properties. BMC Biochem. 11, 17
76. Hoogewijs, D., Geuens, E., Dewilde, S., Vierstraete, A., Moens, L., Vinogra-dov, S., and Vanfleteren, J. R. (2007) Wide diversity in structure andexpression profiles among members of the Caenorhabditis elegans glo-bin protein family. BMC Genomics 8, 356
N2 and CB4856 Proteome and Transcriptome Comparison
1680 Molecular & Cellular Proteomics 15.5