zwitterions layer at but do not screen electrified interfaces
TRANSCRIPT

1
Zwitterions Layer at but Do Not Screen Electrified Interfaces
Muhammad Ghifari Ridwan, Buddha Ratna Shrestha, Nischal Maharjan, Himanshu Mishra*
King Abdullah University of Science and Technology (KAUST), Water Desalination and
Reuse Center (WDRC), Biological and Environmental Science & Engineering Division
(BESE), Thuwal, 23955-6900, Saudi Arabia
*Corresponding Author: [email protected]
Keywords: zwitterions; ionic strength; Debye length; electrostatic interaction; surface forces;
ion adsorption

2
ABSTRACT
The role of ionic electrostatics in colloidal processes is well-understood in natural and
applied contexts; however, the electrostatic contribution of zwitterions, known to be present
in copious amounts in extremophiles, has not been extensively explored. In response, we
studied the effects of glycine as a surrogate zwitterion, ion, and osmolyte on the electrostatic
forces between negatively charged mica–mica and silica–silica interfaces. Our results reveal
that while zwitterions layer at electrified interfaces and contribute to solutions’ osmolality,
they do not affect at all the surface potentials, the electrostatic surface forces (magnitude and
range), and solutions’ conductivity across 0.3–30 mM glycine concentration. We infer that
the zwitterionic structure imposes an inseparability among the ± charges and that this
inseparability prevents the buildup of a counter-charge at interfaces. These elemental
experimental results pinpoint how zwitterions enable extremophiles to cope with the osmotic
stress without affecting finely tuned electrostatic force balance.

3
INTRODUCTION
Ions and zwitterions orchestrate the inner workings of prokaryotic, plant, and animal cells via
electromagnetic interactions, thereby giving rise to finely tuned structure–function
relationships in proteins, chemical reactions, catalysis, molecular recognition and signaling,
and bioenergetics1-5. Ion electrostatics also underlies numerous practical matters, including
soil water-holding capacity6, the stability of pharmaceutical and cosmetic formulations7,
water desalination8 and treatment9 processes, and nanotriboelectricity harvesting10.
Interestingly, simple hard ions, such as Na+, K+, Mg2+, Ca2+, and Cl−, which are ubiquitous in
biological systems, retain their electrical charge irrespective of the solution pH or
temperature11. Therefore, their presence in excess can tilt the finely tuned balance of
molecular forces, notably electrostatics2, 12-14. The Debye–Hückel model accurately captures
the behavior of ions in dilute solution (≤100 mM) on the basis of Maxwell’s first law of
electromagnetism, ∇2𝜙 = −𝜌 𝜀0𝜀r⁄ , and the assumption that the Boltzmann statistics
accurately describe the clustering of the oppositely charged ions at electrified interfaces, 𝜌 =
𝜌0𝑒−𝑒𝜓 𝑘B𝑇⁄ 15. This Poisson–Boltzmann equation explains why the clustering of ions
dramatically decreases the range and magnitude of electrostatic forces between charges
and/or charged surfaces, such as within or among proteins and emulsified oil droplets in
water16. Such a molecular-scale disruption manifests as cytotoxicity17; indeed, salt stress
precludes the use of seawater for growing food and forces us to exploit limited and dwindling
freshwater resources18. This severity echoes in “The Rime of the Ancient Mariner”: “Water,
water everywhere, Nor any drop to drink.”19. Yet, some lifeforms thrive even in harsh
environments, including salty, arid, pressurized, hot, or cold environments, where the
amounts of solutes (ions) and solvent (water) can vary dramatically, thereby catastrophically
affecting the electrostatics and inducing osmotic imbalance1, 20, 21. The current understanding
of how life prevails under such extreme conditions via intermolecular and surface forces is
far from satisfactory3, 22-24.
Osmolytes—electrically neutral molecules such as zwitterionic amino acids (e.g., glycine,
proline, and alanine), sugars and polyols (e.g., glucose and glycerol), methylamines (e.g.,
sarcosine, betaine, and trimethylamineoxide), and urea—orchestrate the balancing act1, 4, 21, 25.
They are observed in high concentrations in a wide variety of extremophiles, including
cyanobacteria, fungi, lichens, multicellular algae, vascular plants, insects, and marine
invertebrates and pelagic fishes. Researchers have documented the effects of osmolytes and
their compensating effects, such as those of betaine and urea, on enzymatic activities.

4
However, unlike the contributions of hard ions, the contributions of zwitterions to an aquatic
solution’s ionic strength and surface forces remain unclear. For instance, the zwitterionic
contribution to ionic strength has been suggested to be (i) zero26, (ii) similar to that of 1:1
salts27, (iii) and similar to that of partially charged molecules28. Obviously, these proposed
contributions would result in drastically different electrostatic forces29-31. Therefore, direct
measurements of surface forces as a function of surfaces and solutions are necessary to
clarify this matter. Recently, Sivan and coworkers used atomic force microscopy (AFM) to
probe the effects of adding betaine (1–3 M) on the forces between silica surfaces immersed in
solutions comprising NaCl, KCl, CsCl, and MgCl2 at concentrations less than or equal to 50
mM32. They found that, although the addition of hard ions decreased the range and magnitude
of electrostatic forces, betaine (1–3 M) increased both the magnitude and range of
electrostatics between silica surfaces. These new results suggest that the effect of osmolyte
action on surface forces is profound.
Herein, we investigate the effects of glycine, as a surrogate osmolyte, on electrostatic forces
between electrified surfaces at biologically relevant concentrations (<0.6 M) to address the
following questions:
1. How do zwitterions influence surface forces between electrically charged surfaces in
dilute electrolytes?
(i) Do zwitterions layer at electrified interfaces and screen them, similar to the
effect of hard ions?
(ii) If zwitterions increase/decrease surface forces, is this effect due to their
contribution to the solution’s ionic strength or their contribution to its
dielectric response?
(iii) If they exert no effect, is the lack of effect attributable to the fortuitous
cancellation of their various aforementioned influences?
2. Do zwitterions transition to simple ions if the pH is adjusted to change their charge to,
for example, ±𝑒, where e is the electronic charge?
(i) Are the effects of the thus-formed positive and negatively charged ions on
surface forces identical?
(ii) What is the correlation between the surface forces and the electrolytes’
osmotic pressure in these systems?

5
To probe these nested and interrelated questions, we used AFM and a surface force apparatus
(SFA) to measure the forces between electrified silica–silica and mica–mica surfaces
separated by dilute aqueous solutions (≤30 mM). The results reveal that zwitterions exhibit
stronger effects than hard ions as a function of pH and ionic composition; although they
enhance solutions’ osmolality, they do not influence the electrostatic surface potentials/forces
or the screening lengths. In addition, if they are rendered to ionic form by varying the pH,
they behave as hard ions.
RESULTS
Single-crystal SiO2/Si wafers and freshly cleaved muscovite mica surfaces are ultrasmooth
and acquire a negative charge in aqueous solutions depending on the pH/pKa relationships
because of the deprotonation of Si–OH groups33 and the leaching of K+ ions15, respectively.
These materials therefore serve as rigid substrates for comparing the behaviors of ions and
zwitterions at electrified interfaces. Glycine was used as a surrogate osmolyte because it is a
common amino acid with the smallest hydrophobic unit. In the pH range 3–9, the majority of
glycine molecules in water exist in zwitterionic form; below and above this range, they
display net positive and negative charges because of the –NH3+ and –COO− groups,
respectively34. We next used AFM to measure the electrostatic force at the silica–silica
interfaces and to probe glycine adsorption onto the electrified mica–water interface. Whereas
colloidal probes were used in the former experiments, nanoscale tips were used in the latter
experiments (Fig. 1A and Methods). In addition, we used SFA to achieve angstrom-scale
resolution between ultrasmooth surfaces while measuring forces and pinpoint electrostatic
decay lengths in various solutions35. Notably, although the contact area in the colloidal probe
experiments was <300 nm2, that in the SFA experiments was ~100 µm2 (Fig. 1B and
Methods). Results from these complementary techniques are presented in the following
subsections.

6
Figure 1. (A) Schematics of the atomic force microscopy (AFM) experiments. The relative
distance between the AFM cantilever and the surface is determined by the displacement of
the laser in the photodiode. The force is then measured on the basis of Hooke’s law by
detecting the deflection of the cantilever by the prevailing force between the AFM cantilever
tip and the surface. The inset shows the contact geometry between a silica colloidal tip and a
silica surface. (B) Schematic of the surface force apparatus (SFA). The absolute distance
between two surfaces is calculated by interpreting the fringes of equal chromatic order
(FECO). The force is then measured on the basis of Hooke’s law by considering the
difference between the calculated distance and the normal distance (without spring
deflection). (Image credits: Heno Hwang, Scientific Illustrator, KAUST)
Effects of glycine activity and water pH on electrostatic forces between surfaces.
We conducted AFM experiments (for silica surfaces) and SFA experiments (for mica
surfaces) using aqueous solutions of glycine in the concentration range 0.3–30 mM (pH ≈
6.5) and pure water (pH ≈ 5.7) for comparison. Even though the zwitterionic concentration
increased more than 100-fold, no differences were detected in the magnitude of the
electrostatic forces and the Debye length in the silica–silica system (Fig. 2A) and the mica–
mica system in water (Fig. 2B). That is, the addition of zwitterions did not affect the
electrostatics in these systems; the electrostatics were similar to those in pure water.
However, when we added hard ions (i.e., KCl (0.01–10 mM) to 3 mM glycine solutions, the
force magnitude decreased and the Debye lengths decreased from 45 nm at 0.01 mM to 29
nm at 0.1 mM, 10 nm at 1 mM, and 3 nm at 10 mM. These changes can be explained on the
basis of the linearized Poisson–Boltzmann model (see details in the Discussion).

7
Next, we investigated the effects of the pH of 3 mM glycine solutions in the range 2–12 on
surfaces forces for the silica–silica system (Fig. 2C) and the mica–mica system (Fig. 2D).
The experimental results revealed that, when 5 < pH < 7, the Debye length did not change (45
± 7 nm); however, when pH < 5 or pH > 7, the Debye length decreased systematically as
follows: from 29 nm at pH 4.4 to 3 nm at pH 2.1 and from 15 nm at pH 9.8 to 4 nm at pH
11.8. In the Discussion section, we explain these observations based on the linearized
Poisson-Boltzmann model and the speciation of glycine (into zwitterions and ions).
Figure 2. (A-B) Effects of the zwitterionic glycine concentration (0.3–30 mM; pH≈ 6.5) on the
electrostatic forces between charged surfaces in water with/without KCl. Semi-logarithmic (A)
AFM force data normalized by tip radius and (B) SFA force data normalized by the effective
radius of curvature of the discs. (C-D) Normalized force as a function of the surface separation
at different pH values in 3 mM glycine solutions, as measured (C) between silica surfaces by
AFM and (D) between mica surfaces by SFA. Under acidic conditions, the zwitterions and
positively charged ions formed because protonation of the amine group dominated the chemical
speciation of glycine. Under basic conditions, the zwitterions and negatively charged ions
formed because deprotonation of the carboxylic group dominated the chemical speciation of
glycine. The continuous lines are linear fits whose slope yields the Debye length, λ, which is
listed within parentheses.

8
Adsorption of glycine at an electrified interface as a function of water pH.
We first incubated freshly cleaved mica surfaces in 30 mM glycine solutions at pH values of
1.7, 6.8, and 11.8 for 30 min to achieve chemical equilibrium. We then rinsed the surfaces
with deionized water, dried them with flowing N2 gas, and imaged them by AFM (Fig. 3A–
C). We found that glycine self-assembled on mica only at pH 6.8, forming a patchy layer
(Fig. 3B); no adsorption occurred at pH values of 1.7 and 11.8 (Fig. 3A and C). These results
underscore the effects of the form of glycine (i.e., zwitterionic at pH 6.8 and ionic at other pH
values) on its adsorption behavior (see details in the Discussion).
Figure 3. 3D AFM images of incubated mica in 30 mM glycine solution at different pH levels.
Each image size is 5 × 5 µm2. (A) Mica surface after incubation in 30 mM glycine solution at
pH 1.7. The asperities’ height is less than 0.7 Å. (C) Mica surface after incubation in 30 mM
glycine solution at pH 6.8. The asperities’ height is 4 Å. (C) Mica surface after incubation in
30 mM glycine solution at pH 11.8. The asperities’ height is less than 0.8 Å.
Electrical conductivity, osmotic pressure, and dielectric constant of glycine solutions.
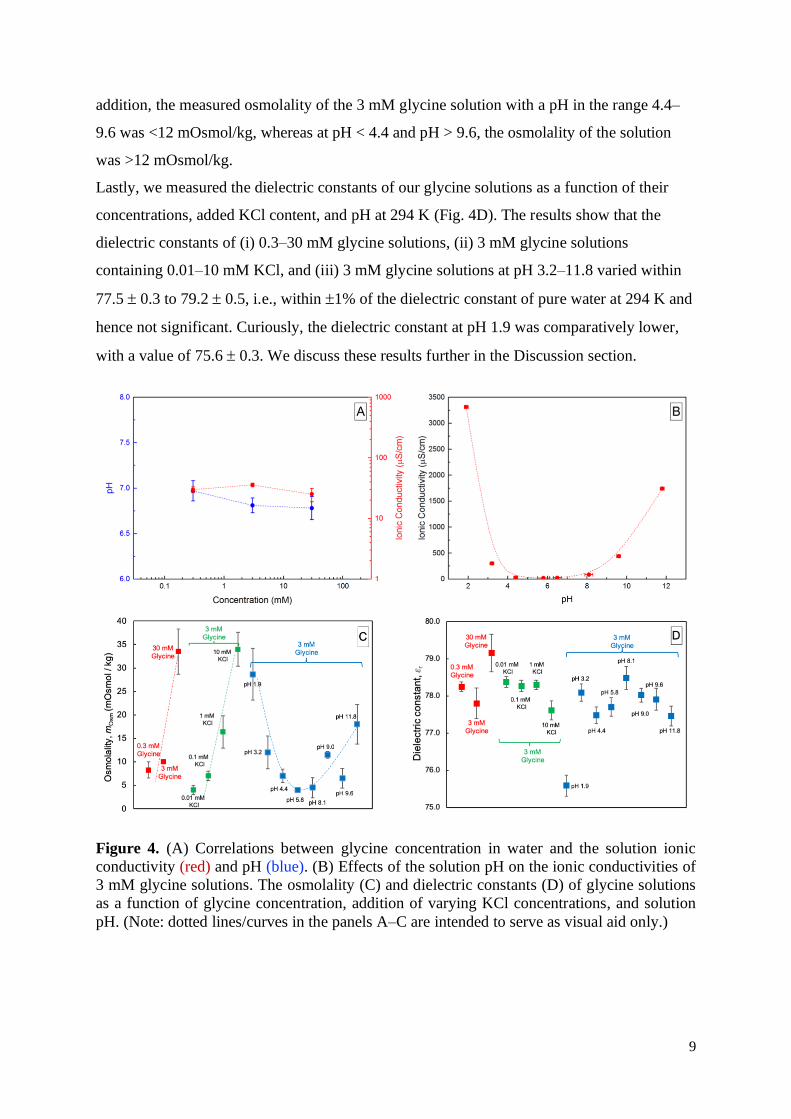
We measured the ionic conductivities of glycine solutions as a function of their concentration
and solution pH. At pH 7 ± 0.25, the ionic conductivities for 0.3 mM, 3 mM, and 30 mM
glycine solutions were in the range 30–50 μS/cm (Fig. 4A) and were independent of the
solute concentration. In stark contrast, ionic conductivities of 3 mM glycine solutions
increased to 250 μS/cm when the solution pH was adjusted to 3 or 9 (Fig. 4B). Specifics of
the differences between the anionic and cationic forms are discussed later.
We next quantified the osmolality of aqueous solutions as a function of the glycine
concentration, added KCl content, and the pH. The experimental osmolality of the 0.3 mM, 3
mM, and 30 mM glycine solutions was 8.3 ± 1.7, 10.0 ± 0.1, and 33.5 ± 4.8 mOsmol/kg,
respectively (Fig. 4C). Similar trends were observed for the glycine solutions with different
KCl concentrations; that is, osmolality increased with increasing KCl concentration. In
Height (Å)
0.7
0
Height (Å)
8
0
Height (Å)
0.8
0
pH 1.7 pH 6.8 pH 11.8
A B C
-0.1
0.1
0.3
0.5
0 1 2 3 4
He
igh
t (n
m)
Axis (μm)
-0.1
0.1
0.3
0.5
0 1 2 3 4
He
igh
t (n
m)
Axis (μm)
-0.1
0.1
0.3
0.5
0 1 2 3 4H
eig
ht
(nm
)
Axis (μm)
9
addition, the measured osmolality of the 3 mM glycine solution with a pH in the range 4.4–
9.6 was <12 mOsmol/kg, whereas at pH < 4.4 and pH > 9.6, the osmolality of the solution
was >12 mOsmol/kg.
Lastly, we measured the dielectric constants of our glycine solutions as a function of their
concentrations, added KCl content, and pH at 294 K (Fig. 4D). The results show that the
dielectric constants of (i) 0.3–30 mM glycine solutions, (ii) 3 mM glycine solutions
containing 0.01–10 mM KCl, and (iii) 3 mM glycine solutions at pH 3.2–11.8 varied within
77.5 0.3 to 79.2 0.5, i.e., within 1% of the dielectric constant of pure water at 294 K and
hence not significant. Curiously, the dielectric constant at pH 1.9 was comparatively lower,
with a value of 75.6 0.3. We discuss these results further in the Discussion section.
Figure 4. (A) Correlations between glycine concentration in water and the solution ionic
conductivity (red) and pH (blue). (B) Effects of the solution pH on the ionic conductivities of
3 mM glycine solutions. The osmolality (C) and dielectric constants (D) of glycine solutions
as a function of glycine concentration, addition of varying KCl concentrations, and solution
pH. (Note: dotted lines/curves in the panels A–C are intended to serve as visual aid only.)

10
DISCUSSION
In this section, we draw upon our results to address the questions posed in the Introduction.
Our key finding is that, in dilute solutions, zwitterions layer/adsorb at electrified
interfaces but do not electrostatically screen them. We explain why the addition of glycine
leads to no observable differences in the Debye lengths and surface forces in the
concentration range 0.3–30 mM, unlike the case where hard ions are present (Fig. 2A-B).
To facilitate the discussion, we first consider some important formulae related to the range
and magnitude of electrostatic surface forces. The first equation is for the Debye length, 𝜆 =
(2𝑁A𝑒2𝐼
𝜀o𝜀r𝑘B 𝑇)
−1/2
, where εoεr is the permittivity of the medium, NA is Avogadro’s number, e is the
electronic charge, I is the ionic strength of the electrolytes, kB is the Boltzmann constant, and
T is the absolute temperature32. Ionic strength, in turn, is described by the equation 𝐼 =
1
2∑ 𝐶𝑖𝑧𝑖
2𝑖 , where Ci and zi denote the concentration and charge of species i, respectively. Next,
the expression for the normalized surface force investigated in our experiments can be
analytically derived as 𝐹
𝑅=
64𝜋𝜀o𝜀r
𝜆(
𝑘B𝑇
𝑒)
2tanh2 (
𝑒𝜓o
4𝑘𝑇) 𝑒−
𝐷
𝜆 , where D is the separation
distance between two surfaces and 𝜓o is the surface potential15.
We now consider the dependence of 𝜆 on εr and I. The negligible variations in the measured
surface forces’ magnitude and range (Fig. 2A-B) and the dielectric constants of glycine
solutions, εr, in the range 0.3–30 mM (Fig. 4D) imply that the contribution to I must also be
minimal. This argument demonstrates that zwitterions do not contribute to I, and hence 𝜆, in
dilute solutions. This result challenges previous proposals for assigning partial/elementary
charges28, 36-42 to zwitterions when estimating their contributions to I. Interestingly, the
variation in the dielectric constants of 3 mM glycine solutions containing 0.01–10 mM KCl
and whose pH values were adjusted in the range 3.2–11.8 is also small. We consider that, in
the pH range 4–9, the contributions of hard ions K+, H+, Cl−, and OH− and zwitterions are
opposite: hard ions decrease the dielectric constant, whereas glycine increases it as εr = 78.5 +
δ×Cosmolyte [M], where = /mol 43. At pH 1.9, the dielectric constant changes
substantially, whereas this change is not observed at pH 11.8; this difference warrants further
investigation.
Next, we use theory to pinpoint the effects of glycine’s zwitterionic and ionic forms on the
screening of the electrostatic potential of silica and mica surfaces. To this end, we conducted
11
100 force-runs in each solution and analyzed the results statistically. Each curve was fitted
with an exponential decay function, and pre-exponential factors in the linear (semi-
logarithmic force‒distance) regime were used to calculate surface potentials at the outer
Helmholtz layer15. Thus, the calculated surface potentials for silica in 0.3 mM, 3 mM, and 30
mM glycine solutions were 42 ± 7 mV (Table 1). By contrast, the addition of 0.01 mM, 0.1
mM, 1 mM, and 10 mM KCl to 3 mM glycine resulted in a dramatic decrease in the
calculated surface potential from 40 mV to 38 mV, 25 mV, and 10 mV, respectively. These
results demonstrate that zwitterions do not lead to electrostatic screening under dilute
conditions. In addition, we repeated these experiments using AFM colloidal probes of
different sizes and observed consistent trends (SI Fig. S1).
We here explain the effects of water pH on the Debye lengths and surface forces in glycine
solutions, as observed in our experiments with silica–silica (Fig. 2A) and mica–mica systems
(Fig. 2B). In the pH range 7.8–11.8, glycine is present in the anionic state because of
deprotonation of its –NH3+ and –COOH groups (SI Figs. S2 and S3); in the pH < 5 range,
glycine becomes a cation because of protonation of its –NH3 and –COO− groups34. In its
anionic and cationic states, glycine contributes to I, which influences 𝜆 and leads to a
decrease in the magnitude and range of surface forces. By contrast, when the pH is in the
range 4–9, glycine exists as a zwitterion and does not contribute to I, as previously
demonstrated; thus, the Debye lengths are unaffected. In addition, the electrical conductivities
of solutions containing purely ionic forms of glycine exhibit a conductivity as much as
sixfold higher than that of solutions containing the zwitterionic form of glycine. Notably,
water’s intrinsic ionic strength cannot be neglected in solutions containing purely zwitterionic
glycine. Table 1 summarizes the effects of the glycine concentration, added KCl content, and
water pH on the electrical conductivity, I, εr, mosm, 𝜆, repulsive electrostatic forces (at 20 nm),
and Ψsilica at various pH values.

12
Table 1. Summary of experimental data and calculated values presented in the present work.
pH Composition
Ionic
Conductivity
(μS/cm)
I (M)a εr mosm
(mOsmol/kg)
𝜆 (nm)b F/R (mN/m)c Ψsilica (mV) b
6.9 ± 0.3 0.3 mM glycine 29.8 ± 3.2 6.1 × 10⁻⁶ 78.2 ± 0.1 33.5 ± 4.8 46.1 ± 1.3 0.187 −40.7 ± 3.8
6.8 ± 0.3 3 mM glycine 35.7 ± 2.4 4.8 × 10⁻⁶ 77.8 ± 0.4 10.0 ± 0.1 45.7 ± 7.1 0.188 −41.5 ± 5.0
6.7 ± 0.2 30 mM glycine 25.1 ± 6.2 3.5 × 10⁻⁶ 79.2 ± 0.5 8.3 ± 1.7 48.1 ± 3.6 0.186 −43.4 ± 5.8
6.4 ± 0.3 3 mM glycine +
0.01 mM KCl 32.4 ± 1.1 7.4 × 10⁻⁶ 78.4 ± 0.1 34.0 ± 3.6 43.3 ± 1.6 0.188 −40.4 ± 6.1
6.2 ± 0.2 3 mM glycine + 0.1
mM KCl 96.3 ± 4.4 5.2 × 10⁻⁵ 78.3 ± 0.2 16.4 ± 3.4 27.6 ± 4.1 0.185 −38.6 ± 7.3
6.2 ± 0.2 3 mM glycine + 1
mM KCl 271.0 ± 0.5 5.0 × 10⁻⁴ 78.3 ± 0.1 7.0 ± 1.0 10.1 ± 0.9 0.05 −23.5 ± 8.3
6.2 ± 0.2 3 mM glycine +10
mM KCl 1461.8 ± 7.9 5.0 × 10⁻³ 77.6 ± 0.3 4.0 ± 1.0 4.5 ± 0.9 ~0 −9.6 ± 5.6
1.9 ± 0.1 3 mM glycine 3313.1 ±
5.86 1.5 × 10⁻² 75.6 ± 0.3 28.7 ± 5.5 1.5 ± 0.5 ~0 −4.33 ± 0.6
3.2 ± 0.1 3 mM glycine 302.4 ± 4.40 1.0 × 10⁻³ 78.1 ± 0.2 12.0 ± 3.5 10.7 ± 0.9 0.03 −14.9 ± 4.8
4.4 ± 0.1 3 mM glycine 26.9 ± 5.49 6.6 × 10⁻⁵ 77.5 ± 0.2 7.0 ± 1.4 25.6 ± 0.4 0.11 −28.4 ± 3.1
5.8 ± 0.2 3 mM glycine 21.8 ± 17.16 2.6 × 10⁻⁶ 77.7 ± 0.2 4.0 ± 0.1 45.0 ± 2.3 0.17 −41.3 ± 4.9
6.5 ± 0.3 3 mM glycine 23.4 ± 15.37 2.4 × 10⁻⁶ 78.5 ± 0.3 4.5 ± 2.1 43.0 ± 1.6 0.17 −39.8 ± 4.8
8.1 ± 0.2 3 mM glycine 82.9 ± 7.02 9.3 × 10⁻⁵ 78.0 ± 0.3 11.5 ± 2.1 27.3 ± 2.0 0.13 −43.3 ± 4.9
9.6 ± 0.2 3 mM glycine 439.5 ± 8.96 1.5 × 10⁻³ 77.9 ± 0.3 6.5 ± 2.1 11.0 ± 0.9 0.06 −23.1 ± 9.3
11.8 ± 0.1 3 mM glycine 1740.5 ±
14.88 9.3 × 10⁻³ 77.5 ± 0.3 18.0 ± 4.2 3.6 ± 0.6 ~0 −6.9 ± 1.5
aZwitterions do not contribute to ionic strength. bAverage values from 100 force curves. cMagnitude of surface forces at 20 nm.
We here discuss our mechanistic understanding of the observed similarities and differences in
the effects of zwitterions and ions at electrified interfaces. Textbook physics tells us that
electrified interfaces repel similarly charged ions and attract counter-ions to form a diffuse
electrical double layer (EDL). Consequently, the surface potential (or electrical charge
density) perceived outside the EDL is substantially reduced (Fig. 5A). Although zwitterions
adsorb onto electrified interfaces (Fig. 3B), they do not affect the net electrical potential (or
the surface charge density) because each zwitterionic species comprises an explicit positive
and negative charge (Fig. 5B). This inseparability of the + and − charges precludes the
accumulation of counterions, thereby obviating screening of electrical field/potential/charge
density. Depending on the surface charge, adsorbed zwitterions might orient/distribute in a ±
or ∓ alignment with the surface; depending on the surface charge density, a lateral
interdigitation, ± ∓ ± ∓ ± ∓, might also be possible along the surface. Nanoscale
confinement between charged surfaces of similar/dissimilar surface charge density could

13
further complicate this matter. These aspects should be explored further via complementary
experiments and theory. By contrast, when the solution pH is 11.8 (Fig. 3C) and glycine
transitions to its anionic form, it is repelled by the negatively charged surfaces. The cationic
form (pH 1.7) (Fig. 3A) also fails to adsorb onto the negatively charged surface; it is
outcompeted by protons because their small size enables them to better fit into the negatively
charged sites44. At electrified interfaces, zwitterions form a layer akin to the Helmholtz layer
of hard ions; however, their distribution might not follow Boltzmann statistics.
Figure 5. Schematic of the ion/molecule distribution on the negatively charged surface in an
aqueous solution. (A) Illustration of monovalent ions on the negatively charged surface in an
aqueous solution. The inset shows the concentration of monovalent cations and anions as a
function of the distance from a negatively charged surface. (B) Illustration of zwitterions on
the negatively charged surface in an aqueous solution. The inset illustrates the concentration of
cations and anions on a zwitterionic osmolyte as a function of the distance from a negatively
charged surface.
Here, we comment on the contribution of glycine speciation on surface forces in concentrated
solutions. We remind the reader that, in the pH range 5–7, more than 99.95% of glycine
remains in the zwitterion state (SI Fig. S3). Thus, in dilute solutions (e.g., ≤30 mM), the ionic
form of glycine is only 0.05% and its contribution to the ionic strength is 1.5 × 10⁻⁶ M. This
contribution is, in fact, lower than the ionic strength of water in equilibrium with atmospheric
CO2 (pH 5.6, 5 × 10⁻⁶ M). Therefore, the effects of speciation are negligible in dilute glycine
solutions. By contrast, if the glycine concentration is very high, e.g., 3 M in the pH range 5–

14
7, the speciation into the ionic form would be ~15 mM, which is expected to suppress
electrostatics with a Debye length of 2‒3 nm. Therefore, our results are consistent with the
latest findings on the resurrection of electrostatics at high (1–3 M) osmolyte concentrations.
Lastly, we note that, even though zwitterions do not affect ionic strength, surface forces,
potentials, or Debye lengths, they do contribute to solutions’ osmotic pressure (Fig. 4C). The
van’t Hoff equation describes this relationship as 𝛱 = 𝑅𝑇 ∑ 𝑛𝑖𝐶𝑖𝑖 , where is the osmotic
pressure, R is the universal gas constant, T is the absolute temperature, and ni is the van’t
Hoff factor. Note that the observed nonlinearity in the osmolality measurements at 0.3 mM is
attributed to the instrument’s limited accuracy outside its operating range (20–3200
mOsmol/kg).
CONCLUSION
Our curiosity-driven investigation of zwitterions and ions at electrified surfaces revealed that
zwitterions exhibit a rich range of effects depending on the solution pH and concentration.
Whereas hard ions such as K+ and Cl− always contribute to ionic strength, zwitterions do not
contribute to ionic strength in dilute solutions. Whereas hard ions adsorb at charged interfaces
and screen them, zwitterions form a layer at charged interfaces but do not screen them.
Therefore, the magnitudes and ranges of electrostatic surface forces remain unaffected in
such solutions. These distinctive behaviors of zwitterions are due to their unusual structure
that renders the positive and negative charges inseparable. Thus, zwitterions do not impact
electrostatics inside the EDL and the Boltzmann distribution is consequently not relevant to
describe their interfacial activity. Zwitterionic surface adsorption would likely depend on the
interfacial charge density, the molecular dimensions of zwitterions, and competing effects
with other species, e.g., protons; molecular simulations are warranted to probe this further.
Our surface force measurements demonstrate how zwitterions, but not hard ions, can
maintain the finely tuned balance of electrostatic forces, Debye lengths, and electrical
conductivities in dilute solutions with concentrations varying more than 100-fold.
Simultaneously, zwitterions contribute to the osmotic pressure in the same manner as hard
ions. Therefore, they can facilitate a reliable evolutionary strategy to support life under
osmotic stresses. Our report thus provides a surface-forces-based reductionist rationale for the
exploitation of zwitterionic osmolytes such as glycine by extremophiles. These findings
should also guide the rational design of biocatalysts45, energy harvesting46, and nanofluidic
devices47, 48, and beyond21.

15
METHODS
Materials. Glycine, potassium chloride (KCl), potassium hydroxide (KOH), and
hydrochloric acid (HCl) were purchased from Sigma-Aldrich and were used as-received.
Glycine was added to deionized (DI) water from a MilliQ Advantage 10 system (resistivity of
18 MΩ cm, pH 5.7 ± 0.1, and total organic carbon (TOC) ≤ 2 ppm) to prepare solutions with
specific concentrations of 0.3 mM, 3 mM, and 30 mM glycine. The solutions were titrated
with KOH or HCl to obtain the desired pH. All the experiments were conducted at 21.0 ±
0.5°C. AFM cantilevers with a silica colloidal tip were purchased from Nanoscribe. Si wafers
(<100> orientation) with a 2.4 μm-thick thermal oxide layer were purchased from Silicon
Valley Microelectronics. Muscovite mica substrates were purchased from S&J Trading.
Solution pH, ionic conductivity, osmotic pressure, and dielectric constant. Solutions’ pH
and conductivity were quantified using a Mettler SevenCompact Duo S213 pH/conductivity
benchtop meter. Prior to the measurements, the instrument was calibrated using standard
solutions of pH 4, 7, and 10 and solutions with electrical conductivities of 5 µS/cm and 1443
µS/cm. A Vapro 5600 vapor pressure osmometer was used to measure solutions’ osmolality
after being calibrated with standard solutions with osmolalities of 100 mmol/kg, 290
mmol/kg, and 1000 mmol/kg. The dielectric constants of solutions were measured using an
open-ended coaxial probe connected to a frequency vector analyzer (300 kHz to 4.5 GHz).
Prior to the measurement, the instrument was calibrated with open, short, load (DI water)
calibration.
Atomic force microscopy (AFM). A JPK Nanowizard Ultraspeed-II atomic force
microscope was used to image glycine adsorbed onto the mica surface and measuring the
interaction forces between the silica surfaces in dilute solutions. For the imaging, AFM
cantilevers with Sb-doped silica tips (spring constant, k = 2.8 N/m) were used in tapping
mode. For the surface force measurement, AFM cantilevers with silica colloidal probes at
their tips (tip diameter, D = 15 ± 3 µm; k = 0.32 N/m) were used against a SiO2 (2.4 µm)/Si
surface of a <001> Si wafer. The sensitivity and k of the cantilevers were calibrated via the
contact-based and thermal noise methods, respectively49. The force between the colloidal
probe and the substrate was measured by recording the deflection, ∆𝑑, which converted into
force using Hooke’s law, 𝐹 = 𝑘∆𝑑. Prior to the measurement, the AFM cantilevers and
substrates were cleaned using O2 plasma generated in a Diener Zepto plasma system (process
conditions: radio-frequency power = 100 W, pressure = 300 mTorr, O2 flow rate = 16.5 sccm,
duration = 3 min).
16
Surface force apparatus (SFA). An SFA-2000 apparatus (SurForce, Santa Barbara, USA)
was used to simultaneously measure distances and forces between molecularly smooth mica
films in aqueous solutions. To prepare the mica film, one side of them was coated with a 50
nm-thick Au layer; the Au-coated mica films were then glued onto transparent silica discs
with a cylindrical face with a radius of curvature, R, of 1–2 cm. The Au-coated side was
glued, and the pristine mica surface remained exposed. Pairs of mica/Au/glue/disk samples,
where the mica was obtained from the same “mother” film to ensure equal thickness, were
placed in a cross-cylinder geometry. The distances and forces between the surfaces were
determined via white-light multiple-beam interferometry that yielded fringes of equal
chromatic order (FECO)35. Surfaces were first brought into contact in a dry N2 environment
to assess the films’ thickness; the surfaces were then separated and approximately 50 µL of
an aqueous solution was placed between the samples. The top surface remained fixed, and the
bottom surface affixed to a cantilever was driven upward at ~10 nm/s using a motor.
Repulsion between the surfaces reduced the approach speed, which bent the cantilever (k ≈ 2
kN/m); this bending force was recorded to characterize the surface forces.
17
DATA AVAILABILITY
The authors declare that all the data supporting the findings of this study are available within
the paper and its Supplementary Information. All data available in this work are available
from the authors per request.
REFERENCES
1. Yancey, P. H.; Clark, M. E.; Hand, S. C.; Bowlus, R. D.; Somero, G. N., Living
with water stress: evolution of osmolyte systems. Science 1982, 217 (4566), 1214.
2. Warshel, A.; Sharma, P. K.; Kato, M.; Xiang, Y.; Liu, H.; Olsson, M. H. M.,
Electrostatic Basis for Enzyme Catalysis. Chemical Reviews 2006, 106 (8), 3210-3235.
3. Tanford, C.; Reynolds, J., Nature's Robots: A History of Proteins. Oxford University
Press: New York, 2003.
4. Mukherjee, M.; Mondal, J., Unifying the Contrasting Mechanisms of Protein-
Stabilizing Osmolytes. The Journal of Physical Chemistry B 2020, 124 (30), 6565-6574.
5. Mishra, H.; Enami, S.; Nielsen, R. J.; Hoffmann, M. R.; Goddard, W. A.; Colussi,
A. J., Anions dramatically enhance proton transfer through aqueous interfaces. Proc. Acad.
Natl. Sci. U.S.A. 2012, 109 (26), 10228-10232.
6. Hillel, D., Introduction to Soil Physics. Academic Press: 1982.
7. Carrouel, F.; Viennot, S.; Ottolenghi, L.; Gaillard, C.; Bourgeois, D., Nanoparticles
as Anti-Microbial, Anti-Inflammatory, and Remineralizing Agents in Oral Care Cosmetics: A
Review of the Current Situation. Nanomaterials 2020, 10 (1).
8. Das, R.; Arunachalam, S.; Ahmad, Z.; Manalastas, E.; Mishra, H., Bio-inspired gas-
entrapping membranes (GEMs) derived from common water-wet materials for green
desalination. Journal of Membrane Science 2019, 588, 117185.
9. Santana, A.; Farinha, A. S. F.; Toraño, A. Z.; Ibrahim, M.; Mishra, H., A first-
principles approach for treating wastewaters. International Journal of Quantum Chemistry
2021, 121 (5), e26501.
10. Nauruzbayeva, J.; Sun, Z.; Gallo, A.; Ibrahim, M.; Santamarina, J. C.; Mishra, H.,
Electrification at water–hydrophobe interfaces. Nature Communications 2020, 11 (1), 5285.
11. Benjamin, M. M., Water Chemistry. Second ed.; Waveland Press, Inc.: Long Grove,
IL, USA, 2015.
12. Dishon, M.; Zohar, O.; Sivan, U., From Repulsion to Attraction and Back to
Repulsion: The Effect of NaCl, KCl, and CsCl on the Force between Silica Surfaces in
Aqueous Solution. Langmuir 2009, 25 (5), 2831-2836.
13. Lee, A. A.; Perez-Martinez, C. S.; Smith, A. M.; Perkin, S., Scaling Analysis of the
Screening Length in Concentrated Electrolytes. Physical Review Letters 2017, 119 (2),
026002.
14. Ma, C. D.; Wang, C.; Acevedo-Vélez, C.; Gellman, S. H.; Abbott, N. L.,
Modulation of hydrophobic interactions by proximally immobilized ions. Nature 2015, 517
(7534), 347-350.
15. Israelachvili, J. N., Intermolecular and Surface Forces. Third ed.; Academic Press,
Elsevier Inc.: 2011.
16. Ravera, F.; Dziza, K.; Santini, E.; Cristofolini, L.; Liggieri, L., Emulsification and
emulsion stability: The role of the interfacial properties. Advances in Colloid and Interface
Science 2021, 288, 102344.
17. Hasegawa, P. M.; Bressan, R. A.; Zhu, J.-K.; Bohnert, H. J., Plant cellular and
molecular responses to high salinity. Annual Review of Plant Physiology and Plant
Molecular Biology 2000, 51 (1), 463-499.

18
18. Famiglietti, J. S.; Ferguson, G., The hidden crisis beneath our feet. Science 2021, 372
(6540), 344.
19. Coleridge, S. T., The Rime of the Ancient Mariner. Dover Publications: 1992.
20. Yancey, P. H., Organic osmolytes as compatible, metabolic and counteracting
cytoprotectants in high osmolarity and other stresses. Journal of Experimental Biology 2005,
208 (15), 2819.
21. Rothschild, L. J.; Mancinelli, R. L., Life in extreme environments. Nature 2001, 409
(6823), 1092-1101.
22. Abobatta, W. F., Plant Responses and Tolerance to Extreme Salinity: Learning from
Halophyte Tolerance to Extreme Salinity. In Salt and Drought Stress Tolerance in Plants:
Signaling Networks and Adaptive Mechanisms, Hasanuzzaman, M.; Tanveer, M., Eds.
Springer International Publishing: Cham, 2020; pp 177-210.
23. Kamerlin, S. C. L.; Warshel, A., At the dawn of the 21st century: Is dynamics the
missing link for understanding enzyme catalysis? Proteins: Structure, Function, and
Bioinformatics 2010, 78 (6), 1339-1375.
24. Shrestha, B. R.; Pillai, S.; Santana, A.; Donaldson Jr, S. H.; Pascal, T. A.; Mishra,
H., Nuclear Quantum Effects in Hydrophobic Nanoconfinement. The Journal of Physical
Chemistry Letters 2019, 10 (18), 5530-5535.
25. Lang, F.; Busch, G. L.; Ritter, M.; VÖLkl, H.; Waldegger, S.; Gulbins, E.;
HÄUssinger, D., Functional Significance of Cell Volume Regulatory Mechanisms.
Physiological Reviews 1998, 78 (1), 247-306.
26. Stellwagen, E.; Prantner, J. D.; Stellwagen, N. C., Do zwitterions contribute to the
ionic strength of a solution? Analytical Biochemistry 2008, 373 (2), 407-409.
27. Romanenko, V.; Rothblat, G.; Levitan, I., Sensitivity of Volume-regulated Anion
Current to Cholesterol Structural Analogues. The Journal of general physiology 2004, 123,
77-87.
28. Cecchi, T.; Pucciarelli, F.; Passamonti, P., Ion-interaction chromatography of
zwitterions. The fractional charge approach to model the influence of the mobile phase
concentration of the ion-interaction reagent. Analyst 2004, 129 (11), 1037-1046.
29. Kamerlin, S. C. L.; Sharma, P. K.; Chu, Z. T.; Warshel, A., Ketosteroid isomerase
provides further support for the idea that enzymes work by electrostatic preorganization.
Proceedings of the National Academy of Sciences 2010, 107 (9), 4075.
30. Israelachvili, J.; Wennerström, H., Role of hydration and water structure in biological
and colloidal interactions. Nature 1996, 379 (6562), 219-225.
31. Baimpos, T.; Shrestha, B. R.; Raman, S.; Valtiner, M., Effect of Interfacial Ion
Structuring on Range and Magnitude of Electric Double Layer, Hydration, and Adhesive
Interactions between Mica Surfaces in 0.05–3 M Li+ and Cs+ Electrolyte Solutions.
Langmuir 2014, 30 (15), 4322-4332.
32. Govrin, R.; Tcherner, S.; Obstbaum, T.; Sivan, U., Zwitterionic Osmolytes Resurrect
Electrostatic Interactions Screened by Salt. J Am Chem Soc 2018, 140 (43), 14206-14210.
33. Iler, R. K., The colloid chemistry of silica and silicates. LWW: 1955; Vol. 80.
34. McMurry, J., Organic chemistry. Brooks/Cole, USA 2000, 895, 1003.
35. Israelachvili, J.; Min, Y.; Akbulut, M.; Alig, A.; Carver, G.; Greene, W.;
Kristiansen, K.; Meyer, E.; Pesika, N.; Rosenberg, K.; Zeng, H., Recent advances in the
surface forces apparatus (SFA) technique. Rep Prog Phys 2010, 73 (3).
36. Roy, R. N.; Robinson, R. A.; Bates, R. G., Thermodynamics of the two dissociation
steps of N-tris (hydroxymethyl) methylglycine (Tricine) in water from 5 to 50.deg. Journal of
the American Chemical Society 1973, 95 (25), 8231-8235.

19
37. Rodríguez, H.; Soto, A.; Arce, A.; Khoshkbarchi, M. K., Apparent Molar Volume,
Isentropic Compressibility, Refractive Index, and Viscosity of DL-Alanine in Aqueous NaCl
Solutions. Journal of Solution Chemistry 2003, 32 (1), 53-63.
38. Wenner, J. R.; Bloomfield, V. A., Buffer Effects onEcoRV Kinetics as Measured by
Fluorescent Staining and Digital Imaging of Plasmid Cleavage. Anal Biochem 1999, 268 (2),
201-212.
39. Karamanos, N. K.; Lamari, F., State-of-the-art of capillary electrophoresis with
application to the area of glycoconjugates. Biomedical Chromatography 1999, 13 (8), 501-
506.
40. Romanenko, V. G.; Rothblat, G. H.; Levitan, I., Sensitivity of Volume-regulated
Anion Current to Cholesterol Structural Analogues. Journal of General Physiology 2003, 123
(1), 77-88.
41. Ramasami, T.; Taylor, R. S.; Sykes, A. G., Evidence for a dissociative mechanism in
the reaction of glycine with aquopentaamminechromium(III). Ionic strength contributions (as
a 1:1 electrolyte) and ion-pairing (KIP) ability of the glycine zwitterion. Inorganic Chemistry
1976, 15 (9), 2318-2320.
42. Cecchi, T.; Cecchi, P., The dipole approach in the lon-interaction chromatography of
zwitterions— Use of a potential approximation to obtain a simplified retention equation.
Chromatographia 2002, 55 (5), 279-282.
43. Oster, G.; Price, D.; Joyner, L. G.; Kirkwood, J. G., The Dielectric Constants of
Solutions of Glycine and Pyridine Betaine in Water—Dioxane Mixtures. J Am Chem Soc
1944, 66 (6), 946-948.
44. Pashley, R. M.; Israelachvili, J. N., Dlvo and hydration forces between mica surfaces
in Mg2+, Ca2+, Sr2+, and Ba2+ chloride solutions. Journal of Colloid and Interface Science
1984, 97 (2), 446-455.
45. Gomes, J.; Steiner, W., The Biocatalytic Potential of Extremophiles and
Extremozymes. Food Technology and Biotechnology 2004, 42.
46. Xu, W.; Zheng, H.; Liu, Y.; Zhou, X.; Zhang, C.; Song, Y.; Deng, X.; Leung, M.;
Yang, Z.; Xu, R. X.; Wang, Z. L.; Zeng, X. C.; Wang, Z., A droplet-based electricity
generator with high instantaneous power density. Nature 2020, 578 (7795), 392-396.
47. Bocquet, L., Nanofluidics coming of age. Nature Materials 2020, 19 (3), 254-256.
48. Robin, P.; Kavokine, N.; Bocquet, L., Modeling of emergent memory and voltage
spiking in ionic transport through angstrom-scale slits. Science 2021, 373 (6555), 687.
49. Butt, H.-J.; Cappella, B.; Kappl, M., Force measurements with the atomic force
microscope: Technique, interpretation and applications. Surface Science Reports 2005, 59
(1), 1-152.
Acknowledgments
HM thanks Mr. Changzi Wang, a student from his course on Aquatic Chemistry (EnSE 202)
at KAUST, for bringing this problem to his attention. The authors are indebted to Mrs. Masha
Belyi (Research Scientist, Amazon) for creating a Python script for analyzing hundreds of
AFM force-distance curves generated in this work to pinpoint trends in Debye lengths and
surface potentials. MGR thanks Mr. Mohammad Abbas (KAUST) for discussions on cell
physiology; BRS thanks Dr. Bruno Torres (KAUST) for providing colloidal probes for AFM
20
experiments. The co-authors thank Ms. Ana Rouseva (KAUST) and Mr. Paulus Buijs
(KAUST) for assisting with osmotic pressure measurements presented in Fig. 5C; Dr. Farizal
Hakiki (KAUST) and Prof. Carlos Santamarina (KAUST) for characterizing dielectric
responses of solutions presented in Fig. 5D; and Mr. Heno Hwang, KAUST Illustrator, for
preparing Figures 1 and 5.
AUTHOR CONTRIBUTIONS
HM conceived the project and supervised the research. MGR performed AFM experiments
and reproduced BRS’s SFA data. BRS performed SFA experiments and reproduced MGR’s
AFM data. NM performs conductivity and pH measurements. MGR and NM perform
osmotic pressure measurements. MGR analyzes the dielectric constant measurement data and
osmotic pressure data. MGR wrote the first draft, revised by BRS and NM. HM rewrote and
finalized the manuscript.
COMPETING INTERESTS
The authors declare no competing interests.
ADDITIONAL INFORMATION
Supplementary information is available for this paper in the submission package.
21
Supplementary Information
Zwitterions Layer at but Do Not Screen Electrified Interfaces
Muhammad Ghifari Ridwan, Buddha Ratna Shrestha, Nischal Maharjan, Himanshu Mishra*
King Abdullah University of Science and Technology (KAUST), Water Desalination and
Reuse Center (WDRC), Biological and Environmental Science & Engineering Division
(BESE), Thuwal, 23955-6900, Saudi Arabia
*Corresponding Author: [email protected]

22
Force-distance curves for the silica–silica system obtained via colloidal probe AFM with
probe-tips of radius 6.6 μm.
Figure S1. Effects of glycine on the screening lengths and the normalized force–distance
curves for the silica–silica system probed via AFM using colloidal probes of radius 6.6 µm.
(A) Effects of glycine concentration in the range 0.3–30 mM on the measured interaction
forces. Dashed black lines are the best fits obtained using the equation 𝐹
𝑅=
64𝜋𝜀o𝜀r
𝜆(
𝑘B𝑇
𝑒)
2tanh2 (
𝑒𝜓o
4𝑘𝑇) 𝑒−
𝐷
𝜆 , where εoεr is the permittivity of the medium, e is the
electronic charge, kB is the Boltzmann constant, and T is the absolute temperature, I is the ionic
strength, 𝜆 is the Debye length, D is the separation distance between two surfaces and 𝜓o is the
surface potential1. The shaded area represents the errors associated with screening length
estimation (λ). (B) Effects of adding KCl to glycine solutions on the normalized force–distance
curves for the silica–silica system probed via colloidal probe AFM. Normalized force as a
function of distance between interacting surfaces 3 mM glycine solutions under (C) acidic and
(D) basic conditions.

23
Speciation of glycine with pH.
Figure S2. The chemical speciation of glycine as a function of solution pH: under acidic
conditions, majority of glycine exhibits a net positive charge; under basic conditions, majority
of glycine exhibits a net negative charge. At intermediate (near-neutral) pH conditions, glycine
is charged but overall neutral. (Please, see Fig. S3 for further details)

24
Speciation curves of glycine at various pH.
Figure S3. The fractions of different states of the amino acid glycine at different pH values.

25
References
1. Israelachvili, J. N., Intermolecular and Surface Forces. Third ed.; Academic Press, Elsevier
Inc.: 2011.