· fig. 1.1 shows the human heart and the main blood vessels. the functions of the parts of the...
TRANSCRIPT

Cambridge International ExaminationsCambridge International General Certificate of Secondary Education
0610/41May/June 2016
1 hour 15 minutes
BIOLOGYPaper 4 Theory (Extended)
Candidates answer on the Question Paper.
No Additional Materials are required.
READ THESE INSTRUCTIONS FIRST
Write your Centre number, candidate number and name on all the work you hand in.Write in dark blue or black pen.You may use an HB pencil for any diagrams or graphs.Do not use staples, paper clips, glue or correction fluid.DO NOTWRITE IN ANY BARCODES.
Answer all questions.
Electronic calculators may be used.You may lose marks if you do not show your working or if you do not use appropriate units.
At the end of the examination, fasten all your work securely together.The number of marks is given in brackets [ ] at the end of each question or part question.
This document consists of 20 printed pages.
[Turn over06_0610_41_2016_1.15© UCLES 2016
*7774192182*
www.dynamicpapers.com

Fig. 1.1 shows the human heart and the main blood vessels. The functions of the parts of theheart and some of the blood vessels are given in Table 1.1.
(a)1
A
B
C
D
E
F
G
H
J
K
Fig. 1.1
06_0610_41_2016_1.15© UCLES 2016
2 www.dynamicpapers.com

Complete Table 1.1.
One row has been done for you.
Table 1.1
nameletter onFig. 1.1
function
structure that separates oxygenated anddeoxygenated blood
structure that prevents backflow of bloodfrom ventricle to atrium
aortaAblood vessel that carries oxygenated blood
blood vessel that carries deoxygenated blood
structure that prevents backflow of bloodfrom pulmonary artery to right ventricle
chamber of the heart that contains oxygenated blood
chamber of the heart that contains deoxygenated blood
[6]
[Turn over06_0610_41_2016_1.15© UCLES 2016
3 www.dynamicpapers.com

A group of students used a heart monitor to record the pulse rate of an athlete during a 5000metre race. The recordings started just before the race began and ended just after it hadfinished, as shown in Fig. 1.2.
(b)
180
160
140
120
100
80
60
40
20
00 2 4 6 8 10 12 14 16 18
time / min
pulse rate/ beats perminute
start of race end of race
Fig. 1.2
Use data from Fig. 1.2 to describe the effect of exercise on the pulse rate of the athlete.(i)
................................................................................................................................
................................................................................................................................
................................................................................................................................
................................................................................................................................
................................................................................................................................
................................................................................................................................
................................................................................................................................ [3]
06_0610_41_2016_1.15© UCLES 2016
4 www.dynamicpapers.com

Explain the change in pulse rate between 2 minutes and 3 minutes after the recordingsstarted.
(ii)
................................................................................................................................
................................................................................................................................
................................................................................................................................
................................................................................................................................
................................................................................................................................
................................................................................................................................
................................................................................................................................
................................................................................................................................
................................................................................................................................ [4]
[Total: 13]
[Turn over06_0610_41_2016_1.15© UCLES 2016
5 www.dynamicpapers.com

The nervous system coordinates the responses of animals to changes in their environment.2
Fig. 2.1 shows the arrangement of the nervous system in a mammal.
Complete Fig. 2.1 by writing the names of the missing parts of the mammalian nervous systemin the boxes.
(a)
nervous system
brain ............................
............................nervous system
............................nervous system
cranial nerves spinal nerves
Fig. 2.1[3]
Fig. 2.2 is a flow chart that shows how an involuntary action is controlled.(b)
painful stimulus
pain receptor
X
relay neurone
motor neurone
muscle
response
Fig. 2.2
06_0610_41_2016_1.15© UCLES 2016
6 www.dynamicpapers.com
State the structure found at X.(i)
................................................................................................................................ [1]
State the type of involuntary action shown by the flow chart.(ii)
................................................................................................................................ [1]
State two ways in which a voluntary action differs from an involuntary action.(iii)
1 .............................................................................................................................
................................................................................................................................
2 .............................................................................................................................
................................................................................................................................
[2]
[Turn over06_0610_41_2016_1.15© UCLES 2016
7 www.dynamicpapers.com

Fig. 2.3 shows three pots of seedlings that have been kept in different conditions.(c)
pot P pot Q pot R
Fig. 2.3
State the conditions in which pots P and Q were kept.(i)
P .............................................................................................................................
Q.............................................................................................................................
[1]
State the name of the growth response shown by the seedlings in pot R.(ii)
................................................................................................................................ [2]
06_0610_41_2016_1.15© UCLES 2016
8 www.dynamicpapers.com

Explain the advantage to the seedlings of this growth response.(iii)
................................................................................................................................
................................................................................................................................
................................................................................................................................
................................................................................................................................
................................................................................................................................ [2]
Auxins control the growth responses of seedlings.
Explain how auxins control the growth response of the seedlings in pot R.
(iv)
................................................................................................................................
................................................................................................................................
................................................................................................................................
................................................................................................................................
................................................................................................................................
................................................................................................................................
................................................................................................................................
................................................................................................................................
................................................................................................................................ [4]
[Total: 16]
[Turn over06_0610_41_2016_1.15© UCLES 2016
9 www.dynamicpapers.com

Catalase is an enzyme that breaks down hydrogen peroxide inside cells. Red blood cells containcatalase.
3
Some dogs have an inherited condition in which catalase is not produced. This condition is knownas acatalasia and it is caused by a mutation in the gene for catalase.
Define the terms gene and gene mutation.(a)
gene...................................................................................................................................
...........................................................................................................................................
gene mutation....................................................................................................................
...........................................................................................................................................
[2]
A geneticist was asked to investigate the inheritance of acatalasia in dogs.(b)
The normal allele is represented by B and the mutant allele is represented by b.
The geneticist made the diagram in Fig. 3.1 to show the inheritance of acatalasia in a familyof dogs. The shaded symbols indicate the dogs with acatalasia.
1
4 5
2 3
normal male
normal female
male with acatalasia
female with acatalasia
Fig. 3.1
State the genotypes of the dogs identified as 1, 2 and 3 in Fig. 3.1.(i)
1 .............................................................................................................................
2 .............................................................................................................................
3 ............................................................................................................................. [3]
06_0610_41_2016_1.15© UCLES 2016
10 www.dynamicpapers.com
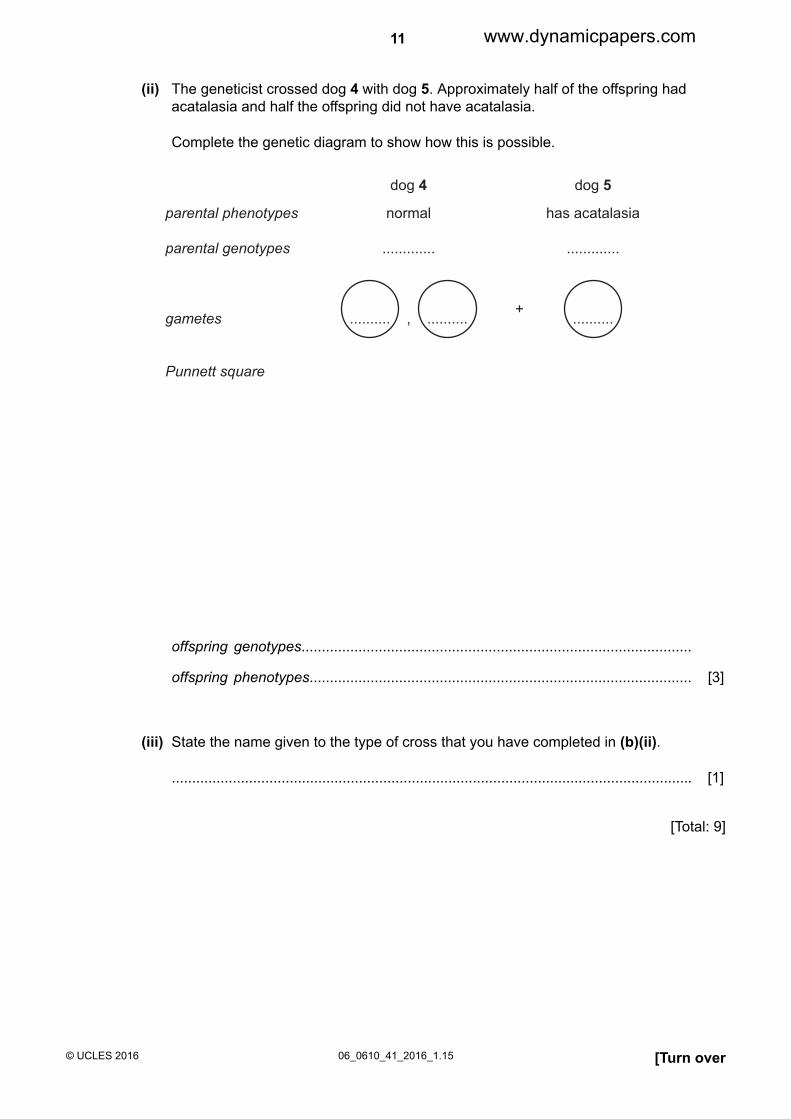
The geneticist crossed dog 4 with dog 5. Approximately half of the offspring hadacatalasia and half the offspring did not have acatalasia.
Complete the genetic diagram to show how this is possible.
(ii)
parental phenotypes
parental genotypes
gametes
Punnett square
normal
.............
.......... , ..........
dog 4
has acatalasia
.............
..........
dog 5
+
offspring genotypes................................................................................................
offspring phenotypes.............................................................................................. [3]
State the name given to the type of cross that you have completed in (b)(ii).(iii)
................................................................................................................................ [1]
[Total: 9]
[Turn over06_0610_41_2016_1.15© UCLES 2016
11 www.dynamicpapers.com

Rhabdostyla is a single-celled organism that has no cell wall and no chlorophyll.4
Gases are exchanged across the cell membrane of Rhabdostyla.
Name:
(a)
the gas produced by Rhabdostyla ....................................................................................
the process that produces the gas ...................................................................................
the method of removal of the gas .....................................................................................
[3]
Rhabdostyla lives in freshwater habitats, such as ponds, lakes and rivers.
Freshwater has a very low concentration of solutes.
Rhabdostyla has a contractile vacuole that fills with water and empties at intervals as shown inFig. 4.1. The contractile vacuole removes excess water.
contractile vacuole
contractile vacuole expels excess water
not drawn to scale
Fig. 4.1
Explain, using the term water potential, why Rhabdostyla needs to remove excess water.(b)
...........................................................................................................................................
...........................................................................................................................................
...........................................................................................................................................
...........................................................................................................................................
...........................................................................................................................................
...........................................................................................................................................
........................................................................................................................................... [3]
06_0610_41_2016_1.15© UCLES 2016
12 www.dynamicpapers.com

In an investigation, individual Rhabdostyla were placed into different concentrations of sea water.The rate of water excreted by the contractile vacuole of each organism was determined. The resultsare shown in Fig. 4.2.
20
18
16
14
12
10
8
6
4
2
0
rate ofwaterexcreted/ µm3 s–1
0 4
concentration of sea water / %
12
Fig. 4.2
Explain the results shown in Fig. 4.2.(c)
...........................................................................................................................................
...........................................................................................................................................
...........................................................................................................................................
...........................................................................................................................................
...........................................................................................................................................
...........................................................................................................................................
........................................................................................................................................... [3]
[Turn over06_0610_41_2016_1.15© UCLES 2016
13 www.dynamicpapers.com

Single-celled organisms with cell walls do not have contractile vacuoles. Suggest why.(d)
...........................................................................................................................................
...........................................................................................................................................
...........................................................................................................................................
...........................................................................................................................................
...........................................................................................................................................
...........................................................................................................................................
........................................................................................................................................... [3]
[Total: 12]
06_0610_41_2016_1.15© UCLES 2016
14 www.dynamicpapers.com
A researcher investigated the population growth of fish for fish farming. The researcher stocked afarmer’s lake with a small number of these fish and recorded the number of fish over the next fiveyears. The researcher’s results showed that the population of fish had increased exponentially.
5
Use the axes to show the exponential growth in the population of fish.
Label the axes and draw a suitable curve.
(i)(a)
[3]
Explain why the population of fish increased exponentially.(ii)
................................................................................................................................
................................................................................................................................
................................................................................................................................
................................................................................................................................
................................................................................................................................
................................................................................................................................
................................................................................................................................
................................................................................................................................
................................................................................................................................ [4]
[Turn over06_0610_41_2016_1.15© UCLES 2016
15 www.dynamicpapers.com
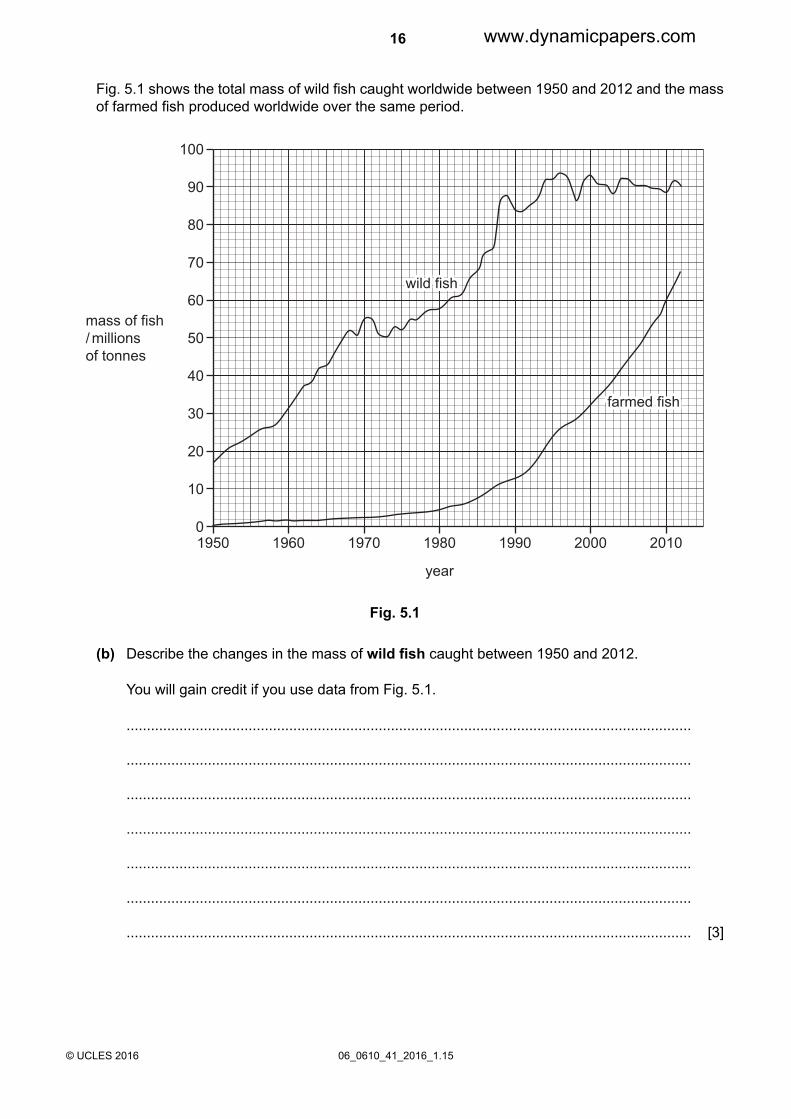
Fig. 5.1 shows the total mass of wild fish caught worldwide between 1950 and 2012 and the massof farmed fish produced worldwide over the same period.
wild fishwild fish
farmed fishfarmed fish
100
90
80
70
60
50
40
30
20
10
01950 1960 1970 1980
year
1990 2000 2010
mass of fish/ millions of tonnes
wild fish
farmed fish
Fig. 5.1
Describe the changes in the mass of wild fish caught between 1950 and 2012.
You will gain credit if you use data from Fig. 5.1.
(b)
...........................................................................................................................................
...........................................................................................................................................
...........................................................................................................................................
...........................................................................................................................................
...........................................................................................................................................
...........................................................................................................................................
........................................................................................................................................... [3]
06_0610_41_2016_1.15© UCLES 2016
16 www.dynamicpapers.com

It is predicted that wild fish stocks will decrease and become depleted because of overfishing.
Suggest ways in which governments can try to maintain the stocks of wild fish.
(c)
...........................................................................................................................................
...........................................................................................................................................
...........................................................................................................................................
...........................................................................................................................................
...........................................................................................................................................
...........................................................................................................................................
...........................................................................................................................................
...........................................................................................................................................
...........................................................................................................................................
...........................................................................................................................................
...........................................................................................................................................
...........................................................................................................................................
........................................................................................................................................... [6]
Like fish stocks, forests can be a sustainable resource.
Discuss what is meant by the term sustainable resource, using forests as an example.
(d)
...........................................................................................................................................
...........................................................................................................................................
...........................................................................................................................................
...........................................................................................................................................
...........................................................................................................................................
...........................................................................................................................................
........................................................................................................................................... [3]
[Total: 19]
[Turn over06_0610_41_2016_1.15© UCLES 2016
17 www.dynamicpapers.com
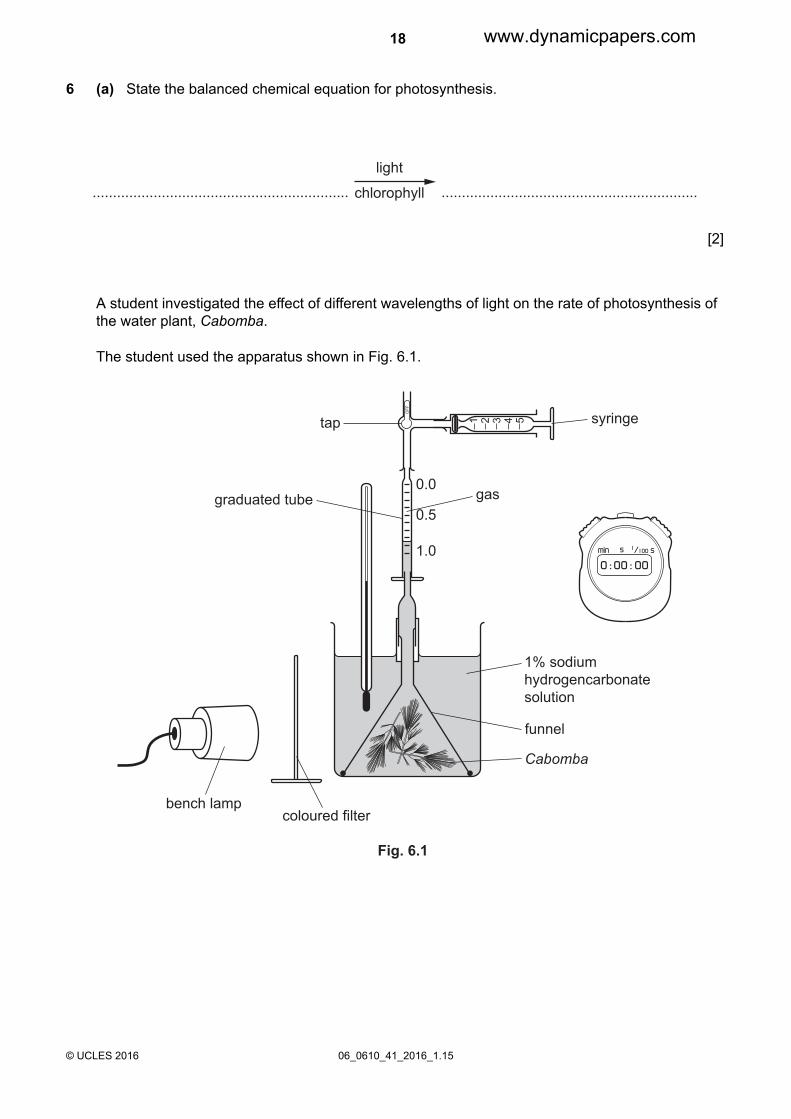
State the balanced chemical equation for photosynthesis.(a)6
............................................................... ...............................................................
light
chlorophyll
[2]
A student investigated the effect of different wavelengths of light on the rate of photosynthesis ofthe water plant, Cabomba.
The student used the apparatus shown in Fig. 6.1.
OFF
1 2 3 4 5
bench lampcoloured filter
graduated tube gas
syringetap
1% sodiumhydrogencarbonatesolution
funnel
Cabomba
0.0
0.5
1.0
Fig. 6.1
06_0610_41_2016_1.15© UCLES 2016
18 www.dynamicpapers.com

The student collected the gas produced by the plant for five minutes. The results are shownin Table 6.1.
(b)
Table 6.1
volume of gascollected / cm3
wavelength oflight / nm
colour of filter
0.80400violet
0.80475blue
0.20550green
0.40600yellow
0.90675red
Describe the effect of wavelength of light on the rate of photosynthesis as shown in the student’sresults in Table 6.1.
You will gain credit if you use data from the table.
...........................................................................................................................................
...........................................................................................................................................
...........................................................................................................................................
...........................................................................................................................................
...........................................................................................................................................
...........................................................................................................................................
........................................................................................................................................... [3]
State how the student would calculate the rates of photosynthesis from the results in Table 6.1.(c)
...........................................................................................................................................
........................................................................................................................................... [1]
[Turn over06_0610_41_2016_1.15© UCLES 2016
19 www.dynamicpapers.com

State why the student:(d)
kept the lamp at the same distance during the investigation,(i)
................................................................................................................................
................................................................................................................................
................................................................................................................................ [1]
used sodium hydrogencarbonate solution.(ii)
................................................................................................................................
................................................................................................................................
................................................................................................................................ [1]
State three uses in a plant of the carbohydrate produced in photosynthesis.(e)
1.........................................................................................................................................
2.........................................................................................................................................
3.........................................................................................................................................
[3]
[Total: 11]
Permission to reproduce items where third-party owned material protected by copyright is included has been sought and cleared where possible. Every reasonableeffort has been made by the publisher (UCLES) to trace copyright holders, but if any items requiring clearance have unwittingly been included, the publisher willbe pleased to make amends at the earliest possible opportunity.
To avoid the issue of disclosure of answer-related information to candidates, all copyright acknowledgements are reproduced online in the Cambridge InternationalExaminations Copyright Acknowledgements Booklet. This is produced for each series of examinations and is freely available to download at www.cie.org.uk afterthe live examination series.
Cambridge International Examinations is part of the Cambridge Assessment Group. Cambridge Assessment is the brand name of University of Cambridge LocalExaminations Syndicate (UCLES), which is itself a department of the University of Cambridge.
06_0610_41_2016_1.15© UCLES 2016
20 www.dynamicpapers.com