© 2010 liliana a alencastro - university of...
TRANSCRIPT

1
AN ECONOMIC ANALYSIS OF REBUILDING ARTISANAL FISHERIES: THE POTENTIAL FOR FISHERMEN-BASED ECOTOURISM IN THE GALAPAGOS MARINE
RESERVE
By
LILIANA A. ALENCASTRO
A DISSERTATION PRESENTED TO THE GRADUATE SCHOOL OF THE UNIVERSITY OF FLORIDA IN PARTIAL FULFILLMENT
OF THE REQUIREMENTS FOR THE DEGREE OF DOCTOR OF PHILOSOPHY
UNIVERSITY OF FLORIDA
2010

2
© 2010 Liliana A Alencastro

3
To Luis Alfredo, Juanita, Guillermo and Guillermo Jr.

4
ACKNOWLEDGMENTS
I thank my family and my fiancé, Luis Alfredo, for their constant love and encouragement,
especially during the last part of my doctoral program. Without all their help and support,
completing this journey would not have been possible.
I want to recognize my committee chair, Dr. Sherry Larkin, for her excellent and
continuous guidance during the progress of this dissertation, her support during the last phase of
my degree and her understanding during difficult times. I am very thankful to the rest of my
committee members, as well, for their valuable advice regarding the methodological aspects of
this study.
I give special thanks to the Compton Foundation and the Tropical Conservation and
Development program at the University of Florida for funding this study. I am also grateful to
the Galapagos National Park Service and the Marine Conservation Research Department at the
Charles Darwin Research Station for providing part of the data used in this study and for their
assistance during field work and later stages of this research
Finally, I extend my gratitude to the Food and Resource Economics Department for the
financial support that made my graduate education in the U.S. possible. A special recognition
goes to Dr. Jeffrey Burkhardt, Graduate Coordinator, and Jess Herman for all their help and
consideration, as well as to Dr. Carlos Jauregui for his collaboration with data management,
software use and for important suggestions about the econometric analysis shown in this
document

5
TABLE OF CONTENTS page
ACKNOWLEDGMENTS ...............................................................................................................4
LIST OF TABLES...........................................................................................................................7
LIST OF FIGURES .........................................................................................................................8
ABSTRACT.....................................................................................................................................9
CHAPTER
1 INTRODUCTION ..................................................................................................................11
Artisanal Fisheries ..................................................................................................................11 Approaches to Manage Artisanal Fisheries ............................................................................13 Artisanal Fisheries in the Galapagos Marine Reserve............................................................15 Approaches to Evaluate Preferences and Efficiency ..............................................................18
Stated Preference Analysis for Fishery Entry and Exit ...................................................18 Efficiency Analysis in Fisheries......................................................................................19
Problem Statement..................................................................................................................20 Goal and Objectives................................................................................................................21 Overview of Methods and Study ............................................................................................21
2 EXITING PREFERENCES OF SMALL SCALE FISHERMEN: AN EXPLORATION OF INTERDEPENDECE EFFECTS .....................................................................................23
Introduction.............................................................................................................................23 Methodology...........................................................................................................................26 Data and Estimation................................................................................................................28 Results and Discussion ...........................................................................................................30
Exit Choice Model...........................................................................................................30 Profitability of fishing .... .........................................................................................31 Interdependence ...... .................................................................................................32 Demographics ...... ....................................................................................................33 Probability simulations .............................................................................................34
Tour Choice Model..........................................................................................................36 Summary and Conclusions .....................................................................................................38
3 ASSESING PRODUCTION TECHNOLOGY AND TECHNICAL EFFICIENCY IN SMALL SCALE FISHING FLEETS: DOES VESSEL INTERRELATION MATTER?.....46
Introduction.............................................................................................................................46 The Artisanal Spiny Lobster Fishery......................................................................................48 Methodology...........................................................................................................................50 Data and Model Specification ................................................................................................53

6
Results.....................................................................................................................................58 Frontier Model.................................................................................................................58 Technical Efficiency Model ............................................................................................60
Summary and Conclusions .....................................................................................................62
4 TOURISTS PREFERENCES FOR FISHERMEN-OPERATED EXCURSIONS ................74
Introduction.............................................................................................................................74 Methodology...........................................................................................................................77 Data.........................................................................................................................................80 Results and Discussion ...........................................................................................................84
Interest Models ................................................................................................................85 Willingness to Book Models ...........................................................................................87
Conclusions.............................................................................................................................91
5 CONCLUSIONS ..................................................................................................................104
APPENDIX
A FACE TO FACE SURVEY INSTRUMENT FOR FISHERMEN EXITING BEHAVIOR IN SPANISH...................................................................................................109
B ONLINE SURVEY INSTRUMENT OF PREFERENCES OF U.S. VISITORS FOR FISHERMEN-OPERATED TOURS ...................................................................................115
LIST OF REFERENCES.............................................................................................................123
BIOGRAPHICAL SKETCH .......................................................................................................131

7
LIST OF TABLES
Table page 2-1 Distribution of observed responses....................................................................................41
2-2 Variable descriptions and statistics....................................................................................42
2-3 Multinomial logit estimates for exit choice .......................................................................43
2-4 Effects of discrete variables on the probability of switching.............................................43
2-5 Multinomial logit estimates for choice of tour operations.................................................44
3-1 Average fleet characteristics ..............................................................................................65
3-2 Geographical distribution of the fleet ................................................................................65
3-3 Variable definition and descriptive statistics .....................................................................66
3-4 Sample differences based on observation of towing information......................................68
3-5 Sample statistics by towing status......................................................................................69
3-6 Parameter estimates ...........................................................................................................71
3-7 Hypotheses testing for parameters .....................................................................................72
4-1 Variable description ...........................................................................................................93
4-2 Summary statistics .............................................................................................................95
4-3 Willingness to book responses by interest level ................................................................97
4-4 Comparison of covariates based on participant self selection ...........................................98
4-5 Ordered logit estimates for tour interest ............................................................................99
4-6 Effects of significant variables on the interest probability for standard tours .................100
4-7 Effects of significant variables on the interest probability for fishing tours....................100
4-8 Binary logit estimates for willingness to book a tour ......................................................101
4-9 Effects on the probability of booking a tour ....................................................................102

8
LIST OF FIGURES
Figure page 2-1 Probability of switching.....................................................................................................45
3-1 Distribution of efficiency scores........................................................................................73
4-1 Distribution of interest responses.....................................................................................103

9
Abstract of Dissertation Presented to the Graduate School of the University of Florida in Partial Fulfillment of the Requirements for the Degree of Doctor of Philosophy
AN ECONOMIC ANALYSIS OF REBUILDING ARTISANAL FISHERIES: THE
POTENTIAL FOR FISHERMEN-BASED ECOTOURISM IN THE GALAPAGOS MARINE RESERVE
By
Liliana A. Alencastro
May 2010 Chair: Sherry Larkin Major: Food and Resource Economics
This study examined the diversification of artisanal fishermen into tourism as a strategy to
recover resource stocks and rebuild fishermen livelihoods in the Galapagos Marine Reserve.
Incorporating unique interdependence characteristics between individuals and fishing vessels,
and using a combination of stated preference and stochastic production frontier methodologies,
the study (1) assessed fishermen switching and tour choice behavior and socio-economic
determinants, (2) examined the harvesting potential and technical efficiency of the fleet, and (3)
assessed the demand potential for fishermen-operated tours.
Results indicate that vessel owners were more willing to switch than crew. Switching
preferences also differed between boat size and geographical locations. Interestingly, capital
malleability issues were compensated by the opportunity to transfer fishing capital outside the
fishing sector. If switching, fishermen preferred bay and diving tours followed by the diving
cruise option, and choices depended on vessel size, location, and access to bank funding.
The findings suggest that a reduction of fleet size would be less effective than policies
managing variable inputs to reduce the harvesting potential of the fleet. Also, the fleet can still
improve technical efficiency and increase harvests in the short run. As expected, interdependence

10
between boats influenced the production technology but the effect was negative. Smaller vessels,
especially fiberglass boats, were less productive if they were towed by larger boats.
Standard tours had a higher demand potential in comparison to artisanal fishing trips.
Standard tours had higher booking intentions if half-day excursions were offered and tourists
preferred full-day fishing trips with a dining option. Expected conservation and local benefits
increased the interest for fishermen-based tours, while wealthier tourists were more reluctant to
book these trips.
Overall, the study found a promising market potential for fishermen-based ecotourism
depending on the extent that fishermen are allowed into the standard tour market by the reserve
managers. However, the potential for fishing effort reduction is limited and additional policies
focusing on vessel efficiency and rights-based management will be needed to rebuild resource
stocks. Future diversification strategies need to differentiate between vessel owners and crew and
the specific realities of the fishing ports to entice fishermen to quit fishing.

11
CHAPTER 1 INTRODUCTION
Artisanal Fisheries
Artisanal fisheries represent a very complex and dynamic fishing sub-sector such that a
universal definition for it does not exist (Berkes et al. 2001). They are usually described by a
range of diverse characteristics (FAO/RAP 2004; Salas et al. 2007; Defeo and Castilla 2005,
Berkes et al. 2001). First, artisanal fishing predominates in developing nations where coastal
communities and fishing households are dependent on the marine resources for subsistence, in
contrast to fisheries that are exploited by fishing firms (i.e., business ventures). Thus, artisanal
fisheries are usually small-scale fisheries that rely on a large number of fishermen and vessels
relative to industrial fishing.
Second, artisanal fishing fleets are often characterized by diverse vessel types that target
multiple species, usually a large number of small stocks. Because of this, resource use is seasonal
and vessels use multiple traditional gear types such as spears, lines, traps, or hand harvesting.
That is, technological advancement is slower compared to industrial fleets since there is
sufficient local labor. They operate mostly near shore, across multiple fishing grounds and
landing sites, and on short trips of around one to two days. Therefore, there is a low level of
capital investment. The harvesting, processing and distribution technologies are labor intensive.
According to a recent report from FAO/RAP (2004), artisanal fishing provides
employment to more than 35 million people worldwide, contributes more than 50% of fish food
in the world, and represents 19% of animal protein intake in developing nations. Therefore, this
occupation plays a critical role in poverty alleviation, food security, and income generation for
coastal communities in developing countries in Africa, Asia and Latin America. However, since
these fisheries feed so many in local communities, what harvesters may receive from selling their
12
catch is minimal compared to the size of the overall economy of their nations. Even the highest-
value species in export markets do not translate into an important component of national product
as profits are often earned by middlemen. Hence, fishermen have very limited power to influence
the markets, and commercialization and credit access is highly-dependant on middlemen groups.
Despite the recognized importance of artisanal fisheries worldwide1, management efforts
for this sector have been met with limited success (where any exist) and many fishery resources
have become overexploited. Most artisanal fisheries have operated under open access conditions,
mainly to maximize employment and food supplies to local communities (Salas et al. 2007).
Also, the prohibitive costs of monitoring and enforcement in extensive geographical areas
prevent the collection of data that might be required to develop and manage a fishery
successfully. Lastly, an increasing demand for high-valued species (e.g., lobster, scallops,
shrimp) in international markets and the lack of alternative employment opportunities that
characterizes many artisanal fisheries has often promoted the uncontrolled increase in fishing
effort, which has reduced resource stocks, fishing income and food availability and generally
worsened fishermen livelihoods in the long run (Defeo and Castilla, 2005).
Artisanal fisheries can be very diverse and so require unique approaches to manage them
successfully. There are, however, a few different types of management that have been shown to
work for this sector. The following section reviews those approaches, which include the use of a
co- or joint- management structure and the use of territorial use rights (the two most common).
Following this review, the unique case of managing overfished fisheries in the Galapagos Marine
Reserve (GMR) is discussed. The final section outlines how this study will investigate the
1 Although the terms artisanal and small scale fisheries are often used interchangeably in the literature, in this study artisanal fisheries refer to fishing communities that are heavily dependent on the marine resources for subsistence or sustainability of a localized culture or economy in addition to being small-scale.

13
potential success of a plan to manage an overfished artisanal fishery and to rebuild fishermen
livelihoods using the GMR as a case study.
Approaches to Manage Artisanal Fisheries
Traditional approaches used in developed nations and industrial fisheries are recognized as
not appropriate for the complexities of artisanal fisheries (Defeo and Castilla 2005). More
suitable mechanisms need to consider fishing communities in decision making, emphasize
participation of all stakeholders, and retain traditional knowledge in the resource management
(Berkes et al. 2001). Such approaches include ecosystem-based management, integrated coastal
management (fishing as part of a comprehensive coastal development policy), community-based
and co-management (direct participation of local communities and shared responsibility for
resource management between authorities and users), and spatially–based management (e.g.,
territorial use rights (TURFs), marine protected areas, and no-take zones) (FAO/RAP 2004).
Many communities in developing countries have adopted these management schemes. For
instance, community quotas, TURFs and exclusive fishing zones have complemented regulated
open access controls in some counties in Latin America, especially for benthic resources (Salas
et al. 2007). No take zones and ban areas have performed successfully in reef fisheries in the
Phillipines, the Caribbean and some countries in Africa (Martin-Smith et al. 2004) and on the
demersal resources in the Gulf of Castellamare (Sicily) (Whitmarsh et al. 2003).
The most promising results in management of fisheries for community sustainability have
been observed under appropriately designed and implemented co-management schemes,
particularly when combined with spatial tools and access rights. For instance, the allocation of
near shore management areas to local communities through well-established fishermen unions,
associations or cooperatives has proven to be a stable and strong management system for some
artisanal fisheries in Chile, Japan and Mexico. As documented by Cancino et. al. (2007) and

14
Defeo and Castilla (2005), in these initiatives the government sets general regulations such as
quota and size limits for the species, gear restrictions and season length but transfers the
authority and responsibility to manage, monitor and enforce the management areas to the users.
In Chile, the TURF system has been applied to benthic resources only. The federal
government allocates ‘Areas for Management and Exploitation of Benthic Resources’
(AMERBs) for a given period subject to renewal based on performance and status of stocks.
Fishermen associations are required to submit management and exploitation projects for
evaluation prior to receive an exclusive management area, as well as periodic monitoring reports
for renewal (Gonzalez 1996). In Japan, the allocation of areas with exclusive access rights is the
prevalent management system and applies to a variety of fisheries (e.g., shellfish, shrimp, and
mobile fish). Access rights have been managed and coordinated by Fishery Cooperative
Associations traditionally attached to the coastal areas rather than based on management
projects. The cooperatives in turn sub-allocate the area to groups of individuals, especially
families, based on fishing tradition. Interestingly, in the two countries, fishermen as managers
integrate efforts with biological consultants or extension scientists to monitor the status of the
fisheries. Similarly, in the case of the spiny lobster of Punta Allen in Mexico, the government
grants exclusive territorial access rights to cooperatives, which in turn sub-allocate the areas and
rights to families based on tradition. Here, the system builds strongly on the family component of
the organization by allowing the areas to be inheritable and transferable. In this way, the
decentralization of management and the availability of exclusive access rights have transformed
production areas and the resources into family assets.
The success of these TURF-based co-management approaches in artisanal fisheries has
relied on the following main aspects:

15
• The existence of a clear and appropriate legal framework formalizing (a) the decentralization of management and decision making, (b) the implementation of exclusive territorial use rights and (c) the authority of local communities and cooperatives to manage and coordinate the access rights and area allocation among subgroups.
• The level of organization of communities and management cooperatives or associations, such that enforcement of internal rules and exclusive access may be ensured.
• The role of fishing tradition and family as productive units in the allocation of management responsibilities.
Despite the potential positive outcomes of co-management in artisanal fisheries, a
sustainable use of resources and livelihood support has been difficult to accomplish or not
realized at all in other cases (Defeo and Castilla 2005, Nasuchon and Charles 2010, Hearn 2008).
A perfect example of limited success of a co-management structure is found in the case of the
Galapagos Marine Reserve (GMR) in Ecuador.
Artisanal Fisheries in the Galapagos Marine Reserve
The GMR is one of the largest marine reserves in the world, covering the interior waters of
the Galapagos Islands and those within 40 nautical miles measured from the baseline of the
Archipelago. It is approximately 133,000 km2 in size and is managed as part of the Galapagos
National Park (GNP). Fishing activities are restricted to small-scale levels by national law. The
main income source for the fishing sector, which accounts for around 20% of the economy of the
Islands (Taylor et. al. 2006), is provided by two fisheries: sea cucumber (Isotichopus fuscus) and
spiny lobster (Panulirus penicillatus and P. gracilis). Both products have been primarily destined
for exports, especially to Asian markets as delicacies. A third and smaller source of income
comes from whitefish fisheries, which are harvested in the area all year long. These are destined
mainly to local and mainland markets (Murillo 2002).
A co-management framework was formally established in the Special Law for the
Conservation of the Province of Galapagos (SLG) in 2000. Under this legal framework the

16
management of natural resources and the decision making process integrated for the first time all
local user groups (i.e., scientists, small-scale fishermen, the governmental management agency,
and tourism sector), changing from a top-down to a bottom up structure (Congreso Nacional del
Ecuador 1998). Three instances of participatory democratic decision making and implementation
define the co-management system (Heylings and Bravo, 2007). At the local level, stakeholders
are represented on the Participatory Management Board (PMB). Participants of the PMB are
representatives of the fishing, tourism (including naturalists guides), scientific and management
sectors, which propose management actions and decide based on a consensus. At the national
level, the Inter-institutional Management Authority (IMA) is the entity in charge of the final
decisions about policies based on local-level proposals, including those that could not reach a
consensus at the PMB. Decision makers at this level are representatives of national ministries
and the environmental community, as well as representatives of the local user groups (i.e.,
fishing and tourism sectors). At this level, the scientific sector acts just as an advisor while the
management agency, the Galapagos National Park Service (GNPS), serves as technical secretary.
Finally, the GNPS is responsible for the implementation and enforcement of all resulting
policies.
Under co-management the fisheries are regulated by limited access, total allowable quotas
and traditional input-output controls such as gear restrictions, closed seasons and minimum sizes
on landed product. Despite an explicit legal framework, management decentralization, and a
clear institutional structure for decision making, the stocks of the most important and valuable
species have continued declining and the profitability of fishing has worsened (Hearn 2008). For
example, in 2006 the sea-cucumber fishery was considered to be severely overexploited and had
to be closed temporarily, and the spiny lobster fishery showed strong indications of decreasing

17
population abundance (Hearn et al. 2006). Also, illegal fishing from artisanal fishermen
continues to be a concern (Viteri and Chavez 2007).
As noted by Heylings and Bravo (2007), one of the main challenges of the participatory
decision making system is the low level of organization and fishermen representation. Fishing
cooperatives are recently starting to be active as fishermen associations, and participants from
the fishing sector at the PMB are not always considered good representatives of the whole group.
In addition, the agreements reached at the local level are not always perceived as honored by the
IAM which creates an issue of credibility. Lastly, but not least important, a critical limitation is
the lack of a clear definition of access rights among users. Although a legal framework exists
formalizing the co-management system, the resource is still managed as property of the
government hindering the incentives for sustainable harvesting among fishermen (Hearn 2008).
Given the above mentioned challenges and fishery problems, alternative strategies to
rebuild the fisheries are needed. The management authority (i.e., GNPS) has proposed the
creation of alternative livelihood options for the sector in order to reduce the fishing effort (i.e.,
fishermen and fishing vessels). Specifically, the program proposes a change of activity from
fishing to tourism through the concession of new tour operation permits to fishermen in
permanent exchange for their fishing and vessel licenses (Servicio Parque Nacional Galapagos
2006, Murillo et al. 2006). The program is voluntary and competitive as the number of tour
permits is strictly controlled. As such, this new program is expected to permanently reduce the
size of the fishing fleet. If successful, fishermen leaving the fishing sector may engage in
economically sustainable non extractive activity and the remaining fishermen should also
anticipate more profitable fishing as spiny lobster and sea cucumber stocks rebuild in response to
a smaller fleet size.

18
However, much remains unknown about the efficiency of this strategy as an instrument for
fishing effort reduction and for future improvement of the fishing livelihoods. This informational
gap becomes more relevant when considering the heterogeneity across vessels and individual
fishermen (i.e., vessel owners and crew).
Approaches to Evaluate Preferences and Efficiency
Stated Preference Analysis for Fishery Entry and Exit
One useful approach to assess the entry-exit decisions of fishermen and to identify factors
that may affect that choice is the stated preference method, particularly before the
implementation of management strategies. With this technique, individuals (i.e., fishermen)
indicate what their preference would be (i.e., stay or exit) based on a hypothetical management
scenario. The preferred choices are assumed to be those that maximize their utility (Bennett and
Blamey 2001).
The use of this approach has recently increased in comparison to other approaches
commonly employed but which are based on past decisions and are not adequate to predict new
behavior. For instance, Ikiara and Odink (2000) assessed the stated willingness to accept to quit
fishing among small-scale Kenyan fishermen. They found that the main reason to stay was the
lack of alternative fishing options, and that socioeconomic factors like opportunity costs,
profitability of fishing, having more fishing experience and owning a fishing vessel increased the
resistance to exit. Similarly, Cinner et al. (2008) also examined the willingness to quit fishing
among nine Kenyan communities between Mombasa and Malindi and found that expected
reduction in catch levels, and having additional occupations and higher income increased their
likelihood to exit. They concluded that poorer households would be less likely to exit even when
faced with declining fisheries and that the generation of employment opportunities directed to
that sector may help reduce fishing effort.

19
Efficiency Analysis in Fisheries
Efficiency analysis has been widely applied in fisheries to evaluate the production
technology of fleets under the inherent stochastic nature of fishing using stochastic frontier
methods. With this approach, an economic production function is specified in terms of fixed
(e.g., vessel size, engine power) and variable inputs (e.g., days at sea, fishing time, number of
fishermen on board), measures of fish stock, environmental and technological factors that may
affect the technology. Variations in catch are assumed to depend not only on random events but
also on an inefficiency component for each vessel, which in turn is also dependent on fishermen
and vessel characteristics (Pascoe et al. 2003).
The fisheries economics literature has used this type of analysis for a variety of
production–related purposes, ranging from development implications to the effect of input
controls on vessel economic performance. For instance, Squires et al. 2003 evaluated if
development assistance directed to improve artisanal fishing vessels is effectively improving
technical efficiency and the harvest potential of the fleet in the Malaysian gill net fishery. They
concluded that focusing on ‘developing’ human capital factors would yield more efficiency
improvements than technological and capital expansions of the fleet, and that development
assistance for fishing communities would be better focused on aspects other than affecting
harvesting capacity.
On the other hand, Fousekis and Klonaris (2003) found that variations on harvest depended
mostly on random effects as opposed to technical efficiency, and that vessel characteristic were
more important determinants of efficiency than skipper skills for trammel netters in Greece Their
results allowed them to examine how existing and proposed structural policies might affect the
harvesting potential of the fleet given specific input controls.

20
Problem Statement
The need to incorporate diversification options to rebuild artisanal livelihoods and stocks
in artisanal fisheries management is recognized in the literature (Kuperan and Abdullah 1994;
Teh et al. (2008), but it is scarcely documented (Salas et al. 2007). Salayo et al. (2008) and Teh
et al. (2008) found that fishermen show strong support for the development of alternative
livelihoods inside and outside the fishing sector as a management tool, especially in the tourism
sector. As noted by Carvalho (2008), marine tourism jobs seem a natural option for relocated
fishermen given their skills in boating and fishing.
To the author’s best knowledge, only two studies have addressed the implications of
ecotourism as an alternative employment opportunity for fishermen. Alban and Boncoeur (2004)
assessed the potential demand, supply, institutional constraints and expected profitability of
developing a pluri-activity for fishermen operating in the Iroise Sea. They indicated that despite
a promising interest from tourists and fishermen, the fiscal and administrative framework and the
low profitability of the new activity threatened to limit the potential of the initiative. More
recently, Sarr et al. (2008) proposed a two-sector theoretical bioeconomic model to analyze the
interaction between artisanal fishing and ecotourism and the effect on social welfare in the
Saloum Delta, Senegal, in the context of an existing Marine National Park and a growing tourism
sector. They concluded that creating a non-extractive activity in ecotourism may help integrate
the need for long-term marine conservation and the immediate need of additional income in poor
fishing communities.
Understanding fishermen behavior and potential demand is critical to the development and
introduction of alternative livelihoods, especially when switching activities are considered as
permanent decisions. However, it is also important to understand the implications of capital (i.e.,
vessel) reduction on the production performance of the remaining fleet to accurately evaluate the

21
viability of such alternatives as a fishing effort reduction strategy. Moreover, in the context of
artisanal fisheries, it is also relevant to consider the role of social ties in the dynamics of
harvesting and fishermen behavior as such social networks are increasingly recognized as key
components of economic processes and desirable outcomes (Sekhar 2007).
Goal and Objectives
The present study seeks to contribute to the artisanal fisheries management literature
(especially when stocks need to be rebuilt) by expanding the assessment of alternative livelihood
options as viable management tools by incorporating the role of production technology and of
social ties that may be especially important in artisanal fisheries. Hopefully, knowledge of this
information will help decision makers in the design of management strategies seeking to reduce
extractive pressure on severely exploited resources, particularly when participatory management
has had limited results.
The goal of this study is to assess the viability of fishing effort diversification into tourism
as an alternative livelihood and effort reduction strategy for the artisanal fishing sector of the
Galapagos Marine Reserve. The specific objectives are:
• To analyze fishermen stay/exit behavior and identify relevant socio-economic determinants.
• To assess the production frontier and technical efficiency of the artisanal fishing fleet.
• To ascertain the role of production interrelations proper of small scale fishing sectors on fishermen behavior and fleet production.
• To evaluate the market potential of fishermen-based operations in the local tourism industry.
Overview of Methods and Study
The objectives of this study are explored in each of the following chapters. Chapter 2
shows the assessment of stated preferences of fishermen to continue fishing or to exit using a

22
discrete choice modeling framework. The stated behavior is based on the findings of personal
interview surveys of individual fishermen. This primary data collection allowed for the
examination of the effect of any interdependency in preferences based on social linkages
between fishermen. Chapter 3 implements a stochastic production frontier model using trip-level
catch data to determine the production structure of the sector and the role of technical
inefficiency on harvesting potential and its determinants (including an examination of the
linkages among harvesters). Chapter 4 explores the potential market demand for tour services
provided by newcomers from the fishing sector using a probability modeling approach. The
modeling is possible based on the primary data collection of stated preferences from past visitors
to the islands. Finally, Chapter 5 summarizes the most salient findings of the analysis and
presents the general conclusions and implications for artisanal fisheries management.

23
CHAPTER 2 EXITING PREFERENCES OF SMALL SCALE FISHERMEN: AN EXPLORATION OF
INTERDEPENDECE EFFECTS
Introduction
Overcapacity in fisheries has been recognized as a leading cause of overexploitation of
marine resources worldwide (Food and Agriculture Organization, FAO, 1998). Since the FAO
published its Declaration of the Code of conduct for Responsible Fisheries in 1995, the
managing of the extractive capacity of fishing fleets has received increased attention (Asche
2007). Many studies have explored the use of industry or government sponsored fleet size
reduction programs (Guyader et al. 2004; Larkin et al. 2004; Funk et al. 2003; Kitts et al. 2001;
Sun 1999) and recent efforts have focused specifically on the issue of stranded capital as it
relates to changing management regimes (Wilen 2009). As noted by Ikiada and Odink (2000),
the understanding of the behavior of individuals is as necessary as the understanding of the
dynamics of the resource for any management plan. In the context of fishing fleet reduction, the
identification and understanding of fishermen incentives to exit fisheries is crucial.
To date, the majority of behavioral analysis in fisheries has focused on spatial fishing
effort allocation and fisheries selection (Smith and Zhang 2007; Smith 2005; Salas and Gaertner
2004; Smith and Wilen 2004; Smith and Wilen 2003; Wilen et al. 2002). This literature
concludes that the behavior of individuals and the factors that drive decision making need to be
incorporated into management decisions in order to avoid unwanted or unintended fishery
outcomes. By comparison, less work has been conducted regarding the decision making process
to exit fisheries. Given the state of many fisheries worldwide (Worm et al. 2006), the need for
such information could not be more timely.
The majority of studies that have investigated fishery switching decisions, including the
decision to forgo fishing in any given fishery, have utilized the profit maximizing assumption

24
(either implicitly or explicitly) (Pascoe and Mardle 2005). Ward and Sutinen (1994) introduced
the modeling of entry-exit behavior for vessels in the shrimp fishery of the Gulf of Mexico. They
predicted the probability of a vessel to enter, and then stay or exit using revealed preference data.
Their main findings are the expected positive effect of crowding externalities on the probability
of exiting and supporting evidence that exit behavior is less sensitive to profitability variation
than entry decisions. No evidence was found to support the role of opportunity costs, market
variability, or stock variability on exiting behavior.
More recently, Pradhan and Leung (2004) extended the enter-stay-exit choice modeling
approach to Hawaiian longline fisheries by also using revealed preference data. The study
provides supporting evidence for many of Ward and Sutinen’s (1994) findings – namely
regarding the opportunity cost of fishing stock abundance, and crowding externalities – and they
also found that individual characteristics such as residency and captainship also affected exiting
preferences. These findings are important in identifying factors that have affected participation in
the short run but they are based on past behavior and, therefore, cannot be used to accurately
predict a new choice. Nor do they consider factors that might be unique to small-scale fisheries,
especially in developing countries.
As vessel decommission schemes receive increased attention, so too has the modeling
approaches to assess their outcomes. For example, Ikiara and Odink (2000) employed a
contingent valuation approach to assess fishermen’s resistance to exit small-scale Kenyan
fisheries as measured by the stated willingness to accept to quit fishing. In this small scale-
context, fishermen did not have alternative fishing options but were more interested in securing
non-fishing sources of income to support their livelihoods. Drawing from the work of Ward and
Sutinen (1994) and early models of fishing effort allocation, they explored the role of

25
opportunity cost of exiting, imperfect capital malleability and indicators of opportunities outside
the fishing sector. The effects of other variables describing individuals’ utility function were also
addressed such as alternative income sources, family tradition and vessel ownership. Their
analysis supported the theoretical importance of opportunity costs and profitability in the
resistance to exit, but no evidence was found to support the expected effect of imperfect capital
malleability. Having more fishing experience and owning the vessel were, however, found to be
significant factors in the resistance to exit.
Although previous studies have explored many and varied factors, most research has
ignored specific transitions to alternative occupations and all models have assumed that
individuals make decisions in a completely independent way. However, interdependencies of
individual exiting decisions could be reasonably expected especially in highly interactive
harvesting systems such as small-scale artisanal fisheries. In these types of fisheries, informal
and fraternal linkages might be relevant to the decision making process of members of the same
or interrelated production units (FAO 2004). The importance of interdependent preferences has
been recognized in the fields of consumption economics, marketing and transportation research
where it has been noted that ignoring such effects when they are likely to exist can yield biased
estimates (Yang et al. 2006; Bhat and Pendyala 2005).
In fisheries, the issue of interdependence in spatial fishing decisions has been recognized
(Hicks et al. 2004). Extending that idea, the relationships among individuals (captain, crew) and
between vessels (changing captains, multi-vessel companies, mother boat arrangements) are
likely to affect how any one participant will respond to an opportunity to forgo fishing rights in
perpetuity. Excluding this information from the exit choice decision can, therefore, lead to
inaccurate predictions of future fishing effort.

26
The objective of this chapter is to identify the factors that help to explain fishermen’s
stated preferences regarding whether they plan to switch from fishing to tourism and if they do,
which type of tour activities they plan to provide. This information can help fishery managers
facilitate and assess the success of a management program designed to reduce fleet size, fishing
capacity, and fishing effort. In addition, the study will contribute to the existing literature by
exploring the potential role of interdependence indicators in understanding exiting preferences at
the individual (disaggregated) level. The analysis illustrates the case of the Galapagos small-
scale fishing sector using a stated preference approach in the wake of an unprecedented
management situation. The next section discusses the modeling methodology, which is followed
by a section with details about the data. The last two sections discuss the estimation results and
conclusions, respectively.
Methodology
Fishermen are assumed to maximize their utility when deciding whether to switch
professions from fishing to tour operator and, if so, what type of tours they would prefer. An
alternative methodology is to model choices by assuming decisions are based on the objective of
maximizing profits. The more general utility approach is retained for this analysis since it is
more appropriate within an artisanal fishing context.
In this study, fishermen are faced with multiple choices for each decision. The total utility
for alternative j in the universal choice set C held by individual n can be specified by the
construct:
jnjnjn VU ε+= Cj ∈∀ (2-1)
where Vjn is the systematic, observable component of utility and εjn represents the random,
unobservable part.

27
The observable component Vjn can be defined by the expression
∑=
=I
i
in
ijjn XV
1β (2-2)
In Equation 2-2, i identifies the type of characteristics that are assumed to affect the choice
(i.e., Xi variable vectors) and their measureable correlation with V (i.e.,βi parameters). In
particular, the variable groups include those directly or indirectly reflecting the benefits of
fishing (i = 1), interdependence indicators (i = 2), and demographic characteristics (i = 3).
Fishermen opting to switch to tourism are also assumed to maximize their perceived utility
when deciding among the new tour operations. Following the same theoretical framework, the
systematic component of utility for the tour alternatives is just an expansion of the previous
model to include variables that reflect an individual’s ability to fund a switch into tourism (i = 4).
In addition to the new X4 variable, the set of regressors in X1, X2, and X3 differs between tour
choices since their nature are distinctly different.
While utility is unobservable, the stated preferences of each individual (Yn) can be used to
infer information about utility. Economically rational individuals are expected to prefer the
alternative with the highest utility, so that the probability of choosing alternative j over all other
available options l can be expressed as:
P(Yn = j| j,l) = P [(Vjn+εjn) > (Vln+εln)] ljCl ≠∈∀ , (2-3)
Given the computational complexity of multidimensional integrals related to the
probability density functions of normally distributed error terms, the εjn are assumed to be
identically and independently distributed Gumbell random variables. As such, choice
probabilities for each individual n can be calculated as follows:
∑∈
+==
Cl
nVl
Vjn
n eejYP
1)( (2-4)
28
Since there are more than two choices, there is a reference category (e.g., j = 1) with the
associated probability of:
∑∈
+==
Cl
nVln eYP
11)1( (2-5)
Thus, there are J-1 equations to be estimated, one for each choice relative to the reference
or base choice.
Data and Estimation
Small scale fishermen were interviewed from November 2007 through March 2008 about
their preferred choices for switching permanently to tourism. If they indicated an intention to
switch, they were then asked to identify their preferred type of tour permit. A total of 355
randomly selected fishery participants were interviewed (156 vessel owners and 199 crew
members). This represents an overall response rate of 34.7% given there were 1,022 registered
participants during the 2007-08 fishing season. Participants were selected across three strata each
representing one of the three main islands. In addition to their choices, fishermen were asked
about tourism-related factors and concerns, operational characteristics in the fishing sector and
general socio-demographic questions.
Secondary data include vessel ownership records and trip-level landings records for the
lobster and sea cucumber fisheries for the period 1997-2005. This information was obtained from
the Galapagos National Park Service and the Charles Darwin Research Station. Vessel
ownership records provided information on the number and type of vessels linked to the
corresponding owner while the landing records allowed small vessels to be linked with mother
boats in multi day trips. With these secondary data, it was also possible to relate fishermen to
specific vessels and to identify historic inter-vessel harvesting relationships.
29
After excluding non-responses for the independent variables, the final dataset consisted of
two samples, one for switching intentions (N = 299) and the other for the subsequent choice of
tour activities only for those individuals planning to switch (N = 103). Exiting behavior is
modeled in terms of the individual’s stated response to a question asking them if they planned to
relinquish their fishing rights (permits) in exchange for a tour operator permit. The response
categories included “no”, “do not know” and “yes”. Those responding “yes” were then asked
about their preferences for offering three distinct types of tours including: (1) standard cruises,
(2) bay and diving tours, and (3) multi-day diving cruises. Table 2-1 shows the distribution of
observed choice responses. Exiting choices are evenly distributed between the options to stay
and switch with a slight preference for switching. Most respondents would prefer to offer bay
and diving tours, followed by multiday diving cruises. This indicates a stronger preference for
options involving some type of diving activities (85.4%) than for any other type of operation.
The Xi explanatory variables hypothesized to influence exit decisions are defined in Table
2-2. Two interdependence variables were created to control for relationships between captain and
crew (i.e., intravessel linkages) and operations that involve ‘mothership ’relationships. The
‘mothership’ system consists of smaller vessels offloading at sea onto larger vessels for
multiday, multi-zone fishing trips, and it is not uncommon to observe a mother ship working
with vessels related to the same family or social group. These variables provided the best
approximations to account for the effect of social ties in fishermen exit behavior given the
available information. Choice interdependence is addressed by introducing the variables into
both models. In the absence of monetary variables for economic factors such as capital
investment and alternative labor opportunities, this study is not able to include capital
malleability or traditional opportunity cost measures. However, we were able to include six

30
variables that related to the profitability of fishing and, thus, serve as proxies for opportunity
costs. The capital malleability issue is less of a concern in this study since it is widely recognized
that vessels operating in the Galapagos need to be moved into other uses or they will continue
fishing, which is why they are being offered the chance to join the growing tourism sector.
Given the difference between the sets of explanatory factors assumed to affect the stated
preference of each choice, the exiting and subsequent tour choices are modeled separately
according to equation (4) using an unordered multinomial logit. The models are estimated using
maximum likelihood techniques in NLOGIT. This software allows for differences in utility
function specifications that can prove useful when analyzing limited sample sizes and distinct
alternatives that are likely influenced by different set of factors, such as for our tour choice
model. For comparison, a nested multinomial specification was used to correlate the two sets of
choices since the choice responses were sequential. However, testing for correlation of the errors
between tour choices and switching responses indicated a theoretically inconsistent structure and
the model was rejected.
Results and Discussion
Exit Choice Model
Estimates are reported in Table 2-3, where the option to continue fishing (i.e., “no”
response to switching alternative) was chosen as the base because identifying the factors
contributing to the decision to switch to tourism is an objective of this study. Additional
interaction variables were also evaluated using likelihood ratio tests, but they were statistically
insignificant and are not presented in the final results. The overall model was statistically
significant (p < 0.0001; LogL = -170.8) and the Adjusted R-squared indicated that the model was
able to explain 41% of the variation in responses. In summary, only five of the 15 explanatory
variables were significant at the 10% level or better in the equation explaining whether a

31
fisherman was undecided with respect to switching from fishing to tourism versus someone who
was planning to continue fishing. However, a total of 11 of the 15 variables were significant in
explaining a fishermen’s stated intention to switch into tourism versus someone who was not.
The explanatory variables are discussed by type for each choice decision.
Profitability of fishing
Of the six variables representing the opportunity cost of fishing to a respondent, none
explained undecided fishermen but nearly all were correlated with the decision to switch into
tourism. Being a crew member (CREW) or using a fiberglass or small wooden boat to fish
(SBOAT) reduced the likelihood that they were planning to exchange their fishing rights for
tourism permits or, equivalently, they were more likely to want to continue fishing (the omitted
alternative). Conversely, vessel owners or those working on larger boats were more likely to
indicate they planned to switch their fishing effort from the fishing to the tourism sector. This
result contradicts previous findings supporting the hypothesis that vessel owners are more
resistant to exit than crew under the argument of a ‘career’ effect in fisheries (Ikiara and Odink
2000). Our result could reflect the perfect capital malleability in this case study since vessel
owners will transfer their boat to the tourism sector and continue operating. Crew members,
however, lack the capital asset required to immediately begin participating or they may lack the
skills that could be required with the new tours. The finding that smaller boats are less likely to
switch was expected since the requirements to enter the tourism sector are more stringent for
vessels in the smallest size class (Servicio Parque Nacional Galapagos 2006). In addition, it’s
possible that this variable is also accounting for some of the concern over the need to meet new,
more stringent, safety guidelines (SAFEREG, which was not significant) that would require
significant investments in vessel upgrades.

32
Participation in high-value fisheries (HIGHVAL), having more years of fishing experience
(FISHYRS), or being a diver (DIVER) also increased the probability that a fishermen has planned
to exit the fishing sector and move into tourism. This result implies that fishermen who rely
mostly on whitefish or open water stocks (versus the relatively high-valued spiny lobster or sea
cucumber), have less fishing experience, or who do not dive are more likely to want to continue
fishing. This result could reflect the decline in stock abundance of the traditional high-valued
stocks, which is likely more noticeable by those who have been fishing longer.
The reduced abundance of the high-valued species also increases the relatively profitability
of alternative species that do not require dive skills. Divers have an advantage in switching to
marine tours in that diving tours in particular have been expanded creating more opportunities in
the industry (Servicio Parque Nacional Galapagos 2009). Thus, training programs targeted to
replace traditional fishing methods (i.e., free diving to dangerous depths) with more specialized
scuba diving methods could be effective at enticing human capital from fishing into tourism.
Interdependence
An owner-crew relationship within a vessel (ICLINK) was not found to have any effect in
explaining exiting intentions, however, a mother boat relationship between small and large
vessels (IMLINK) increased the probability that the fishermen were undecided in their decision
to switch. This implies that fishermen that were not associated with a mother boat were more
likely to indicate they planned to continue fishing. This result may reflect the complex and subtle
social and economic linkages that characterize small-scale fisheries, especially in the Galapagos
(Baine et al. 2007). In this context, it is not uncommon to observe a mother boat providing
storage and towing service to other vessels.

33
Demographics
The majority of demographic variables were significant in explaining the undecided
responses, and only one of the seven variables did not have any explanatory power with respect
to the “yes” responses, which indicated a plan to switch into tourism. Geographic differences in
plans were evident as residents of San Cristobal and Isabela were less likely to switch into
tourism (i.e., more likely to continue fishing) compared to residents of Santa Cruz who were
more likely to switch to tourism. Residents of San Cristobal were also more likely to be
undecided versus those who plan to continue fishing.
The probability that a fishermen intends to switch to tourism versus continue fishing was
found to be directly correlated with the number of children in the house (CHILD) and total
household income (INC2 or INC3). Having an alternative source of income (ALTINC) in the
household in addition to fishing income was also a factor that increased the probability of a
switch versus remaining in the fishing sector. This result likely reflects the ability to pay for
costs associated with switching into the tourism sector, or it could reflect the ability to access to
formal funding sources. Issues related to access to investment (start-up) capital for small-scale
food production in developing countries are not new (FAO 2005), especially as it relates to
inherently risky resource-based products. For fisheries managers and policy makers who hope
fishermen decide to abandon fishing and enter the tourism sector, it may be more important to
identify those individuals who are undecided. In this study, it is fishermen that live in San
Cristobal, have no (or fewer) children, or those with a monthly income of US$501-$1,000.
Lastly, having a college degree (EDUC) was not found to affect either the decision to exit
or whether a fisherman was undecided1. Although a higher education level may represent more
1 A college level education was examined in the model because the majority of participants had high school education.

34
opportunities outside fishing, there are not many other alternatives besides fishing and tourism in
the Galapagos. Given that both fishing and tourism rely on skills associated with marine boating,
the extra education was not a factor.
Probability simulations
Using the “yes” equation from Table 2-3, we calculated a base or benchmark probability
level to explain how the decision to continue fishing or to switch into tourism varied between the
vessels owners and crew members (CREW). The benchmarks were calculated with the sample
means for the continuous variables (FISHYRS, CHILD) and assuming a value of zero for the
discrete variables. The distinct effects of each significant variable are summarized in Table 2-4.
This is a critical simulation as the decision to allocate equal and independent rights for crew is
topic of much debate. Are they equally likely to want to switch professions? Do certain
characteristics explain their reluctance to switch as opposed to vessel owners? The answers to
these questions can help fishery managers devise the appropriate social programs that would
have the best chance of achieving their fishing effort reduction goals.
The benchmark probabilities indicated that vessel owners had a much higher probability of
switching from fishing to tourism compared to crew members (i.e., 55% versus 9%). The
simulations show that both vessel owners and crew react in a similar way to all socioeconomic
variables; however crew members are more sensitive to changes in those factors. This is best
illustrated by the relative change in probability (percent change) rather than the nominal change
(percentage points).
Owners and crew that had the highest level of income (INC3) or alternative sources of
income (ALTINC) had the highest probability of switching from fishing to tourism (i.e.,
switching probabilities increased from 55.3% to 83.9% or 81.9% for owners and from 9.1% to
26.8% or 29.6% for crew, respectively), but crew were dramatically more sensitive to changes in

35
these variables. Earning the highest income level increased the switching probability of crew in
233% as opposed to only a 51.6% increase for vessel owners. Similarly, crew members with
access to alternative income were 193% more likely to switch, while vessel owners were just
48% more likely to do so.
The probability of switching from fishing to tourism was also found to be much more
sensitive to the type of target fishery and diving practices for the crew than for vessel owners.
Owners participating in high value fisheries had a probability of switching that was 40.6% lower
than those targeting other fisheries compared to a 142% lower probability for crew. Being a diver
increased the probability of a crew member switching in 188% while that of owners increased
only in 47.3% in comparison to non-divers.
Finally, while the probabilities of switching are directly related to fishing experience
(FISHYRS) and number of dependents (CHILD) for both owners and crew, the size and
magnitude of these effects differed greatly (figure 1a and 1b). The number of dependents
increased the probability that a crew member would switch at an increasing rate versus a
constant rate for owners. The more years of fishing experience by the crew also increased the
probability they would switch at an increasing rate. However, the probability of switching for
vessel owners increases at a decreasing rate. These results underscore the importance of
accounting for human capital in fishing since the crew are less likely to switch, especially those
with less fishing experience. Although this result may seem counterintuitive (as we might expect
the more experienced fishermen to have the comparative advantage to continue fishing), it is
likely that those with more experience have a better understanding of the extent of overfishing
and the potential for recovery. Training or funding programs to entice fishermen to leave the
fishing sector would be more effective if they target recently active owners and crew (e.g., recent

36
beneficiaries of parental fishing rights or boat investors who entered the sector during the fishing
expansion in the late 1990s).
Tour Choice Model
Results for the multinomial logit models of tour choice operations are reported in Table 2-
5 where the standard cruise operation was chosen as the base category since it is the most
common type of tour that is already being offered.
While the models include an additional set of variables related to the tour choices (X4),
they include fewer explanatory opportunity cost, interdependence and demographic variables
compared to the exit choice model. The reduction in explanatory variables increased the degrees
of freedom available to the model but was also necessary to better match the distinct nature of
each choice. For example, the bay and diving tour option is a single-day operation restricted to
in-shore visits such that the size of boats and investment required are modest. Variables
reflecting vessels size (SBOAT) and traditional financing options (FBANK, FFAM) are included
in that model only. On the other hand, diving cruises are multi-day, off shore diving excursions
which require high levels of capital and specialization. Hence, high investment needs
(INVHIGH) and large funding sources (FINV) are hypothesized to affect this option only.
Additional relevant factors such as owner-crew and owner-owner interdependence, diving skills
(DIVER), geographical location and concern with safety regulations are included in both
specifications. The overall model was significant (p < 0.00001; LogL = -60.81) and the adjusted
R-squared indicated that the model explained 35.0% of the variation in the responses.
Five out of the nine explanatory variables significantly explained the choice of bay and
diving tours; while only three of the eight covariates explained the diving cruise option at the
10% level at least. The probability of choosing bay and diving tours is higher for individuals
working or owning small fishing vessels, or who are concerned with safety regulations in

37
comparison to standard cruises. This reflects the fact that fishermen are not used to strict safety
procedures and the costly implications of adapting small boats for traditional cruise operations.
Safety aspects in tourism are critical and safety procedures, equipment and vessel upgrades for
single-day excursions may seem more manageable than for other types of trips. Interestingly,
there is no evidence supporting the significance of diving skills (DIVER) to explain the choice of
tour options by fishermen in the study site. For this specific case, abilities to perform alternative
occupations in recreational excursions are perhaps more relevant in their tour choice behavior.
Out of the two possible funding sources, only access to bank credits (FBANK) increases
the probability of individuals engaging in bay and diving tours. This is expected as investment
requirements for standard cruise activities may be more prohibitive for this type of funding.
Fishermen from San Cristobal (LOC_CR) are also more likely to want to engage in bay and
diving excursions, while individuals from Isabela (LOC_IS) are more reluctant to do so and also
to engage in diving cruises. This is, individuals from this latter community have a higher
probability of preferring standard cruise operations overall.
Fishermen with an identified owner–crew relation (ICLINK) are less willing to want a
multi-day diving cruise permit in comparison to standard cruises. The result may reflect the
highly specialized nature of a diving cruise and the informal ties among individuals working in
the same vessel. A fishing vessel may be the workplace for members of the same family or social
network, and the relocation of fishing crew into tourism may seem more difficult the higher the
specialization and complexity of the tour excursion. However, interrelations between vessel
owners (IMLINK) were not found to affect tour choice behavior.
Fishermen have a higher probability to choose multiday diving cruises when faced with
higher investment than standard cruises (INVHIGH). Access to informal credit institutions

38
(FFAM) and third party investors (FINV) was not found to explain tour choice, which may
reflect the lack of these types of investment opportunities in small-scale fishing communities.
Summary and Conclusions
The two main marine stocks that support the local small-scale artisanal fishery in the
Galapagos Marine Reserve are near extinction. In an effort to reduce fishing effort, the managers
have proposed an ambitious program to exchange permits to fish for tour operator permits
permanently. The tour permits would be freely transferrable in the current market where the
numbers of permits are tightly-controlled and have a relatively high market value. To assess the
potential effectiveness of this program in terms of an effort reduction in the fishery, and to
identify any factors that can be used to help the authorities devise training programs to increase
the effort reduction, a stated preference survey was implemented. The data was used to estimate
multinomial logit models of the exit decisions of both vessels owners and the crew, who would
be eligible to obtain equal and autonomous rights. Those indicating they planned to exchange
their fishing rights for tourism permits were then asked to indicate the type of tour they would
prefer to offer.
Results support the relevance of accounting for interdependence between fishing
participants in addition to traditional economic and demographic factors to explain exit choices
and preferences for alternative tour occupations in the context of small scale fisheries. Consistent
with economic theory and previous findings, opportunity cost indicators are significant
explanatory factors of stated or revealed exit behavior. Vessel ownership, participation in high-
value fisheries, longer fishing experience and possessing diving skills were found to increase the
likelihood of a fisherman to switch to tourism, while working with small fishing boats reduced
that probability. In contrast to previous studies, these results model the transition to a particular
alternative occupation where capital malleability is not an issue. Geographical location, total

39
household income, additional non-fishing occupations and household size were also statistically
significant demographic variables that helped to explain differences in switch choices.
As hypothesized, interdependent relationships affected a fisherman’s stated behavior. A
mother boat relationship increased the probability that a fisherman remained undecided in their
decision to exit the fishing industry. Thus, it is important to recognize that production
relationships can prohibit independent decision making. Any program designed to transfer
fishing effort may need to redefine a production unit to account for such relationships. Among
those fishermen planning to switch into tourism, interdependence within a production unit with
respect to human capital (i.e., owner and crew) was found to reduce the probability of planning
to offer multi-day diving cruises. Because this variable will capture relatives, it could be that
offering such a trip would not be possible due to the need to have some of these family member
stay at home. It is important for fisheries managers that are devising effort reduction strategies to
recognize the constraints on households in their ability to participate in every option.
The analysis found different reactions of crew and vessel owners especially to differences
in income level, availability of alternative income, target fishery, diving practice, number of
children and fishing experience, which could also be a proxy for age. Both groups, who often
lack access to formal financial assistance, showed the highest dependency on their own income
resources in order to exit the fisheries. Improved access to external funding or training is likely
to play a role to facilitate the relocation of fishermen outside the fisheries. Furthermore, funding
aspects such as access to bank loans and investment needs are critical determinants of the type of
tour options fishermen choose besides geographical, safety and infrastructure considerations.
The findings of this study have important management implications. Future fishing
capacity programs need to be tailored to the characteristic of each port, which can be

40
accomplished through the local cooperative organizations. For instance, fishing cooperatives
could institute savings and credit programs for their active members (to improve access to
funding in the absence of formal credit offering for the sector). Second, plans aiming to entice
fishermen to exit should include an effective description of the status of the stocks sea cucumber
and lobster fisheries to emphasize the duration and difficulty of the rebuild. Traditional
instruments such as closed seasons, taxes to landing values or innovative policies such as
allocations of quotas to ‘mother boat’ structures in multiday fishing trips may prove effective in
reducing fleet size while protecting endangered stocks.
The scope of these findings regarding stated fishermen exiting behavior is limited to the
context of a fishing-tourism transition where the issue of capital malleability is overcome.
However, the results provide further evidence about expected ‘rational’ behavior and social
aspects relevant to small-scale fisheries. Given data availability and sample size considerations,
this study used simple linkage indicators among individuals to identify possible interdependency
in behavior. Further research that explores more refined scales of relationships, such as actual
correlations between related fishermen choices, is needed. Another area beyond the scope of this
paper is the role of vessel efficiency on exiting behavior. Further exploration of this topic is
important to better understand observed differences among individuals related to different fleet
segments and to help management authorities design fleet-targeted, and perhaps more efficient
capacity reduction plans.

41
Table 2-1. Distribution of observed responses Response No. observations Percent Exit choice: No 120 40.10% Do not know 51 17.10% Yes 128 42.80% Total 299 100.0% Tour choice: Standard cruise 15 14.60% Bay and diving tour 51 49.50% Diving cruise 37 35.90% Total 103 100.0%
Tour options with less than 10 observations were excluded from the model.

42
Table 2-2. Variable descriptions and statistics Exit choice (N = 299) Tour choice (N = 103) Variable Definition Mean Std dev. Mean Std dev.
Profitability of fishing (X1): CREW 1 if crew; 0 if owner 0.552 0.497 0.165 0.372 SBOAT 1 if works with or is a small boat, 0 otherwise 0.866 0.341 0.864 0.343 HIGHVAL 1 if fishes lobster and sea cucumber, 0 otherwise 0.856 0.351 0.845 0.363 FISHYRS Fishing experience (years, range: 0 - 60) 18.07 9.321 21.068 9.743 DIVER 1 if worked as diver, 0 otherwise 0.411 0.492 0.544 0.499 SAFEREG 1 if concerned with safety regulations, 0 otherwise 0.198 0.395 0.265 0.439 Interdependence (X2): ICLINK 1 if crew-owner relation observed, 0 otherwise 0.528 0.499 0.417 0.494 IMLINK 1 if 'mother boat’ relation observed, 0 otherwise 0.147 0.354 0.281 0.450 Demographics (X3): LOC_CR 1 if resides in San Cristobal, 0 otherwise 0.475 0.499 0.330 0.471 LOC_IS 1 if resides in Isabela, 0 otherwise 0.298 0.448 0.233 0.423 CHILD Children living in household (number, range: 0-4) 0.916 0.956 1.107 1.006 INC2 1 if monthly income: USD$501- 1,000, 0 otherwise 0.405 0.491 0.447 0.498 INC3 1 if monthly income >USD$1000, 0 otherwise 0.237 0.426 0.379 0.486 ALTINC 1 if have alternative income, 0 otherwise 0.472 0.499 0.612 0.488 EDUC 1 if college graduate, 0 otherwise 0.055 0.225 0.064 0.254 Funding to enter tourism (X4): FBANK 1 if bank funding available, 0 otherwise N/A N/A 0.670 0.464 FFAM 1 if family funding available, 0 otherwise N/A N/A 0.304 0.458 FINV 1 if funding from third-party investors, 0 otherwise N/A N/A 0.320 0.467 INVHIGH 1 if high investment level needed, 0 otherwise N/A N/A 0.592 0.492 N/A indicates the variable was not applicable to the choice set.

43
Table 2-3. Multinomial logit estimates for exit choice Do not know Yes Variable Estimate t-value Estimate t-value Constant -4.732 -2.742*** -1.125 -0.940 CREW 0.841 1.122 -2.501 -5.012*** SBOAT 0.559 0.936 -1.013 -1.726* HIGHVAL 0.143 0.249 1.039 1.746* FISHYRS -0.049 -1.497 0.051 2.121** DIVER -0.346 -0.684 1.269 2.961*** SAFEREG 0.596 0.966 0.535 1.118 ICLINK 0.631 1.307 -0.068 -0.170 IMLINK 1.922 2.075** 0.634 0.944 LOC_CR 3.103 2.897*** -1.169 -2.291** LOC_IS -0.685 -0.459 -1.074 -1.927* CHILD -0.518 -1.911* 0.425 1.938* INC2 1.147 2.135** 0.845 1.828* INC3 1.243 1.830* 1.442 2.538** ALTINC 0.402 0.873 1.296 3.022*** EDUC 1.387 1.377 -0.135 -0.151 LogL -170.828 Adj. R-Sq 0.415 N 299
*Significant at the 0.10 level; **Significant at the 0.05 level; ***Significant at the 0.01 level. Table 2-4. Effects of discrete variables on the probability of switching by type of fishermen Variable Owner Crew (Base= 0.553) (Base = 0.091) SBOAT -0.240 (-43.9%) -0.050 (-61.6%) HIGHVAL 0.225 ( 40.6%) 0.130 (142.0%) DIVER 0.262 ( 47.3%) 0.173 (188.2%) LOC_CR -0.284 (-51.4%) -0.064 (-69.9%) LOC_IS -0.256 (-46.2%) -0.058 (-63.5%) INC2 0.188 ( 34.0%) 0.097 (105.7%) INC3 0.286 ( 51.6%) 0.205 (223.4%) ALTINC 0.266 ( 48.0%) 0.177 (193.2%) Note: Results calculated using the “Yes” model from Table 2-3.
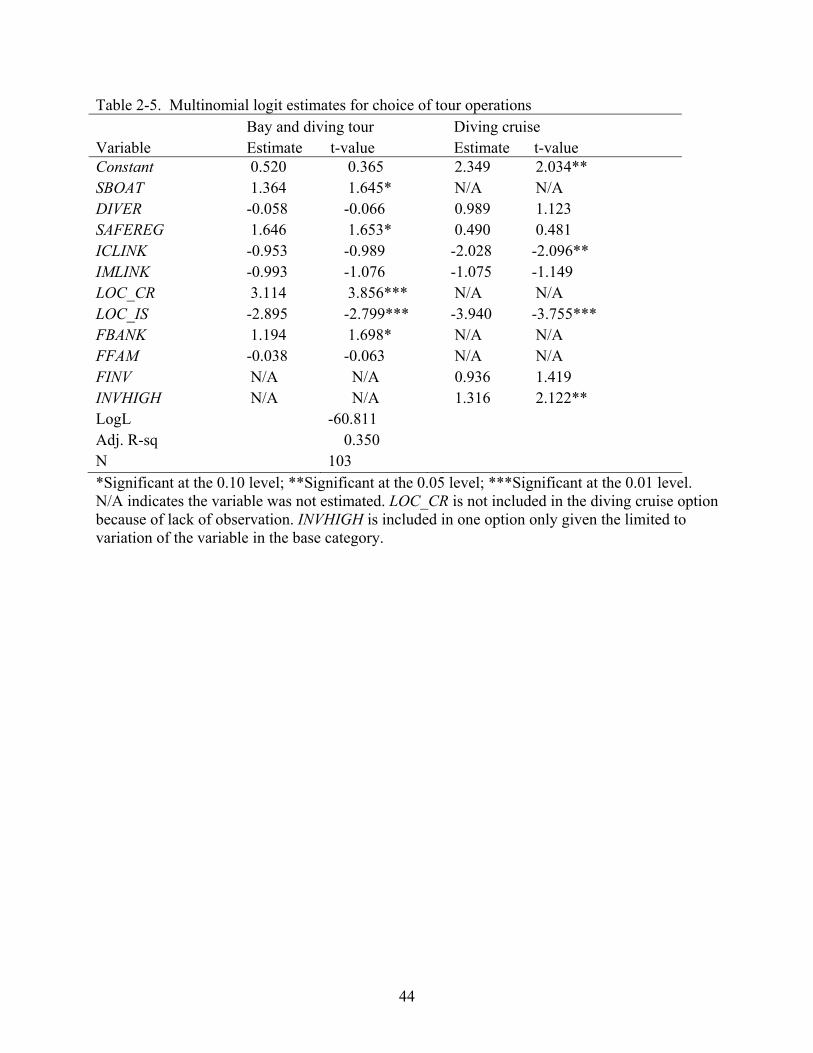
44
Table 2-5. Multinomial logit estimates for choice of tour operations Bay and diving tour Diving cruise Variable Estimate t-value Estimate t-value Constant 0.520 0.365 2.349 2.034** SBOAT 1.364 1.645* N/A N/A DIVER -0.058 -0.066 0.989 1.123 SAFEREG 1.646 1.653* 0.490 0.481 ICLINK -0.953 -0.989 -2.028 -2.096** IMLINK -0.993 -1.076 -1.075 -1.149 LOC_CR 3.114 3.856*** N/A N/A LOC_IS -2.895 -2.799*** -3.940 -3.755*** FBANK 1.194 1.698* N/A N/A FFAM -0.038 -0.063 N/A N/A FINV N/A N/A 0.936 1.419 INVHIGH N/A N/A 1.316 2.122** LogL -60.811 Adj. R-sq 0.350 N 103 *Significant at the 0.10 level; **Significant at the 0.05 level; ***Significant at the 0.01 level. N/A indicates the variable was not estimated. LOC_CR is not included in the diving cruise option because of lack of observation. INVHIGH is included in one option only given the limited to variation of the variable in the base category.

45
0.000.100.200.300.400.500.600.700.800.901.00
0 5 10 15 20 25 30 35 40 45 50 55 60
Fishing experience
Prob
abili
ty
A
0.000.100.200.300.400.500.600.700.800.901.00
0 1 2 3 4
No. Children
Prob
abili
ty
B
Figure 2-1. Probability of switching. (A) Probability by number of children. (B) Probability by fishing experience.
Crew
Owner
Crew
Owner

46
CHAPTER 3 ASSESING PRODUCTION TECHNOLOGY AND TECHNICAL EFFICIENCY IN SMALL
SCALE FISHING FLEETS: DOES VESSEL INTERRELATION MATTER?
Introduction
The literature on production and technical efficiency analysis in large commercial fisheries
has increasingly expanded in the last decade. Most empirical analyses usually focus on
evaluating the effectiveness of capacity management programs, the effects of traditional input
controls on harvest levels and vessel performance, and on the assessment of the role of fishing
skills and vessel characteristics on explaining technical efficiency (Sharma and Leung 1999;
Greenville et al. 2006; Pascoe and Coglan 2002; Tingley et al. 2005; Felthoven 2002; Kirkley et
al. 1998).
However, fewer studies have addressed the specific production dynamics and technical
efficiency of artisanal fishing fleets. In comparison to the industrial large commercial sector,
artisanal fisheries are strongly influenced by socio-economic, technological and political factors.
These distinctive characteristics in turn affect the appropriate type of management strategies
(Berkes et al. 2001). Some studies explicitly mentioning the effect of production factors on
efficient output levels indicate that harvests are more sensitive to variable inputs than to
measures of vessel capital (e.g., size and capacity) (Fousekis and Klonaris 2003; Lokina 2008;
Esmaeili 2006). Other studies have analyzed in more detail the technical efficiency of small scale
fisheries in developing countries. There is evidence that the level of efficiency in input use is
more relevant than random events or luck in explaining output variability (Esmaeli 2006, Jeon et
al. 2006, Madau et al. 2009), although for the particular cases of artisanal trammel netters in
Greece and gill netters in the east coast of Malaysia inefficiency was not critical in determining
production performance (Fousekis and Klonaris 2003, Squires et al. 2003). In average, small
scale fishing fleets seem to operate with moderate technical efficiency, suggesting a significant

47
scope for output increases given the same input levels and resource conditions or input and costs
reductions for the existing output levels.
The previous literature has addressed the productivity and efficiency of fishing vessels as
independent production units, which decide autonomously how many inputs to use and what
fishing grounds to operate in. Only Schnier et al. (2006) presented a descriptive analysis of
paired trawling within and between producer segments using a latent class production model to
explore the issue of unobserved heterogeneity in the Northeast Atlantic herring fishery.
However, paired trawlers were excluded from the production modeling and efficiency
estimation. In the context of artisanal fishing fleets and their limited infrastructure, vessel
interaction in the production process may be a usual and customary practice to access different
fishing grounds, especially those far from the home ports. This interaction is likely to be
facilitated by the social ties prevalent on community-based production systems, where it is not
uncommon to observe family and friends forming composite production units. Hence,
accounting for vessel interdependence will help depict an appropriate production technology for
small scale fleets that operate under that system and obtain accurate estimates of their
productivity and technical efficiency. From a capacity management perspective for instance, this
information would be helpful to better evaluate the potential impacts of fleet reduction programs
that affect multi-vessel production units.
The objective of this chapter is to evaluate the production possibilities and technical
efficiency of individual vessels and also the role of mothership-catcher vessel interrelations on
boat performance with an application to the artisanal spiny lobster fishery in the Galapagos
Marine Reserve. The next section describes the characteristic of the fishery, section three
explains the stochastic frontier methodology employed, followed by the data description and

48
model specification in section four. Finally, results and conclusions with recommendations about
strategies to influence technical efficiency in the fleet are provided in section five.
The Artisanal Spiny Lobster Fishery
The spiny lobster fishery in the Galapagos Islands targets two species, Panulirus
penicillatus and Panulirus gracilis, commonly known as red and green lobster respectively. It
started in 1960 for subsistence purposes and expanded throughout the years with the introduction
of fishermen and vessels from the mainland and the adoption of improved harvesting methods
(Toral et al. 2002).
Since 1998, with the establishment of the special Law for the Galapagos and the creation
of the Marine Reserve, the fishing fleet has been constrained to limited entry and small scale
operations only. The fishery has become the second more important income-generation activity
for the fishing sector ( after sea cucumber) with landings of 31.40 MT and an ex-vessel value of
USD$900,000 approximately in 2006 (Hearn et al. 2007).
The fishing fleet is comprised by a total of 446 registered vessels grouped in three fleet
segments. Small wooden boats (WB) have a length between 3-8 mts. and the most limited
storage capacity and propulsion power, medium fiberglass (FG) vessels are 5 to 9.5 mts. long
and large boats (LB) are vessels of up to 18 mts., with the highest registered tonnage and engine
power measures (Table 3-1). Overall, fiberglass vessels account for the majority of the fleet (i.e.,
51%), while large boats represent only 14% (Table 3-2).
The fleet is distributed among the three main inhabited islands: San Cristobal, Santa Cruz
and Isabela. Most vessels are located in San Cristobal and, contrary to the other ports; wooden
boats represent most of the island fleet. By 2005, only sixty percent of the overall fleet was
active, with 88% of fiberglass boats, 46% of wooden boats and 43% of large boats actually
fishing (Hearn et al. 2006). Vessels usually operate independently for single-day fishing trips,

49
which are mostly near shore. For multi-day offshore fishing trips, however, vessels work within
the ‘mother boat’ system. In this system, larger or ‘mother’ boats tow smaller vessels to distant
fishing grounds and provide storage for their catches until landing at the home port (Baine et al.
2007). Compensation is given as a fixed fee or share of total harvests. The mother boat system
can be considered as a joint production unit where the harvesting performance of subunits (i.e.,
smaller vessels) is related to the corresponding mother boat. Only fiberglass and wooden boats
are considered fishing units in this fishery (Castrejon 2007)1.
The fishery is managed by limited entry and traditional input and output controls. The
fishing season is limited to 4-5 months a year, generally from September to December. The
product is collected exclusively by diving (i.e., scuba, hookah and snorkel), using Hawaiian
fishing spears with a trident length not exceeding 40 cm or just hand picking. Output controls
include minimum sizes of 26 and 15 cm for whole individuals and tails respectively, restrictions
to spawning stocks and total allowable catch measures per year. For 2009, the total catch quota
was set in 30 MT, which will be adjusted to the stock condition every season (Comisión Técnica
Pesquera de la Junta de Manejo Participativo 2009).
Despite the innovative participatory management framework and fishing controls, lobster
stock abundance has decreased during the last years raising concerns about the sustainability of
the resource and the local fishing community. From 2000 to 2005, total harvests decreased in
about 59% from an estimate of 85 MT to less than 35 MT per year with total revenues declining
in 53% (from almost USD$ 2 million to $900.000) (Hearn et al. 2006). As with other open
access fisheries worlwide, the need to rebuild these stocks and to limit the fishing capacity of the
fleet has become a priority for this resource.
1 Large boats are considered fishing units only for year round pelagic and demersal fisheries, specifically, whitefish.

50
Methodology
Production frontier methods provide a framework to identify the ‘best practices’ in an
industry, creating boundaries or frontiers against which the inefficiency of firms is assessed.
Firms on the frontier operate efficiently while those below the boundary are considered
inefficient. From an output perspective, the ‘best practice’ frontier refers to the maximum
possible output attainable by a firm at observed input combinations and given technology
(Kumbhakar and Lovell 2000).This paper uses the Stochastic Production Frontier (SPF)
methodology to assess the production technology and technical efficiency of the Galapagos
artisanal fishing fleet. This method is considered particularly appropriate in fisheries production
analysis, given the stochasticity related to the environmental and biological aspects of the
activity (Kirkley, Squires and Strand 1995).
Following the Battese and Coelli (1995) approach for panel data, a stochastic frontier
production function is defined as
jtjtjt XfY εβ += );(lnln , with jtjtjt uv −=ε (3-1)
Yjt represents the level of output for firm j in period t, Xjt is the vector of production
factors2 used by firm j in period t, β is a vector of coefficients to be estimated and εjt is a
composite error term where vjt represents a traditional random noise and ujt is an additional non-
negative one-sided error component capturing technical inefficiency of firm j3.
To obtain estimates of technical efficiency it is necessary to make distributional
assumptions regarding the error components vjt and ujt. Both terms are assumed to be
2 In fisheries, production factors are usually represented by a vector of capital stock or fixed inputs, variable inputs, non-discretionary stocks out of the producer’s control, and a vector of temporal, environmental or technological conditions (Kirkley et al 2002).
3 This composite error definition allows impacts of random events or unmeasured inputs on final output not to be confused or combined with inefficiency deviations (Kirkley et al 2002).

51
independently distributed from each other, with vjt ~iid N(0,σv2) and ujt ~id N*(μ,σu
2) where N*
indicates the normal distribution truncated at zero4.
In order to estimate inefficiency effects, ujt is specified as a function of relevant variables,
zjt, hypothesized to influence firms’ efficiency such that
ujt = δ0+ zjtδ+ wjt ; jit ~ N*(0, σu2 ) and ujt ~id N*( zjtδ, σu
2) (3-2)
where zjt is a vector of exogenous firm and operator specific factors. These factors differ
from those in the production frontier as they are more related to influencing the ability of vessels
to locate and catch fish than to determining the production technology. δ is the set of parameters
to be estimated and wjt is a random variable not required to be independently and identically
distributed, assumed to follow a normal distribution truncated at – zjtδ to satisfy the non-
negativity condition of ujt. Equations 3-1 and 3-2 are estimated jointly using maximum
likelihood techniques5. Details on the likelihood function and variance parameters and
transformations are provided by Battese and Coelli 1993.
The technical efficiency (TE) score for the individual firm j in period t is defined in a
logged-based functional form as:
)exp()exp( jtjtjtjt wzuTE −−=−= δ (3-3)
As the SPF model (Equations 3-1 and 3-2) is estimated given the joint density function of
the composite error term εjt, the estimator of technical efficiency, TE, is based on the conditional
4 Additional distributional assumptions for uit used in the literature include (a) a half-normal, (b) exponential and (c) 2-parameter Gamma distributions. The truncated normal distribution allows a more flexible specification for the one-sided efficiency error (Kumbhakar and Lovell 2000).
5 Joint estimation of the frontier and technical efficiency effects avoids inconsistencies between the distributional assumptions of the inefficiency term arising when Equations 3-1 and 3-2 are estimated using a 2-step approach. In that case, estimation of the stochastic frontier in the first step assumes identically and independently distributed inefficiencies (uit). In the second stage, the predicted TE scores are assumed to be a function of firm specific variables, meaning that the uit’s are not identically distributed (Battese and Coelli 1995).

52
expectation of ujt and TEjt. As shown in Kumbhakar and Lovell (2000), the TE for individual
firm j is predicted by the following expression:
*)}/*(/*]*)/*[({**]}2/1*{exp[]|)[exp( 2 σμσσμσμε jjjjjuE Φ−Φ+−=− (3-4)
where μi* and σ* are transformations of the variances of the error components uj and vj.
Estimation of technical efficiency effects (Equation 3-2) is plausible provided that
technical efficiency exists and that it is stochastic. The validity of these assumptions can be
tested using standard generalized likelihood ratio tests. To test whether or not inefficiency effects
are absent, the null hypothesis is expressed by γ =δ=0, where γ = σu2 / (σv
2+ σu2). If technical
inefficiency indeed applies to the model, it is necessary to test if they are stochastic through the
null hypothesis γ =0.6. Finally, the null hypothesis δ =0 is used to test if technical inefficiency is
a linear function of the hypothesized Zjt factors. As noted by Battese and Coelli (1995), if the
hypothesis that all δ are zero can not be rejected (excluding the intercept δ0), the uit would have a
truncated normal distribution with mean δ0.
A flexible functional form such as the translog production specification is recommended
for econometric estimation since it avoids imposing too restrictive assumptions on returns to
scale and elasticities of substitutions in the technology. The translog production function is given
by:
jtjtmjtn n k
m
mmkjtnjtnknjtnjt uvdXXXY −++++= ∑ ∑∑ ∑
=20 ln*ln2/1lnln ββββ (3-5)
6 If technical inefficiency is absent, the production frontier would reduce to the standard OLS mean production function with only the input variables Xjt included. In this case the degrees of freedom (number of parameter restrictions) equal 1 for γ and the number of δ coefficients, including δo. If technical efficiency is not stochastic (i.e., deterministic), the frontier reduces to a mean production function with the zjt variables added to the input (Xjt) variables in the specification. In this case, the number of degrees if freedom equals 1 for γ plus the number of non-identified δ parameters, in some cases being just δo. For these two hypotheses, the likelihood ratio statistic has an asymptotic mixed chi-squared distribution as γ=0 is on the boundary of the parameter space (Battese and Broca 1997). The appropriate critical values can be found in Table 1 of Kodde and Palm 1986.

53
where Yjt and Xnjt rpresent output and production inputs respectively, dmjt are additional
technology indicators, such as time, resource stocks, etc. However, this approach is likely to
create problems of multicollinearity and degrees of freedom (Coelli 1995). An alternative
functional form such as the Cobb-Douglas production function can also be tested as a special
case of the translog function where all the βnk equal zero in order to validate the assumption of a
more restrictive production technology (Pascoe et al. 2003)7.
Data and Model Specification
The data used in this study are pooled cross sections of trip-level catch and fishing effort
from a total of 316 individual vessels during the period 1997-2006. The total dataset consisted of
8746 trip observations and it was obtained from the Charles Darwin Research Station monitoring
program8. The information included landing volume, fishing effort, fishing sites, vessel names,
departure and landing ports and an indicator of whether the vessel was towed or not in the
specific trip. Data on physical boat characteristics such as length, engine power, gross registered
tonnage and construction year was provided by the Galapagos National Park Service.
The estimation sample was limited to fiberglass and wooden vessels only because reported
output from large boats (i.e., motherships) corresponds to the catch of the smaller vessels they
tow (Castrejon 2007). Vessels with less than 5 trips were excluded in order to reduce the number
of missing time series. Also, catch data with values of zero or more than 500 MT and gross
registered tonnage (GRT) of more than 5.68 tons were considered outliers and were not included
7 Specifically, the Cobb-Douglas specification restricts output elasticities to be constant at all input levels and returns to scale to be equal across all firms.
8 Information was collected from almost all active fishing vessels during each season though either on-board observers or field assistants filling record sheets at the docks (Hearn et al 2006). Vessels were required to report their landings in order to obtain a monitoring certificate from the Galapagos National Park to be able to sell their product. Landings that were not monitored are considered illegal catch.

54
in the final sample9. Missing information for towing accounted for 21% of the sample and it was
dropped from the sample to avoid bias from any missing data adjustment method as this is a
fundamental variable in the analysis. Therefore, the analysis was conditional on towing
information. Most missing data for control variables such as capital characteristics and fishing
effort accounted for less than 6% of the sample and were replaced using the dummy adjustment
method10,11. The final sample included 201 fishing boats and 6381 observations. A detailed
description of the variables, summary statistics and a priori expected effects are presented in
Table 3-3. In comparison to a sample that is not conditional on observing towing data, boats in
the final sample had higher average catch and storage capacity levels (Table 3-4). The absence of
towing information caused only a moderate underrepresentation of fishing units departing from
or fishing in San Cristobal, of those operating during the first two years in the analysis (1997-
1998) and those fishing by hand picking. Conversely, boats operating around the other fishing
ports, during the period 1999-2001 and which used mechanized gear were overrepresented. The
rest of the variables remained considerably similar.
The analysis follows the approach suggested by Battesse and Coelli (1995) given its ability
to identify factors influencing technical inefficiency in a panel data context. A full Translog
specification was not allowed by the data as several interaction terms had a linear correlation
9 GRT outliers represented only 1% of the sample and consisted of 60 observations from 3 fiberglass boats. They differed substantially from the rest of the sample as a measure of capital, and were likely to introduce biases in the model, as indicated by preliminary analysis.
10 The dummy adjustment method replaces missing values with the mean of the corresponding variable and additionally creates a dummy variable indicating that the observation was missing, which must be included in the model (Allison 2002).This approach allows retaining non missing information from the same cross sectional unit with missing data, and it is better justified if applied to a small percentage of the sample.
11 Preliminary regression analysis was used to compare the effect of listwise deletion vs. dummy adjustment for missing data. Coefficients remained relatively stable for most factors across methods, but listwise deletion of missing data on boat age (14% sample) created stability and converging problems. For that reason dummy adjustment was considered a justified approach.

55
greater than 0.99 and caused stability and convergence problems. Hence, the frontier model for
the Galapagos spiny lobster fishery is specified as a Cobb-Douglas production function12:
jtjtjjtjtm
jmm
kjtkkjtjtjjt
uvDWBOATDTOWDTOWDWBOATDYEAR
DZONENDIVERSSEADAYSGRTWEIGHT
−++++
+++++=
∑
∑
=
=
*
lnlnlnln
1312
10
211
19
13210
φφφφ
αββββ (3-6)
WEIGHTjt represents catch volume in kilograms for vessel j in trip t13; GRTj is the gross
registered tonnage of vessel j capturing the capital stock measure14, and variable inputs are
denoted by SEADAYSjt and NDIVERSjt , the number of days at sea and number of divers
observed for vessel j in trip t respectively.
DZONEkjt is a vector of dummy variables indicating if vessel j fished in zone k and it is
intended to control for high and low productivity areas capturing the effect of resource stock
availability15. The next variables are dummy indicators used to control for temporal and
technological conditions. DYEARm represents a vector of M-1 year binary variables which are
intended to capture non linear technical change in time, and DWBOATj indicates if vessel j is a
wooden boat. The term DTOWjt is introduced to control for vessel interrelations in the
production process, taking the value of one if vessel j was towed in trip t. This variable was 12 Generalized likelihood ratio tests of joint significance did not support the inclusion of cross product input terms in a translog specification context.
13 Catch is expressed in kilograms to avoid negative values after logarithmic transformations and it is treated as a single-output measure since there are not price differentials between the two target species. In addition, lobster output is modeled separately from other fisheries also open during lobster season since participation in different fisheries requires completely separate fishing trips given the differences in gear use, technology and the spatial distribution among resources.
14 An additional fixed input, horse power, was also considered in preliminary models, but the inclusion of a second factor did not improve the performance of the model as indicated by likelihood ratio tests. The inclusion of GRT over horse power was supported by AIC and BIC criteria.
15In the absence of independent measures of stock biomass, using area-based dummy variables as proxies for stock abundance allows to control for spatial differences in resource abundance, fishing practices and socio-economic conditions (Squires et. al. 2003). In this case, all fishing zones are included in the model because they are not mutually exclusive; vessels can fish in more than one site in the same trip, especially during multi-day trips.

56
introduced in the frontier function as opposed to the inefficiency model because the towing
system reflects a technological component likely to affect input use and maximum possible
output. It allows vessels to spend more days at sea and to go to more and different fishing sites
increasing their exposure to different levels of resource abundance. Finally, the interaction term
DTOWjt*DWBOATj captures possible differential effects of the towing system between fiberglass
and wooden boats16.
The inefficiency measure for vessel j in trip t, ujt, is specified as:
++++++= jtjtjtjtjtjt DGEARDFDIVEDPORTDPORTDPORTu 543210 431 δδδδδδ
jtjtj uvBAGE −+6δ (3-7)
The first five explanatory variables are dummy indicators taking the value of one if the
vessel homeport is Puerto Baquerizo Moreno (San Cristobal) (DPORT1jt), Puerto Villamil
(Isabela) (DPORT 3jt) or others (DPORT4jt), if divers practiced free diving as opposed to hookah
methods (DFDIVEj), and hand-picked the catch (DGEARjt); while BAGEj measures the age of
the boat in years. These variables intend to capture the effect of social and vessel-specific
practices and characteristics on the observed efficiency of input use.
According to economic theory, fixed and variable inputs (GRT, SEADAYS and NDIVERS)
are expected to have a positive effect on the catch frontier and the year indicators for 2005 and
2006 (DYEAR9 and DYEAR10) are hypothesized to show a negative effect given the reduction in
resource biomass observed in those years. The coefficients for DPORT1, DPORT3, and
DPORT4 are expected to have a negative effect on technical inefficiency as they represent ports
with higher fishing activity in comparison to the tourism-based economy of the base port
16 A model with interactions between WBOAT and DTOW with inputs was also explored to check for differential impacts on inputs main effects but they were jointly non-significant as indicated by likelihood ratio test statistics.
57
(DPORT2) and they may presumably be more efficient in their input use given their fishing
specialization. The practice of free diving (DFDIVE) and the use of non-mechanized gear
(DGEAR) are likely to limit the full use of the existing technology increasing technical
inefficiency (reducing technical efficiency). Older vessels may be in worse maintenance
conditions or constructed with outdated materials and designs, which is also expected to limit the
optimal use of available inputs and boat efficiency (Pascoe and Coglan 2002; Squires et al 2003).
Vessel interrelation (DTOW) may have different effects on the production frontier. On one
hand, it could show a positive effect on output as being towed increases the number of days that
individual vessels can spend fishing and the number of sites they can reach, simulating an
expansion of fishing technology. On the other hand, towed boats function just as a part of a
bigger fishing unit (i.e., mothership) and they may need to adjust their catch considering the rest
of vessels in the mothership and the available storage space. Consequently, their catch per day
may be more limited than for independent boats. Additionally, controlling explicitly for the
towing factor in the frontier model might capture part of what might be considered inefficiency
in the absence of that control. These are empirical questions to be answered by the analysis. The
rest of the variables have unknown a priori expectations.
Characteristics of the sample differed between towed and independent boats in a given
fishing trip (Table 3-5). On average, towed vessels were smaller (i.e., lower GRT), spent more
days at sea and had higher catches per trip than autonomous boats (25,980 vs. 11,448 kgs.
respectively).The majority of towed boats in the sample (68%) operated in the north and west
section of Isabela Island and around two other zones father north in the archipelago in
comparison to 91% of independent boats which fished closer to the main ports (Santa Cruz, San
Cristobal and the southern part of Isabela Island). In order to assess the implications of

58
controlling for the effect of vessel interrelation (i.e., towing effects) on production and technical
efficiency, the complete (base) model presented in Equation 3-6 and Equation 3-7 is compared to
a restricted version without those controls (i.e., restricted model). The production frontier and the
inefficiency effects models are estimated simultaneously using maximum likelihood routines in
FRONTIER 4.1 (Coelli 1996).
Results
Frontier Model
The coefficient estimates for the complete (base) and restricted models are reported in
Table 3-6. Generalized likelihood ratio tests for the validity of a stochastic frontier specification,
inefficiency determinants and interrelation effects for both models are reported in Table 3-7.
Results show that the stochastic frontier framework is more appropriate than the mean
production function for the sample data (γ =δ=0 strongly rejected), technical inefficiency is
stochastic (γ =0 strongly rejected), and that inefficiency effects are a linear function of the
proposed social and vessel specific factors (δ1=…δ5=0 strongly rejected). The inclusion of vessel
interrelation (DTOW and interaction term) significantly improved the final model specification
as supported by the result of the first hypothesis for the complete model. Result interpretations
will be based on the complete model and comparisons with the restricted specification will be
introduced later to assess any differences.
Input variables were statistically significant, had the expected signs, and since the model
was expressed in logarithmic form, the significant input coefficients represent output elasticities.
Given the assumption of a Cobb-Douglas technology, trip productivity depended mostly on the
number of days spent at sea as a proxy of fishing time (0.97 elasticity), followed by labor (0.50
elasticity) and capital (0.017), although only the variable inputs had significant effects. This
finding is not surprising since the fiberglass and wooden vessel segments are relatively

59
homogenous in terms of capital and by nature, the lobster fishery is a diving intensive activity.
The fishing technology exhibited increasing returns to scale even if excluding the non-significant
elasticity of capital (i.e., an expansion of 1% in all inputs yielded more than 1% output increase).
In fisheries, there are a priori reasons to expect variable returns to scale (Pascoe et al. 2003),
specially decreasing returns, given the incentives for overcapitalization in open access fisheries.
However, this result reflects the artisanal nature of the Galapagos fishing fleet, and it is
consistent to the findings of previous studies. For instance, returns to scale for the trammel net
inshore fleet in Northeastern Greece and for the gillnet artisanal fleet operating in the
Hormozgan Province (Iran) were estimated at 1.26 and 1.42 respectively (Fousekis and Klonaris
2003; Esmaeili 2006). Similarly to our study, higher harvest responses for these artisanal fleets
were associated primarily to changes in variable inputs such as the amount of gear used or
number of days at sea. Interestingly, in theses cases, capital inputs significantly affected output
levels.
Some of the disaggregated zone indicators capturing the spatial distribution of stocks are
statistically significant. Vessels fishing around San Cristobal South and East, Isabela West,
Marchena and Genovesa Islands had significantly larger catches, while harvests were lower in
Santa Cruz grounds. This finding indicates particularly unfavorable stock conditions in Santa
Cruz, which is consistent with the historical lower abundance levels reported for that area in
comparison to other zones (Hearn et al. 2006). Additionally, trip productivity was significantly
lower for vessels operating during the 2004 and 2006 seasons. These temporal effects are most
likely attributed to the observed drop in resource stocks after 2004 rather than to any technical
change effect in the fleet. As hypothesized, the vessel interrelation variable (DTOW) and the
corresponding interaction term (DWBOAT*DTOW) were highly significant. Results showed that

60
in fact, towed vessels were less productive than autonomous boats despite the expansion of days
at sea and fishing zones available. This indicates that the towing system (mothership) limits the
harvesting potential of small vessels, but the negative effect was lower for small wooden boats in
comparison to fiberglass units as indicated by the positive sign of the interaction term. The
finding supports the relevance of accounting for vessel interrelations in the production
technology of small scale fisheries.
Technical Efficiency Model
Port of origin, gear type and vessel age were significant determinants of the fleet’s
technical efficiency (Table 3-6). The positive signs indicate an increase in technical inefficiency
or alternatively, a decrease in technical efficiency. Vessels departing from Isabela (DPORT3)
were more inefficient than vessels from Santa Cruz, the main tourism hub, and there was no
evidence of higher efficiency for vessels originating in the main fishing port, San Cristobal
(DPORT1). Only vessels related to other, occasional, departure ports showed higher technical
efficiency (i.e., lower technical inefficiency) relative to the base. A possible explanation may
arise from the lack of active cooperative organization in the fishing communities, which limits
the development of fishermen attributes that may be applied to increase their fishing efficiency
(e.g., training and specialization options). Although these results did not support the hypothesis
of better performance for vessels from fishing-based communities relative to the tourism-based
port, they suggested that technical efficiency varies across geographically distributed vessel
groups.
Hand picking (DGEAR) and free diving (DFDIVE) increased technical inefficiency (i.e.,
reduced efficiency) relative to the use of Hawaiian spears or hooks and more advanced methods
like hookah diving. Surprisingly, older vessels (BAGE) were less inefficient (more efficient) than

61
younger boats17. However, a similar effect was also observed by Squires et al. (2003) in artisanal
fisheries. They argued that vessel performance may respond to a learning period, and that older
vessels are more likely to be mastered to the fullest, increasing their efficiency. Alternatively,
older vessels may have taken corrective measures such as updating their propulsion power in
order to compensate for the limitations of older capital vintage (e.g., dated construction materials
and hull design), actually increasing their efficiency in reaching fishing grounds faster.
As indicated by the γ (Gamma) coefficient, deviations from the output frontier depended
mostly on technical inefficiency rather than on random shocks as the variance of ujt (σ2u)
represented 96.6% of total error variance, σ2u +σ2
v. There is also considerable scope for technical
efficiency improvement in the fishery. Fleet performance varied widely, with scores ranging
from a lowest of 0.01 to a maximum of 0.92 and a mean technical efficiency of 0.65. The
distribution of the scores was slightly skewed to the right (Figure 3-1A), the majority of trips
(57%) were between 60%-80% efficient, and only around 15% were more than 80% efficient.
These results support the findings of previous studies in small scale fishing fleets; however, the
average performance and scores distribution are somewhat lower than those previously reported
in the literature. For instance, Fousekis and Klonaris (2003) reported and average technical
efficiency of about 72% for the inshore fleet of artisanal trammel netters in Greece with most
vessel units performing above 80% efficiency. Similarly, the small scale gillnet fleet of the
Hormozgan Province in Iran, which targets demersal and pelagic multispecies like tuna and
mackerel, was found to operate at around an average of 78% efficiency (Esmaeili 2006).
Using the estimated coefficients from the restricted model (Table 3-6), technical efficiency
scores for the fleet were also estimated for comparison with the complete model. Interestingly,
17 Non linear effects for boat age (BAGE) were also explored but results did not show any difference from the linear specification.

62
there is no evidence of overrepresentation of technical efficiency when failing to control for
vessel interrelation (DTOW) as the extent of technical inefficiency and the distribution of
efficiency scores between both models are similar (Figure 3-1A). The result may reflect the
particular fleet under study and further exploration of this effect on technical efficiency
estimation in other empirical applications is needed to test the validity of this conclusion.
Finally, technical efficiency of towed vessels was lower than for autonomous boats (Figure
3-1B).18 Fishing trips from towed units tended to concentrate more in the lower efficiency
ranges, with only 67% of towed trips operating at more than 80% efficiency in comparison to
72% of independent units performing at the same efficiency level. It is important to note that in
order to assess technical efficiency differences between the towing and autonomous
technologies, it will be necessary to analyze the performance of the motherships and towed boats
in a trip as a whole and comparing it to that of independent trips, which is beyond the scope of
this study.
Summary and Conclusions
This paper analyzed the production technology and technical efficiency of the artisanal
lobster fishing fleet in the Galapagos Marine Reserve during the period 1997-2006, accounting
for vessel interrelations into the production framework.
Given the assumed production technology, harvests were not significantly affected by
vessel capital. Instead, they were more sensitive to variable fishing effort. The fleet operated at
increasing returns to scale, which corresponds to the findings of previous studies also applied to
the small scale fisheries.
18Frontier and inefficiency effects models were explored for the towed and autonomous subsamples separately, but the increased lack of balance in the panel for the towed group created model instability and the pooled model was preferred.

63
The analysis revealed that considering vessel interrelation structures between large
motherships and smaller catcher boats in the modeling of the production technology matters, but
it did not affect the extent of the technical efficiency found in the fleet. Being towed limited the
harvesting frontier of individual catcher vessels, but the extent of the impact varied between
wooden and fiberglass boats. In addition, trips where individual vessels are towed also tended to
be less technically efficient than when they operate autonomously.
Results indicated a considerable potential for technical efficiency improvement in the fleet.
Technical inefficiency accounted for most of the variation in catches and, on average, vessels
were only 65% efficient in their input use. These findings contribute to the evidence of
moderate-to-high technical efficiency observed in small scale fishing fleets.
Geographical location, diving methods, gear type and vessel age had significant impacts on
technical efficiency levels. Policies promoting and enforcing the use of more advanced diving
methods and collection gear, as well as targeting the crew of younger vessels with training
programs will likely increase the technical efficiency of the boats. Locally-based governance
efforts to strengthen fishermen cooperatives might also prove useful to improve the technical
efficiency of vessels in San Cristobal and Isabela. Active fishermen organizations are likely to
have the incentives to conduct a more organized and monitored fishing activity. They may also
facilitate appropriate training of members through partnerships with the management authority or
development NGOs working in the area.
Technical efficiency increase in fisheries may be an undesirable objective in the absence of
appropriately defined property rights, especially in stock declining fisheries (Jeon et al. 2006).
However, policies that promote input savings while maintaining the observed output levels will

64
help increase the profitability of the fleet, improving their economic performance without
expanding the fishing pressure on the stocks in the short run.
From a capacity management point of view, the results suggest that capital reduction
policies (e.g., vessel decommissioning programs) in the small scale fiberglass and small wooden
fleet segments will have little effect on the efficient harvesting potential in the Galapagos spiny
lobster fishery. Instead, controls targeting variable fishing effort (e.g., fishing time and labor)
will be more useful to affect catch at the trip level19. However, the potential for technical
efficiency improvements in the fleet are a latent limitation for the success of capacity reduction
policies in the absence of strategies that complementarily address the lack of property rights.
Given multicollinearity limitations to estimate a flexible functional form of technology,
this paper assumed a Cobb-Douglas production function and focused on the effect of vessel
interrelation on fiberglass and small wooden vessels as individual production units. Additional
research addressing multi-vessel structures as composite fishing units and the influence of vessel
interrelation in technical efficiency measurement in other empirical applications is recommended
to complement the present analysis. Finally, the results of this study are conditional on observing
towing information. Future work needs to address the issue of sample selection due to missing
information for towing status.
19 Limitations on days at sea will likely be compensated with increases in labor effort, but the output effect of increased labor will be lower than that caused by changes in days at sea as indicated by the estimated output elasticities.

65
Table 3-1. Average fleet characteristics Boat Fiberglass Wooden boat Length (mts) 11.14 6.94 4.81 GRT (tonnes) 20.62 2.85 1.71 Engine power (hp) 109.35 75.68 46.78 Crew capacity (individuals) 6.60 3.00 3.00
Source: Fishing Registry 2008, Galapagos National Park Service. Table 3-2. Geographical distribution of the fleet
Type Total San Cristobal Santa Cruz Isabela
Boat 14.35% 16.51% 18.75% 6.61% Fiberglass 51.57% 36.79% 64.29% 66.12% Wooden boat 34.08% 46.70% 16.96% 27.27% Total Fleet 100.00% 47.53% 25.34% 27.13%
Source: Fishing Registry 2008, Galapagos National Park Service.

66
Table 3-3. Variable definition and descriptive statistics Variable Description Mean Std. Dev. Min Max Expected effect WEIGHT Catch weight in kilograms per trip 13165.83 21664.99 40 343637 Frontier: GRT Gross registered tonnage in tons 2.195 0.822 1 5.68 (+) SEADAYS Number of days at sea per trip 1.740 2.000 1 23 (+) NDIVERS Mean number of divers per trip 1.300 0.468 1 4 (+) DZONE1 1 if fishing zone Isabela Sur, 0 otherwise 0.486 0.499 0 1 (- / +) DZONE2 1 if fishing zone Santa Cruz, 0 otherwise 0.245 0.429 0 1 (- / +)
DZONE3 1 if fishing zone San Cristobal South and East, 0 otherwise 0.114 0.317 0 1 (- / +)
DZONE4 1 if fishing zone Isabela West, 0 otherwise 0.042 0.199 0 1 (- / +) DZONE5 1 if fishing zone Isabela North , 0 otherwise 0.029 0.168 0 1 (- / +)
DZONE6 1 if fishing zone San Cristobal North and West, 0 otherwise 0.023 0.148 0 1 (- / +)
DZONE7 1 if fishing zone Santiago, 0 otherwise 0.019 0.136 0 1 (- / +) DZONE8 1 if fishing zone Floreana, 0 otherwise 0.011 0.103 0 1 (- / +) DZONE9 1 if fishing zone Pinta, 0 otherwise 0.013 0.112 0 1 (- / +) DZONE10 1 if fishing zone Marchena, 0 otherwise 0.013 0.111 0 1 (- / +) DZONE11 1 if fishing zone Espanola, 0 otherwise 0.004 0.059 0 1 (- / +) DZONE12 1 if fishing zone Wolf, 0 otherwise 0.006 0.075 0 1 (- / +) DZONE13 1 if fishing zone Santa Fe, 0 otherwise 0.005 0.072 0 1 (- / +) DZONE14 1 if fishing zone Darwin, 0 otherwise 0.005 0.067 0 1 (- / +) DZONE15 1 if fishing zone Genovesa, 0 otherwise 0.006 0.076 0 1 (- / +) DZONE17 1 if fishing zone Rabida, 0 otherwise 0.002 0.043 0 1 (- / +) DZONE18 1 if fishing zone Pinzon, 0 otherwise 0.002 0.042 0 1 (- / +) DYEAR2 1 if 1998, 0 otherwise 0.003 0.052 0 1 (- / +) DYEAR3 1 if 1999, 0 otherwise 0.136 0.343 0 1 (- / +) DYEAR4 1 if 2000, 0 otherwise 0.175 0.380 0 1 (- / +) DYEAR5 1 if 2001, 0 otherwise 0.267 0.442 0 1 (- / +) DYEAR6 1 if 2002, 0 otherwise 0.169 0.375 0 1 (- / +) DYEAR7 1 if 2003, 0 otherwise 0.139 0.346 0 1 (- / +) DYEAR8 1 if 2004, 0 otherwise 0.059 0.236 0 1 (- / +)

67
Table 3-3. Continued DYEAR9 1 if 2005, 0 otherwise 0.049 0.215 0 1 (-) DYEAR10 1 if 2006, 0 otherwise 0.003 0.048 0 1 (-) DWBOAT 1 if wooden boat, 0 otherwise 0.400 0.490 0 1 (- / +) DTOW 1 if towed, 0 otherwise 0.118 0.323 0 1 (- / +) Inefficiency
DPORT1 1 if home port Baquerizo Moreno, 0 otherwise 0.185 0.388 0 1 (-)
DPORT3 1 if home port Puerto Villamil, 0 otherwise 0.519 0.499 0 1 (-) DPORT4 1 if home port Other, 0 otherwise 0.003 0.053 0 1 (-) DFDIVE 1 if free diving, 0 otherwise 0.014 0.119 0 1 (-) DGEAR 1 if hand gear , 0 otherwise 0.167 0.373 0 1 (+) BAGE Vessel age in years 4.763 4.465 0 21 (+)
Dummy base categories: 1997, hookah diving, fiberglass, autonomous vessels, mechanized gear ( spear and hook), and Puerto Ayora home port (Santa Cuz Island, tourism hub).

68
Table 3-4. Sample differences based on observation of towing information (DTOW)
Final sample (N=6381)
Not based on observing DTOW (N=8101)
Variable Mean Std. Dev. Mean Std. Dev. WEIGHT 13165.83 21664.99 12615.39 20290.47 Frontier: GRT 2.195 0.822 2.136 0.808 SEADAYS 1.740 2.000 1.677 1.852 NDIVERS 1.300 0.468 1.328 0.476 DZONE1 0.486 0.499 0.454 0.497 DZONE2 0.245 0.429 0.199 0.398 DZONE3 0.114 0.317 0.182 0.385 DZONE4 0.042 0.199 0.036 0.185 DZONE5 0.029 0.168 0.024 0.153 DZONE6 0.023 0.148 0.036 0.186 DZONE7 0.019 0.136 0.017 0.129 DZONE8 0.011 0.103 0.017 0.131 DZONE9 0.013 0.112 0.011 0.105 DZONE10 0.013 0.111 0.012 0.107 DZONE11 0.004 0.059 0.006 0.008 DZONE12 0.006 0.075 0.005 0.067 DZONE13 0.005 0.072 0.005 0.072 DZONE14 0.005 0.067 0.004 0.062 DZONE15 0.006 0.076 0.005 0.070 DZONE17 0.002 0.043 0.002 0.044 DZONE18 0.002 0.042 0.002 0.044 DYEAR2 0.003 0.052 0.068 0.252 DYEAR3 0.136 0.343 0.108 0.310 DYEAR4 0.175 0.380 0.139 0.347 DYEAR5 0.267 0.442 0.212 0.409 DYEAR6 0.169 0.375 0.168 0.374 DYEAR7 0.139 0.346 0.134 0.341 DYEAR8 0.059 0.236 0.059 0.236 DYEAR9 0.049 0.215 0.046 0.210 DYEAR10 0.003 0.048 0.002 0.046 DWBOAT 0.400 0.490 0.441 0.496 DTOW 0.118 0.323 0.118 0.323 Inefficiency DPORT1 0.185 0.388 0.278 0.448 DPORT3 0.519 0.499 0.482 0.499 DPORT4 0.003 0.053 0.005 0.067 DFDIVE 0.014 0.119 0.016 0.126 DGEAR 0.167 0.373 0.240 0.427 BAGE 4.763 4.465 5.003 4.439

69
Table 3-5. Sample statistics by towing status DTOW=0 (N=5627) DTOW=1 (N=754) Variable Mean Std. Dev. Min Max Mean Std. Dev. Min Max WEIGHT 11448.72 15225.21 200 268409 25980.35 45370.50 40 343636.10 Frontier GRT 2.230 0.821 1 5.68 1.940 0.785 1 4.35 SEADAYS 1.549 1.287 1 17 3.167 4.383 1 23 NDIVERS 1.270 0.454 1 4 1.548 0.498 1 2 DZONE1 0.525 0.499 0 1 0.203 0.399 0 1 DZONE2 0.271 0.444 0 1 0.051 0.217 0 1 DZONE3 0.127 0.332 0 1 0.015 0.116 0 1 DZONE4 0.016 0.126 0 1 0.231 0.421 0 1 DZONE5 0.009 0.096 0 1 0.178 0.382 0 1 DZONE6 0.026 0.157 0 1 0.000 0.000 0 0 DZONE7 0.007 0.084 0 1 0.108 0.310 0 1 DZONE8 0.007 0.082 0 1 0.041 0.199 0 1 DZONE9 0.002 0.044 0 1 0.093 0.290 0 1 DZONE10 0.002 0.042 0 1 0.093 0.290 0 1 DZONE11 0.004 0.064 0 1 0.000 0.000 0 DZONE12 0.000 0.013 0 1 0.046 0.211 0 1 DZONE13 0.004 0.062 0 1 0.015 0.120 0 1 DZONE14 0.000 0.019 0 1 0.036 0.186 0 1 DZONE15 0.003 0.050 0 1 0.031 0.172 0 1 DZONE17 0.000 0.013 0 1 0.015 0.120 0 1 DZONE18 0.001 0.030 0 1 0.008 0.089 0 1 DYEAR2 0.003 0.055 0 1 0.000 0.000 0 0 DYEAR3 0.154 0.361 0 1 0.004 0.063 0 1 DYEAR4 0.176 0.381 0 1 0.167 0.373 0 1 DYEAR5 0.242 0.428 0 1 0.454 0.498 0 1 DYEAR6 0.164 0.370 0 1 0.211 0.408 0 1 DYEAR7 0.150 0.357 0 1 0.058 0.235 0 1 DYEAR8 0.063 0.243 0 1 0.032 0.176 0 1 DYEAR9 0.045 0.208 0 1 0.074 0.262 0 1

70
Table 3-5. Continued DYEAR10 0.003 0.052 0 1 0.000 0.000 0 0 DWBOAT 0.383 0.486 0 1 0.529 0.499 0 1 Inefficiency DPORT1 0.167 0.373 0 1 0.317 0.466 0 1 DPORT3 0.544 0.498 0 1 0.338 0.473 0 1 DPORT4 0.002 0.044 0 1 0.009 0.096 0 1 DFDIVE 0.016 0.126 0 1 0.000 0.000 0 0 DGEAR 0.156 0.363 0 0.267 0.442 0 1 BAGE 4.797 4.436 0 21 4.513 4.664 0 20

71
Table 3-6. Parameter estimates Restricted model Complete model Variable Estimate t-value Estimate t-value Stochastic Frontier Model Constant 9.336 29.621*** 9.373 29.906*** GRT 0.014 0.531 0.016 0.581 SEADAYS 0.970 57.577*** 0.972 57.239*** NDIVERS 0.497 17.484*** 0.499 17.457*** DZONE1 -0.035 -0.646 -0.066 -1.223 DZONE2 -0.184 -3.367*** -0.224 -3.868*** DZONE3 0.229 3.830*** 0.194 3.179*** DZONE4 0.128 2.097** 0.162 2.625** DZONE5 -0.051 -0.824 -0.019 -0.294 DZONE6 0.139 1.776* 0.103 1.294 DZONE7 -0.083 -1.138 -0.065 -0.872 DZONE8 0.161 1.700* 0.141 1.469 DZONE9 -0.079 -0.920 -0.041 -0.459 DZONE10 0.250 2.850*** 0.277 3.054*** DZONE11 0.150 1.051 0.112 0.783 DZONE12 0.045 0.325 0.127 0.919 DZONE13 -0.071 -0.539 -0.101 -0.752 DZONE14 0.100 0.634 0.143 0.925 DZONE15 0.355 3.071*** 0.353 3.023*** DZONE17 0.001 0.000 0.038 0.193 DZONE18 -0.051 -0.238 -0.073 -0.348 DYEAR2 -0.025 -0.073 -0.021 -0.061 DYEAR3 -0.069 -0.224 -0.075 -0.244 DYEAR4 -0.061 -0.198 -0.065 -0.209 DYEAR5 -0.240 -0.776 -0.236 -0.766 DYEAR6 -0.336 -1.086 -0.329 -1.064 DYEAR7 -0.297 -0.959 -0.301 -0.975 DYEAR8 -0.629 -2.024** -0.633 -2.039** DYEAR9 -0.427 -1.375 -0.424 -1.368 DYEAR10 -0.921 -2.612*** -0.921 -2.602*** DTOW -0.181 -3.911*** DWBOAT -0.018 -0.833 -0.028 -1.195 DTOW*DWBOAT 0.135 2.459** Inefficiency Model Constant -16.510 -2.829*** -14.437 -3.316*** DPORT1 -0.282 -2.058** -0.143 -1.022 DPORT3 0.766 3.391*** 0.853 3.628*** DPORT4 -6.786 -2.421** -7.266 -4.240*** DFDIVE 5.288 3.918*** 4.818 4.119*** DGEAR 3.502 3.072*** 3.113 3.403*** BAGE -0.079 -6.647*** -0.069 -8.132*** Sigma-squared 9.146 3.135*** 7.959 3.738*** Gamma 0.970 97.967*** 0.966 102.283*** Log likelihood -6869.523 -6862.642 N 6381 6381
*Significant at the 0.10 level; **Significant at the 0.05 level; ***Significant at the 0.01 level.

72
Table 3-7. Hypotheses testing for parameters of the frontier and inefficiency models
Null Hypothesis
Log-likelihood value
Likelihood ratio statistic
Criticala value
No. restrictions
Restricted model 1. No TE (γ = δ = 0) -7089.982 440.92 19.05 11 2. Deterministic TE (γ = 0) -7065.588 392.13 5.14 2 3. Z factors do not affect TE (δ1 = …=δ9=0) -6890.976 42.91 16.92 9 Complete model 1. No tow effects (βDTOW=βDTOW*DWBOAT=0) -6869.523 14.68 5.99 2 2. No TE (γ = δ = 0) -7075.244 425.20 19.05 11 3. Deterministic TE (γ = 0) -7049.550 373.82 5.14 2 4. Z factors do not affect TE (δ1 = …=δ9=0) -6884.505 43.73 16.92 9 a Critical values for hypotheses about γ correspond to a mixed chi-squared distribution and were obtained from Table 1 in Kodde and Palm(1986).

73
0
5
10
15
20
25
30
35
40
[0.00 -0.10)
[0.10 -0.20)
[0.20 -0.30)
[0.30 -0.40)
[0.40 -0.50)
[0.50 -0.60)
[0.60 -0.70)
[0.70 -0.80)
[0.80 -0.90)
[0.90 -1]
Efficiency Range
%Tr
ips
0102030405060708090100
Cum
mul
ativ
e %
Base
Full
A
0
5
10
15
20
25
30
35
40
[0.00 -0.10)
[0.10 -0.20)
[0.20 -0.30)
[0.30 -0.40)
[0.40 -0.50)
[0.50 -0.60)
[0.60 -0.70)
[0.70 -0.80)
[0.80 -0.90)
[0.90 -1]
Efficiency Range
% T
rips
010
2030
4050
6070
8090
100
Cum
mul
ativ
e %
Tow ed
Autonomous
B Figure 3-1. Distribution of efficiency scores. (A) Comparison between restricted and complete
models. (B) Comparison between towed and autonomous boats.

74
CHAPTER 4 TOURISTS PREFERENCES FOR FISHERMEN-OPERATED EXCURSIONS
Introduction
In the wake of collapsing fisheries worldwide, fisheries managers have begun to consider
new and creative ways to reduce fishing effort while at the same time continuing to support
fishing communities. Recent strategies include vessel decommissioning programs or a change in
management system such as toward rights-based program. These programs can be effective, but
are costly to the public and time consuming and may not be possible in isolated areas. For
example, artisanal fishing communities do not have alternative sources of employment or the
infrastructure to disable fishing vessels.
One creative alternative to reduce commercial fishing effort but take advantage of the
available capital (vessels and fishing expertise) is to transition fishermen into marine-based
recreation (Kusakawa 1992; DiarioC 2003; Estrategia and Negocios 2009). In order for this type
of strategy to work, managers need to consider the potential demand for marine or boat-based
recreational activities offered by these new operators prior to promoting and implementing a
strategy that is new, different, and, therefore, risky.
In order to assess the potential for new products, researchers have relied on stated
preference analysis. With respect to new marine-based tours, and fishing-related tours in
particular, the existing literature has focused on such factors as changes in catch rates and fishing
conditions to understand consumer behavior (Alberini et al. 2007; Rolfe and Prayaga 2007;
Paulrud 2006; Prayaga et al. 2010; Stoll and Ditton 2006). Much of this literature has relied on
the contingent valuation approach to estimate the non-market value of regulatory changes that
affect recreational fishing.

75
To our knowledge, the only study specifically addressing the market potential of new boat-
based tours in the context of the transition of commercial fishers to tourism was presented by
Alban and Boncoeur (2004). They analyzed the general interest and potential demand for guided
fishing and non-fishing tours offered by commercial fishermen in the Iroise Sea, France. Using
personal interviews, they explored the role of demographics and tour-related attitudes on
preferences for the new trips. Their results suggested considerable general interest on tours
offered in commercial fishing boats, especially for non-fishing activities in comparison to
fishing-only tours. Preferences significantly differed between gender, age and social origin.
Females, participants between 20 to 55 years old and seniors or white collar workers were more
likely to prefer these tours. In summary, the transition of fishermen to the tourism industry was
expected to be a promising alterative due to the potential demand for the new tours.
The Galapagos Marine Reserve (GMR) provides a recent example of a similar initiative to
transfer existing fishing effort to local tourism in an attempt to rebuild declining fish stocks and
ensure sustainability of the local community. After appropriate training and vessel renovations,
selected fishermen will be allowed to provide the same type of tours provided by traditional
operators (standard tours like bay and diving trips, interisland and diving cruises), as well as new
artisanal fishing trips where consumers will be exposed to the local fishing culture and practices.
This latter option will offer fishermen the opportunity to continue applying their fishing and
boating skills and generate revenue for the local economy1. To assess the potential success of the
program, information about the market potential for fishermen as tour operators and for the
proposed new services is of critical importance.
1 While all tours generate revenue, those booked through large foreign tour-operators can often result in leakage of funds outside of the local community (either to mainland Ecuador or to foreign companies).

76
The objective of this chapter is to assess the interest in and potential demand for standard
tours and new artisanal fishing trips provided by fishermen in the GMR. The analysis uses stated
preference methods and probability models as the tour services are new options in the market.
Identifying the level of interest in the new operations provides a first indicator of market
potential. The level of interest is expected to depend primarily on consumers’ attitudes regarding
the characteristics of the tour providers, the quality of services, and the appeal of new tour
experiences (e.g., fishing in small boats) compared to current operations. This information will
help identify the type of consumers to target and the most relevant factors to increase the demand
for the new fishermen-based operations. This is especially important since fishermen have to
compete with well-established traditional operators. In addition, the potential demand can be
assessed for specific tours by examining what characteristics would increase the likelihood of
tourists including them in their itineraries (Roehl et al. 1993).
To examine the potential for new marine-based recreational boating tours offered by the
new tour operators (i.e., ex-commercial fishermen), I conducted a survey of past visitors. The
selection of past visitors as the sample frame was considered necessary due to the uniqueness of
the destination and, thus, the relatively small target population. In addition to standard socio-
demographic information, past visitors were asked about their trip, the benefits and concerns of
new tours, their general level of support for the program and level of interest for two different
types of tours, and the characteristics of each type of trip they would most prefer. The following
section describes the methodology that was used to quantitatively analyze interest and
willingness to book two specific types of new tours. Then, we describe the data and empirical
specifications of the models. Following a discussion of the results, we conclude with a brief
summary of the potential success of this program based on the reported consumer preferences.

77
Methodology
This study uses stated preference methods and a probability modelling framework to
analyze past visitors interest ratings and willingness to book fishermen-operated tours (both in
general and for a specific type of fishing tour). In summary, a higher level of interest in or
willingness to book a tour is assumed to generate a higher level of utility to the respondent.
Following Liao (1994), the latent indirect utility function for individual n generated by
fishermen-based tours can be modeled linearly as:
ni
n
I
i
in xV εβ += ∑
=1* 4-1
where i identifies the type of characteristics that are assumed to influence visitors’ interest
and willingness to include tours in their itineraries (i.e., xi variable vectors) and estimated
parameters. The types of variables assumed to affect either their interest or willingness to have
booked one of these new tours on their last trip include traditional demographic characteristics,
information about their last trip (duration and purpose, for example), the benefits and concerns of
booking with new operators, and for a specific tour, the characteristics of the trip that would be
most appealing to them.
Since utility is unobservable, and what is observed is the individuals’ stated interest for or
likeliness to book a tour, we can use the observed information to define a new variable, Yn, to
specify the preferences. For a multinomial ordered response model:
Yn = 1 If Vn* ≤ μ1 (μ1=0)
Yn = 2 If μ1 < Vn* ≤μ2
Yn = 3 If μ2 < Vn* < μ3
Yn = J If μJ-1 < Vn*
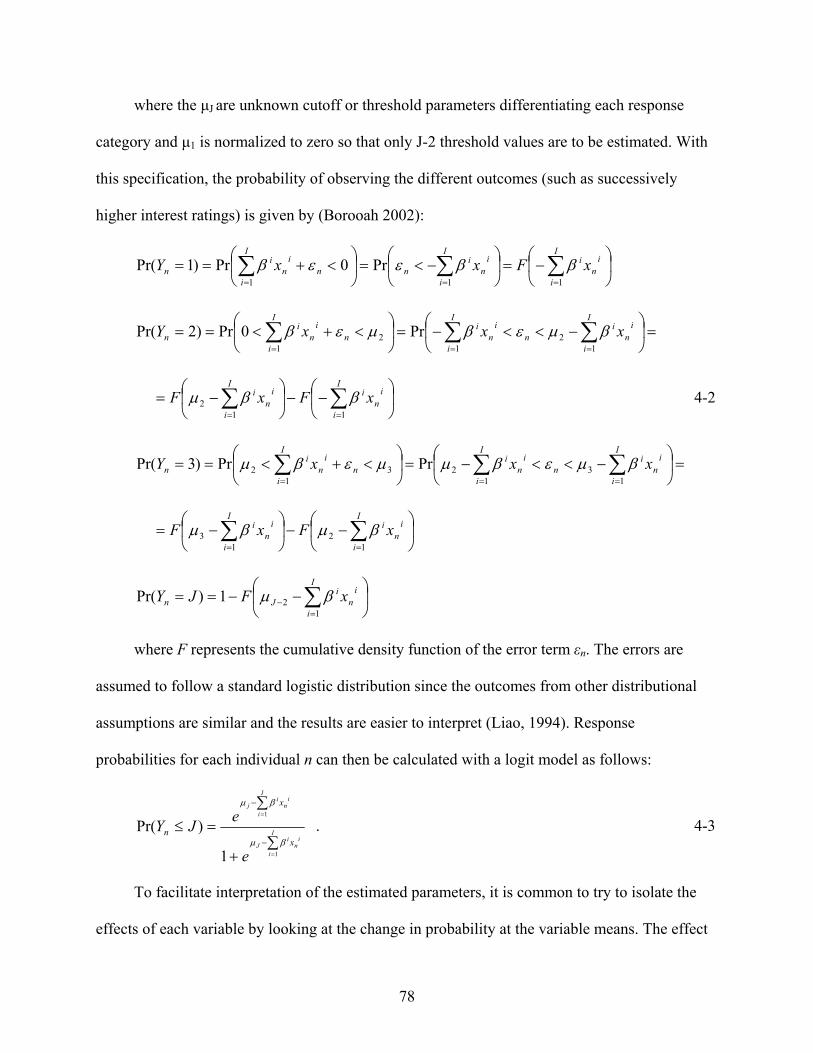
78
where the μJ are unknown cutoff or threshold parameters differentiating each response
category and μ1 is normalized to zero so that only J-2 threshold values are to be estimated. With
this specification, the probability of observing the different outcomes (such as successively
higher interest ratings) is given by (Borooah 2002):
⎟⎠
⎞⎜⎝
⎛−=⎟
⎠
⎞⎜⎝
⎛−<=⎟
⎠
⎞⎜⎝
⎛<+== ∑∑∑
===
I
i
in
iI
i
in
in
I
in
in
in xFxxY
111Pr0Pr)1Pr( ββεεβ
=⎟⎠
⎞⎜⎝
⎛−<<−=⎟
⎠
⎞⎜⎝
⎛<+<== ∑∑∑
===
I
i
in
in
I
i
in
iI
in
in
in xxxY
12
112 Pr0Pr)2Pr( βμεβμεβ
⎟⎠
⎞⎜⎝
⎛−−⎟
⎠
⎞⎜⎝
⎛−= ∑∑
==
I
i
in
iI
i
in
i xFxF11
2 ββμ 4-2
=⎟⎠
⎞⎜⎝
⎛−<<−=⎟
⎠
⎞⎜⎝
⎛<+<== ∑∑∑
===
I
i
in
in
I
i
in
iI
in
in
in xxxY
13
12
132 PrPr)3Pr( βμεβμμεβμ
⎟⎠
⎞⎜⎝
⎛−−⎟
⎠
⎞⎜⎝
⎛−= ∑∑
==
I
i
in
iI
i
in
i xFxF1
21
3 βμβμ
⎟⎠
⎞⎜⎝
⎛−−== ∑
=−
I
i
in
iJn xFJY
121)Pr( βμ
where F represents the cumulative density function of the error term εn. The errors are
assumed to follow a standard logistic distribution since the outcomes from other distributional
assumptions are similar and the results are easier to interpret (Liao, 1994). Response
probabilities for each individual n can then be calculated with a logit model as follows:
∑+
∑=≤
=
=
−
−
I
i
in
iJ
I
i
in
ij
x
x
n
e
eJY1
1
1
)Pr(βμ
βμ
. 4-3
To facilitate interpretation of the estimated parameters, it is common to try to isolate the
effects of each variable by looking at the change in probability at the variable means. The effect

79
of a continuous covariate on the response variable is given by the partial derivative of a
particular probability with respect to the explanatory variable of interest. In general notation, it
can be defined as follows where f represents the probability density function of the logistic
distribution:
iI
i
in
ij
I
i
in
ij
i
n xfxfx
jYββμβμ
⎭⎬⎫
⎩⎨⎧
⎥⎦
⎤⎢⎣
⎡−−⎥
⎦
⎤⎢⎣
⎡−=
∂=∂ ∑∑
==−
111
)Pr( 4-4
Partial derivatives are not; however, appropriate to capture the effect of discrete covariates.
In this case, the appropriate marginal effect is better estimated by taking the difference between
estimated probabilities when the discrete explanatory variable ix~ takes the value of 0 and 1
holding all other variables constant, usually at their means, using equation 4-3 such that:
)0~|Pr()1~|Pr(~)Pr(
==−===Δ
=Δ in
ini
n xjYxjYx
jY. 4-5
Binomial processes follow the same logic of the general ordered framework described
above, without the need of specifying separating thresholds as there is just one response
category. In this case, the binary outcome Y*n (such as whether or not the respondent would have
been willing to book a tour) is generated by the following relation:
Y*n =1 if Vn*>0
Y*n=0 otherwise
The probability of observing Y*n =1 is now given by:
⎟⎠
⎞⎜⎝
⎛−−=⎟
⎠
⎞⎜⎝
⎛−>=⎟
⎠
⎞⎜⎝
⎛>+== ∑∑∑
===
I
i
in
iI
i
in
in
I
in
in
in xFxxY
1111Pr0Pr)1*Pr( ββεεβ 4-6
Again, assuming a logistic distribution for the error term εn, this probability may be
estimated using the following equation:
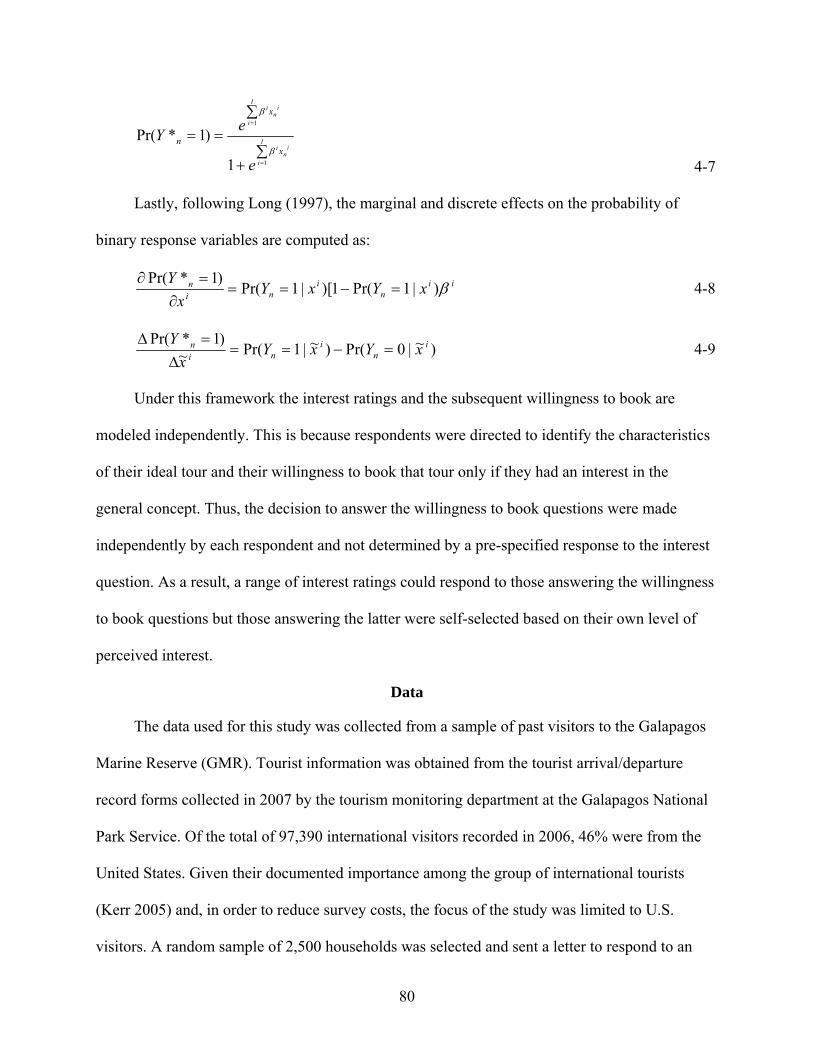
80
∑+
∑==
=
=
I
i
in
i
I
i
in
i
x
x
n
e
eY1
1
1
)1*Pr(β
β
4-7
Lastly, following Long (1997), the marginal and discrete effects on the probability of
binary response variables are computed as:
iin
ini
n xYxYx
Yβ)|1Pr(1)[|1Pr(
)1*Pr(=−==
∂=∂
4-8
)~|0Pr()~|1Pr(~)1*Pr( i
ni
nin xYxY
xY
=−==Δ
=Δ 4-9
Under this framework the interest ratings and the subsequent willingness to book are
modeled independently. This is because respondents were directed to identify the characteristics
of their ideal tour and their willingness to book that tour only if they had an interest in the
general concept. Thus, the decision to answer the willingness to book questions were made
independently by each respondent and not determined by a pre-specified response to the interest
question. As a result, a range of interest ratings could respond to those answering the willingness
to book questions but those answering the latter were self-selected based on their own level of
perceived interest.
Data
The data used for this study was collected from a sample of past visitors to the Galapagos
Marine Reserve (GMR). Tourist information was obtained from the tourist arrival/departure
record forms collected in 2007 by the tourism monitoring department at the Galapagos National
Park Service. Of the total of 97,390 international visitors recorded in 2006, 46% were from the
United States. Given their documented importance among the group of international tourists
(Kerr 2005) and, in order to reduce survey costs, the focus of the study was limited to U.S.
visitors. A random sample of 2,500 households was selected and sent a letter to respond to an

81
Internet survey in August 2009. A total of 229 letters were returned as undeliverable. By
September 15, 2009, 282 completed responses (12.4% response rate) had been submitted and
were used for the analysis.
The survey instrument had five components. The first section obtained information on the
visitors’ last trip. The second section discussed the entry fee (every foreign visitor pays a $100
entry fee of which $5 goes to the GMR) and their willingness to pay an additional $5 fee directly
to the GMR (which nearly everyone agreed). The third section described the state of the fishery
and the plan to move vessels from fishing to tourism. Participants were asked to individually rate
several distinct benefits and concerns associated with the proposal. In the fourth section,
respondents were asked to state their level of interest in booking two different types of tours:
standard excursions and artisanal fishing trips on a five-point qualitative scale ranging from “not
at all” interested to “very” interested. At this point, respondents were directed to specify their
preferred trip characteristics (using a closed-ended framework) if they had any interest at all in a
tour offered by ex-artisanal fishermen. The trip characteristics included trip length, boat size, and
activity options. Then, respondents were asked to consider their itinerary on their last trip and, if
their ideal tour would have been offered, would they have added the tour to their itinerary,
replaced another tour with this one, or would not have taken the tour. The final questions in this
section asked respondents to provide their maximum willingness to pay for the ideal tour they
specified as an open-ended question; however, a low response to this question and the high
variability of responses precluded further analysis.2 In the last section respondents were asked a
series of demographic questions.
2 Respondents were not required to answer any question. The high variability of responses was expected following traditional findings of open-ended contingent valuation models, although surveying past visitors was expected to partially solve the anchoring problem. Voluntary comments at the end of the survey indicated that the majority of

82
The dependent and explanatory variables are defined in Table 4-1 and the corresponding
summary statistics for each model are presented in Table 4-2. Four dependent variables are
defined for analysis: interest level in tours offered by ex-fishermen – both traditional tours that
are currently being offered and tours that would provide an artisanal fishing experience – and
whether they would have been willing to book one of these tours by ex-fishermen. Interest
variables were defined as categorical ratings on a scale of 1 (not interested at all) to 5 (very
interested). Potential demand is based on their stated willingness to have booked (added or
replaced) one of the tours during their last visit had they been available. Assessing to what extent
these new tours would negatively affect the demand for existing tours is important to evaluate
the overall effectiveness of the program to the economy as a whole. Unfortunately, insufficient
responses for the “replace” alternatives precluded the estimation of a multinomial logit
specification that would have formally analyzed the options independently3. Thus, these discrete
dependent variables reflect the willingness to book one of the tours regardless of whether the
tour would be added to an itinerary or replace an identical tour operated by a traditional tour
agency.
Figure 4-1 shows the distribution of responses for the interest response variables. Interest
for standard tours (INT1) is normally distributed with the majority of respondents being
somewhat interested. Of the subset of those reporting some level of interest (i.e., 69% of
sample), 59% of those would have been willing to book the standard tour they constructed (D1).
On the other hand, the distribution of responses for interest on artisanal fishing (INT2) was
skewed to the left, with most of the respondents being not interested at all in this tour option. Of respondents had pre-purchased a set number of tours such that they could not recall pricing of individual components.
3 Of course this is only unfortunate for our analysis, but the fact that the majority of respondents stated they would add a tour instead of replace one is an encouraging result for the managers.

83
those that did have some level of interest in an artisanal fishing tour (48%), 64% would have
been willing to include the fishing excursion of their design in their itineraries (D2). A detailed
comparison of willingness to book responses with respect to the level of interest for each type of
tour is shown in Table 4-3. Due to the self selection characteristic of the willingness to book
questions, the above mentioned percentages apply to the group of visitors who were particularly
interested in these tours and not to the overall sample of visitors. This is especially true of the
artisanal fishing tours which are hypothesized to apply to only a subset of visitors. However, the
characteristics of this sample were not dramatically different from those of a sample including
the self excluded respondents (Table 4-4).
The explanatory variables (Xi) were classified into four groups. The first group (X1)
represented relevant characteristics of the respondents’ last trip to the site, which were
hypothesized to influence demand intentions. These were very similar between samples, and
indicated that most visitors went to the islands for vacation as opposed to study or business, most
arranged their trips exclusively with travel agencies and stayed for six days on average.
The second group of explanatory variables (X2) included the potential benefits and
shortcomings associated with fishermen-operated tours. Most respondents, ranging from 78% to
88% across models, considered fish conservation as a highly important benefit of the switching
program; while only 37% to 40% considered the attraction of small boat amenities highly
compelling. The most important concern among visitors was the lack of experience of fishermen
as tour operators, which accounted for around half the visitors across samples, and the least
important concern was the lack of language skills as only 33% to 36% considered this a highly
important limitation associated to the new tours.

84
The third group of covariates (X3) included the trip characteristics for standard tours and
artisanal fishing trips operated by fishermen that will affect whether they would be willing to
book a tour. Most respondents preferred standard tour trips in at least medium size boats and
boating activities instead of snorkeling and diving specially (only 15% chose this last option),
but they showed similar preferences for different trip lengths. When deciding for an artisanal
fishing tour, half day trips were preferred to full day excursions (accounted for only 28%),
catching finfish using hook and lines or nets was preferred to a diving-based lobster fishing trip
(36%), and more than half respondents were compelled by the option of eating their catch at the
end of the trip.
Finally, the fourth group of explanatory variables (X4)included the demographic
characteristics of the respondent that are assumed to affect both whether they were interested in
or were willing to book either the traditional or new fishing tours offered by the ex-fishermen
Across models, respondents were relatively similar by gender, geographic origin and
membership to environmental and development organizations. The average respondent was
between 48 to 53 years old and had a relatively high household income level4 (USD$100,000-
USD$150,000).Most participants were white and highly educated, as 91%of them had at least a
college degree and 54% had a graduate education.
Results and Discussion
All models were estimated in Limdep 4.0 using maximum likelihood estimation (MLE)
techniques. Interest models were estimated using ordered logit specifications and potential
4 Income categories were specified as continuous instead of dummy variables as preliminary model runs suggested a positive and increasing correlation between interests and income across binary indicators. This also retained degrees of freedom, which is important with limited sample sizes. LOGINC was considered as an explanatory variable in order to explore non-linear effects of income. Preliminary model runs, likelihood ratio tests and information criteria for model selection did not support the inclusion of the linear income term for any of the artisanal fishing models, and only the logged term was retained for explaining interest and demand of fishing excursions.

85
demand models, as indicated by the willingness to book any type of tour, assumed binary logit
specifications. Coefficient estimates and marginal effects are discussed below for each type of
tour and policy implications are discussed at the end of the section.
Interest Models
Parameter estimates for the ordered multinomial logit models of the level of interest
expressed for the standard and artisanal fishing tours are shown in Table 4-5. All models were
superior to constant only specifications (p < 0.001) and statistically significant coefficients are
indicated at the 10% level or lower.
All threshold parameters (μ1, μ2 and μ3) were statistically significant confirming that the
response categories of both models are indeed ordered. Ten out of the nineteen explanatory
variables were significant determinants of interest for standard tours, while only five out of
eighteen covariates significantly explained the interest for artisanal fishing excursions. For
standard tours, of the four benefits considered in the model, fish stock conservation
(FISHCONS), exposure to the local culture (CULTURE) and small boat experiences (SBOAT)
explained interest level, while only one of the four concerns considered, namely the lack of
affiliation with a known company (AFFIL), was statistically significant. Gender, age, higher
education and income were also relevant factors explaining interest for this type of tour.
Expected benefits were less relevant in explaining the interest for artisanal fishing tours in
comparison to standard trips, and concerns were not significant at all. Only direct support to the
local community (LSUPPORT) influenced visitors’ interest for a fishing excursion. Gender, age,
and geographical location also influenced interest for this type of tour, but in contrast to standard
trips, education and income were not found to explain differences in the general interest for
fishing trips.
86
As the sign and magnitude of the estimated coefficients for ordered response models are
not directly interpretable, the direction and extent of the impact for each variable is better
illustrated by their marginal effects. These effects were computed at the means of the covariates
and the ‘marginal’ effects of binary variables were calculated as the difference between the
predicted probabilities when the variable take the values of zero (i.e., reflects the base category)
and one (i.e., reflects the included category). Table 4-6 and Table 4-7 report the marginal effects
on the probability of interest for the variables that were found significant in the standard tour and
artisanal fishing models.
For standard tours, the variation in responses for the ‘somewhat interested’ middle
category could not be significantly explained by the variables in the model (Table 4-6). Thus, the
trade-offs in probability changes are observed between the two lowest and highest interest levels
only. Individuals very compelled by fish conservation increased their probability of being highly
interested by 21 percentage points. High interest for exposure to the local culture and in
supporting operators of the smallest boats raised the probability of being highly interested
(providing a 4 or 5 interest rating) by 6 and 25 percentage points, respectively. Interest in smaller
boats had the highest positive impact on the interest for traditional tours. The lack of affiliation
with a known company reduced the probability of being highly interested by 10 percentage
points.
Gender and age had opposite effects on the interest probability for standard tours. Men
were about 10 percentage points more likely than women to be highly interested in this type of
tour, while a 10 year increase in average age reduced the probability of being very interested by
4 percentage points. Higher levels of education and income5 also reduced the interest in standard
5 This observation refers to the full effect of income shown in Table 4-6.

87
excursions. College graduates were 19 percentage points less likely to be in the highest response
categories and as average income increases one category, the probability of being highly
interested decreases by 23 percentage points.
In comparison to standard tours, significant trade-offs in the interest probabilities for
artisanal fishing were observed between the lowest (INT1=1) and the three top response
categories (INT1=3,4,5) with the marginal effects evenly distributed among each of the upper
categories (Table 4-7). Being highly compelled by the opportunity to contribute directly to the
local community reduced the probability of being not interested at all in fishing tours by 16
percentage points but increased the probability of being at least somewhat interested by 17
percentage points. Men and individuals from the southern and north central regions of the U.S.
were more likely to be at least somewhat interested in fishing tours by 14 and 22 percentage
points, respectively, as compared to women and residents of the Pacific coast. Age was the only
demographic variable indicating a decrease in interest for artisanal fishing. A ten-year increase of
average age reduced the probability of being at least somewhat interested by 0.7 percentage
points. Conversely, the probability of being not interested at all increased by around 0.6
percentage points.
Willingness to Book Models
The binary logit estimates for the willingness to book fishermen-based standard tours and
artisanal fishing trips are presented in Table 4-8. The models were significantly better than
constant-only specifications (p<0.05) and correctly predicted 80% and 77 % of the responses,
respectively. Seven of the twenty nine explanatory variables for the standard tour model
significantly explained the willingness to book such a tour, while five out the twenty five
covariates explained the likelihood to book an artisanal fishing excursion.
88
From the characteristics of their last trip, only independent travel arrangements had a
significant effect on the intention to book standard tours. Of all benefits, concerns and specific
trip characteristics considered, only a high interest for exposure to the local culture, high concern
for the lack of affiliation with known tour operators, and preferences for multi-day operations
played a role in explaining the decision to book a traditional tour. Geographical location and
income were the two demographic factors influencing the booking intentions for this type of
trips. The sign of the estimates in a binary logit model indicates the direction of the effects,
suggesting that only individuals highly compelled by the local culture and residing in the
northeastern region were more likely to book standard trips.
Contrary to standard tours, booking preferences for artisanal fishing were not significantly
explained by any benefits or concerns. A combination of independent and agency–based travel
arrangements and the length and dining characteristics of the trip significantly affected the
demand intentions for this tour. Individuals looking for full-day trips and those interested in
dining their catch at the end of the day were more likely to book a fishing excursion.
Interestingly, the type of target species was not a significant factor. Gender, graduate education
and income significantly influenced individuals’ booking intentions for an artisanal fishing tour
and, of the three, only men were more likely to book this option.
As in the interest models, the extent of the effects of the significant explanatory variables
on the probability of booking standard and artisanal fishing excursions is better illustrated by
marginal effects. Marginal effects of significant variables for both models are presented in Table
4-9, and were calculated similarly to the effects shown in the previous section.
Regarding the demand for standard tour operations, visitors who arranged their last trip on
their own were 30 percentage points less likely to book standard tours than those who had a

89
travel agency arrange their trip. This is not surprising as visitors arranging their excursions are
able to better discriminate among trips than those who had to choose from a pre-established set
of options offered by travel agencies. The negative effect of the lack of known affiliation concern
was higher than the positive effect of the culture-associated benefit on the probability of booking
a standard tour (i.e., an increase of 26 percentage points versus a reduction of 34 percentage
points). Visitors who preferred multiday excursions were 52 percentage points less likely to
include a traditional tour in their itineraries. This implies that those interested in half day trips
were more likely to try this tour. Residents of the northeast increased their likelihood to demand
this tour by 23 percentage points in comparison to residents of the pacific coast, while having
higher income dramatically reduced the booking probability of standard tours provided by
fishermen by 83 percentage points6.
For artisanal fishing trips, having a wider scope of tour planning resources (i.e., own
planning and agency assistance) reduced the booking probability by 37 percentage points in
comparison to those who arranged their trip exclusively with travel agencies. This outcome
suggests that tourists were more likely to choose this type of tour if offered as part of their pre-
arranged package rather than to search specifically for it, especially when having more resources
to design their itineraries. From the trip characteristics, the opportunity to eat the day’s catch had
the highest positive impact. Individuals preferring full day trips and the dining option were 31
and 35 percentage points more likely to book a fishing trip, respectively. The reduction in
booking intentions was higher for individuals with graduate education than for those with higher
income (43 versus 27 percentage points), while being male raised the probability of including a
fishing excursion in their itineraries by 40 percentage points in comparison to women.
6 This observation refers to the full effect of income shown in Table 4-9.

90
These results have important planning implications. The analysis indicates that of the total
number of respondents, 40% and 31% would be willing to add or replace a traditional trip with a
new standard and artisanal fishing tour respectively. Considering the share of U.S. visitors to the
Galapagos in 2007 (i.e.44,312 tourists) and the limited number of fishing boats that could be
included in the tourism sector, an approximate extrapolation of the number of fishermen–
operated trips that are likely to be booked suggests a promising demand (17,325 and 13,427 tours
approximately). Campaigns to inform tourists about the expected conservation benefits, small
scale recreational attractions such as unique small-boat amenities and access to the local culture,
as well as the legitimacy and professionalism of fishermen-based tour companies will be useful
to increase U.S. tourists’ interest and potential demand for fishermen operated excursions,
especially for standard tours. At the same time, financing and training efforts to ensure the
optimal condition of small vessel infrastructure, service quality and learning of tour-specific
skills will be needed to complement advertising campaigns. Marketing efforts must also address
the significant differences in preferences for the new fishermen-based tours across gender,
education and income, focusing on raising the interest of women, highly educated and wealthier
individuals.
Also, fishermen interested in providing standard tours will have higher demand potential
by focusing on half-day operations rather than on multiday trips. To entice the demand for
artisanal fishing tours, operators should offer a full day of activities and the unique experience of
dining the catch at the end of the day. A full day of activities may entail visitations to several
fishing sites or different fishing targets during the day. Authorities need to consider the viability
of these aspects into the normative for new tours. Additionally, building relationships with
traditional tour operators and travel agencies to negotiate the inclusion of the new standard and

91
artisanal tours as part of pre-arranged packages may prove very useful for the new providers to
introduce their tours in the market with a level of legitimacy.
Conclusions
As a strategy to reduce fishing effort in the Galapagos Marine Reserve, managers have
offered small scale fishermen the opportunity to become marine tour operators in permanent
exchange of their fishing permits. They will be allowed to offer standard excursions such as
those currently offered by traditional operators (single-day bay and diving tours and multiday
interisland and diving cruises) as well as new artisanal fishing tours where visitors will be
exposed to traditional fishing culture and practices.
Using a stated preference approach, this study investigated tourists’ support for the new
program of fishermen-based tour operations and identified relevant factors that explain general
interest and booking intentions (i.e., demand) for two types of tour excursions: standard torus
and artisanal fishing trips. Similarly to the findings of Alban and Boncoeur (2004), the potential
demand for fishermen-based excursions is promising, especially for standard tours. Conservation
benefits, small scale tour attractions and affiliation concerns associated to the inclusion of
fishermen into tourism, trip length, dining attractions, type of trip arrangement, as well as
individual characteristics such as gender, education and income were the most important factors
explaining tourists preferences.
The scope of these findings is limited to the U.S market in general and past visitors in
particular. Visitors from other countries are likely to have different preferences although it’s
reasonable to expect that there would be some positive level of demand such that the projections
in this paper are conservative. Also, this study used simple main effects to explore the role of
individual characteristics on tour interest and demand and additional research is needed to
identify relevant market niches in order to better target marketing efforts. The next step of this

92
analysis is to identify clusters of visitors and incorporate that information into the modeling of
interests and booking intentions. Additionally, given the self-selection characteristic of the
willingness to book questions, the modeling could be extended to consider sample selection
issues to identify possible biases in the results. Despite the mentioned imitations, this study
provides valuable insights for small-scale fisheries managers about the potential market support
for diversification of fishermen into tourism and about relevant determinants of potential demand
for the new fishermen-based tour operations that may help planning similar fishing
diversification programs in other artisanal fishing communities.

93
Table 4-1. Variable description Variable Description Response variables: INT1 Interest rating for standard tours (1= not to 5=very) INT2 Interest rating for artisanal fishing tours (1= not to
5= very) D1 1 if willing to book standard tours, 0 otherwise D2 1 if willing to book artisanal fishing, 0 otherwise
Last visit (X1): VACATION 1 if purpose of visit was vacation, 0 otherwise ARRANGEI 1 if trip arranged independently only, 0 otherwise ARRANGEIA 1 if trip arranged independently and with agency, 0 otherwise LENGTH Length of trip (days)
Benefits and Concerns (X2): FISHCONS 1 if highly compelled by fish conservation, 0 otherwise LSUPPORT 1 if highly compelled by local support, 0 otherwise CULTURE 1 if highly compelled by local culture, 0 otherwise SBOAT 1 if highly compelled by small boats, 0 otherwise EXP 1 if highly concerned with limited experience, 0 otherwise LANG 1 if highly concerned with language skills, 0 otherwise AFFIL 1 if highly concerned by lack of known affiliation, 0 otherwise VSIZE 1 if highly concerned with small vessel amenities, 0 otherwise
Trip characteristics (X3): BMED 1 if medium boat size, 0 otherwise BLARGE 1 if large boat size, 0 otherwise FULLD 1 if full day trip, 0 otherwise MULTD 1 if multiday trip, 0 otherwise SNKL 1 if snorkel, 0 otherwise BTOUR 1 if boat tour, 0 otherwise LOBSTER 1 if lobster target, 0 otherwise DINING 1 if dining option, 0 otherwise Demographics (X4): MEMBER 1 if environmental or development organization, 0 otherwise MALE 1 if men, 0 otherwise AGE Visitor's age ( years) SOUTH 1 if resides in Southwest or Southeast, 0 otherwise NCENTRAL 1 if resides in Great Lakes and Mountain Prairie, 0 otherwise NEAST 1 if resides in Northeast, 0 otherwise COLLEGE 1 if college graduate, 0 otherwise GRADS 1 if graduate school, 0 otherwise

94
Table 4-1. Continued
INC
Household income levels:1=less than USD$50,000; 2=USD$50,000-USD$ 99,000; 3=USD$100,000-USD$149,000; 4=USD$150,000-USD$199,000; 5=USD$200,000-USD$499,000; 6=more than USD$500,000
LOGINC Natural logarithm of income level WHITE 1 if white race, 0 otherwise
Dummy base categories: study/other visit purpose, travel agency exclusive arrangement, small boat, half day trip, diving, finfish target, no dining, Pacific coast residence, less than college degree.

95
Table 4-2. Summary statistics Standard tours Artisanal fishing Interest (N = 218) Demand (N = 196) Interest (N = 220) Demand (N = 100) Variable Mean Std dev. Mean Std dev. Mean Std dev. Mean Std dev. INT1 2.954 1.202 N/A N/A N/A N/A N/A N/A D1 N/A N/A 0.587 0.494 N/A N/A N/A N/A INT2 N/A N/A N/A N/A 2.395 1.365 N/A N/A D2 N/A N/A N/A N/A N/A N/A 0.640 0.482 Last visit (X1): VACATION N/A N/A 0.918 0.274 N/A N/A 0.910 0.287 ARRANGEI N/A N/A 0.163 0.370 N/A N/A 0.170 0.377 ARRANGEIA N/A N/A 0.102 0.303 N/A N/A 0.140 0.348 LENGTH N/A N/A 6.535 1.662 N/A N/A 6.420 1.706 Benefits and Concerns (X2): FISHCONS 0.775 0.418 0.806 0.396 0.782 0.414 0.880 0.326 LSUPPORT 0.660 0.474 0.668 0.472 0.664 0.473 0.780 0.416 CULTURE 0.693 0.462 0.688 0.464 0.690 0.463 0.800 0.402 SBOAT 0.404 0.492 0.387 0.488 0.400 0.491 0.370 0.485 EXP 0.532 0.500 0.500 0.501 0.536 0.499 0.530 0.502 LANG 0.357 0.480 0.331 0.472 0.364 0.482 0.330 0.472 AFFIL 0.417 0.494 0.403 0.492 0.423 0.495 0.400 0.492 VSIZE 0.408 0.492 0.408 0.493 0.409 0.492 0.410 0.494 Trip characteristics (X3): BMED N/A N/A 0.469 0.500 N/A N/A N/A N/A BLARGE N/A N/A 0.438 0.497 N/A N/A N/A N/A FULLD N/A N/A 0.326 0.470 N/A N/A 0.280 0.451 MULTD N/A N/A 0.357 0.480 N/A N/A N/A N/A SNKL N/A N/A 0.367 0.483 N/A N/A N/A N/A BTOUR N/A N/A 0.495 0.501 N/A N/A N/A N/A LOBSTER N/A N/A N/A N/A N/A N/A 0.360 0.482

96
Table 4-2. Continued DINING N/A N/A N/A N/A N/A N/A 0.530 0.502 Demographics (X4): MEMBER 0.472 0.500 0.459 0.499 0.468 0.500 0.500 0.502 MALE 0.504 0.501 0.500 0.501 0.504 0.501 0.480 0.502 AGE 53.300 15.740 51.830 15.390 53.540 15.620 48.280 16.240 SOUTH 0.303 0.460 0.311 0.464 0.300 0.459 0.370 0.485 NCENTRAL 0.206 0.405 0.194 0.396 0.204 0.404 0.210 0.409 NEAST 0.234 0.424 0.229 0.422 0.240 0.428 0.180 0.386 COLLEGE 0.376 0.485 0.372 0.485 0.373 0.485 0.370 0.485 GRADS 0.536 0.499 0.540 0.499 0.540 0.499 0.540 0.500 INC 3.261 1.430 N/A N/A 3.277 1.430 N/A N/A LOGINC 1.069 0.503 1.069 0.513 1.074 0.503 1.051 0.539 WHITE 0.922 0.268 0.923 0.266 0.927 0.260 0.900 0.301
N/A indicates the variable was not applicable to the model.

97
Table 4-3. Willingness to book responses by interest level Standard tour Artisanal fishing Interest Add Replace No Add Replace No 1 4 2 20 1 0 15 2 5 4 23 5 2 7 3 28 12 30 13 9 11 4 27 14 3 15 4 3 5 14 4 3 12 3 0

98
Table 4-4. Comparison of covariates based on participant self selection for booking an artisanal fishing tour
Final sample (N=100)
Not based on self selection (N=207)
Variable Mean Std. Dev Mean Std. dev VACATION 0.910 0.287 0.928 0.259 ARRANGEI 0.170 0.377 0.164 0.371 ARRANGEIA 0.140 0.348 0.101 0.303 LENGTH 6.420 1.706 6.522 1.639 FISHCONS 0.880 0.326 0.783 0.413 LSUPPORT 0.780 0.416 0.657 0.476 CULTURE 0.800 0.402 0.700 0.459 SBOAT 0.370 0.485 0.386 0.488 EXP 0.530 0.502 0.536 0.499 LANG 0.330 0.472 0.357 0.480 AFFIL 0.400 0.492 0.402 0.495 VSIZE 0.410 0.494 0.406 0.492 FULLD 0.280 0.451 0.324 0.469 LOBSTER 0.360 0.482 0.346 0.478 DINING 0.530 0.502 0.479 0.501 MEMBER 0.500 0.502 0.464 0.499 MALE 0.480 0.502 0.502 0.501 AGE 48.280 16.24 52.899 15.631 SOUTH 0.370 0.485 0.309 0.463 NCENTRAL 0.210 0.409 0.198 0.399 NEAST 0.180 0.386 0.237 0.426 COLLEGE 0.370 0.485 0.367 0.483 GRADS 0.540 0.500 0.546 0.499 INC N/A N/A N/A N/A LOGINC 1.051 0.539 1.078 0.508 WHITE 0.900 0.301 0.923 0.267

99
Table 4-5. Ordered logit estimates for tour interest Standard tours Artisanal fishing Variable Estimate t-value Estimate t-value Constant 2.781 3.308*** 0.795 1.001 FISHCONS 1.389 3.779*** 0.171 0.461 LSUPPORT 0.370 1.012 0.679 1.905* CULTURE 0.715 2.031** 0.148 0.428 SBOAT 1.328 4.450*** 0.343 1.191 EXP -0.474 -1.571 0.055 0.181 LANG 0.055 0.162 0.073 0.218 AFFIL -0.590 -1.950* -.354 -1.168 VSIZE 0.217 0.710 0.322 1.031 MEMBER 0.063 0.233 -0.153 -0.572 MALE 0.573 2.084** 0.897 3.270*** AGE -0.024 -2.676*** -0.027 -2.960*** SOUTH -0.102 -0.281 0.602 1.668* NCENTRAL 0.445 1.199 0.819 2.160** NEAST 0.113 0.303 0.205 0.557 COLLEGE -1.339 -2.653*** -0.587 -1.171 GRADS -1.030 -2.069** -0.288 -0.576 INC 0.587 1.662* N/A N/A LOGINC -1.835 -1.829* -0.320 -1.162 WHITE -0.397 -0.783 0.201 0.392 u1 1.359 8.526*** 0.565 5.908*** u2 3.482 19.710*** 1.850 11.785*** u3 5.325 21.328*** 3.029 12.738*** LogL -275.80 -302.85 LogL0 -333.69 -321.25 p-value <0.001 0.005 N 218 220 * Significant at 10%; ** Significant at 5%; *** Significant at 1%.

100
Table 4-6. Effects of significant variables on the interest probability for standard tours Standard tours Variable 1 2 3 4 5 FISHCONS -0.149a -0.156c 0.093a 0.162c 0.050c LSUPPORT -0.030 -0.044 0.006 0.051 0.017 CULTURE -0.062a -0.084b 0.022 0.094b 0.031b SBOAT -0.096c -0.144c -0.022 0.187c 0.075c AFFIL 0.048a 0.069b -0.008 -0.081a -0.027a MALE -0.044b -0.066b 0.003 0.080b 0.028a AGE 0.002b 0.003c 0.000 -0.003b -0.001b SOUTH 0.008 0.012 -0.001 -0.014 -0.005 NCENTRA -0.031 -0.050 -0.008 0.065 0.024 COLLEGE 0.122b 0.152c -0.044 -0.172c -0.058b GRADS 0.079b 0.116b 0.001 -0.144b -0.053a INC -0.045a -0.069a 0.003 0.082a 0.028a LOGINC 0.141a 0.215a -0.010 -0.257a -0.088a INC* 0.096 0.146 -0.007 -0.175 -0.060 a Significant at 10%; b Significant at 5%; c Significant at 1% INC* denotes the full effect of income. It was calculated as the sum of the individual marginal effects of INC and LOGINC. This sum is equivalent to calculating the full marginal effect as the product f(X*β) * (βINC +βLOGINC) where f represents the probability density function of the logistic distribution, X* is the vector of mean values of explanatory variables, β is the complete set of estimated coefficients, βINC is the estimated coefficient on linear income and βLOGINC is the coefficient on the log of income (Borooah 2002). Table 4-7. Effects of significant variables on the interest probability for fishing tours Artisanal fishing Variable 1 2 3 4 5 FISHCONS -0.041 -0.002 0.016 0.016 0.011 LSUPPORT -0.163a -0.003 0.065a 0.060a 0.042a CULTURE -0.035 -0.002 0.014 0.014 0.010 SBOAT -0.081 -0.005 0.029 0.033 0.024 AFFIL 0.084 0.004 -0.032 -0.033 -0.023 MALE -0.210c -0.011 0.076c 0.083c 0.061c AGE 0.006c 0.000 -0.002c -0.003c -0.002c SOUTH -0.137a -0.012 0.046a 0.059 0.045 NCENTRA -0.179b -0.022 0.051c 0.082b 0.068a COLLEGE 0.140 0.004 -0.055 -0.053 -0.037 GRADS 0.068 0.004 -0.025 -0.027 -0.019 LOGINC 0.076 0.004 -0.029 -0.030 -0.021 a Significant at 10%; b Significant at 5%; c Significant at 1%.

101
Table 4-8. Binary logit estimates for willingness to book a tour Standard tours Artisanal fishing Variable Estimate t-value Estimate t-value Constant 1.940 0.954 3.753 1.211 VACATION -0.465 -0.595 -1.622 -1.269 ARRANGEI -1.224 -2.032** -1.247 -1.294 ARRANGEIA -0.962 -1.207 -1.570 -1.689* LENGTH 0.160 1.120 -0.182 -0.944 FISHCONS 0.558 0.916 0.462 0.405 LSUPPORT 0.552 0.979 0.708 0.727 CULTURE 1.101 2049** 0.161 0.172 SBOAT 0.479 1.015 0.702 1.034 EXP 0.464 0.911 -0.237 -0.335 LANG -0.632 -1.213 -0.467 -0.619 AFFIL -1.492 -3.147*** 0.562 0.806 VSIZE -0.046 -0.095 0.217 0.273 BMED -0.352 -0.511 N/A N/A BLARGE -0.315 -0.430 N/A N/A SNKL -0.820 -1.276 N/A N/A BTOUR -0.245 -0.391 N/A N/A MULTD -2.358 -3.650*** N/A N/A FULLD -0.299 -0.549 1.818 2.192** LOBSTER N/A N/A -0.736 -1.026 DINING N/A N/A 1.727 2.534** MEMBER -0.2126 -0.497 0.449 0.716 MALE -0.137 -0.318 2.044 2.804*** AGE 0.004 0.258 0.018 0.759 SOUTH 0.614 1.108 0.076 0.103 NCENTRAL 0.477 0.819 -0.916 -0.947 NEAST 1.102 1.906* -0.214 -0.217 COLLEGE -1.399 -1.365 -1.270 -1.650 GRADS -1.555 -1.524 -1.324 -1.906* INC 2.039 3.303*** N/A N/A LOGINC -5.640 -3.101*** -1.324 -1.906* WHITE -1.137 -1.241 -1.283 -1.073 LogL -89.06 -44.49 p-value <0.001 0.019 % correct predictions 80.10% 77.00% N 196 100 * Significant at 10%; ** Significant at 5%; *** Significant at 1%.

102
Table 4-9. Effects on the probability of booking a tour Variable Standard tours Artisanal fishing ARRANGEI -0.295** -0.288 ARRANGEIA -0.234 -0.366* CULTURE 0.260** 0.034 AFFIL -0.343*** 0.114 MULTD -0.525*** N/A FULLD -0.069 0.310*** DINING N/A 0.355*** MALE -0.032 0.402*** NEAST 0.227** -0.046 GRADS -0.340 -0.434* INC 0.470*** N/A LOGINC -1.303*** -0.276* INC* 0.833 N/A * Significant at 10%; ** Significant at 5%; *** Significant at 1%. INC* denotes the full effect of income on interest probabilities for standard tours. It was calculated as the sum of the individual marginal effects of INC and LOGINC. This sum is equivalent to calculating the full marginal effect as the product f(X*β) * (βINC +βLOGINC) where f represents the probability density function of the logistic distribution, X* is the vector of mean values of explanatory variables, β is the complete set of estimated coefficients, βINC is the estimated coefficient on linear income and βLOGINC is the coefficient on the log of income (Borooah 2002).

103
010203040
5060708090
1 2 3 4 5
INT1
Freq
uenc
y
A
010203040
5060708090
1 2 3 4 5
INT2
Freq
uenc
y
B Figure 4-1. Distribution of interest responses. (A) Interest for standard tours. (B) Interest for
artisanal fishing tours.
N=218
N=220

104
CHAPTER 5 CONCLUSIONS
This study presents a socio-economic analysis of the potential of transferring fishing effort
(i.e., vessels and fishermen) to the tourism industry as a successful strategy to rebuild small scale
fisheries illustrating the case of the Galapagos Marine Reserve. The evaluation combined three
different areas: individual fishing preferences, fleet production and efficiency and tourists’
interest and potential demand. The main findings are summarized below.
• Fishermen were almost as likely to stay as to exit, and a considerable number of individuals were undecided. Vessel owners were more likely to switch to tourism than crew and both groups had different sensitivities to changes in demographics and fishing related factors. Preferences also differed between geographical locations. Fishermen from Santa Cruz, the tourism hub for the Archipelago, were more enticed to switch than other individuals. These findings indicate the need to devise diversification strategies that differentiate between vessel owners and crew and the specific realities of the fishing ports. Participants in high value but depleted fisheries (higher opportunity costs) or who dived were also more likely to exit. Higher availability of income (funding) also encouraged fishers to switch. Capital malleability issues were compensated by the opportunity to transfer fishing capital investments outside the fishing sector. This particular feature of the diversification strategy provided vessel owners with stronger incentives to exit the fisheries, in contrast to previous findings in the literature suggesting a negative effect of ownership on exiting decisions.
• From the existing standard tour operations, fishermen were more likely to engage in bay and diving tours (single–day) followed by the diving cruise option. Mostly fishermen from Isabela were interested in standard cruise operations. Individuals preferred bay and diving tours if they own small vessels, had concerns about safety implications, were from San Cristobal or had access to bank funding. Individuals willing to make great investments preferred diving cruises to standard cruise operations.
• Vessel lobster catch depended mostly on the level of variable inputs used, especially days at sea, and not on the fleet’s capital. Also, the fleet shows a considerable level of technical inefficiency (around 35%), which is the prevalent factor influencing per-trip harvest variation. Technical efficiency differed between geographical locations, and it could be increased by the use of more sophisticated diving methods and gear types.
• Interrelations between vessels and fishermen played a role on fishermen decisions and the production structure of the small scale fishing fleet. Results suggested that linkages between owners and crew in the same fishing vessel influenced their choices for diving cruise operations in the local tourism industry. Also, the per-trip harvesting potential and technical efficiency of individual vessels was limited when they participated in mothership

105
operations (i.e., composite fishing units) in comparison to independent boats. This limiting effect was higher for fiberglass than for wooden vessels.
• Results suggested a promising market potential for fishermen-based ecotourism considering the limited number of fishing vessels in the Islands in contrast to the number of visitors per year. Standard tours had a higher interest and demand potential in comparison to artisanal fishing trips. Conservation benefits, exposure to the local culture and specially preference for small boats increased the general interest for standard tours, while the direct contribution to the local community made fishing trips more appealing. Only the lack of affiliation with a known company had a negative effect on tourist preferences, specifically for standard tours. The demand potential for artisanal fishing trips was higher for full-day fishing with a dining option, and standard tours had higher booking intentions if half-day excursions are offered. High income individuals were more reluctant to book any type of tours offered by fishermen.
These findings have important implications about the success of the switching program.
Fishermen and visitors are willing to engage in standard tours, especially in half day operations
(e.g., bay and diving tours). From the supply and demand perspective, this suggests a promising
potential for the program as a viable economic alternative for fishermen outside the fishing
sector to the extent that they are allowed to participate in standard tour market by the
management authority. However, the level of interest from tourists still needs to be increased to
realize a full potential. Management authorities or fishermen groups need to develop
informational campaigns or advertising for actual and potential visitors about the expected fish
conservation and local community benefits related to the transition of fishermen into tourism in
order to increase the appealing of the plan. In this sense, the promotion of artisanal fishing trips
needs special attention as the activity is completely new, visitors are more unfamiliar with its
characteristics and it still has limited potential. Efforts to create a legitimate image of fishermen
as tour providers are also critical, and these may include the formal organization of the new
providers in companies or associations, as well as service quality and technical training.
Partnerships or collaborations with local restaurants to offer the unique option of dining the catch
and with travel agencies to make fishermen-based tours known are also needed.

106
From a production perspective, the program has a more limited scope for controlling the
harvesting potential of the fleet in the lobster fishery. As the results suggest, per-trip harvests
depend mostly on variable inputs, participation in mothership structures and technical efficiency.
Since the program is likely to be more successful among owners of larger boats, its impact is
expected to be higher on the capitalization of the motherboat segment than on the other vessel
groups. Provided that fish stocks and other production factors remain stable in the short run, a
reduction in the number of mother ships will also reduce the harvest limitations observed among
towed vessels in comparison to independent boats, actually improving harvest rates per day of
trip. In the long run, and in the absence of alternative strategies to rebuild resource populations,
stocks will be reduced. In addition, the catch potential of the remaining fishing units may also
increase if technical efficiency is improved.
In order to restore fishery stocks in the GMR, additional policies controlling input use and
technical efficiency are needed (e.g., limiting the number of days at sea per trip or restricting the
use of mechanized gear and diving methods). Contrary to agriculture, increasing the efficiency of
fishing fleets is not a desirable outcome given the problem of open access in fisheries and
declining stocks. On the other hand, inefficient fishing vessels are not a desirable economic
outcome either. In the long run, managers will need to direct their attention to alternative
management schemes, such as rights based policies. This regime will help control the race for
catch while promoting an efficient allocation of fishing effort in order to achieve more promising
outcomes in fisheries conservation.
This study contributes to the fisheries management literature in several ways. First, as
emphasized by the modern approach to artisanal fisheries management focused on poverty
reduction and livelihood improvement, management policies must include the generation of

107
alternative employment opportunities while promoting reduction of harvesting effort. This study
suggests a promising potential for fishermen and fishing vessels diversification into ecotourism
as an alternative livelihood strategy, but it also illustrates the possible limitations of such plan as
a mechanism to reduce the production capacity of artisanal fishing fleets when catch is not
dependent on vessel capital. It also identifies factors that can be useful to the design of similar
programs in other artisanal fishing communities. Second, this analysis contributes to the
understanding of artisanal fishermen incentives to stay or exit when faced by the opportunity to
switch into alternative occupations. Knowledge of this behavior is critical to design better
informed fishing management strategies. Lastly, the study demonstrated the relevance of
explicitly considering the unique characteristics of artisanal fishing systems, namely vessel
interrelations, into the assessment of fleet harvesting potential. This is particularly important for
the design of more appropriate capacity management programs targeted to small scale fishing
fleets, which consider the socioeconomic ties influencing the operations of this sector.
The conclusions of this study are subject to some limitations. Limited linkage information
for all the fishermen in the sample precluded a richer analysis of the role of interdependence in
fishermen’s switching (exiting) decisions and choice of tour operations. Hence, those results
should be interpreted only as preliminary indicators of relevance of individual linkages rather
than as exact effects. Similarly, results about linkage effects on the production technology of the
fleet are dependent on observations of responses regarding vessels’ towing status. Also, findings
about input elasticities and returns to scale are assumed to be the same for all firms regardless of
the level of input use as a flexible functional form of technology could not be analyzed given
high collinearity issues in the data. Results about tourists’ preferences are limited to the market
of U.S visitors. Therefore, the demand potential suggested by the analysis may be considered as

108
conservative as it is reasonable to expect some interest for fishermen-operated tours from other
visitor markets. Lastly, the analysis of potential demand is dependent on the assumption of
complete independence between interest and demand preferences for fishermen-based tours.
The next steps to address some of the above mentioned limitations include the exploration
of alternative measures of interdependence among fishermen for switching preferences analysis.
To the possible extent allowed by the survey data, a reduced sample with only vessel owners and
crew members from the same fishing units (i.e., vessels, motherships) may be defined and new
indicators will reflect a relationship with a ‘yes’ response from another individual in the same
production unit .Also, this study will be extended by examining sample selection implications on
the modeling of interdependence effects on harvesting technology and on tourists preferences.
Finally, further research that addresses (1) the role of technical efficiency on exiting behavior,
(2) fishermen incentives to stay or exit fishing regarding other diversification opportunities, (3)
clear market niches for fishermen-based tours, and (4) the demand potential for fishermen-based
ecotourism in other markets will be very useful to complement the contributions of the present
study to the understanding of artisanal fishing and the improvement of its management.
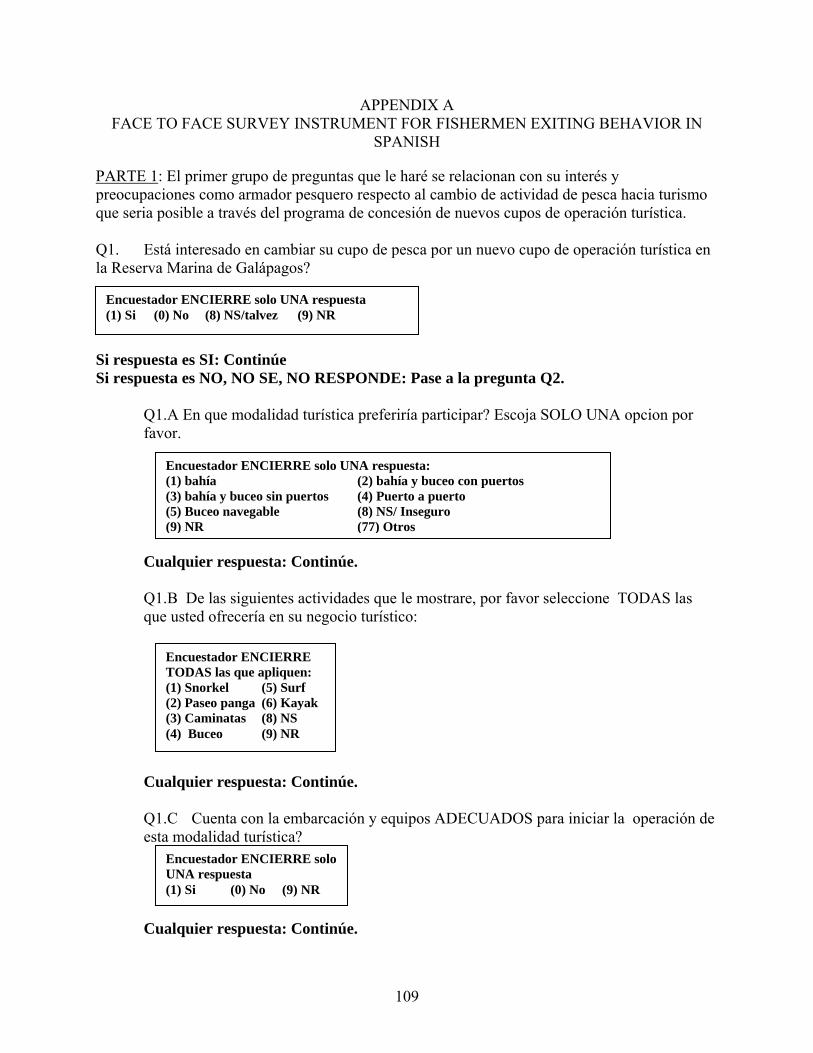
109
APPENDIX A FACE TO FACE SURVEY INSTRUMENT FOR FISHERMEN EXITING BEHAVIOR IN
SPANISH
PARTE 1: El primer grupo de preguntas que le haré se relacionan con su interés y preocupaciones como armador pesquero respecto al cambio de actividad de pesca hacia turismo que seria posible a través del programa de concesión de nuevos cupos de operación turística. Q1. Está interesado en cambiar su cupo de pesca por un nuevo cupo de operación turística en la Reserva Marina de Galápagos?
Si respuesta es SI: Continúe Si respuesta es NO, NO SE, NO RESPONDE: Pase a la pregunta Q2.
Q1.A En que modalidad turística preferiría participar? Escoja SOLO UNA opcion por favor. Cualquier respuesta: Continúe. Q1.B De las siguientes actividades que le mostrare, por favor seleccione TODAS las que usted ofrecería en su negocio turístico: Cualquier respuesta: Continúe. Q1.C Cuenta con la embarcación y equipos ADECUADOS para iniciar la operación de esta modalidad turística? Cualquier respuesta: Continúe.
Encuestador ENCIERRE solo UNA respuesta (1) Si (0) No (8) NS/talvez (9) NR
Encuestador ENCIERRE solo UNA respuesta: (1) bahía (2) bahía y buceo con puertos (3) bahía y buceo sin puertos (4) Puerto a puerto (5) Buceo navegable (8) NS/ Inseguro (9) NR (77) Otros
Encuestador ENCIERRE TODAS las que apliquen: (1) Snorkel (5) Surf (2) Paseo panga (6) Kayak (3) Caminatas (8) NS (4) Buceo (9) NR
Encuestador ENCIERRE solo UNA respuesta (1) Si (0) No (9) NR
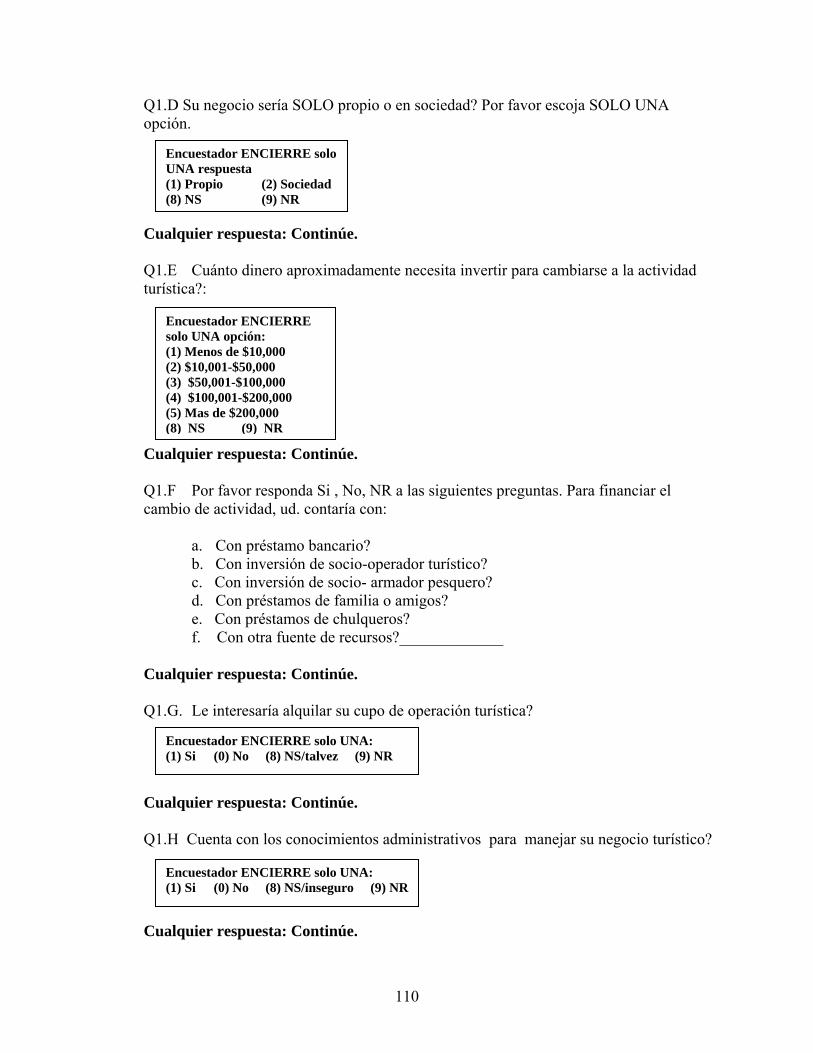
110
Q1.D Su negocio sería SOLO propio o en sociedad? Por favor escoja SOLO UNA opción. Cualquier respuesta: Continúe. Q1.E Cuánto dinero aproximadamente necesita invertir para cambiarse a la actividad turística?: Cualquier respuesta: Continúe. Q1.F Por favor responda Si , No, NR a las siguientes preguntas. Para financiar el cambio de actividad, ud. contaría con:
a. Con préstamo bancario? b. Con inversión de socio-operador turístico? c. Con inversión de socio- armador pesquero? d. Con préstamos de familia o amigos? e. Con préstamos de chulqueros? f. Con otra fuente de recursos?_____________
Cualquier respuesta: Continúe. Q1.G. Le interesaría alquilar su cupo de operación turística? Cualquier respuesta: Continúe. Q1.H Cuenta con los conocimientos administrativos para manejar su negocio turístico? Cualquier respuesta: Continúe.
Encuestador ENCIERRE solo UNA: (1) Si (0) No (8) NS/talvez (9) NR
Encuestador ENCIERRE solo UNA opción: (1) Menos de $10,000 (2) $10,001-$50,000 (3) $50,001-$100,000 (4) $100,001-$200,000 (5) Mas de $200,000 (8) NS (9) NR
Encuestador ENCIERRE solo UNA respuesta (1) Propio (2) Sociedad (8) NS (9) NR
Encuestador ENCIERRE solo UNA: (1) Si (0) No (8) NS/inseguro (9) NR

111
Q2. Le mencionare 6 aspectos relacionados con el cambio de actividad de pesca a turismo. Por favor dígame que tan preocupado esta ud. por cada aspecto usando una escala del 1 al 3 donde 1 representa NADA PREOCUPADO, 2 significa UN POCO PREOCUPADO y 3 MUY PREOCUPADO. Nada Poco Mucho NS NR
Que tan preocupado esta ud …. 1 2 3 8 9 A) Por el costo de cambiarse al turismo? 1 2 3 8 9 B) Por la cantidad de nuevos cupos a otorgarse? 1 2 3 8 9 C) Por las medidas de seguridad requeridas? 1 2 3 8 9 D) Por el compromiso con horarios fijos? 1 2 3 8 9 E) Por encontrar tripulación apta para su barco? 1 2 3 8 9 F) Por la necesidad de un traductor de idiomas? 1 2 3 8 9 G) Otra preocupación? ________________________ Cualquier respuesta: Continúe
PARTE DOS: Ahora le haré unas preguntas sobre su experiencia en el sector pesquero, la necesidad por otras fuentes de empleo y condiciones socioeconómicas en general. Q3. Por cuantos años ha estado involucrado en el sector pesquero de Galápagos? Cualquier respuesta: Continúe Q4. Durante el último año, ha trabajado usted como patrón o capitán de alguna embarcación pesquera? Si respuesta es SI: Continúe. Si respuesta NO o NO RESPONDE: pase a la pregunta Q5
Q4.A Cuantos años de experiencia tiene como capitán? Cualquier respuesta: Continúe Q4.B Alguna de las embarcaciones pesqueras en las que ha sido capitán tiene sistema de identificación de coordenadas geográficas? Cualquier respuesta: Continúe
Encuestador ESCRIBA NUMERO o NR si no responde: ______ años
Encuestador ENCIERRE respuesta: (1) Si (0) No (9) NR
Encuestador ESCRIBA NÚMERO o NR si no responde: _______ años
Encuestador ENCIERRE respuesta: (1) Si (0) No (8) NS (9) NR

112
Q4.C. Tomando en cuenta las pesquerías en las que ud. ha participado durante el ultimo año, aproximadamente cuantas empresas del continente le compraron su captura en el 2007? Cualquier respuesta: Continúe Q4.D Ha obtenido un precio más alto por los animales más grandes de la captura de cualquier pesquería? Cualquier respuesta: Continúe
Q5. Durante los últimos 12 meses, ha trabajado usted como tripulante de alguna embarcación pesquera? Cualquier respuesta: Continúe Q6. Durante los últimos 12 meses, ha trabajado usted como buzo? Si respuesta es SI continúe. Si respuesta NO, NO RESPONDE pase a la pregunta Q7
Q6.A Que método de buceo prefiere: con hookah o buceo libre? Cualquier respuesta: Continúe
Q7. En cualquiera de los TRES últimos años, ha participado ud. en: 1 0 9
a. Pesquería de langosta? Si No NR b. Pesquería de pepino? Si No NR c. Pesca blanca? Si No NR d. Pesca de altura? Si No NR
Cualquier respuesta: Continúe
ESCRIBA NÚMERO incluido 0 si respuesta es ‘ninguna’ o NR si no responde: _____ empresas
Encuestador ENCIERRE respuesta: (1) Si (0) No (9) NR
Encuestador ENCIERRE respuesta: (1) Si (0) No (9) NR
Encuestador ENCIERRE respuesta: (1) Si (0) No (9) NR
Encuestador ENCIERRE respuesta: (1) Hookah (2) Libre (9) NR

113
Q8. Trabaja en otras actividades además de la pesca?
Si la respuesta es SI: Continúe. Si respuesta NO, NO RESPONDE pase a la pregunta Q9
Q8.A Le mostrare una lista de otros sectores económicos. Por favor dígame en cuales de ellos ud. también trabaja. Cualquier respuesta: Continúe Q8.B Que le genera mayor ingreso: la pesca o sus otras actividades? Cualquier respuesta: Continúe
PARTE TRES: Las siguientes preguntas que le haré tratan sobre sus características sociales generales: Q9. En que año nació? Cualquier respuesta: Continúe Q10. Terminó la escuela primaria? Cualquier respuesta: Continúe Q11. Es ud. originario de Galápagos o de Ecuador continental?
Cualquier respuesta: Continué
Encuestador ENCIERRE respuesta: (1) Si (0) No (9) NR
Encuestador ENCIERRE solo UNA: (1) Pesca (2) Otra (9) NR
Encuestador ENCIERRE TODAS las que digan: (1) Turismo (5) Transporte (2) Agricultura (6) ONGs (3) Comercio (77) Otro ___________ (4) Empleo de gobierno (9) NR
ESCRIBA ANO (ej: 1954) o NR si no responde: Año ______
Encuestador ENCIERRE respuesta: (1) Si (0) No (9) NR
Encuestador ENCIERRE solo UNA respuesta: (1) Galápagos (2) Continente (9) NR (77) Otro __________

114
Q12. Cuantas personas viven en su casa, incluido ud.? Cualquier respuesta: Continúe
Q13. De aquellos que viven con ud., cuantas personas son menores de 12 años? Cualquier respuesta: Continúe Q14. Además de usted, cuantos miembros de su casa ayudan a mantener el hogar?
Cualquier respuesta: Continúe Q15. Cual de las siguientes categorías que le mostrare representa el ingreso mensual aproximado de su hogar, proveniente de todas las actividades laborales en su casa durante el 2007?: Esto termina nuestra conversación. Muchas gracias por su tiempo y participación. Tiene preguntas adicionales sobre esta encuesta o sugerencias sobre los nuevos cupos de turismo u otras estrategias que la autoridad debería considerar para promover una pesca sostenible?
ESCRIBA NÚMERO o NR si no responde: ______ personas
ESCRIBA NÚMERO (incluido 0 =ninguno) o NR si no responde: ____ personas
ESCRIBA NÚMERO (incluido 0 =ninguno) o NR si no responde: _____ personas
Encuestador ENCIERRE solo UNA opción: (1) Menor $500 (4) $1501-$2000 (2) $501-$1000 (5) Mayor $2000 (3) $1001-$1500 (9) NR

115
APPENDIX B ONLINE SURVEY INSTRUMENT OF PREFERENCES OF U.S. VISITORS FOR
FISHERMEN-OPERATED TOURS
Section I: Your last Galapagos visit Q1. In your opinion, what was the quality of the environment in the Galapagos Islands at the time of your visit? Very poor (conservation efforts are not working) 1
Poor 2
Okay 3
Good 4
Very good (conservation efforts are working well) 5
Q2. How important was it for you to visit the Galapagos Islands someday in your life? Not at all 1
2
Somewhat 3
4
Very 5
Q3. Which of the following sources of information did you use to learn about the Galapagos prior to your visit? [Please check all that you remember using]
a) Ecuadorian Ministry of Tourism webpage
b) Galapagos Chamber of Tourism webpage
c) Charles Darwin Research Station webpage
d) Galapagos National Park Service webpage
e) Ecotourism webpage
f) Environmental organization webpage
g) Specialized travel books/pamphlets/magazines
h) AAA
i) Past visitors

116
Q4a. Were the Galapagos Islands the main destination of this trip? Yes No
Q4b. What was the main purpose of this visit to the Galapagos Islands? Select one...
Q5. In what year was this trip? Select one...
Q6. Including you, how many people traveled in your party? Select one... persons
Q7. How long did you stay in the Islands? Select one... days
Q8. How did you arrange this visit to the Galapagos Islands? Select one...
Q9. How did you arrive in the Galapagos Islands? Select one... Q10. What recreational activities did you do during this visit? [check all that apply]
a) Snorkeling b) Surfing c) Camping
d) Scuba diving e) Kayaking f) Horse riding
g) Mountain biking h) Trekking/hiking i) Flora/wildlife watching
j) Shopping k) Boat tour of islands l) Other Q11. Please complete the table about any excursions (either land or water-based) you might have taken on this trip. Length Number taken Average cost per person per trip
Half-day Select one... USD$
Full-day Select one... USD$
Multi-day Select one... USD$
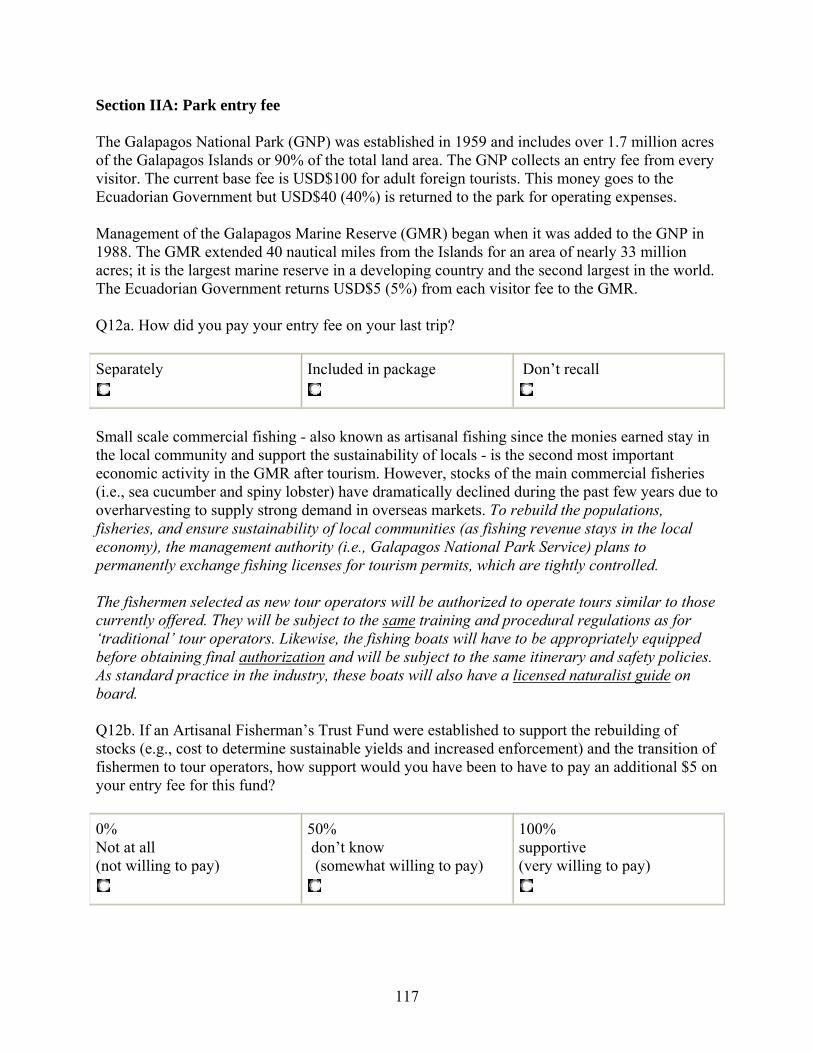
117
Section IIA: Park entry fee The Galapagos National Park (GNP) was established in 1959 and includes over 1.7 million acres of the Galapagos Islands or 90% of the total land area. The GNP collects an entry fee from every visitor. The current base fee is USD$100 for adult foreign tourists. This money goes to the Ecuadorian Government but USD$40 (40%) is returned to the park for operating expenses. Management of the Galapagos Marine Reserve (GMR) began when it was added to the GNP in 1988. The GMR extended 40 nautical miles from the Islands for an area of nearly 33 million acres; it is the largest marine reserve in a developing country and the second largest in the world. The Ecuadorian Government returns USD$5 (5%) from each visitor fee to the GMR. Q12a. How did you pay your entry fee on your last trip? Separately
Included in package
Don’t recall
Small scale commercial fishing - also known as artisanal fishing since the monies earned stay in the local community and support the sustainability of locals - is the second most important economic activity in the GMR after tourism. However, stocks of the main commercial fisheries (i.e., sea cucumber and spiny lobster) have dramatically declined during the past few years due to overharvesting to supply strong demand in overseas markets. To rebuild the populations, fisheries, and ensure sustainability of local communities (as fishing revenue stays in the local economy), the management authority (i.e., Galapagos National Park Service) plans to permanently exchange fishing licenses for tourism permits, which are tightly controlled. The fishermen selected as new tour operators will be authorized to operate tours similar to those currently offered. They will be subject to the same training and procedural regulations as for ‘traditional’ tour operators. Likewise, the fishing boats will have to be appropriately equipped before obtaining final authorization and will be subject to the same itinerary and safety policies. As standard practice in the industry, these boats will also have a licensed naturalist guide on board. Q12b. If an Artisanal Fisherman’s Trust Fund were established to support the rebuilding of stocks (e.g., cost to determine sustainable yields and increased enforcement) and the transition of fishermen to tour operators, how support would you have been to have to pay an additional $5 on your entry fee for this fund? 0% Not at all (not willing to pay)
50% don’t know (somewhat willing to pay)
100% supportive (very willing to pay)
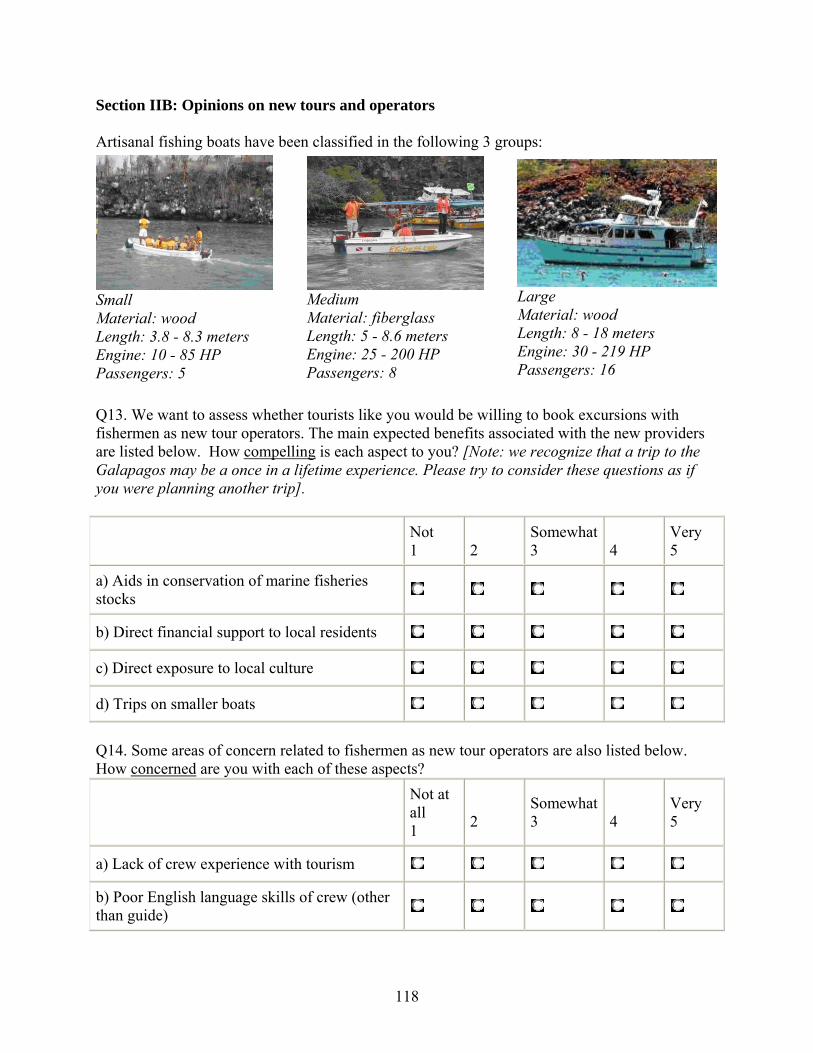
118
Section IIB: Opinions on new tours and operators Artisanal fishing boats have been classified in the following 3 groups:
Small Material: wood Length: 3.8 - 8.3 meters Engine: 10 - 85 HP Passengers: 5
Medium Material: fiberglass Length: 5 - 8.6 meters Engine: 25 - 200 HP Passengers: 8
Large Material: wood Length: 8 - 18 meters Engine: 30 - 219 HP Passengers: 16
Q13. We want to assess whether tourists like you would be willing to book excursions with fishermen as new tour operators. The main expected benefits associated with the new providers are listed below. How compelling is each aspect to you? [Note: we recognize that a trip to the Galapagos may be a once in a lifetime experience. Please try to consider these questions as if you were planning another trip].
Not 1
2
Somewhat 3
4
Very 5
a) Aids in conservation of marine fisheries stocks
b) Direct financial support to local residents
c) Direct exposure to local culture
d) Trips on smaller boats Q14. Some areas of concern related to fishermen as new tour operators are also listed below. How concerned are you with each of these aspects?
Not at all 1
2
Somewhat 3
4
Very 5
a) Lack of crew experience with tourism
b) Poor English language skills of crew (other than guide)

119
c) Not affiliated with known company
d) Lack of amenities available on larger vessels
Section IIC: Evaluating two alternative types of excursions Alternative 1: Q15a. Considering the potential benefits and concerns of excursions operated by new providers that you just indicated, how interested are you in booking one of these excursions? [Note: As before, please try to think back to when you were planning your trip when answering the following questions]. Not at all 1
2
Somewhat 3
4
Very 5
Q15b. If you would have been interested in these new tour operators, which type of excursion would you have been most likely to try? Please construct this tour by selecting your preferred boat size, trip length, and main activity of the choices offered.
Boat size: Small
Medium
Large
Trip length: Half day
Full day
Multi-day
Main activity: Scuba diving
Snorkeling
Inter-island Transportation
Q15c. Would the availability of such an excursion have changed your itinerary during your previous visit? If you booked an all-inclusive package, assume this was one of the options .
YES I would have added an excursion by one of these new operators
YES I would have replaced an excursion I took with one from these new operators
NO I would not have taken this excursion

120
Alternative 2: Besides the same tour activities offered by traditional operators, fishermen will also offer a unique opportunity for fishing trips with them in medium to large boats. Known as "Artisanal Fishing Tours," this will be the first time that visitors have been allowed the opportunity for recreational fishing. Visitors will experience the local fishing culture and will learn about day-to-day fishing practices. They could even end their fishing experience by eating their fresh catch in a local restaurant. Q16a. Considering the same potential benefits and concerns of excursions operated by new providers that you evaluated on the previous page, but ignoring the previous alternative (Q15), how interested would you have been (if at all) in booking a new Artisanal Fishing Tour? Not at all 1
2
Somewhat 3
4
Very 5
Q16b. If you would have been interested in an Artisanal Fishing Tour, which type of excursion would you have been most likely to try? Please construct this tour by selecting your preferred trip length, fishing trip, and whether you would like the dining option.
Trip length: Half Day
Full day
Fishing options & method:
Lobster (scuba diving)
Finfish (hook & line, nets)
Dining option (eat caught seafood at local restaurant after trip):
Yes (retain catch)
No (release catch)
Q16c. Would the availability of such an excursion, if priced reasonably or was available as an option, have changed your itinerary during your previous visit? YES I would have added an excursion by one of these new operators
YES I would have replaced an excursion I took with one of these new operators
NO I would not have taken this excursion

121
Q16d. How much would you have been willing to pay for this tour? Please consider your individual selections, the average cost of tours during your last visit, and the uniqueness of this opportunity.
The most I would pay for this tour is: USD$ Section III: Information about the sample of respondents Q17. Are you or was anyone in your party… Yes No
a) a member of any conservation organization?
b) a member of a development/aid organization?
c) employed in any aspect of the tourism industry?
Q18. What is your gender? Select one...
Q19. In what year were you born? Select one... Q20. In what region do you consider your primary home to be located? [Please select from the pull-down menu to the right of the map]
Select one... Q21. What is the highest level of education you have completed?
Select one... Q22. In what range – approximately – was your total household income before taxes in 2008?
Select one... Q23. And, just to see if we have a representative sample, would you please share your race?
Select one...

122
Q24. Would you say that you are of Hispanic ancestry? Select one... Section IV: Comments and finish Thank you for your information, which will be used to estimate the potential use and value of this new tourism sector.

123
LIST OF REFERENCES
Alban, F., and J. Boncoeur. 2004. An Assessment of the Potential Interest of Fishermen to Engage in Boat-Chartering in the Context of a Marine Park: The Case of the Iroise Sea, Western Brittany, France. Contesting the Foreshore: Tourism, Society, and Politics on the Coast, J. Boissevain and T. Selwyn, eds., pp. 185-203. Amsterdam, The Netherlands: Amsterdam University Press.
Alberini, A., V. Zanatta, and P. Rosato. 2007. Combining Actual and Contingent Behavior to Estimate the Value of Sports Fishing in the Lagoon of Venice. Ecological Economics 61 (2-3):530-541.
Allison, P. 2002. Missing Data. Sage University Papers Series on Quantitative Applications in the Social Sciences, 07-136. Thousand Oaks, CA: Sage Publications, Inc.
Asche, F. 2007. Capacity Measurement in Fisheries: What Can We Learn? Marine Resource Economics 22 (1):105-108.
Baine, M., M. Howard, S. Kerr, G. Edgar, and V. Toral. 2007. Coastal and Marine Resource Management in the Galapagos Islands and the Archipelago of San Andres: Issues, Problems and Opportunities. Ocean and Coastal Management 50:148-173.
Battese, G.E.,and S.S. Broca. 1997. Functional Forms of Stochastic Production Functions and Models for Technical Efficiency Effects: A Comparative Study for Wheat Farmers in Pakistan. Journal of Productivity Analysis 8:395-414.
Battese, G.E.,and T.J. Coelli. 1993. A Stochastic Frontier Production Function Incorporating a Model for Technical Inefficiency Effects. Working Papers in Econometrics and Applied Statistics No. 69. Department of Econometrics, University of New England, Armidale, Australia.
____. 1995. A Model for Technical Inefficiency Effects in a Stochastic Frontier Production Function for Panel Data. Empirical Economics 20:325-332.
Bennett, J., and R. Blamey. 2001. Introduction. The Choice Modelling Approach to Environmental Valuation, J. Bennett and R. Blamey, eds., pp.1-10. Chentelham, U.K.: Edward Elgar.
Berkes, F., R. Mahon, P. McConney, R. Pollnac, and R. Pomeroy. 2001. Managing Small-Scale Fisheries: Alternative Directions and Methods. Ottawa, ON: International Development Research Center.
Bhat, C., and R. Pendyala. 2005. Modeling Intrahousehold Interactions and Group Decision Making. Transportation 32:443-448.
Borooah, V.K. 2002. Logit and Probit: Ordered and Multinomial Models. Thousand Oaks, CA: Sage Publications.

124
Cancino, J.P., H. Uchida, and J. E. Wilen. 2007. TURFs and ITQs: Collective vs. Individual Decision Making. Marine Resource Economics 22:391-406.
Carvalho, A.R. 2008. Profits and Social Performance of Small-scale Fishing in the Upper Parana River Floodplain (Brazil). Brazilian Journal of Biology 68(1):87-93.
Castrejon, M. 2007. Personal Communication.
Cinner, J.E., T.Daw and T.R. McClanahan. 2008. Socioeconomic Factors that Affect Artisanal Fishers’ Readiness to Exit a Declining Fishery. Conservation Biology 23(1):124-130.
Coelli, T.J. 1995. Recent Developments in Frontier Modelling and Efficiency Measurement. American Journal of Agricultural Economics 39 (3): 219-245.
____. 1996. A Guide to Frontier Version 4.1: A Computer Program for Stochastic Frontier Production and Cost Function Estimation. Working Paper No. 7/96. Centre for Efficiency and Productivity Analysis, University of New England, Armidale, Australia.
Comisión Técnica Pesquera de la Junta de Manejo Participativo (CTPJMP). 2009. Capítulo Pesca del Plan de Manejo de la Reserva Marina de Galápagos. http://www.galapagospark.org/documentos/capitulo_pesca_reserva_marina_galapagos.pdf, last accessed October 29, 2009.
Congreso Nacional del Ecuador. 1998. Ley de Régimen Especial para la Conservación y Desarrollo Sustentable de la Provincia de Galápagos. Quito, Ecuador, pp.42.
Conrad, J. 1999. Resource Economics. New York, NY: Cambridge University Press.
Diario C. 2003. Proyecto de Turismo Alternativo de Pescadores Artesanales. http://www.diarioc.com.ar/inf_general/Proyecto_de_turismo_alternativo_de_pescadores_artesanales/32782, last accessed March 3, 2010.
Defeo, O., and J.C. Castilla. 2005. More than One Bag for the World Fishery Crisis and Keys for Co-management Successes in Selected Artisanal Latin American Shellfisheries. Reviews in Fish Biology and Fisheries 15:265-283.
Esmaeili, A. 2006. Technical Efficiency Analysis for the Iranian Fishery in the Persian Gulf. ICES Journal of Marine Science 63:1759-1764.
Estrategia and Negocios. 2009. Pesca Artesanal Atrae Turistas. http://estrategiaynegocios.net/vernoticia.aspx?option=63381, last accessed March 3, 2010.
FAO. 1995. Code of Conduct for Responsible Fisheries. Rome, FAO, 41 pp.
____. 1998. Report of the Technical Working Group on the Management of Fishing Capacity. FAO Fisheries Report No. 586. Rome, Italy.

125
FAO/RAP/FIPL. 2004. A Research Agenda for Small-Scale Fisheries. RAP Publication No. 2004/21 and FIPL/C 10009. Bangkok, Thailand: FAO Regional Office for Asia and the Pacific.
Felthoven, R. 2002. Effects of the American Fisheries Act on Capacity, Utilization and Technical Efficiency. Marine Resource Economics 17:181-205.
Fousekis. P., and S. Klonaris. 2003. Technical Efficiency Determinants for Fisheries: A Study of Trammel Netters in Greece. Fisheries Research 63:85-95.
Funk, R.D., W.L.Griffin Sr., J.W. Mjelde, and J. M. Ward.2003. A Simulation Model of License Buyback in the Texas Bay Shrimp Fishery. Marine Resource Economics 18 (1):33-53.
Greenville, J.,J. Hartmann, and T.G. Macaulay. 2006. Technical Efficiency in Input-Controlled Fisheries: The NSW Ocean Prawn Trawl Fishery. Marine Resource Economics 21:159-179.
Gonzalez, E. 1996. Territorial Use Rights in Chilean Fisheries. Marine Resource Economics 11:211-218.
Guyader, O., F. Daures, and S. Fifas. 2004. A Bioeconomic Analysis of the Impact of Decommissioning Programs: Application to a Limited-Entry French Scallop Fishery. Marine Resource Economics 19 (2):225-242.
Hearn, A. 2008. The Rocky Path to Sustainable Fisheries Management and Conservation in the Galapagos Marine Reserve. Ocean and Coastal Management 51:567-574.
Hearn, A., J.C. Murillo, and H. Reyes. 2007. Disminuye la Rentabilidad de las Pesquerías en la RMG. Informe Galápagos 2006-2007. Galápagos, Ecuador: Servicio Parque Nacional Galápagos, Fundación Charles Darwin e Ingala.
Hearn A, Murillo JC, Nicolaides F, Moreno J & H Reyes. 2006. Evaluación de la Pesquería de Langosta Espinosa (Panulirus Penicillatus y P. Gracilis) en la Reserva Marina de Galápagos 2005. Evaluación de las Pesquerías en la Reserva Marina de Galápagos, Informe Compendio 2005, A. Hearn, ed., pp. 46–116. Galápagos, Ecuador: Fundación Charles Darwin.
Heylings, P., and M. Bravo. 2007. Evaluating Governance: A Process for Understanding How Co-Management is Functioning, and Why in the Galapagos Marine Reserve. Ocean and Coastal Management 50:174-208.
Hicks, R.L., J. Kirkley, and I.E. Strand Jr. 2004. Short Run Welfare Losses from Essential Fish Habitat Designations for the Surfclam and Ocean Quahog Fisheries. Marine Resource Economics 19(1):113-129.
Ikiara, M.M., and J.G. Odink. 2000. Fishermen Resistance to Exit Fisheries. Marine Resource Economics 14(3):199-213.

126
Jensen, C.L. 2002. Reduction of the Fishing Capacity in “Common Pool” Fisheries. Marine Policy 26:155-158.
Jeon, Y., I.H. Omar, K. Kuperan, D. Squires, and I. Susilowati. 2006. Developing Country Fisheries and Technical Efficiency: The Java Sea Purse Seine Fishery. Applied Economics 38:1541-1552.
Kerr, S. 2005. What is Small Island Sustainable Development About? Ocean and Coastal Management 48:503-524.
Kirkley, J., C. J. Morrison Paul, and D. Squires. 2002. Capacity and Capacity Utilization in Common-Pool Resource Industries: Definitions, Measurement, and a Comparison of Approaches. Environmental and Resource Economics 22:71-97.
Kirkley, J., D. Squires, and I. E. Strand. 1995. Assessing Technical Efficiency in Commercial Fisheries: The Mid-Atlantic Sea Scallop Fishery. American Journal of Agricultural Economics 77:68-697.
____. 1998. Characterizing Managerial Skill and Technical Efficiency in a Fishery. Journal of Productivity Analysis 9:145-160.
Kitts, A., E. Thunberg, and J. Robertson. 2001. Willingness to Participate and Bids in a Fishing Vessel Decommissioning Program: A Case Study of New England Groundfish. Marine Resource Economics 15 (3):221-232.
Kodde, D., and F. Palm. 1986. Wald Criteria for Jointly Testing Equality and Inequality Restrictions. Econometrica 54:1243-1248.
Kumbhakar, S., and C.A. Knox Lovell. 2000. Stochastic Frontier Analysis. New York, NY: Cambridge University Press.
Kuperan, K., and N.M.R. Abdullah. 1994. Small-Scale coastal Fisheries and Co-management. Marine Policy 18(4):306-313.
Kusakawa, T. 1992. Commercial Fisheries and Sports Fishing: Conflict and Cooperation. Proceedings of the 6th Biennial Conference of the International Institute of Fisheries Economics and Trade, M. Antona, J. Catanzano and J.G. Sutinen, eds., pp.1201-1211. Paris, France: IFREMER.
Liao, Tim F.1994. Interpreting Probability Models: Logit, Probit, and Other Generalized Linear Models. Thousand Oaks, CA: Sage Publications.
Lokina, R. B. 2008. Technical Efficiency and the Role of Skipper Skill in Artisanal Lake Victoria Fisheries. Environment and Development Economics 14:497-519.
Long, J.S. 1997. Regression Models for Categorical and Limited Dependent Variables. Thousand Oaks, CA: Sage Publications.

127
Madau, F.A., L. Idda, and P. Pulina. 2009. Capacity and Economic Efficiency in Small-Scale Fisheries: Evidence from the Mediterranean Sea. Marine Policy 33:860-867.
Marthin-Smith, K.M., M. A. Samoilys, J.J. Meeuwig, and A.C.J. Vincent. Collaborative Development of Management Options for an Artisanal Fishery for Seahorses in the Central Philippines. Ocean and Coastal Management 47:165-193.
Murillo, J.C., H. Reyes, and A. Hearn. 2006. Aspectos Sociales de las Pesquerías en Galápagos. Informe Galápagos 2006-2007. Galápagos, Ecuador: Parque Nacional Galápagos, Fundación Charles Darwin e INGALA.
Murillo, J.C. 2002. Indicadores Socio-Económicos de la Pesca. Reserva Marina de Galápagos, Línea Base de la Biodiversidad, E. Danulat and G.J. Edgar, eds., pp.440-458. Galápagos, Ecuador: Fundación Charles Darwin y Servicio Parque Nacional Galápagos.
Nasuchon, N., and A. Charles. 2010. Community Involvement in Fisheries Management: Experiences in the Gulf of Thailand Countries. Marine Policy 34:163-169.
Pascoe, S., and S. Mardle. 2005. Anticipating Fisher Response to Management: Can Economics Help? Working Paper. CEMARE, University of Portsmouth, Portsmouth, UK.
Pascoe, S., J.E. Kirkley, D. Greboval, and C.J. Morrison Paul. 2003. Measuring and Assessing Capacity in Fisheries, Issues and Methods. FAO Fisheries Technical Paper 433/2. Rome, Italy.
Pascoe, S., and L. Coglan. 2002. The Contribution of Unmeasurable Inputs to Fisheries Production: An Analysis of Technical Efficiency on Fishing Vessels in the English Channel. American Journal of Agricultural Economics 84 (3):585-597.
Paulrud, A. 2006. Marginal Valuation of Improving the Sport-Fishing Catch. Tourism Economics 12(3):437-449.
Pradhan, N., and P. Leung. 2004. Modeling Entry, Stay and Exit Decisions of the Longline Fishers in Hawaii. Marine Policy 28: 311-324.
Prayaga, P., J. Rolfe, and N. Stoeckl. 2010. The Value of Recreational Fishing in the Great Barrier Reef, Australia: A Pooled Revealed Preference and Contingent Behavior Model. Marine Policy 34(2):244-251.
Roehl, W.S., R. Ditton, S.M. Holland, and R. R. Perdue. 1993. Developing New Tourism Products Sports Fishing in the South-East United States. Tourism Management 14(4):279-288.
Rolfe, J., and P. Prayaga. 2007. Estimating Values for Recreational Fishing at Freshwater Dams in Queensland. Australian Journal of Agricultural and Resource Economics 51(2):157-174.

128
Salas, S., R.Chuenpagdee, J.C. Seijo, and A. Charles. 2007. Challenges in the Assessment and Management of Small-Scale Fisheries in Latin America and the Caribbean. Fisheries Research 87:5-16.
Salas, S., and D. Gaertner. 2004. The Behavioral Dynamics of Fishers: Management Implications. Fish and Fisheries 5:153-167.
Salayo, N., L. Garces, M. Pido, K. Viswanathan, R. Pomeroy, M. Ahmed, I. Siason, K. Seng, and A. Masae. 2008. Managing Excess Capacity in Small-Scale Fisheries: Perspectives from Stakeholders in Three Southeast Asian Countries. Marine Policy 32:692-700.
Sarr, O., J. Boncoeur, M. Travers, and M.C. Cormier-Salem. 2008. Can Ecotourism be an Alternative to Traditional Fishing? An Analysis with Reference to the Case of the Salomon Delta (Senegal). Economics of Poverty, Environment and Natural Resource Use, R.B. Dellink and A. Ruijs, eds., pp.87-100. Dordrecht, The Netherlands: Springer.
Schnier, K.E., C.M. Anderson, and W.C. Horrace. 2006. Estimating Heterogeneous Production in Fisheries. Working Paper. Coastal Institute, Department of Environmental and Natural Resource Economics, University of Rhode Island, Kingston, RI.
Sekhar, N.U. 2007. Social Capital and Fisheries Management: The Case of Chilika Lake in India. Environmental Management 39:497-505.
Servicio Parque Nacional Galapagos (SPNG). 2006. Estatuto Administrativo del Parque Nacional Galapagos. http://www.galapagospark.org/documentos/DPNG_estatuto_administrativo.pdf, last accessed January 27, 2010.
Servicio Parque Nacional Galapagos (SPNG). 2009. Monitoreo de los Sitios de Visita de la Reserva Marina de Galapagos. http://www.galapagospark.org/programas/turismo_monitoreo_marino.html, last accessed January 28, 2010.
Sharma, K., and P. Leung. 1999. Technical Efficiency of the Longline Fishery in Hawaii: An Application of a Stochastic Production Frontier. Marine Resource Economics 13:259-274.
Shepherd, S.A., P Martinez, M.V. Toral-Granda and G.J. Edgar. 2004. The Galapagos Sea-Cucumber Fishery: Management Improves as Stock Declines. Environmental Conservation 31(2):102–110.
Smith, M.D., and J.E. Wilen. 2003. Economic Impacts of Marine Reserves: The Importance of Spatial Behavior. Journal of Environmental Economics and Management 46:183-206.
____. 2004. Marine Reserves with Endogenous Ports: Empirical Bioeconomics of the California Sea Urchin Fishery. Marine Resource Economics 19(1):85-112.
Smith, M.D. 2005. State Dependence and Heterogeneity in Fishing Location Choice. Journal of Environmental Economics and Management 50:319-340.
129
Smith, M.D., and J. Zhang. 2007. Sorting Models in Discrete Choice Fisheries Analysis. Selected paper presented at the American Agricultural Economics Association Annual Meeting. Portland, OR.
Squires, D., R.Q. Grafton, M.F. Alam, I.H. Omar. 2003. Technical Efficiency in the Malaysian Gill Net Artisanal Fishery. Environment and Development Economics 8:481-504.
Stoll, Jhon, R. Ditton. 2006. Understanding Anglers’ Willingness to Pay Under Alternative Management Regimes. Human Dimensions of Wildlife 11(1):27-42.
Sun, Ch. 1999. Optimal Number of Fishing Vessels for Taiwan’s Offshore Fisheries: A Comparison of Different Fleet Size Reduction Policies. Marine Resource Economics 13 (4):275-288.
Taylor, J.E., J. Hardner, and M. Stewart. 2006. Ecotourism and Economic Growth in the Galapagos: An Island Economy-wide Analysis. Working Paper 06-001. Department of Agricultural and Resource Economics, University of California, Davis, CA.
Teh, L., and W. Cheung. 2008. A Survey of Alternative Livelihood Options for Hong Kong’s Fishers. International Journal of Social Economics 35 (5):380-395.
Tingley, D., S. Pascoe, and L. Coglan. 2005. Factors Affecting Technical Efficiency in Fisheries: Stochastic Production Frontier Versus Data Envelopment Analysis Approaches. Fisheries Research 73:363-376.
Toral, M. V., E.Espinoza, A. Hearn, and C. Martínez. 2002. Langostas Espinosas. Reserva Marina de Galápagos, Línea Base de la Biodiversidad, E. Danulat and G.J. Edgar, eds., pp. 199-221. Galápagos, Ecuador: Fundación Charles Darwin y Servicio Parque Nacional Galápagos.
Viteri, C. and C. Chavez. 2007. Legitimacy, Local Participation , and Compliance in the Galapagos Marine Reserve. Ocean and Coastal Management 50:253-274.
Ward, J.M., and J. Sutinen. 1994. Vessel Entry-Exit Behavior in the Gulf of Mexico Shrimp Fishery. American Journal of Agricultural Economics 76:916-923.
Ward, J.M.; Kirkley, J.E.; Metzner, R.; Pascoe, S. 2004. Measuring and Assessing Capacity in Fisheries.1: Basic Concepts and Management Options. FAO Fisheries Technical Paper. No. 433/1. Rome, Italy.
Wilen, J.E. 2009. Stranded Capital in Fisheries: The Pacific Coast Groundfish/Whiting Case. Marine Resource Economics 24(1):1-18.
Wilen, J.E, M.D. Smith, D. Lockwood and L.W. Botsford. 2002. Avoiding Surprises: Incorporating Fisherman Behavior Into Management Models. Bulletin of Marine Science 70(2):553-575.

130
Whitmarsh, D., C. Pipitone, F. Badalamenti, and G. D’Anna. 2003. The Economic Sustainability of Artisanal Fisheries: The Case of the Trawl Ban in the Gulf of Castellammare, NW Sicily. Marine Policy 27:489-497.
Worm, B., E.B. Barbier, N. Beaumont, J.E. Duffy, C. Floke, B.S. Halpern, J.B.B. Jackson, H.K. Lotze, F.Micheli, S. R. Palumbi, E. Sala, K.A. Selkoe, J.J Stachowicz, and R. Watson. 2006. Impacts of Biodiversity Loss on Ocean Ecosystem Services. Science 314 (5800):787-790.
Yang, S., V. Narayan, and H. Assael. 2006. Estimating Interdependence of Television Program Viewership Between Spouses: A Bayesian Simultaneous Equation Model. Marketing Science 25:336-349.

131
BIOGRAPHICAL SKETCH
Liliana Alencastro was born in Guayaquil, Ecuador. She obtained her undergraduate
degree in Economics with a minor in Finance in 2000 at the Escuela Superior Politécnica del
Litoral (ESPOL) in her home country. After working as a research assistant in the Center for
Economic Research at ESPOL, she continued her graduate education and obtained her Master of
Science degree in the Food and Resource Economics Department at the University of Florida in
2004. In the same year, she started the doctoral program in the same department and received her
Ph.D. degree in May of 2010. Her research interests are focused on natural resource economics,
especially on the human dimensions of artisanal fisheries management. She has studied the
preferences of hobbyists for marine ornamental fish, and more recently, the socioeconomic and
efficiency implications of fishing capacity management in small scale commercial fisheries.