retirement.ladwp.comretirement.ladwp.com/agendaitems/agenda - 20121212 item 9a.pdf · water and...
TRANSCRIPT

--
Water and Power Employees Retirement Plan Preliminary Summary ollnvoetment Returne For the Period Ending September 30. 2012
InvestmentStyla Ilncapuonl,ncapuonMar1<atl·.1 CUlTant Mar1<atl",ol.T.. Cltl A11~'1 Month I 3-Months I YTD I FYTD 11.v..r 13.vaars I Sovearsl Sinca 11.vrSlatual Watch Data Valua Valua Portfolio TaflllLla Endlllll ~ ~ Incaptlon ~ Sl!!lus P.O
Total Retirement .Plan (Groa~)' 7.6~6,.~:~.2. 0'. ",' '" ...'. :,,:,;::1 ~;~~I'!~ ..J'<: Total Retirement Plan (Net) . '">".',.'" ~ ."'.".
Retirement Policy Benchmark Added Value Domestic Equity Mil;lligers. >:'(;'\\ .~''.' .,'.".
03 0 60 35 34 5 09 29 AbOva ItllsckRock RUBSalll000 (GroBS) I La/lla Gap COrs-S I Aug' 1 1,766,100,000 1"'1 ..•. %1 ' 2.0%, I 2. 1 6. 1 16. 1 6:3 1 30. 1 13. 1 ,.221 6.52735'174'5331·.·.·.:·.'.9 58 ...•BlsckRock Ruasalll000 Inda.Inda. (Net)(b) (Redemption 01 " >"">";",,,?,:-::. 2.60 6.35 16.33 6.35 30.06 13.28 1.21 6.51 ~: Russell 1000 $1,762,000,000) '., "~'.:".:-:';~ ::L:.:':-: 2.57 6.31 16.28 6.31 30.05 13.27 1.22 6.45 Value Added ". . .:'.:;":: ":';:'" 0.03 0.04 0.05 0.04 0.03 0.01 -0,01 0.06
IMFS (Groas) Balow PI Aug. 2012MFS (Net) (b)
~: Russell 1000 Value Value Added
tlelow
04 26 07 ,4 07 17 05 41 Balow IEamast Partners (GRlss) I SrnaU Gap Growth-G I N°V' I 94,000,000 '·.·.·1 106'366'5741'.'.•. ·.·:.,!.··~~.:'k.'1·:..·.\I.·::·.~~1 2. 1 8. 1 9. 1 6. 1 28. 1 13. 1 2. 1 5.lXEamast Parlnara (Nst) (b) ..>.,:'"..... ',.'.• ,....".: , 2.21 5.92 8.69 5.92 27.57 12.45 1.81 4.40 ~: Russell 2000 Valuelnde. ..': '';:·.>f:,j:,.~, .:'.""<•.::> 3.58 5.67 14.37 5.67 32.63 11.72 1.35 4.17 ~d .' , '. ., ......;',.,.,y,."" . ·1.35 0.25 -5.68 0.25 -5.06 0.73 0.46 0.23
94 Below ronUar(GRlas) 1 SrrialrcapGroWllf-G'1 Apr·101 100,800",."..'. f03:B95;4421.·.·':.:.:.~I.} .•.·I·..i';'.1.".;4 ... ~.'.'.I 1. 1 3.331 ~ 3:331 24.2~ NJ)\I N/AI 7.49...5:% ...•. ~ May 2Ot2 ~: Rus.ell2ooo Growth Inde. .' ; ..,.\,',~:t-; ,,:.':,:. ',;:, 3.00 4.84 14.06 4.84 31.18 N/A N/A 10.58 Value Added "..',,'.,"- .;;'.,. ,;)::/.. -1.14 ·1.76 '5,09 -1.76 -7.93 N/A N/A -4.09
65 16 61 29 39
FronUar (Nat)(b) '·":'",.':.Y,'''.,'·'.'.:.:..' 1.86 3.08 8.99 3.06 23.25 N/A N/A 6.49
Balow Sub-tolal DomesUc Equity (Gross) I I I 1':'1 2,665,478,370 I i34.~%I:34·00%1 2. 1 6.61/ 16. 1 6. 1 29. 1 12. 1 0.97Sub-Iolal DomasUc Equity(Nat)· -<' " .• ' 2.64 6.59 18.07 8.59 29.20 12.30 0.87 Bsnchmar1< Russall3000 Indax ' • ,..~,: " 2.63 6.23 16.13 8.23 30.20 13.28 1.30 Vslus Addsd . '.; ':" 0.01 0.36 -0.06 0.38 -1.00 -0.98 -0.43
....,:•.. :t..InternstionaIEaultvM;lnagers' "I ""CC:; I· ······1·1·· ';1; ':1<;· J "::.\:1.;; Aboveco I Devaloped COre·S Jun-D4 270.000,000.. 3.68
.>. 3.26 Sapt. 2011I» Structural2.86... 0.40
prreve pe aue- r· Below Sspt.2011
Above
393,000,000
ep· 2 08, 0, N/A N/A N/A N/A N/A N/A N/A N/A N/A N/A N/A N/A N/A N/A N/A N/A N/A N/A
0 00 92 1 451 021 45 97 ,4 061 Balow PfTIThaBoslonCompsnyEmarglng{GRlss) I Eme/lllngMldValue·C 1 Mar.051 50'000'0001"1 1 :: : .. 1; 5.09"•.. 1 -0. 0. 3. 0. 1' 5. 1 -0. 1 '1.% 9.43Ths Boalon COmpsny Emerging (Nel)(b) .. ' :<.,.... ,: ,;......... -0.99 0.25 2.41 0.25 5.15 -0.96 -1.90 8.61 Sept. 2011 ~: MSCI EMF IMI ND Index '. .(:... ~..:; '.:,':..'.": 6.05 7.82 12.47 7.82 16.78 5.82 -0.71 11.59 Value Added 'c :·.CC' .... ; :t':;,;:.;·: -7.04 ·7.58 ·10.01 ·7.58 -11.63 -6.78 -1.19 -2.98
Ema/lling M1<t Growlh·C Mar-o , 0,000 ...Abovs Mar. 2011
ep' 2 13. ,000
,'. ~:
Balow031 391 651 28 81Sub-tolallntarnstlonal Equity (Gross) I I 1·.··'.·.·..'1 t,696,366,636 (C)12o.82%121.00%1 4. 7.551 s. 7. 11. 1 1.8 -3.77Sub-tolallntarnatlonal EqUity (Nat) 4.02 7.53 8.32 7.53 11.21 1.81 -3.84I '.. :., :) .. Benchmar1< MSCI ACW.US~MI . . .. . . • 3.89 7.64 10.69 7.54 14.36 3.49 -3.85 VsluaAdded' . 0.13 -0.01 -2.37 -0.01 -3.15 ·1.66 0.01
Nota.: 'S" lor Sapsrata Account
"C" lor COmmingled Account (c) Includes International Developed and Emerging Marksts Transttion eccounts for $1.3M and $73.9M, respectively. "N/A" . Recantly IUnded sccounts and no perlonnanca available lor this perlod. (d) Portfolio refum Includes perlormsnce of International Developed and Emerging Msrkets Trans"ion accounts.. (a) Watch Status ("P" due to Parlonnance; "0" due to Organizational Change, "T" lor Tannlnated account; and "R"lor Rehired)
(b) Net returns are estimated basad on contrac1usl fees scheduls, Pags 1 018 (J)

Water and Power Employees Retirement Plan Preliminary Summary of Inveatment Returne For the Period Ending September 30, 2012
Prellmlnerv Annuellzed Investment Style 3-Month. YTD FYTD l·Yeer I 3·Yesr. I SoYesrs Welch
Ending Slslu. P, 0,
IJP Morgsn Core (Gro••) ;."" :60~~ FI-S Apr-l 0 1,103,500,000 ~4.~f.I •.nt l:f;'~ 0.4l 2.01 5.41 2.01 6.65 N1A
";);-T•..~-". :;',:,.,'.
N1A r,3~1 ADove
~'.~~~~'.
. JP Morgen Core (Net) (b) 0.40 1.99 5.34 1.99 6.55 N/A N/A 7.25 ~ BC U.S. Aggregate 0.14 1.59 3.99 1.59 5.16 N/A N/A 6.63 Velue Added 0.26 0.40 1.35 0.40 1.39 N/A N/A 0.62
IWen. Core (GroBB) GOre fl-5 JUI-lO 9~1l;'1OQ,000 I''; 916, 930,S70 0.57 2.39 5.94 2.3S f:'ffi 7.7S 8.40 6.941 Above Wells Core (Net) (b) ;''1, 0.56 2.36 5.85 2.36 7.34 7.67 S.28 6.82 ~: BC U.S. Aggregete Value Added
'-"i \;
0.14 0.42
1.59 0.77
3.99 1.86
1.59 0.77
5.t6 2.t8
6.19 1.48
6.53 1.75
5.69 1.13
.ooml. High Yield (Gross) Hlg' jeICl-:) Mar.lJ5 133,737,389 H" 2.46 6.51 16.87 6.51 21.40 14.56 9.94 9.691 AbOve P Looml. High YIeld (Net) (b) 2.42 8.39 16.50 6.39 20.90 14.06 9.44 9.19 May20t2 ~: BC High Yield Index Valua Added
Iwens High Yield (GroBB) High Yield-S Nov:04
~:;'
103,000,000 1_,; 122.238,624
1.39 1.03 0:91
4.53 1.86 3.66
12.13 4.37
10.34
4.53 1.86 3,66 16.06
19.37 1.53
If:29
12.90 1.16
9.34 0.10 8J~
8.81 0.38 T.86fIlilOw T
Walls High Yield (Net) (b)Il!lIl!iIllIli!: BC High Yield Index Value Added ~i
0.87 1.39
-0.52
3.55 4.53 -0.99
10.00 12.13 -2.14
3.55 4.53 -0.99
15.60 19,37 -3,77
10.83 12.90 ·2.07
8.27 9.34
·1.07
7.40 8.40
·1.00
July 2011 R
Nov.2Otl
Sub-total Fixed Income (Groee) 2,087,494,621 0.64 2.58 6.52 2.58 8.24 6.22 7.37 Above . Sub-total Fixed Income (Net) 0.64 2.55 6.46 2.55 8.20 8.17 7.32 Benchmark Barclaya Capital U.S, Universal
RiI~i'R';fu~~~::::e:·lue, ' , ""-.' \ ," BT, :~)~'~~;';f.~,'~j:,.:~ . .·;':;<;:;~'~;~l J ;~(-;.,; <
0.29 0.35
2.00 0.55
.... >,'~ijil·,:
4.93 1.55
2.00 0.55
8.45 1.75
8.70 1.47
6.53 0.69
IAeIOil1edge Fund 01 Funda (lrrOaiJ1lagged'lmo) 1 Hedga Fof F-C FelHl7 33,000,000 Lo; 37,140,989 ,. 0.84 2.21 6,12 1.79 4.90 6.26 3.05 3.04 AbOve P Aelos Hedge Fund of Funds (Net) (lagged·l mol (b) '\-, 0,71 1.83 5.25 1.51 3.77 5.20 2.11 2.11 Nov. 2011 ~: T-BIII + 3% (lagged l'mo) 0.26 0.78 2.07 0.52 3,10 3,13 3.84 4,08 Value Added 0.45 1.05 3.18 0.99 0,67 2.07 ·1.53 ·1.97
WAMco (Gross) WAMCO (Net) (b)
Global TIPS·5 Apr-l0 Ii 336,J!lIl,448 -0,72 ~ T:ll9
1.04 a. 3.03
I.U_ 1.04
6.49 6.29
Ntll N/A
NJII N/A 6.37
"'lIT1 6elow
~:.BC WGILB Index Value Addsd .t\ -0.63
-0,09 1.01 0.03
3.771 -0.74
1.01 1 0.03
7.021 -0.73
N/AIN/A
N/AN/A
7.30 -0.93
co Q)
Sub-total Real Return (Grosa) Sub-total Reel Return (Net)
;~' 373,422,437 1.18
1.18 3.39 3.38
6.28 5.25
7.32 7.31
Above
Benchmerk CG 3·mo US T·BIII+3% 0.78 2.31 3.05 3.09 I\:) Added Value 0.42 1,07 3.20 4.22
Prlvatil EqultvM8iialieraiQu;;riti~iilg!leei) -., "" '-'_;:';,",,;:;:I':.?;::I: ;;i;t;, F,;,\~'F: Fund or Funds I Jun-061 29,400,000 j;;, 19,907,319 PE/RF :f.J!lI 5.29 Below
3.06 4.84 ·2.70 24.73 5.76 ·19.89
FundOfFijjj(JS Sep·llll 11,000,000 '- .. PE/RE "'4:50 9.39 Below
__ .... _J •• _ .... II ""'''''''.''0,
IHRJ Capital (Gro88) (lOl2) I HRJ Capital (Nat) ~: CA PENC Blend plus Russell 3000+3%
urxJ 01 t-unds Mar-OS .",! I'
F 16,800,000 I: 16,234,9~l';:L'f;111'''{': -'1 PE/RE 1.23
-2.70
·2.70 6.79 1.49
4.09 8.63
IFlsher Lynch (GroBB) {fQI2) Fisher Lynch (Nel)
Value Added II Fund of FiJnds APf-oB 12,~,_
W.098'8i·{f~~';JI"<:·{~.(·;,IP9RE 3.93 -0.95 ·1.19
2.39 1.85
0.81 -0.23
0,81 -0.23
16.45 14.06
NJA N/A
13,611 10.2~1
Below
andmark XIII (GroBB) (1 Q12} - I ~: CA PENC Blend plus Russell 3000+3% Value Added I
Fund of Funds Nov·OO
':;" 27,300.000 I;~ 14,7ll4,:J4ll' PE/RE
·2.70 1.51 4:10
-2.70 4.55 4.06
·2.70 2.47
13.32
30.88 -31.11 13.32
23.94 -9.68 13,62
N/A N/A
4.92
9.57 0,65 6.441 Below
Landmark XIII (Net)Il!lIl!iIllIli!: CA PENC Blend plus Russell 3000+3%
3.60 -2.70
3,06124,73
11.201-2.70
11.20130.86
11.65123.94
3'20110.32
4.4713.23
Value Added ILandmark XIV (Gr08a) (1012)
II und 01 FUnds sep:os .400,000 I,,, 16,046:M5 ~~Hlo
6.30 4.31
-21.67 13.90 -19.68 -12.29 ·7.12 -8.76 -sorow
Landmark XIV (Net) Benchmalk: CA PENC Blend plus Russell 3000+3% Value Added I
}. ~~~. 3.74 ·2.70 6.44
NOles: 'S· for Separate Account ·C· for Corrm!ngled Account .N/A" • RocenOy lunded accounts snd no pertonnance available for IhIs period, ·PE/RE·· Private equity snd real estatelnvostmanls returns are provldod quarterly (Source: Private I) (a) Watch Slalus (.p" due 10 Pertonnance; ·0' due to Organizational Change, ·T' lor Terminated account; and 'R· tor Rehired)
(b) Net returns are estimated based on contraelual fees schedule,
Page 2 of 8
Cd;

Water and Power Employee8 Retirement Plan Preliminary Summery o'investment Returne For the Period Ending September 3D, 2012
Inveatment Style IncePllonllncepuon Mar1letl'l Current Merketl ~(l'!0!1 i~II~;ill Month 13-Montha' YTD FYTD I-Year Prellm Annu
I 3-Yeera lnary al
I ized 5-Yeara Since I-Yr Status Wetch
Date Value (In mllllon)'" Value Portlollo ,Tallleta Ending Ending Incaptlon va. Status P, 0 Plfvate Equity Feb-09 9,000,000 'i 11,949,581 PEJAE 12.34 Ilelow
6.67 10.93 -4.26
f4~21 Above 53.01 30.69 22.32 17.79 Ilelow 4.01
30.69 -26.68
-o.G2 -a.81 30.88
-37.69 Sub-total Private Equity (Gross) I ,~, 128,013,227 2.30 6.68 9.01 9.01 17.28 8.92 Below Sub-total Private Equity (Net) .>' 1.80 4.68 6.75 6.75 14.52 8.64 Benchmer1l CA PENC Bind pius Rua~II3000+3% ;;~' -2.70 24.73 -2.70 30.88 23.94 10.32 VelueAdded I '.' ,.;""',)",,::1';;',)1',';:, 4.50 -20.15 9.45 -24.13 -9.42 -3.68
R~I E;b;ti-M;~~g;r;·(Q·~~rt;i,-~·gg;d)~~ ··::.·/(:T;\:,'-:'/I:;:~::;;.';;.;~/;:i'tz~}~,:~·,:;~:,';. ~;~,;. tl;"~~ ;':W;;:~~Lt_~!::~ ::a~ :\<·t):~}Yh'.;';/·"' ;.';" -{~::~;._~ D~.:;·:;;; .("if'?!:; ':~"1.;-;:~:~~t.;;~:- :::;S:t:~~f.:.~: ~:::'!":l~;~~>i ,~, :;;~_~~:·,;_;+if~_. ~'.~~,:>'~' .~;~~.~). : ,;:~.~~~: ;:'::~:::".£:" ".';'~k~·:"(,;i:~~:~; :;~:.?~-:::';~::;;;;:"! ' ";r::," '<"~,_ ,1··:'.-'-',
2:48 5.27 Ilelow 2.23 4.76 2.68 8.46
-0.45 -3.70 2.38 5.74 ve 2.14 5.25 2.66 6.46 -0.54 -3.21 3.63 6.37 Above
PR~n:h<:&: NCREIF Index (lagged) I I I l£l Stlif.VG.;};'::1 I 2.681 8.461 2.681 12.041 6.821 2.51 I _3.45 Valu.Added.,., """"', :','.0':, :',' 0.66 -0.69 13.41 4.05 2.46 -4.43 5.37
AboveCD c» cu
Above
Above
Above
Below
IDRAGrowt ross ~ ORA Growth (Net) 11.41 ~: NCREIF Index (lagged) 10.63 Value Added 0.58
lAG Core roaa slate e 12 -3,'I'BO,OOilTT--'!5>,l.603077;'l,lTl7T31l:07'%f;:;:"G:;Tt>lE7Rrl-3.CI2T--Im\;r--3.Cl2T--N7Jl[l-I'l~--'Wiq--6:T'7l
AG Core (Net) ~: NCRElF Index (lagged) Value Added
IPCCP(Grossj(lQ12) Heall:state JUI'12 3J~0,OOO ,', 7,163,293 t'I:IHI: -0.12 NJA -0.12 NJA NJA NJA -0.12 IPCCP(Net) ;' -0.12 N/A -0.12 N/A N/A N/A -0.12 ~: NCREIF Index (Jagged) ;::. 2.66 N/A 2.66 N/A N/A N/A 2.68 ValueAdded'" -2.80 N/A -2.60 N/A N/A N/A -2.60
1!!!8CKSlone \.~rosaJ \, ..121 e8ll:s18le JUI-12 2.0,uuu I\i: •.360.810 t'I:IHI: O. NJA O. 9 N1A N1A N1A O. 9 IBlackstone (Net) 1':: 5.79 N/A 5.79 N/A N/A N/A 5.79
Ja~3~Zl'd~d NCREIF Index (lagged) I;, ~:~~ ~~ ~:~~ .~~ ~~ ~~ ~:~
Notes: 'N/A', - RecenUy funded eccounts end no partonnance avaJlabie lor this pelfod. 'PEJRE'· Plfvele equity and real estate investments rBlums are provided quarterly (Souree: Plfvate I) (a) Walch Status ('PO due to Perlonnance; '0' due to Organizational Change, 'r lor Termlnated account; and 'R" for Rehired)
Pege 3 ci'8
~
I

Weter end Power Employees Retirement Plen Prellmlnery Summery of Inveetment Returne
For the Period Ending September 30, 2012
Inveatment Style Incepllon
~~!t<~~~i~·;ti':,
3-Monlha VTD FYTD Prellmlnery Annuellzed
l-Vear I 3-Veara I 5-Veara 61nce 11-Vr Statual WetchI Inl!Dntlnn VA. ~tAtUA IP _0_
Real Estate Jul·121 425,000 1,464,288 ,.<..,......,.. :,.10;0: PEiRE -4.25
-4.25
2.68 -6.93
NJAINJA
NJA
NJA
-4.251-4.25
2.68 -6.93
NJAI NJAINJA NJA NJANJA
NJA NJA NJA NJA NJA NJA
-4.25
-4.25
2.88 -6.93
IAlmanec Realty (Groaa)(lQI2)
Almanac Really (Net)
~: NCREIF Index (lagged)
Value Added
6ub-total Real Eatate (Gross)
Sub-total Real Eatata (Nat)
Benchmar1l NCREIF Prop 1Q Aneara
Value Added ~~:..:.~ :.. '.:'.::~:f':.-~- .. -t,'-?::'~~ ..;;',.
2.81 5.95 13.83 13.83 11.55 1.07 Above
2.53 5.27 12.33 12.33 10.30 0.14
2,88 8.46 2.88 12.04 8.82 2.51
-0.16 -3.19 9.85 0.29 1.48 -2.37
~;:_:.{',,~<~}>~~.:/ :~_:;::~..f4;~~, \' ~:·::~;·:~~a/D/~ <'. I',{~
Gatewey - Active (Groaa)
Gateway - AcUve (Nat)
Benchmark: S&P 500 Buy·Write Index
Value Added
Gatewey - Paaslve (Gross)
Gateway - Paaaive (Net)
Benchmark: S&P 500 Buy-Write Index
Value Added
Covered Call
Covered caU
May-12
May-12
78,500,000 'f" 63,896,774 /'.,U,:" 1.01 3.50 6.82 3.50 NJA NJA NJA 6.82
~ ,: 1.01 3.49 6.82 3.49 NJA NJA NJA 6.79 .(~ 0.83 2.98 6.74 2.98 NJA NJA NJA 6.74
i',: 0.18 0.51 0.08 0.51 NJA NJA NJA 0.05 . --- -- "~
;;\' 334,265,748 0.79
0.78
2.92
2.89
6.58
6.58
2.92
2.92
NJA
NJA
NJA
NJA
NJA
NJA
6.58
6.45
I<i: 1.-': 0.83 2.98 6.74 2.98 NJA NJA NJA 6.74 ~ -0,05 -0.09 -0.16 -0.08 NJA NJA NJA -0.29
Sub-total Covered Calla (Net)
Sub-total Covered Calla (Groaa)
' 418,182,522
Benchmar1l S&P Buy-Write Index Value Added I· 0>
'j.,
Cosh"Rellrement"" ";'.,~',. 'J~:'.\?.:•. :i::;::;',:'.';0::/.';:": ~.: <'i.e.';::':-";·>, "::.:"';,.,,/IN,f"Y./iIJ .'",i{:,:",: ;,.' Tr8nsIUon'~;;·\'.~G··; 1';';-': ."::', ;;::::.~~:.> ;;:::;. ::,~'.;:-~I,:'!~.;:',,; ,~:.-~:,,:');. i,:,r,?, .~-: t"(:.
;~,;i'i::~:';;J:;:iroTAt:REiiREMENT,'FUNDi'~;j
co WATER AND POWER EMPLOVEES' RETIREMENT PLAN AND RETIREE HEALTH BENEFITS FUND0) SCHEDULE OF RELATIVE RETURN - NET OF MANAGEMENT FEES (QUARTERL V ONLV)
-- .-..__. --, -_.~ SeDlemb
0,83 3.03 8.63 3,03 NJA NJA NJA
0.831 0.83
3.031 2.98
8.821 8.74
3.031 2.98
NlAI NJA
NJAI NJA
NJA NJA
-0.00 0.05 -0.12 0.05 NJA NlA NJA :~.n:1.09I,/{·t;'>;',;·';;;I;i';:'}'::+:'C.-':'
;'::~{I:. <;;', r,i:·;:~~:~K'··:-·
Net Return
Portfolio Return
Gross Return (Source: BNV MeDon) Less: EstJrnated Manaaement Fees
As..tCleaa(ll1)
Fixed Income 125%)
9.88
cal-Veer
lQ.15
0.27
15.47
l-Vear
15.74 0.27
8.19
SoVear
8.45 0.26
2.04
5-Veer
2.29 0.25
9.48
la-Vear
9.&9 0.21
MSCI ACWxUS·IMI Net III
Polley Index - Groaa
BarclaYa caoital US Universal
Intematlonal EQuity 121 %) 10.69 14.38
4.93 6.45
3.49
6.70
/3.65
6.63
10.21
5.74
Russell 3000 Index Pert Domestic EQuity (34 % 16.13 30.20 13.26 1.30 6.49
NCREIF Pmo 1Q Arrears Real Eslate (4 % 8.46 12.04 6.82 2.51 8.29
CA PE VC BlendlRussell 3000+3% 1111 Private EQuitv (4% 24.73 30.88 23.94 10.32· NJA
CG 3·Month US T·BIII + 3% Real Ratum (6% 2.31 3.05 3.09 3.64 NJA
CBOE sap SOO Buy-Wrile Covered Calls 15%\ 6.74 NJA NJA NJA NJA
CG 3·Month US T-Bill Cash /1%\ 0.05 0.05 0.09 0.64 1.73
Weighted Polley Relum (allocation targets
RelaUve Return - Nat of Feea
Total 100% 10.42 18.90
10.54 /1.43
9.07
/o.e8
2.40
/0.38
7.70
1.78 (0 Intemational Benchmarks MSCI Worid Ex-US IMI, MSCI Emerging IMI, and MSCI ACWI Ex·US IMI were revised to show 'Net Dividends" elleellve September 30,2010. (ii) Private Equity BlendlRusseU 3000+3% Inde' was modilled ellective Oct. 1, 2011. Index retum as 01 June 30, 2012. . iii) Asset allocation based on New Evolvlna PoUCy /Option 2) effective April 1, 2012lhru Jun. 30, 2013.
Not.a: All manager lees are estimated. Value added Is based on net 01 'ee returns vs. the benchmarks. Sourca: BNV Weslem Trust Company (prior to December 31,2004); Mellon Biml< (alter Decembsr 31,2004).. . Retirement Plan Policy Benchmark Is comprised 01: 25% Barclays capital Univ; 21% MSCI ACWxUS IMI NO"; 34% Russell 3000; 6% T Bllls+3%; and I'll. T Bills; 4% NCREIF;
4% CA PElVC Blend plus Russel/3000+3%, and 5% S&P BuyWrite. The new Retiremenl Plan Policy Benchmark aliocaUon wasmodllled effective April 1, 2012 thru June 30, 2013. Health Plan Policy Benchmark is comprised of : 26% Barclays Capilal Unlv; 21 % MSCI ACWxUS IMI NO'; 35% Russell 3000; 6% T Bllls+3%,.and 1% T Bills; 3% NCRElF;
3% CA PElVC Blend p1ua RusseI13000t3%, and 5% S&P BuyWrite. The new Health Plan Polley Benchmark allocallon was modilled effeeUve April 1, 2012 thru June 30, 2013. Policy Benchmark lor Total Non US Equity was replaced by MSCI ACWI ex US IMI effective January 1, 2009. Intematlonal Benchmarks MSCI Worid Ex-US IMI, MSCI Emerging IMI, and MSCI ACWI Ex-US 1M! were revised 10 show "Net Dividends" effective September 30, 2010. Private Equity Benchmark LOWGXPE3BLNO rellects both Cambridge PENC lrom inception thru .Sept., 2011 and Russell 3000+3% from Oct. 2011 Ihru current (one-quartar-In-arrears)
Page 4 of 8
rdY

Water and Power Employees Retirement Plan Preliminary Summary of Invaslmanl Ralurns
CD Q)
C1I
Jan. 2012:
May 2012
Aug. 2012
Watch Status P,O,T(a)
lOW
Balow
Above
ow NlA 6.461 I May 2012 ' NlA 10.58 NlA -4.12
0.88 2.41 Below .0.75 2.28 1.30 2.62
-0.55 -0.34
For Ihe Period Endlna Saalember 30. 2012
maU Cap Growth-C I Apr-TIl NlA NlA NlA
12.73
] I I I n 2. 63
1 6. 65
1 15.01
1 6.551 29.21
1 12.62
2.63 , 6.23 16.13 6.23 30.20 13.26 0.00 0.32 -0.12 0.32 -0.99 -0.64
"::::;;;:~~;
4,6 18.05 4.9 20.86 4.78 4.13 4.87 17.74 4.87 20.44 3.52 3.24 7.45 10_16 7.45 13.64 2.86' 0.89 ·2.59 7.58 -2.59 6.80 0.66
Sep-091 39,400,000 H 97,1051":;cO,01%P;;}1~,;;i"1~Y 1.58 3.56 0.09 3.56 1.17 -2.75 1.55 3.47 -0.17 3.47 0.82 -3.80 3.24 7.45 10.16 7.45 13.64 2.86
·1.69 -3.98 -10.33 -3.98 -12.82 ·6.66 sop-091 40,100,000 II 64,481.1021 :~.01%1 iii?!:!:::::';?; 2.97 7.20 11.27 7.20 15.31 4.49
2.94 7.12 11.03 7.12 14.99 4.17 3.24 7.45 10.16 7.45 ' 13.64 2.86
-0.30 -0.33 0.87 -0.33 1.35 1.31 Devsloped Growth-S I Aug-121 68,200,000 vi 72,652,0591,:g;5.~~~Ir~;'g!;;ifj; 2.90 NlA NlA NlA NlA NlA
2.87 NlA NlA NlA NlA NlA 3.24 NlA NlA NlA NlA NlA
-0.38 NlA NlA NlA NlA NlA Developed Growth-S I Sep-121 80,000,000 I: I 8O.041.9791:;·4:Eg%l';~j;;,)'1i1~; NlA NlA NlA NlA NlA NlA
NlA NlA NlA NlA NlA NlA NlA NlA NlA NlA NlA NlA NlA NlA NlA NlA NlA NlA NlA NlA NlA NlA NlA NlA NlA NlA NlA NlA NlA NlA NlA NlA NlA NlA NlA NlA NlA NlA NlA NlA NlA NlA
:1 2tJ4,;S~g,fU4 4.34 7.69 7.28 7.59 9.84 1.43
~,
4.33 7.67 7.22 7.67 9.n 1.37r; 3.89 7.64 10.69 7.54 14.36 3.49
t~ 0.44 0.03 -3.47 0.03 -4.69 -2,12
Note.: ,"5' lor Separate Account
"C' for CommIngled Account
"NlA" - RecenUy Iunded accounts and no pertonnance avallable for Ihl. period. ia) Watch'Slatus rp' due to Pertonnance; '0" due to Organizational Change,"T" for Tenninated account; and "R" for Rehired)
(b) Net relurns are esllmated based on contractual lees schedule.
(c) Includes Intemallonal Developed and Emerging Markets Transilion accounts for $0.2M and $33.2M, respecllvely.
Page 5 of 8 @

Water and Power Employees Retirement Plan Preliminary Summary of Invaatmant Raturna For the Period Ending September 30, 2012
Preliminary Annualized Invastment Style IlncepUon Iincepuon Markat FYTD I l-Year I 3-Yeara I fi.Years I Since 11-Yr Status vS'1 Watch Status
Date Current Market 1;~~f:l:'1t li'~I!'~;::1 Month 13-Months I YTD
Inception Benchmartt P, 0, T (a) Value Value Portfolio' 'Targets' Ending Ending
i:~ed'I~~O~·Mil~ii~;~i}~<;;V"~'!'i.;:c':::1.t; 'f~~9: Core FI-g Apr-HI 154,5lllJ,llllO 168,llS1,7-rg 0.34 .8 5.llll 1.851' 6:4' N1A N1A 7:09 Above
0.33 1.83 5.01 1.83 6.31 NJA NJA 6.99 0.14 1.59 3.99 1.59 5.16 NJA NJA 6.40 0.19 0.24 1.02 0.24 1.15 NJA NJA 0.59 0.57 2.39 5.93 2.311 7.44 7.78 8.42 8.06 Aboveore 0.56 2.36 5.84 2.38 7.32 7.66 8.30 7.94 0.14 1.59 3.99 1.59 5.16 6.19 6.53 6.35 0.42 0.77 1.85 0.77 2.16 1.47 1.77 1.59
IWelia1I1Ilnvrerd-(Groee) I High Y1eld-S T0.87 4.0' In:76 4.01 16.73 9.86 NJA 9.86 BelowSep-09 44,l4O-;-31832.800.0001'~ July 2011
~: BC High Yield Index 0.83 3.90 10.42 3.90 16.27 8.48 NJA 9.40Welle High Yield (Net) (b)
R1.39 4.53 12.13 4.53 19.37 12.90 NJA 12.90 -0.56 -0.64 -1.72 -0.64 -3.10 -4.42 NJA -3.50 Nov. 2011
Sub-total Fixed Income (Gross) ValuaAddad
0.51 2.34 6.04 2.34 7.85 7.63 8.38 8.02 Above Sub-tolal Fixed Income (Net)
382,773,593 0.51 2.33 6.00 2.33 7.81 7.58 8.32 7.96
Benchmark Barclaya Capital Aggregate 0.29 2.00 4.93 2.00 8.45 6.70 6.63 8.42 Added Value . ~ 0.22 0.33 1.07 0.33 1.36 0.88 1.69 1.64
.. R'~i:R~t~~r{M~ri~~~\:~I;~;~~~;%~;;:~::!~}t~X;~~:!\~:~:~ ~~j5 :r~t:r;~ft;~B;:Y~~!/~~~~~:I?j.fi:::t.f~~~!t~:1 ?t~%.tK~~~Y;;,;~~::;1'::A:~~~<I~.·i Above P
Nov. 2011
co Q)
m
Sub-total Real Return (Net) IBenchmark CG 3-ma US T-BIII+3% Value Added
I I 1..·.;1:.
. "
70,523,383
9,
;:'}5;48% ;k6.00%
-0.31 1
0.25 -0.56
1.381
0.76 0.62
3.91 1
2.31 1.60
1.381
0.76 0.62
8.731
3.05 3.68
5.091
3.09 2.00
NJAINJA NJA
7.713.12 4.59
Above
Below
Ifelow
1,400,000 ~ . "'.'
',; Encap II ross 1012 300,000 m Encap VIII (Net) .:~; CA PENC Blend plus RusseU3000+3% . ;. Value Added I .-.
1.867'122ILi?~·1:5t1r':':~{i:{~~n ;;!;:~·:;:i:~.:. '.;.·.z~fil'.;.·".,,!,;.;.,. ,,; .., •.......:, .it:. ,,-- :i."
785,5191'.': o.Q6%!":t..:?'J'S ·::'r~(.i:·'i:· ·:;.\t-:',5.· ''''':;•.''''.;:';-';:: ".'?;... >f:.;:.:: ......··•.. v-;.' :.,:",,:.,.....
,g:~1 -2.702.36
~:~~I 24.73
·22.06
f38ffi -2.705.34
76.051 82.31 -2.70 65.01
r:1 30.86
-28.24
76.051 62.31 30.88 31.43
~:~~1 23.94
-21.93
NJAI NJA NJA NJA
~I NJANJA
NJAI NJA NJA NJA
1~:~~ 10.93-4.26
74.11 52.92 30.69 22.23
Below
Above
Below
Vista IV (Nel) I ~: CA PENC SIena piUS Mussell "UUU+"~10 Value Added
Sub-Iolal Private Equity (Gross) Sub-total Private Equity (Net) Cembrldge PENC BlendlRuaaeIl3000+3% Added Value I
I I I . I
10,149,553 .
-~.tV 1.96 2.59 1.81
-2.70 4.51
~~.,,, -27.21
7.79 8.14
24,73 -18.59
-~.,u -5.93 14.63 10.16 -2.70 12.88
1'411"\
NJA 14.63 10.16 30.88
-20.72
NlI'\
NJA 21.27 14.34 23.94 -8.60
Nfl'\
NJA NlA NlA NlA NlA
""V.DO
-37.69 22.66 15.08 13.18 1.90
Below
Notes: 's' for Separate Account 'C" lor ConvnIngled Account
'NJA' - Recanlly funded accounts and no performance avaUable lor IIlls period. 'PEJRE' - Private equily and real aslate Invaslments ratums ara provided quarterly (Source: Prlvate I) (a) Watch Slatus ('P' due 10 Perlonnance; '0' due to Organizallonal Changa. 'T' for Tanninatad account; and 'R' for Rehired)
(b) Net returns are estimated based on contractual fees schedule. Page 6 of 8
(f)

Water and Power Employeea Retirement Plan Preliminary Summary of Investmant Returns For the Period Ending September 30, 2012
co Q)
.......
Paga 7 of 8
rb
Sub-total RaaJ Eatata (Gross) SUb-total RaaJ Estale (Nell Benchmark NCREIF Prop 10 Arraars Added Value
Covered Calls:." ,:,,'.:, "" - ''','''',' "...·IT ':<i':":...... "'>;u";;", ,:'1':;;:,;,,;(,;;,0,/
Inveslmant Style Current Msrkel I~~~f:r!>tl!"';'~!C>~';;; Month I3-Months VsluePortfollo' :Targsts'; Ending Ending
812,865 I.: :O:O~&
AIlove
Below
0" ."._,;-", ,::'> :,'\::,--l:::,.) )":';':'","
Above
Above
Since 11-vr Stalus vs'1 Wslch Stalus Incepllon Benchmark P, 0, T (a)
5-Vaare nuallzed
,.,.. ,""
NlA NlA N/A
13.02 11.16 8.82 2.33
Preliminary 1-Vear I 3-VaarsFYTOVTO
Sic ;'';'':,:'':' ':;1Af'~;::~"}1~
9,76 19,58 19.58 4.69 8.91 17.56 17,56 2,68 8,46 2.68 12.04 2.01 0.45 14,68 5,52 6.22 13,93 29.53 29.53 5,51 11,91 25,61 25.61 2,68 8.46 2,68 . 12.04 2.83 3.45 22.93 13.57 6.23 13.12 37.66 37.66 5.65 11.78 35.27 35.27 2.68 8.46 2.68 12.04 - -- 3.32 32.59 23.23
3.28 8.00 8.00 1.40 2.81 7.00 7.00 2.68 8.46 2.68 12.04
·1.28 -5.65 4.32 ·5,04 6.46 ,10.76 12.72 NlA 5.74 9.68 11.41 NlA 2.68 8,46 2.68 NlA 3.06 1.22 8.73 NlA 3,03 N/A ~.02 NJA 2.21 N/A 2.21 NlA 2.68 N/A 2.68 NlA
-4.89 NlA -0.47 NlA 5.79 NJA 5.79 NlA 5.79 N/A 5.79 NlA 2.68 NlA 2.68 NJA 3.11 NJA 3.11 NJA
-0.12 NJA -0.12 ~~-0.12 NlA -0.12
2.68 N/A 2.68 N/A ~.80 N/A -2.80 N/A 4.25 NlA ·4.25
~~-4.25 NlA
-6.93 NlA 3.07 5.82 12.76 12.76 2.73 4.90 11.05 11.05
12.04
fc[PE7RE
Inception IInception Markst
-4.25 NlA 2.68 NJA 2.68
·6,93 NJA
2.68 8.46 2.68 0.05 -3.56 8.37 -0.99
~);'.;.::;>'/'''' <;'{~~>;' ;
l'E7RE
PEJRE
1,n-6,875 I I PEJRE
I PEJRE
I I'ElRE'
-;.>
AI' pElAE I ".~fl1.63
I
Rsal Eslate I Jul.12! 47,000 I" 162,696
623,013
363,198 1,
,790,
1,090,205
1,096,731
5,283,461
12,859,868
Dale Value
RaaJ Eslate an- 0 1,200,000
200,000
300,000
:i:'
'.i
one Star II (Gross) (1012) Lone Star II (Net)
Benchmar1<: NCREIF Index Oegged) Value Added
Blackstone (Gross) (1012) Blackstone (Nel) ~: NCREIF Index (Iaggad) Value Added
ORA GrowIh (Oross) (1012) ORA Growth (Nat) ~: NCREIF Index Qegged) Value Added
nvesco Core RE (Gross) (1012) Invesco Core RE (Net) ~: NCREIF Index Oagged) Value Added
Lone Star VII (Gross) (1012) Lone Star VII (Net) ~: NCREIF Index (lagged) Value Added
ii.;.il'·E~b.t~M;;:ri;~iaiiiIQ;:;.irt~ii.lii~;;dI:i!0~\ >'45
lAG Core (Gross) (1012) AG Core (Net) ~: NCREIF Index (lsgged) Value Added
IPCCP (Gross) (1012) PCCP(Net)
Benchmark: NCREIF Index (lagged) Value Added
IAlmanac Reslty(Grossj (1012) Almanac Raalty (Net) ~: NCREIF Index (lagged) Value Added
IMesa West (Gross) (1012) Mesa West (Net) ~: NCREIF Index (lagged) Value Added
Gatsway - Active (Gross) Coverad Call May-12 12,100,000 12,967,611 1.00 3.48 6,81 3,48 NlA NJA NJA Gateway - Active (Net) 1.00 3.47 5.91 3.47 NJA .NlA NlA
6.81
Benchma!1<: S&P 500 Buy-Witte Index ".y.. , 0.83 2.98 6.74 2.98 NlA NlA N/A Value Added 0.17 0,49 4.52 0.49 NlA NJA NlA
6.74
Gatswsy - Passive (Gross) Covered call May·12 48,500,000 51,680,609 0.79 2.92 6.59 2.92 NJA N/A NlA Gateway - Passive (Net) ':T 0.78 2.89 6.64 2,89 NlA NlA NlA
6.59
Bsnchmsrlc S&P 500 Buy-Witte Index 0.83 2.98 6.74 2.98 NlA N/A N/A Value Added -0.05 -0.09 4.25 -0.09 NlA NlA N/A
6.74
8.78
0.04
6.46
-0.28
~,.~;; ;..~\:;::..:y~.:~. -,": I;:';':-;~'~ ~;;::';;;:,j-;;~(:
6,83 Sub-total Covared Calls (Nat) 0.83 3.03 6.63 3.03 NJA NlA NlA
""', ;. '-,";1,',:;1',.:,<:",:1:,,:,\':,"0'::,'..1':' ,';':;::"',::1" ::'.!', .,", :.' ,,': :';J,
6.62 6.74
-0.12 -;:',;:3.031 :'~ :")'~:":':.':::~ ";~'; ~!.~\',:'~ I~';;2;.;q·i~ t'·:~ ~V-)_~i:}'
1,286,266,187 r;) ;;:"1'oO%I'iii:3~%TOTAL RETIREE HEALTH FUND
Cssh: RetlrM,HlialW\;:,,):Y·' .:c, ''''<'''{',hi'j.. ~" '1 i'ok "''':0:93%1~''':,1 :00%1, '-:"·O:02I?"';",//O.1.1 ke:,; ·0.59kf;iJj" o.ifhii;{;0,75 Ff:!~:,';3: 171::' :'f,~,2.68·· 'Trimsltlcin"'St',':,,'h:,:';': \::1.' ;:' ..''',:'' .. :.:. "::'Ye' ';,/0;18%
Sub-total Covared Calls (Gross) 64,648,220 0.831 3.031 6.631 3.031 NJAI NJAI NlA
Benchmark S&P Buy-Write Index 0.83 2.98 6.74 2.98 NlA NlA NlA Valua Addad -0.00 0.05 4.40 0.05 NlA NlA NlA
Notes: "N/A" • RscenUy Iundad B<'COunts and no performance available lor II1ls psltod. "PElRE"· Prlvate equity and raaJ astalli Investments retums SIS provided quarterly (IRR Net 01 lees). (a) WatCh Slatus ("P' due 10 Performance; "0' due to Organizational Changs, '1' lor Terminated account; and"R" for Rehired)
~
Water and Power Employees Retirement Plan Preliminary Summary of Investment Returns For the Period Ending August 31,2012
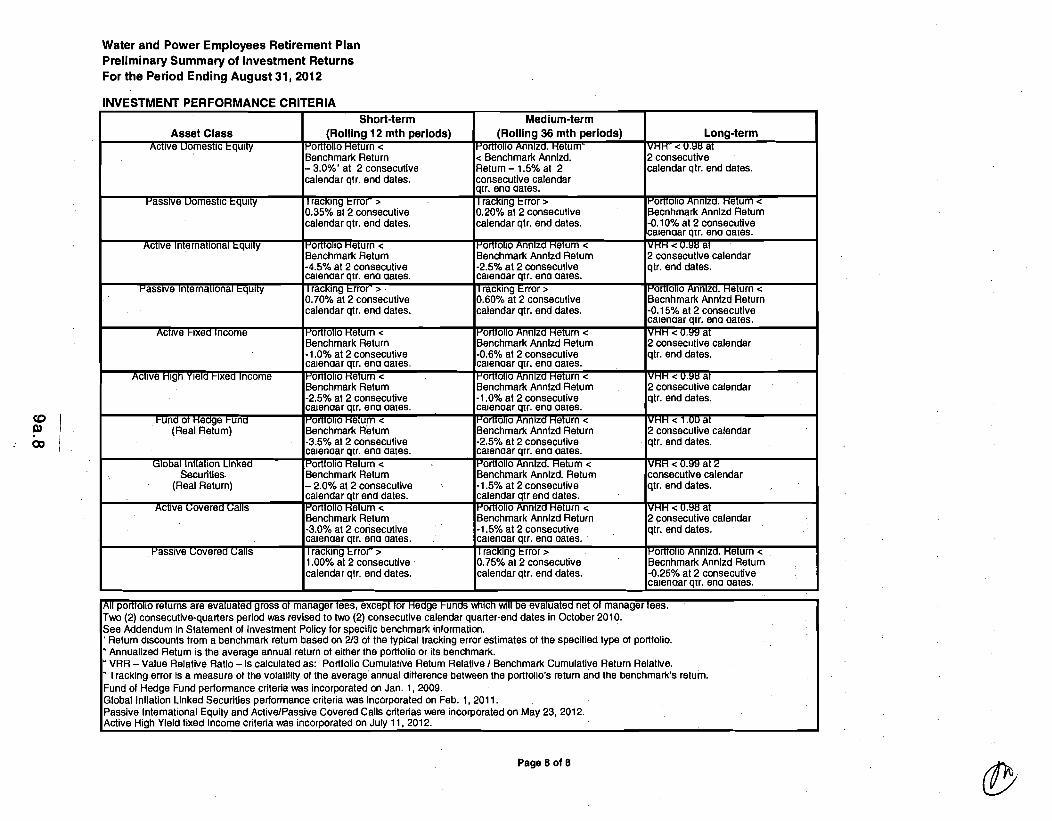
INVESTMENT PERFORMANCE CRITERIA Short-term Medium-term
Asset Class (Roiling 12 mth periods) (Roiling 36 mth periods) Long-term I\CllVe uomesllc ~quny 1"'01110110 Helurn < II"'0mOliO I\nnlza. Helurn VHH~ < U.l:Ill al
Benchmark Return < Benchmark Annlzd. 2 consecutive - 3.0%' at 2 consecutive Return 1.5% at 2 calendar qtr. end dates. calendar qtr. end dates. consecutive calendar
qlr. ena aales. t"'asslve uomesllc ~qullY I raCKing ~rror >
0.35% at 2 consecutive II raCKing ~rror > 0.20% at 2 consecullve
omollo I\nnlzo. HelUrn < Becnhmark Annlzd Return
calendar qtr. end dates. calendar qtr. end dates. -0.10% at2 consecutive calenaar qlr. ena aales.
ACIlve InlernaliOnal ~quny 1"'01110110 Helurn < 11"'01110110 I\nnlza HelUrn < VHH < U.l:Ill al Benchmark Return Benchmark Annlzd Return 2 consecutive calendar -4.5% at 2 consecutive calenaar qlr. ena aales.
-2.5% at 2 consecutive calenaar qlr. ena aales.
qtr. end dates.
l"'aSSlve Imernallonal ~quny I raCKing ~rror >. I raCKing ~rror > 11"'01110110 I\nnlza. Helurn < 0.70% at 2 consecutive 0.60% at 2 consecutive Becnhmark Annlzd Return calendar qtr. end dates. calendar qtr. end dates. -0.15% at 2 consecutive
calenaar qlr. ena aales. ACllve r-Ixea Income 1"'01110110 Helurn < 01110110 AnniZa Helurn < IVHH < U.l:Il:I al
Benchmark Return Benchmark Annlzd Return 2 consecutive calendar -1.0% at2 consecutive calenaar qu. ena aales.
-0.6% at 2 consecutive calenaar qlr. ena aales.
qtr. end dates.
ACIlve Hlgn Ylela r-Ixea Income 11"'0010110 Helurn < 11-'0"'0110 AnniZa Helurn < IVHH < U.l:Itl al Benchmark Return Benchmark Annlzd Return 2 consecutive calendar -2.5% at 2 consecutive calenaar qlr. ena aales.
-1.0% at2 consecutive calenaar qlr. ena aales.
qtr. end dates.
. r-una 01 Heage r-uno omOIiO Melurn < 1"'0",0110 Annlza Helurn < IVHH < 1.UU al (Real Return) Benchmark Return Benchmark Annlzd Return 2 consecutive calendar
-3.5% at 2 consecutive calenaar qlr. ena aales.
-2.5% at 2 consecutive calenaar qlr. ena aales.
. qtr. end dates.
I.:IIOOal muallon LInKeo 1"'01110110 Helurn < 1-'0010110 I\nnlza. Helum < IVHH < U.!l!l at 2 Securities Benchmark Return Benchmark Annlzd. Return consecutive calendar
(Real Return) - 2.0% at 2 consecutive calendar qtr end dates.
-1.5% at2 consecutive calendar qtr end dates.
qtr. end dates.
I\Cllve voverea valiS 01110110 Helurn < 01110110 I\nnlza Helurn < IVHH < U.l:Ill al Benchmark Return Benchmark Annlzd Return 2 consecutive calendar -3.0% at 2 consecutive calenaar qu. ana aales.
-1.5% at 2 consecutive calenaar qlr. ena aales..
qtr. end dates.
.l-'aSSlve voverea valiS. II raCKing ~rror > 1.00% at 2 consecutive'
I raCKing ~ rror > 0.75% at2 consecutive
11"'01110110 Anmza. HelUrn < . Becnhmark Annlzd Return
calendar qtr. end dates. calendar qtr. end dates. -0.25% at 2 consecutive calenaar.qlr. ena aales.
co PJ (X)
IAII portfolio returns are evaluated gross of manager fees, except for Hedge Funds wtIich Will be evaluated net Of manager fees. Two (2) consecutive-quarters period was revised to two (2) consecullve calendar quarter-end dates in October 2010. See Addendum In Statement of Investment Policy for specific benchmark information. ~. , Return discounts trom a benchmark return based on 2/3 ot the typical tracking error estimates otthe specitied type ot porttolio. • Annualized Return is the average annual return ot either the porttolio or its benchmark. I" VRR - Value Relative Ratio - Is calculated as: Portfolio Cumulative Return Relative / Benchmark Cumulative Return Relallve. • Tracking error is a measure otthe vOlatility or the average annual dillerence between the porttOliO's return and the benchmark's return. Fund of Hedge Fund performance criteria was incorporated on Jan. 1, 2009. Global Inflation Linked Securities performance criteria was Incorporated on Feb. 1, 2011. Passive International EqUity and Active/Passive Covered Calls criterias were incorporated on May 23,2012. Active High Yield tixed Income criteria was incorporated on July 11,2012.
Page 8 of 8
(/!:I

MONTHLY REPORT OF INVESTMENT MANAGERS ON WATCH*
Return vs. Benchmark Since Watch As of September 30, 2012
Performance Since Beain Watch Status'
Portfolio Style Group Concern Begin Watch
Status Last
Reviewed First
Month First 3 Months
First 6 Months
First 9 Months
First 12 Months
Since Placed on Watch
co p)
CO
N/M
10.3Small Cap Growth
Russell 2000 Growth
Tbills + 3 %
Hedge FOFs
Large Cap Growth
Russell 1000 Growth
Large Cap Value
Russell 1000 Large Cap Value
Large Cap Growth
Russell 1000 Growth
Russell 2000 Growth
Russell 1000 Growth
Tbills + 3 %/\
Aetos vs. Target
Fred Alger vs. Target
Frontier vs. Target
:·;'~~3mi~j&:~H~~JI)~>"... " 6.7
Loomis Sayles vs. N/M BC High Yield High Yield 2.1 5.3
BC High Yield N/M N/MTaraet
'Flnal performance data through 9/30/12 provided by LDZ, and preliminary performance data through 9130/12 provided by Mellon. "Performance data from manager, net of fees. Periods marked as '•••' do not Indicate that returns are not available for these periods; only that the manager in question has not been on watch status for these periods. Periods marked as "N/M" indicate returns are not meaningful enough to fairly Judge investment performance.
@5?