© 2014 erica wallace gonzaga - university of...
TRANSCRIPT

PHOTOCATALYTIC REDUCTION OF TRACE AQUEOUS MERCURY USING A VISIBLE LIGHT SOURCE
By
ERICA WALLACE GONZAGA
A THESIS PRESENTED TO THE GRADUATE SCHOOL OF THE UNIVERSITY OF FLORIDA IN PARTIAL FULFILLMENT
OF THE REQUIREMENTS FOR THE DEGREE OF MASTER OF ENGINEERING
UNIVERSITY OF FLORIDA
2014
© 2014 Erica Wallace Gonzaga

To my family

4
ACKNOWLEDGMENTS
I would like to thank my advisor, Dr. David Mazyck, for opening the doors to
research and offering an opportunity to work with his graduate students when I will still
completing my undergraduate degree. I am also grateful for the guidance he has offered
in the past two years of graduate school. I would like to thank Dr. Jean-Claude
Bonzongo, Dr. Paul Chadik and Dr. Wolfgang Sigmund for serving on my committee.
I am grateful for the wonderful research team and colleagues that have helped
me throughout graduate school: Christine Valcarce, Amy Borello, Sanaa Jaman and
Ana Maria Hagan. Thank you to all CCI employees, especially Regina Rodriguez, for
offering assistance whenever I needed it. I am grateful for the help and hard work of my
undergraduate assistant Sutanya Singivipulya.
Lastly, I would like to thank my husband Luiz Gonzaga for being patient and
understanding. You have been the most supportive partner I could ask for and I am
grateful for having you in my life.
5
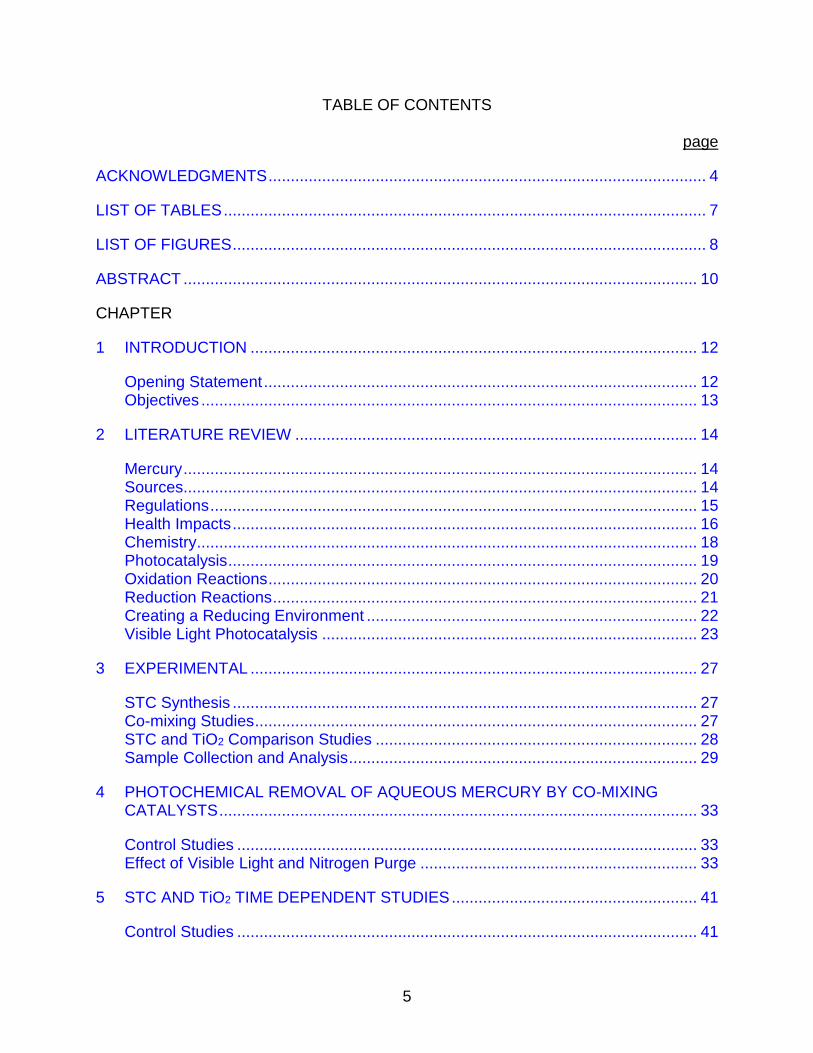
TABLE OF CONTENTS page
ACKNOWLEDGMENTS .................................................................................................. 4
LIST OF TABLES ............................................................................................................ 7
LIST OF FIGURES .......................................................................................................... 8
ABSTRACT ................................................................................................................... 10
CHAPTER
1 INTRODUCTION .................................................................................................... 12
Opening Statement ................................................................................................. 12 Objectives ............................................................................................................... 13
2 LITERATURE REVIEW .......................................................................................... 14
Mercury ................................................................................................................... 14 Sources ................................................................................................................... 14
Regulations ............................................................................................................. 15 Health Impacts ........................................................................................................ 16
Chemistry ................................................................................................................ 18 Photocatalysis ......................................................................................................... 19
Oxidation Reactions ................................................................................................ 20 Reduction Reactions ............................................................................................... 21 Creating a Reducing Environment .......................................................................... 22
Visible Light Photocatalysis .................................................................................... 23
3 EXPERIMENTAL .................................................................................................... 27
STC Synthesis ........................................................................................................ 27 Co-mixing Studies ................................................................................................... 27 STC and TiO2 Comparison Studies ........................................................................ 28
Sample Collection and Analysis .............................................................................. 29
4 PHOTOCHEMICAL REMOVAL OF AQUEOUS MERCURY BY CO-MIXING CATALYSTS ........................................................................................................... 33
Control Studies ....................................................................................................... 33
Effect of Visible Light and Nitrogen Purge .............................................................. 33
5 STC AND TiO2 TIME DEPENDENT STUDIES ....................................................... 41
Control Studies ....................................................................................................... 41

6
Effects of Formic Acid ............................................................................................. 41
Effects of Nitrogen Purge ........................................................................................ 42 TiO2 Comparison Studies ....................................................................................... 43
Comparison of Visible Light and UV 254 ................................................................ 43
6 OPTIMIZATION DOSE DEPENDENT STUDIES .................................................... 50
Control Studies and Dose Determination ................................................................ 50 Effect of Formic Acid ............................................................................................... 50 Effect of Nitrogen Purge.......................................................................................... 52
7 MERCURY CONCENTRATION DEPENDENT STUDIES ...................................... 60
Control Studies ....................................................................................................... 60
Comparison of Visible Light vs. UV 254 .................................................................. 60
8 CONCLUSIONS ..................................................................................................... 65
LIST OF REFERENCES ............................................................................................... 67
BIOGRAPHICAL SKETCH ............................................................................................ 72

7
LIST OF TABLES
Table page 2-1 Band gap energies for different photocatalysts................................................... 26
3-1 Catalyst Surface Characterization ...................................................................... 31
3-2 Equivalent catalyst dose. .................................................................................... 32
6-1 Catalyst doses for dose dependent studies. ....................................................... 54
8
LIST OF FIGURES
Figure page 3-1 Spectral power distribution provided by the manufacturer [57] ........................... 31
3-2 Visible light setup (profile view). ......................................................................... 31
3-3 Reactor setup employed in UV 254 studies ........................................................ 32
3-4 Experimental conditions for STC and TiO2 comparison studies. ........................ 32
4-1 Time dependent control studies in the absence of light ...................................... 37
4-2 Photoreduction of mercury using STC under visible light in the presence of formic acid. ......................................................................................................... 37
4-3 Photoreduction of mercury using WO3 under visible light in the presence of formic acid. ......................................................................................................... 38
4-4 Photoreduction of Hg: effects of co-mixing silica-titania composite and tungsten oxide in the presence of formic acid..................................................... 38
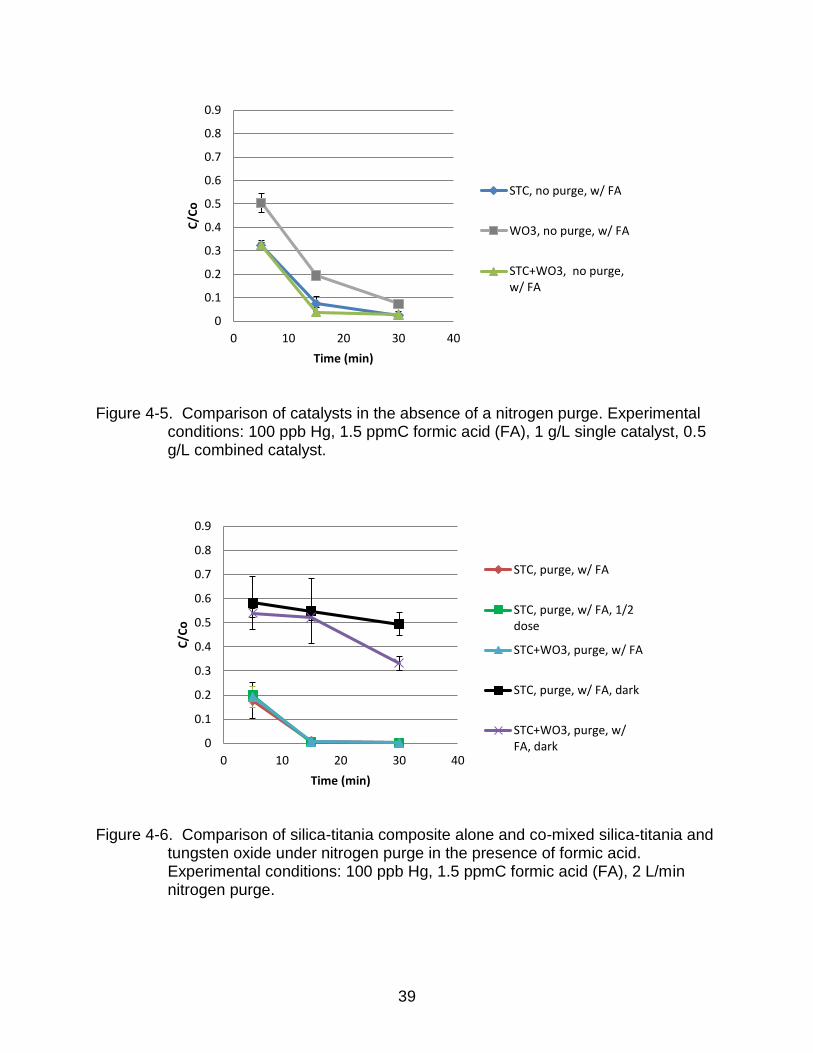
4-5 Comparison of catalysts in the absence of a nitrogen purge.. ............................ 39
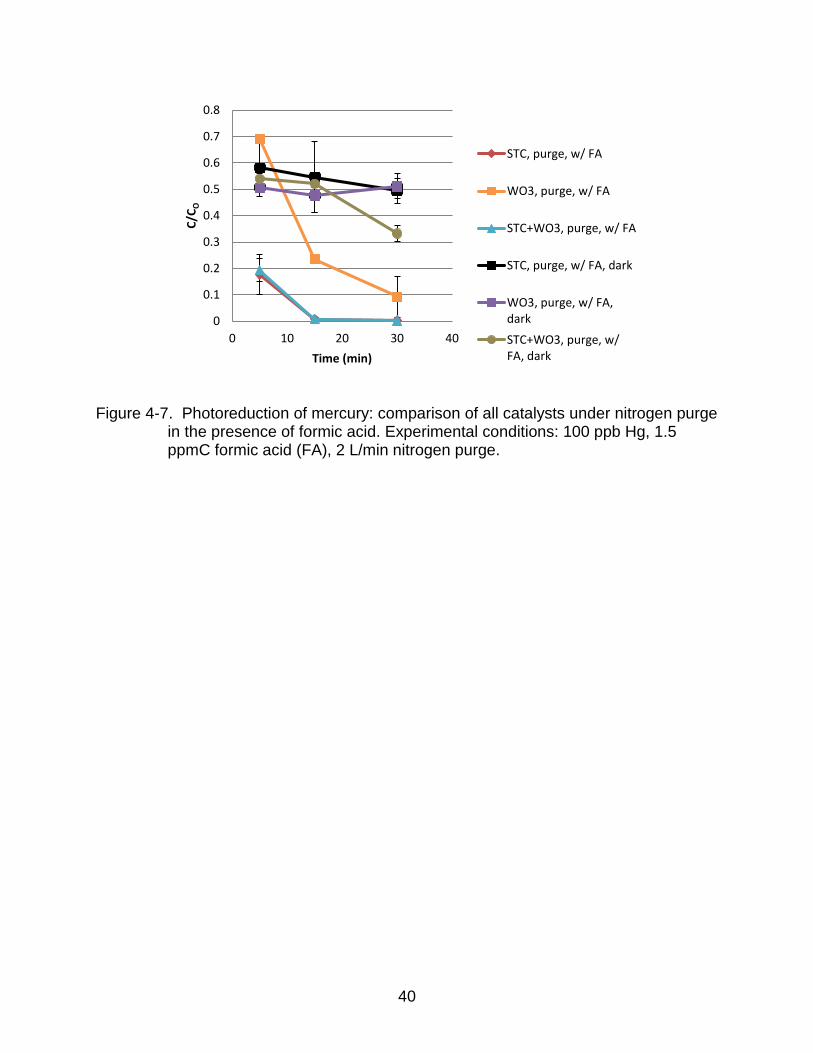
4-6 Comparison of silica-titania composite alone and co-mixed silica-titania and tungsten oxide under nitrogen purge in the presence of formic acid .................. 39
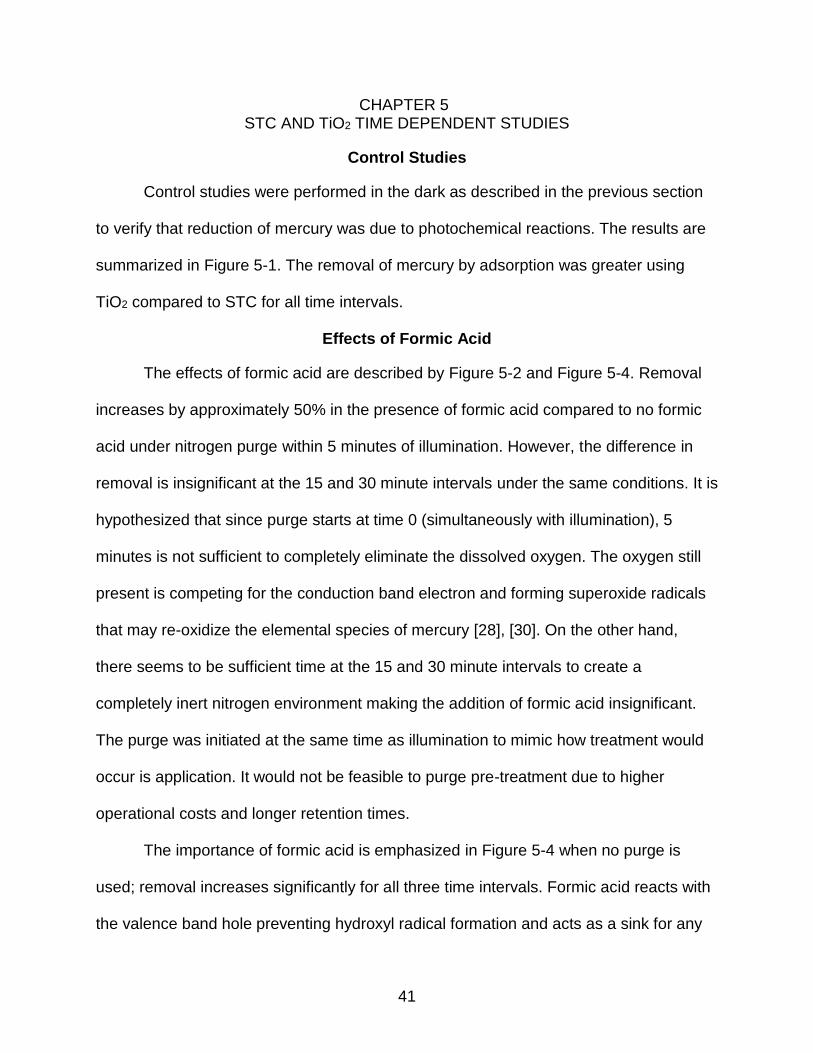
4-7 Photoreduction of mercury: comparison of all catalysts under nitrogen purge in the presence of formic acid ............................................................................. 40
5-1 STC and TiO2 time dependent control studies .................................................... 45
5-2 Photoreduction of mercury using STC under nitrogen purge. ............................. 45
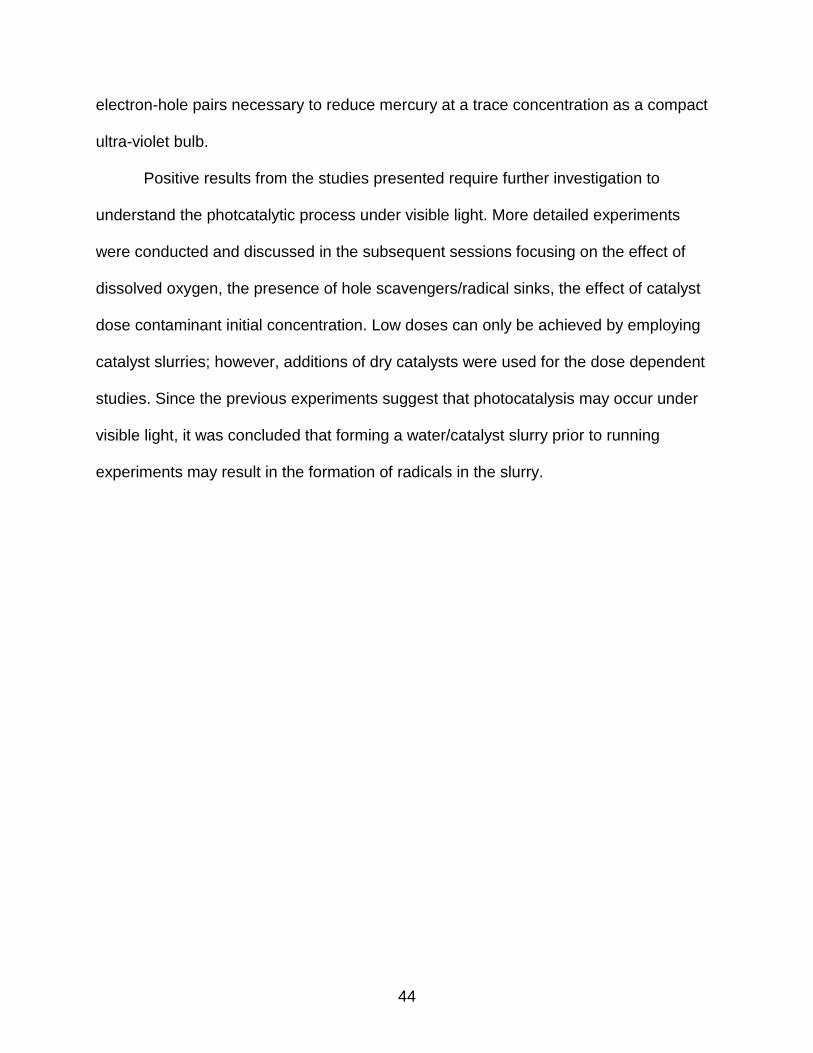
5-3 Mercury oxidation in the absence of formic acid. ................................................ 46
5-4 Photoreduction of mercury using STC without nitrogen purge ........................... 46
5-5 Photoreduction of mercury using STC in the presence of formic acid.. .............. 47
5-6 Photoreduction of mercury using STC without formic acid. ................................ 47
5-7 Comparison of STC and TiO2 with nitrogen purge and formic acid .................... 48
5-8 Photoreduction of mercury using TiO2 under nitrogen purge.. ............................ 48
5-9 Photoreduction of mercury using STC under visible and UV 254 light. .............. 49

9
6-1 Effects of formic acid on photoreduction of mercury using STC without a purge.. ................................................................................................................ 54
6-2 Effects of formic acid on photoreduction of mercury using STC under nitrogen purge. ................................................................................................... 55
6-3 Effects of formic acid on photoreduction of mercury using TiO2 without nitrogen purge. ................................................................................................... 55
6-4 Effects of formic acid on photoreduction of mercury using TiO2 under nitrogen purge.. .................................................................................................. 56
6-5 Effects of nitrogen purge on photoreduction of mercury using STC with formic acid. .................................................................................................................... 56
6-6 Effects of nitrogen purge on photoreduction of mercury using STC with no formic acid .......................................................................................................... 57
6-7 Effects of nitrogen purge of photoreduction of mercury using TiO2 with formic acid. .................................................................................................................... 57
6-8 Effects of nitrogen purge on photoreduction of mercury using TiO2 without formic acid. ......................................................................................................... 58
6-9 Photoreduction of mercury using STC: comparison on all scenarios. ................. 58
6-10 Photoreduction of mercury using TiO2: comparison of all scenarios. .................. 59
7-1 Mercury concentration dependent control studies.. ............................................ 62
7-2 Comparison of UV 254 vs. visible light using STC.. ............................................ 62
7-3 Comparison of UV 254 vs. visible light using TiO2 .............................................. 63
7-4 Comparison of visible light vs. UV 254 using STC at lower Hg concentrations .. 63
7-5 Representation of photocatalytic reduction of high concentrations of aqueous mercury. ............................................................................................................. 64
10
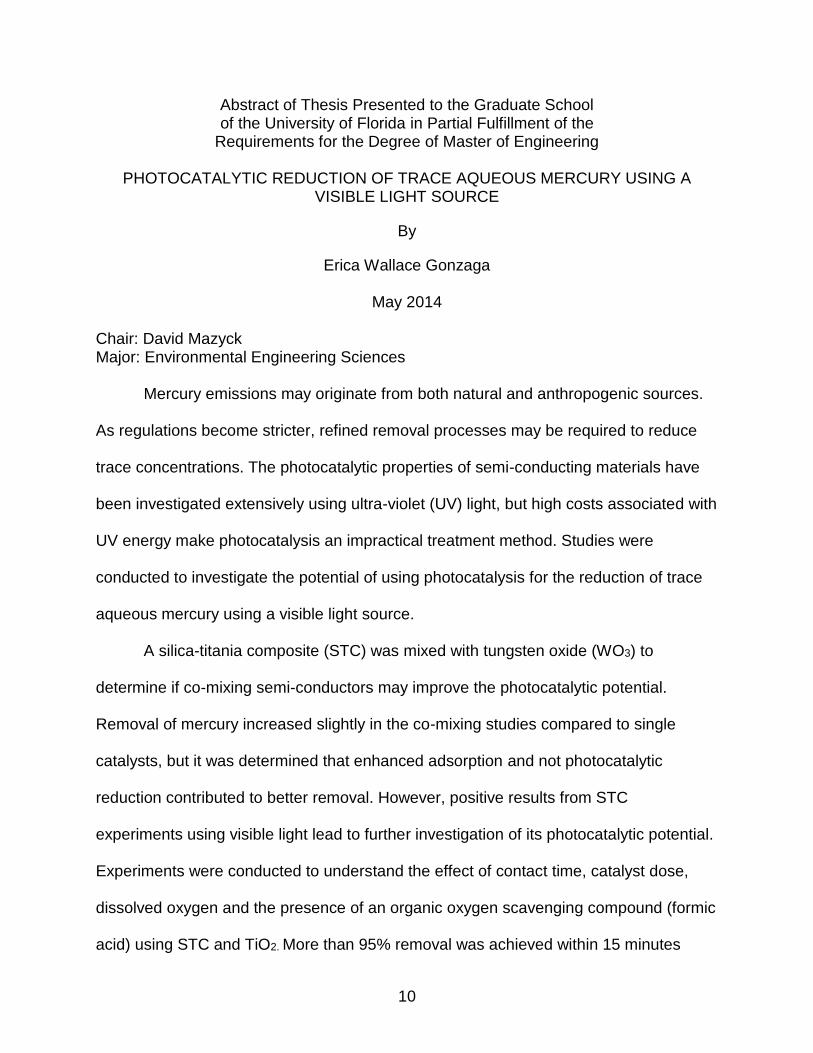
Abstract of Thesis Presented to the Graduate School of the University of Florida in Partial Fulfillment of the
Requirements for the Degree of Master of Engineering
PHOTOCATALYTIC REDUCTION OF TRACE AQUEOUS MERCURY USING A VISIBLE LIGHT SOURCE
By
Erica Wallace Gonzaga
May 2014
Chair: David Mazyck Major: Environmental Engineering Sciences
Mercury emissions may originate from both natural and anthropogenic sources.
As regulations become stricter, refined removal processes may be required to reduce
trace concentrations. The photocatalytic properties of semi-conducting materials have
been investigated extensively using ultra-violet (UV) light, but high costs associated with
UV energy make photocatalysis an impractical treatment method. Studies were
conducted to investigate the potential of using photocatalysis for the reduction of trace
aqueous mercury using a visible light source.
A silica-titania composite (STC) was mixed with tungsten oxide (WO3) to
determine if co-mixing semi-conductors may improve the photocatalytic potential.
Removal of mercury increased slightly in the co-mixing studies compared to single
catalysts, but it was determined that enhanced adsorption and not photocatalytic
reduction contributed to better removal. However, positive results from STC
experiments using visible light lead to further investigation of its photocatalytic potential.
Experiments were conducted to understand the effect of contact time, catalyst dose,
dissolved oxygen and the presence of an organic oxygen scavenging compound (formic
acid) using STC and TiO2. More than 95% removal was achieved within 15 minutes

11
using STC when formic acid and/or a nitrogen purge were utilized. Detailed 5 minute
experiments demonstrated that the presence of formic acid is the most important factor
affecting removal; acting as a radical a scavenger and preventing re-oxidation of
mercury. With formic acid present, reduction of mercury ranged between 82-98% for
different STC concentrations. The presence of dissolved oxygen affected removal
negatively only when formic acid was used; reducing removal by approximately 40%.
Lastly, the effect of initial concentration of mercury was investigated. Visible light
was effective at photoreducing mercury by more than 80% at low concentrations of 50
and 100 parts per billion using STC. There was no statistical difference between
removals with visible light compared to UV 254 nm at these concentrations. However,
removal rates decreased drastically as mercury concentrations increased to 500 and
1000 ppb as hypothesized. At 1000 ppb, mercury removal was only about 15% using
visible light compared to more than 95% using UV 254 nm. The reduction of mercury is
directly proportion to available electrons from the photocatalyst.

12
CHAPTER 1 INTRODUCTION
Opening Statement
The toxicity of mercury was first recognized in the early 1950s when a chemical
plant discharged an estimated 70-150 tons of inorganic mercury into Minamata Bay in
Japan. The fish in the bay displayed mercury concentrations of approximately 15 ppm
[1]. The local residents relied heavily on the consumption of fish and started developing
methylmercury poisoning symptoms. Some of these symptoms included impairment of
speech, muscle weakness, vision problems and numbness of hands and feet [2].
Awareness about the toxicity of mercury has increased since the 1950s and
countries all around the world are working on implementing mercury emission
regulations. In the United States, the regulatory limit of mercury in drinking water is
0.002 mg/L; a concentration believed to not affect human health [3]. In 2013, an
international treaty known as Minamata Convention was signed by 140 countries,
including the United States, pledging to regulate and reduce mercury emissions [4].
Photocatalytic treatment of heavy metals has been gaining more attention from
the scientific community in the past couple of decades. Unlike other treatment process
such as precipitation and adsorption, photocatalytic oxidation/reduction is capable of
reducing contaminants to trace or nearly undetectable levels. When a catalyst is
exposed to ultra-violet light, the photon energy excites an electron from the valence
band causing it to jump to the conduction band. This is known as the electron-hole pair.
This pair is responsible for generating redox reactions if recombination of the electron
does not occur.

13
Many studies have focused on the modification of a photocatalyst, such as
titanium dioxide (TiO2), for use of visible light. Most of these studies have characterized
the catalyst, measuring light absorbance/reflectance and binding energy, but there has
not been substantial research on applying these modified catalysts in treatment
processes. It has been noted that mercury has been reduced in natural systems
exposed to sunlight, which contains less than 5% UV rays [5]. Other studies have
questioned whether just a small percentage of UV photons are necessary to induce
photocatalytic reactions.
The purpose of this study herein is to investigate the potential of photocatalytic
reduction of trace aqueous mercury under visible light. Since most modification
techniques include doping the catalyst with another metal, the effect of co-mixing
catalysts (two semi-conductor metals) will be investigated.
Most other studies have tested visible light catalysis with high concentration of
contaminants (ppm range). If the formation of electron-hole pairs is directly proportional
to the intensity of light, and the reduction of mercury depends on the number of
electron-hole pairs, then it is hypothesized that visible light (which emits low levels of
UV light) may be effective at reducing low concentrations of mercury (ppb range).
Objectives
Investigate the potential of using co-mixed catalysts in the photocatalytic reduction of aqueous mercury under visible light.
Optimize the visible light photocatalytic process using a silica-titania composite by controlling dissolved oxygen, organic concentration and catalyst concentration.
Compare the performance of titania immobilized with silica to conventional titanium dioxide exposed to visible light.
Investigate the effects of initial concentration of mercury on visible light photocatalysis.

14
CHAPTER 2 LITERATURE REVIEW
Mercury
Mercury is present naturally in the environment and exits in three different forms
that vary in toxicity: elemental, organic, and inorganic. The elemental form of mercury is
released into the environment naturally through erosion and volcanic eruptions but
anthropogenic sources are responsible for approximately 70% of mercury (Hg) released
today [6]. Its toxic nature was discovered in the mid 1900’s and laws regulating
emissions are still debated today.
Sources
Most of the mercury transport in the atmosphere originates from anthropogenic
sources. The main industrial activities that contribute to emissions include gold mining,
pharmaceutical production, manufacturing of light bulbs and thermometers, metal
processing and chlor-alkali chlorine production facilities among others. By far, the
largest source of anthropogenic Hg emissions is coal-fired power plants, accounting for
close to 50% of industrial discharges [6] [7].
The combustion of coal is responsible for the emission of both elemental and
oxidized forms of mercury. Divalent Hg2+ is highly reactive and has a lifetime in the
atmosphere of only a few days. It is deposited on land or in water close to its point of
emission. Once deposited, oxidized mercury has the potential to transform into
methylmerucy; a highly toxic, organic form of mercury. On the other hand, elemental
mercury has a lifetime in the atmosphere of approximately one year and can travel long
distances, contaminating areas far from the point of emission.

15
In the United States, mercury concentration in coal ranges from 0.8 to 1 μg/g [7].
During combustion, mercury is released from coal as its gaseous, elemental form. The
total concentration of mercury in flue gas emissions ranges from 1 to 35 μg/N m3 [8]. As
the flue gas cools, part of the gaseous mercury gets oxidized to HgO, HgCl2 or Hg2Cl2.
Wet scrubbers or dry sorbent injection are common treatment processes used to
remove the oxidized mercury. If not captured or treated, the remaining 50% of elemental
mercury gets released to the atmosphere.
Contamination of water can occur via atmospheric transport or direct industrial
discharge. Mercury emitted hundreds, or even thousands, of miles away can be
discharged to the soil or a body of water through rainfall, thus contaminating drinking
water sources. Elemental mercury released into the environment can get oxidized by
ozone in the atmosphere to its divalent form from where it can be returned to the
surface of the Earth through wet or dry deposition [9]. Once deposited, it may bind with
other compounds on the surface or is re-emitted to the atmosphere as gaseous
mercury.
Regulations
In the United States, mercury emissions are currently regulated by the
Environmental Protection Agency (EPA) under the Safe Drinking Water Act (SDWA),
the Clean Water Act (CWA), the Clean Air Act (CAA), and the Resource Conservation
and Recovery Act (RCRA).
In 2005, the EPA created the Clean Air Mercury Rule under the CAA with the
intention of reducing emissions for coal-fired power plants by setting caps. The rule was
voided in 2009 when the D.C. Circuit removed power plants from the list of hazardous
contaminant sources of the CAA [10]. In 2012, the EPA issued the Mercury and Air

16
Toxic Standards (MATS) with the intention of reducing air pollutants for oil and coal-fired
power plants. The proposed rules will regulate emissions from plants generating 25
megawatts or more and allows each plant up to 4 years to comply with the technology-
based standards [11].
In 1992, the EPA issued the Impaired Waters and Total Maximum Daily Load
(TMDL) Regulations which limits the amount of contaminants that may be discharged
into a body of water. Point source discharges are controlled by the National Pollutant
Discharge Elimination System (NPDES) in which permits are issued by individual states
[12]; therefore the TMDL for mercury varies from state-to-state. The drinking water in
the United States is protected by the SDWA, which was passed in 1974 [3]. It sets
standards and ensures the quality of municipal drinking water around the country. The
regulation of mercury under the SDWA began in 1992 and the maximum contaminant
level (MCL) in drinking water is 0.002 mg/L or 2 ppb [3].
In 2013, the Minamata Convention on Mercury was created to reduce
anthropogenic emissions of mercury around the globe. A 2001 global assessment of
mercury conducted by the United Nations Environmental Programme (UNEP) provided
sufficient evidence on the negative impacts of mercury. Negotiations started in 2009
and after 4 years the treaty was finalized and signed by over 140 countries including the
United States [4].
Health Impacts
Exposure to mercury can occur via inhalation, ingestion, or through dermal
contact. Mercury may exist as a cation which gives it the potential to react with most
ligands in living cells. Elemental mercury (Hg0) is the least toxic species of the heavy

17
metal. If ingested, it is a stable, unreactive element in the body that will pass through the
digestive system and be eliminated without causing harm.
In bodies of water, mercury undergoes biomethylation by specific organisms to
form one of the most toxic species known as methylmercury (MeHg) [13]. It is
suggested that methylmercury reacts with cysteine to form a compound that mimics the
essential amino acid methionine [14]. Methionine is capable of entering the brain barrier
and is always the first amino acid to start the polypeptide chain [14]. Therefore, when
methylmercury enters the body, it is capable of penetrating the brain and inhibiting
protein synthesis.
MeHg is ingested by fish and other aquatic organisms which in turn are
consumed by humans. Mercury binds to proteins and lipids and can cause serious harm
to the brain and nervous system. In adults, mercury contamination may cause
headaches, nausea, vomiting, numbness, and difficulty walking, seeing, speaking and
hearing among other symptoms [15]. Fetuses and young children are more susceptible
to the damaging effects of mercury and exposure may cause a series of developmental
issues including cerebral palsy, retardation and seizures [16].
The toxicity of MeHg was not recognized until the 1950s when the population of
Minamata, Japan began developing serious neurological problems. Contamination of
the water occurred via wastewater discharge from a Chisso Corporation plant that
manufactured fertilizers [17]. The local population relied heavily on the contaminated
fish as their source of protein. Adults developed serious symptoms affecting the
neurological system, similar to epilepsy, known as Minamata disease. 30 cases of
18
cerebral palsy were reported due to mothers who consumed the contaminated fish
during pregnancy [18].
Chemistry
Mercury is a heavy metal that exists in three oxidation states, Hg0, Hg+, and Hg2+.
Gaseous mercury in the atmosphere exists primarily in its elemental state, Hg0. The
divalent form is found in dissolved waters or attached to particles [19]. Therefore the
oxidized form of mercury, Hg2+, tends to be discharged from the atmosphere through
precipitation, close to its source of emission [20]. On the other hand, Hg0 is less soluble
and will travel long distances across the globe before it is oxidized and released back to
the earth. The lifetime of Hg0 in the atmosphere could last up to 2 years [20].
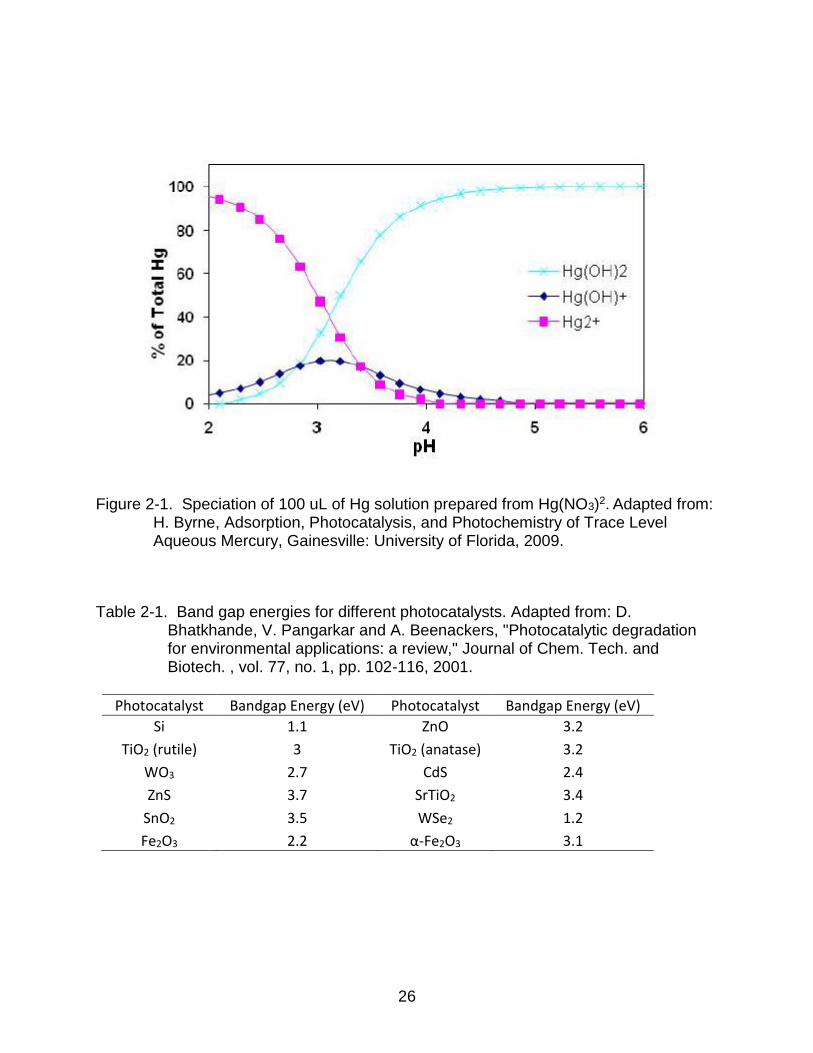
Across varying pH values and chloride concentrations, the divalent form of
mercury will complex with hydroxide and chloride ions in surface waters with an oxic
environment. Hg will complex with hydroxide ions at pH values greater than 3 or when
there is no chloride present and will hydrolyze to HgOH+ and Hg(OH)2 according to
Equations (2-1and (2-2 [21].
𝐻𝑔2+ + 𝐻2𝑂 ⇄ 𝐻𝑔𝑂𝐻+ + 𝐻+ (2-1)
𝐻𝑔𝑂𝐻+ + 𝐻2𝑂 ⇄ 𝐻𝑔(𝑂𝐻)2 + 𝐻+ (2-2)
HgOH+ is predominant in the lower pH range of 2.2 to 3.8 while Hg(OH)2 occurs at pH
above 3.8 and being the only hydrolyzed species at pH 6 and above. Examining the
various hydrolyzed species of mercury suggests the degree of solubility of the heavy
metal. At natural water pH ranges, mercury will be present as a soluble hydrolyzed
complex rather than free ions.
However, divalent mercury has a large affinity for complexation with chloride
rather than hydroxide in oxic environments. At lower pH values, the Hg-Cl complexation
19
will form four species depending on the concentration of Cl- present in solution: HgCl+,
HgCl2, HgCl-3, and HgCl2-4 [22] where HgCl2 is the predominant species. An
intermediate species, HgClOH may be formed with in a small window of precise pH and
chloride concentration values.
As discussed in subsequent sections, Hg(NO3)2 was used in this study. The
compound ionizes into NO3- and Hg2+. Since no other ions are present in solution, the
mercury ions will hydrolyze as seen in Figure 2-1 [23].
Photocatalysis
Photocatalytic oxidation has been widely used for the treatment of organic
compounds in water and air streams. In the past 20 years, interest has been
increasingly shifting to the potential of using photocatalysis in the reduction of heavy
metals from aqueous waste streams. Many metal oxides display photocatalytic
properties. These semiconductors contain a void area, where no energy levels are
available, known as the band gap [24]. When the semiconductor is exposed to light at a
specific wavelength, an electron jumps the band gap from the valence band to the
conduction band producing a positively charged hole (h+) in the valence band and a
photoexcited electron (e-) in the conduction band. This is known as an electron-hole pair
(Equation (2-3) [25]. The amount of energy required to produce an electron-hole pair
must be equal to or greater than the band gap energy, in most cases UV or near UV
light is required [24]. Recombination of the electron to the valence band can occur
almost instantaneously if no other reactions take place. Instead of recombination, the
electron-hole pair may participate in redox reactions with molecules adsorbed to the
surface of the catalyst. The positively charged hole becomes available to oxidize any
20
nearby compounds while the negatively charged conduction band promotes a reduction
reaction.
Oxidation Reactions
Valence band holes may directly oxidize a target pollutant or create hydroxyl
radicals in the water. Hydroxyl radicals are believed to be the primary oxidants in
photocatalytic oxidation and may be produced through various mechanisms. Water
molecules adsorbed by the catalyst or OH- groups on the surface of the catalyst may
interact with the valence band to produce hydroxyl radicals as described by Equations
(2-4 and (2-5 [26] [27] [28].
𝑇𝑖𝑂2 →ℎ𝑣 ℎ𝑣𝑏
+ + 𝑒𝑐𝑏− (2-3)
𝐻2𝑂 + ℎ𝑣𝑏+ → ∙ 𝑂𝐻 + 𝐻+ (2-4)
𝑂𝐻− + ℎ𝑣𝑏+ → ∙ 𝑂𝐻 (2-5)
It is also suggested that hydroxyl radicals may be formed by the interacting of
oxygen with the conduction band electron to form a superoxide ion which then
transforms into hydrogen peroxide as described by Equations (2-6 through (2-10 [29].
The hydrogen peroxide molecules are then broken into hydroxyl radicals by interaction
with the conduction band electron, by reacting with the superoxide ion or by direct
photolysis (Equations (2-11 through (2-13) [28] [30] [31].
𝑂2 + 𝑒𝑐𝑏− → 𝑂2
∙ − (2-6)
𝑂2∙ − + 𝐻+ → 𝐻𝑂2 ∙ (2-7)
𝐻𝑂2 ∙ +𝐻𝑂2 ∙ → 𝐻2𝑂2 + 𝑂2 (2-8)
𝑂2∙ − + 𝐻𝑂2 ∙ → 𝐻𝑂2
− + 𝑂2 (2-9)
𝐻𝑂2− + 𝐻+ → 𝐻2𝑂2 (2-10)

21
𝐻2𝑂2 + 𝑒𝑐𝑏− → ∙ 𝑂𝐻 + 𝑂𝐻− (2-11)
𝐻2𝑂2 + 𝑂2∙ − → ∙ 𝑂𝐻 + 𝑂𝐻− + 𝑂2 (2-12)
𝐻2𝑂2 →ℎ𝑣 2 ∙ 𝑂𝐻 (2-13)
Reduction Reactions
Many studies have focused on the photooxidation of organic contaminants, but
slowly there has been an attention shift to investigating the photoreduction of heavy
metals and inorganic compounds [32].
For photoreduction to be thermodynamically achievable, the reduction potential
of the metal ion must greater than the energy of the conduction band of the
photocatalyst [33] [34] . The size of the gap between the conduction (cb) and valence
(vb) bands will remain constant, but the energy levels will alter with a change in pH. The
difference in energy levels is quantified by Equations (2-14 and (2-15 [35] [36].
𝐸𝑐𝑏 = (−0.05 − 0.059𝑝𝐻) 𝑒𝑉 (2-14)
𝐸𝑣𝑏 = (3.25 − 0.059𝑝𝐻) 𝑒𝑉 (2-15)
According to the equations above, the photoreduction of mercury should increase
with an increasing pH. It has been discussed that the photoreduction of a metal ion is
directly proportional to the adsorption of the metal on to the surface of the photocatalyst
[37]; therefore increasing the amount of metal ions adsorbed should increase the rate of
photoreduction. However, an increased in absorbed metal ions increases the chances
of photooxidation by the valence band hole [34] [38].
The following products are produced through the photocatalytic reductions of
varying mercury salts in neutral or acidic pH (Equations 2-16 through 2-18) [39]:
22
𝐻𝑔(𝑁𝑂3)2 + 𝐻2𝑂 → 𝐻𝑔0 +1
2𝑂2 + 2𝐻𝑁𝑂3
(2-16)
4𝐻𝑔𝐶𝑙2 + 2𝐻2𝑂 → 2𝐻𝑔2𝐶𝑙2 + 𝑂2 + 4𝐻𝐶𝑙 → 4𝐻𝑔0 (2-17)
𝐻𝑔(𝐶𝑙𝑂4)2 + 𝐻2𝑂 → 𝐻𝑔0 +1
2𝑂2 + 2𝐻𝐶𝑙𝑂4
(2-18)
At a high pH, elemental mercury is oxidized according to Equation 2-19 [39]:
𝐻𝑔0 + 𝑂2 → 𝐻𝑔𝑂 (2-19)
The reduced form of mercury may be eliminated from the system through volatilization
or removed through adsorption on to the catalysts.
Creating a Reducing Environment
Treatment techniques may be tailored to favor oxidation or reduction reactions. A
reducing environment is preferable when treating aqueous mercury. Organic materials
may be added to act as a hole scavenger and/or radical sink. In the presence of
nitrogen purge, formic acid displayed the highest amount of carbon oxidized compared
to acetic acid, methanol, ethanol, sucrose, and salicylic acid; oxidizing twice as much
carbon as acetic acid at the 40 minute interval [40].
Formic acid is a small molecule that can be adsorbed on to the surface of TiO2
impeding recombination by interaction with the valence band hole to produce carbon
dioxide and water through the oxidation reaction. It will absorb only high energy light at
wavelengths less than 260 nm [34] which means that formic acid will not be in
competition with TiO2 for the absorbance of lower energy UVA rays. These advantages
make formic acid a suitable hole scavenger in the photoreduction of mercury as seen by
Wang et al where the addition greatly increased the amount of mercury photoreduced
[34]. However, it is important to note that the amount of formic acid necessary is directly
proportional to number of electrons necessary for reduction. In a study investigating the

23
enhanced photocatalytic reduction of nitrate over Bi-doped TiO2, it was noted that 5
moles of electrons are required to completely reduce 1 mole of nitrate to nitrogen gas
[41]. Therefore, 5 moles of formic acid would be necessary. In the case of mercury
reduction, two electrons are required for the formation of elemental mercury requiring
two moles of formic acid per mole of mercury as seen in Equation 2-20:
𝐻𝑔2+ + 2𝑒− → 𝐻𝑔0 (2-20)
This is consistent with the results obtained by Wang et al; the addition of formic acid at
concentrations more than double the concentration of mercury showed no improved
photoreduction [34].
As covered earlier, the presence of dissolved oxygen may hinder the reduction of
heavy metals. Oxygen facilitates the oxidation reactions occurring at the valence band
hole by trapping the photoexcited electron at the conduction band [42] competing with
mercury for the reduction reaction. Additionally, the reaction of oxygen with the cb
electron generates a superoxide radical which has the potential to re-oxidize the
reduced species of mercury. Therefore, an inert gas purge, such as nitrogen, is
desirable to reduce the dissolved oxygen in solution
Visible Light Photocatalysis
Table 2-1 lists a few possible photocatalysts and their band gap energies. A
suitable catalyst must be photoreactive at an achievable energy level, non-toxic,
chemically stable and non photocorrosive [43]. Titanium dioxide (TiO2) is the most
widely used photocatalytic material; highly suitable for environmental applications [44].
Titanium dioxide exits in two crystalline structures: rutile (3.0 eV) and anatase
(3.2 eV) [45]. Degussa P25 is a commercially available TiO2 comprised of a mixture of
70% anatase and 30% rutile with an average particle size of 30 nm and BET surface

24
area of 40-70 m2/g [46]. Although the band gap of TiO2 requires photon energy at or
below UVA wavelengths (< 290 nm), it has been argued that only a few photons at the
required energy level are sufficient to promote photocatalysis [44]. Therefore, the small
amount of UVA photons emitted by indoor lighting could perhaps be capable of
generating electron-hole pairs on the surface of TiO2 and treating trace amounts of
contaminant. A series of studies investigated the photocatalytic degradation (PCD) rate
of various organic compounds with respect to light intensity and were able to achieve
degradation by solar radiation; however it was observed that PCD rate does increase
with increasing light intensity [29] [47] [48].
Various techniques have been conducted to improve the photocatalytic potential
of TiO2 under visible light such as doping the catalyst with metal and non-metal ions [49]
[50] [51] [52]. Most of the literature has focused on characterizing the modified
photocatalyst and measuring light absorption/reflection [45] [52] [53] but not many
studies have been published comparing side by side results of photocatalytic reduction
of heavy metals under visible and ultra-violet light. If indeed only a few photons are
required to excite the valence band electron, it could be argued that a visible light
source would be sufficient to reduce trace levels of contaminants. Additionally, the
slightly increased absorbance of light for the doped catalysts may be negligible if
successful results are obtained by using plain TiO2 under visible light. Asahi et al
investigated the effects of doping titanium dioxide with nitrogen. The absorbance of light
in the visible range for doped catalysts is only enhanced marginally compared to plain
TiO2 [53]. Other studies slightly improved the reflectance/absorbance of light in the

25
visible light range of TiO2 by doping techniques, demonstrating insignificant difference
between doped and undoped catalysts [51] [54] [55].
About 30% decomposition of rhodamine B and 2,4-dichlorophenol was achieved
using pure TiO2 under visible light [56]. Nitrogen doping of the catalyst improved results
to decomposition rates between 45% and 98% depending on the nitrogen dose,
however the study was conducted using high ppm concentrations of contaminants. It
would be interesting to investigate the photocatalytic decomposition rate with pure TiO2
at lower contaminant concentrations. Additionally, the contact times were as high as 5
hours, which would be unfeasible in application.
If it can be demonstrated that the photoreduction of heavy metals is possible
using a visible light source, the additional costs of doping techniques and high energy
UV light sources would be unnecessary for the commercial application of photocatalytic
treatment of trace metals.
26
Figure 2-1. Speciation of 100 uL of Hg solution prepared from Hg(NO3)2. Adapted from: H. Byrne, Adsorption, Photocatalysis, and Photochemistry of Trace Level Aqueous Mercury, Gainesville: University of Florida, 2009.
Table 2-1. Band gap energies for different photocatalysts. Adapted from: D.
Bhatkhande, V. Pangarkar and A. Beenackers, "Photocatalytic degradation for environmental applications: a review," Journal of Chem. Tech. and Biotech. , vol. 77, no. 1, pp. 102-116, 2001.
Photocatalyst Bandgap Energy (eV) Photocatalyst Bandgap Energy (eV)
Si 1.1 ZnO 3.2
TiO2 (rutile) 3 TiO2 (anatase) 3.2
WO3 2.7 CdS 2.4
ZnS 3.7 SrTiO2 3.4
SnO2 3.5 WSe2 1.2
Fe2O3 2.2 α-Fe2O3 3.1

27
CHAPTER 3 EXPERIMENTAL
STC Synthesis
The silica-titania composite was synthesized using tetraethyl orthosilicate
(TEOS) as the precursor in the sol-gel method. 50 mL of DI water (18.2 MΩ-cm), 100
mL of ethanol (Fisher, 200 proof), 4 mL of 1 M nitric acid (made from concentrated
Fisher) and 70 mL of TEOS were added in a HDPE container. 8 mL of 3% wt
hydrofluoric acid (diluted from 49% Fisher) was added to achieve a pore diameter of
approximately 140 A. Lastly, a mass of 2.8 g of titanium dioxide (Degussa P25) was
added for a TiO2 loading of 4%. The mixture was magnetically stirred until gelation. It
was then capped and allowed to age at room temperature for 4 hours and dried at 65
degrees Celsius for an additional 48 hours. The material was transferred to a Pyrex
container and covered with pin-sized holes to allow moisture to escape. It was heated at
a temperature of 103 degrees Celsius for 18 hours followed by 180 degrees Celsius for
6 hours. The dried material was ground using a mortar and pestle and then sieved to
achieve particles between 45 to 90 μm. Table 3-1 summarizes the surface
characteristics of each catalyst.
Co-mixing Studies
Hg solutions were prepared by diluting 1000 mg/L of Hg(NO3)2 (Fisher) with
deionized water. Formic acid (Fisher) was added at a concentration of 1.5 ppm of
carbon. Experiments were conducted in Pyrex flasks with a liquid volume of 150 mL and
continuously stirred by magnetic stir bars. The STC was added at a loading of 1 g/L
based on previous pseudo equilibrium batch studies [56]. Catalysts for the co-mixing
experiments were added in equal amounts (0.5 mg/L of each) to achieve a total
28
concentration of 1 mg/L. Illuminated experiments were conducted for 5, 15 and 30
minutes exposed to visible light at a distance of 1 inch from the reactors. The bulb used
was a GE Ecolux Startcoat T-8 Linear Fluorescent Light with a peak wavelength close
to 550 nm (Figure 3-1) [57]. Flasks were capped with rubber stoppers equipped with a
purge glass tube (5 mm diameter) and a similar vent tube (Figure 3-2). Experiments
were conducted under no purge (solely exposed to air) and under nitrogen purge
(Airgas, ultra high purity) at a rate of 2 L per minute controlled by a flow meter. Control
experiments were conducted in the dark following the same procedure described above.
The flasks were covered in aluminum foil to prevent exposure to any ambient light.
Duplicate experiments were conducted for all sets and the ranges of values are
expressed by error bars.
STC and TiO2 Comparison Studies
Time dependent studies were conducted as described above. Pyrex flasks
containing 150 mL of 100 ppb Hg solution were exposed to visible light under varying
conditions. The STC concentration was maintained at 1 g/L and the TiO2 concentration
was determined from the loading of the material in the silica-titania composite;
approximately 76 mg/L. Mixtures were exposed to one linear fluorescent visible light
bulb at a distance of 1 inch from the flasks for time intervals of 5, 15 and 30 minutes.
Flasks were covered with a rubber stopper equipped with 5 mm glass tubes for gas
purge and ventilation. The stopper and glass tubes were present in dark experiments as
well to maintain equal mixing gradients.
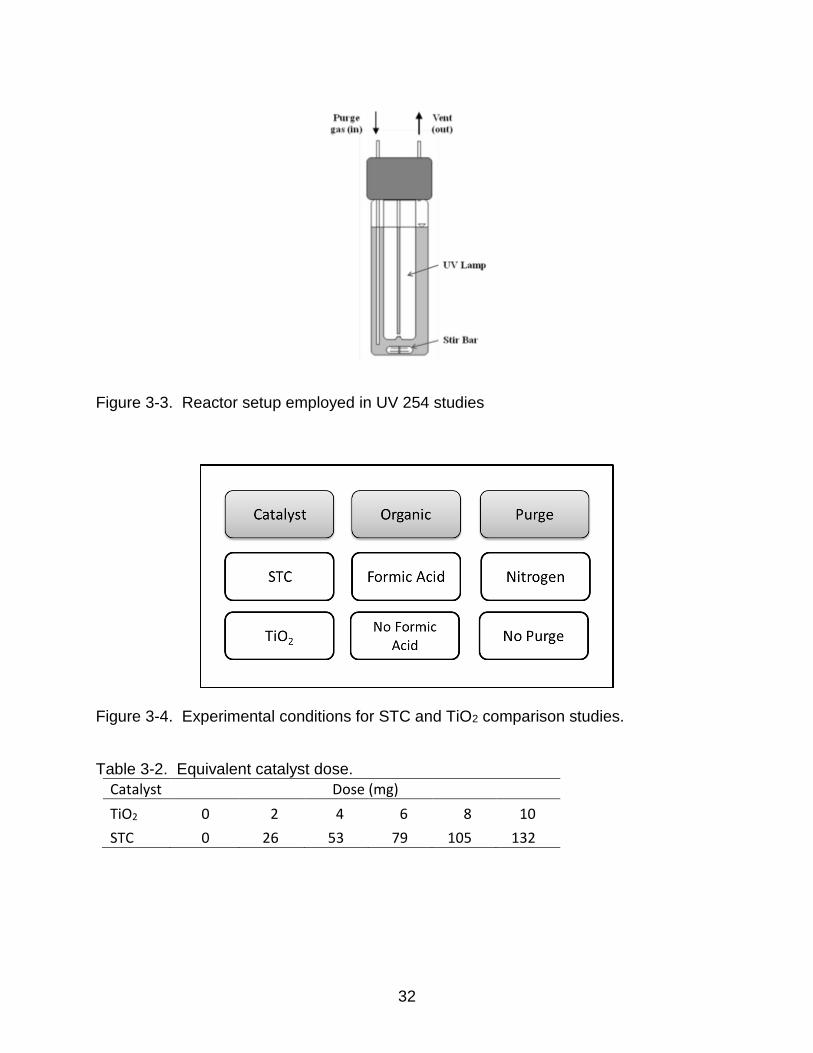
Lastly, the same experiments were conducted under 254 nm ultra-violet light in
order to compare mercury removal in both scenarios. For these studies, a liquid volume
of 100 mL was placed in a cylindrical Pyrex glass reactor and continuously stirred by
29
magnetic mixing (Figure 3-3). The reactors were covered with a Teflon lid equipped with
two ¼ inch glass tubes; one for delivery of a gas purge and the other for ventilation. A
PL-S Twin Tube Short Compact Fluorescent Lamp was inserted through the Teflon lid
into the reactor. Illumination, addition of the catalyst, and the gas purge (when
applicable) were initialized at the same time for all experiments.
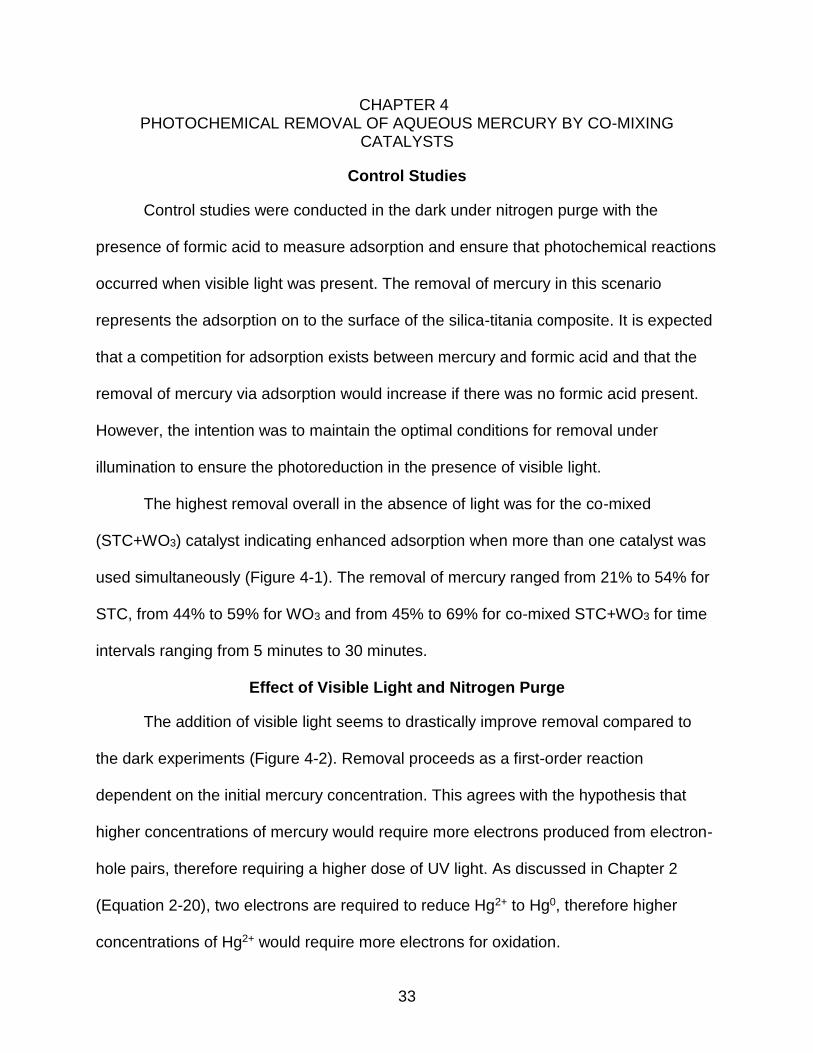
For dose dependent studies, experiments were conducted as described above
for a period of 5 minutes under the same scenarios described in Figure 3-4. The matrix
of catalyst doses is presented in Table 3-2. The 0 mg dose represents the experiments
exposed to visible light only, without the addition of a catalyst.
For all STC and TiO2 comparison studies, control experiments were conducted in
the dark. Additionally, comparison experiments were conducted under 254 nm ultra-
violet light. Duplicate experiments were conducted for all studies and results are
reported as normalized concentration C/C0. Error bars represent the range of values
obtained.
In all studies, the pH was measured but not controlled. The values ranged from
3.80 to 4.5. There was no significant change in removal between different pH values
within the range.
Sample Collection and Analysis
After illumination, samples were vacuum filtered through a 45 μm cellulose
membrane to separate the catalyst from the solution. Aliquots of 20 mL were taken from
the filtrate and placed in 40 mL glass vials with Teflon lined caps. Nitric acid was added
immediately in order to preserve the samples which were digested according to the EPA
standard method 254.3 and analyzed within two weeks of collection using a Teledyne
30
Instruments Hydra Atomic Adsorption Mercury Analyzer manufactured by Leeman Labs.
The detection limit was determined to be 1 ppb of mercury.

31
Table 3-1. Catalyst Surface Characterization
BET Pore Size Pore Vol. Mesopore Vol.
m2/g Å cc/g cc/g
WO3 10.45 136.00 0.0336 0.03172
STC 174.67 182.60 0.7974 0.7826
TiO2 45.22 194.90 0.2203 0.2046
Figure 3-1. Spectral power distribution provided by the manufacturer [57]
Figure 3-2. Visible light setup (profile view).
Stir Plate
Light Source
Purge Tube Vent Tube
150 mL Liquid Vol.
32
Figure 3-3. Reactor setup employed in UV 254 studies
Figure 3-4. Experimental conditions for STC and TiO2 comparison studies.
Table 3-2. Equivalent catalyst dose.
Catalyst Dose (mg)
TiO2 0 2 4 6 8 10
STC 0 26 53 79 105 132
33
CHAPTER 4 PHOTOCHEMICAL REMOVAL OF AQUEOUS MERCURY BY CO-MIXING
CATALYSTS
Control Studies
Control studies were conducted in the dark under nitrogen purge with the
presence of formic acid to measure adsorption and ensure that photochemical reactions
occurred when visible light was present. The removal of mercury in this scenario
represents the adsorption on to the surface of the silica-titania composite. It is expected
that a competition for adsorption exists between mercury and formic acid and that the
removal of mercury via adsorption would increase if there was no formic acid present.
However, the intention was to maintain the optimal conditions for removal under
illumination to ensure the photoreduction in the presence of visible light.
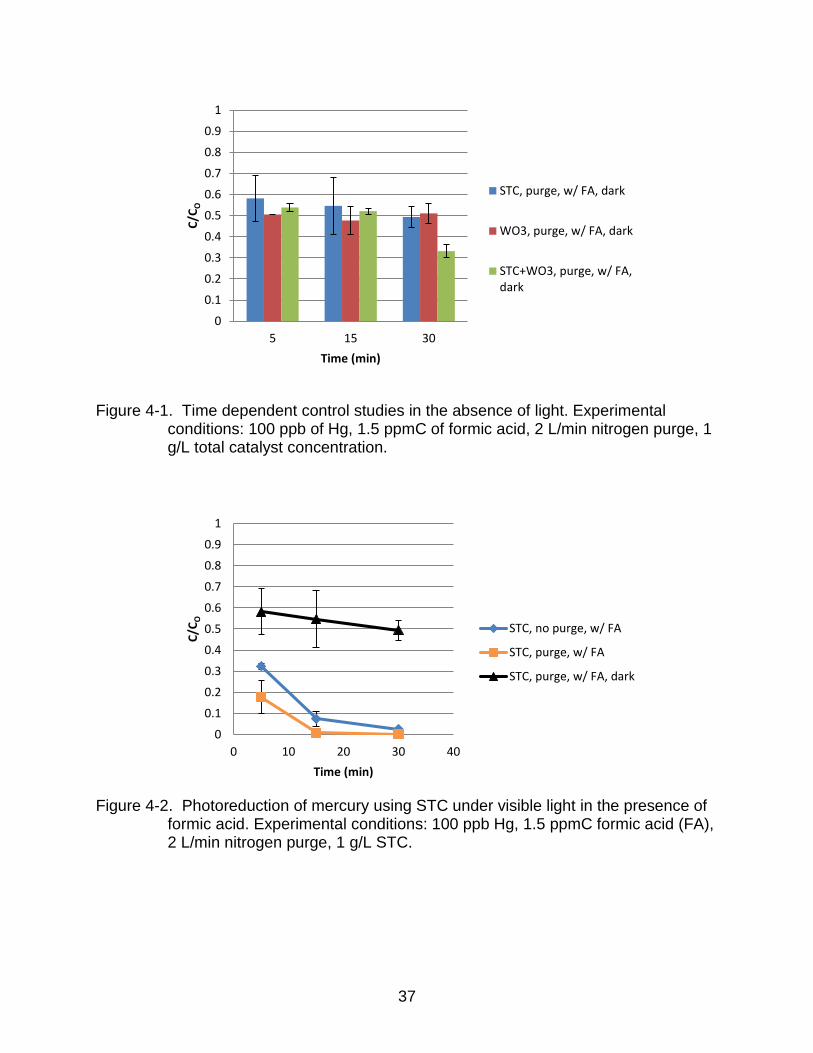
The highest removal overall in the absence of light was for the co-mixed
(STC+WO3) catalyst indicating enhanced adsorption when more than one catalyst was
used simultaneously (Figure 4-1). The removal of mercury ranged from 21% to 54% for
STC, from 44% to 59% for WO3 and from 45% to 69% for co-mixed STC+WO3 for time
intervals ranging from 5 minutes to 30 minutes.
Effect of Visible Light and Nitrogen Purge
The addition of visible light seems to drastically improve removal compared to
the dark experiments (Figure 4-2). Removal proceeds as a first-order reaction
dependent on the initial mercury concentration. This agrees with the hypothesis that
higher concentrations of mercury would require more electrons produced from electron-
hole pairs, therefore requiring a higher dose of UV light. As discussed in Chapter 2
(Equation 2-20), two electrons are required to reduce Hg2+ to Hg0, therefore higher
concentrations of Hg2+ would require more electrons for oxidation.

34
In this case, the photon energy in visible light is sufficient to decrease the
concentration of mercury from 100 ppb at time zero to approximately 1 ppb at 30
minutes. The presence of a nitrogen purge slightly increased removal at the 5 minute
interval but there was no significant difference at 15 or 30 minutes (Figure 4-2).
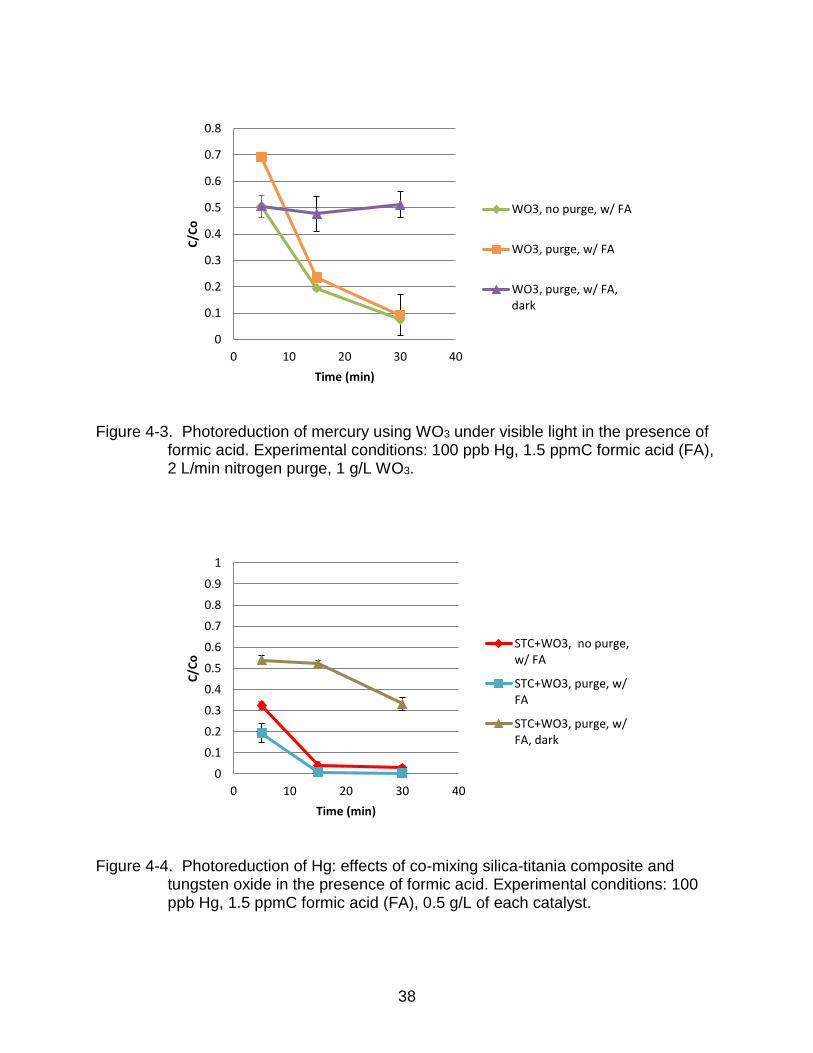
Similar results were observed for WO3 at 15 and 30 minutes; there was a
significant difference in the removal of mercury when comparing dark runs with
illuminated experiments and no substantial difference in results between experiments
with and without a nitrogen purge (Figure 4-3). The presence of a nitrogen purge may
not be as significant in these scenarios since there is an organic compound in solution.
The formic acid present acts as a hole scavenger and radical sink, preventing re-
oxidation of Hg0 to Hg2+ by either hydroxyl or superoxide radicals. However, this may
not occur in the absence of formic acid since there would be no compound to absorb
superoxide radicals formed by dissolved oxygen. The effect of nitrogen purge without an
organic compound present will be discussed in subsequent sections.
The nitrogen purge, however, did affect the removal in the co-mixing experiments
(Figure 4-4). At the 5 minute interval, removal was about 68% with no purge compared
to 94% under nitrogen purge; showing almost 30% more removal. It was indicated in the
literature that tungsten oxide has smaller band gap energy than titanium dioxide; 2.7 eV
compared to 3.2 eV [43]. This would mean that more electron-hole pairs would be
produced at the same energy intensity as compared to TiO2, therefore, increasing the
potential for radical formation and requiring both a nitrogen purge and organic present
for effective removal. At first glance, the removal of Hg using a co-mixed catalyst
seemed to improve when compared to STC or WO3 alone. However, comparing co-

35
mixed data to STC in the absence of N2 purge, under visible light shows no difference in
removal (Figure 4-5).
Additionally, there was a slight improvement in adsorption of mercury for co-
mixed catalysts compared to single catalysts as discussed in the control studies.
Analyzing the 30 minute interval for STC and STC + WO3 in the dark demonstrates an
improvement in removal of approximately 14% (Figure 4-6). Co-mixed STC+WO3
demonstrated high removal at all time intervals. Studies were performed using half dose
of STC to verify that removal improvement was actually due to the addition of WO3 and
not the decreased dose of STC. The results show that there was no significant
difference in mercury removal using 1 g/L of STC compared to 0.5 g/L. In summary, the
addition of WO3 to STC improves removal of mercury through enhanced adsorption and
there is no effect on photoreduction.
Figure 4-7 summarizes the results of all experiments under nitrogen purge in the
presence of formic acid. It is important to note that the silica-titania composite was
successful at removing mercury under illumination with more than 80% removal at only
5 minutes and performed better than tungsten oxide. This could be explained by the
same theory of why the nitrogen purge is effective for co-mixed catalysts compared to
single catalysts. WO3 displays lower band gap energy than TiO2 creating more electron-
hole pairs in visible light. The increased number of these pairs will escalate the chance
of radical formation and lead to re-oxidation of mercury. Increasing the initial
concentration of mercury could possibly invert removal results leading to higher removal
with WO3 compared to STC.

36
The next sections are devoted to understanding reduction of mercury using STC
in more detail and optimizing the process by studying the effects of contaminant
concentration, gas purge, presence of an organic and comparison to titanium dioxide.
37
Figure 4-1. Time dependent control studies in the absence of light. Experimental conditions: 100 ppb of Hg, 1.5 ppmC of formic acid, 2 L/min nitrogen purge, 1 g/L total catalyst concentration.
Figure 4-2. Photoreduction of mercury using STC under visible light in the presence of
formic acid. Experimental conditions: 100 ppb Hg, 1.5 ppmC formic acid (FA), 2 L/min nitrogen purge, 1 g/L STC.
0
0.1
0.2
0.3
0.4
0.5
0.6
0.7
0.8
0.9
1
5 15 30
C/C
O
Time (min)
STC, purge, w/ FA, dark
WO3, purge, w/ FA, dark
STC+WO3, purge, w/ FA,dark
0
0.1
0.2
0.3
0.4
0.5
0.6
0.7
0.8
0.9
1
0 10 20 30 40
C/C
O
Time (min)
STC, no purge, w/ FA
STC, purge, w/ FA
STC, purge, w/ FA, dark
38
Figure 4-3. Photoreduction of mercury using WO3 under visible light in the presence of
formic acid. Experimental conditions: 100 ppb Hg, 1.5 ppmC formic acid (FA), 2 L/min nitrogen purge, 1 g/L WO3.
Figure 4-4. Photoreduction of Hg: effects of co-mixing silica-titania composite and tungsten oxide in the presence of formic acid. Experimental conditions: 100 ppb Hg, 1.5 ppmC formic acid (FA), 0.5 g/L of each catalyst.
0
0.1
0.2
0.3
0.4
0.5
0.6
0.7
0.8
0 10 20 30 40
C/C
o
Time (min)
WO3, no purge, w/ FA
WO3, purge, w/ FA
WO3, purge, w/ FA,dark
0
0.1
0.2
0.3
0.4
0.5
0.6
0.7
0.8
0.9
1
0 10 20 30 40
C/C
o
Time (min)
STC+WO3, no purge,w/ FA
STC+WO3, purge, w/FA
STC+WO3, purge, w/FA, dark
39
Figure 4-5. Comparison of catalysts in the absence of a nitrogen purge. Experimental
conditions: 100 ppb Hg, 1.5 ppmC formic acid (FA), 1 g/L single catalyst, 0.5 g/L combined catalyst.
Figure 4-6. Comparison of silica-titania composite alone and co-mixed silica-titania and
tungsten oxide under nitrogen purge in the presence of formic acid. Experimental conditions: 100 ppb Hg, 1.5 ppmC formic acid (FA), 2 L/min nitrogen purge.
0
0.1
0.2
0.3
0.4
0.5
0.6
0.7
0.8
0.9
0 10 20 30 40
C/C
o
Time (min)
STC, no purge, w/ FA
WO3, no purge, w/ FA
STC+WO3, no purge,w/ FA
0
0.1
0.2
0.3
0.4
0.5
0.6
0.7
0.8
0.9
0 10 20 30 40
C/C
o
Time (min)
STC, purge, w/ FA
STC, purge, w/ FA, 1/2dose
STC+WO3, purge, w/ FA
STC, purge, w/ FA, dark
STC+WO3, purge, w/FA, dark
40
Figure 4-7. Photoreduction of mercury: comparison of all catalysts under nitrogen purge in the presence of formic acid. Experimental conditions: 100 ppb Hg, 1.5 ppmC formic acid (FA), 2 L/min nitrogen purge.
0
0.1
0.2
0.3
0.4
0.5
0.6
0.7
0.8
0 10 20 30 40
C/C
O
Time (min)
STC, purge, w/ FA
WO3, purge, w/ FA
STC+WO3, purge, w/ FA
STC, purge, w/ FA, dark
WO3, purge, w/ FA,dark
STC+WO3, purge, w/FA, dark
41
CHAPTER 5 STC AND TiO2 TIME DEPENDENT STUDIES
Control Studies
Control studies were performed in the dark as described in the previous section
to verify that reduction of mercury was due to photochemical reactions. The results are
summarized in Figure 5-1. The removal of mercury by adsorption was greater using
TiO2 compared to STC for all time intervals.
Effects of Formic Acid
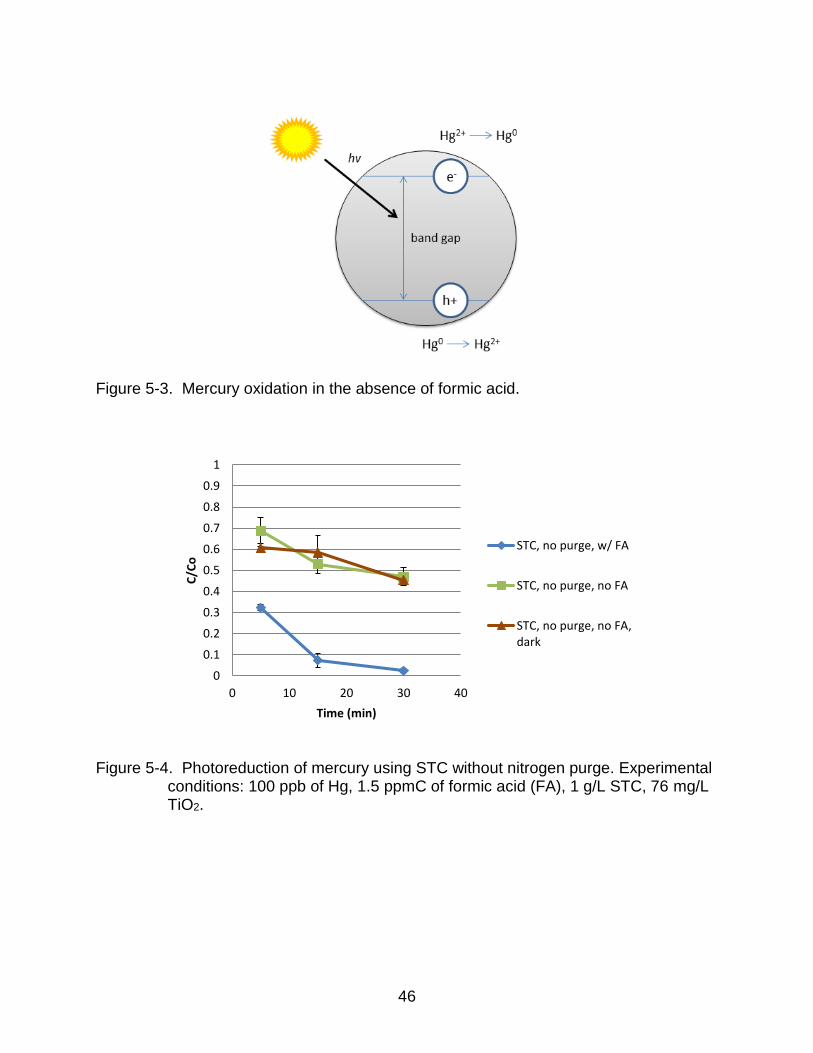
The effects of formic acid are described by Figure 5-2 and Figure 5-4. Removal
increases by approximately 50% in the presence of formic acid compared to no formic
acid under nitrogen purge within 5 minutes of illumination. However, the difference in
removal is insignificant at the 15 and 30 minute intervals under the same conditions. It is
hypothesized that since purge starts at time 0 (simultaneously with illumination), 5
minutes is not sufficient to completely eliminate the dissolved oxygen. The oxygen still
present is competing for the conduction band electron and forming superoxide radicals
that may re-oxidize the elemental species of mercury [28], [30]. On the other hand,
there seems to be sufficient time at the 15 and 30 minute intervals to create a
completely inert nitrogen environment making the addition of formic acid insignificant.
The purge was initiated at the same time as illumination to mimic how treatment would
occur is application. It would not be feasible to purge pre-treatment due to higher
operational costs and longer retention times.
The importance of formic acid is emphasized in Figure 5-4 when no purge is
used; removal increases significantly for all three time intervals. Formic acid reacts with
the valence band hole preventing hydroxyl radical formation and acts as a sink for any
42
radicals present. No photocatalytic removal occurs in the absence of formic acid as
seen in the comparison of dark experiments with illuminated experiments. For every
divalent mercury species reduced by one electron, a radical is formed by the electron-
hole pair. Since no other compound is present to react with the radical, mercury is re-
oxidized to its divalent form, Hg2+ (Figure 5-3). Dark reactions with formic acid in the
absence of a nitrogen purge were not conducted since the presence of formic acid did
not significantly affect adsorption.
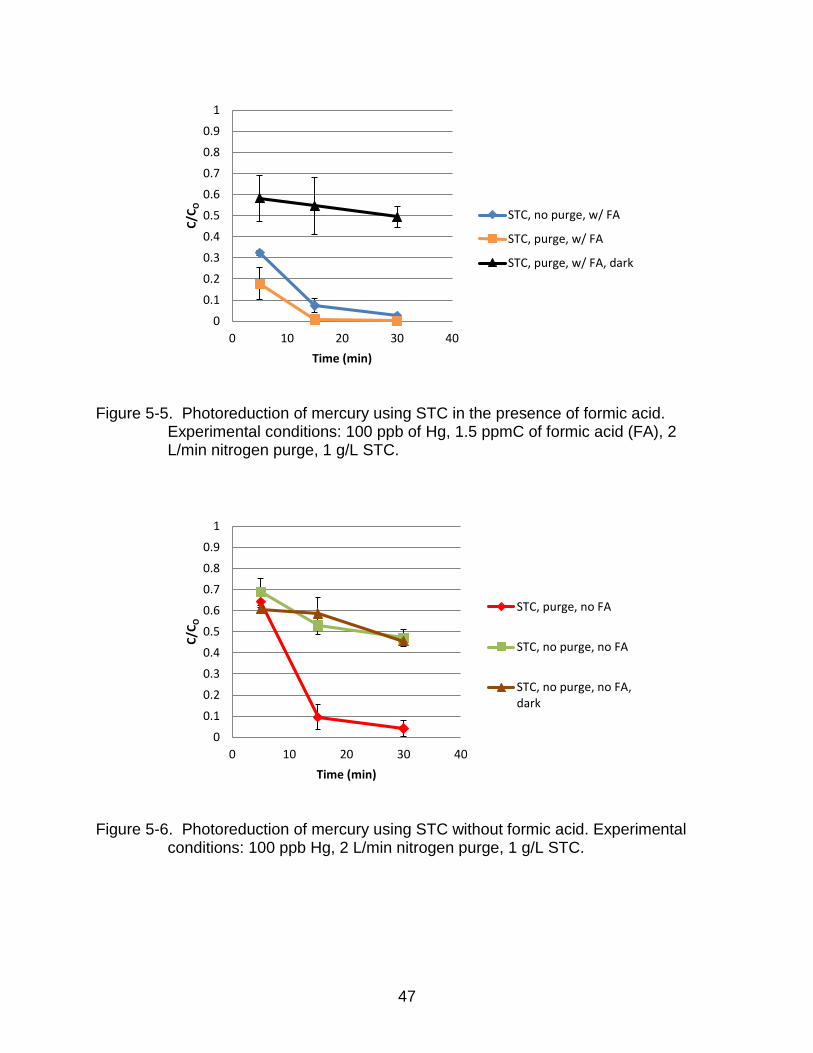
Effects of Nitrogen Purge
Experiments with and without formic acid were conducted to investigate the
effects of a nitrogen purge under both scenarios. In the presence of formic acid, the
addition of a nitrogen purge does not significantly improve results (Figure 5-5). The
formic acid prevents both hydroxyl and superoxide radicals from re-oxidizing Hg0 to its
divalent form. The nitrogen purge becomes significant at longer time intervals when
there is no formic acid present.
As seen in Figure 5-6, removal is the same for all scenarios at 5 minutes, when
there is still dissolved oxygen present. As the purge decreases the concentration of
dissolved oxygen, removal of mercury improves drastically compared to no nitrogen
purge (15 and 30 minutes). Reducing the concentration of dissolved oxygen prevents
the formation of superoxide radicals and since there is no formic acid present to prevent
re-oxidation of Hg0, the effect a nitrogen purge becomes more significant.
Interestingly, the silica-titania composite performed quite well in the reduction of
mercury under the appropriate conditions. The studies discussed above suggest two
possible mechanisms: either the silica may be responsible for lowering the band gap
energy of titanium dioxide or the few photons emitted by visible light in the UVA range

43
are enough to cause the photocatalytic reduction of trace mercury levels. Further
studies comparing STC to TiO2 were conducted to verify a conclusion.
TiO2 Comparison Studies
The same experiments were conducted using TiO2 in order to compare STC’s
photocatalytic activity to a known, widely used catalyst. There was no significant
difference in removal using STC compared to TiO2, in the presence of formic acid and a
nitrogen purge (Figure 5-7), suggesting that the silica does not alter the band gap
energy of titanium dioxide. There is significance difference at the 95% confidence level
for dark experiments at 30 minutes for STC and TiO2 but this cannot be confirmed for 5
and 15 minute experiments. However, the difference in removal between the two
catalysts varied greatly at 5 minutes when no formic acid was present, but this due to
better adsorption of mercury onto TiO2 nanoparticles (Figure 5-8). The data points for
TiO2 illuminated studies compared to dark studies are not statistically different at the
95% confidence level.
The presence of formic acid seems to greatly affect the removal mechanism
when using titanium dioxide. If formic acid is present, photocatalysis occurs and the
illuminated experiments are statistically different from the dark experiments. In the
absence of formic acid, the only mechanism of mercury removal is adsorption, evident
by similar dark and illuminated studies data.
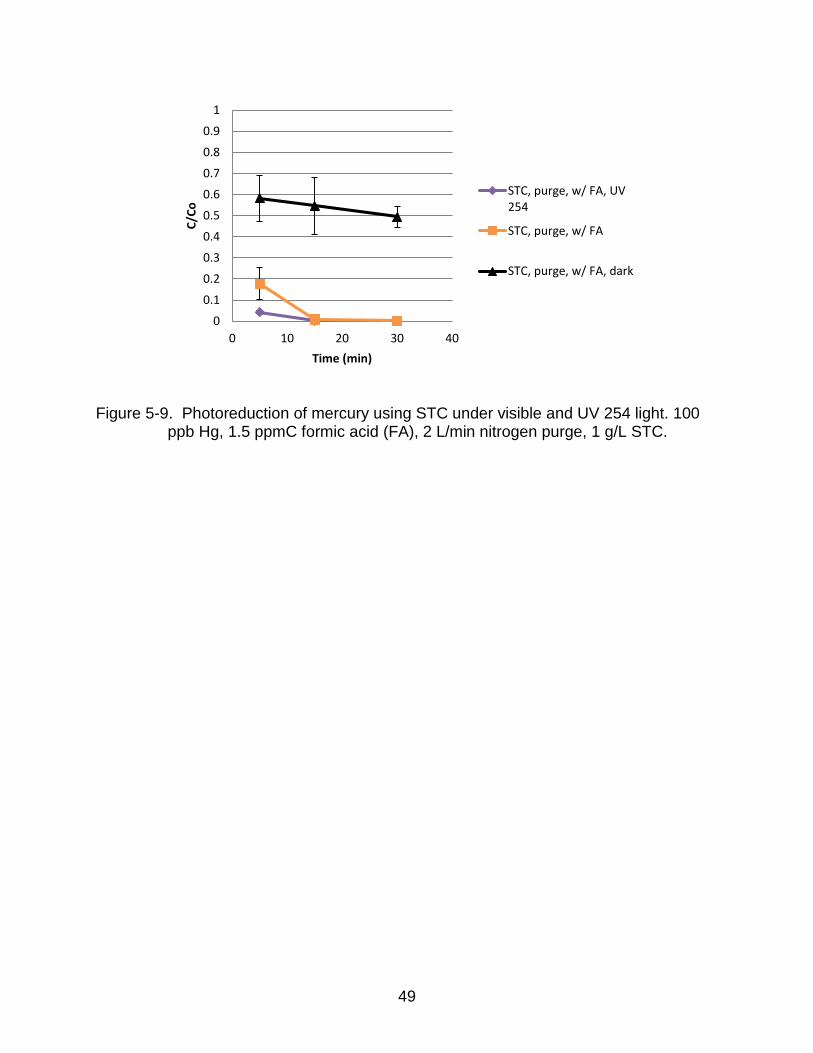
Comparison of Visible Light and UV 254
Studies were conducted comparing removal using STC exposed to visible light
and UV 254 nm. Removal seemed to slightly increase under UV 254 at the 5 minute
interval but the difference was not statistically significant at the 95% confidence level.
This suggests that a linear fluorescent bulb may be capable of generating the same
44
electron-hole pairs necessary to reduce mercury at a trace concentration as a compact
ultra-violet bulb.
Positive results from the studies presented require further investigation to
understand the photcatalytic process under visible light. More detailed experiments
were conducted and discussed in the subsequent sessions focusing on the effect of
dissolved oxygen, the presence of hole scavengers/radical sinks, the effect of catalyst
dose contaminant initial concentration. Low doses can only be achieved by employing
catalyst slurries; however, additions of dry catalysts were used for the dose dependent
studies. Since the previous experiments suggest that photocatalysis may occur under
visible light, it was concluded that forming a water/catalyst slurry prior to running
experiments may result in the formation of radicals in the slurry.

45
Figure 5-1. STC and TiO2 time dependent control studies. Experimental conditions: 100 ppb of Hg, 1.5 ppmC of formic acid, 2 L/min nitrogen purge, 1 g/L STC, 76 mg/L TiO2.
Figure 5-2. Photoreduction of mercury using STC under nitrogen purge. Experimental
conditions: 100 ppb of Hg, 1.5 ppmC of formic acid (FA), 2 L/min nitrogen purge, 1 g/L STC.
0
0.1
0.2
0.3
0.4
0.5
0.6
0.7
0.8
0.9
1
5 15 30
C/C
O
Time (min)
STC, purge, w/ FA, dark
TiO2, purge, w/ FA, dark
0
0.1
0.2
0.3
0.4
0.5
0.6
0.7
0.8
0.9
1
0 10 20 30 40
C/C
O
Time (min)
STC, purge, w/ FA
STC, purge, no FA
STC, purge, w/ FA, dark
STC, purge, no FA, dark
46
Figure 5-3. Mercury oxidation in the absence of formic acid.
Figure 5-4. Photoreduction of mercury using STC without nitrogen purge. Experimental
conditions: 100 ppb of Hg, 1.5 ppmC of formic acid (FA), 1 g/L STC, 76 mg/L TiO2.
0
0.1
0.2
0.3
0.4
0.5
0.6
0.7
0.8
0.9
1
0 10 20 30 40
C/C
o
Time (min)
STC, no purge, w/ FA
STC, no purge, no FA
STC, no purge, no FA,dark
47
Figure 5-5. Photoreduction of mercury using STC in the presence of formic acid.
Experimental conditions: 100 ppb of Hg, 1.5 ppmC of formic acid (FA), 2 L/min nitrogen purge, 1 g/L STC.
Figure 5-6. Photoreduction of mercury using STC without formic acid. Experimental conditions: 100 ppb Hg, 2 L/min nitrogen purge, 1 g/L STC.
0
0.1
0.2
0.3
0.4
0.5
0.6
0.7
0.8
0.9
1
0 10 20 30 40
C/C
O
Time (min)
STC, no purge, w/ FA
STC, purge, w/ FA
STC, purge, w/ FA, dark
0
0.1
0.2
0.3
0.4
0.5
0.6
0.7
0.8
0.9
1
0 10 20 30 40
C/C
O
Time (min)
STC, purge, no FA
STC, no purge, no FA
STC, no purge, no FA,dark

48
Figure 5-7. Comparison of STC and TiO2 with nitrogen purge and formic acid. Experimental conditions: 100 ppb Hg, 1.5 ppmC of formic acid (FA), 2 L/min nitrogen purge, 1 g/L STC, 76 mg/L TiO2.
Figure 5-8. Photoreduction of mercury using TiO2 under nitrogen purge. 100 ppb Hg, 2
L/min nitrogen purge, 1 g/L STC, 76 mg/L TiO2.
0
0.1
0.2
0.3
0.4
0.5
0.6
0.7
0.8
0.9
1
0 10 20 30 40
C/C
o
Time (min)
STC, purge, w/ FA
TiO2, purge, w/ FA
STC, purge, w/ FA, dark
TiO2, purge, w/ FA, dark
0
0.1
0.2
0.3
0.4
0.5
0.6
0.7
0.8
0.9
1
0 20 40
C/C
O
Time (min)
TiO2, purge, no FA
STC, purge, no FA
TiO2, purge, no FA,dark
49
Figure 5-9. Photoreduction of mercury using STC under visible and UV 254 light. 100 ppb Hg, 1.5 ppmC formic acid (FA), 2 L/min nitrogen purge, 1 g/L STC.
0
0.1
0.2
0.3
0.4
0.5
0.6
0.7
0.8
0.9
1
0 10 20 30 40
C/C
o
Time (min)
STC, purge, w/ FA, UV254
STC, purge, w/ FA
STC, purge, w/ FA, dark
50
CHAPTER 6 OPTIMIZATION DOSE DEPENDENT STUDIES
Control Studies and Dose Determination
Experiments were conducted in the dark with and without the addition of formic
acid. It is evident from previous studies that the organic compound interferes with
mercury removal (in dark runs) by competing for adsorption. The previous doses used
for STC and TiO2 were 150 mg and 11.4mg respectively. This corresponded to a
concentration of 1 g/L of STC and an equivalent 76 mg/L of TiO2. It was determined
that the lowest, accurate mass of dry TiO2 measurable with the available balance was 2
mg. Therefore, the TiO2 doses chosen were 2, 4, 6, 8, and 10 mg. The corresponding
STC doses were 26, 53, 79, 105, and132 (Table 6-1). The dose of 0 mg represents the
experiments exposed to light only, without the addition of a catalyst
Effect of Formic Acid
The effects of formic acid on mercury reduction were investigated for both STC
and TiO2 with and without the presence of a nitrogen purge. The addition of formic acid
did not drastically effect the removal of mercury using STC without a nitrogen purge
(Figure 6-1). There seems to be a slight improvement in removal for STC doses above
50 mg. However, removal improved drastically when formic acid was added to the
solution in the presence of a nitrogen purge as seen in Figure 6-2.
The nitrogen purge reduces the amount of dissolved oxygen in solution, limiting
the formation of oxidizing radicals. As discussed earlier, dissolved oxygen competes
with mercury for the conduction band electron. The oxygen molecule will react with the
electron to form hydrogen peroxide which cleaves into hydroxyl radicals (Equations (2-
6 through (2-12). Therefore, two mechanisms exits that hinder mercury reduction in the
51
presence of oxygen: the competition for the conduction band electron and the formation
of oxidizing agents which my re-oxidize the reduced species of mercury. The addition of
formic acid may reduce the amount of oxidizing agents in solution, but it will not prevent
the competition for the conduction band electron as described by Equations (2-6
through (2-10 in Chapter 2.
When the amount of dissolved oxygen has been decreased by a nitrogen purge,
the effects of formic acid are amplified. There is no longer a compound competing with
mercury for the conduction band spot and the amount of oxidizing agents in solution is
decreased. The formic acid interacts with the valence band hole to prevent the
formation of radicals improving the reduction of mercury. Further research may be
proposed to investigate whether increasing the concentration of formic acid may
improve removal when there is dissolved oxygen present. The change in dose showed
little to no effect on the removal of mercury suggesting that lower concentrations must
be tested. However, achieving an accurate lower concentration may only possible by
using a pre-mixed slurry which may result in the formation of additional radicals if this
slurry is exposed to ambient light.
The same results were not obtained using titanium dioxide. The addition of formic
acid hindered removal drastically in the absence of a nitrogen purge (Figure 6-3). As
mentioned in the previous sections, formic acid competes for adsorption on to the
catalyst, blocking the mercury from reaching the photo-excited electrons from the
conduction band. This is evident by the drastic difference in removal between the two
dark reactions. The data were statistically different at the 95% confidence level for dark
and illuminated studies with no purge in the presence of formic acid. For the comparison
52
between illuminated and dark studies without a purge and without formic acid, all points
were statistically different at the 95% confidence level except for 10 mg. Therefore, the
photocatalytic reduction of mercury occurs using TiO2 when there is no organic
compound or nitrogen purge present.
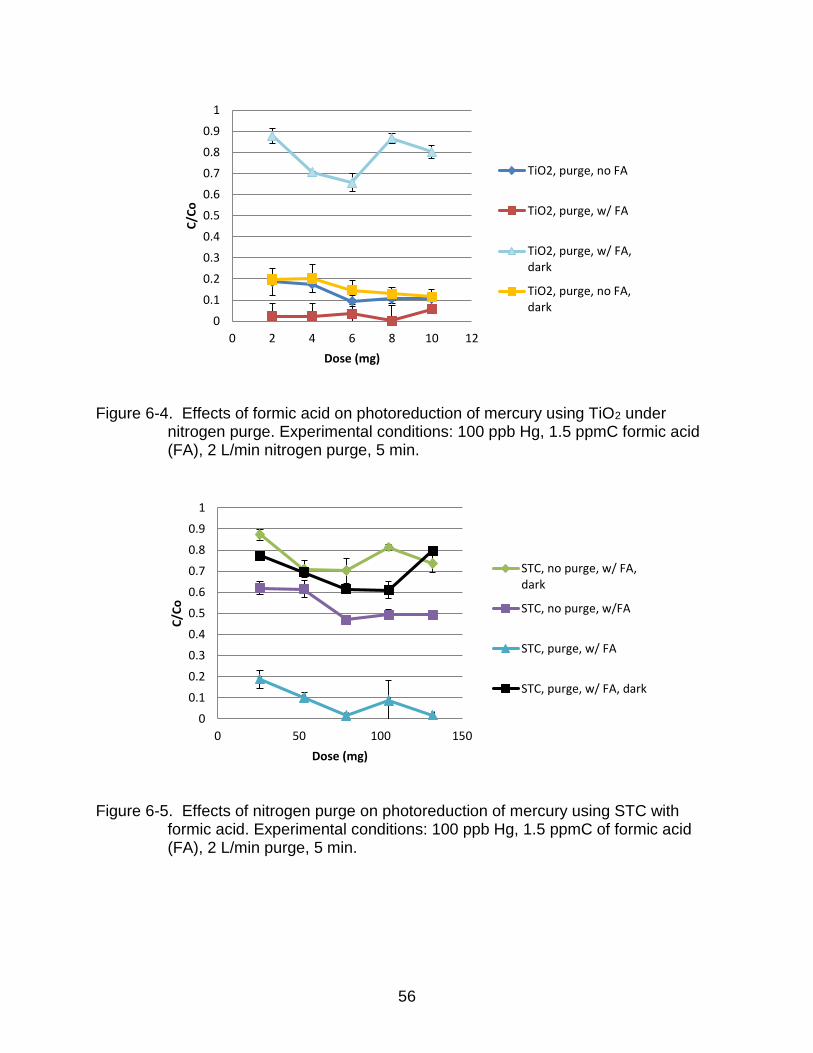
Figure 6-4 shows the effects of formic acid when a purge is present. It is
interesting to note that the presence of formic acid did not hinder removal in illuminated
studies. The improvement of removal by the addition of formic acid under nitrogen
purge was statistically significant for points 2, 4 and 10 mg but not for 6 and 8 mg
(illuminated purge with no formic acid compared to illuminated purge with formic acid).
Although formic acid competes with mercury for adsorption as seen in the dark studies,
it does not impede the mercury compound from reaching the conduction band electron.
In the absence of formic acid, removal was due to adsorption only, even in illuminated
studies.
Effect of Nitrogen Purge
When formic acid is present, the addition of a nitrogen purge greatly improves the
reduction of mercury using STC as seen in Figure 6-5, most likely by reducing the
oxidizing radicals as discussed earlier. Formic acid alone is not capable of combating
radicals formed by both the valence band hole (hydroxyl radicals) and the conduction
band electron (superoxide radicals) and removal never surpasses 52% in this scenario.
When the nitrogen purge is added, formation of radicals occurs only by hydroxide ions
at the valence band hole.
However, when no formic acid is present, the addition of a nitrogen purge is
insignificant (Figure 6-6). Enough hydroxyl radicals are formed to re-oxidize the
elemental mercury species. This may support the theory that the main oxidizing agents

53
generated by the electron-hole pair are hydroxyl radicals formed by the interaction
between water and/or hydroxide ions at the surface of the catalyst and the positive
valence band hole as described by in Chapter 2 by Equations (2-4 and (2-5 [26].
Similar results were observed using TiO2. The addition of a nitrogen purge made
a drastic difference when formic acid was present (Figure 6-7) but was insignificant in
the absence of formic acid (Figure 6-8). It was concluded that the generation of radicals
by the dissolved oxygen affects removal negatively when there are no additional
hydroxyl radicals being formed. In the absence of formic acid, radicals are being
produced by the positive valence band hole at the same rate that mercury is reduced by
an electron from the conduction band. Therefore, removal of mercury reaches
equilibrium whether or not additional radicals are formed by the dissolved oxygen.
Figure 6-9 and Figure 6-10 summarize the results of all experiments using STC
and TiO2 respectively. By comparing results altogether, it is evident that the best
mercury removal scenario using STC includes the presence of formic acid exposed to a
nitrogen purge. For TiO2, the difference is not as drastic, but the best removal
environment also includes the combination of formic acid with a nitrogen purge. For
TiO2, studies with no formic acid and no nitrogen purge performed just as well as having
both components present, but it was concluded that removal was due to adsorption
only.

54
Table 6-1. Catalyst doses for dose dependent studies.
Catalyst Dose (mg)
TiO2 0 2 4 6 8 10
STC 0 26 53 79 105 132
. Figure 6-1. Effects of formic acid on photoreduction of mercury using STC without a
purge. Experimental conditions: 100 ppb of Hg, 1.5 ppmC formic acid (FA), 5 min.
0
0.1
0.2
0.3
0.4
0.5
0.6
0.7
0.8
0.9
1
0 50 100 150
C/C
o
STC (mg)
STC, no purge, no FA
STC, no purge, no FA,dark
STC, no purge, w/ FA,dark
STC, no purge, w/FA

55
Figure 6-2. Effects of formic acid on photoreduction of mercury using STC under
nitrogen purge. Experimental conditions: 100 ppb Hg, 1.5 ppmC formic acid (FA), 2L/min purge, 5 min.
Figure 6-3. Effects of formic acid on photoreduction of mercury using TiO2 without nitrogen purge. Experimental conditions: 100 ppb Hg, 1.5 ppmC formic acid (FA), 5 min.
0
0.1
0.2
0.3
0.4
0.5
0.6
0.7
0.8
0.9
1
0 50 100 150
C/C
o
STC (mg)
STC, purge, no FA
STC, purge, w/ FA
STC, purge, w/ FA, dark
0
0.1
0.2
0.3
0.4
0.5
0.6
0.7
0.8
0.9
1
0 2 4 6 8 10 12
C/C
o
Dose (mg)
TiO2, no purge, no FA
TiO2, no purge, no FA,dark
TiO2, no purge, w/ FA
TiO2, no purge, w/ FA,dark
56
Figure 6-4. Effects of formic acid on photoreduction of mercury using TiO2 under
nitrogen purge. Experimental conditions: 100 ppb Hg, 1.5 ppmC formic acid (FA), 2 L/min nitrogen purge, 5 min.
Figure 6-5. Effects of nitrogen purge on photoreduction of mercury using STC with formic acid. Experimental conditions: 100 ppb Hg, 1.5 ppmC of formic acid (FA), 2 L/min purge, 5 min.
0
0.1
0.2
0.3
0.4
0.5
0.6
0.7
0.8
0.9
1
0 2 4 6 8 10 12
C/C
o
Dose (mg)
TiO2, purge, no FA
TiO2, purge, w/ FA
TiO2, purge, w/ FA,dark
TiO2, purge, no FA,dark
0
0.1
0.2
0.3
0.4
0.5
0.6
0.7
0.8
0.9
1
0 50 100 150
C/C
o
Dose (mg)
STC, no purge, w/ FA,dark
STC, no purge, w/FA
STC, purge, w/ FA
STC, purge, w/ FA, dark

57
Figure 6-6. Effects of nitrogen purge on photoreduction of mercury using STC with no formic acid. Experimental conditions: 100 ppb Hg, 2 L/min nitrogen purge, 5 min.
Figure 6-7. Effects of nitrogen purge of photoreduction of mercury using TiO2 with
formic acid. Experimental conditions: 100 ppb of Hg, 1.5 ppmC formic acid (FA), 2 L/min nitrogen purge, 5 min.
0
0.1
0.2
0.3
0.4
0.5
0.6
0.7
0.8
0.9
1
0 50 100 150
C/C
o
Dose (mg)
STC, no purge, no FA
STC, purge, no FA
STC, no purge, no FA,dark
0
0.1
0.2
0.3
0.4
0.5
0.6
0.7
0.8
0.9
1
0 2 4 6 8 10 12
C/C
o
Dose (mg)
TiO2, no purge, w/ FA
TiO2, purge, w/ FA
TiO2, no purge, w/ FA,dark
TiO2, purge, w/ FA, dark

58
Figure 6-8. Effects of nitrogen purge on photoreduction of mercury using TiO2 without
formic acid. Experimental conditions: 100 ppb of Hg, 2 L/min nitrogen purge, 5 min.
Figure 6-9. Photoreduction of mercury using STC: comparison on all scenarios.
0
0.1
0.2
0.3
0.4
0.5
0.6
0.7
0.8
0.9
1
0 2 4 6 8 10 12
C/C
o
Dose (mg)
TiO2, purge, no FA
TiO2, no purge, no FA
TiO2, no purge, no FA,dark
TiO2, purge, no FA, dark
-0.1
0
0.1
0.2
0.3
0.4
0.5
0.6
0.7
0.8
0.9
1
0 50 100 150
C/C
o
Dose (mg)
STC, no purge, no FA
STC, purge, no FA
STC, no purge, no FA,dark
STC, no purge, w/ FA,dark
STC, no purge, w/FA
STC, purge, w/ FA

59
Figure 6-10. Photoreduction of mercury using TiO2: comparison of all scenarios.
0
0.1
0.2
0.3
0.4
0.5
0.6
0.7
0.8
0.9
1
0 2 4 6 8 10 12
C/C
o
Dose (mg)
TiO2, purge, no FA
TiO2, no purge, no FA
TiO2, no purge, no FA,dark
TiO2, no purge, w/ FA
TiO2, no purge, w/ FA,dark
TiO2, purge, w/ FA
TiO2, purge, no FA,dark
60
CHAPTER 7 MERCURY CONCENTRATION DEPENDENT STUDIES
Control Studies
Studies were conducted in the dark with mercury initial concentrations of 100,
500 and 1000 parts per billion. The catalyst concentration was 1 g/L for STC and the
equivalent 76 mg/L for TiO2. Experiments were conducted in the presence of formic acid
and nitrogen purge for 5 minutes. STC and TiO2 performed similarly with an initial
concentration of 500 ppb of Hg; removing less than 20%. STC outperformed TiO2 at the
higher concentration of 1000 ppb (Figure 7-1).
Comparison of Visible Light vs. UV 254
Experiments were conducted for all three concentrations using STC (Figure 7-2)
and TiO2 (Figure 7-3) exposed to visible light and UV 254. As hypothesized, removal of
mercury increased as initial concentration decreased when using visible light. At an
initial concentration of 100 ppb, there was no statistical difference in removal using
visible light compared to UV 254. Utilizing visible light source is just as effective in
reducing mercury at low concentrations compared to ultra-violet light. A lower
concentration of 50 ppb was investigated using STC (Figure 7-4). There was no
statistical difference in removal between visible light and UV 254 at this concentration
reinforcing the conclusion the visible light is capable of photoreducing low
concentrations of mercury.
Two electrons are required to reduce Hg2+ to Hg0. The electrons are provided by
the surface of the photocatalyst after excitation by light. Since the excitation of electrons
is directly proportional to the number of photons in the required energy level (370-380
nm), the reduction of mercury will also be directly proportional to the amount of photons.
61
If higher concentrations of mercury exist (more Hg2+), then more electrons will be
required for reduction. Visible light emits only a limited number of UVA photons,
therefore, sufficient electrons would not be produced to reduce higher mercury
concentrations. Figure 7-5 portrays a representation of the photocatalytic reduction of
higher concentrations of aqueous mercury (above 100 ppb).

62
Figure 7-1. Mercury concentration dependent control studies. Experimental conditions: 1 g/L STC, 76 μg/L TiO2, 1.5 ppm formic acid, 2 L/min nitrogen purge, 5 min.
Figure 7-2. Comparison of UV 254 vs. visible light using STC. Experimental conditions:
1g/L STC, 1.5 ppmC formic acid, 2 L/min nitrogen purge, 5 min.
0
0.1
0.2
0.3
0.4
0.5
0.6
0.7
0.8
0.9
100 500 1000
C/C
O
Initial Hg Conc. (ppb)
STC, Dark
TiO2, Dark
0
0.1
0.2
0.3
0.4
0.5
0.6
0.7
0.8
0.9
1
100 500 1000
C/C
O
Initial Hg Conc. (ppb)
STC, UV 254
STC, Visible Light
STC, Dark

63
Figure 7-3. Comparison of UV 254 vs. visible light using TiO2. Experimental conditions: 76 μg/L TiO2, 1.5 ppmC formic acid, 2 L/min nitrogen purge, 5 min.
Figure 7-4. Comparison of visible light vs. UV 254 using STC at lower Hg concentrations. Experimental conditions: 1g/L STC, 1.5 ppm formic acid, 2 L/min nitrogen purge, 5 min.
0
0.1
0.2
0.3
0.4
0.5
0.6
0.7
0.8
0.9
1
100 500 1000
C/C
O
Initial Hg Conc. (ppb)
TiO2, UV 254
TiO2, Visble Light
TiO2, Dark
0
0.1
0.2
0.3
0.4
0.5
0.6
0.7
0.8
0.9
1
50 100
C/C
O
Initial Hg Conc. (ppb)
STC, Visible Light
STC, UV

64
Figure 7-5. Representation of photocatalytic reduction of high concentrations of aqueous mercury.
hv < 400 nm
Hg+
Hg2+
Hg2+
Hg2+
Hg2+
Hg2+
Hg2+
hv < 400 nm
hv > 400 nm
hv > 400 nm
Hg
+

65
CHAPTER 8 CONCLUSIONS
The purpose of this study was to enhance visible light photocatalysis by
modifying the removal process rather than modifying the catalyst, The co-mixing of
different catalysts does not affect the photocatalytic removal of mercury. The slightly
increased removal evident in the co-mixed STC+WO3 studies was due to enhanced
adsorption. However, the silica-titania composite performed quite well as a single
catalyst under visible light and the positive results lead to further investigation, including
comparison with regular titanium dioxide.
STC and TiO2 performed similarly in illuminated experiments with visible light
suggesting that silica does not lower the band gap energy of TiO2. Studies were
conducted in different scenarios in order to understand the effect of dissolved oxygen,
the presence of an organic compound and catalyst dose. It was concluded that the
addition of formic acid greatly improved removal by acting as a radical sink, preventing
the re-oxidation of Hg0 to Hg2+. Dissolved oxygen only affected removal negatively if
formic acid was present. In the absence of an organic compound, re-oxidation of
mercury occurred whether or not there was dissolved oxygen.
Lastly, it was determined that visible light is capable of emitting enough photons
to reduce trace levels of mercury. Results showed similar removal using visible light
compared to UV 254 at low initial concentrations of mercury (100 ppb), but poor
removal at high initial concentrations of 1000 ppb. It is suggested that visible light emits
few photons at a range slightly below 400 nm which may be capable of producing some
electron-hole pairs. Future work may be conducted to create a model of light intensity
needed based on contaminant concentrations.
66
Visible light photocatalysis may be employed as a polishing step to further
reduce contaminant concentrations. Cheaper, more widely used process such as
precipitation and carbon adsorption can reduce the bulk of contaminants found in
various waste streams but these methods may not be feasible to reduce levels below
the parts per billion range. Visible light photocatalysis provides a safe method of
reducing multiple contaminants through both oxidation and reduction reactions.
67
LIST OF REFERENCES
[1] M. Fujiki and S. Tajima, "The pollution of Minamata Bay by mercury," Water Sci. Tech., vol. 25, no. 11, pp. 133-140, 1992.
[2] K. Eto, "Minamata Disease," Neuropathology, vol. 20, no. 1, pp. 14-19, 2000.
[3] U.S. Environmental Protection Agency, "Basic Information about Mercury in Drinking Water," May 2012. [Online]. Available: http://water.epa.gov/ drink/contaminants/basicinformation/mercury.cfm. [Accessed January 2014].
[4] United Nations Environmental Programme, "Minamata Convention on Mercury," October 2013. [Online]. Available: http://www.mercuryconvention.org/Portals/ 11/documents/publications/MinamataConventiontextEn.pdf. [Accessed January 2014].
[5] M. Amyot, G. Mierle, D. Lean and D. McQueen, "Sunlight-induced formation of dissolved gaseous mercury in lake waters," Environ. Sci. Tech., vol. 28, pp. 2366-2371, 1994.
[6] UNEP, "Global mercury assesment report," United Nations Environmental Programme, New York, 2002.
[7] E. G. Pacyna, J. M. Pacyna, K. Sundseth, J. Munthe, K. Kindbom, S. Wilson, F. Steenhuisen and P. Maxson, "Global emission of mercury to the atmosphere from antropogenic sources in 2005 and projections to 2020," Atmospheric Environment, vol. 44, no. 20, pp. 2487-2499, 2010.
[8] S. Serre and G. Silcox, "Adsorption of elemental mercury on the residual carbon in coal fly ash," Ind. Chem. Eng. Res., vol. 39, no. 6, pp. 1723-1730, 2000.
[9] M. Galperin, M. Sofiev and E. Mantseva, "A model of the chemical transformation of mercury and its long-range atmospheric transport," in Global and regional mercury cycles: sources, fluxes and mass balances, Dordretch, The Netherlands, Kluwer Academic Publishers, 1996.
[10] U.S. Environmental Protection Agency, "Clean Air Mercury Rule," March 2011. [Online]. Available: http://www.epa.gov/camr/. [Accessed January 2014].
[11] U.S. Environmental Protection Agency, "Mercury and Air Toxics Standards Basic Information," April 2012. [Online]. Available: http://www.epa.gov/mats/ basic.html. [Accessed January 2014].
[12] U.S. Environmental Protection Agency, "Impaired Water and Total Maximum Daily Loads," December 2013. [Online]. Available: http://water.epa.gov/ lawsregs/lawsguidance/cwa/tmdl/. [Accessed January 2014].
68
[13] P. Tchounwou, W. Ayensu, N. Ninashvili and D. Sutton, "Environmental Exposure to Mercury and its Toxicopathologic Implications for Purblic Health," Env. Toxicology, vol. 18, no. 3, 2003.
[14] T. Clarkson, "Metal toxicity in the central nervous system," Env. Health Perspectives, vol. 75, pp. 59-64, 1987.
[15] S. Witt, "OSHA safety hazard information bulletin on dimethylmercury," [Online]. Available: http://www.osha.gov/dts/hib/hib_data/hib19980309.html.
[16] World Health Organization, "Methylmercury. International Program on Chemical Safety," Geneva , 1990.
[17] Harada, "Congenital Minamata disease: intrauterine methylmercury poisoning," Teratology, vol. 18, no. 2, pp. 285-288, 1978.
[18] Y. Harada, "Congenital (or fetal) Minamata disease.," Kumamato University, Kumamato, Japan, 1968.
[19] C.-J. Lin and S. Pehkonen, "The chemistry of atmospheric mercury: a review," Atmospheric Environment, vol. 33, pp. 2067-2079, 1999.
[20] O. Lindqvist and H. Rodhe, "Atmospheric Mercury - a reveiw," Tellus, vol. 37, no. B, pp. 136-159, 1985.
[21] F. Morel, A. Kraepiel and M. Amyot, "The Chemical Cycle and Bioaccumulation of Mercury," Annual Review of Ecology and Systematics, vol. 29, pp. 543-566, 1998.
[22] H. Hahne and W. Kronntje, "Significance of pH and Chloride Concentration on Behavior of Heavy Metal Pollutants: Mercury (II), Cadmium (II), Zinc (II), and Lead (II)," Journal of Environmental Quality, vol. 2, no. 4, pp. 444-450, 1973.
[23] H. Byrne, Adsorption, Photocatalysis, and Photochemistry of Trace Level Aqueous Mercury, Gainesville: University of Florida, 2009.
[24] K. Kabra, R. Chaudhary and R. Sawhney, "Treatment of hazardous inorganic and organic compounds through aqueous phase photocatalysis," Ind. Eng. Chem. Res., vol. 43, pp. 7683-7696, 2004.
[25] O. Legrini , E. Oliveros and A. M. Braun, "Photochemical Processes for Water Treatment," Chem. Rev., vol. 93, pp. 671-698, 1993.
[26] R. W. J. Matthews, "Hydroxylation reactions induced by near-ultraviolet photolysis of aqueous titanium dioxide suspensions," Chem. Soc. Faraday Trans., vol. 80, p. 457, 1984.

69
[27] R. Bickley, T. Gonzalez-Carreno, J. Lees, L. Palmisiano and R. Tilley, "A structural inverstigation of titanium dioxide photocatalyts," Journal of Solid State Chem., vol. 92, pp. 178-190, 1990.
[28] M. Litter, "Heterogeneous photocatalysis, transition metal ions in photocatalytic systems," Applied Catalysis B: Environmental , vol. 23, pp. 89-114, 1999.
[29] K. Okamoto, Y. Yamamoto, H. Tanaka and A. Itaya, "Kinetics of heterogeneous photocatalytic decomposition of phenol over anatase TiO2 powder," Bull Chem Soc., vol. 58, pp. 2023-2028, 1985.
[30] R. Cundall, R. Rudham and M. Salim, "Photocatalytic oxidation of propan-2-ol in the liquid phase by rutile," J. Chem. Soc., Faraday Trans. , vol. 72, pp. 1642-1651, 1976.
[31] P. Harvey, R. Rudham and S. Ward, "Photocatalytic oxidation of liquid propan-2-ol by titanium dioxide," J. Chem. Soc., Faraday Trans. 1, vol. 79, pp. 1381-1390, 1983.
[32] L. B. Khalil, W. E. Mourad and M. W. Rophael, "Photocatalytic reduction of environmental pollutant Cr(VI) over some semiconductors under UV/visible light illumination," Applied Catalysis B: Environmental , vol. 17, no. 3, pp. 267-273, 1998.
[33] K. Rajeshwar, C. R. Chenthamarakshan and Y. M. Wenjian Sun, "Cathodic photoprocesses on titania films and in aqueous suspensions," Journal of Electoanalytical Chemistry, Vols. 538-539, pp. 173-182, 2002.
[34] X. Wang, S. Pehkonen and A. Ray, "Photocatalytic reduction of Hg(II) on commercial TiO2 catalysts," Electrochemica Acta, vol. 49, no. 9-10, pp. 1435-1444, 2004.
[35] M. Ward, J. White and A. Bard, "Electrochemical investigation of energetics of particulate titanium dioxide photcatalysts. The methyl-viologen acetate system," J. Am. Chem. Soc., vol. 105, pp. 27-31, 1983.
[36] Y. Xu and M. Shoonen, "The absolute energy positions of conduction and valence bands of selected semiconducting minerals," American Mineralogist , vol. 85, no. 3-4, pp. 543-556, 2000.
[37] S. Sanuki, K. Shako, S. Nagaoka and H. Majima, "Photocatalytic reduction of Se ions using suspended anatase powders," Mat. Trans., JIM, vol. 41, no. 7, pp. 799-805, 2000.
[38] N. Serpone, Y. K. Ah-You, T. P. Tran and R. Harris, "AM 1 simulated sunlight photoreduction and elimination of Hg (II) and CH3Hg(II) chloride salts from aqueous suspensions of titanium dioxide," Solar Energy, vol. 39, no. 6, pp. 491-498, 1987.
70
[39] S. Botta, D. Rodriguez, A. Leyva and M. Litter, "Feature of the transformation og Hg(II) by heterogeneous photocatalysis over TiO2," Catalysis Today, vol. 76, no. 2-4, pp. 247-258, 2002.
[40] T. Tan, D. Beydoun and R. Amal, "Effects of organic hole scavengers on the photocatalytic reduction of selenium ions," Journal of Photochem. and Photobio. A: Chemistry, vol. 159, pp. 273-280, 2003.
[41] S. Rengaraj and X. Z. Li, "Enhanced photocatalytic reduction reaction over Bi3+-TiO2 nantoparticles in the presence of formic acid as a hole scavenger," Chemosphere, vol. 66, no. 5, pp. 930-938, 2007.
[42] M. A. Fox and M. Dulay, "Heterogenous photocatalysis," Chem. Rev., vol. 93, pp. 341-357, 1993.
[43] D. Bhatkhande, V. Pangarkar and A. Beenackers, "Photocatalytic degradation for environmental applications: a review," Journal of Chem. Tech. and Biotech. , vol. 77, no. 1, pp. 102-116, 2001.
[44] A. Fujishima, T. Rao and D. Tryk, "Titanium dioxide photocatalysis," Journal of Photochem. and Photobio. C: Photochem. Reviews, vol. 1, no. 1, pp. 1-21, 2000.
[45] J. B. Varley, A. Janotti and C. G. Van de Walle, "Mechanism of visible-light photocatalysis in nitrogen-doped TiO2," Advanced Materials, vol. 23, no. 20, pp. 2343-2347, 2011.
[46] D. Chen and A. Ray, "Removal of toxic metal ions from wastewater by semiconductor photocatalysis," Chem. Eng. Sci., vol. 56, no. 4, pp. 1561-1570, 2001.
[47] J. Critteden, J. Liu, D. Hand and D. Perram, "Photocatalytic oxidation of chlorinated hydrocarbons in water," Water Res. , vol. 31, pp. 429-438, 1997.
[48] D. Ollis, E. Pellizzetti and N. Serpone, "Destruction of water contaminants," Env. Sci. Technol., vol. 25, pp. 1523-1528, 1991.
[49] M. Seery, R. George, P. Floris and S. Pillai, "Silver doped titanium dioxide nanomaterials for enhanced visible light photocatalysis," Journal of Photochem. and Photobio. A: Chemistry, vol. 189, no. 2-3, pp. 258-263, 2007.
[50] D. Chatterjee and S. Dasgupta, "Visible light induced photocatalytic degradation of organic pollutants," Journal of Photochem. and Photobio. C: Photchem. Reviews, vol. 6, pp. 186-205, 2005.
[51] T. Umebayashi, T. Yamaki, H. Itoh and K. Asai, "Bad gap narrowing of titanium dioxide by sulfur doping," Applied Physics Letters, vol. 81, no. 3, p. 454, 2002.

71
[52] M. Mrowetz, W. Balcerski, A. J. Colussi and M. Hoffmann, "Oxidative power of nitrogen-doped TiO2 photocatalysts under visible light illumination," J. Phys. Chem. B , vol. 108, no. 45, pp. 17269-17273, 2004.
[53] R. Asahi, T. Morikawa, T. Ohwaki, K. Aoki and Y. Taga, "Visible-light photocatalysis in nitrogen-doped titanium oxides," Science, vol. 293, p. 269, 2001.
[54] C.-y. Wany, C. Bottcher, D. Bahnemann and J. Dohrmann, "A comparative study of nanometer sized Fe(III)-doped TiO2 photocatalysis: synthesis, characterization and activity," J. Mater. Chem., vol. 13, pp. 2322-2329, 2003.
[55] M. Liu, X. Qiu, M. Miyauchi and K. Hashimoto, "Cu(II) oxide amorphous nanoclusters grafted Ti3+ self-doped TiO2: an efficient visible light photocatalyst," Chem. of Mat., vol. 23, pp. 5282-5286, 2011.
[56] H. Byrne and D. Mazyck, "Removal of trace levels of aqueous mercury by adsorption and photocatalysis on silica-titania composites," Journal of Hazardous Materials , pp. 915-919, 2009.
[57] General Electric, "GE Lighting Product Catalog," 2013. [Online]. Available: http://genet.gelighting.com/LightProducts/Dispatcher?REQUEST=COMMERCIALSPECPAGE&PRODUCTCODE=10415&BreadCrumbValues=Lamps_Linear%20Fluorescent%5EFull%20Wattage&SearchFieldCode=null.
[58] C. Senior, A. Sarofim, T. Zeng, J. Heble and R. Mamani-Paco, "Gas-phase transformations of mercury in coal fired power plants," Fuel Processing Tech., vol. 63, pp. 197-213, 1999.
72
BIOGRAPHICAL SKETCH
Erica Wallace Gonzaga was born in Saint Paul, MN. Her family moved to her
mother’s home country of Brazil when she was 4 years old. Erica attended the
American School of Brasilia, Brazil and moved to Fort Lauderdale, FL. after graduation
in 2004. She started studying architecture at Broward College but after 2 years, decided
to change her major to engineering. Erica was accepted to the University of Florida
Biological Engineering program as a transfer student in the spring of 2009. She
graduated with her bachelor’s degree in December 2011 and spent the following
semester working as a lab assistant for a PhD candidate in the department of
Environmental Engineering. Erica was accepted as a Master of Engineering student in
the Department of Environmental Engineering in the fall of 2012. One week before
starting graduate school, Erica married her husband, Luiz Gonzaga, who is currently
finishing is residency in Prosthodontics in the College of Dentistry at the University of
Florida.