© 2016 christopher kuprianczyk
TRANSCRIPT

© 2016 Christopher Kuprianczyk

FACTORS AFFECTING PROBABILISTIC RISK ASSESSMENT OF TRANSPORTATION OF
HAZARDOUS MATERIAL BY RAIL
BY
CHRISTOPHER KUPRIANCZYK
THESIS
Submitted in partial fulfillment of the requirements
for the degree of Master of Science in Nuclear, Plasma, and Radiological Engineering
in the Graduate College of the
University of Illinois at Urbana-Champaign, 2016
Urbana, Illinois
Advisers:
Professor Clifford E. Singer, Director of Research
Professor William R. Roy

ii
Abstract
Transportation of hazardous material by rail is a fundamental infrastructural operation performed on
a large scale within the United States yearly. Material release is a possibility associated with shipment
failure that incurs large costs, and thus minimizing probability of release is of high importance. The
approach to minimize this risk varies based on the type of material being transported. This thesis focuses
on a comparison of risk analysis, risk perception, and regulation of highly radioactive material (spent
nuclear fuel / high level radioactive waste) and flammable liquid material (with an emphasis on crude oil
due to the high yearly volume of transport) being transported by rail.
In this thesis, a probabilistic risk assessment of the hazardous material transportation operations
by rail is performed. This assessment yields risk importance measures for major failure (here meaning
material release). The results indicate that prevention of derailment itself is the most important risk
reduction measure, followed by preservation of the structural integrity of containers, should derailment
occur. However, various factors affect the perception of operational risk. These factors depend on the type
of hazardous material being transported, thereby affecting the perceived failure probability and associated
costs of failure. Four factors affecting risk perception are identified, and their effects on parameters within
the risk assessment are analyzed. These factors are natural versus industrial risks, chronic versus
catastrophic risks, familiar versus unfamiliar risks, and risks managed by trustworthy versus
untrustworthy sources. Improving risk perception can be done by implementing a consent-based approach
and by educating the public about the transported hazardous materials.
Regulation of transportation operations is one approach by which risk can be minimized.
In this thesis, an analysis of rail regulations is made with a focus on comparing the relative regulatory
stringency for radioactive material and flammable liquid material shipments. The regulations analyzed are
those that differ between the two material classes. The regulations affecting standard operation, such
as speed, train size, and brake systems, are more stringent for flammable liquid carrying trains.
Regulations concerning hypothetical accident conditions (drop, puncture, thermal, and immersion) are
stricter for containers of radioactive material. A more integrated probabilistic risk assessment would
likely strike a different balance between regulatory requirements for flammable liquids and radioactive
materials, but implementing any such approach would need to account for how factors affecting risk
perception affect the rulemaking process.

iii
Acknowledgements
I would like to thank my internship mentors, particularly Matthew R Feldman and Dr. Kevin J. Connolly
of Oak Ridge National Lab, for introducing me to the topic and issues of hazardous material
transportation during my two internships in the summers of 2014 and 2015. They provided invaluable
guidance to the writing and research process, particularly for this subject material. I would like to
acknowledge my two academic advisers, Dr. Clifford Singer and Dr. William Roy, for providing
guidance in the thesis writing process and introducing me to suggestions and material I would not have
otherwise been aware of. In addition, I would like to thank other members of the NPRE department for
guiding me through my academic years. I would like to acknowledge my friend and colleague, Robert
Geringer, who has provided encouragement and input through my undergraduate and graduate years.
I would also like to acknowledge another two of my colleagues, Kathryn Mummah and Joseph
Rajchwald, with whom I have collaborated on papers from which I have borrowed material to include
in this thesis. I would like to acknowledge the National Academy for Nuclear Training for providing me
with a fellowship for financial support for much of this thesis-writing period.
iv
Table of Contents 1. Introduction ....................................................................................................................................... 1
1.1 Hazardous Materials ..................................................................................................................... 1
1.2 Risk ............................................................................................................................................... 2
1.3 Regulation ..................................................................................................................................... 3
2. Probabilistic Risk Assessment .......................................................................................................... 6
2.1 Event Tree ..................................................................................................................................... 7
2.2 Initiating Event .............................................................................................................................. 7
2.3 End States...................................................................................................................................... 9
2.4 Top Event: Operation Failure ..................................................................................................... 11
2.5 Top Event: Hazmat Car Involvement ......................................................................................... 12
2.6 Top Event: Hazardous Material Release .................................................................................... 15
2.7 Probability and Risk Calculations .............................................................................................. 18
2.8 Risk Importance Measures .......................................................................................................... 20
2.9 Takeaways from the PRA and Risk Importance Measures ........................................................ 22
3. Risk Perception ............................................................................................................................... 23
3.1 Factors Affecting Risk Perception .............................................................................................. 23
3.2 Natural versus Industrial ............................................................................................................. 24
3.3 Chronic versus Catastrophic ....................................................................................................... 26
3.4 Familiar versus Unfamiliar ......................................................................................................... 28
3.5 Trustworthy versus Untrustworthy ............................................................................................. 30
3.6 Risk Perception Summary and Future Work .............................................................................. 32
4. Risk Reduction by Regulation ........................................................................................................ 34
4.1 Accident Prevention and Mitigation Parameters......................................................................... 34
4.1.1 Speed ................................................................................................................................... 35
4.1.2 Train Size ............................................................................................................................ 38
4.1.2.1 Train Length ....................................................................................................................... 38
4.1.2.2 Car Weight ...................................................................................................................... 42
4.1.3 Brake Systems ..................................................................................................................... 42
4.2 Hypothetical Accident Conditions .............................................................................................. 44
4.2.1 Drop Test ............................................................................................................................ 45
4.2.2 Puncture Test ...................................................................................................................... 46
4.2.3 Thermal Test ............................................................................................................................. 54
4.2.4 Immersion Test ................................................................................................................... 58

v
4.3 Regulation Summary ................................................................................................................. 59
5. Approaches to Risk Reduction and Future Work ........................................................................... 61
5.1 Risk Perception Sensitivity and Analysis .................................................................................. 61
5.2 Regulatory Effects and Reduction Approaches .......................................................................... 65
5.3 Conclusions ................................................................................................................................. 67
5.4 Future Work ................................................................................................................................ 68
6. References ....................................................................................................................................... 70
Appendix A: Data used from FRA Office of Safety Analysis .................................................................... 74

1
1. Introduction
Transportation of hazardous material (i.e of hazmat) occurs on a large scale in the United States.
On average, over 7,600 railroad cars carrying hazmat are transported via U.S. railways yearly [1]. The
purpose of this thesis is to analyze the risk of this transportation of hazardous material by rail, and to use
this analysis to identify pathways by which risk can be reduced. One pathway that already exists
is regulation of railroad transport. Several regulations will be analyzed in terms of how they affect the risk
analysis. The results of the analysis do not provide the entire picture, as various factors affect the
perception of risk, leading to a difference between the perceived risk and the risk as calculated in the
analysis. These factors will also be discussed in detail based on how they affect the risk analysis.
1.1 Hazardous Materials
The hazardous materials of focus in this report are radioactive material and flammable liquid. Radioactive
material is one focus because of the upcoming need for large-scale transportation of spent nuclear fuel
(SNF) and high level radioactive waste (HLRW), sometimes referred to together as high level radioactive
material (HLRM). The United States has 99 operating nuclear power reactors at 65 sites, as well as 13
shutdown reactor sites, and thus has a high rate of SNF production. Existing U.S. reactors have produced
and are estimated to produce a combined total of 140,000 metric tons of heavy metal waste (MTHM) [3],
all of which will likely require transportation to a possible interim storage facility (ISF) and/or eventual
repository site. Many nuclear power plant sites already have nearby railhead access, and those without
functioning railheads can have them installed at relatively low cost, making rail one of the most efficient
modes of HLRM transportation.
Railroads are an integral part of the U.S. shipment infrastructure for cargo other than SNF/HLRW
because of the routing flexibility and speed at which shipments of vast quantities of material can take
place. Near 40% of domestic transport, in ton-miles, is made via rail yearly. [4] With over 140,000 miles
of track, the rail system is expansive and essential for U.S. domestic infrastructure. [5] However, despite
the extensiveness of the rail system, its safety and reliability can be called into question. Train accidents
such as derailments do not always draw considerable attention, but, when those trains are carrying
hazardous material, the accidents can evolve into larger scale events, potentially leading to skepticism
regarding the general safety of railroad shipments.
The discovery of crude oil in the Bakken Formation of North Dakota has caused a spike
in domestic transport of crude by rail (CBR) in recent years. The Bakken Formation contains shale oil that

2
has recently become more accessible due to the development of hydraulic fracturing (fracking)
technology. The oil found in the Bakken Formation, however, is sweet (i.e. low in sulfur) and light [6],
which causes it to have a more volatile nature than typical crude oil. So, when trains transporting this oil
derail, large-scale events are more likely to occur. The incidents related to transportation of this oil can
lead to skepticism in the reliability in the rail network for any hazardous material transportation. A result
of this thesis is an analysis of differences in risk of transporting material by rail based on the type
of material being transported, and the containers that they are transported in.
1.2 Risk
Risk is involved in any activity that involves the potential for failure. It is quantified by the product of the
probability of failure and the consequence of that failure.
(1)
Risk is quantified in whichever units the consequence is described by. This can be money, lives, time,
or any other source of loss. Risk assessment is an important tool in assessing large-scale operations prior
to performing them in order to minimize consequences and failure frequency. A probabilistic risk
assessment (PRA) of hazardous material transportation by rail is performed in Chapter 2 of this thesis,
including information on the tools used to perform the assessment and a risk importance measure analysis
for all failure modes. All cost values are in U.S. dollars (USD) at face value at the time the data was
reported.
Risk as calculated in the PRA is not always the same as risk perceived, especially by those who
do not fully understand or similarly assess the values factors involved in the PRA [7]. Various factors
affect risk perception, which can cause a misappropriation of efforts to risk reduction, or a
misrepresentation of relative risk between various activities, compared to a PRA approach with a different
risk consequence evaluation. In Chapter 3 of this report, four risk perception factors will be identified and
related to the topic of hazardous material transportation by rail. In particular, a comparison of risk
perception between SNF/HLRW and CBR will be made based upon these factors. These factors do not
typically affect the risk calculation results directly, but rather affect individual identifiable parameters
within the PRA, which then affect the final risk calculation result. For each factor, the affected parameters
within the PRA are identified, and their effect on the final risk calculation is determined.
3
1.3 Regulation
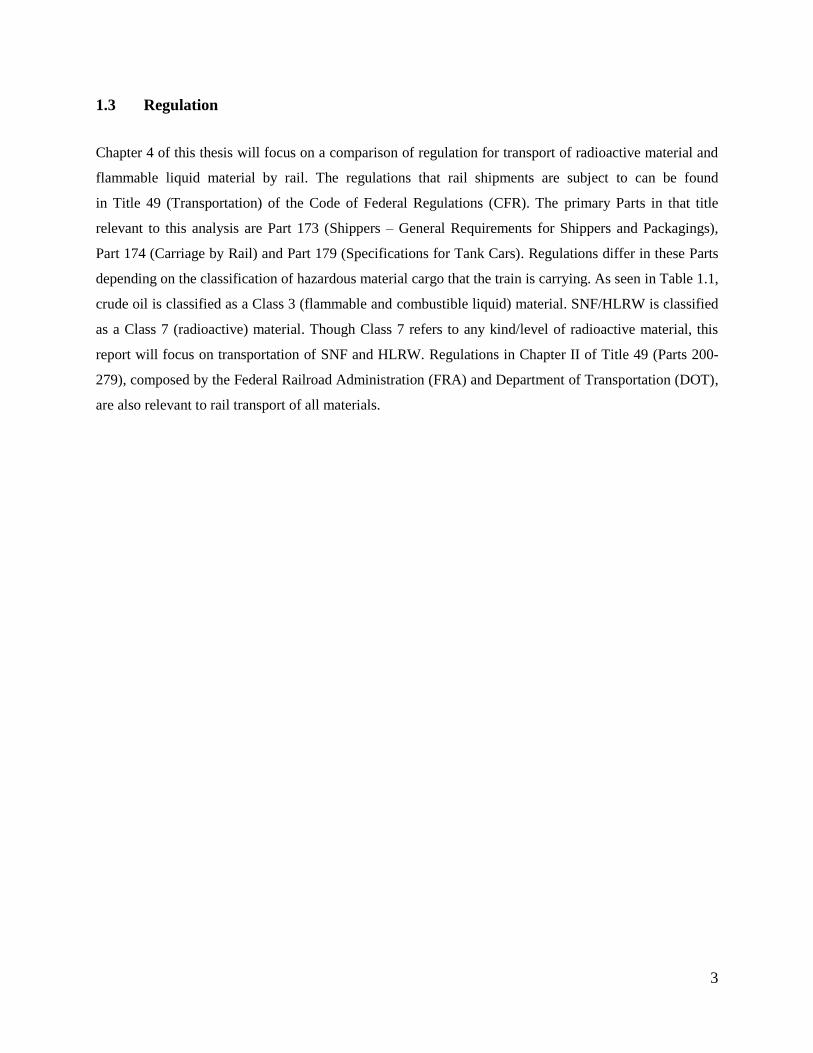
Chapter 4 of this thesis will focus on a comparison of regulation for transport of radioactive material and
flammable liquid material by rail. The regulations that rail shipments are subject to can be found
in Title 49 (Transportation) of the Code of Federal Regulations (CFR). The primary Parts in that title
relevant to this analysis are Part 173 (Shippers – General Requirements for Shippers and Packagings),
Part 174 (Carriage by Rail) and Part 179 (Specifications for Tank Cars). Regulations differ in these Parts
depending on the classification of hazardous material cargo that the train is carrying. As seen in Table 1.1,
crude oil is classified as a Class 3 (flammable and combustible liquid) material. SNF/HLRW is classified
as a Class 7 (radioactive) material. Though Class 7 refers to any kind/level of radioactive material, this
report will focus on transportation of SNF and HLRW. Regulations in Chapter II of Title 49 (Parts 200-
279), composed by the Federal Railroad Administration (FRA) and Department of Transportation (DOT),
are also relevant to rail transport of all materials.

4
Table 1.1 : Hazardous material classification for crude oil and SNF/HLRW as per 49 CFR 173.2 [8]
Class No. Division No. (if any) Name of class or division 49 CFR reference
for definitions
None
Forbidden materials 173.21
None
Forbidden explosives 173.54
1 1.1 Explosives (with a mass explosion hazard) 173.50
1 1.2 Explosives (with a projection hazard) 173.50
1 1.3 Explosives (with predominately a fire hazard) 173.50
1 1.4 Explosives (with no significant blast hazard) 173.50
1 1.5 Very insensitive explosives; blasting agents 173.50
1 1.6 Extremely insensitive detonating substances 173.50
2 2.1 Flammable gas 173.115
2 2.2 Non-flammable compressed gas 173.115
2 2.3 Poisonous gas 173.115
3
Flammable and combustible liquid 173.120
4 4.1 Flammable solid 173.124
4 4.2 Spontaneously combustible material 173.124
4 4.3 Dangerous when wet material 173.124
5 5.1 Oxidizer 173.127
5 5.2 Organic peroxide 173.128
6 6.1 Poisonous materials 173.132
6 6.2 Infectious substance (Etiologic agent) 173.134
7
Radioactive material 173.403
8
Corrosive material 173.136
9
Miscellaneous hazardous material 173.140
None
Other regulated material: ORM-D 173.144
A Final Rule (80 FR 26643-26750) regarding amendments to regulations of Class 3 material was released
on 1 May 2015, and went into effect beginning on 7 July 2015. Those changes are made to regulations
defined in 49 CFR Parts 171-180, and any amendments will be noted as such throughout this paper. Both
the previous and the new regulations will be discussed for Class 3 materials. The new regulations apply to
trains known as high-hazard flammable trains (HHFTs), which are defined in the Rule as trains composed
of either 20 or more tank car loads of a Class 3 flammable liquid in a continuous block, or 35 tank car

5
loads of a Class 3 flammable liquid across the entire train. [9] Crude oil is typically shipped in a railcar
tank known as the DOT-111, which has a Canadian equivalent known as the CTC-111A. ―The DOT-
111A, called a CTC-111A in Canada, make up about 69 per cent of the American tanker car fleet and
up to 80 per cent of the Canadian fleet.‖ [10] SNF/HLRW is shipped in a cask, which is then typically
placed on a heavy load flatbed railcar.
Because SNF/HLRW is shipped via container and flatbed, the container requires its own
regulations as well, which can be found in Title 10 (Energy) CFR Part 71 (Packaging and Transportation
of Radioactive Material), as prepared by the Nuclear Regulatory Commission (NRC). This Part also
provides regulations for general transport of radioactive material, so the cask-bearing railcar is subject
to both groups of regulations when applicable.
Restrictions imposed by the Association of American Railroads (AAR) will be taken into account
as well. The primary AAR regulations relevant to this analysis are Circular No. OT-55-N (Recommended
Railroad Operating Practices For Transportation of Hazardous Materials), which applies to both Class 3
and Class 7 HLRM shipments, and AAR Standard S-2043 (Performance Standard for Trains Used
to Haul High Level Radioactive Material).
6
2. Probabilistic Risk Assessment
The purpose of this section is to set up a PRA analysis for the transportation of hazardous material by rail.
This analysis has the value of identifying the primary sources of risk during the transportation operation.
It also provides a quantitative baseline by which to analyze the more qualitative effects of both risk
perception phenomena and regulatory actions, which are performed in later sections of this thesis. The
assessment in Chapter 2 is for generic hazardous material transportation, and not for any particular
material classification. Comparisons of Class 3 and Class 7 will be made in Chapters 3 and 4 using this
PRA as a reference to show how each classification differs in terms of risk quantification.
The primary tool used in this analysis is the event tree. An event tree represents a series of events
that must occur to reach a certain end state of an operation. These events are referred to as ―top events,‖
as they are identified as the events listed along the top of the event tree (as in Fig. 2.2). The end states are
those listed on the right side of the event tree. For every event tree, there exists an initiating event (IE),
which is the leftmost event.
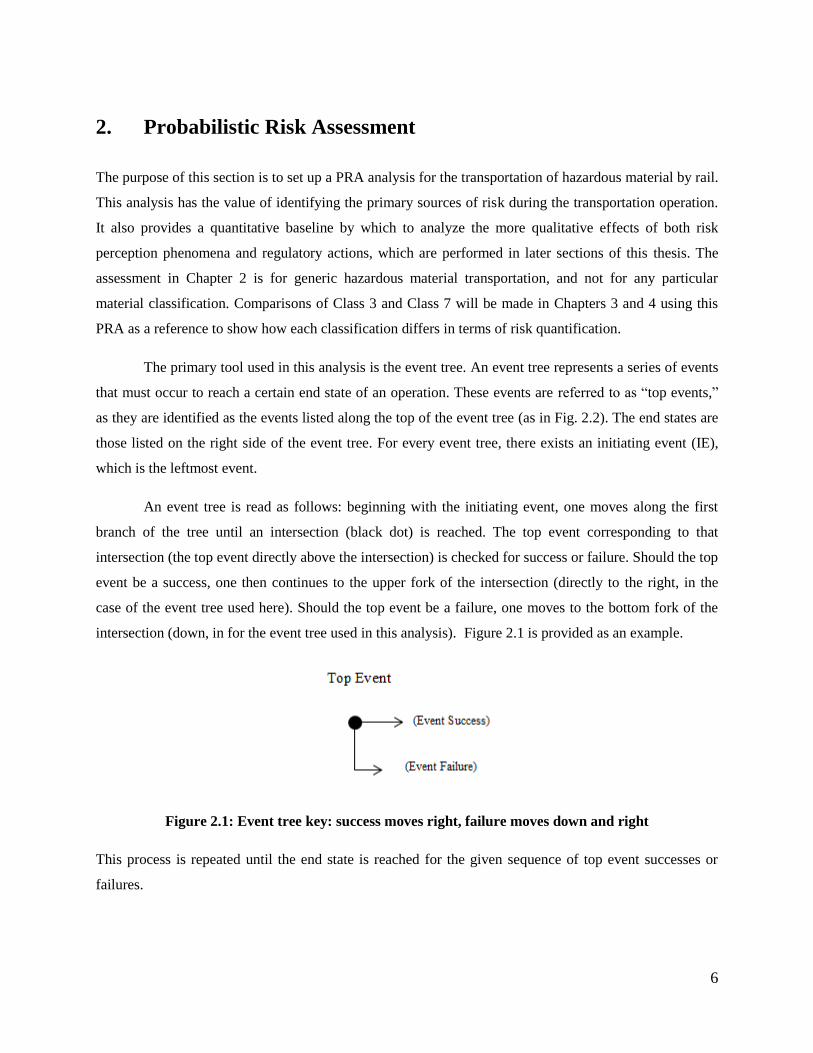
An event tree is read as follows: beginning with the initiating event, one moves along the first
branch of the tree until an intersection (black dot) is reached. The top event corresponding to that
intersection (the top event directly above the intersection) is checked for success or failure. Should the top
event be a success, one then continues to the upper fork of the intersection (directly to the right, in the
case of the event tree used here). Should the top event be a failure, one moves to the bottom fork of the
intersection (down, in for the event tree used in this analysis). Figure 2.1 is provided as an example.
Figure 2.1: Event tree key: success moves right, failure moves down and right
This process is repeated until the end state is reached for the given sequence of top event successes or
failures.

7
2.1 Event Tree
The event tree for the transportation of hazardous material by rail will now be developed. Assumptions
will be noted as they are made. The event tree will first be formulated and presented, and then each top
event will be discussed in more detail.
The first step of the event tree formulation is defining the initiating event (IE). After defining the
IE, each of the top events can follow: Operational failure/Derailment, Derailment of Hazmat, Hazmat
Release, End State. In this analysis, it is given that there is hazardous material on the train, and thus the
presence of hazardous material on the train is not checked for in a top event. With these top events, the
event tree is created as follows:
Figure 2.2: Hazardous material transportation by rail risk event tree
2.2 Initiating Event
In this case, the IE is a shipment of hazardous material by rail. A shipment must occur in order for the
event tree to be relevant (without any shipments, there can be no successes or failures). Initiating events
are typically quantified in terms of frequency of occurrence. In this case, the number of transportation
attempts (shipments) per year would be the relevant frequency for risk determination. Frequency varies
based on the type of hazardous material being transported by rail. For example, radioactive material
(particularly SNF/HLRW) has a very low frequency of shipment by rail at the time of this thesis, while
flammable liquids (Class 3 hazardous material) have a relatively high frequency. Frequencies of crude oil
8
shipments in particular have experienced a large increase in the past decade, including an increase of over
500% from 2011 to 2014 [11].
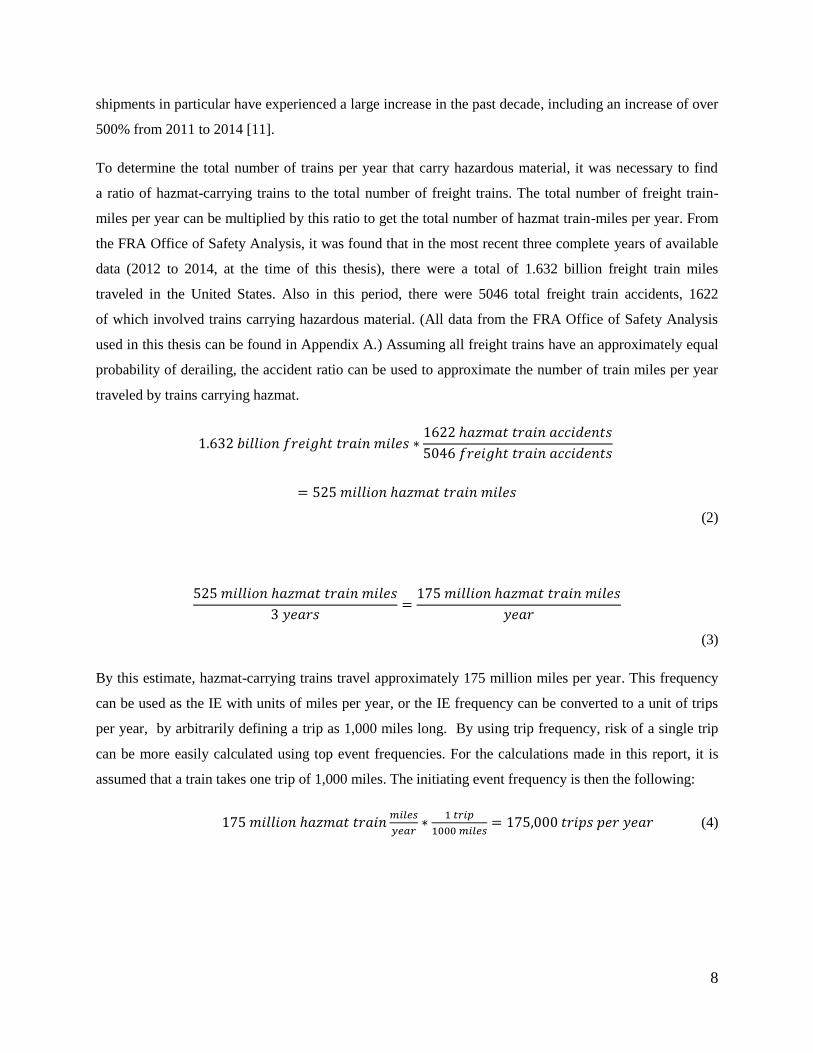
To determine the total number of trains per year that carry hazardous material, it was necessary to find
a ratio of hazmat-carrying trains to the total number of freight trains. The total number of freight train-
miles per year can be multiplied by this ratio to get the total number of hazmat train-miles per year. From
the FRA Office of Safety Analysis, it was found that in the most recent three complete years of available
data (2012 to 2014, at the time of this thesis), there were a total of 1.632 billion freight train miles
traveled in the United States. Also in this period, there were 5046 total freight train accidents, 1622
of which involved trains carrying hazardous material. (All data from the FRA Office of Safety Analysis
used in this thesis can be found in Appendix A.) Assuming all freight trains have an approximately equal
probability of derailing, the accident ratio can be used to approximate the number of train miles per year
traveled by trains carrying hazmat.
(2)
(3)
By this estimate, hazmat-carrying trains travel approximately 175 million miles per year. This frequency
can be used as the IE with units of miles per year, or the IE frequency can be converted to a unit of trips
per year, by arbitrarily defining a trip as 1,000 miles long. By using trip frequency, risk of a single trip
can be more easily calculated using top event frequencies. For the calculations made in this report, it is
assumed that a train takes one trip of 1,000 miles. The initiating event frequency is then the following:
(4)
9
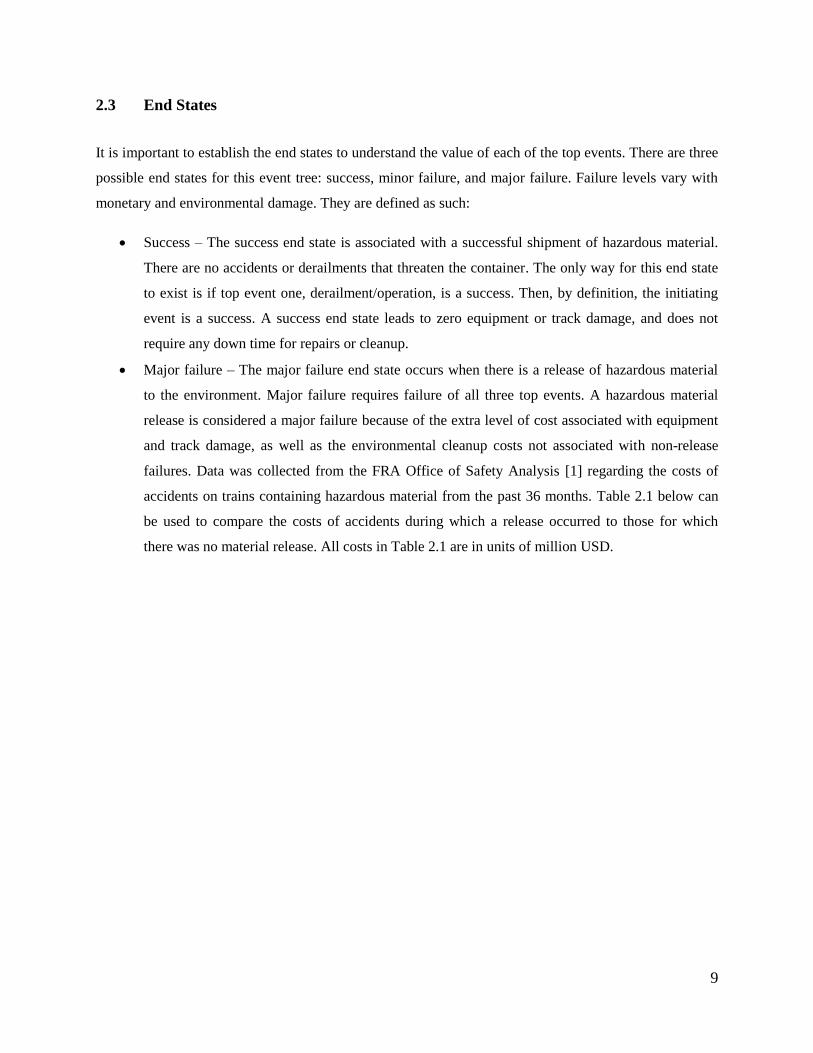
2.3 End States
It is important to establish the end states to understand the value of each of the top events. There are three
possible end states for this event tree: success, minor failure, and major failure. Failure levels vary with
monetary and environmental damage. They are defined as such:
Success – The success end state is associated with a successful shipment of hazardous material.
There are no accidents or derailments that threaten the container. The only way for this end state
to exist is if top event one, derailment/operation, is a success. Then, by definition, the initiating
event is a success. A success end state leads to zero equipment or track damage, and does not
require any down time for repairs or cleanup.
Major failure – The major failure end state occurs when there is a release of hazardous material
to the environment. Major failure requires failure of all three top events. A hazardous material
release is considered a major failure because of the extra level of cost associated with equipment
and track damage, as well as the environmental cleanup costs not associated with non-release
failures. Data was collected from the FRA Office of Safety Analysis [1] regarding the costs of
accidents on trains containing hazardous material from the past 36 months. Table 2.1 below can
be used to compare the costs of accidents during which a release occurred to those for which
there was no material release. All costs in Table 2.1 are in units of million USD.
10
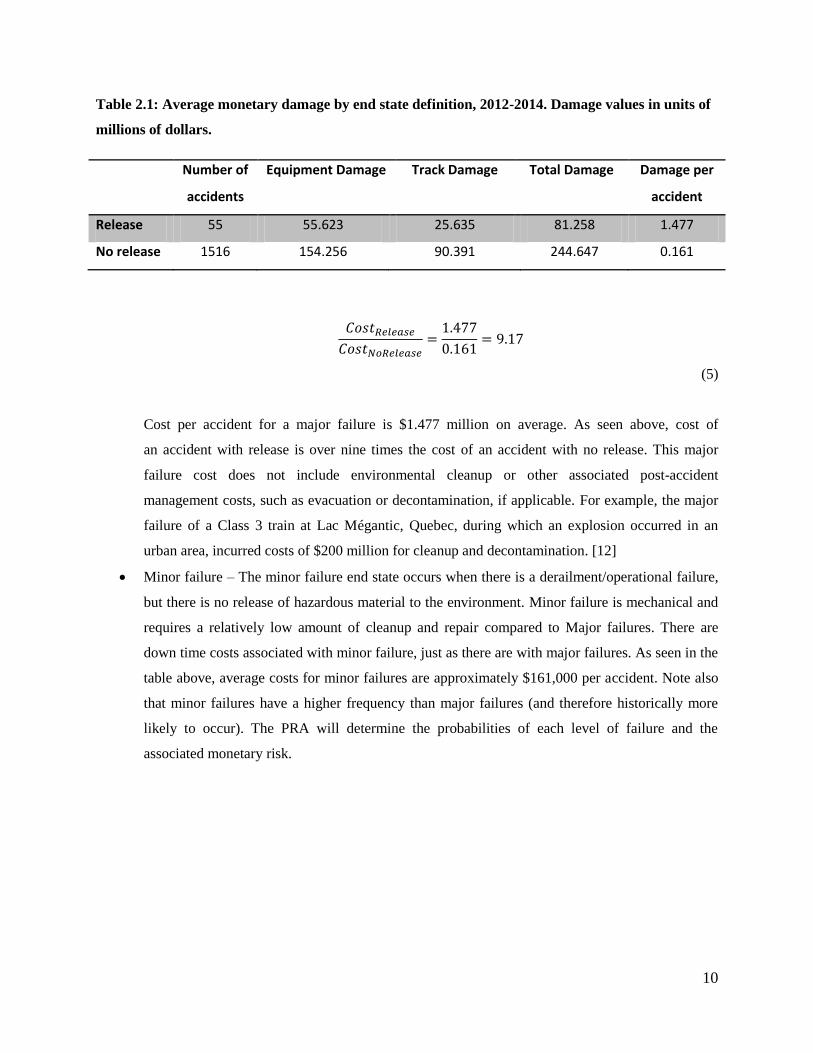
Table 2.1: Average monetary damage by end state definition, 2012-2014. Damage values in units of
millions of dollars.
Number of
accidents
Equipment Damage Track Damage Total Damage Damage per
accident
Release 55 55.623 25.635 81.258 1.477
No release 1516 154.256 90.391 244.647 0.161
(5)
Cost per accident for a major failure is $1.477 million on average. As seen above, cost of
an accident with release is over nine times the cost of an accident with no release. This major
failure cost does not include environmental cleanup or other associated post-accident
management costs, such as evacuation or decontamination, if applicable. For example, the major
failure of a Class 3 train at Lac Mégantic, Quebec, during which an explosion occurred in an
urban area, incurred costs of $200 million for cleanup and decontamination. [12]
Minor failure – The minor failure end state occurs when there is a derailment/operational failure,
but there is no release of hazardous material to the environment. Minor failure is mechanical and
requires a relatively low amount of cleanup and repair compared to Major failures. There are
down time costs associated with minor failure, just as there are with major failures. As seen in the
table above, average costs for minor failures are approximately $161,000 per accident. Note also
that minor failures have a higher frequency than major failures (and therefore historically more
likely to occur). The PRA will determine the probabilities of each level of failure and the
associated monetary risk.

11
2.4 Top Event: Operational Failure
The first top event checks the status of the train operation, including the chance of derailment due to any
cause. Given the IE has occurred (i.e. a shipment is taking place), the train must derail or there must be an
operational failure for there to be a shipment failure. Operational failures include side-on collisions and
other failure modes during which derailment does not necessarily occur. Risks due to failure modes such
as violent attacks are not within the scope of this analysis.
To provide insight as to approximate derailment probability, data was collected from the FRA
Office of Safety Analysis [1] to determine the total number of accidents since January, 2012. Data was
then found for the total number of train-miles traveled in the same time period. Dividing the former
number by the latter yields a per-mile train accident rate. This rate is for all freight trains, as opposed
to just those carrying hazardous materials.
Table 2.2 displays the number of accidents from January, 2012 through December, 2014
by accident cause:
Table 2.2: Railroad accidents by cause from 2012-2014 [1]
Cause of Accident/Event Number of Incidents
Equipment 610
Human Factors 1,950
Miscellaneous 754
Signal 148
Track 1,584
Total Events 5,046
Each accident consisted of one of the following events: derailments, head-on collision, rear-end collision,
side collision, raking collision, broken train collision, highway-rail impact, obstruction impact,
fire/violent rupture, other impacts, other events.
As found previously, the total number of train miles found for the same three-year time period
was $1.632 billion.
This yields a relative train accident frequency of the following:

12
(6)
To put this into perspective and more into probability terms, resume the assumption that a typical train
trip is 1,000 miles long. On a per-trip basis, there would be 0.0031 accidents per trip, or a 0.31% chance
of an accident on a 1,000 mile train trip, based on the historical data.
2.5 Top Event: Hazmat Car Involvement
The next top event checks whether the hazardous material-carrying cars were the ones that derailed, given
that some part of the train derailed. When a derailment occurs, there are usually only a few railroad cars
off the rails. In the event of failures such as side-on collisions, often only one or two cars are involved
in the accident. Therefore, there is some probability that should an accident occur, none of the hazmat
cars are involved, and there is thus no chance of material release. There are several complicated steps
in the analysis of this top event. For example, factors such as the overall train composition, number of
hazmat-carrying cars on the train, location of hazmat-carrying cars in the train, and location of accident,
all need to be considered to accurately determine this probability.
It is useful to have an approximate value of this probability in order to determine its relative contribution
to the probability of each end state. Several assumptions must be made for this approximation and will
be noted as such.
The first assumption is homogeneity among trains containing hazardous material. This is not the
case in reality, as some trains may contain only a few hazmat-carrying cars, as is expected to be done with
spent nuclear fuel. Some trains may contain only a few hazmat-carrying cars among several other non-
hazmat cars, and some may be large unit trains, carrying up to 120 hazmat-carrying cars on the same
train, as is often done with crude oil shipments.
The first step in establishing the homogeneity assumption is to determine the expected number
of cars that derail should an accident occur. Based on Probability analysis of multiple-tank-car release
incidents in railway hazardous materials transportation by Liu, Saat, and Barkan [13], the median
number of railroad cars that derail per derailment event is five. It is thus assumed that for each incident,
five consecutive cars in the train derail.
The second step in homogeneity establishment is to determine the expected number of hazmat-
carrying cars on the train experiencing an accident. To obtain this value, the FRA Office of Safety

13
Analysis database will again be used. From the database, data was gathered from the most recent 36
months available (October, 2015 to November, 2012), detailing the total number of cars involved
in accidents as well as the number of hazmat-carrying cars involved in those accidents. With this data [1],
a simple ratio can be made to determine the probability that a given car is carrying hazmat on an accident-
involved train. The ratio is as follows:
(7)
In other words, this ratio assigns the value 22.14% to the probability that any given car on a train
is carrying hazardous material, given already that 1) the train has experienced an accident/derailment and
2) there is at least one car on the train carrying hazardous material.
Thus far, it is assumed that on a hypothetical homogeneous train for which an accident occurs,
five cars are involved in the accident and 22.14% of the cars on the train contain hazardous material. With
this information, the probability that a hazmat-carrying car is involved in the accident can be found. One
final assumption is needed in this step, which is that the hazmat-containing cars are randomly distributed
among the train. In reality, hazmat-carrying cars are typically grouped together, but data for these car
distributions is not readily available or practical to use in this analysis, because point of derailment is also
unknown in this scope.
The probability p that a given car contains hazmat is 22.14%, and the probability q that it does not
contain hazmat is the compliment of this, or 77.86%. The probability of having k cars with hazmat out
of the five that derail can be calculated with the following binomial equation:
( ) ( )
(8)
where n is five. The binomial distribution is shown in the Fig. 2.3 below.

14
Figure 2.3: Binomial distribution of probability versus k
The probabilities of each of the six values of k are provided in Table 2.3.
Table 2.3: Probability of k derailed hazmat cars versus k, using binomial equation
k (number of hazmat cars derailed) pk (probability of k derailed hazmat cars)
0 0.2861
1 0.4068
2 0.2314
3 0.0658
4 0.0094
5 0.0005
>0 0.7139
This shows that if five cars derail, the probability that zero of them contain hazmat is 28.61%. This is the
definition of a success of this top event. The probability that at least one of them contains hazmat
is 71.39%, which defines failure of this top event. The most likely number of hazmat cars to derail is one,
at 40.68%.
0
0.05
0.1
0.15
0.2
0.25
0.3
0.35
0.4
0.45
0 1 2 3 4 5 6
pro
bab
ility
of
k d
era
iled
haz
mat
car
s
k (number of hazmat cars derailed)

15
If this top event occurs, the event tree proceeds directly to the minor failure end state. If this top
event fails (k>0), then at least one hazmat car has derailed, and the event tree proceeds to the third top
event.
2.6 Top Event: Hazardous Material Release
The third top event to consider is the failure of the container of the hazardous material. Container failure
leads to material release, which is the precedent for the major failure end state. There are two ways to
represent this probability. The first is through use of a fault tree. A fault tree is another PRA tool; it is
used to quantify the probability of a top event based on the probabilities of multiple basic events. In the
case of container failure, the total probability that the container fails is equal to the sum of the
probabilities of its failure modes. The fault tree method ties in well with the hypothetical accident
condition tests required by the Code of Federal Regulations for hazardous material containers. Although
these test requirements differ based on the contents of the container, (which will be discussed thoroughly
in a Chapter 4), the failure modes for each container type are the same. A fault tree for this top event
would look like the following in Fig. 2.4:
Figure 2.4: Theoretical fault tree for Top Event 3 failure featuring hypothetical accident conditions
as failure modes
16
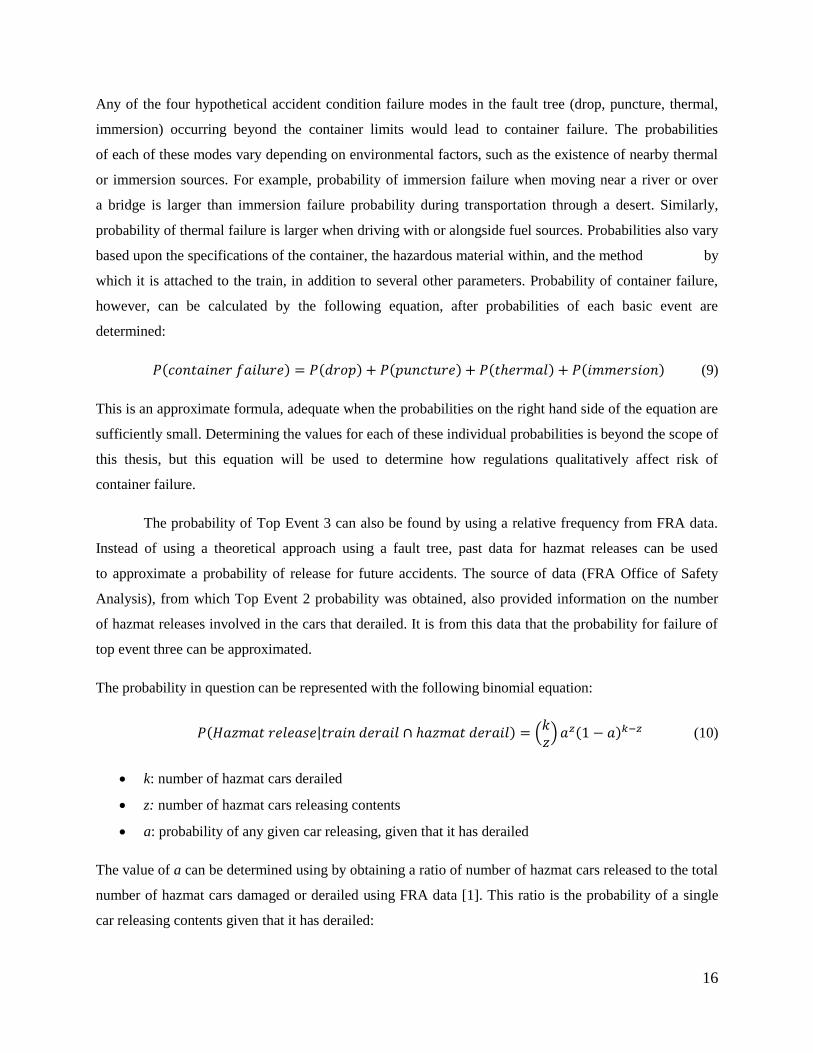
Any of the four hypothetical accident condition failure modes in the fault tree (drop, puncture, thermal,
immersion) occurring beyond the container limits would lead to container failure. The probabilities
of each of these modes vary depending on environmental factors, such as the existence of nearby thermal
or immersion sources. For example, probability of immersion failure when moving near a river or over
a bridge is larger than immersion failure probability during transportation through a desert. Similarly,
probability of thermal failure is larger when driving with or alongside fuel sources. Probabilities also vary
based upon the specifications of the container, the hazardous material within, and the method by
which it is attached to the train, in addition to several other parameters. Probability of container failure,
however, can be calculated by the following equation, after probabilities of each basic event are
determined:
( ) ( ) ( ) ( ) ( ) (9)
This is an approximate formula, adequate when the probabilities on the right hand side of the equation are
sufficiently small. Determining the values for each of these individual probabilities is beyond the scope of
this thesis, but this equation will be used to determine how regulations qualitatively affect risk of
container failure.
The probability of Top Event 3 can also be found by using a relative frequency from FRA data.
Instead of using a theoretical approach using a fault tree, past data for hazmat releases can be used
to approximate a probability of release for future accidents. The source of data (FRA Office of Safety
Analysis), from which Top Event 2 probability was obtained, also provided information on the number
of hazmat releases involved in the cars that derailed. It is from this data that the probability for failure of
top event three can be approximated.
The probability in question can be represented with the following binomial equation:
( | ) ( ) ( ) (10)
k: number of hazmat cars derailed
z: number of hazmat cars releasing contents
a: probability of any given car releasing, given that it has derailed
The value of a can be determined using by obtaining a ratio of number of hazmat cars released to the total
number of hazmat cars damaged or derailed using FRA data [1]. This ratio is the probability of a single
car releasing contents given that it has derailed:

17
(11)
The value of k ranges from zero to five, as determined in the previous section. However, the probability
of this top event assumes that at least one hazmat car has derailed, and thus k cannot be zero for this top
event. Table 2.4 shows the normalized probabilities of k, given k>0.
Table 2.4: Normalized probabilities of pk, given k>0
k (number of hazmat cars derailed) pk (probability of k derailed hazmat cars | k>0)
1 0.5698
2 0.3241
3 0.0922
4 0.0132
5 0.0007
The median value of k is 1, while the mean is 1.55. The probabilities are skewed towards smaller values
of k, which means the median is a better estimate of the data. The value of z can range from zero to k.
Success for top event three is defined as zero containers releasing material (z = 0). Failure is defined as
the compliment of this probability (z > 0). Table 2.5 reports the success and failure probabilities for each
value of k.
Table 2.5: Success and failure probabilities for top event three for each k value
k (number of hazmat cars derailed) P3(success) z = 0 P3(failure) z > 0
1 0.9239 0.0761
2 0.8536 0.1464
3 0.7886 0.2114
4 0.7286 0.2714
5 0.6732 0.3268
Success of containment leads to a minor failure end state. Containment was not breached, and thus
consequences are minimized. If containment failed, then there was a release of hazardous material to the
environment, which is a major failure end state.
18
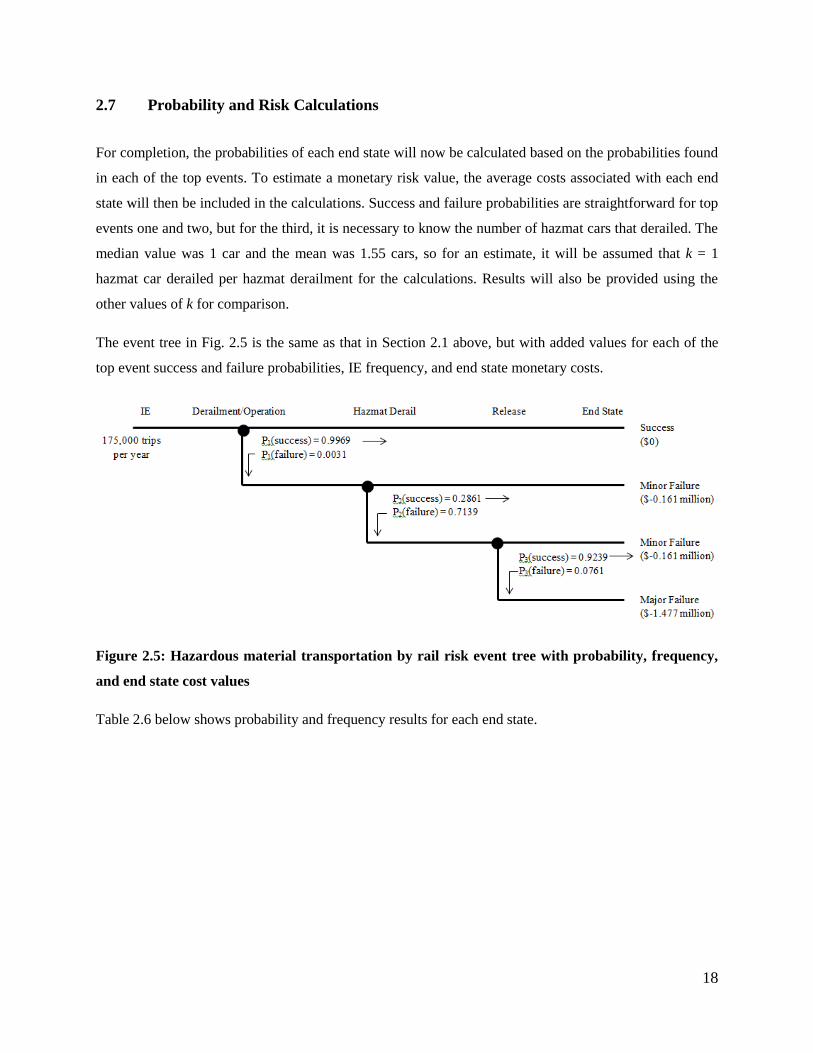
2.7 Probability and Risk Calculations
For completion, the probabilities of each end state will now be calculated based on the probabilities found
in each of the top events. To estimate a monetary risk value, the average costs associated with each end
state will then be included in the calculations. Success and failure probabilities are straightforward for top
events one and two, but for the third, it is necessary to know the number of hazmat cars that derailed. The
median value was 1 car and the mean was 1.55 cars, so for an estimate, it will be assumed that k = 1
hazmat car derailed per hazmat derailment for the calculations. Results will also be provided using the
other values of k for comparison.
The event tree in Fig. 2.5 is the same as that in Section 2.1 above, but with added values for each of the
top event success and failure probabilities, IE frequency, and end state monetary costs.
Figure 2.5: Hazardous material transportation by rail risk event tree with probability, frequency,
and end state cost values
Table 2.6 below shows probability and frequency results for each end state.

19
Table 2.6: Final event tree end state calculations, with probability, frequency, and risk due to each
end state
End State Probability Calculated
Frequency (yr-1
)
Risk per trip ($) Risk per year (million $)
Success 0.9969 174458 0 0
Minor Failure 2.932*10-3
513 472 82.59
Major Failure 1.684*10-4
29 248 42.83
Total 1 175,000 720 125.42
Risk of minor failure is nearly double the risk of major failure, while the probability of minor failure is
approximately 17 times that of major failure, assuming k=1. Comparing the table above to the data found
in the end states section, the expected frequencies of minor and major failure closely resemble the data
from 2012 to 2014, which is expected becuase most of the probabilities in the event tree are derived from
this data set.
Table 2.7 provides risks and frequencies for all values of k for comparison. Major failure
probability and risk are proportional to the number of hazmat cars expected to derail.
Table 2.7: End state risks and frequencies for all assumed values of k
k value Minor Failure
Frequency (yr-1
)
Major Failure
Frequency (yr-1
)
Risk per Trip ($) Risk per year
(million $)
1 513 29 720 125.42
2 486 57 928 162.44
3 461 82 1,116 195.34
4 437 105 1,288 225.44
5 416 127 1,455 254.56
Note that all risk values account only for risk due to equipment and track damage, as reported in the FRA
database. These values do not include risk associated with costs resulting from environmental damage,
down time, clean up, or other large-scale operations such as evacuation or decontamination. Sources of
risk vary based on the type of hazardous material being transported, since different hazardous materials
have different environmental effects. These sources also vary based on location of shipment. For
example, risk due to evacuation cost would be higher in an urban area than in a rural area.

20
2.8 Risk Importance Measures
One of the primary benefits of performing the final risk calculations is to determine which parts of the
event sequence have the greatest effect on the overall risk values. The events with the highest relative risk
importance can then be identified and targeted for improvement. Risk importance measures provide
a path to the most efficient use of resources for risk reduction.
One way to reduce risk is to implement rules and regulations regarding operation and safety
standards for the equipment used in hazardous material transportation. Risk reduction worth (RRW),
or similarly, Fussell-Vesely importance (FV), can be used to determine which segment of operation needs
to be focused on with stricter standards, should there be a call for regulation increase, to have the
maximum effect of reducing risk. The equations for RRW and FV are below.
( )
( )
( ) ( )
( ) (12)
R(base): present risk level
R(px = 0): risk with top event x with probability zero
For this event tree, however, RRW and FV are not very useful tools for determining effects of top events
for the major failure end state. This is because the reduction of any of the top event probabilities to zero
will cause a major failure probability of zero. Because all three events must fail for the major failure end
state, R(px = 0) equals zero for all events, and all events will have the same FV of 1. The minor failure top
event has a similar issue, where FV of top event one is 1, and FV for all other top events are equal.
Conversely, certain risk importance measures can be used to determine maximum risk
achievement to determine which factors would increase overall risk the most. Because of the nature of
this event tee, risk achievement will be the most useful tool in determining the risk-related value of each
top event. This is because setting the risk achievement does not automatically disallow any failure end
states (but rather the success end state). The measurement term used here is risk achievement worth
(RAW), and is defined by the following equation.
( )
( ) (13)
R(px = 1): risk with top event x with probability one
21
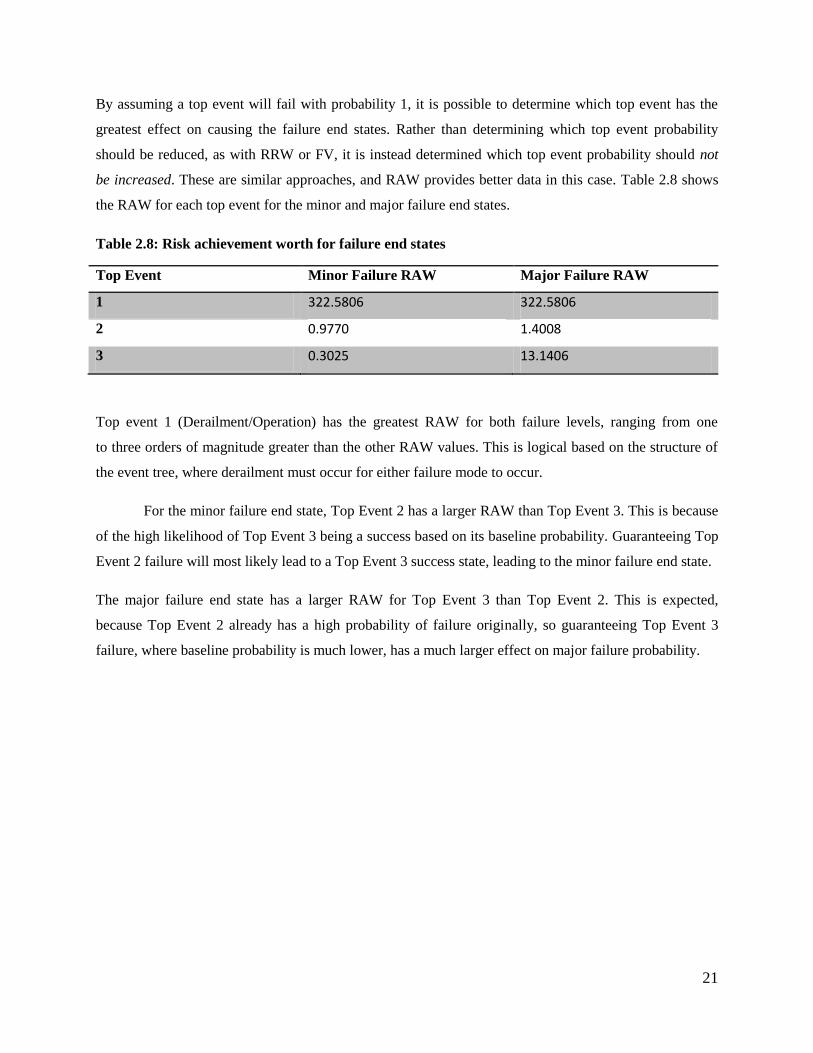
By assuming a top event will fail with probability 1, it is possible to determine which top event has the
greatest effect on causing the failure end states. Rather than determining which top event probability
should be reduced, as with RRW or FV, it is instead determined which top event probability should not
be increased. These are similar approaches, and RAW provides better data in this case. Table 2.8 shows
the RAW for each top event for the minor and major failure end states.
Table 2.8: Risk achievement worth for failure end states
Top Event Minor Failure RAW Major Failure RAW
1 322.5806 322.5806
2 0.9770 1.4008
3 0.3025 13.1406
Top event 1 (Derailment/Operation) has the greatest RAW for both failure levels, ranging from one
to three orders of magnitude greater than the other RAW values. This is logical based on the structure of
the event tree, where derailment must occur for either failure mode to occur.
For the minor failure end state, Top Event 2 has a larger RAW than Top Event 3. This is because
of the high likelihood of Top Event 3 being a success based on its baseline probability. Guaranteeing Top
Event 2 failure will most likely lead to a Top Event 3 success state, leading to the minor failure end state.
The major failure end state has a larger RAW for Top Event 3 than Top Event 2. This is expected,
because Top Event 2 already has a high probability of failure originally, so guaranteeing Top Event 3
failure, where baseline probability is much lower, has a much larger effect on major failure probability.

22
2.9 Takeaways from the PRA and Risk Importance Measures
A takeaway from this risk importance measurement is that the derailment/operation top event has by far
the greatest impact on the frequency of both minor and major failures, by default, since
derailment/operational failure is a precursor to any failure end state. Derailment/operation also has the
same RAW for both failure levels. Based on the risk importance measure, it is seen that the best way to
reduce the probability of shipment failure is to reduce the probability of derailment/operational failure.
This is a difficult task, however, since derailment/operation already has a very low failure rate, and the
law of diminishing returns suggests that incrementally lowering an already low failure rate can have a
very high cost.
By assuming derailment has happened, the next best way to reduce cost is to reduce the
probability of major failure. If derailment/operational failure occurs, then there is definitely a failure end
state, and minor failure is the cheaper one. The RAW results indicate that Top Event 3, hazardous
material release, has the greatest effect on major failure probability. Therefore, to reduce major failure
probability, the best approach would be to reduce probability of hazmat release; this is done by having
stronger, more durable containers of the material on the trains, and will be discussed greatly in Section 3
of this report.
The final way to reduce major failure probability is to reduce probability of Top Event 2, which
is to reduce the probability that a hazmat-carrying car derails. Potential solutions will also be discussed
in Chapter 5, but based on the binomial used to calculate this probability, the most logical approach
would be to reduce the number of hazmat-carrying cars in general. This is unlikely to happen, since
successful hazmat car shipments are associated with large profits, and would not be a popular or plausible
approach.
Several assumptions were made in this analysis, including homogeneity and fixed values for top
event failure probabilities instead of distributions. Therefore, there is some uncertainty associated with the
final calculation results. These results are used for the purpose of relative magnitudes and references for
later Chapters, rather than for a full risk assessment of this operation. For that, a more in-depth analysis
would be required, as will be discussed in Section 5.4: Future work.

23
3. Risk Perception
The purpose of Chapter 3 is to bring attention to the several factors that lead to a difference between the
risk as calculated in Chapter 2 and the risk as perceived by the public. These factors can apply to any
source of risk, so this chapter applies and explains the factors in terms of the risk due to the transportation
of hazardous materials. The factors will be used to differentiate between the public view of risk of hazmat
transportation based on the type of material being transported, notably between Class 3 (flammable
liquid) material such as crude oil, and Class 7 (radioactive) material such as spent nuclear fuel. The
discussion of each perception factor will then reference back to the event tree in Chapter 2. These factors
do not directly change the perception of the calculated risk, but rather certain values within the
calculation. The change in the value perceptions then effectively changes the calculation results.
As a reminder, the top events of the event tree are as follows:
Initiating event (IE) – hazardous material shipment
Top event one (TE1) – derailment or operational failure
Top event two (TE2) – presence of hazardous material among the derailed/failed cars
Top event three (TE3) – release of hazardous materials
End states – success: successful shipment; minor failure: failure without hazmat release; major
failure: failure with hazmat release
Each factor analysis will end with a speculation on how the factor affects parametric quantities within
the PRA. The event tree (Fig. 2.5) and the final risk probability/frequency table (Table 2.6) will
be reproduced with added visuals to show which parts of the PRA are affected by each risk perception
factor.
3.1 Factors Affecting Risk Perception
Four factors that affect risk perception will be analyzed in this chapter. The factors are natural versus
industrial risks, chronic versus catastrophic risks, familiar versus unfamiliar risks, and risks managed
by trustworthy versus untrustworthy sources. Those factors in consideration are the ones considered
to have the greatest effect on hazardous material transportation specifically and also have an effect
on some parameter within the PRA calculation or results. Each factor is also identified by the Department
of Health and Welfare of the state of Idaho in a report titled Perceived Versus Actual Risk [14], as well
24
as by risk perception expert Dr. Peter Sandman, former Rutgers professor and founder of the
Environmental Communication Research Program. [15]
3.2 Natural versus Industrial
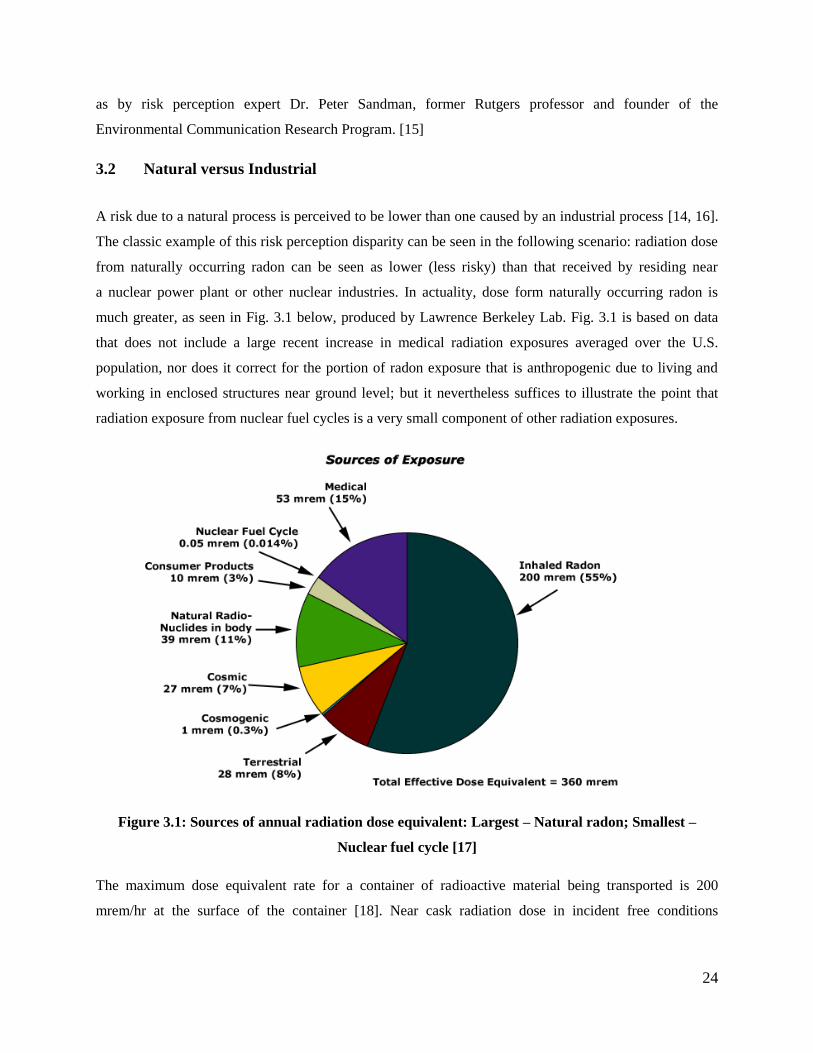
A risk due to a natural process is perceived to be lower than one caused by an industrial process [14, 16].
The classic example of this risk perception disparity can be seen in the following scenario: radiation dose
from naturally occurring radon can be seen as lower (less risky) than that received by residing near
a nuclear power plant or other nuclear industries. In actuality, dose form naturally occurring radon is
much greater, as seen in Fig. 3.1 below, produced by Lawrence Berkeley Lab. Fig. 3.1 is based on data
that does not include a large recent increase in medical radiation exposures averaged over the U.S.
population, nor does it correct for the portion of radon exposure that is anthropogenic due to living and
working in enclosed structures near ground level; but it nevertheless suffices to illustrate the point that
radiation exposure from nuclear fuel cycles is a very small component of other radiation exposures.
Figure 3.1: Sources of annual radiation dose equivalent: Largest – Natural radon; Smallest –
Nuclear fuel cycle [17]
The maximum dose equivalent rate for a container of radioactive material being transported is 200
mrem/hr at the surface of the container [18]. Near cask radiation dose in incident free conditions

25
is estimated to be 0.0004 mrem. [19]. This like takes into consideration some distance from the cask as
well as a very short exposure time due to the cask moving at train speeds during shipment.
The natural versus industrial factor affects the event tree by varying the cost associated with the success
end state. For the industrial risks, even the success end state has some associated cost; for the hazmat
shipments, this cost is environmental, resulting from the feared radiation coming from the packaging.
Even though this radiation is very small compared to other radiation exposures, it is perceived to be
significant. There is no such cost associated with the natural risks. For example, the transportation of
Class 3 material would have minimal perceived risk-based costs associated with a successful shipment
compared to Class 7 transportation. Fig. 3.2 shows where the natural versus industrial factor affects the
PRA.
Perceived Type of Risk Affected Factor Perceived Effect on Factor Perceived Effect on
Total Risk
Natural Success Cost Remains $0 None
Industrial Success Cost Becomes >$0 Increased Total Risk Cost
Figure 3.2: Effect of natural versus industrial risk perception factor on the PRA
Associating a cost with the success end state has two effects. First, it greatly increases the perceived
overall risk of operation, since the success state is the most frequent, and giving it a small cost has a large
26
total value. Second, it weakens the concept of a success end state, and essentially provides the idea that
every shipment is a failure. This is very detrimental to the planning and operation of shipment of the
industrially-perceived materials, since money is spent on reducing these success end state costs, even
though those costs are negligible.
3.3 Chronic versus Catastrophic
Risks with large infrequent consequences (catastrophic) are perceived as riskier than those with smaller
consequences with high frequency (chronic) [14, 16]. The typical example of this phenomenon is the
perception of risk of flying in an airplane versus risk from driving in a car. While an airplane crash has
a high cost of failure (catastrophic), it has a probability orders of magnitude less than that of a car
accident, which has relatively low individual failure cost [20]. Multiplying the probability by the
consequence yields the risk, and risk per mile of driving a car is much greater than that of flying.
The issue here is with the perception of frequency of catastrophic failures. Because the
catastrophic failures are highly publicized through the media, the public perceives them to have a much
larger frequency than they actually do. Associating a high cost event with a high frequency leads to a
huge increase in perceived total risk. Similarly, the low profile failures, such as car accidents, are not
as publicized, and the success state frequency for lesser consequence actions is so high that total risk
is perceived as low. Even if chronic failures are publicly known to have larger frequency than
catastrophic failures, the relative difference is not typically understood.
As calculated in Chapter 2, the minor failures contribute most to the total risk, due to their much
higher frequency of occurrence. Although major failures have greater consequences per incident (~$1.477
million), minor failures contribute nearly double the risk to the total yearly risk value. There is a similar
situation with chronic and catastrophic failures.
This consequence size factor has a parallel in the realm of shipment of different hazardous
materials. Risk involving Class 7 material is historically associated with catastrophic consequences,
notably due to the incidents at Chernobyl, Fukushima, Hiroshima and Nagasaki. All accidents or
destructive uses of Class 7 material have had large negative consequences and are highly publicized for
extended periods of time, so now any interaction or involvement with Class 7 material is perceived to
have a high failure frequency. On the contrary, Class 3 material accidents, such as gas explosions or oil
fires, are associated with a lower relative major failure frequency, and thus lower contribution to total risk
from major failure. Inclusion of the consequences of use of nuclear weapons in the above list can be
significant, particularly if one compares the casualties from a1984 methyl isocyanate release in India in

27
the chemical hazards. This is because perceptions of the consequences of possible future nuclear
explosions far outweigh those from chemical hazards and thus by association may considerably influence
risk perceptions concerning radioactive materials more generally.
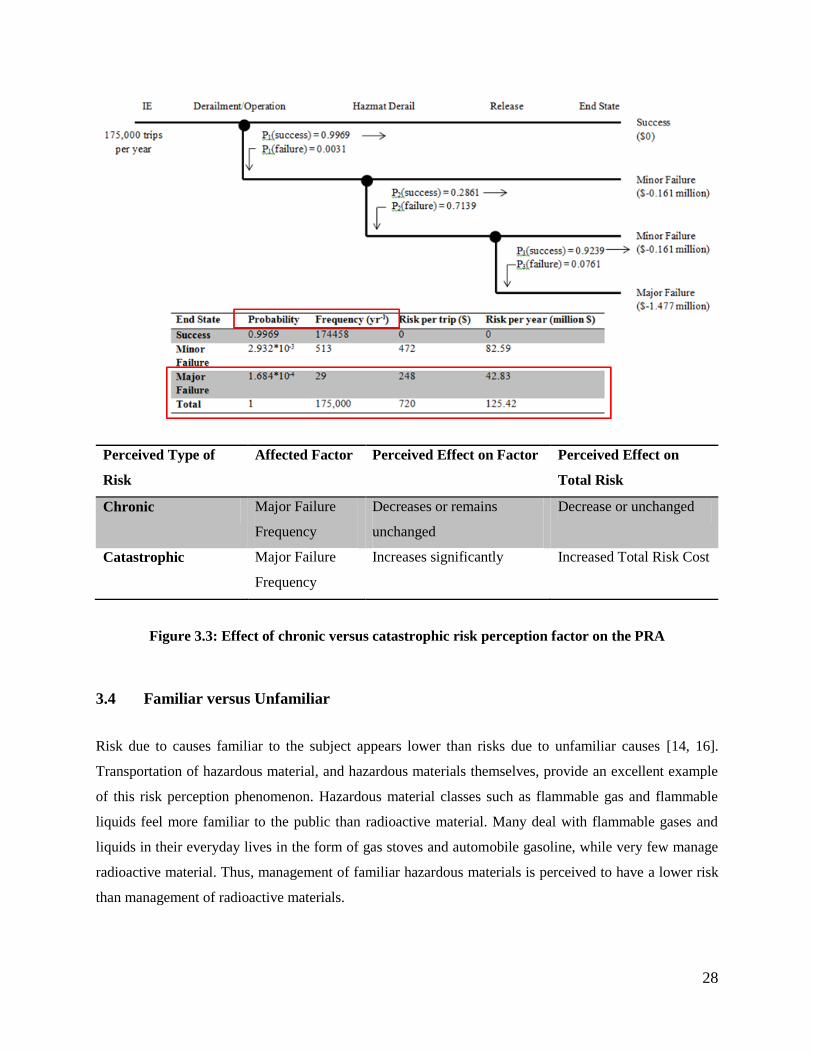
The effect on total risk can be explained with use of the event tree from Chapter 2. For
catastrophic failure, the frequency of incident is perceived to be higher than is calculated by several
orders of magnitude. This increases the total perceived risk over all end states by a large amount, even
with the low relative frequency of major failure, particularly for Class 7 material. For the chronic failures,
such as release of Class 3 material, the major failure end state has a higher probability of occurrence but
a lower cost per incident. As will be discussed in Chapter 4, containers of Class 7 material have a much
lower probability of release than containers of Class 3. Fig. 3.3 shows where the chronic versus
catastrophic factor affects the PRA.
28
Perceived Type of
Risk
Affected Factor Perceived Effect on Factor Perceived Effect on
Total Risk
Chronic Major Failure
Frequency
Decreases or remains
unchanged
Decrease or unchanged
Catastrophic Major Failure
Frequency
Increases significantly Increased Total Risk Cost
Figure 3.3: Effect of chronic versus catastrophic risk perception factor on the PRA
3.4 Familiar versus Unfamiliar
Risk due to causes familiar to the subject appears lower than risks due to unfamiliar causes [14, 16].
Transportation of hazardous material, and hazardous materials themselves, provide an excellent example
of this risk perception phenomenon. Hazardous material classes such as flammable gas and flammable
liquids feel more familiar to the public than radioactive material. Many deal with flammable gases and
liquids in their everyday lives in the form of gas stoves and automobile gasoline, while very few manage
radioactive material. Thus, management of familiar hazardous materials is perceived to have a lower risk
than management of radioactive materials.

29
This perception phenomenon is explained by a feeling of understanding of the failure states for
familiar materials, and by a lack of understanding for failure states of the unfamiliar materials. An
unfamiliarity with transportation of some material drives up the perceived cost of the failure end states,
particularly the major failure end state as defined by this thesis. Because of past large scale radioactive
release events, such as nuclear plant meltdowns, any release is perceived to have the potential of causing
a similar level of damage [21]. Therefore, perceived cost of major failure for a radioactive material
shipment is closer to the levels of the past-publicized events, even though failure in this case would be
much more manageable.
Contrarily, familiarity with materials can drive down the perceived cost of major failure from
what it is calculated to be. Familiar materials are perceived as more manageable, and they sometimes may
be, however major failure can still incur very large cost. Fig. 3.4 shows where the familiar versus
unfamiliar factor affects the PRA.

30
Perceived Type of
Risk
Affected Factor Perceived Effect on Factor Perceived Effect on
Total Risk
Familiar Major Failure
Cost
Decreases or remains
unchanged
Decrease or unchanged
Unfamiliar Major Failure
Cost
Increases significantly Increased Total Risk Cost
Figure 3.4: Effect of familiar versus unfamiliar risk perception factor on the PRA
The difference between the familiar versus unfamiliar factor and the natural versus industrial factor is the
following: the familiar/unfamiliar factor affects the perceived failure costs, while the natural/industrial
factor affects the perceived success costs. Unfamiliar materials have a large perceived major failure cost
due to its effects and properties being poorly understood. An industrial material, however, is often
misunderstood to cause problems even when no failure occurs. Note that it is possible to have multiple
factors affecting the same scenario, as is the case with Class 7 material.
3.5 Trustworthy versus Untrustworthy
A risk controlled by an untrustworthy source is perceived to be greater than the same risk controlled by
a trustworthy source [14, 16]. The best example of this is in the nuclear power and radioactive waste
management industry, particularly the experiences at Yucca Mountain in the United States versus those
31
of Osthammar in Sweden. The Yucca Mountain Project has been unsuccessful thus far. Part of the cause
is resulting from the risk to the State of Nevada being involuntary, and part of the effect has led to a lack
of trust in the U.S. Department of Energy (DOE) to manage radioactive waste. One consultant for Lincoln
County, Nevada, Mike Baughman, stated for the Las Vegas Review Journal that ―the political approach to
resolving this very technical issue results in a significant erosion of trust,‖ [22] and a report for the State
of Nevada Agency for Nuclear Projects states that their task is to research ―the DOE's track record in
nuclear materials handling and trustworthiness.‖ [23] Trustworthiness is acknowledged to be a factor in
the decision-making process for the Yucca mountain project, and this is so because it affects the
perception of the magnitude of risk involved in allowing the project to proceed. The trustworthiness factor
is similar for all risk-based analyses, such as the transportation of hazardous material. Because DOE is
also responsible for this process, the reputation of trustworthiness (or lack thereof) of DOE stemming
from the Yucca Mountain Project and earlier Cold War era management of radioactive materials has an
effect on its trustworthiness for transporting radioactive material.
Trustworthiness affects the PRA through the event tree by changing the perception of success and
failure probabilities. A trustworthy source will have a higher perceived probability of success (and lower
probability of failure). This drives down the perceived risk by reducing the frequency of failure states, and
thus the cost contribution of the failure states to the total risk. Contrarily, an untrustworthy source will
have a higher perceived probability of failure (and lower probability of success). This has the effect
of increasing total risk by increasing the failure state frequency and cost contribution to the total risk. Fig.
2.5 displays where the trustworthy versus untrustworthy factor affects the PRA.

32
Perceived Type of
Risk
Affected Factor Perceived Effect on Factor Perceived Effect on
Total Risk
Trustworthy Success/Failure
Probability
Decreases Decreased Total Risk
Cost
Untrustworthy Success/Failure
Probability
Increases Increased Total Risk
Cost
Figure 3.5: Effect of trustworthy versus untrustworthy risk perception factor on the PRA
To decrease the perceived risk, a good strategy is openness and cooperation. This strategy both makes the
risk a voluntary one, thereby establishing the IE frequency, and builds trust, thereby increasing the
perceived success probability. Trustworthiness is a large part of why the approach for building an SNF
repository in Sweden was successful when compared to the attempt made by the United States in Nevada.
3.6 Risk Perception Summary and Future Work
Bringing together risk as perceived by the public and risk as calculated by experts is a vital step in the
efficient appropriation of efforts for reducing risk. For each of the four factors discussed in Chapter 3,
there is some cause for transportation of Class 7 material to have a higher perceived risk than calculated.
33
High perceived risk has the effect of potential of very expensive regulation or altogether inability to
perform the transportation operation out of fear of that risk. For maximum efficiency of operation, these
factors should be addressed. For most of the factors, cooperation and transparency may have some
influence, but overlap of concerns about nuclear weapons and non-weapons effects may be only partially
amenable to such approaches. Discrepancies between risk as perceived and as calculated PRA differently
weighted with respect to risk assessement of the transportation procedure and hazard, lead to an increased
failure probability and overall monetary and environmental risk, as perceived by non-experts. Risk from
Class 7 shipments is likely perceived as much higher than risk due to Class 3 shipments due to these
factors.
Each of the factors can be addressed to reduce the perceived risk. A more in-depth analysis
on which factor quantitatively affects overall risk the most would have to be performed in order to best
allocate resources for education or participation in decision making, if only one or two could be addressed
at a time. Chapter 5 of this thesis will present some approaches for addressing each of these factors.
34
4. Risk Reduction by Regulation
The purpose of this chapter is to outline the rules and regulations governing train operation, particularly
those for trains carrying hazardous material. Regulations are set in place in order to reduce the risk
of railroad transportation. This chapter will outline several regulations that have an effect on the PRA
performed in Chapter 2, and will explain the parts of the PRA affected by each regulation. This chapter
is divided into two sections; the first discusses regulations that affect standard operation of the train, and
the second discusses regulations regarding hypothetical accident conditions. Each section has a unique
effect on the PRA.
Some work shown in this chapter was performed by the thesis author during an internship at Oak Ridge
National Lab. [52]
4.1 Accident Prevention and Mitigation Parameters
This section provides an overview of some of the regulations that affect standard train operation and
setup. Generally, these regulations have the purpose of reducing probability of TE1
(derailment/operational failure) and TE2 (hazmat car involvement) from the PRA in Chapter 2. The risk
importance measures analysis indicated that TE1 had the greatest effect on each of the failure
probabilities. Therefore, the regulations affecting TE1 are among the most important in reducing total
transportation risk.
The following regulations are set in place in an attempt to reduce probabilities of Top Events
1 and 2. The event tree structure is set up so that both of these events must fail in order for major failure
to occur. It is therefore beneficial to attempt to reduce the likelihood of each. Likelihood reduction must
be done while still maintaining some efficiency in the transportation network; for example, speed limits
can be set very low to avoid accidents, but this would cause a large operation cost. This section aims
to demonstrate the differences in railroad operation standards among cargo of different material
classifications, primarily for crude oil (which is in Class 3) and radioactive material (which is in Class 7),
that will alter either the likelihood or the consequence of an accident should one occur. Many operational
parameters are shared among rail transport of materials of all classes, but some differ from class to class.
The parameters that both differ and have a significant effect on accident cause/consequence are the ones
that will be discussed. They are the following: train speed, train size (weight and length), and brake
systems.

35
4.1.1 Speed
The first way to control potential accident occurrence or consequence is by regulating train speed. Speed
is an important factor in train operations because of the effect it has on many of the other regulated
parameters; it affects braking systems, routing, and hypothetical accident conditions. Trains are also
limited to a certain speed when performing a turn based on track curve radius and grade (incline).
Train speed has an effect on all three Top Event probabilities within the event tree in Chapter 2,
as shown in Fig. 4.1. It affects the probability of accident or derailment based on stopping distance for
obstructions and other abilities for navigating obstacles, as will be discussed later in this section. Train
speed has an effect on TE2 probability as well. Based on Liu, Barkan and Saat, ―Analysis of Derailments
by Accident Cause‖, the predicted number of train cars derailing can be obtained as a function of train
speed, using the following equation [24]:
(14)
Nc: number of cars derailed
Ac: given constant (average value of 1.852)
S: Train speed
Bc: Given constant (average value of 0.486)
Recall that the probability of TE2 is found using a binomial expression with parameter n representing the
number of derailed cars, which can be found in this case using Nc.. As n increases, TE2 failure probability
increases.
Train speed also has an effect on TE3 probability. From ―A Risk Assessment Study of the
Transportation of Hazardous Materials over the U.S. Railroads‖ by Raj, the predicted probability
of hazardous material release given derailment of a hazmat-carrying car can be found as a function
of train speed using the following equation:
( ) (15)
q(U): probability of release, in percent
a: constant obtained from data
U: train speed, in m.p.h. [25]

36
Figure 4.1: PRA parameters directly affected by train speed regulations
The standards for speed of Class 7 SNF/HLRW-carrying tank cars can be found in AAR Circular No. OT-
55-N, which are the following:
Definition: A ―Key Train‖ is any train with: …One or more car loads of Spent Nuclear Fuel
(SNF), High Level Radioactive Waste (HLRW)…
Maximum speed -- "Key Train" - 50 MPH [26]
Speed limitations were placed on speed of Class 3 railcars in the recently passed legislation regarding
speed in high threat urban areas (HTUA). (HTUAs are defined in 49 CFR 1580, in Section 3 and
Appendix A.) The new regulation mandates the following:
All trains are limited to a maximum speed of 50 mph. The train is further limited to a maximum
speed of 40 mph while that train travels within the limits of high-threat urban areas (HTUAs) as
defined in §1580.3 of this title, unless all tank cars containing a Class 3 flammable liquid meet or
exceed the DOT Specification 117 standards, the DOT Specification 117P performance standards,
or the DOT Specification 117R retrofit standards provided in part 179, subpart D of this
subchapter. [27]
The justification provided for this level of reduction is to decrease the kinetic energy of a train traveling
through HTUAs. A 10 mph decrease in speed from 50 mph to 40 mph would decrease kinetic energy,
defined by KE=0.5*m*v2 where m is mass and v is velocity, by a factor of:

37
(16)
A speed decrease will also increase the likelihood of a train operator to apply brakes successfully and
avoid a potential cause of danger should one present itself in front of the train. Braking distance is also
dependent on speed based on the following equation:
(17)
v: final velocity
v0:initial velocity
a: acceleration
Δx: stopping distance
For the case of a freight train needing to stop, final velocity is zero, v0 is either 50 mph or 40 mph,
depending on the location, and acceleration is an assumed constant depending on the quality of the brakes
and other operating conditions. To compare stopping distance for trains moving at 40 mph and 50 mph,
the following ratio analysis can be used:
(18)
The stopping distance is also reduced by 36% because of the speed limitation. Decreasing speed in critical
areas can reduce probability and consequence of an accident in multiple ways.
The speed reduction was not made greater as a result of the safety concerns caused by increased
rail traffic and congestion in HTUAs. HHFTs may be required to reduce speed in an HTUA, but other
trains would not necessarily need to, and thus train dispatching and management and use of track sidings
would increase, thereby increasing risk of collisions and cost of commerce due to time delays. [9]
The cost and benefit of this speed regulation change was estimated in 80 FR 26643-26750 based
on a 20 year total and at a 7% discount rate. Cost was estimated at $180 million, while benefits range
from $56 – 242 million. Costs are based on the time lost by traveling through HTUAs at slower speeds,

38
while benefits are calculated based on the avoidance of low to high consequence incidents, thereby
providing a range of potential monetary benefit.
Based on speed regulations, Class 3 and Class 7 had been regulated equivalently, but after 80 FR
26643-26750, certain Class 3 trains, notably those typical of carrying crude oil, now have increased
regulations because of the speed restriction in HTUAs. The overall magnitude of this difference in
regulation depends upon the relative frequency at which SNF/HLRW carrying railcars travel through
HTUAs when compared with HHFTs.
4.1.2 Train Size
The second parameter potentially affecting incident likelihood or consequences is train size. This section
will be divided into regulations and effects of both train length and car weight. Generally, the larger
a train is, the more mass it has, thereby increasing its kinetic energy and severity of accident should one
occur. Long trains also take longer so stop due to communication from car to car when brakes are applied.
If a defect on a train track exists, a long train will inherently take a longer time to bypass the defect,
thereby increasing the likelihood of the defect causing an event. Weight of individual train cars is also
considered, since weight increase leads to an increase in force required to flip the train on its side
or raise it off the track, which are the general processes by which derailment occurs. This section will
compare regulations regarding size parameters where applicable, as well as compare typical train
dimensions, for Class 3 and Class 7 (HLRM) material trains.
4.1.2.1 Train Length
A train carrying HLRM can be one of three types: regular trains, key trains, or dedicated trains. A regular
train operates under standard regulations, including those that apply for the various hazardous material
classifications that are on the train. Regular trains can be any length and have any combination of cargo
classifications. Key trains are similar to regular trains but operate under additional restrictions that
improve safety by altering security, operation, and routing procedures. Dedicated trains are specifically
constructed to transport SNF/HLRW by providing specially built heavy-load flatcars and buffer cars.
SNF/HLRW is the only cargo on a train dedicated to it. Dedicated trains also operate under increased
restriction to decrease risk [19].
Although the use of dedicated trains requires increases in regulatory restriction, economic and
safety benefits arise from using shorter dedicated trains. The shorter dedicated trains are also able to reach
their destinations more quickly since all of the cargo is destined for a single location, which also provides

39
greater predictability in train movement and location along the route. The use of dedicated trains allows
for a smaller train fleet, since there is minimal down time associated with dedicated train cars traveling
longer routes to accommodate other cargo destinations. Dedicated trains are also able to incorporate the
optimal configurations of flatcars, buffer cars, and locomotives to decrease risk during transport.
According to an FRA Report to Congress from 2005 in support of the use of dedicated trains for
SNF/HLRW rail transport, safety benefits also arise from dedicated train usage. ―Non-incident risk from
the entire future shipping campaign is estimated to be on the order of approximately one (1) latent cancer
fatality (LCF) for every 40,000 shipments in non-dedicated trains and approximately one (1) LCF for
every 50,000 shipments in dedicated trains.‖ [19] The DOE also required the use of dedicated trains for
SNF/HLRW shipments to the Yucca Mountain facility when the project was active. [28] Though this
requirement may not yet officially apply for SNF/HLRW transport to a future repository site, it will
be assumed that dedicated trains will be the type in use for the purpose of comparison with typical Class 3
carrying trains.
A dedicated train for SNF/HLRW transport is constructed in a fashion similar to that shown in the
Fig. 4.2. Locomotive car(s) drive the train, two buffer cars surround the cask cars, and an escort car trails
at the end. Though there is no limitation to the actual length of the train, there is a limitation on the
amount of radioactivity that can be transported at once which can be found in 49 CFR 174.700 (b): ―The
number of packages of Class 7 (radioactive) materials that may be transported by rail car or stored at any
single location is limited to a total transport index and a total criticality safety index (as defined
in §173.403 of this subchapter) of not more than 50 each. [29]‖ Therefore the number of cars with casks
on them is limited by the amount and composition of used fuel within. For this discussion, assume a train
with a range of three to eight cask cars.

40
Figure 4.2: Typical dedicated SNF/HLRW transportation train consist [30]
There is no regulatory train length limit for trains carrying Class 3 material, but rather a mechanical limit
of the locomotives and the couplers holding the train together. Typical unit trains, or trains carrying only
one type of material, for crude oil are within the range of 70-120 tank cars [31]. At about 54 feet of length
per car [32], this can lead to train lengths of 3780 to 6480 feet, not including the lengths of the
locomotives and buffer cars. Trains of this length, which are significantly longer than dedicated trains
carrying Class 7 SNF/HLRW, are more likely to derail.
In the case of a damaged length of track, it is possible for a train to navigate it without derailing.
This becomes less and less likely as more of the train passes it, both based on a constant probability of
a given car derailing at that point, and based on the increase of damage to the track as a cyclical load
is placed on it by the passing train. Take as an example the derailment that occurred in Cherry Valley,
Illinois on 19 June 2009, where there was a washed out length of track that derailed part of a train
carrying 114 tank cars of Class 3 material. The conductor was unaware of the track wash out (track
flooding), and the train proceeded over the endangering length of track. The train traversed the hazardous
track, and after two locomotives and 56 train cars had already passed the washed out zone, the following
19 cars derailed. According to the accident report, the washout, originally 17 feet long, likely widened
due to the passage of the train. It then failed at the 57th car due to unsupported track after widening of the
washout [33]. Longer trains both take longer to pass a damaged length of track, and cause that length

41
of track to lessen its condition and ability to support the rest of the train. A short train, such as the
dedicated trains used to transport SNF/HLRW that are 8-13 cars long, would potentially be able to
traverse the washout based on the number of cars that were able to pass on the Class 3 train. The 8-13 cars
would likely have caused less damage to the track than the 56 tank cars that passed on the long train.
Although shorter trains require more trips across a given amount of track to transport the same
amount of cargo, this analysis assumes that track damage would be discovered and reported by a train
traversing the damage, and would be repaired by the next trip.
Train length affects the probabilities of failure for Top Events 1 and 2. It affects TE1, derailment
and operational failure, based on the brief analysis above. It also affects TE2 probability by limiting the
number of cars that could potentially derail. A shorter train, such as a SNF/HLRW unit train, is far less
likely to have several cars derail than a 120-car-long Class 3 material unit train. Thus, there is a smaller
failure probability for TE2 as n decreases. Lastly, train length can also have an effect on IE frequency.
If length is limited, more trips are required to transport the same amount of material. Higher IE frequency
leads to higher frequency of all end states. Fig. 4.3 shows the parameters of the PRA affected by train
length.
Figure 4.3: PRA parameters directly affected by train length regulation

42
4.1.2.2 Car Weight
SNF/HLRW cars weigh about 394,500 pounds; 250,000 pounds are from the cask and its contents, while
the other 144,500 pounds are from the heavy-haul flat car. ―Like other cars constructed to carry heavy
loads, cask cars use additional axles and span bolsters to distribute the weight over a larger portion of the
track structure.‖ [19] Class 3 tank cars, such as the DOT-111, are limited to 286,000 lbs. by
regulation. [9] The benefits of heavy cars are that they are more stable and require more torque to flip
over or derail. The downsides include the placement of more stress on the track, which could cause
problems if the track is damaged already, which is why the heavy cars have the additional axles and
equipment for load distribution. Thus, car weight affects TE1 probability, but it is a function of multiple
variables depending on the operation and track conditions.
4.1.3 Brake Systems
Brake systems are a major method by which to prevent or mitigate accident consequences. Brakes can
either decrease the kinetic energy of a train before a collision or derailment, or they can stop the train
in time to avoid an accident altogether. In general, train brakes are regulated by 49 CFR 232, and it to this
extent that Class 7 material-carrying railcars are officially regulated. The AAR, however, requires the use
of additional braking systems on railcars carrying HLRM, by requesting the use of Electronically
Controlled Pneumatic (ECP) brakes on railcars in Standard S-2043. [34] The FRA supported this request
in its 2005 Report to Congress. [19]
Brakes of Class 3 trains were formerly regulated solely by 49 CFR 232 until the Final Rule (80 FR
26643-26750) passed on 1 May 2015, which added regulation to the brake systems required by HHFTs.
The regulation is split into five parts, the first three of which are as follows:
(i) Each rail carrier operating a high-hazard flammable train (as defined in §171.8 of this
subchapter) operating at a speed in excess of 30 mph must ensure the train is equipped and
operated with either a two-way end-of-train (EOT) device, as defined in 49 CFR 232.5, or a
distributed power (DP) system, as defined in 49 CFR 229.5.
(ii) By January 1, 2021, each rail carrier operating a high-hazard flammable unit train (HHFUT)
comprised of at least one tank car loaded with a Packing Group I material, at a speed exceeding 30
mph must ensure the train is equipped with ECP brakes that meet the requirements of 49 CFR part
232, subpart G, except for buffer cars, and must be operated in ECP brake mode as established in
49 CFR part 232, subpart G.
(iii) By May 1, 2023, each rail carrier operating a high-hazard flammable unit train (HHFUT) not
described in paragraph (a)(3)(ii) of this section, at a speed exceeding 30 mph must ensure the train
is equipped with ECP brakes that meet the requirements of 49 CFR part 232, subpart G, except for

43
buffer cars, and must be operated in ECP brake mode as established in 49 CFR part 232, subpart
G. [9]
The final two Parts, not reproduced here, provide exceptions and alternative brake system approval
processes. The first of these regulations, (i), requires the installation of two-way EOT or DP devices. The
reason for this is the length of typical Class 3 unit trains. If the brakes needed to be applied in an
emergency, it took too long for the cars in the rear to receive the braking signal, since it must travel
through the train car by car starting at the front. This meant it took a long time for all brakes to be applied.
The EOT and DP devices provide additional signals to the train so that all of the brakes may be fully
activated sooner than if it was using the traditional systems. The delay is not as relevant in Class 7 HLRM
dedicated trains since they are only up to 15 cars long, and the signal travel time is negligible compared to
that of the Class 3 unit trains which can be up to 120 cars long.
The second and third of these regulations, (ii) and (iii), require the installation of ECP brakes
by 2021 and 2023, respectively, on HHFUTs that travel in excess of 30 mph, which is a majority of them
when considering typical operating conditions. ECP brakes are an upgrade to the traditional air braking
technology which effectively allow all of the brakes on the train to be activated simultaneously, similar
to the effect of the EOT and DP devices. This brings the level of restriction on brake systems of Class 3
trains beyond the Class 7 brake system restrictions imposed by AAR Standard S-2043, but not until 2021
at the latest. Note that this regulation only applies to HHFUTs, which are defined in the 80 FR 26643-
26750 as ―a train comprised of 70 or more loaded tank cars containing Class 3 flammable liquids
traveling at greater than 30 mph.‖ [9]
Brake system quality primarily affects TE1 of the event tree. Better brakes decrease the
probability of an accident or derailment. The other top events are not directly affected, but can be affected
indirectly through the effects brake systems have on train speed.

44
4.2 Hypothetical Accident Conditions
Hypothetical accident condition regulations work under the assumption that Top Events 1 and 2 fail, and
they determine how well prepared each type of rail transport car needs to be to withstand the stresses
expected during an accident. There are four tests that each rail container can be subjected to by regulation.
The first is a drop test, simulating the railcar or container falling some distance onto a surface. The second
is a puncture test, which involves applying a concentrated force to the container. The third is a thermal
test, which involves subjecting the container to a pool fire and/or a torch fire for the required amount
of time. The fourth test is an immersion test, which involves placing the container underwater and
checking for breaches in containment.
Class 3 and Class 7 material containers are subject to different regulations of hypothetical
accident scenario testing. Class 7 HLRM containers are subject to all four types of testing, and
in sequence, meaning the same cask must pass all four in the given order to be certified for operation.
Class 3 containers, such as the DOT-111, are subject to only the puncture and thermal tests. This section
outlines these tests and provides analysis on the differences in requirements that each must pass
by regulation.
Each of these tests affects the failure probability of TE3 (material release) of the Chapter 2 PRA.
As stated in Chapter 2, TE3 failure probability can also be represented by a fault tree, with basic events
representing each of the four failure modes addressed by the hypothetical accident condition regulatory
tests. The sum of the failure probabilities for each of these basic events is equal to the total theoretical
Top Event 3 failure probability. Thus, increasing regulatory requirement for these conditions leads to
a decreased failure probability. The primary areas of effect in regards to the PRA are shown in Fig. 4.4.

45
Figure 4.4: PRA parameters affected by hypothetical accident condition testing regulation
4.2.1 Drop Test
Class 7 HLRM containers are subject to a drop test as per 10 CFR 71.73, which states that the container
must undergo ―A free drop of the specimen through a distance of 9 m (30 ft.) onto a flat, essentially
unyielding, horizontal surface, striking the surface in a position for which maximum damage is expected.‖
[35] In the case of the free drop, the orientation that would cause the most damage is generally regarded
as the following in Fig. 4.5:

46
Figure 4.5: Drop Test accident scenario for Class 7 HLRM container in orientation where
maximum damage is expected
Based on the following kinetics equation, in which g is acceleration due to gravity and h is height of the
container before the drop, the speed of the cask upon impact is approximately 13 meters per second, or 30
miles per hour. This can also simulate a 30 mph impact as part of a train system. The drop test is the first
of four required of a SNF/HLRW container. It is not required for a Class 3 container.
√
(19)
4.2.2 Puncture Test
The first test common to containers of both material classes is the puncture test. The puncture test
investigates the ability of the packaging container to withstand a concentrated force in a hypothetical
accident scenario. Puncture test procedures for each container type vary but have a similar concept:
application of a large force over a small area at the weakest points of the container. For the Class 7
container, this involves dropping it onto an upright metal rod, while for the Class 3 HHFT container,
it involves hitting the container from the side with a ram.
The full puncture test requirements for the Class 7 container can be found in 10 CFR 71, and are
reproduced below.

47
A free drop of the specimen through a distance of 1 m (40 in) in a position for which maximum
damage is expected, onto the upper end of a solid, vertical, cylindrical, mild steel bar mounted on
an essentially unyielding, horizontal surface. The bar must be 15 cm (6 in) in diameter, with the
top horizontal and its edge rounded to a radius of not more than 6 mm (0.25 in), and of a length as
to cause maximum damage to the package, but not less than 20 cm (8 in) long. The long axis of
the bar must be vertical. [35]
In the case of the puncture test, the orientation that causes the most damage is considered to be
perpendicular to the side of the cask, as shown in Fig. 4.6 below.
Figure 4.6: Puncture test orientation for maximum damage for Class 7 SNF/HLRW containers
The setup is different for a Class 3 container. The puncture test is performed by setting the tank car up
in a stationary position and then striking it with a ram car. The full requirements can be found in
80 FR 26643-26750 for the side-on puncture test. Prior to that Rule, only a head-on puncture was
required, which was not necessarily the orientation that would inflict the maximum damage, as is required
in the SNF/HLRW container regulations. The new regulation for the HHFT tank car is as follows, with
the orientations shown in Fig. 4.7:

48
The tank car must be able to withstand a minimum side impact speed of 12 mph when impacted at
the longitudinal and vertical center of the shell by a rigid 12-inch by 12-inch indenter with a
weight of 286,000 pounds. [9]
Figure 4.7: Class 3 tank car puncture test orientations [36]
The required specifications for the tests of the SNF/HLRW container and the crude oil railcar differ in
each of impact force, indenter size, and impact speed. To obtain the relative magnitude of the tests, the
specifications will be normalized to a quantity that exemplifies the puncture intensity. This quantity
is represented by the variable I in the following equation:
(20)
F: force of impact
v: relative velocity of container and indenter on impact
A: impact area (or area of indenter face)
Puncture intensity is proportional to both impact force and velocity because as either increases, the more
difficult it becomes for the material to remain intact upon impact. Puncture intensity is inversely
proportional to impact area since a smaller contact area concentrates the given applied force (increases the
pressure), thereby causing a higher stress on the shell contact area.
[Orientation now required by 80 FR 26643-26750]
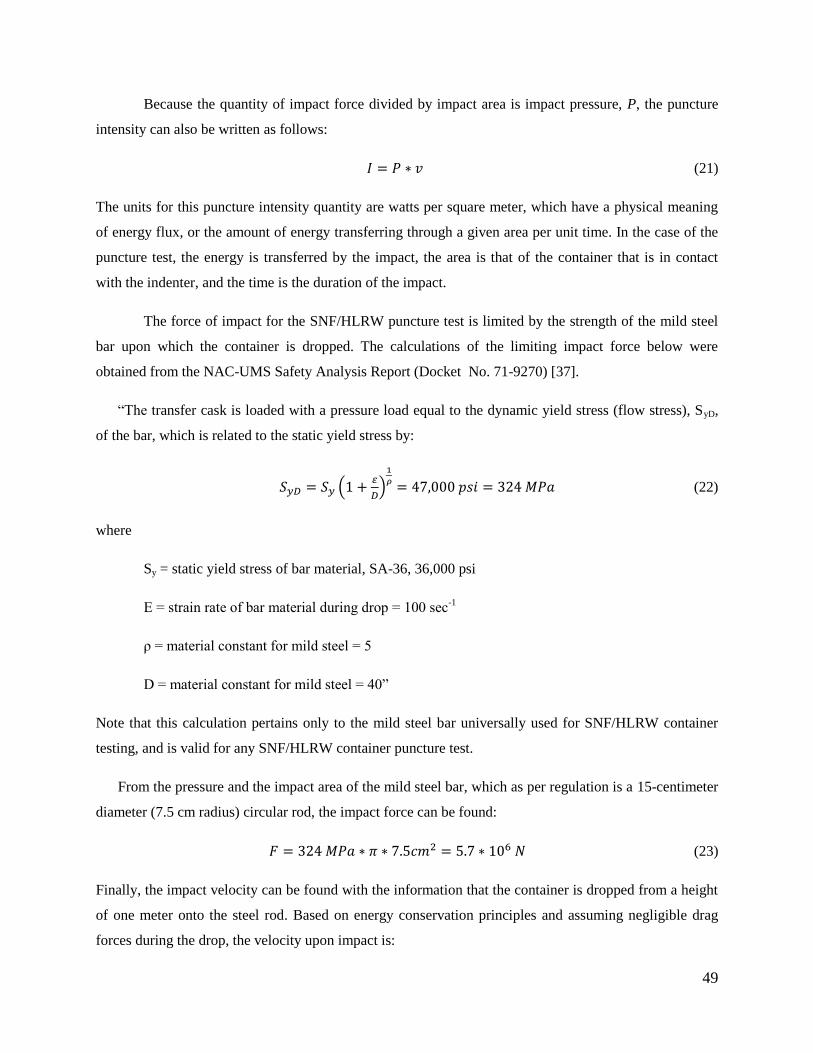
49
Because the quantity of impact force divided by impact area is impact pressure, P, the puncture
intensity can also be written as follows:
(21)
The units for this puncture intensity quantity are watts per square meter, which have a physical meaning
of energy flux, or the amount of energy transferring through a given area per unit time. In the case of the
puncture test, the energy is transferred by the impact, the area is that of the container that is in contact
with the indenter, and the time is the duration of the impact.
The force of impact for the SNF/HLRW puncture test is limited by the strength of the mild steel
bar upon which the container is dropped. The calculations of the limiting impact force below were
obtained from the NAC-UMS Safety Analysis Report (Docket No. 71-9270) [37].
―The transfer cask is loaded with a pressure load equal to the dynamic yield stress (flow stress), SyD,
of the bar, which is related to the static yield stress by:
(
)
(22)
where
Sy = static yield stress of bar material, SA-36, 36,000 psi
Ε = strain rate of bar material during drop = 100 sec-1
ρ = material constant for mild steel = 5
D = material constant for mild steel = 40‖
Note that this calculation pertains only to the mild steel bar universally used for SNF/HLRW container
testing, and is valid for any SNF/HLRW container puncture test.
From the pressure and the impact area of the mild steel bar, which as per regulation is a 15-centimeter
diameter (7.5 cm radius) circular rod, the impact force can be found:
(23)
Finally, the impact velocity can be found with the information that the container is dropped from a height
of one meter onto the steel rod. Based on energy conservation principles and assuming negligible drag
forces during the drop, the velocity upon impact is:
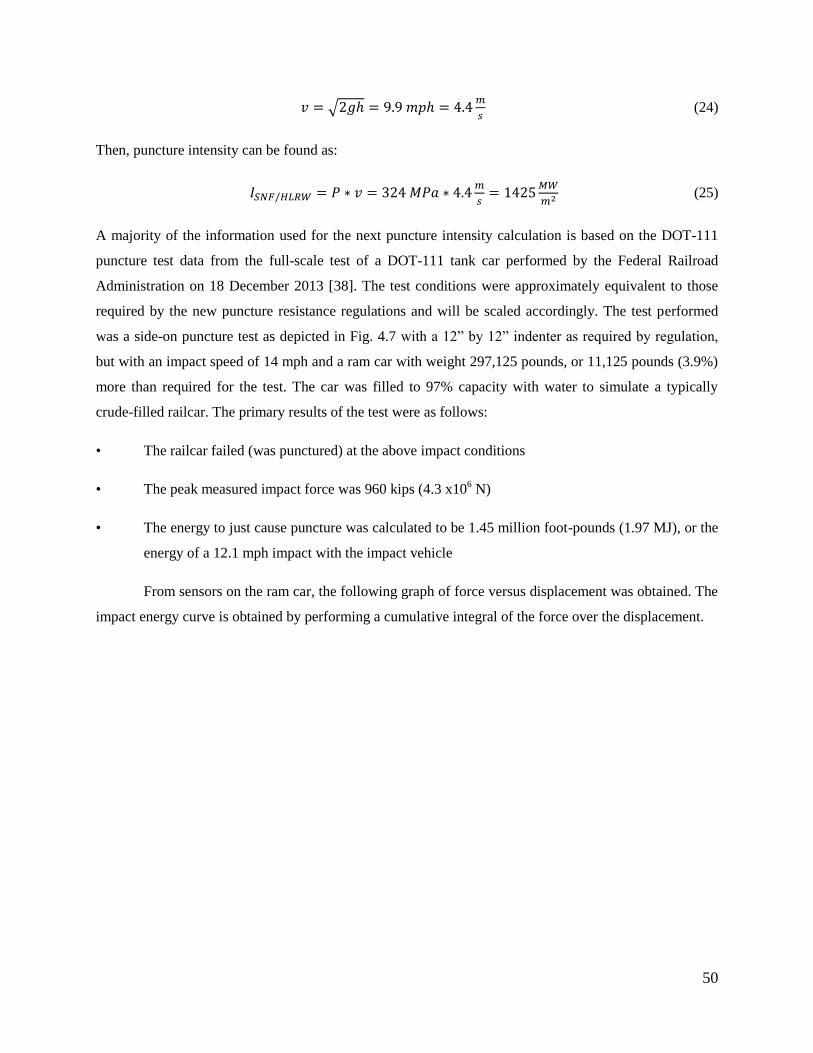
50
√
(24)
Then, puncture intensity can be found as:
(25)
A majority of the information used for the next puncture intensity calculation is based on the DOT-111
puncture test data from the full-scale test of a DOT-111 tank car performed by the Federal Railroad
Administration on 18 December 2013 [38]. The test conditions were approximately equivalent to those
required by the new puncture resistance regulations and will be scaled accordingly. The test performed
was a side-on puncture test as depicted in Fig. 4.7 with a 12‖ by 12‖ indenter as required by regulation,
but with an impact speed of 14 mph and a ram car with weight 297,125 pounds, or 11,125 pounds (3.9%)
more than required for the test. The car was filled to 97% capacity with water to simulate a typically
crude-filled railcar. The primary results of the test were as follows:
• The railcar failed (was punctured) at the above impact conditions
• The peak measured impact force was 960 kips (4.3 x10⁶ N)
• The energy to just cause puncture was calculated to be 1.45 million foot-pounds (1.97 MJ), or the
energy of a 12.1 mph impact with the impact vehicle
From sensors on the ram car, the following graph of force versus displacement was obtained. The
impact energy curve is obtained by performing a cumulative integral of the force over the displacement.
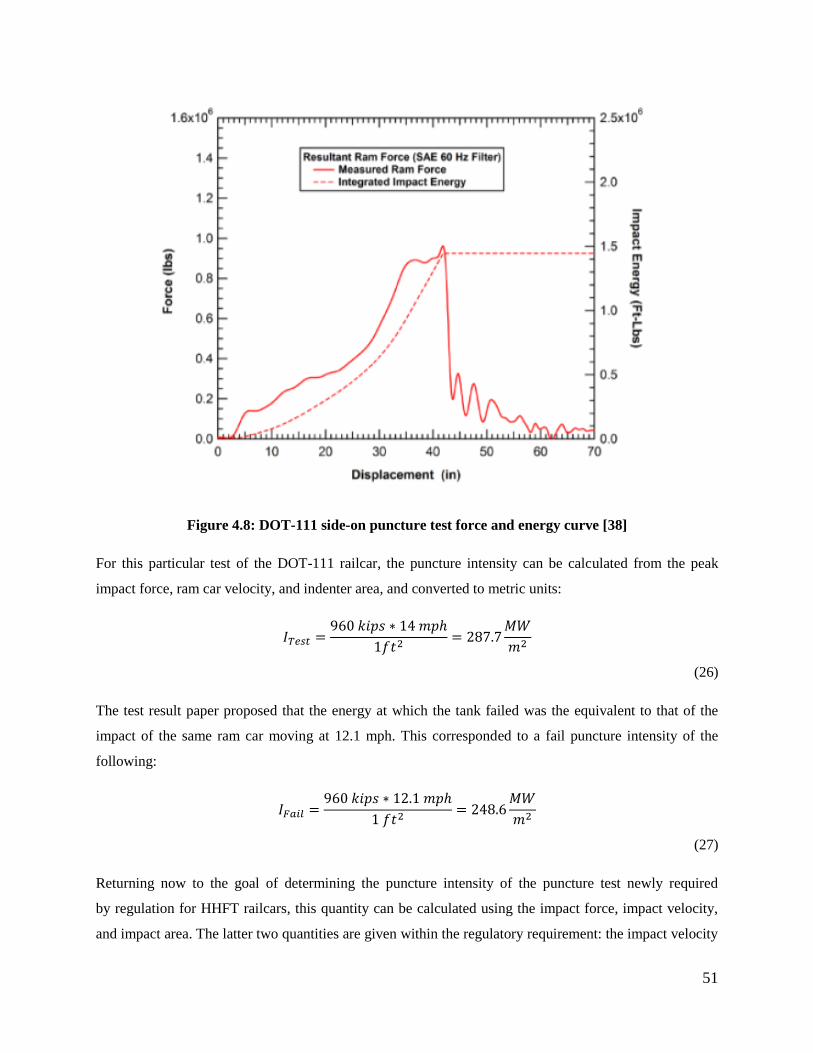
51
Figure 4.8: DOT-111 side-on puncture test force and energy curve [38]
For this particular test of the DOT-111 railcar, the puncture intensity can be calculated from the peak
impact force, ram car velocity, and indenter area, and converted to metric units:
(26)
The test result paper proposed that the energy at which the tank failed was the equivalent to that of the
impact of the same ram car moving at 12.1 mph. This corresponded to a fail puncture intensity of the
following:
(27)
Returning now to the goal of determining the puncture intensity of the puncture test newly required
by regulation for HHFT railcars, this quantity can be calculated using the impact force, impact velocity,
and impact area. The latter two quantities are given within the regulatory requirement: the impact velocity
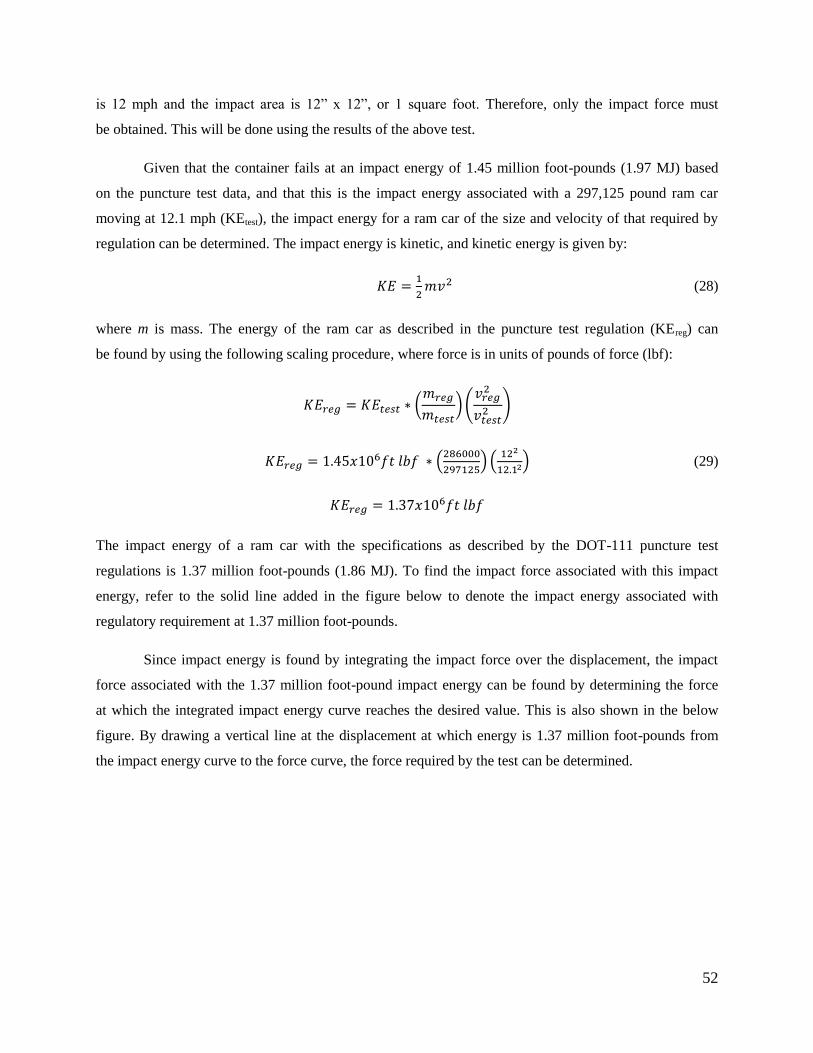
52
is 12 mph and the impact area is 12‖ x 12‖, or 1 square foot. Therefore, only the impact force must
be obtained. This will be done using the results of the above test.
Given that the container fails at an impact energy of 1.45 million foot-pounds (1.97 MJ) based
on the puncture test data, and that this is the impact energy associated with a 297,125 pound ram car
moving at 12.1 mph (KEtest), the impact energy for a ram car of the size and velocity of that required by
regulation can be determined. The impact energy is kinetic, and kinetic energy is given by:
(28)
where m is mass. The energy of the ram car as described in the puncture test regulation (KEreg) can
be found by using the following scaling procedure, where force is in units of pounds of force (lbf):
(
)(
)
(
) (
) (29)
The impact energy of a ram car with the specifications as described by the DOT-111 puncture test
regulations is 1.37 million foot-pounds (1.86 MJ). To find the impact force associated with this impact
energy, refer to the solid line added in the figure below to denote the impact energy associated with
regulatory requirement at 1.37 million foot-pounds.
Since impact energy is found by integrating the impact force over the displacement, the impact
force associated with the 1.37 million foot-pound impact energy can be found by determining the force
at which the integrated impact energy curve reaches the desired value. This is also shown in the below
figure. By drawing a vertical line at the displacement at which energy is 1.37 million foot-pounds from
the impact energy curve to the force curve, the force required by the test can be determined.
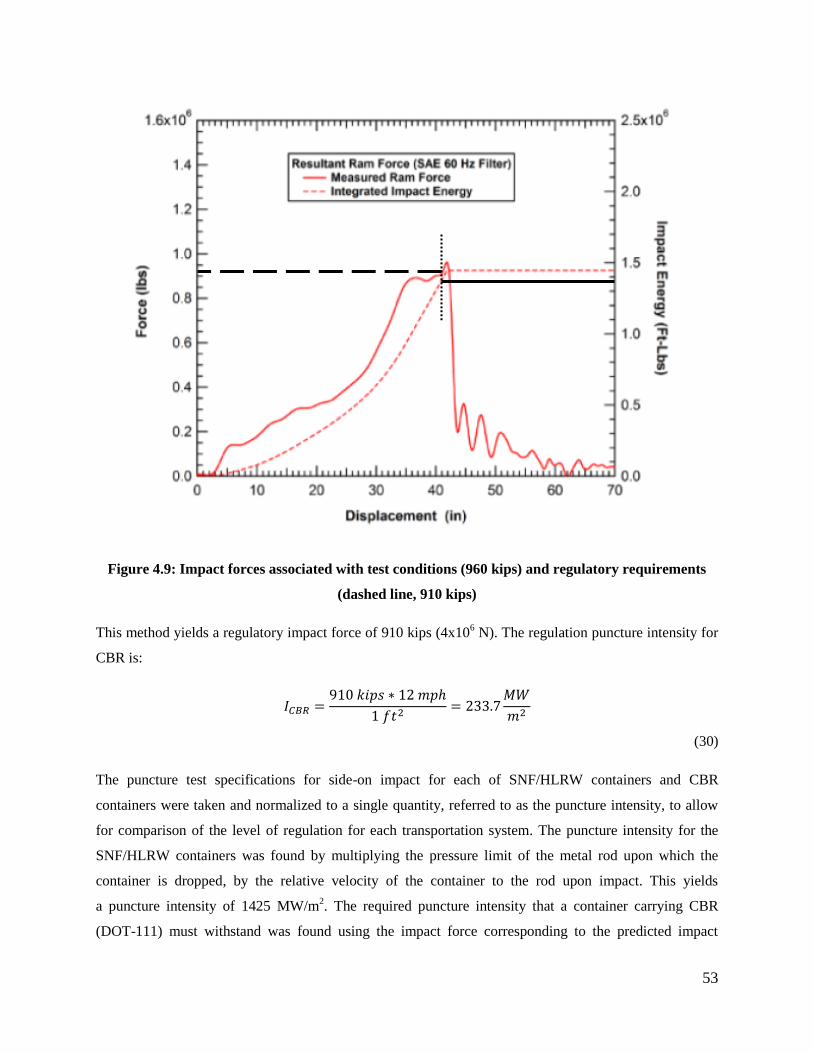
53
Figure 4.9: Impact forces associated with test conditions (960 kips) and regulatory requirements
(dashed line, 910 kips)
This method yields a regulatory impact force of 910 kips (4x10⁶ N). The regulation puncture intensity for
CBR is:
(30)
The puncture test specifications for side-on impact for each of SNF/HLRW containers and CBR
containers were taken and normalized to a single quantity, referred to as the puncture intensity, to allow
for comparison of the level of regulation for each transportation system. The puncture intensity for the
SNF/HLRW containers was found by multiplying the pressure limit of the metal rod upon which the
container is dropped, by the relative velocity of the container to the rod upon impact. This yields
a puncture intensity of 1425 MW/m2. The required puncture intensity that a container carrying CBR
(DOT-111) must withstand was found using the impact force corresponding to the predicted impact
54
energy and the required impact velocity and indenter area. This yields a puncture intensity of 233.7
MW/m2. It is also calculated that a DOT-111 would fail at a puncture intensity of 248.6 MW/m
2.
Four primary observations can be drawn from these calculations:
1) Federal puncture test requirement regulations of SNF/HLRW rail transport containers have 6.1
times the puncture intensity of those now implemented for CBR rail transportation containers.
2) Federal regulations for puncture test requirements of rail transport containers for SNF/HLRW are
5.73 times greater than the failure puncture strength of a typical DOT-111 railcar.
3) DOT-111 railcars can be cleared for operation with a puncture resistance safety factor of 1.06.
4) Probability of failure of the puncture basic event of the TE3 fault tree is greater for the DOT-111
than for a SNF/HLRW cask.
Note that the data from this single test performed on the DOT-111 is not necessarily
representative of all DOT-111 tank cars, and that the contents of the tank during the test (water) are not
necessarily representative of the standard contents of the railcar during typical operation (Class 3
material) during puncture conditions.
4.2.3 Thermal Test
The thermal test is the second hypothetical accident condition that both Class 3 and Class 7 packages are
tested to withstand. Thermal tests consist of subjecting the containers to a fire for a specified temperature
and duration. For Class 7 (SNF/HLRW) containers, the specific conditions are found in 10 CFR 71, and
the orientation is shown in Fig. 4.10. The information from that regulation relevant to this analysis
is given below.
Exposure of the specimen fully engulfed, except for a simple support system, in a hydrocarbon
fuel/air fire of sufficient extent, and in sufficiently quiescent ambient conditions, to provide an
average emissivity coefficient of at least 0.9, with an average flame temperature of at least 800 °C
(1475 °F) for a period of 30 minutes…and the specimen must be positioned 1 m (40 in) above the
surface of the fuel source. [35]

55
Figure 4.10: Thermal test orientation for Class 7 HLRM packaging
The procedures and requirements for tank cars used to carry Class 3 material differ from the radioactive
material container tests, and they can be found in 49 CFR 179, Appendix B. The tank cars are subject
to two different thermal tests: a pool fire, similar to that described above, and a torch fire, which is a more
concentrated flame at a hotter temperature. However, for this thermal test, tank cars are not tested, but
rather metal plates of the same material, thickness, and thermal properties as the tank car shell with
thermal shielding equivalent to that on a full-size tank car.
The thermal test procedure for the tank car pool and fire tests are each two step processes. The
first step demonstrates that heat will flow through the metal plate in the absence of a thermal protection
system. The procedure consists of exposing a metal plate to the fire conditions described by regulation
(reproduced in the Table 4.1 below) with nine thermocouples in the required arrangement on the
unexposed side of the plate. The thermocouples must indicate temperatures between 0° and 37.8° Celsius
prior to fire exposure. One side of the plate is then exposed to the fire in a fashion where the only heat
transfer path is through the plate. A minimum of two thermocouple devices must indicate 427 °C (800 °F)
after 13 minutes, plus-or-minus one minute, of simulated pool-fire exposure. A minimum of two
thermocouples must indicate 427 °C (800 °F) in four minutes, plus-or-minus 30 seconds, of torch
simulation exposure. [39]
This portion of the test ensures that the fire is providing enough heat to adequately test the
thermal protection system by serving as an experimental control. For example, if the thermocouples
remained at low temperatures after fire exposure without a thermal protection system, then they would
certainly remain at low temperatures in the test with the thermal protection system, in which case the
thermal protection system performance would be unclear.

56
The second portion of the test is similar to the first, except the plate has a thermal protection
system on the side exposed to the fire. The other side has the thermocouples arranged as in the first
portion, with the same pre-fire exposure temperature minimum and maximum (0° C to 37.8° C). The
protected plate is then exposed. For both the pool fire and torch fire tests, the thermal protection system
must retard the heat flow to the plate so that none of the thermocouples on the non-protected side of the
plate indicate a plate temperature in excess of 427 °C. The pool fire test requires a minimum of three
consecutive successful simulation fire tests for each thermal protection system. The torch fire test requires
a minimum of two consecutive successful tests for each thermal protection system. [39]
After determining that heat would indeed flow through the plate without a thermal protection
system in the first portion of the test, the second portion demonstrates the ability of the thermal protection
system to sufficiently retard head flow.
Table 4.1: Class 3 tank car thermal test specifications [39]
Test Type Fire Temperature (°C) Duration (min)
Pool 871 100
Torch 1204 30
Higher temperature and duration standards for Class 3 tank cars are logical, since Class 3 materials
(flammable liquids) are a fuel source for a thermal incident. Should the contents of a tank car ignite
somehow, the adjacent tank cars should be able to withstand the resulting thermal load as long as there
exists fuel to burn. SNF/HLRW containers do not have flammable contents, and a dedicated train would
not have other containers with flammable contents, so a thermal load of the magnitude of 25,000+ gallons
of burning crude oil would have to come from an outside source.
In an attempt to minimize the likelihood of subjecting HLRM containers to extensive thermal
stress, the AAR passed, as part of Circular No. OT-55-N, a ―no-pass‖ restriction regarding the movement
of trains carrying HLRM into a tunnel simultaneously occupied by a Class 2 (flammable gas) or Class 3
train. This is in light of the Howard Street Tunnel fire in Baltimore, MD in 2001 [40], during which a
derailed train carrying tripropylene and hydrochloric acid, Class 3 materials, led to a chemical fire that
burned in a tunnel for five to six days before it could be extinguished. It is unknown whether a HLRM
container could withstand this level of thermal stress, but to avoid the risk altogether, the restriction was
implemented. It is as follows:

57
When a train carrying SNF or HLRW meets another train carrying loaded tank cars of flammable
gas, flammable liquids or combustible liquids in a single bore double track tunnel, one train shall
stop outside the tunnel until the other train is completely through the tunnel. [26]
This no-pass restriction has the effect of further reducing the failure probability of the thermal failure
basic event within the fault tree representative of TE3. By reducing the availability of a thermal source,
the probability of thermal failure is reduced, and thus the probability of hazardous material release
is reduced.
A potential issue lies within the setup of the Class 3 tank car thermal test. The test determines the
ability of a plate of the same thermal properties and thickness to withstand the given thermal load, but this
does not capture the other potential effects stemming from a tank car being subject to a thermal load, such
as expansion of the contained liquid and the resulting pressure buildup within the tank. Pressure buildup
can cause a tank rupture, even if the tank hull is able to withstand the external thermal load.
A report by AAR written to the Pipeline and Hazardous Materials Safety Administration
(PHMSA) regarding Recommendations to Improve the Safety of Railroad Tank Car Transportation
in November 2013 [41] provides an overview of the ability of different variations of DOT-111 tank cars
to withstand a 1500° F (815° C) pool fire. This analysis was performed using the AFFTAC model, which
is the model typically used to perform an analysis of fire effects on tank cars. Results are shown in Table
4.2 below. The study shows that tank cars carrying ethanol without jackets failed the thermal test in fewer
than 100 minutes, which is the minimum survival time required by regulation. The tank cars that were
carrying diesel fuel or that were jacketed were able to withstand the fire for the required length of time.
Though definitive conclusions cannot be drawn regarding tank cars carrying crude oil from this study, it
can still be concluded that the thermal test of a bare metal plate required by regulation does not fully
encompass the effects of a thermal load on an enclosed tank car.

58
Table 4.2: Thermal test model of DOT-111 variations subjected to 1500° F pool fire [41]
Tank Car Features
Survival Time in Pool
Fire (min.) Ethanol
Survival Time in Pool
Fire (min.) Diesel Fuel
Non-CPC 1232
DOT 111
None 51 252
JKT 72 321
CPC-1232 DOT-
111 without JKT
with HHS, additional
1/16" shell thickness,
TFP 65 261
CPC-1232 DOT-
111 with JKT with JKT, FHS, TFP all lading expelled at 623 1,355
CPC-1232 – AAR tank car standard effective 1 Oct 2011; JKT – Jacketed; HHS – Half-height head shield; FHS –
Full height head shield; TFP – Top fittings protection
4.2.4 Immersion Test
Two different immersion tests are required of Class 7 containers. The first is the fourth and final test
in sequence after the drop, puncture, and thermal tests on the same cask. This immersion tests requires
― For fissile material subject to §71.55, in those cases where water in-leakage has not been assumed for
criticality analysis, immersion under a head of water of at least 0.9 m (3 ft) in the attitude for which
maximum leakage is expected. [35]‖ A separate immersion test, this time for a package not previously
subjected to the drop, puncture, and thermal tests, is to be performed on ―A separate, undamaged
specimen must be subjected to water pressure equivalent to immersion under a head of water of at least 15
m (50 ft). [35]‖ No radioactive material should be released from the packages to pass each immersion
test. The basic orientation is shown in Fig. 4.11.
An immersion test is not required for Class 3 tank cars.

59
Figure 4.11: Immersion test schematic for SNF/HLRW containers
This immersion test requirement reduces the basic event failure probability of immersion failure in the
TE3 fault tree, further reducing the overall TE3 failure probability.
4.3 Regulation Summary
Regulations are implemented in the transportation industry for the purpose of reducing risk. All three top
events of the PRA are targeted. TE1 and TE2 are targeted by operational regulations, and TE3 is targeted
by hypothetical accident condition regulations, in general. These regulations differ based upon the class
of hazardous material being transported. It is seen that Class 3 material is more restricted in its operation
considering train speed and brake systems, but note also that SNF/HLRW trains are typically restricted
to being dedicated trains with fewer cars and more security. SNF/HLRW trains are far more regulated
based on hypothetical accident condition requirements, requiring tests of all four failure modes
in sequence, whereas Class 3 containers require only separate puncture and thermal tests.
From a risk-based standpoint, Class 7 containers have a lower TE3 failure probability than Class
3 containers. In all accident condition cases, Class 7 containers have more stringent regulations, and
a claim can therefore be made that it has lower probability of failure. A comparison of probabilities of
TE1 and TE2 failure between the two classes is less clear. Multiple factors require consideration. It is
quantitatively unknown how much each factor reduces failure probability of the top events. Questions
such as the following need to be addressed in order to form a complete comparison of risk due
to shipments of the two material classes:
Water

60
Does a reduction in train speed of Class 3 trains in HTUAs or use of fewer cars in Class 7
dedicated trains reduce risk and failure probability more?
Will ECP brake systems leave Class 3 unit trains and Class 7 dedicated trains on par in
terms of braking ability?

61
5. Approaches to Risk Reduction and Future Work
A PRA was performed here, factors affecting risk perception were identified, and regulatory attempts at
risk reduction were analyzed. It is thus now appropriate to suggest further approaches to a reduction in
risk for the transportation of hazardous material by rail. The purpose of this chapter is to address solutions
to risk perception and regulation issues based on the results of the PRA performed in Chapter 2. Existing
factors and regulations and their effects on the PRA will be summarized, and approaches to improve them
will be provided. Since Class 7 transportation by rail has not yet occurred on a large scale, there is still
time to make this analysis and potentially implement some of the suggestions made.
5.1 Risk Perception Sensitivity and Analysis
Table 5.1 summarizes the factors affecting risk perception and the corresponding effects they have on the
PRA results.
Table 5.1: Summary of factors affecting risk perception and their corresponding effect on PRA
parameters
Factor Affected PRA Parameter Effect on PRA Parameter
Natural/Industrial Success Cost Increased
Chronic/Catastrophic Major Failure Frequency Increased
Familiar/Unfamiliar Major Failure Cost Increased
Trustworthy/Untrustworthy Success Probability Decreased
Although it is unknown how much the listed in Table 5.1 affect the total risk in their present state, it is
possible to consider the sensitivity of the total risk to each factor. This discussion of sensitivity provides
insight regarding the rate of risk change per change in PRA parameter, but not the current effect level on
those parameters. Additional research is required to determine which of the factors affects risk perception
the most presently. Much like the risk importance measure analysis in Chapter 2, this sensitivity analysis
is useful for providing a path towards efficient risk reduction methods.
The sensitivity analysis is performed by varying the value of a parameter and observing the
change in total risk. By plotting total risk versus parameter change, the sensitivity of risk to the given
parameter is obtained; sensitivity is given by the slope of the resultant curve. Fig. 5.1 shows results of
analysis of the sensitivity of risk to each of the four risk perception factors. The risk is most sensitive to
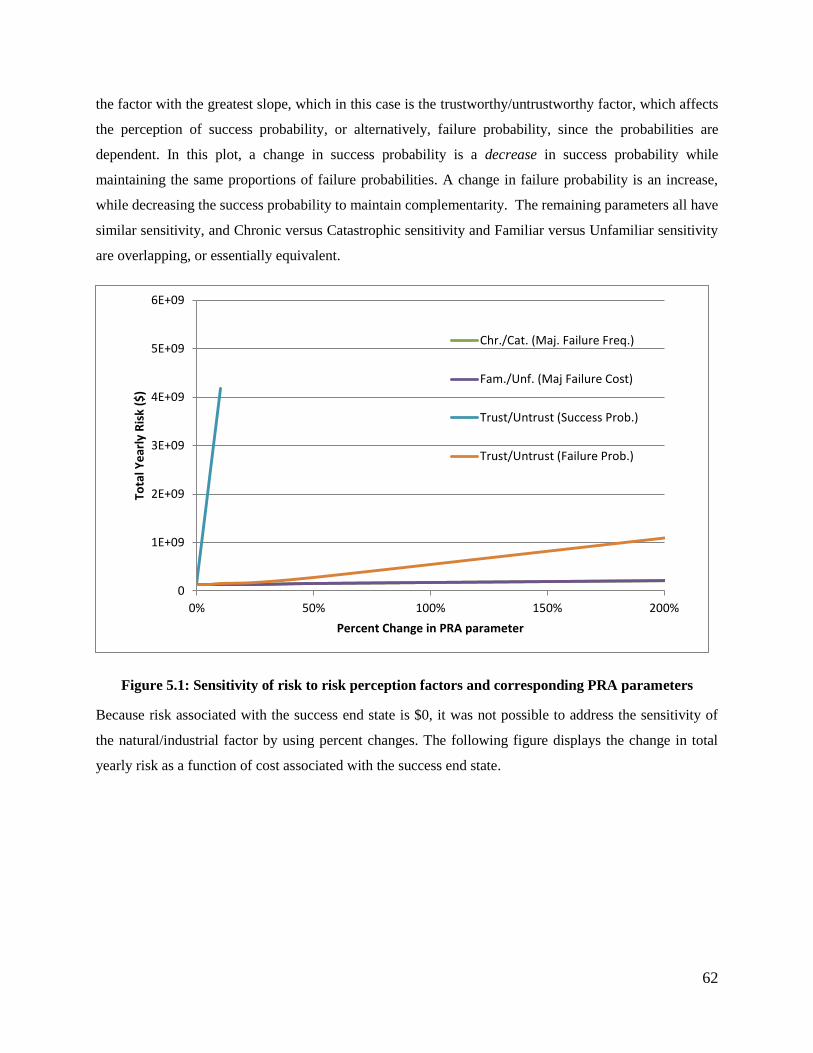
62
the factor with the greatest slope, which in this case is the trustworthy/untrustworthy factor, which affects
the perception of success probability, or alternatively, failure probability, since the probabilities are
dependent. In this plot, a change in success probability is a decrease in success probability while
maintaining the same proportions of failure probabilities. A change in failure probability is an increase,
while decreasing the success probability to maintain complementarity. The remaining parameters all have
similar sensitivity, and Chronic versus Catastrophic sensitivity and Familiar versus Unfamiliar sensitivity
are overlapping, or essentially equivalent.
Figure 5.1: Sensitivity of risk to risk perception factors and corresponding PRA parameters
Because risk associated with the success end state is $0, it was not possible to address the sensitivity of
the natural/industrial factor by using percent changes. The following figure displays the change in total
yearly risk as a function of cost associated with the success end state.
0
1E+09
2E+09
3E+09
4E+09
5E+09
6E+09
0% 50% 100% 150% 200%
Tota
l Ye
arly
Ris
k ($
)
Percent Change in PRA parameter
Chr./Cat. (Maj. Failure Freq.)
Fam./Unf. (Maj Failure Cost)
Trust/Untrust (Success Prob.)
Trust/Untrust (Failure Prob.)

63
Figure 5.2: Sensitivity of risk to cost associated with success end state
In this figure, the y-intercept is the present value of risk. To put this in perspective with the other
parameters, a $5000-cost associated with the end state has a similar effect to increasing the failure
probabilities by approximately 180%.
The sensitivity analysis demonstrates that the best approach for reducing perceived risk is to
address the trustworthy versus untrustworthy and the natural versus industrial risk perception factors. The
factors can be addressed with cooperation and education, respectively. Cooperation with the public tends
to build trust, while a lack of cooperation diminishes it. This can be seen historically with the attempts
of establishing long-term HLRM repositories in Sweden and the United States. As stated by the U.S.
Secretary of Energy Advisory Board, ―public trust and confidence is generally essential for agencies
to carry out effectively missions assigned to them.‖ [42] In the Environmental Impact Statement of SKB,
the company responsible for managing Sweden’s nuclear waste, it is stated among ―Key factors for
progress in the Swedish nuclear waste management programme‖ that ―Building of trust in affected
municipalities creates the necessary public acceptance.‖ [43] Establishing trust decreases the perceived
risk, which is what makes it so vital to actions such as hazardous material transportation and storage.
Establishing trust through public cooperation also helps to reduce perceived risk when addressing the
0.000
0.400
0.800
1.200
1.600
2.000
0 2000 4000 6000 8000 10000 12000
Tota
l Ye
arly
Ris
k (G
$)
Cost associated with success end state

64
familiar versus unfamiliar factor. By introducing cooperation into the hazardous material management
procedure, the public has the ability to become more familiar with the materials in question. Take again
as an example the approach taken by SKB during the repository establishment process up to the present
time of this thesis. All of the SKB facilities are open to visitor tours, including the ISF, canister
laboratory, and Aspӧ Hard Rock Laboratory, each of which are essential to the development of the
repository. [44].The transparent approach taken by SKB provides a way for the public to become familiar
with the materials and provides a path for establishing trust, both of which decrease perceived risk. In the
United States, a consent-based approach was not taken for siting Yucca Mountain, and that project has
since stalled due largely in part to public opposition. The State of Nevada vetoed the attempt of DOE
to send waste to Yucca, and then took action to prevent the construction of railways to get the waste
to Yucca subsequently. [45] Following the support withdrawal from the Yucca Mountain project, the
Obama Administration formed a panel of experts to formulate a plan for an alternative repository
solution. This panel, known as the Blue Ribbon Commission on America’s Nuclear Future (BRC),
presented a report in 2011 to the Secretary of Energy regarding their suggestions to an approach for future
potential repository. The basis of the siting process recommended in the report was to follow a consent-
based approach. [46, 47]
A cooperative approach is relevant to hazardous material transportation as well. Among the
causes of the Yucca Mountain project failure was the Walker River Paiute Tribe withdrawal
of permission to ship nuclear waste through its reservation. [46] This inhibited the transportation of
Class 7 material to a final repository destination. There is also opposition to the operation as a whole,
including shipment along current rail lines. Since ―the potential for an accident and subsequent release
of radioactive materials has generated considerable opposition to transporting large amounts
of radioactive waste,‖ [48] there is still room for improvement regarding the public perception of the
shipments. A potential approach would be to work with local authorities to support emergency response
training, as provided by Section 180(c) of the Nuclear Waste Policy Act, as amended in 1987. [49] This
approach would have several effects on risk and risk perception, such as making the material more
familiar, lessening the likelihood of a catastrophic incident, and establishing trust with local communities,
thereby addressing three of the risk perception factors. Another approach is to develop cooperation
programs such as the ―Commercial Vehicle Safety Alliance, which seeks uniformity in commercial
vehicle inspections and enforcement activities,‖ and the FRA Safety Assurance and Compliance Program,
which works ―to identify systemic safety issues, including issues pertaining to hazardous materials
transportation, and to develop and implement plans to address them.‖ [50] These programs develop trust
between the public and those responsible for handling the hazardous materials.

65
The second approach to reducing perceived risk is through providing knowledge about the
subject. This approach addresses the natural versus industrial and chronic versus catastrophic factors, and
also helps address the familiar versus unfamiliar factor. Radiation has a high outrage factor, and providing
knowledge about natural radiation and a comparison to levels of industrial radiation may be useful to
decreasing the sense of risk due to the natural versus industrial factor. However, this is more difficult to
effectively implement than the cooperation approach since reaching out to the masses with this type of
knowledge is challenging and can be taken as an attempt of disinformation. Because the knowledge is
provided to reach some goal for the providers benefit, such as permission for hazmat transportation or the
development of a HLRM storage facility, the legitimacy of the information can be questioned. Therefore,
this approach is secondary to cooperation, as attempting to educate the public before establishing trust can
cast doubt upon the authenticity of the information conveyed.
5.2 Regulatory Effects and Reduction Approaches
Unlike risk perception factors, regulation affects the probabilities of individual top events within the PRA
event tree. Table 5.2 below summarizes the regulations discussed in this thesis and the corresponding
affected top events for each.
Table 5.2: Affected top events for each regulated train system feature
Regulated Train System Feature Affected Top Event (TE)
Speed TE1 TE2 TE3
Train Length TE1 TE2
Car Weight TE1
Brake Systems TE1
Hypothetical Accident Conditions TE3
The sensitivity analysis for these regulations is essentially identical to the risk importance
measures analysis performed in Chapter 2 of this thesis. The sensitivity of risk to each is proportional
to the sum of the risk importance of the affected top events. Therefore, risk is most sensitive to the
operational regulations, which all include TE1 as an affected top event. TE1 is currently the most affected
top event by regulation, which is one of the causes of the low failure probability it currently has. Because
TE1 has the greatest risk importance, it is the most targeted by regulatory measures. However,
hypothetical accident condition regulations are also vital, since, as discussed previously, the cost
of reducing derailment failure is likely very high due to its already very low probability. TE3 had the

66
second greatest risk importance measurement and has a much higher failure probability than
operation/derailment, which is what hypothetical accident condition regulations are intended to reduce.
One way to reduce risk through use of regulation is to increase the level of hypothetical accident
regulations required for containers of Class 3 material. The puncture test required of Class 3 containers
has a very small safety factor, and the speed required to cause puncture is much less than the average train
speed, leading to a very high likelihood of TE3 failure during a collision. The thermal test requirements
can also be improved to account for the effects of thermal expansion and bursting, rather than just the
thermal load abilities of the container material. Since Class 3 materials are flammable by definition, the
thermal test is one of the most relevant tests for those containers. It is possible to add a drop and
immersion test requirement for Class 3 containers as well, but those are much less relevant for Class 3
than for Class 7 because Class 7 containers are lifted off the train during standard operation, making a
drop scenario much more likely.
The probability of TE2 failure is a function of two parameters: n, the number of cars that derail
per derailment, and p, the ratio of hazmat cars to non-hazmat cars on trains. To reduce the failure
probability, either n or p must be reduced. Reducing n is done by addressing TE1 and decreasing the
probability of derailment on a car-by-car scale rather than a train-by-train scale. Speed regulations are
partly intended to achieve this effect, and other potential regulations of car connections may have
an effect on car-to-car derailment magnitude. Train length also affects n by limiting the number of cars
on a train, which thus limits the maximum number that can derail in an event. Requiring the use of key
or dedicated trains is one way to reduce n. The other approach is regulating p, which can be done by
limiting the number of hazmat-carrying cars per train. While this approach may reduce the probability of
hazmat derailment, it will cause efficiency issues, as unit trains are a major part of hazmat transportation.
Requiring diversity in train cargo would also cause the train to travel a longer distance to get cargo to all
destinations, thereby increasing probability of TE1 failure. Therefore, if TE2 must be addressed via
regulation, then reducing n is the best approach.
67
5.3 Conclusions
The risk of hazmat railroad transportation was analyzed in this thesis for two primary reasons. One was
to perform an analysis in preparation for an upcoming increase of radioactive material transport by rail
in the form of shipments of SNF/HLRW to an eventual ISF and repository site. This analysis can
potentially shed some light on the risk, risk perception, and regulatory issues regarding Class 7 railroad
transport. The second reason was to provide insight on the differences between Class 3 and Class 7
material transport in terms of risk perception and regulation. The probabilistic risk assessment (PRA) in
Chapter 2 was an assessment of hazardous material transport by rail in general (i.e., for all material
classes). The analyses of Chapters 3 and 4 then provided insight toward the differences between classes in
terms of the PRA.
The PRA in Chapter 2 was performed at a basic level to obtain point estimates of hazmat rail
transportation failure probabilities. From these estimates, a risk importance measures analysis was made
to identify which top events have the greatest impact on risk. The derailment/operational failure event and
the material release top events had the greatest importance. After further analysis of regulation in
Chapter 4, it was found that these top events were the most targeted by regulation. Each of the operational
regulations target derailment/operational failure, and the hypothetical accident condition regulations
target the material release failure. Regulations serve to reduce failure probability.
The regulations selected for analysis in this thesis were those in which regulation levels differ
between trains carrying Class 3 and Class 7 material. The comparison of regulatory stringency in Chapter
4 resulted in a deduction that Class 3 material rail transport has more stringent operational regulations.
This does not necessarily lead to the conclusion that Class 3 trains have a lower TE1 failure probability,
but rather that the probability contributions from those regulated factors are smaller. Though use
of dedicated trains for SNF/HLRW transport for future repositories is not officially mandated
by regulation, including this feature can greatly reduce TE1 failure probability for Class 7 trains.
Hypothetical accident condition regulations are more stringent for Class 7 trains than for Class 3
trains. The only possible exception is the thermal test, for which the flammable liquid-carrying trains have
higher temperature and duration requirements for the fires in the test. This exception is still questionable,
however, since some problems were found with the comprehensiveness of the Class 3 thermal test
procedure. For all other hypothetical accident condition tests (drop, puncture, and immersion), Class 7
trains have stricter requirements. Each test addresses a failure mode for TE3, and each requirement
reduces the probability of TE3 failure.
68
In addition to regulation, risk perception plays a role in creating an acceptable level of risk
needed for the performance of tasks such as hazardous material transportation. Several factors affect both
risk perception and some quantity in the PRA, such as failure probability or cost. Four factors were
analyzed in this thesis: natural versus industrial risks, chronic versus catastrophic risks, familiar versus
unfamiliar risks, and trustworthy versus untrustworthy risks. From the sensitivity analysis for these
factors, it was found that risk was most sensitive to the trustworthiness of those responsible for the risk.
It is suggested that cooperation was the best way to address this factor, since cooperation increases trust,
and thus decreases the perceived risk. Another approach to reduce perceived risk is to provide knowledge
to the public and educating them about any risks involved in hazmat transportation, but this is secondary
to cooperation because issues may arise regarding suspicions about the quality of information provided.
5.4 Future Work
Several assumptions were made within this thesis that can be expanded upon for a more accurate analysis
of hazmat transportation risk. Beginning in Chapter 2, various assumptions were made regarding the PRA
top events, including multiple homogeneity assumptions and a simple event tree with only three top
events. This is a target for improvement in a future analysis. For example, a similar risk assessment was
made by Liu, Saat, and Barkan, in which point of derailment was taken into account and probability
distributions were carried through the analysis, yielding a distribution for failure state probabilities. [13]
In the Chapter 2 PRA, the amount of available data led to a low uncertainty level, but a distribution yields
a more accurate failure state probability and is more characteristic of a complete risk assessment.
Assumptions were made regarding tank car placement, point of derailment, and train length homogeneity
in this thesis, which can be represented more accurately with additional data to obtain a more accurate
failure probability distribution.
A second possibility for future work is with a more in-depth analysis of the risk perception factors
and their relative effects on the PRA and risk perception in general. As stated within the sensitivity
analysis section, sensitivity provides information on the rate of risk change per change in risk perception
factor, but does not provide the current level of effect of the factor on the risk. A potential approach
to solve this problem is to conduct surveys of the public to determine which factors have the largest effect
on their perception of risk from hazardous materials. A similar approach was taken by Fischoff et al. in
1978 to determine the perceived risk of nuclear power compared to x-rays and ―electric power‖, in which
nuclear power had higher average risk ratings than the others. [51]

69
A comparison like this could be made for transportation of different hazardous material classes,
such as Class 3 and Class 7, or a comparison could be made between transportation of hazardous material
and some other risky activity. The factors with the highest mean rating would have the greatest effect on
risk perception of hazmat transportation. This comparison may provide some quantitative insight as to
effects that the risk perception factors have on PRA quantities, such as success probability and major
failure cost, to potentially back up the claims made in this thesis regarding the factor effects on PRA
parameters.
A third possibility for future work is to perform a more quantitative analysis of the transportation
regulations to determine if there is possible underregulation or overregulation of hazmat containers, since
failure probabilities are so different for each. Class 7 transportation has an excellent record with few
to zero release incidents [48], whereas Class 3 transportation has had several release incidents, but a much
longer and larger-volume record of shipments. Whether or not this difference can be explained
by regulation stringency differences or just small Class 7 shipment volume should be investigated.
A possibility for future work would be to implement changes based on the analysis made within
the risk perception factors chapter and the sensitivity analysis section regarding cooperation and voluntary
risk taking. The changes would serve to decrease the perceived risk of hazardous material management
and create a more efficient hazardous material management process. Based on lessons learned from the
Yucca Mountain repository project, cooperation is important to implement from the start of long-term
operations, which is upcoming once again when a repository is established and large quantities of Class
7 hazardous material are shipped nationwide. To best avoid public risk perception issues, a cooperative
approach should be taken, and taking steps toward public education about the relevant hazardous
materials is another advantageous endeavor that may assist in completing the task.

70
6. References
[1] FRA (Federal Railroad Administration). 2016. Federal Railroad Administration Office of Safety
Analysis. March 8, 2016. Federal Railroad Administration, Washington D.C. Accessed March 8,
2016 from http://safetydata.fra.dot.gov/OfficeofSafety/default.aspx
[2] IAEA (International Atomic Energy Agency). 2016. United States of America. Power Reactor
Information System. April 11, 2016. International Atomic Energy Agency, Vienna, Austria.
https://www.iaea.org/PRIS/CountryStatistics/CountryDetails.aspx?current=US
[3] T. Mui and W.M. Nutt. (2014). Preliminary Design Concepts for a Deep Borehole Disposal Re-
Packaging Facility. Waste Management Symposium 2014, Phoenix, AZ.
[4] FRA (Federal Railroad Administration). 2010. ―National Rail Plan Progress Report.‖ September 20,
2010. Federal Railroad Administration, Washington D.C.
[5] FRA (Federal Railroad Administration). Freight Rail Today. Federal Railroad Administration,
Washington D.C. Accessed March 8, 2016 from https://www.fra.dot.gov/Page/P0362
[6] North Dakota Petroleum Council. 2012. Bakken Crude Properties. Bismarck, ND. Accessed March
8, 2016 from https://www.ndoil.org/resources/bkn/
[7] N. Železnik. 2011. ―Understanding Risk Perception.‖ International training on Interaction between
technical and social aspects for waste disposal programmes. Istanbul, Turkey. July 2011.
Accessed March 8, 2016 from https://www.iaea.org/OurWork/ST/NE/NEFW/WTS-
Networks/DISPONET/Intl_TC_Turkey2012.html
[8] 49 CFR Title 173.2. 1995. Shippers—General Requirements for Shipments and Packagings. Subpart
A—General. Hazardous materials classes and index to hazard class definitions. Code of Federal
Regulations, Pipeline and Hazardous Material Safety Administration, U.S. Department of
Transportation.
[9] Federal Register. 2015. Hazardous Materials: Enhanced Tank Car Standards and Operational
Controls for High-Hazard Flammable Trains. 80 FR 26643-26750. May 8, 2015.
[10] L. Powers. 2013. ―Safety rules lag as oil transport by train rises.‖ CBC News. July 9, 2013.
Accessed March 8, 2016 from http://www.cbc.ca/news/canada/safety-rules-lag-as-oil-transport-
by-train-rises-1.1312528
[11] AAR (Association of American Railroads). 2014. Crude Oil Rail Traffic. Accessed March 8, 2016
from https://www.aar.org/Pages/Crude-Oil-Rail-Traffic.aspx
[12] M. Beaudin. 2014. ―Lac-Mégantic disaster: Where things stand today.‖ Montreal Gazette. January
21, 2014.
[13] X. Liu, M. Rapik Saat and C.P.Barkan. ―Probability analysis of multiple-tank-car release incidents
in railway hazardous materials transportation.‖ Journal of Hazardous Materials, col. 276, pp.
442-451, 2014.
[14] Idaho Department of Health and Welfare. ―Perceived Versus Actual Risk.‖ Accessed March 8, 2016
from
http://healthandwelfare.idaho.gov/Portals/0/Health/MoreInformation/PerceivedVersusActualRisk.

71
[15] P. Sandman. 2014. ―Dr. Peter M. Sandman Biography‖. The Peter Sandman Risk Communication
Website. June 18, 2014. Accessed March 8, 2016 from http://www.psandman.com/bio.htm
[16] V. Covello and P. M. Sandman. ―Risk communication: Evolution and Revolution‖. Anthony
Wolbarst (ed.), Solutions to an Environment in Peril. Baltimore: John Hopkins University Press,
2001 pp. 164–178
[17] LBL (Lawrence Berkeley National Lab). 2011. Average Annual Radiation Exposure. May 4, 2011.
Accessed March 8, 2016 from
http://www2.lbl.gov/abc/wallchart/chapters/appendix/appendixd.html
[18] 10 CFR 71. 2012. Packaging and Transportation of Radioactive Material. Code of Federal
Regulations, U.S. Nuclear Regulatory Commission.
[19] FRA (Federal Railroad Administration). 2005. ―Use of Dedicated Trains for Transportation of High-
Level Radioactive Waste and Spent Nuclear Fuel, Report to the Congress.‖ Federal Railroad
Administration, Washington, D.C. March.
[20] A. Locsin. ―Is Air Travel Safer Than Car Travel?‖. USA Today. 2008. Accessed March 8, 2016 from
http://traveltips.usatoday.com/air-travel-safer-car-travel-1581.html
[21] Greenpeace. Transport. June 27, 2006. Greenpeace International. Accessed March 8, 2016 from
http://www.greenpeace.org/international/en/campaigns/nuclear/waste/transport/
[22] ―Nevada postmortem: DOE failed to win trust on Yucca Mountain project‖. Las Vegas Review-
Journal. July 10, 2010.
[23] State of Nevada Agency for Nuclear Projects. Why Does the State Oppose Yucca Mountain?. State
of Nevada. February 4, 1998. Accessed March 8, 2016 from
http://www.state.nv.us/nucwaste/yucca/state01.htm
[24] X. Liu, C.P. Barkan and M. Rapik Saat, ―Analysis of Derailments by Accident Cause‖ Evaluating
Railroad Track Upgrades to Reduce Transportation Risk,‖ Transportation Research Record:
Journal of the Transportation Research Board, no. 2261, pp. 178-185, 2011.
[25] P. K. Raj, ―A Risk Assessment Study of the Transportation of Hazardous Materials over the U.S.
Department of Transportation, Washington, DC, 2014
[26] AAR (Association of American Railroads). 2013. AAR Circular OT-55-N, Recommended Railroad
Operating Practices for Transportation of Hazardous Materials, August 5, 2013.
[27] 49 CFR 174. 1995. Carriage By Rail. Subpart G, Detailed Requirements for Class 3 (Flammable
Liquid) Materials. Code of Federal Regulations, Pipeline and Hazardous Material Safety
Administration, U.S. Department of Transportation.
[28] DOE (U.S. Department of Energy). 2005. Department of Energy Policy Statement for Use of
Dedicated Trains for Waste Shipments to Yucca Mountain. U.S. Department of Energy,
Washington, D.C.
[29] 49 CFR 174. 2014. Special handling requirements for Class 7 (radioactive) materials. Code of
Federal Regulations, Pipeline and Hazardous Material Safety Administration, U.S. Department of
Transportation.
[30] DOE (U.S. Department of Energy). 2009. National Transportation Plan, Revision 0. DOE/RW-0603.
U.S. Department of Energy, Office of Civilian Radioactive Waste Management, Washington, D.C.

72
[31] CRS (Congressional Research Service). 2014. ―U.S. Rail Transportation of Crude Oil: Background
and Issues for Congress.‖ Congressional Research Service. December 4, 2014. Washington D.C.
[32] GBRX. 2013. ―29,000 Gallon Tank Car.‖ The Greenbrier Companies. November 2013. Accessed
July 9, 2015 from http://www.gbrx.com/files/files/NAR/Tank_Cars/Tank29000.pdf
[33] NTSB (National Transportation Safety Board). 2012. Derailment of CN Freight Train U70691-18
With Subsequent Hazardous Materials Release and Fire, Cherry Valley, Illinois, June 19, 2009,
Accident Report. NTSB/RAR-12/01 PB2012-916301. February 14, 2012. National Transportation
Safety Board, Washington D.C.
[34] AAR (Association of American Railroads). 2008. Performance Standard for Trains Used to Haul
High Level Radioactive Material AAR Standard S-2043. Manual of Standards and Recommended
Practices, Section C, Car Construction Fundamentals and Details. Association of American
Railroads, Washington, D.C.
[35] 10 CFR 71. 2012. Packaging and Transportation of Radioactive Material. Code of Federal
Regulations, U.S. Nuclear Regulatory Commission.
[36] D. Y. Jeong. Volpe Center Support in FRA Hazardous Materials Tank Car Safety Research Program
[PDF Document]. Retrieved From:
http://www.ntsb.gov/news/events/Documents/Panel%201_F_David%20Jeong.pdf
[37] NAC. 2005. Safety Analysis Report for the UMS Universal Transport Cask, Volume 1 of 2. Docket
No. 71-9270. November 2005. NAC International, Norcross, Georgia. Accessed July 9, 2015
from http://curie.ornl.gov/system/files/documents/233/NAC-UMS%20SAR,%20Rev.%202.pdf
[38] DOT (U.S. Department of Transportation). 2014. Full-Scale Shell Impact Test of a DOT-111 Tank
Car. DOT RR 14-29. U.S. Department of Transportation, Federal Railroad Administration,
Washington D.C.
[39] 49 CFR 179. 2012. Specifications For Tank Cars. Appendix B to Part 179—Procedures for
Simulated Pool and Torch-Fire Testing. Code of Federal Regulations, Pipeline and Hazardous
Material Safety Administration, U.S. Department of Transportation.
[40] M. R. Carter, M.P. Howard, N. Owens, D. Register, J. Kennedy, K. Pecheux, A. Newton. Effects of
Catastrophic Events on Transportation System Management and Operations. July 2002.
Accessed March 8, 2016 from http://ntl.bts.gov/lib/jpodocs/repts_te/13754.html
[41] AAR (Association of American Railroads). 2013. Hazardous Materials: Rail Petitions and
Recommendations to Improve the Safety of Railroad Tank Car Transportation (RRR). Docket No.
PHMSA—2012—0082. Association of American Railroads, and American Short Line and
Regional Railroad Association.
[42] SEAB (Secretary of Energy Advisory Board). 1993. ―Earning Trust and Confidence: Requisites for
Managing Radioactive Wastes‖. U.S. Department of Energy. November 1993. Washington D.C.
[43] K. Ahlbom. ―Swedish Nuclear Fuel and Waste Management Company‖. Paris, France. Accessed
March 12, 2016 from http://www-ns.iaea.org/downloads/rw/conventions/fourth-review-cycle/tm-
paris/Session%201/sweden-skb-ahlbom.pdf
[44] SKB. ―Contacts and Visits‖. Accessed March 12, 2016 from http://www.skb.com/visitor/contact-
and-visits/
[45] Eureka County, Nevada - Nuclear Waste Office. ―Timeline: 1954 – 2014: Nuclear Waste Policy
Dilemma‖. Accessed March 12, 2016 from http://www.yuccamountain.org/time.htm (current as
of Feb 21 2016)
73
[46] Blue Ribbon Commission on America’s Nuclear Future, Report to the Secretary of Energy, January
2012. http://energy.gov/ne/downloads/blue-ribbon-commission-americas-nuclear-future-
reportsecretary-energy/
[47] K. Mummah and C. Kuprianczyk. ―Public Image in Spent Fuel Disposal: Lessons Learned from
Sweden’s SKB‖. March 2016. Unpublished.
[48] K.A. Rogers and M. G. Kingsley. ―Permanent Disposal‖ in Calculated Risks Highly Radioactive
Waste and Homeland Security. Burlington, VT. Ashgate Publishing Co. 2007.
[49] NWPA (Nuclear Waste Policy Act, as Amended in 1987). U.S. Department of Energy. 1987.
[50] ―Overview of Hazardous Materials Transportation‖ in Cooperative Research for Hazardous
Materials Transportation. Transportation Research Board of the National Academies. 2005.
Accessed from http://www.nap.edu/read/11198/chapter/4
[51] B. Fischhoff, P. Slovic, S. Lichtenstein, S. Read, and B. Combs. ―How Safe is Safe Enough? A
Psychometric Study of Attitudes Towards Technological Risks and Benefits‖. Policy Sciences 9.
1978. pp. 127-152. Elsevier Scientific Publishing Company, Amsterdam.
[52] C. Kuprianczyk. ―A Comparison of Rail Transportation Regulations of Class 3 (Flammable Liquid)
and Class 7 (Radioactive) Material‖. Poster. July 2015. Oak Ridge National Lab.
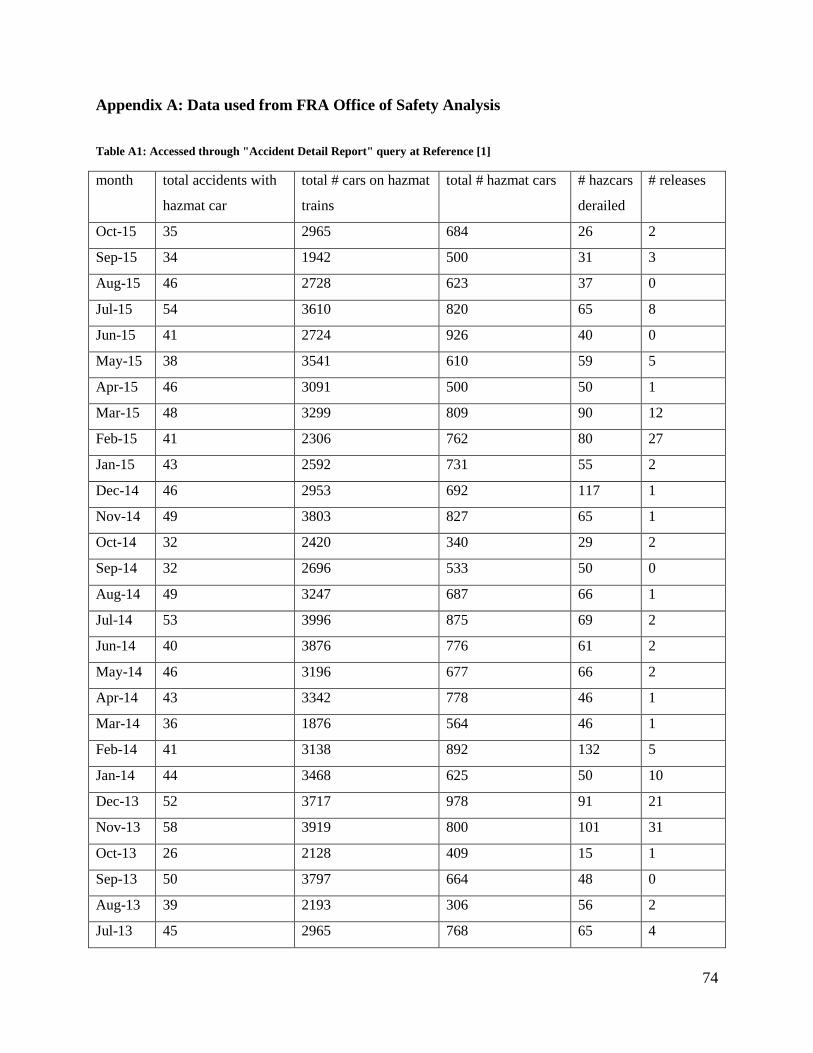
74
Appendix A: Data used from FRA Office of Safety Analysis
Table A1: Accessed through "Accident Detail Report" query at Reference [1]
month total accidents with
hazmat car
total # cars on hazmat
trains
total # hazmat cars # hazcars
derailed
# releases
Oct-15 35 2965 684 26 2
Sep-15 34 1942 500 31 3
Aug-15 46 2728 623 37 0
Jul-15 54 3610 820 65 8
Jun-15 41 2724 926 40 0
May-15 38 3541 610 59 5
Apr-15 46 3091 500 50 1
Mar-15 48 3299 809 90 12
Feb-15 41 2306 762 80 27
Jan-15 43 2592 731 55 2
Dec-14 46 2953 692 117 1
Nov-14 49 3803 827 65 1
Oct-14 32 2420 340 29 2
Sep-14 32 2696 533 50 0
Aug-14 49 3247 687 66 1
Jul-14 53 3996 875 69 2
Jun-14 40 3876 776 61 2
May-14 46 3196 677 66 2
Apr-14 43 3342 778 46 1
Mar-14 36 1876 564 46 1
Feb-14 41 3138 892 132 5
Jan-14 44 3468 625 50 10
Dec-13 52 3717 978 91 21
Nov-13 58 3919 800 101 31
Oct-13 26 2128 409 15 1
Sep-13 50 3797 664 48 0
Aug-13 39 2193 306 56 2
Jul-13 45 2965 768 65 4

75
Jun-13 48 2759 642 96 0
May-13 45 2979 714 71 6
Apr-13 57 4017 864 55 0
Mar-13 59 4230 913 100 13
Feb-13 34 2539 391 72 1
Jan-13 44 2376 705 94 0
Dec-12 46 2945 689 33 2
Nov-12 48 3570 487 58 5
Oct-12 38 2243 487 55 3
Sep-12 43 3191 959 70 7
Aug-12 42 2729 553 57 14
Jul-12 58 4299 808 109 7
Jun-12 51 3464 719 49 3
May-12 52 3536 665 53 0
Apr-12 42 2647 575 38 0
Mar-12 43 3595 553 52 3
Feb-12 48 3340 423 67 1
Jan-12 43 2543 575 38 6
Table A2: Accessed through "Accident Detail Report" query at Reference [1]
month total accidents with
hazmat release
Equipment
Damage
(M$)
Track
Damage
(M$)
total accidents
with hazmat cars
Equipment
Damage
(M$)
Track
Damage
(M$)
Oct-15 2 1700 690 33 3197 1841
Sep-15 1 700 1108 33 4877 3238
Aug-15 0 0 46 2045 1762
Jul-15 4 2090 1072 50 4185 4749
Jun-15 0 0 41 2061 2354
May-15 1 477 2994 37 10479 13018
Apr-15 1 43 2 45 2737 4025
Mar-15 3 3218 7901 45 7176 10789
Feb-15 2 3826 211 39 5794 2807

76
Jan-15 1 3006 42 42 5020 794
Dec-14 1 36 2 45 4121 1595
Nov-14 1 26 12 48 5699 2544
Oct-14 1 3241 87 32 6772 1369
Sep-14 0 0 32 4175 2751
Aug-14 1 5321 863 49 10857 4285
Jul-14 2 2808 1533 53 8958 4045
Jun-14 2 1939 1157 40 8373 4961
May-14 2 367 128 46 3202 2919
Apr-14 1 1098 177 43 5405 1639
Mar-14 1 85 3 36 1368 1344
Feb-14 2 1827 1070 41 3656 2036
Jan-14 2 2587 578 44 5668 2858
Dec-13 2 7074 1214 52 17090 4098
Nov-13 3 2275 652 58 6013 2632
Oct-13 1 1164 37 26 6595 3534
Sep-13 0 0 0 50 12407 4846
Aug-13 1 1647 1208 39 5865 3536
Jul-13 2 753 525 45 8626 3191
Jun-13 0 0 0 48 5373 2119
May-13 4 2827 1342 45 5865 2726
Apr-13 0 0 0 57 2648 1388
Mar-13 5 3317 671 59 8164 2966
Feb-13 1 40 0 34 4162 1471
Jan-13 0 0 0 44 4618 2278
Dec-12 2 286 120 46 2036 1596
Nov-12 3 1845 236 48 4592 1922

77
Table A3: Accessed through “Freight/Passenger Operations Ten Year Overview” query at Reference [1]
CY
2006
CY
2007
CY
2008
CY
2009
CY
2010
CY
2011
CY
2012
CY
2013
CY
2014
CY
2015
FREIGHT TRAIN
ACCIDENTS
2,78
8
2,49
4
2,28
8
1,71
5
1,71
6
1,85
9
1,64
4
1,71
4
1,68
8
1,55
4
RATE of Train
Accidents per mil Freight
train miles
4.46
8
4.25
9
4.04
8
3.60
6
3.37
8
3.55
5
3.08 3.16
2
3.03
3
3.15
3
Table A4: Accessed through “Freight/Passenger Operations Ten Year Overview” query at Reference [1]
CY
2006
CY
2007
CY
2008
CY
2009
CY
2010
CY
2011
CY
2012
CY
2013
CY
2014
CY
2015
--- Human factor caused 1,004 982 840 592 605 699 624 664 662 624
--- Track caused 1,003 887 805 611 613 639 551 539 494 425
--- Motive power/equipment
caused
309 280 278 232 207 212 194 207 209 210
--- Signal caused, all track
types
48 44 51 51 67 32 48 54 46 47
--- Miscellaneous caused 424 301 314 229 224 277 227 250 277 248