© 2016 human kinetics, inc. as accepted for publication in...
TRANSCRIPT

1
1. Title page1
2
3
4
Title: Effects of dehydration on cricket specific skill performance in hot and humid conditions
Type of submission: Original Investigation
© 2016 Human Kinetics, Inc. As accepted for publication in International Journal of Sport Nutrition and Exercise Metabolism. http://journals.humankinetics.com/ijsnem
Full Names of the Authors and Institutional Affiliations:
5
6
7
8
9
10
11
12
13
Janaka P. Gamage1*
Angela P. De Silva2
Arjan K. Nalliah3
Stuart D.R. Galloway4
1School of Sport, University of Stirling, Scotland
2Department of Physiology, Faculty of Medicine, University of Colombo, Sri Lanka
3Department of Coaching, Max Cricket Academy, Sri Lanka Cricket, Sri Lanka
4School of Sport, University of Stirling, Scotland
14
15
Contact Details for the Corresponding Author: 16
* Corresponding author17
- Postal Address: 4E, 189 Residencies, Baseline Road, Colombo 09, Sri Lanka18
- Telephone: +94 766380964 or +61 41582744319
- Email: [email protected]
21
Preferred Running Head: Dehydration and cricket skill performance 22
Abstract Word Count: 298 words 23
Text-Only Word Count: 4020 words 24
Number of Figures and Tables: 4 Figure and 4 Tables 25
2
2. Abstract and Keywords 26
Abstract: 27
The aim of the present study was to assess the effects of dehydration on cricket specific motor skill 28
performance among fast-bowlers, fielders, and batsmen playing in a hot and humid environment. 10 29
fast-bowlers, 12 fielders and 8 batsmen participated in two field trials conducted 7 days apart: a fluid 30
provision trial (FP) and a fluid restriction trial (FR). Each trial consisted of a 2-hour standardized 31
training session and pre-training and post-training skill performance assessments. Bowling speed and 32
accuracy (line and length), throwing speed and accuracy (overarm, sidearm and underarm) and timed 33
running between wickets (1, 2, and 3 runs) was assessed pre to post-training in each trial. Mass loss 34
was 0.6±0.3kg (0.9±0.5%) in FP, and 2.6±0.5kg (3.7±0.8%) in FR trials. Maintaining mass within 35
1% of initial values did not cause any significant skill performance decline. However, the 36
dehydration on the FR trial induced a significant time and trial effect for bowling speed by 1.0±0.8% 37
reduction (0.3±0.8% reduction in FP trial; p<0.01) and 19.8±17.3% reduction in bowling accuracy 38
for line (3.6±14.2% reduction in FP trial; p<0.01), but no effect on bowling length. A significant 39
decline was noted in the FR trial for throwing speed for overarm (6.6±4.1%; p<0.01; 1.6±3.4% 40
reduction in FP trial) and sidearm (4.1±2.3%; p<0.01; 0.6±4.7% increase in FP trial) techniques, and 41
for throwing accuracy for overarm (14.2±16.3%; p<0.01; 0.8±24.2% increase in FP trial) and 42
sidearm (22.3±13.3%; p<0.05; 3.2±34.9% reduction in FP trial) techniques. Batsmen demonstrated 43
significant performance drop in making three runs (0.8±1.2% increase in time in FP trial and 44
2.2±1.7% increase in time in FR trial; p<0.01). Moderate-severe dehydration of 3.7% body mass loss 45
significantly impairs motor skill performance among cricketers, particularly bowlers and fielders, 46
playing in hot and humid conditions. Fluid ingestion strategies maintaining mass loss within 1% 47
prevented a decline in skill performance. 48
49
Key words: Dehydration, performance, cricket skill 50
3
3. Text 51
Introduction 52
Cricket is a team sport characterized by intermittent short duration high intensity activities 53
interspersed with longer low intensity periods. The physical demands on players are determined by 54
the specific tasks they perform (batting, bowling, fielding and wicket keeping), and intensity and 55
duration of the match being played (Christie, 2012). During the day of a cricket test match, athletes 56
spend about 6 hours on the field typically split into morning, afternoon and evening periods of play, 57
each lasting about 2 hours. Players have opportunities to replace fluid losses during these breaks and 58
at the boundary line according to their convenience. However, it can be practically challenging for 59
most athletes to replace large fluid losses during a period of play in hot and humid conditions. A 60
study conducted among fast bowlers has shown that they lost 4.3% of body mass after two sessions 61
of cricket (4 hours) when playing in a hot environment (Gore et al., 1993). Four test cricket playing 62
nations in the Indian subcontinent (India, Sri Lanka, Pakistan and Bangladesh) experience 63
challenging environmental conditions due to high temperature and humidity. 64
65
The hydration status of an athlete can be a vital determining factor in exercise performance. Body 66
mass losses of more than 2% by dehydration can impair an athlete’s performance significantly, with 67
decrements being proportional to the degree of fluid loss (Murray, 2007). However, recent studies 68
have revealed performance impairment with body mass losses of as little as 1% (Bardis et al., 2013, 69
Wilk et al., 2014). Exercising in environments at greater than 25°C temperature and 60% relative 70
humidity poses a significant thermal stress for athletes, which results in increased thermoregulatory 71
sweating and considerable fluid loss (Burke, 2010). Consequently, exercise in hot environments 72
decreases both prolonged (Galloway et al., 1997, Parkin et al., 1999) and intermittent exercise 73
capacity (Drust et al., 2005, Morris et al., 2005) among athletes. The degree of physiological strain 74
on cardiovascular and thermoregulatory mechanisms is greater with a higher degree of 75
4
hypohydration (Montain et al., 1992a, Maxwell et al., 2009, Montain et al., 1992b). In response to 76
these physiological effects, studies have shown thermoregulatory benefits of adequate fluid provision 77
during prolonged exercise in warm environments (Montain et al., 1992b). 78
79
Impairment in sports specific skill performance has been noted in team sports where there is more 80
than 2% body mass loss from dehydration (Devlin et al., 2001, McGregor et al., 1999, Edwards et 81
al., 2007, Baker et al., 2007, Dougherty et al., 2006, MacLeod et al., 2012) but these studies have not 82
been conducted under significant heat stress. Data related to effects of dehydration on motor skill 83
performance among cricketers are limited to a single study in fast bowlers which observed a 84
significant decrement in one aspect of motor skill performance, the bowling accuracy (Devlin et al., 85
2001). To date, there are no data available on other cricket specific skill performances in fielders or 86
batsmen. Most studies which have shown effects on both aerobic (Montain et al., 1992b, Montain et 87
al., 1998, Sawka et al., 1985, Hillman et al., 2011, Ebert et al., 2007), anaerobic (Jones et al., 2008, 88
Hayes et al., 2010), or skill performance (McGregor et al., 1999, Baker et al., 2007, Dougherty et al., 89
2006) due to dehydration have been conducted in indoor laboratory environments. Hot and humid 90
outdoor conditions typically induce a greater thermoregulatory stress due to the addition of heat gain 91
from solar radiation, particularly when there is little wind. The present study aimed to assess the 92
effects of dehydration on cricket specific motor skill performance among fast-bowlers, fielders and 93
batsmen playing in a hot and humid outdoor field environment. Field studies similar to the present 94
study are important to determine the performance effects of dehydration in real ambient conditions, 95
in comparison to what has been observed from controlled laboratory studies. From this study, we 96
aimed to characterize the potential performance decrements induced by fluid restriction, and provide 97
recommendations on hydration strategies for cricketers playing in hot and humid environments. We 98
hypothesized that fluid restriction, and a greater level of dehydration, would impact upon skill 99
performance measures in bowlers, fielders and batsmen. 100
5
101
Methods 102
Subjects 103
Thirty elite cricketers including 8 batsmen, 10 fast-bowlers and 12 fielders (mean age = 22.2±2.1 104
years) from the Sri Lankan training squad were recruited into the study after obtaining informed 105
written consent. The Ethical Review Committee of the Faculty of Medicine, University of Colombo 106
reviewed the study proposal and approval granted. All athletes received a voucher as an incentive for 107
their participation in the study. 108
109
Study design 110
The study was conducted using a cross-over design with two outdoor field trials: a Fluid Provision 111
trial (FP) and a Fluid Restriction trial (FR). Trials were conducted 7 days apart with diet and activity 112
control for 48 hours preceding each trial and fasted from 10pm on the day before the trial. On the 113
trial day morning, we provided the breakfast with a standardized volume of fluid to ensure that 114
athletes were approximately euhydrated prior to each trial. Breakfast included a meat sandwich 115
(~215g), a piece of butter cake (~30g), a medium size banana (~120g) and a packet of milk (200ml), 116
which comply with the recommended pre event meal for these athletes (Total energy of 828 117
kilocalories with 62% of carbohydrate, 26% of fat and 12% protein). Body mass, urine specific 118
gravity and urine colour measurements were taken before each trial to evaluate hydration status at 119
pre-trial on both trial days. Each trial was conducted over 4-hours and included a 2-hour training 120
session with pre-training (Pre-test) and post-training (Post-test) skill performance assessments lasting 121
one hour each (Figure 1). The 2-hour training session consisted of cricket specific drills (short 122
distance running and sprints, cricket specific exercises and field drills) conducted in their routine 123
training, which was developed and supervised by the strength and conditioning coach of the team. 124
Training sessions were controlled to maintain the same duration and intensity of activity on both trial 125

6
days in order to avoid a confounding effect upon post-test performance. The objective was to ingest 126
fluids at a steady rate and at regular intervals during the 2-hour training session to maintain lower 127
body mass loss in the FP trial with higher fluid intake (12-15ml/kg/hour), and to achieve higher body 128
mass loss in the FR trial by restricting fluid intake (4ml/kg/hour). Pre-test and Post-test performance 129
assessments included bowling, fielding and batting performance tests. These performance assessment 130
sessions for both trial days were conducted over the same duration and intensity to maintain 131
consistency. 132
133
Measurements and calculations 134
Mass, mass loss and stature 135
Pre-trial body mass (W1) and post-trial body mass (W2) was measured using a calibrated digital 136
weighing scale (Seca Clara 803) to the nearest 0.1kg. Mass measurements were obtained with 137
minimal clothing worn (underwear only) after emptying the bladder and wiping off sweat. Height 138
was measured to the nearest 0.1 cm using a stadiometer (Seca 217). 139
140
Sweat loss and sweat rate 141
Each athlete was provided with a separate drink bottle for fluid ingestion and a separate container for 142
urine collection. Total volume of fluid ingested (FV) and total volume of urine produced (UV) 143
during the 4-hour trial period was measured. Total sweat loss over the 4-hour period and sweat rate 144
were then calculated using the formula, sweat rate (ml/h) = ((W1-W2) + (FV-UV)) / 4 145
146
Sweat electrolytes 147
A sample of sweat was collected on each trial day using a sweat patch (Tegaderm Pad®) applied on 148
the lumbar para-vertebral region. The skin over that area was first cleaned with 70% alcohol solution 149
and then with deionized water using a sterile technique. Sweat patches were removed after one-hour 150
7
(end of Pre-test) and analyzed on the same day in an accredited medical laboratory for sweat Sodium 151
(Na+) and Chloride (Cl-) content (Chemistry Analyzer, Beckman coulter AU680 with ISE unit, 152
Japan). 153
154
Urinary indices 155
Pre-trial and Post-trial urine samples were obtained to measure urine colour (UC) and urine specific 156
gravity (USG), as measures of hydration status of the athletes. UC was measured using a urine color 157
chart (scale 1-8) and USG using a refractometer (model FG-301, China). 158
159
Performance tests 160
All participants were familiar with the skill performance tests assessments being used in the study as 161
they routinely undertook these tasks during training. Furthermore, a warm-up was given before each 162
skill performance assessment to ensure participants were ready for the assessments. 163
164
Bowling performance test 165
Each fast bowler performed 18 deliveries at match intensity. Their aim was to produce a good length 166
delivery hitting the top of the off-stump with maximum delivery speed. Ball release speed was 167
measured using a Stalker Pro II speed radar gun (± 0.2 km/h, Stalker Pro II, Tualatin, Oregon, USA) 168
located behind the batting stump aiming at the ball release point. Bowling accuracy was determined 169
by 2 parameters: bowling line and length. Bowling line was determined by a measuring grid 170
consisting of rectangular zones, which was positioned behind the batting stump (Portus et al., 2010). 171
According to the scoring system, 100 points were awarded for direct hit on the top of the off stump 172
and lower scores (90, 75, 50, 25 or 0) when the ball hit the grid further away from the target. Video 173
images were recorded using a HD 60fps camera (Sony FS100) kept 10m behind the bowling stump. 174
These video images were analyzed using computer software and ball contact point with the grid was 175

8
captured to determine the scores. Accuracy scores for bowling length were determined based on the 176
ball landing position on the pitch. Video images were recorded using a HD 60fps camera (Sony 177
FS100) positioned at the side of the pitch. The videos were analyzed and images of ball contact point 178
with the pitch were captured. 3 points were given for good length deliveries, 2 points for short and 179
full length deliveries and 1 point for balls pitching outside these pointers. The testers recording these 180
parameters were blind to the trial conditions of each participant. 181
182
Throwing performance test 183
Fielders performed 24 throws in total using three different throwing techniques which included 8 184
overarm, 8 sidearm and 8 underarm throws. Overarm and sidearm throws were performed from a 185
distance of 20m from a target stump and underarm throws were performed from a 10m distance. 186
They were instructed to make the throws with maximum speed and hit the target stump. Throws 187
were carried out from a fixed marker on the ground while maintaining a relatively stationary 188
position. Throwing speed was measured using a speed radar gun (Stalker Pro II, Tualatin, Oregon, 189
USA) positioned behind the target stump aiming at the ball release point. The accuracy of throws 190
was measured using a specifically designed grid located behind and centered to the single target 191
stump (Freeston et al., 2007). The grid consisted of four marked zones surrounding the target stump 192
with each zone measuring 14cm in width. Ball contact point with the measuring grid was recorded 193
using a HD 60fps video camera (Sony FS100) placed behind the throwing arm. Video images were 194
analyzed, and accuracy score determined based on the ball position in relation to the target stump. 195
Accuracy scores ranged from 0-5, taking 5 points for the throws that directly hit the stump and lower 196
scores (4, 3, 2, 1, 0) when the ball hit the grid further away from the target. The testers recording 197
these parameters were blind to the trial conditions of each participant. 198
199
Running performance test 200

9
The batter performance test assessed the time taken to run between wickets. Participants prepared as 201
for routine batting, wearing pads, helmet and other protective gear. The performance test consisted of 202
4 sets of single runs, two runs and three runs with 5-minutes break between each set. Athletes were 203
advised to run as fast as possible between wickets. Two examiners at the batting crease 204
independently measured the time taken to complete runs using a digital timer. Measurements taken 205
to the nearest 0.01 seconds and mean value of the two measures was taken. The testers recording 206
these parameters were blind to the trial conditions of each participant. 207
208
Statistical analysis 209
All data are presented as mean ± standard deviation (SD). Two-factor repeated measures analysis of 210
variance (ANOVA, SPSS 19.0) was used to compare means between the Pre-test (control) and Post-211
test performance variables in FP and FR. Within-subject factors were also analyzed to demonstrate 212
trial effect (FP vs FR), time effect (pre-trial vs post-trial) and trial-time interaction effects. Follow up 213
analysis was performed using paired sample T-tests only when a significant main effect was 214
observed. Other outcomes assessed (ambient conditions, urine and sweat analyses) were all assessed 215
using a one way ANOVA. Correlation analyses between percent body mass loss and percent change 216
in the skill performance test scores were conducted using Pearson correlation coefficient analysis. In 217
all cases the level of statistical significance was taken at p<0.05. 218
219
Results 220
Mean ambient temperature (30.8±2.1°C and 30.1±2.1°C) and humidity (76±9% and 77±8%) was not 221
different for FP and FR trials, respectively. Ambient temperature range throughout the 4-hour period 222
on each trial day was 27.7-32.8 °C and 27.2-32.2 °C on FP and FR, with relative humidity of 66-89 223
% and 68-87 % on FP and FR, respectively. Wind speed was not recorded but the Colombo 224
meteorology department data indicated a mean wind speed of ~2 mph during the study days. 225

10
226
Data on mean mass loss, volume of fluid ingested, volume of urine passed and calculated sweat loss 227
over the 4-hour period for each athlete group on FP and FR trials are presented in Table 1. Overall, 228
there was a significant difference in body mass loss with athletes losing 0.9±0.5 % body mass during 229
the FP trial vs. 3.7±0.8 % body mass during the FR trial (p<0.01). The average sweat rate was 230
1208±171 ml/hour in the FP trial and 861±148 ml/hour in the FR trial, and were significantly 231
different (p<0.01). Batsmen had significantly higher sweat loss, sweat rate (p<0.05) and fluid intake 232
(p<0.01) compared with fielders in FP trial only. No other significant differences were noted 233
between playing positons on the FP or FR trials. Urine output was significantly lower in the FR trial 234
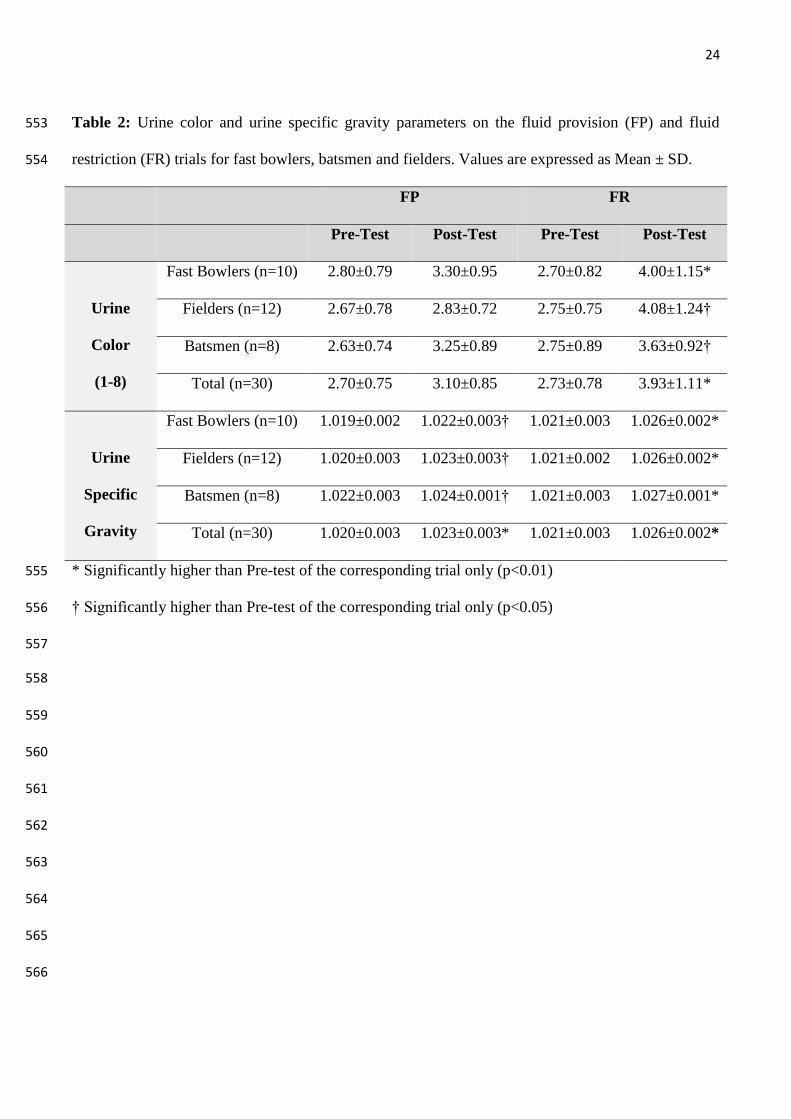
compared to FP trial (p<0.01). In the urinary markers of hydration status (table 2), urine color 235
increased significantly from pre-trial to post-trial in the FR trial only (p<0.01). Similarly, urine 236
specific gravity significantly increased in the post-trial sample on the FR trial only (p<0.01; Table 2). 237
238
Performance tests 239
Results of the performance tests for fast bowlers, fielders and batsmen are presented in Table 3. In 240
the FP trial there were no significant differences in the performance measures for fast bowlers, 241
fielders or batsmen when comparisons were made between pre-test and post-test. 242
243
Fast bowling performance revealed a significant trial and time effects in bowling speed and bowling 244
line measurements (both p<0.05). There were no significant trial-time interaction effects but bowling 245
speed (p=0.056) and bowling line (p=0.093) approached significance. Post-hoc analysis revealed that 246
fast bowling speed declined in the FR trial (124.5±5.5 km/hour in Pre-test vs. 123.2±5.2 km/hour in 247
Post-test; p<0.01) only. Bowling accuracy scores revealed a significant deviation in bowling line 248
score by 19.8±17.3% (34.4±4.2 in Pre-tests vs. 27.5±6.4 in Post-test; p<0.01) on the FR trial only. 249
We did not observe any significant trial, time or trial-time interaction effects for bowling length data. 250
11
251
Throwing speed data showed significant trial, time and trial-time interaction effects for overarm and 252
sidearm throwing techniques (p<0.05). In the FR trial only, there was a significant reduction in the 253
throwing speed for the overarm technique by 6.6±4.1% (96.4±5.4 km/hour in Pre-tests vs. 90.0±6.4 254
km/hour in Post-test; p<0.01) and for the sidearm technique by 4.1±2.3% (88.9±6.7 km/hour in Pre-255
tests vs. 85.3±6.2 km/hour Post-test; p<0.01). Throwing accuracy data for the overarm technique 256
showed a significant trial effect and trial-time interaction effect, but no time effect. Sidearm throwing 257
technique accuracy data also showed significant trial-time interaction effect and time effect, but no 258
significant trial effect. Throwing accuracy scores for overarm and sidearm throws revealed a 259
significant performance drop by 14.2±16.3% (2.8±0.5 in Pre-tests vs. 2.3±0.3 Post-test; p<0.01), and 260
22.3±13.3% (2.1±0.3 in Pre-tests vs. 1.6±0.2 Post-test; p<0.05, respectively, in the FR trial only. 261
There was no significant trial, time or interaction effects in the underarm throwing speed or accuracy 262
data. 263
264
In the running test for batsmen, we observed a significant trial, time and trial-time interaction effects 265
for the three run times (p<0.05) but not for the single or two run times. Follow-up analysis revealed 266
a-significant performance drop in making three runs on the FR trial only, due to athletes being 267
significantly slower in the Post-test (10.52±0.21 sec) compared to the Pre-test (10.29±0.19 sec; 268
p<0.01). 269
270
Percentage differences in positional performance outcome scores in FP and FR trials are presented in 271
Table 3. We observed a greater number of athletes dropped their performance during FR trial by 272
more than twice the mean performance outcome differences recorded in FP trial. The data from the 273
correlation analyses assessing the association between degree of dehydration induced and the change 274
in skill performance outcome scores for each of the playing positions (fielders, batsmen and fast 275

12
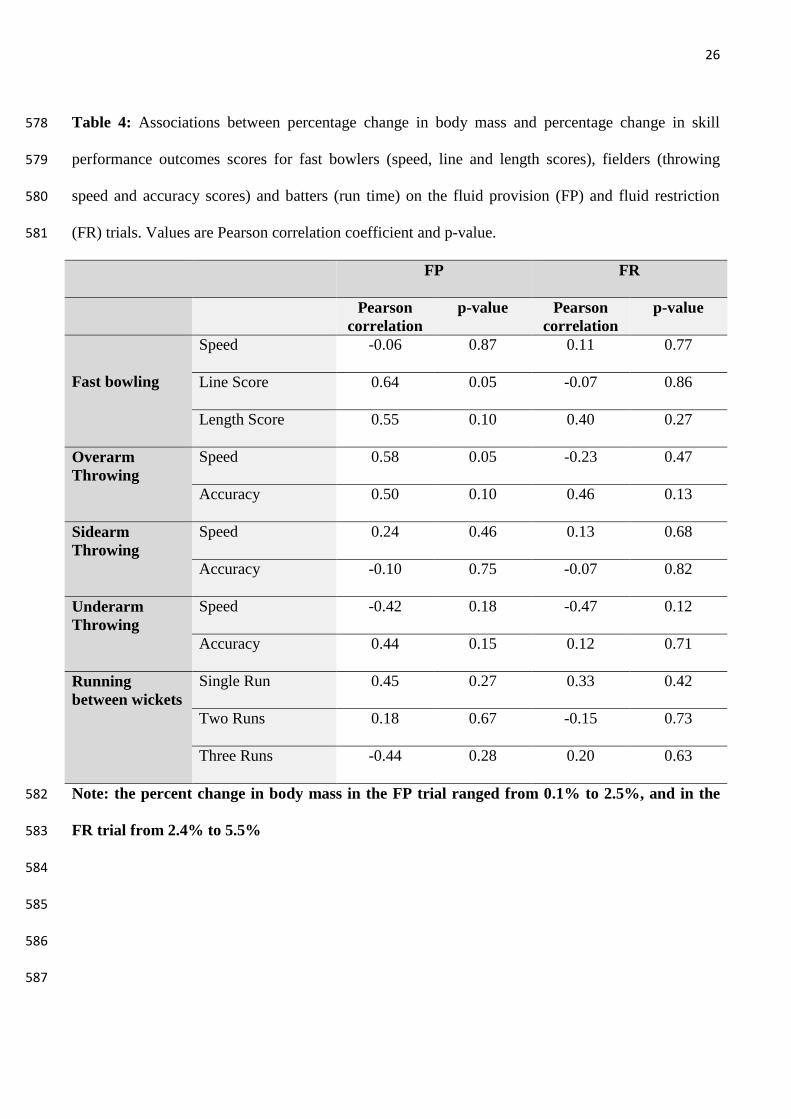
bowlers) are shown in Table 4. There were no significant associations between percent change in 276
body mass and percent change in any of the motor skill performance outcomes in the FP and FR 277
trials. In the FP trial there were two associations that nearly reached significance. These were a 278
positive association of percent change in body mass with fast bowling line performance score and a 279
positive association with overarm throwing speed. 280
281
Discussion 282
The main observation from this study was significant impairment in fast bowling, fielding and 283
running motor skill performance among elite cricketers with fluid restriction that resulted in 284
dehydration by 3.7% body mass. Other studies have shown similar impairment in sports specific skill 285
performance among team sport players in relation to dehydration. These include performance decline 286
in cricket fast bowlers with 2.8% dehydration (Devlin et al., 2001), soccer skills with 2% 287
dehydration (McGregor et al., 1999, Edwards et al., 2007), basketball skills with 2-4% dehydration 288
(Baker et al., 2007, Dougherty et al., 2006), and hockey skills with 2% dehydration (MacLeod et al. 289
2012). 290
291
Throwing and accurately delivering a ball with maximum force in a single effort tests muscle 292
strength and motor control. Based on the available data, some studies have observed detrimental 293
effects of acute dehydration on anaerobic muscular performance with more than 2% body mass loss 294
(Jones et al., 2008, Hayes et al., 2010). Our study has revealed a significant reduction in throwing 295
speed for overarm (6.6±4.1%; p<0.01) and sidearm (4.1±2.3%; p<0.01) techniques as well as a 296
reduction in throwing accuracy in FR trial only. Bowling speed also revealed a significant 297
impairment in performance with a drop in bowling speed by 1.0±0.8% (p>0.01) in the FR trial only. 298
In contrast, Devlin and colleagues (Devlin et al., 2001) found a significant performance drop only in 299
bowling accuracy but not in bowling speed with 2.8% body mass loss. In our study, 9 out of 10 fast 300

13
bowlers were dehydrated by >3% body mass during FR trial (1 fast bowler with 2-3%, 4 with 3-4% 301
and 5 with 4-5% body mass loss), which suggest significant impact on bowling speed with greater 302
degree of dehydration. Throwing performance measures in cricket have been examined in several 303
other studies, but have mainly focused on training methods (Freeston et al., 2007, Freeston et al., 304
2008). To date, there are no published data on effects of dehydration on throwing performance 305
among cricketers and these are presented for the first time in this study. 306
307
Running between wickets can be considered as an intermittent high intensity activity where players 308
sprint between wickets (21m). Data on effects of dehydration on short distance running and sprinting 309
activities are limited. A review of the literature on hydration and muscular performance suggests that 310
hypohydration has negative effects on muscular strength, power and high intensity endurance 311
activities lasting more than 30 seconds but less than 2 minutes (Judelson et al., 2007). Impairments 312
in shuttle running performance with 2.8% body mass loss among cricketers (Devlin et al., 2001) and 313
drop in Yo-Yo intermittent running test performance by 13-15% with 2% body mass loss among 314
soccer players (Edwards et al., 2007) have been reported but these are much longer task durations 315
assessing aerobic performance rather than sprint speed. In our study, we did not observe a significant 316
performance decline in the running speed between wickets, except for in time to make three runs 317
(p<0.01) when batsmen were fluid restricted. 318
319
On examining the relationship between the degree of dehydration (% body mass loss) and change in 320
performance outcome, we noted that there no significant associations (Table 4). This indicates that 321
those who had the largest percentage decline in body mass were not those who had the biggest 322
declines in skill performance outcomes. These observations highlight the individual nature of the 323
impact of dehydration on skill performance in athletes. Individual variation in the performance 324
among players also indicates that some athletes were capable of maintaining their performance, 325

14
while others demonstrate significant decline in their performance, with the same level of 326
dehydration. These observations suggest that it is imprecise to make definite figures for upper limits 327
of body mass losses through dehydration in maintaining cricket performance. Further studies 328
identifying individual variability that exists in cricket skill performance related to different levels of 329
dehydration would help to understand this complex relationship. 330
331
A limited number of studies have examined fluid intakes and sweat losses among cricketers, with 332
none examining the impact of dehydration on skill performance of players from different playing 333
positions. A survey carried out among Australian cricketers during a 2.5-hour training session in hot 334
(29°C) and humid (50%) conditions revealed that players lost 1202 ml of sweat on average per hour 335
with large individual variation (AIS, 2011). Similarly, fluid losses among female cricketers across a 336
tournament (6 innings) showed that mean sweat losses ranged from 0.30±0.31 L/h to 1.44±1.25 L/h 337
(percentage body mass loss range from 0.97 – 3%) with no statistically significant difference 338
between batsmen, bowlers and fielders (Soo et al., 2007). The outcome of these studies, supported by 339
the sweat rate results from our present work (861±148 ml/hour in FR trial vs. 1208±171 ml/hour in 340
FP trial) reveals that cricketers have large individual variation in their sweat losses. However, our 341
data also highlights an often not reported role that fluid ingestion plays upon the capacity to lose 342
fluid through sweating. The significantly higher sweat rate in the FP trial reflects a greater capacity 343
to produce sweat to aid in evaporative cooling (Nielsen, 1974, Moroff et al., 1965). The mean sweat 344
sodium concentration of athletes in this study (51±18 mmol/L in FP trial and 48±12 mmol/L in FR 345
trial) were similar to those found in elite soccer players (Maughan et al., 2004, Maughan et al., 2005, 346
Maughan et al., 2007, Godek et al., 2010), but higher than the values reported among Australian 347
cricketers, 33.2 mmol/L. (AIS, 2011). Cricketers engage in long periods of play and some may 348
therefore be at risk of large sweat volume and sweat electrolyte losses, which could be a significant 349
concern. Therefore, consideration of fluid replacement volume and sodium content of drinks is likely 350
15
to be important when recommending individual hydration strategies to cricketers in hot / humid 351
environments. 352
353
Practical Application 354
Considerable individual variation in sweat losses and their impact upon motor skill performance is 355
observed among cricketers across all playing positions. Generalized fluid replacement guidelines are 356
therefore of limited use for cricketers and individualization of fluid intake strategies should be 357
emphasized. Evidence from this study shows significant impairment in performance with 3-4% body 358
mass loss by dehydration, which emphasizes the importance of hydration strategies for cricketers to 359
help preserving performance in the later stages of matches. Fluid ingestion strategies to maintain 360
mass loss within 1% should likely be adopted to prevent declines in motor skill performance of 361
cricketers. 362
363
Conclusion 364
A fluid deficit of 3.7% body mass loss induced by fluid restriction in a 4-hour cricket session 365
resulted in significant impairments in motor skill performance among elite cricketers playing in hot 366
and humid conditions. Performance declines were observed in bowling speed and accuracy among 367
fast bowlers, in sidearm and overarm throwing speed and accuracy among fielders, and in 368
completing three runs among batsmen. Performance level was not altered when players ingested 369
sufficient fluid to maintain a mean body mass loss of <1%. 370
371
372
373
374
375
16
4. Acknowledgments authorships, declarations of funding sources and conflicts of interest 376
377
Acknowledgments - The authors wish to thank the all athletes took part in this study, the 378
management of the department of coaching, technical and ground staff of Sri Lanka Cricket. We also 379
acknowledge the technical assistance from the laboratory staff of the Asiri Hospital Laboratory Pvt, 380
Ltd, and university students and colleagues assisted with data collection. 381
382
Ethical Approval - The study was approved by the Ethical Review Committee, Faculty of Medicine 383
of University of Colombo, Sri Lanka. 384
385
Conflict of Interest - The authors declare that they have no conflict of interests. 386
387
Funding – No external funding source 388
389
390
391
392
393
394
395
396
397
398
399
400

17
5. References 401
402
1) Baker, L B., Dougherty, K A., Chow, M., Kenney, W L. (2007). Progressive dehydration 403
causes a progressive decline in basketball skill performance. Medicine & Science in Sports & 404
Exercise, 39(7), 1114-23. 405
2) Bardis, C N., Kavouras, S A., Arnaoutis, G., Panagiotakos, D B., and Sidossis, L S. (2013). 406
Mild dehydration and cycling performance during 5-kilometer hill climbing. Journal of 407
Athletic Training, 48(6), 741-747. 408
3) Burke, L M. (2010). Fluid Balance during team sports. Journal of Sports Science, 15(3), 287-409
295. 410
4) Christie, C J. The Physical Demands of Batting and Fast Bowling in Cricket. (2012). In K.R. 411
Zaslav (Ed.), An International Perspective on Topics in Sports Medicine and Sports Injury 412
(pp. 321-332). 413
5) Devlin, L H., Fraser, S F., Barras, N S., & Hawley, J A. (2001). Moderate levels of 414
hypohydration impair bowling accuracy but not bowling velocity in skilled cricket players. 415
Journal of Science & Medicine in Sport, 4(2), 179-87. 416
6) Dougherty, K A., Baker, L B., Chow, M., Kenney, W L. (2006). Two percent dehydration 417
impairs and six percent carbohydrate drink improves boys’ basketball skills. Medicine & 418
Science in Sports & Exercise, 38(9), 1650-1658. 419
7) Drust, B., Rasmssen, P., Mohr, M., Nielsen, B., Nybo, L. (2005). Elevation in core and muscle 420
temperature impairs repeated sprint performance. Acta Physiologica Scandinavica, 13(2), 421
181-190. 422
8) Ebert, T R., Martin, D T., Bullock, N., Mujika, I., Quod, M J., Farthing, L A., Burke, L M., 423
Withers, R T. (2007). Influence of hydration status on thermoregulation and cycling hill 424
climbing. Medicine & Science of Sports & Exercise, 39, 323-329. 425

18
9) Edwards, A M., Mann, M E., Marfell-Jones, M J., Rankin, D M., Noakes, T D., & Shillington, 426
D P. (2007). Influence of moderate dehydration on soccer performance: physiological 427
responses to 45 min of outdoor match-play and the immediate subsequent performance of 428
sport-specific and mental concentration tests. British Journal of Sports Medicine, 41, 385–429
391. 430
10) Freeston, J., Ferdinands, R., & Rooney, K. (2007). Throwing velocity and accuracy in elite 431
and sub-elite cricket players: A descriptive study. European Journal of Sport Science, 7(4), 432
231-237. 433
11) Freeston, J., Rooney, K. (2008). Progressive velocity throwing training increases velocity 434
without detriment to accuracy in sub-elite cricket players: A randomized controlled trial. 435
European Journal of Sports Science, 8(6), 373-378. 436
12) Galloway, S D., Maughan, R J. (1997). Effects of ambient temperature on the capacity to 437
perform prolonged cycle exercise in man. Medicine & Science in Sports & Exercise, 29(9), 438
1240-1249. 439
13) Godek, S F., Peduzzi, C., Burkholder, R., Condon, S., Dorshimer, G., Bartolozzi, A R. (2010). 440
Sweat Rates, Sweat Sodium Concentrations, and Sodium Losses in 3 Groups of Professional 441
Football Players. Journal of Athletic Training, 45(4), 364–371. 442
14) Gore, C J., Bourdon, P C., Woolford, S M., & Pederson, D G. (1993). Involuntary dehydration 443
during cricket. International Journal of Sports Medicine, 14(7), 387-95. 444
15) Hayes, L D., Morse, C I. (2010). The effects of progressive dehydration on strength and 445
power: is there a dose response? European Journal of Applied Physiology, 108, 701-707. 446
16) Hillman, A R., Vince, R V., Taylor, L., McNaughton, L., Mitchell, N., Siegler, J. (2011). 447
Exercise-induced dehydration with and without environmental heat stress results in increased 448
oxidative stress. Applied Physiology Nutrition & Metabolism, 36, 698-706. 449
19
17) Jones, L C., Cleary, M A., Lopez, R M., Zuri, R E., Lopez, R. (2008). Active dehydration 450
impairs upper and lower body anaerobic muscular power. Journal of Strength and 451
Conditioning Research, 22, 455-63 452
18) Judelson, D A., Maresh, C M., Anderson, J M., Armstrong, L E., Casa, D J., Kraemer, W 453
J., Volek, J S. (2007). Hydration and muscular performance: does fluid balance affect 454
strength, power and high-intensity endurance? Sports Medicine, 37(10), 907-921. 455
19) MacLeod, H., & Sunderland, C. (2012). Previous-day hypohydration impairs skill 456
performance in elite female field hockey players. Scandinavian Journal of Medicine & 457
Science in Sports, 22(3), 430-8. 458
20) Maxwell, N S., Mackenzie, R W A., & Bishop, D. (2009). Influence of hypohydration on 459
intermittent Sprint performance in the heat. International Journal of Sports Physiology & 460
Performance, 4, 54-67 461
21) Maughan, R J., Merson, S J., Broad, N P., Shirreffs, S M. (2004). Fluid and electrolyte intake 462
and loss in elite soccer players during training. International Journal of Sport Nutrition & 463
Exercise Metabolism, 14(3), 333–346. 464
22) Maughan, R J., Shirreffs, S M., Merson, S J., Horswill, C A. (2005). Fluid and electrolyte 465
balance in elite male football (soccer) players training in a cool environment. Journal of 466
Sports Science, 23(1), 73–79. 467
23) Maughan, R J., Watson, P., Evans, G H., Broad, N., Shirreffs, S M. (2007). Water balance and 468
salt losses in competitive football. International Journal of Sport Nutrition & Exercise 469
Metabolism, 17(6), 583–594. 470
24) McGregor, S J., Nicholas, C W., Lakomy, H K., Williams, C. (1999). The influence of 471
intermittent high-intensity shuttle running and fluid ingestion on the performance of a soccer 472
skill. Journal of Sports Science, 17(11), 895-903. 473

20
25) Montain, S J., Coyle, E F. (1992a). Fluid ingestion during exercise increases skin blood flow 474
independent of increases in blood volume. Journal of Applied Physiology, 73(3), 903-10. 475
26) Montain, S J., Coyle, E F. (1992b). Influence of graded dehydration on hyperthermia and 476
cardiovascular drift during exercise. Journal of Applied Physiology, 73(4), 1340-50. 477
27) Montain, S J., Sawka, M N., Latzka, W A., Valeri, C R. (1998). Thermal and cardiovascular 478
strain from hypohydration: influence of exercise intensity. International Journal of Sports & 479
Medicine, 19(2), 87–91. 480
28) Moroff, S V., Bass, D E. (1965). Effects of overhydration on man’s physiological responses to 481
work in the heat. Journal of Applied Physiology, 20, 267–70. 482
29) Morris, J G., Nevill, M E., Boobis, L H., Macdonald, I A., Williams, C. (2005). Muscle 483
metabolism, temperature, and function during prolonged, intermittent, high-intensity running 484
in air temperature of 33 degrees and 17 degrees oC. International Journal of Sports Medicine, 485
26(10), 805-814. 486
30) Murray, B. (2007). Hydration and physical performance. Journal of American College of 487
Nutrition, 26(5), 542-548. 488
31) Nielsen, B. (1974). Effects of changes in plasma volume and osmolarity on thermoregulation 489
during exercise. Acta Physiologica Scandinavica, 90, 725–30. 490
32) Parkin, J M., Carey, M F., Zhao, S., Febbraio, M A. (1999). Effects of ambient temperature on 491
human skeletal muscle metabolism during fatiguing submaximal exercise. Journal of Applied 492
Physiology, 86(3), 902-908. 493
33) Portus, M., Timms, S., Spratford, W., Morrison, N., & Croowther, R. The utility of a bowling 494
skills test to assist developing fast bowlers. (2010). In M. Portus (Ed.), Conference 495
proceedings from Conference of Science, Medicine & Coaching in Cricket (pp. 137-140). 496
Brisbane: Cricket Australia. 497

21
34) Sawka, M N., Young, A J., Francesconi, R P., Muza, S R., Pandolf, K B. (1985). 498
Thermoregulatory and blood responses during exercise at graded hypohydration levels. 499
Journal of Applied Physiology, 59(5), 1394–1401. 500
35) Soo, K., & Naughton, G. (2007). The hydration profile of female cricket players during 501
competition. International Journal of Sport Nutrition & Exercise Metabolism, 17(1), 14-26. 502
36) The science of hydration and refueling for cricket. (2011). AIS: 503
http://www.ausport.gov.au/ais. 504
37) Wilk, B., Meyer, F., Bar-Or, O., Timmons, B W. (2014). Mild to Moderate hypohydration 505
reduces boys’ high intensity cycling performance in the heat. European Journal of Applied 506
Physiology, 114(4), 707-713. 507
508
509
510
511
512
513
514
515
516
517
518
519
520
521
522

22
6. Tables 523
Table 1: Mean body mass, mass loss, sweat loss and sweat rate, sweat electrolyte content (sodium 524
and chloride), fluid intake and urine output on the fluid provision (FP) and fluid restriction (FR) 525
trials. Values are expressed as Mean ± SD. 526
Fast Bowlers
(n=10)
Fielders
(n=12)
Batsmen
(n=8)
Total
(n=30)
FP
Pre mass (kg) 73.0±10.4 68.1±11.4 69.0±4.5 70.0±9.6
Post mass (kg) 72.3±10.5 67.6±11.5 68.5±4.5 69.4±9.7
Body mass loss (g) 640±353 575±339 525±249 583±315
Body mass loss (%) 0.91±0.52 0.89±0.64 0.76±0.36 0.86±0.52
Sweat loss (ml) 4923±703 4450±530 5297±591a 4833±683
Sweat rate (ml/hour) 1231±176 1112±132 1324±148 a 1208±171
Sweat sodium (mM) 45±20 59±17 45±14 51±18
Sweat chloride (mM) 38±19 52±15 34±12 42±17
Fluid intake (ml) 4674±373 4251±424 4997±404b 4591±497
Fluid rate (ml/hour) 1168±93 1063±106 1249±101b 1148±124
Urine (ml) 391±176 376±228 225±97 341±192
FR
Pre mass (kg) 72.9±10.4 68.2±11.4 68.8±4.6 69.9±9.6
Post mass (kg) 70.1±10.3 65.9±11.2 66.1±4.8 67.3±9.5†
Body mass loss (g) 2760±506 2283±478 2725±602 2560±554*
Body mass loss (%) 3.82±0.72 3.37±0.66 3.99±0.97 3.69±0.79*
Sweat loss (ml) 3671±569 3107±502 3666±558 3444±591†
Sweat rate (ml/hour) 918±142 777±126 916±139 861±148†
Sweat sodium (mM) 43±13 49±13 54±8 48±12
Sweat chloride (mM) 32±15 35±12 36±9 34±12††
Fluid intake (ml) 1061±162 972±226 1045±162 1021±189†
Fluid rate (ml/hour) 265±41 243±56 261±40 255±47†
Urine (ml) 150±79 148±73 105±41 137±69†
† Significantly lower than the corresponding measure in FP trial for all athletes († = p<0.01; †† = 527
<0.05) 528

23
* Significantly higher than the corresponding measure in FP trial for all athletes (p<0.01) 529
a Significantly higher than the sweat loss and sweat rate of fielders in the FP trial only (p<0.05) 530
b Significantly higher than the fluid intake and fluid intake rate in the FP trial only (p<0.01) 531
532
533
534
535
536
537
538
539
540
541
542
543
544
545
546
547
548
549
550
551
552
24
Table 2: Urine color and urine specific gravity parameters on the fluid provision (FP) and fluid 553
restriction (FR) trials for fast bowlers, batsmen and fielders. Values are expressed as Mean ± SD. 554
FP FR
Pre-Test Post-Test Pre-Test Post-Test
Urine
Color
(1-8)
Fast Bowlers (n=10) 2.80±0.79 3.30±0.95 2.70±0.82 4.00±1.15*
Fielders (n=12) 2.67±0.78 2.83±0.72 2.75±0.75 4.08±1.24†
Batsmen (n=8) 2.63±0.74 3.25±0.89 2.75±0.89 3.63±0.92†
Total (n=30) 2.70±0.75 3.10±0.85 2.73±0.78 3.93±1.11*
Urine
Specific
Gravity
Fast Bowlers (n=10) 1.019±0.002 1.022±0.003† 1.021±0.003 1.026±0.002*
Fielders (n=12) 1.020±0.003 1.023±0.003† 1.021±0.002 1.026±0.002*
Batsmen (n=8) 1.022±0.003 1.024±0.001† 1.021±0.003 1.027±0.001*
Total (n=30) 1.020±0.003 1.023±0.003* 1.021±0.003 1.026±0.002*
* Significantly higher than Pre-test of the corresponding trial only (p<0.01) 555
† Significantly higher than Pre-test of the corresponding trial only (p<0.05) 556
557
558
559
560
561
562
563
564
565
566

25
Table 3: Percentage differences in performance outcome scores in FP and FR trials. Values are 567
expressed as Mean ± SD. 568
FP FR Na
Fast bowling
Speed (km/hour) -0.3±0.8 -1.0±0.8* 8/10
Line -3.6±14.2 -19.8±17.3* 9/10
Length 2.33±7.84 0.94±5.22 4/10
Overarm
Throwing
Speed (km/hour) -1.6±3.4 -6.6±4.1* 10/12
Accuracy 0.8±24.2 -14.2±16.3* 10/12
Sidearm
Throwing
Speed (km/hour) 0.6±4.7 -4.1±2.3* 11/12
Accuracy -3.2±34.9 -22.3±13.3† 11/12
Underarm
Throwing
Speed (km/hour) 0.6±4.7 -1.1±3.6 6/12
Accuracy 5.79±19.16 2.41±15.61 3/12
Running between
wickets
Single Run (sec) -1.15±1.77 1.028±1.94 3/8
Two Runs (sec) -0.98±1.15 0.45±0.79 1/8
Three Runs (sec) 0.8±1.2 2.2±1.7* 5/8
a number of athletes whose performance dropped during FR trial by more than twice the mean 569
performance difference in the FP trial. 570
*Significant change in the percentage difference in performance outcome score compared to FP trial 571
(p<0.01) 572
† Significant change in the percentage difference in performance outcome score compared to FP trial 573
(p<0.05) 574
575
576
577
26
Table 4: Associations between percentage change in body mass and percentage change in skill 578
performance outcomes scores for fast bowlers (speed, line and length scores), fielders (throwing 579
speed and accuracy scores) and batters (run time) on the fluid provision (FP) and fluid restriction 580
(FR) trials. Values are Pearson correlation coefficient and p-value. 581
FP FR
Pearson
correlation
p-value Pearson
correlation
p-value
Fast bowling
Speed -0.06 0.87 0.11 0.77
Line Score 0.64 0.05 -0.07 0.86
Length Score 0.55 0.10 0.40 0.27
Overarm
Throwing
Speed 0.58 0.05 -0.23 0.47
Accuracy 0.50 0.10 0.46 0.13
Sidearm
Throwing
Speed 0.24 0.46 0.13 0.68
Accuracy -0.10 0.75 -0.07 0.82
Underarm
Throwing
Speed -0.42 0.18 -0.47 0.12
Accuracy 0.44 0.15 0.12 0.71
Running
between wickets
Single Run 0.45 0.27 0.33 0.42
Two Runs 0.18 0.67 -0.15 0.73
Three Runs -0.44 0.28 0.20 0.63
Note: the percent change in body mass in the FP trial ranged from 0.1% to 2.5%, and in the 582
FR trial from 2.4% to 5.5% 583
584
585
586
587
27
7. Figure legends 588
589
Figure 1: Diagrammatic representation of the study design, illustrating the hydration protocol, 590
measurement time points, procedures and tests carried out during the 4-hour trial period. 591
592
Figure 2: Comparison between Pre-test and Post-test mean performance scores among fast bowlers 593
in FP and FR trials. Values are Mean ± SD. N=10. *Significant difference from Pre-test of the FR 594
trial (p<0.01). 595
596
Figure 3: Comparison between Pre-test and Post-test mean performance scores among fielders in FP 597
and FR trials. Values are Mean ± SD. N=12. †Significant difference from Pre-test of the FR trial 598
(p<0.05). *Significant difference from Pre-test of the FR trial (p<0.01). 599
600
Figure 4: Comparison between Pre-test and Post-test mean performance scores among batsmen in 601
FP and FR trials. Values are Mean ± SD. N=8. *Significant difference from Pre-test of the FR trial 602
(p<0.01). 603
604
605
606
607
608
609
610
611
612

28
8. Figures 613
Figure 1 614
615
616
617
618
619
620
621
622
623

29
Figure 2. 624
625
626
627
628
629
630
631
632
633
634
635
636
637
638

30
Figure 3 639
640
641
642
643
644
645
646
647
648
649
650
651
652
653

31
Figure 4. 654
655
656
657
658