assess the existing status of implementation of icds in terms of coverage, out reach, coordination,...
TRANSCRIPT


Assess the existing status of implementation of ICDS in terms of coverage, out reach, coordination, convergence, and innovations;
Study the differences in implementation in rural, urban tribal, NGO and WB projects;
Identify gaps and problems in the implementation of ICDS;
Find out the perception of community and local bodies and support extended by them;
Ascertain inter-linkages of ICDS with other development programmes; and
Assess the benefits of ICDS on selected outcome indicators
OBJECTIVES

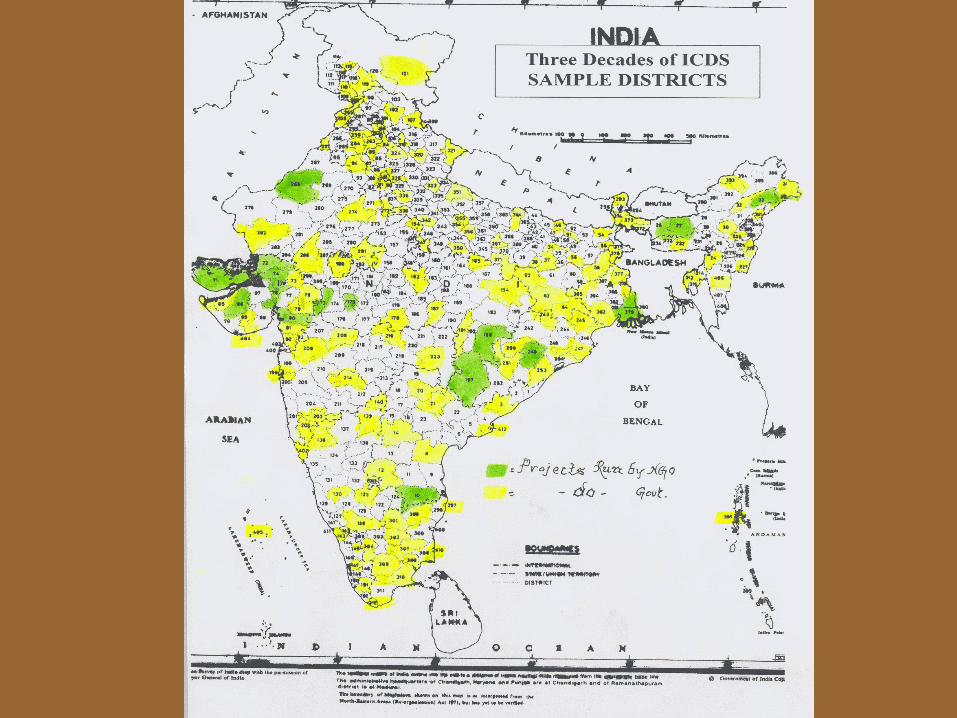
Universe:• Sample was drawn only from blocks which were operational as on 01- 04- 2000 i.e. 4200 projects 3177 rural, 273 urban and 750 tribal).
• For the Study, 150 ICDS projects are selected as a sample i.e. roughly 4% of the total universe.
Sample:1st Stage=Stratified Sampling Technique to decide no. of projects statewise 2nd Stage= Stratified+Purposive( Wherever, there was even one project of rural, urban & tribal category, purposively selected). Selection of Districts: - Districts with maximum number of projects selected* Selection of Projects: - Projects with maximum number of AWWs selected* Selection of AWC villages: - Randomly and at least from two Supervisory circles * Selection of Beneficiaries: - Randomly with the help of AWC’s record
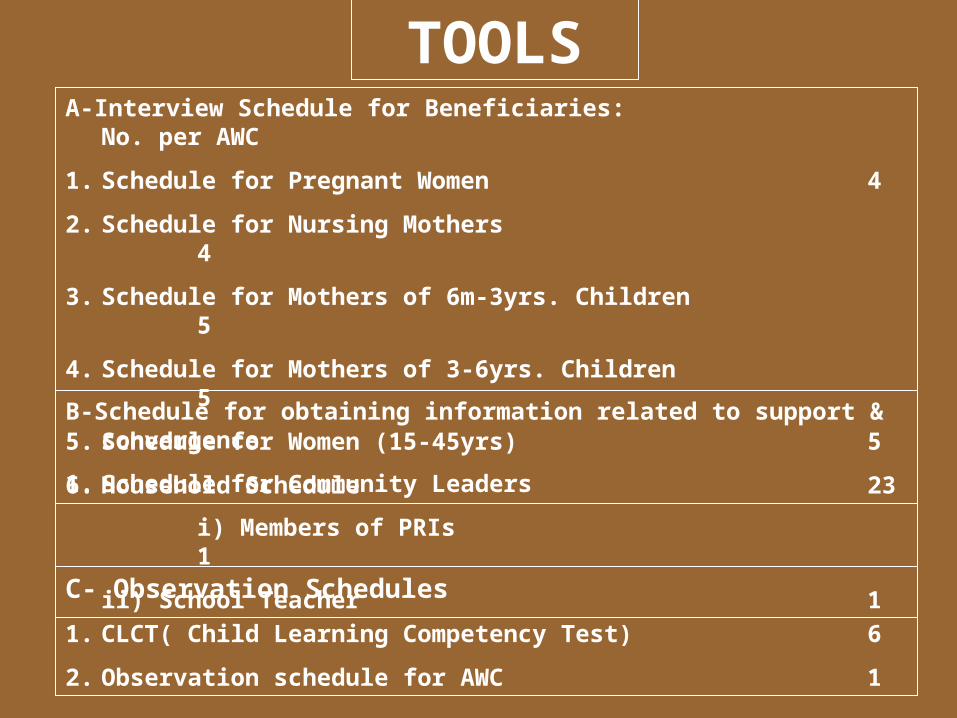
TOOLSA-Interview Schedule for Beneficiaries: No. per
AWC
1. Schedule for Pregnant Women 4
2. Schedule for Nursing Mothers 4
3. Schedule for Mothers of 6m-3yrs. Children 5
4. Schedule for Mothers of 3-6yrs. Children 5
5. Schedule for Women (15-45yrs) 5
6. Household Schedule 23
C- Observation Schedules
1. CLCT( Child Learning Competency Test) 6
2. Observation schedule for AWC 1
B-Schedule for obtaining information related to support & convergence
1. Schedule for Community Leaders
i) Members of PRIs 1
ii) School Teacher 1

D-Schedule for the Functionaries
No. of Schedule/Project
1. Schedule for CDPOs 1
2. Schedule for MO 1
3. Schedule for Supervisor 2
4. Schedule for LHV/ANM 1
5. Schedule for AWWs 25
Contd/-
Total No. of Respondents=41,842

Measures taken:* Preparation of detailed Guidelines
• Preparation of Pre-coded Interview Schedules
• Orient. Workshop of NIPCCD Faculty & Regional Coordinators
• Rigorous training to field staff
• Editing to detect errors & omissions in entries of the schedules
• Data revalidation at the time of entry & validation with the help of “Clipper” software
• Checked range/consistency of every coded response
• Manual checking of 10% entries
• New Concept Information System – a Delhi based professional agency has been engaged for Computerization and data analysis
DATA QUALITY
Computerization & Analysis

HIGHLIGHTS OF FINDINGS

38.743.1 43.2
19.9
75.4
0
10
20
30
40
50
60
70
80
1992 2001 2006
(i) Kutcha
(ii) Pucca
ICDS Over the Years - Infrastructure
(at AWC level)
Type of Building of AWCs

73.476.3
32.9
90.71
55.9
0
10
20
30
40
50
60
70
80
90
100
1992 2001 2006
WeighingScaleLearningKit (PSE)
ICDS Over the Years - Infrastructure
(at AWC level)
Availability of Equipment/ Kit in usable Condition

ICDS over the Years-Staff Position
72.5
95.1
98.2
82.3
97.5
96.7
0
20
40
60
80
100
120
Supervisorin Position
AWWs inPosition
AWHs inPosition
% a
ge
1992
2006

Training Status (% trained)
Sl.No.
Staff NIPCCD Study *1992
NCAER Study**2001
Present Study**
*2006
(i) CDPOs 73.6 D.N.A. 81.6
(ii) Supervisor 84.0 D.N.A. 95.2
(iii) AWWs 80.0 83.6 98.3
D.N.A.= Data Not Available

Educational Qualification of AWWs (% age)
S.No. Staff NIPCCD Study 1992
Present Study2006
(i) Matriculate (H.S.) 49.6 43.2
(ii) Higher Secondary/ Inter
13.6 23.3
(iii) Graduate D.N.A. 10.0
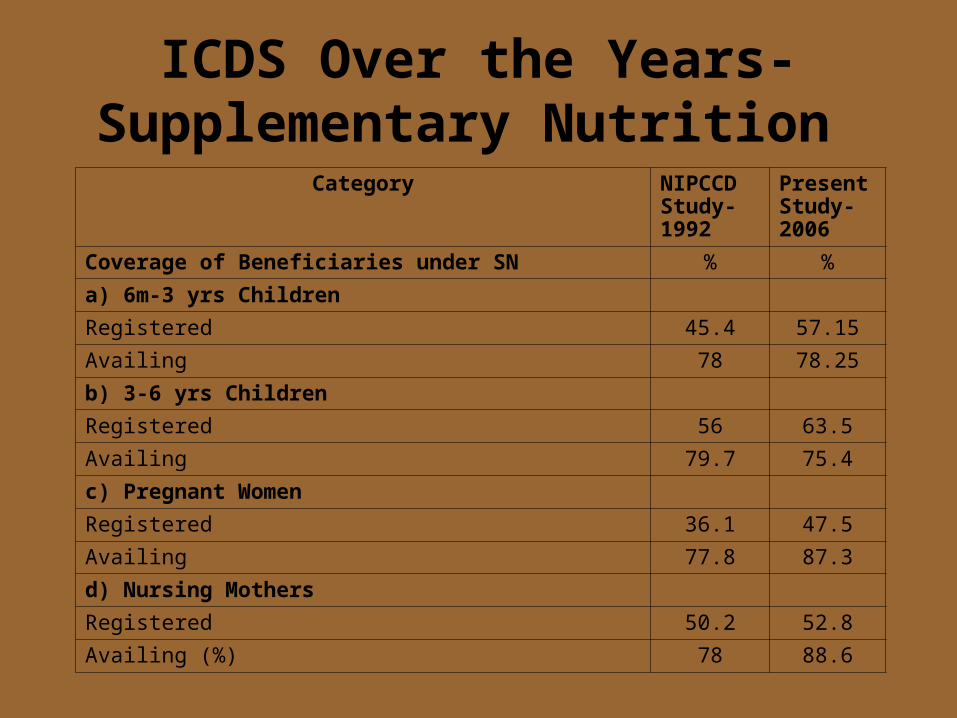
ICDS Over the Years-Supplementary Nutrition
Category NIPCCD Study-1992
Present Study-2006
Coverage of Beneficiaries under SN % %
a) 6m-3 yrs Children
Registered 45.4 57.15
Availing 78 78.25
b) 3-6 yrs Children
Registered 56 63.5
Availing 79.7 75.4
c) Pregnant Women
Registered 36.1 47.5
Availing 77.8 87.3
d) Nursing Mothers
Registered 50.2 52.8
Availing (%) 78 88.6

41
58.9
29
71
0
10
20
30
40
50
60
70
80
1992 2006
Percentageof childrenless than2500 gramsof children
Percentageof childrenmore than2500 grams
Birth Weight of New Born Children

Nutritional Grade (Children 0-3 Yrs)
35.5 35.2
22.4
6.8
53
16.3
7
1.10
10
20
30
40
50
60
Normal Grade-I Grade-II Grade-III& IV
Grade
Perc
enta
ge
1992 2006
Nutritional Grade (Children 3-5 Yrs)
35.9
21.3
4
49.1
12.8
3.20.8
38.8
0
10
20
30
40
50
60
Normal Grade-I Grade-II Grade-III& IV
Grade
Per
cent
age
1992 2006

Quality of SN (as per AWWs)
32
41.6
34.631.2
9.412.3
7.8 9.1
05
1015202530354045
Poor Q
uality
Not T
asty
Cause
s Dia
arrh
oea
Difficu
lt to
Dig
est
Quality
Pe
rce
nta
ge
NIPCCD Study-1992
Present Study-2006

Disruption in Distribution of SN
Disruption in distribution of SN
NIPCCD Study-1992
Present Study-2006
AWWs reporting disruption (%) 62.3 54
Average No. of days of disruption 63.7 41.3
Reasons for Disruption (% AWWs)
Food items not supplied 89 44.5
Weather conditions 15.6 3.3
Transportation Problem 21 9.8
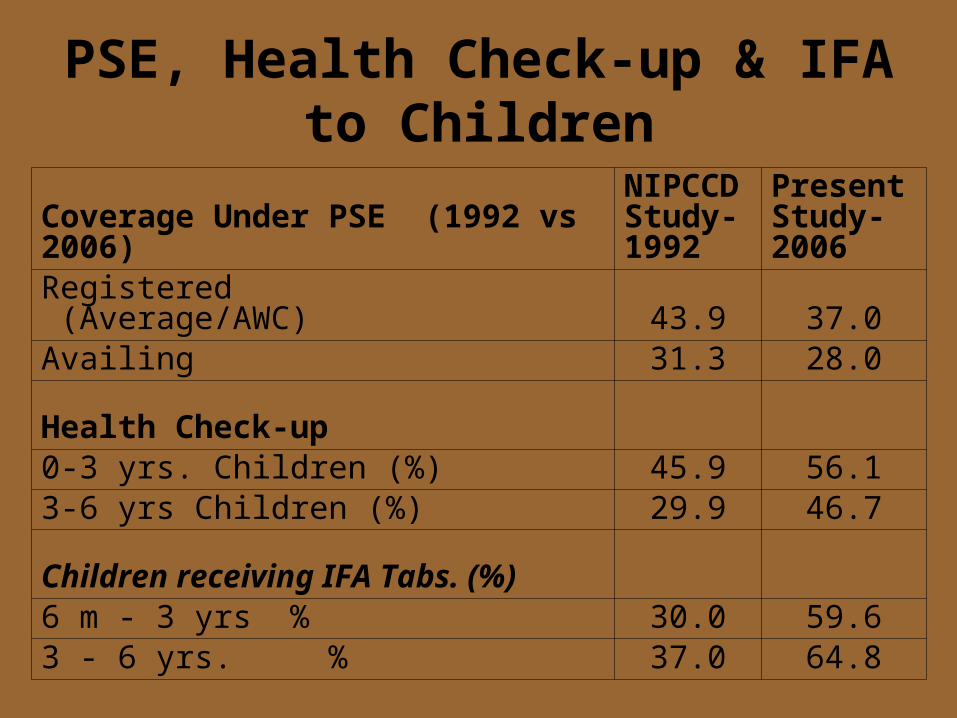
PSE, Health Check-up & IFA to Children
Coverage Under PSE (1992 vs 2006)
NIPCCD Study-1992
Present Study-2006
Registered (Average/AWC) 43.9 37.0Availing 31.3 28.0
Health Check-up0-3 yrs. Children (%) 45.9 56.13-6 yrs Children (%) 29.9 46.7
Children receiving IFA Tabs. (%)6 m - 3 yrs % 30.0 59.63 - 6 yrs. % 37.0 64.8

Place of Delivery (in percentage)
NIPCCD Study-1992
Present Study-2006
Home Delivery 72 53.4PHC/Sub-Centre/Govt. Hospital 19.5 29.6Pvt. Hospital 6.3 16.5Others 0.5 0.4

Birth Attended By
(in percentag
e)
(in percentag
e)Trained Dai 33.2 29.1Health staff (ANM/PHN/LHV) 21.1 32.8Pvt. Practitioners 7.9 17.2Untrained Persons (AWWs/Family Members/Others
37.7 19.6
Total Inst. Delivery DNA 46.2Post-natal Care 37.2 57.5

Percentage of Children Immunized
Children NIPCCD Study 1992
Present Study 2006 *
Children (0-1 years)
BCG 71.5 82.4
Measles 50.4 70.5
Polio 37.5 70.5
Children (3-6 years)
DT Booster 28.4 54.9
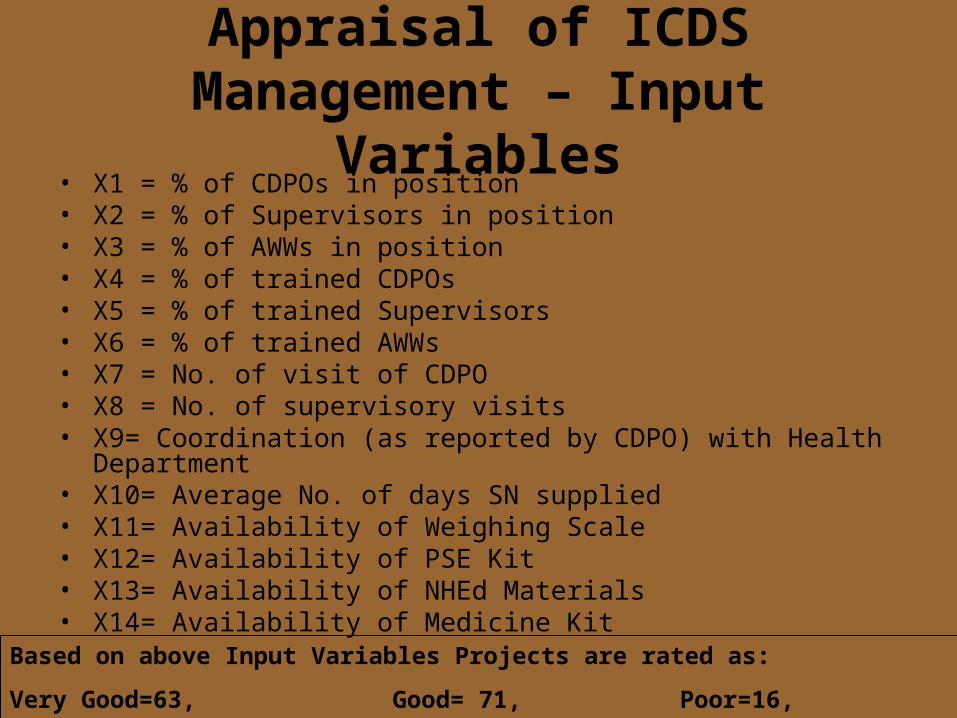
Appraisal of ICDS Management – Input Variables
• X1 = % of CDPOs in position• X2 = % of Supervisors in position• X3 = % of AWWs in position• X4 = % of trained CDPOs• X5 = % of trained Supervisors• X6 = % of trained AWWs• X7 = No. of visit of CDPO• X8 = No. of supervisory visits• X9= Coordination (as reported by CDPO) with Health Department• X10= Average No. of days SN supplied• X11= Availability of Weighing Scale• X12= Availability of PSE Kit• X13= Availability of NHEd Materials• X14= Availability of Medicine Kit
Based on above Input Variables Projects are rated as:
Very Good=63, Good= 71, Poor=16,Total=150


Appraisal of Output/Outcomes of Programme
• Y1 = Observation Score of AWCs• Y2 = CLCT Score (Child Learning Competency Test): • Y3 = % of Children under Normal category• Y4 = % of Grade I Children• Y5 = % of Grade II Children• Y6 = % of Grade III and IV Children• Y7 = No. of 3-6 years children attending PSE classes• Y8 = No. of fully immunized (children)• Y9 = No. of fully immunized (pregnant women)• Y10= Health check-up (No. of Women)• Y11= Health check-up (No. of children)• Y12= No. of NHEd sessions organized• Y13= No. of Referral Cases• Y14= No. of Pass out Children admitted to Primary School
Based on above Output/Outcome Variables Projects are rated as:
Very Good=43, Good= 86, Poor=21 Total=150


Relationship Between Input, Output / Outcomes
< 35 (Poor)
35-45 (Good)
>45(Very Good)
Total
> 15 (Very Good)
4 30 29 63
10-15 (Good) 12 46 13 71
<10 (Poor) 5 10 1 16
Total 21 86 43 150
Output / Outcomes (No. of Projects)Output / Outcomes (No. of Projects)
In
pu
tIn
pu
t

GAP AREAS

Infrastructure
a) No toilet facility 60% AWCs
b) Unsatisfactory toilet facility 17 % AWCs
c) Non availability of Sub- 57% AWCs
Centres
d) Non-availability of
- Indoor Space 48.5 % AWCs
- Outdoor 48.7 % AWCs
e) No separate space for 50.0 % AWCs
Storage
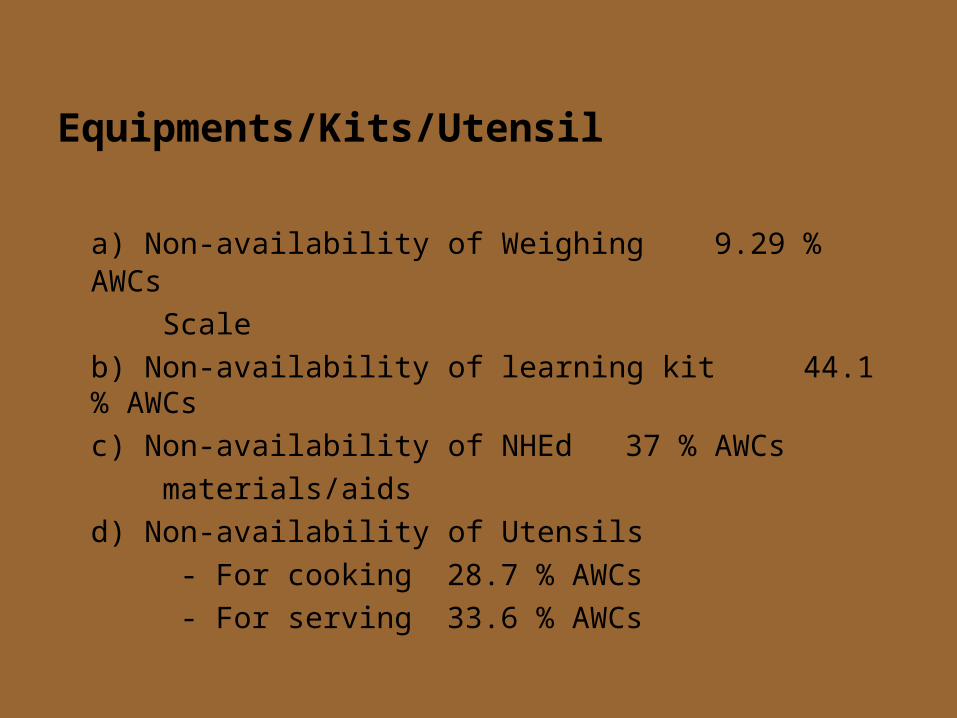
Equipments/Kits/Utensil
a) Non-availability of Weighing 9.29 % AWCs
Scale
b) Non-availability of learning kit 44.1 % AWCs
c) Non-availability of NHEd 37 % AWCs
materials/aids
d) Non-availability of Utensils
- For cooking 28.7 % AWCs
- For serving 33.6 % AWCs

Coordination
Non-existence of Coordination Committee at Project level
Rural 20.0 %
Tribal 28.1 %
Urban 12.5 %

Services
i) SN a) Disruption in supply (Av.days) 41.3 days
b) Supply of Spoiled Food items 6.3 % projects
c) LBW Babies29.0 %

Health Check-up
a) Health Check-up not done
- 0-3 years children 43.9 %
- 3-6 years children 53.3 %
b) Children not receiving IFA Tablets
- 6 months - 3 years 40.4 %
- 3 - 6 years 35.2 %
c) Children not immunized fully34.0 %

THANK YOU