

Assess the existing status of implementation of ICDS in terms of coverage, out reach, coordination, convergence, and innovations;
Study the differences in implementation in rural, urban tribal, NGO and WB projects;
Identify gaps and problems in the implementation of ICDS;
Find out the perception of community and local bodies and support extended by them;
Ascertain inter-linkages of ICDS with other development programmes; and
Assess the benefits of ICDS on selected outcome indicators
OBJECTIVES

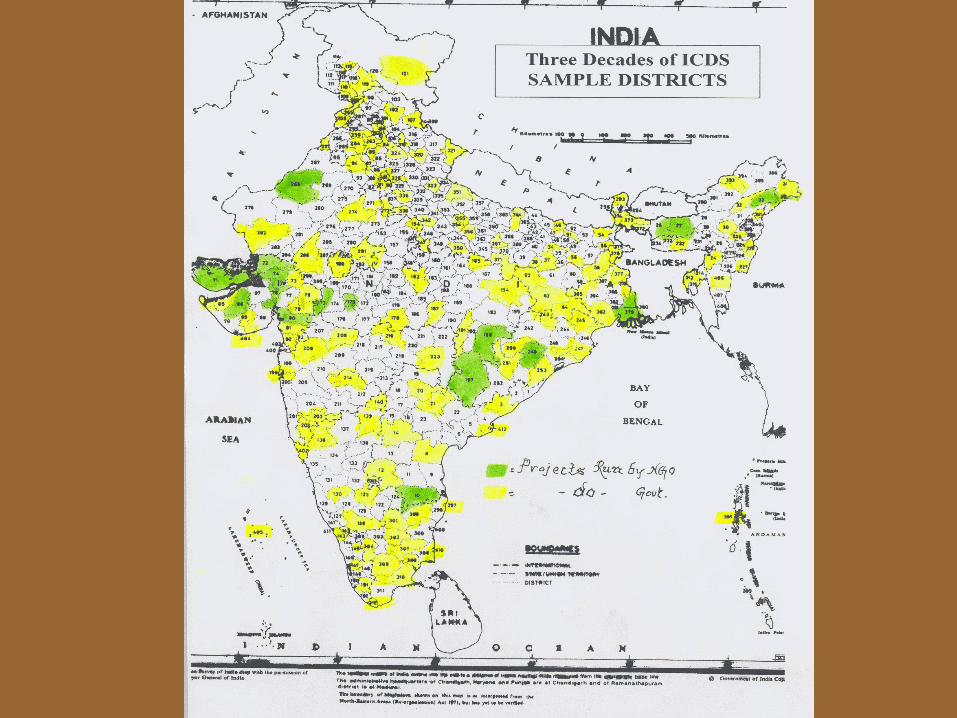
Universe:• Sample was drawn only from blocks which were operational as on 01- 04- 2000 i.e. 4200 projects 3177 rural, 273 urban and 750 tribal).
• For the Study, 150 ICDS projects are selected as a sample i.e. roughly 4% of the total universe.
Sample:1st Stage=Stratified Sampling Technique to decide no. of projects statewise 2nd Stage= Stratified+Purposive( Wherever, there was even one project of rural, urban & tribal category, purposively selected). Selection of Districts: - Districts with maximum number of projects selected* Selection of Projects: - Projects with maximum number of AWWs selected* Selection of AWC villages: - Randomly and at least from two Supervisory circles * Selection of Beneficiaries: - Randomly with the help of AWC’s record
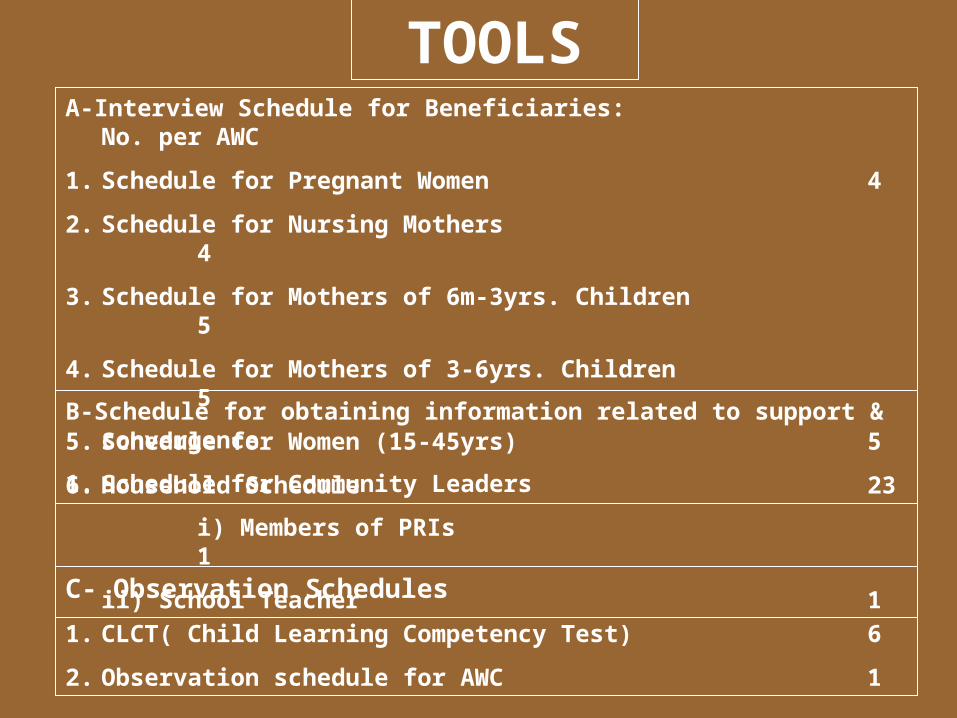
TOOLSA-Interview Schedule for Beneficiaries: No. per
AWC
1. Schedule for Pregnant Women 4
2. Schedule for Nursing Mothers 4
3. Schedule for Mothers of 6m-3yrs. Children 5
4. Schedule for Mothers of 3-6yrs. Children 5
5. Schedule for Women (15-45yrs) 5
6. Household Schedule 23
C- Observation Schedules
1. CLCT( Child Learning Competency Test) 6
2. Observation schedule for AWC 1
B-Schedule for obtaining information related to support & convergence
1. Schedule for Community Leaders
i) Members of PRIs 1
ii) School Teacher 1

D-Schedule for the Functionaries
No. of Schedule/Project
1. Schedule for CDPOs 1
2. Schedule for MO 1
3. Schedule for Supervisor 2
4. Schedule for LHV/ANM 1
5. Schedule for AWWs 25
Contd/-
Total No. of Respondents=41,842

Measures taken:* Preparation of detailed Guidelines
• Preparation of Pre-coded Interview Schedules
• Orient. Workshop of NIPCCD Faculty & Regional Coordinators
• Rigorous training to field staff
• Editing to detect errors & omissions in entries of the schedules
• Data revalidation at the time of entry & validation with the help of “Clipper” software
• Checked range/consistency of every coded response
• Manual checking of 10% entries
• New Concept Information System – a Delhi based professional agency has been engaged for Computerization and data analysis
DATA QUALITY
Computerization & Analysis

HIGHLIGHTS OF FINDINGS

38.743.1 43.2
19.9
75.4
0
10
20
30
40
50
60
70
80
1992 2001 2006
(i) Kutcha
(ii) Pucca
ICDS Over the Years - Infrastructure
(at AWC level)
Type of Building of AWCs

73.476.3
32.9
90.71
55.9
0
10
20
30
40
50
60
70
80
90
100
1992 2001 2006
WeighingScaleLearningKit (PSE)
ICDS Over the Years - Infrastructure
(at AWC level)
Availability of Equipment/ Kit in usable Condition

ICDS over the Years-Staff Position
72.5
95.1
98.2
82.3
97.5
96.7
0
20
40
60
80
100
120
Supervisorin Position
AWWs inPosition
AWHs inPosition
% a
ge
1992
2006

Training Status (% trained)
Sl.No.
Staff NIPCCD Study *1992
NCAER Study**2001
Present Study**
*2006
(i) CDPOs 73.6 D.N.A. 81.6
(ii) Supervisor 84.0 D.N.A. 95.2
(iii) AWWs 80.0 83.6 98.3
D.N.A.= Data Not Available

Educational Qualification of AWWs (% age)
S.No. Staff NIPCCD Study 1992
Present Study2006
(i) Matriculate (H.S.) 49.6 43.2
(ii) Higher Secondary/ Inter
13.6 23.3
(iii) Graduate D.N.A. 10.0
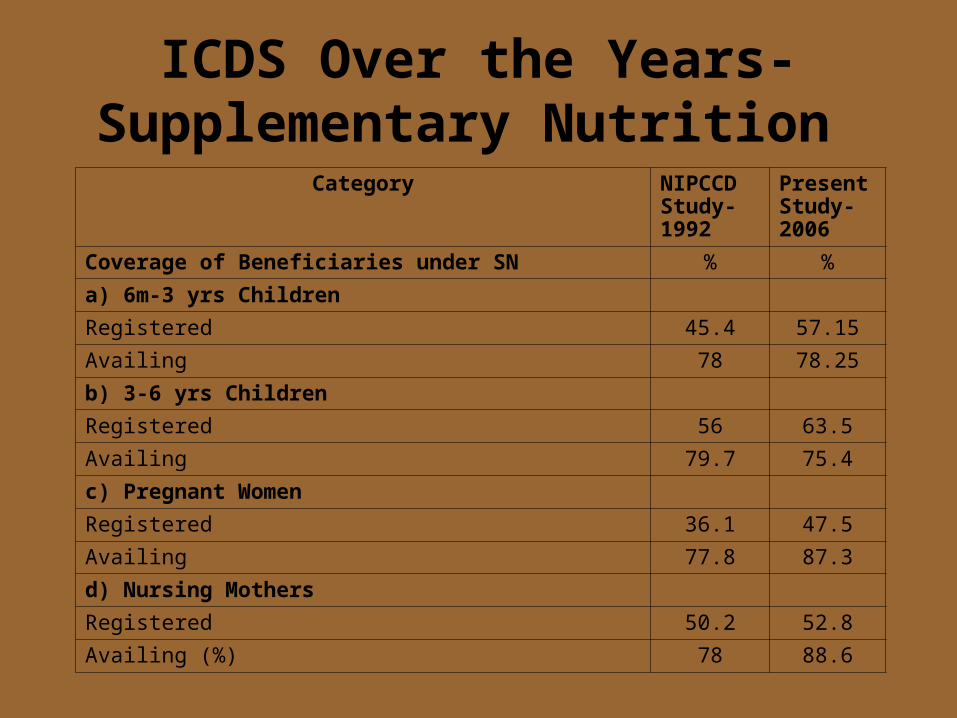
ICDS Over the Years-Supplementary Nutrition
Category NIPCCD Study-1992
Present Study-2006
Coverage of Beneficiaries under SN % %
a) 6m-3 yrs Children
Registered 45.4 57.15
Availing 78 78.25
b) 3-6 yrs Children
Registered 56 63.5
Availing 79.7 75.4
c) Pregnant Women
Registered 36.1 47.5
Availing 77.8 87.3
d) Nursing Mothers
Registered 50.2 52.8
Availing (%) 78 88.6

41
58.9
29
71
0
10
20
30
40
50
60
70
80
1992 2006
Percentageof childrenless than2500 gramsof children
Percentageof childrenmore than2500 grams
Birth Weight of New Born Children

Nutritional Grade (Children 0-3 Yrs)
35.5 35.2
22.4
6.8
53
16.3
7
1.10
10
20
30
40
50
60
Normal Grade-I Grade-II Grade-III& IV
Grade
Perc
enta
ge
1992 2006
Nutritional Grade (Children 3-5 Yrs)
35.9
21.3
4
49.1
12.8
3.20.8
38.8
0
10
20
30
40
50
60
Normal Grade-I Grade-II Grade-III& IV
Grade
Per
cent
age
1992 2006

Quality of SN (as per AWWs)
32
41.6
34.631.2
9.412.3
7.8 9.1
05
1015202530354045
Poor Q
uality
Not T
asty
Cause
s Dia
arrh
oea
Difficu
lt to
Dig
est
Quality
Pe
rce
nta
ge
NIPCCD Study-1992
Present Study-2006

Disruption in Distribution of SN
Disruption in distribution of SN
NIPCCD Study-1992
Present Study-2006
AWWs reporting disruption (%) 62.3 54
Average No. of days of disruption 63.7 41.3
Reasons for Disruption (% AWWs)
Food items not supplied 89 44.5
Weather conditions 15.6 3.3
Transportation Problem 21 9.8
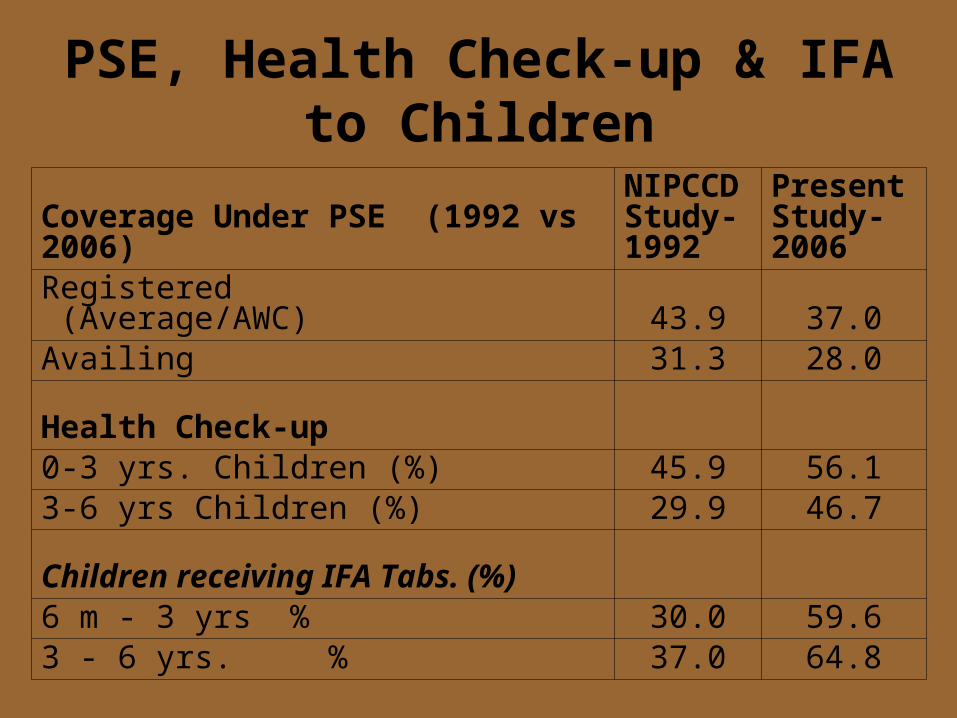
PSE, Health Check-up & IFA to Children
Coverage Under PSE (1992 vs 2006)
NIPCCD Study-1992
Present Study-2006
Registered (Average/AWC) 43.9 37.0Availing 31.3 28.0
Health Check-up0-3 yrs. Children (%) 45.9 56.13-6 yrs Children (%) 29.9 46.7
Children receiving IFA Tabs. (%)6 m - 3 yrs % 30.0 59.63 - 6 yrs. % 37.0 64.8

Place of Delivery (in percentage)
NIPCCD Study-1992
Present Study-2006
Home Delivery 72 53.4PHC/Sub-Centre/Govt. Hospital 19.5 29.6Pvt. Hospital 6.3 16.5Others 0.5 0.4

Birth Attended By
(in percentag
e)
(in percentag
e)Trained Dai 33.2 29.1Health staff (ANM/PHN/LHV) 21.1 32.8Pvt. Practitioners 7.9 17.2Untrained Persons (AWWs/Family Members/Others
37.7 19.6
Total Inst. Delivery DNA 46.2Post-natal Care 37.2 57.5

Percentage of Children Immunized
Children NIPCCD Study 1992
Present Study 2006 *
Children (0-1 years)
BCG 71.5 82.4
Measles 50.4 70.5
Polio 37.5 70.5
Children (3-6 years)
DT Booster 28.4 54.9
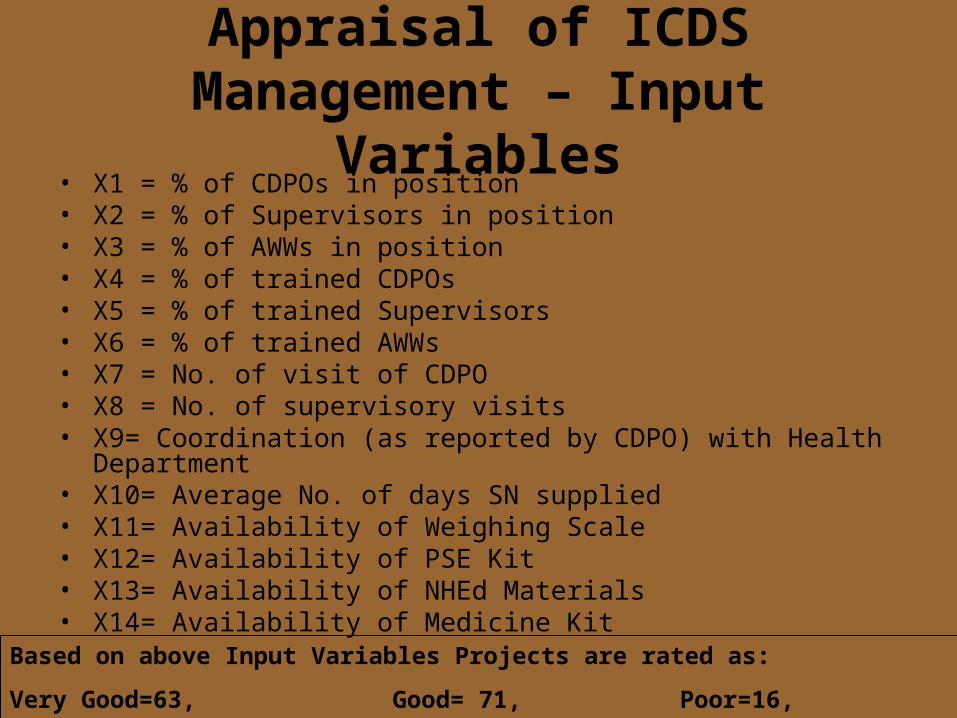
Appraisal of ICDS Management – Input Variables
• X1 = % of CDPOs in position• X2 = % of Supervisors in position• X3 = % of AWWs in position• X4 = % of trained CDPOs• X5 = % of trained Supervisors• X6 = % of trained AWWs• X7 = No. of visit of CDPO• X8 = No. of supervisory visits• X9= Coordination (as reported by CDPO) with Health Department• X10= Average No. of days SN supplied• X11= Availability of Weighing Scale• X12= Availability of PSE Kit• X13= Availability of NHEd Materials• X14= Availability of Medicine Kit
Based on above Input Variables Projects are rated as:
Very Good=63, Good= 71, Poor=16,Total=150


Appraisal of Output/Outcomes of Programme
• Y1 = Observation Score of AWCs• Y2 = CLCT Score (Child Learning Competency Test): • Y3 = % of Children under Normal category• Y4 = % of Grade I Children• Y5 = % of Grade II Children• Y6 = % of Grade III and IV Children• Y7 = No. of 3-6 years children attending PSE classes• Y8 = No. of fully immunized (children)• Y9 = No. of fully immunized (pregnant women)• Y10= Health check-up (No. of Women)• Y11= Health check-up (No. of children)• Y12= No. of NHEd sessions organized• Y13= No. of Referral Cases• Y14= No. of Pass out Children admitted to Primary School
Based on above Output/Outcome Variables Projects are rated as:
Very Good=43, Good= 86, Poor=21 Total=150


Relationship Between Input, Output / Outcomes
< 35 (Poor)
35-45 (Good)
>45(Very Good)
Total
> 15 (Very Good)
4 30 29 63
10-15 (Good) 12 46 13 71
<10 (Poor) 5 10 1 16
Total 21 86 43 150
Output / Outcomes (No. of Projects)Output / Outcomes (No. of Projects)
In
pu
tIn
pu
t

GAP AREAS

Infrastructure
a) No toilet facility 60% AWCs
b) Unsatisfactory toilet facility 17 % AWCs
c) Non availability of Sub- 57% AWCs
Centres
d) Non-availability of
- Indoor Space 48.5 % AWCs
- Outdoor 48.7 % AWCs
e) No separate space for 50.0 % AWCs
Storage
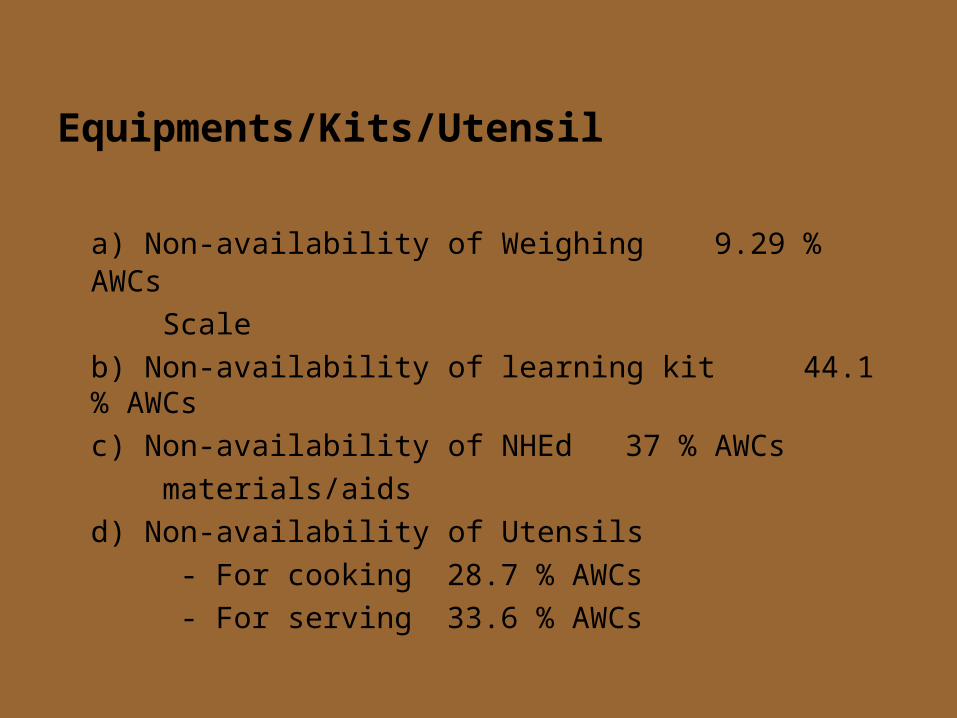
Equipments/Kits/Utensil
a) Non-availability of Weighing 9.29 % AWCs
Scale
b) Non-availability of learning kit 44.1 % AWCs
c) Non-availability of NHEd 37 % AWCs
materials/aids
d) Non-availability of Utensils
- For cooking 28.7 % AWCs
- For serving 33.6 % AWCs

Coordination
Non-existence of Coordination Committee at Project level
Rural 20.0 %
Tribal 28.1 %
Urban 12.5 %

Services
i) SN a) Disruption in supply (Av.days) 41.3 days
b) Supply of Spoiled Food items 6.3 % projects
c) LBW Babies29.0 %

Health Check-up
a) Health Check-up not done
- 0-3 years children 43.9 %
- 3-6 years children 53.3 %
b) Children not receiving IFA Tablets
- 6 months - 3 years 40.4 %
- 3 - 6 years 35.2 %
c) Children not immunized fully34.0 %

THANK YOU


