© copyright statement
TRANSCRIPT

© Copyright Statement All rights reserved. All material in this document is, unless otherwise stated, the property of FPC International, Inc. Copyright and other intellectual property laws protect these materials. Reproduction or retransmission of the materials, in whole or in part, in any manner, without the prior written consent of the copyright holder, is a violation of copyright law.

/
EVALUATION OF FPC-l® FUEL PERFORMANCECATALYST
AT
MARITRANS OPERATING PARTNERS
REPORT PREPARED BYUHI CORPORATION
PROVO, UTAH
November 26, 1987
Report No. M lOOR

FPC-l @ is a registered trademark of URI Corporation, Provo, Utah. Thematerial contained in this packet is privileged information and has copyright©privileges. This material is not to be copied without the express writtenconsent o( URI Corporation.

CONTENTS
INTRODUCTION
BACKGROUND
TEST PROCEDURE
TECHNICAL APPROACH
DISCUSSION
RESULTS
CREW OBSERVATIONS
CONCLUSION
APPENDICES
• Memorandum Report, FPC-l Phase II Field Test
• Summary of FPC-l Testing by Maritrans OperatingPartners
• Figure 1 Carbon Mass Balance Formula
• Specification Sheet for Sun Electric SGA-9000
Introduction
A test program to determine the effect of the FPC-l @ combustion catalyst on fuelconsumption in marine propulsion engines was conducted by Maritrans Operating Partners,Inc., Philadelphia, Pa. The test was conducted under the direction of Mr. Bob Corney, EastCoast Fleet Marine Engineer for Maritrans.
Changes in fuel consumption were determined with an indirect carbon balance technique(based on the measurement of the carbon containing exhaust gases under steady-stateengine conditions) and a direct measurement of gallons consumed per hour (gph) fromengine room fuel flow meters and on-board computers.
Baciq:round
• Recognized Laboratory Testing
At the time of the Maritrans test program, FPC-l @ had already undergone extensive enginetesting in independent EPA recognized and university laboratories. Test procedures werealso recognized and included the EPA - Federal Test Procedures (FTP) and Highway FuelEconomy test (HFET) , a steady-state engine dynamometer test at Brigham YoungUniversity, and Society of Automotive Engineer (SAE) road tests (SAE-J1082). Laboratorytests and road tests, in both gasoline and diesel powered vehicles, demonstrated FPC-lcreates fuel savings of 2% to 10% in light duty passenger vehicles.
• Customer Testing in the Field
Further, over a decade of field testing, primarily in high-speed, heavy duty diesel engines,substantiated the laboratory and road test results. These tests suggest an average in-useimprovement in fuel economy greater than that predicted by the EPA and SAE tests.
Long term field studies have also shown the catalyst inhibits the formation of hard carbondeposits on pistons, valves and in the ring zone area, while gradually removing pre-existingcarbon deposits. Oil analysis further documents reduced soot contamination and enginewear after long term FPC-l @ catalyst use, all of which indicates reduced maintenance andoperating costs.
Because of the substantial data indicating the potential for reduced operating costs, afterseveral meetings with Mr. Bob Corney, Marine Engineer for Maritrans, it was decided toconduct several studies to determine the effect of FPC-l @ on large medium speed enginespowering the Maritrans fleet.

Test Procedures
The two fuel consumption tests utilized by Maritrans and DHI involved the measurementof exhaust gases with a non-dispersive infrared (NDIR) analyzer, and volumetric flow ratemeasurement using in line flow meters and on-board computers while the main enginesoperated under steady-state conditions.
The carbon balance method produces a value of fuel consumption with FPC-1~ relative toa baseline value established with the same engine. Engine speed and load were duplicatedfrom test to test, and measurements of exhaust and ambient temperature are made toperform appropriate corrections.
Exhaust concentrations of C02, CO, HC, and 02 are measured by a Sun ElectricCorporation (SGA-9000). The SGA-9000 is approved by the EPA for engine emissionsanalysis and is calibrated internally using calibration gases recommended by Sun Electric.Specifications for the analyzer are given in Appendices.
Technical Approach
The test fleet selected by Mr. Corney for the FPC-1@test included the tugboats Pathfinder,Voyager II, and Mariner. The tugboats are powered by main engines representative of theentire Maritrans fleet (Cat 399, EMD 567BC and 645E engines).
The tugboats were loaded by pushing at a fixed engine speed (rpm) against the dock.Engine rpm and load where maintained throughout the approximately 45 minute pertugboat test allowing for the accumulation of many data points.
The SGA-9000 exhaust analyzer and the thermocouple instrumentation were calibrated anda leak test on the sampling hose and connections was performed while the main engine(s)for each tugboat were then brought up to stable operating temperature as indicated byengine water and oil temperature, engine manifold, and exhaust temperature.
Baseline data for the carbon balance method consisted of multiple measurements of CO2,
CO, unburned hydrocarbons (measured as CH4), O2, and exhaust temperature, made at 60second intervals for each engine tested. Fuel flow rate was measured from the on-boardcomputer at similar intervals. Engine speed and cylinder temperatures were recorded atregular intervals from both the engine room and the on-board computer.
Throughout the entire fuel consumption test, an internal self-calibration of the exhaustanalyzer was performed after every two sets of measurements to correct instrument drift.A new analyzer exhaust gas filter was installed before both the baseline and treated fuel testseries.
After baseline data accumulation, the fuel tanks on-board the three tugboats were treatedwith FPC-1@at a 1:5000mixing ratio. The tugs then operated as normal, treating fuel as

it was taken on (except the Voyager II), for approximately one month. Then the tests wererepeated at identical engine rpm and load, under nearly identical ambient conditions. Allinstrument calibrations, readings and procedures were reproduced and verified by Mr.Corney who observed every aspect of the test.
Discussion
The indirect or carbon mass balance method uses the exhaust gas concentrations measuredduring the tests to calculate "engine performance factors"which relate the fuel consumptionof the treated fuel to the baseline fuel (untreated). The calculations are based on theassumption that the fuel characteristics, engine operating conditions and test conditions areessentially the same throughout the test. The carbon balance equations are found in theappendices.
Tables 4, 5 and 6 show the calculated volume fractions, average molecular weight of thegases, and the engine performance factors for the treated and baseline test on the starboardmain engine for the Pathfinder and Voyager II, and for the single Mariner main engine.
The Pathfinder is powered by Cat 399 engines. The Voyager II is powered by twin EMD567-BC main engines. The Mariner is powered by a single EMD 645E main engine. Theraw data are summarized in Table 1 for the Pathfinder, Table 2 for the Voyager II, andTable 3 for the Mariner.
The Voyager II was first tested with FPC-l @ treated fuel as the baseline. The catalyst wasthen removed from the system by diluting the treated fuel in the tanks with large volumesof untreated fuel. The other boats were first tested with untreated fuel, and later with FPC-1@ treated fuel.
Results
The changes in fuel consumption for each main engine are shown below by test method.
Tugboat Test Method % Change Fuel Consumption
PathfinderPathfinderVoyager IIVoyager IIMarinerMariner
carbon balancedirect gphcarbon balancedirect gphcarbon balancedirect gph
-1.53%-3.64%-3.95%-5.36%-8.20%-5.00%

Crew Observations
Mr. Corney and several of the chief engineers noted marked reduction in engine smokingafter a few weeks of FPC-l@ treatment. Air boxes on the EMD's were cleaner. Cylindertemperatures, documented from engine room log entries and during the treated fuelsegment of the test, were also reduced (see attached bulletin in appendices).
Conclusions
The following conclusions may be made from the results of the FPC-l@ evaluationconducted for Maritrans Operating Partners, Inc.:
• The addition of FPC-l @to the diesel fuel used by the Maritranstest fleet resulted in fuel economy improvements ranging from1.53% to 8.20%, using the carbon balance test method todetermine fuel consumption.
• The addition of FPC-l @to the diesel fuel used by the Maritranstest fleet resulted in fuel economy improvements ranging from3.64% to 5.36%, using the direct measurement in gallons perhour from the on-board computers and flow meters.
• The addition of FPC-l @appeared to have a positive effectupon exhaust smoking and cylinder temperature.

Control
Treated
0.0144%
0.0117%
Table 1
Summary of Exhaust and GPH MeasurementsDuring Baseline and Treated Fuel Tests
From the Pathfinder
22.2ppm
21.5ppm
1100 RPM
9.68% 7.90%
Exh. Temp. GPH
858.40 of 55
882.50 OF 53
Control
Treated
0.01%
0.01%
9.54% 8.73%
Table 2
Summary of Exhaust and GPH MeasurementsDuring Baseline and Treated Fuel Tests
From the Voyager II
16.4ppm
23.28ppm
600 RPM
4.61% 15.41%
4.42% 14.54%
Exh. Temp. GPH
573.6 OF 56
572.0 OF 53

Table 3
Summary of Exhaust and GPH MeasurementsDuring Baseline and Treated Fuel Tests
From the Mariner
750 RPM
Exh. Temp. GPH
Control 0.068% 22.2ppm 6.92% 11.84% 898.0 OF 60
Treated 0.039% 21.7ppm 6.42% 13.70% 867.9 of 57
Table 4
Volume Fractions for the Pathfinder Data
Control Treated
VfCO 0.000144 0.000117
VfHC 0.0000222 0.0000215
VfC02 0.0968 0.0954
Vf02 0.0790 0.0873
Total Molecular Weight and Performance Factors
Mwtl 29.8661 Mwt2 29.8768
pn 65391.0347 pC2 66390.7381
% Change in P.F. = 66390.7381 - 65391.0347 = 999.7034
999.703465391.0347 x 100 = + 1.53%
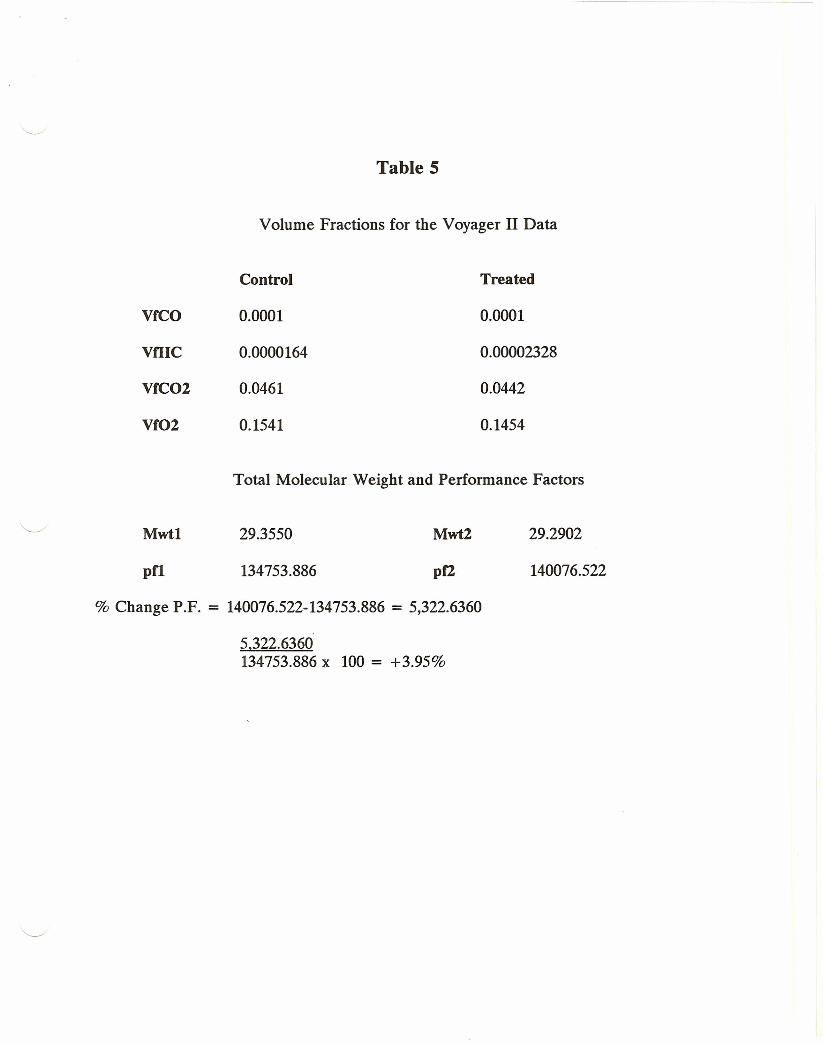
Table 5
Volume Fractions for the Voyager II Data
Control Treated
vrco 0.0001 0.0001
vmc 0.0000164 0.00002328
VfC02 0.0461 0.0442
vroz 0.1541 0.1454
Total Molecular Weight and Performance Factors
Mwtl 29.3550 Mwt2 29.2902
pn 134753.886 pf2 140076.522
% Change P.F. = 140076.522-134753.886 = 5,322.6360
5,322.6360134753.886 x 100 = +3.95%

Table 6
Volume Fractions for the Mariner Data
Control Treated
VfCO 0.00068 0.00039
vmc 0.0000222 0.0000217
VfC02 0.0692 0.0642
Vf02 0.1184 0.137
Total Molecular Weight and Performance Factors
Mwtl 29.5821 Mwt2 29.5765
pn 89800.9148 pC2 97156.2840
% Change P.F. = 97156.2840-89800.9148 = 7,355.3692
7,355.369289800.9148 x 100 = +8.20%

Appendices

Memorandum Report
TO: Mr. Carl Dittrich and Mr. Bob Corney
FROM: S. Craig Flinders, URI Corporation
DATE: June 15, 1988
RE: FPC-l @ Phase II Field Test Results
Gentlemen:
Enclosed are the results of the Phase II carbon balance/volumetric flow rate fuelconsumption test recently conducted with three Maritrans tugboats. Table 1 belowsummarizes the fuel economy improvements created by the addition of FPC-l @ to the fuel.
Table 1
Phase II Carbon Balance Fuel Consumption Comparison
Tugboat Base Fuel PF FPC-l® PF %Improvement
Ranger 67,097.00 70,596.00 5.2
Voyager II 116,955.00 121,659.00 4.0
Schuylkill 69,359.00 70,900.00 2.2
The Voyager II was the only tugboat equipped with an temperature compensating, in-lineflow meter and on-board computer. The volumetric fuel consumption (vfe) in gallons perhour (gph) was taken at regular intervals throughout the entire test (approx. 45 minutestotal running time). Table 2 gives the average rate of fuel usage with and without FPC-lfuel treatment while pushing against the dock at an engine speed of 650 rpm.

Table 2
Phase II Volumetric Fuel Consumption Comparison (Voyager II only, Starboard Main)
Base Fuel Ave. GPH FPC-l® Ave. GPH % Improvement
73 69 5.5
The results of the Phase II test are consistent with those already demonstrated during PhaseI testing with the Voyager II, Pathfinder, and Mariner tabled below (Tables 3 and 4).
Table 3
Phase I Carbon Balance Fuel Consumption Comparison
Tugboat Base Fuel PF FPC-l@ PF %Improvement
Pathfinder 65,391.00 66,391.00 1.5
Voyager II 134,754.00 140,077.00 4.0
Mariner 89,801.00 97,156.00 8.2
Table 4
Phase I Volumetric Fuel Consumption Comparison
Tugboat Base Fuel Ave. GPH FPC-l@ Ave. GPH % Improvement
Pathfinder 55 53 3.6
Voyager II 56 53 5.4
Mariner 60 57 5.0
The tests on six tugboats representing all major engine types used in the fleet (Cat 398,399,Cummins KTA 2300, EMD 567 and 645) using both the carbon balance (cb) and vfcmeasurement from on-board computers indicate an average fuel consumption reduction withFPC-l@ fuel treatment of 4.5%. The average reduction is nearly 5% if the volumetric fuelconsumption test is considered alone.

Crew observations include reduced engine smoking (the Voyager, Mariner and Ranger),lower cylinder temperature (20 to 50 degrees F, the Mariner and Schuylkill) and cleanedair boxes (the Voyager).
Engine life and comparative engine carbon residue buildup studies done by Mr. Corneyhave also been positive. As you know, the Cat 399 main engines powering the Defenderwere rebuilt some time ago. These engines had never exceeded 12,000 hours of operationbefore exhaust valves began to fail. After re-power and FPC-1@fuel treatment, the 399mains achieved over 17,000hours of operation before exhaust valve failure occurred. Thisincrease in valve life is likely due to FPC-1@'sability to remove existing carbon deposits andprevent future buildup, as well as to the demonstrated reductions in cylinder temperatures.
I trust this information is satisfactory. I look forward to our next meeting to discuss theresults of the Maritrans FPC-1@Test Program, and the possible system wide use of FPC-l.In the meantime, if you have any questions, please feel free to call.

SUMMARY OF FPC-l® TESTING BY MARITRANSOPERATING PARTNERS
Under the direction of Mr. Bob Corney, East Coast Fleet Marine Engineer for MaritransOperating Partners, tugboats powered by typical marine propulsion diesel engines were tested with andwithout FPC-1 @ fuel catalyst. Fuels savings averaging 4.5% were documented during both carbon balance(indirect method) and specific fuel consumption tests (using in-line flow meters and on-board computers)while main engines were operated under steady-state engine conditions. In addition to the measuredreduction in fuel consumption, several engines smoked less and experienced cylinder temperaturereductions of 20 to 50 degrees F while running on FPC-1 @ treated fuel.
Table 1. 1987 Test
Percentage Fuel Savings
Carbon Balance Boat Fuel Monitor Crew Observations
Voyager II (EMD 567)Pathfinder (Cat 399)Mariner (EMD 645)
3.951.538.20
5.363.645.00
Less smokeCleaned fuel tanksLess smokeLower cylinder temp.
Table 2. 1988 Test
Percentage Fuel Savings
Carbon Balance Boat Fuel Monitor Crew Observations
Voyager II (EMD 567)Ranger (Cat 398)Schuylkill (Cummins 2300)
4.025.202.22
5.48 Cleaned air boxes
Less SmokeLower cylinder temp.
Average Fuel Savings: 4.18% 4.87%
The composite fuel savings for all ten tests is 4.5%. Maritrans consumes approximately 10,000,000gallons of marine diesel per year. Assuming a fuel cost of $7,000,000 a year, the use of FPC-1 will reduceMaritrans fuel cost approx. $120,000.
With lowered cylinder temperatures, engine life can be extended. Reduced engine smoking equates toreduced engine hard carbon accumulation and cleaner motor oil. Reduced engine smoking also helpsalleviate environment pressures.

Bid Specifications
• %02:0-25%• PPM HC: 0-2000 ppm• %CO: 0-10%• %C02:O-20%• Warm-up: 15 minutes @ 70°-110°F: 20 minutes @ 35°F• System Accuracy: HC, CO, O2 & CO2:±3% of full scale• Temperature Range: 35°-110°F operating; _20° to 130°F storage.• Relative Humidity: Up to 85% non-condensing• Interference Effects: Less than ± 10 ppm HC or ± .05% CO of full scale (lowrange)• System Response Time: 7 seconds for 90% response of full scale• Drift: +3% of full scale in one hour• Repeatability: Less than +2% of full scale• Power: 115V ac, 60Hz @ 4.5A• Circuit Protection: Circuit breaker protection provided for the main console andinfrared• Dimensions: 15" Lx7-3/4" H x 19" D (38 x 19 x 38cm)• Shipping Weight: 65 lbs. (45kg) without stand• Construction: All metal housing painted with blue textured enamel, resistant to oil,gasoline, chipping and scratching
Accessories
• Stainless steel exhaust pickup probe and 25 feet (8m) of sample hose• Literature including Operator's Manual and quick Reference Guide• RS-232 printer port• Extra Filters• Leak check adapter• Anti-Dilution probe adapters (optional)• Calibration gas bottle and mounting (optional)

Figure 1Carbon Mass Balance Formula
Assumptions: CSHl5 and SG = 0.78Time is ConstantLoad is Constant
Mwtpflpf2PFlPF2
TFSGVF
Equations:
= Molecular Weight= Calculated Performance Factor (baseline)= Calculated Performance Factor (treated)= Performance Factor (adjusted for baseline exhaust mass)= Performance Factor (adjusted for treated exhaust mass)= Temperature CF)= Flow (exhaust CFM)= Specific Gravity= Volume Fraction
VFC02VF02VFHCVFCO
= "reading" + 100= "reading" + 100= "reading" + 1,000,000= "reading" + 100
Mwt = (VFHC) (86) + (VFCO)(28) + (VFC02)(44) + (VF02)(32) + [(l-VFHC-VFCO-VF O2-VFC02) (28)]
pf, or PF 1 = 2952.3 x Mwt89(VFHC)+ 13.89(VFCO)+ 13.89(VFC02)
PFl or PF2 = pf x (T+460)F
Fuel Economy:Percent Increase (or Decrease) = x 100