ª «È cs¤Í s€¦ · usaid oceans and fisheries partnership page 4 of 106 value chain...
TRANSCRIPT

Value Chain
Assessment
B I T U N G , I N D O N E S I A
The USAID Oceans and Fisheries
Partnership (USAID Oceans)
July 2017

Submission to USAID Oceans: January 20, 2017 Contract Number: AID-486-C-15-00001 Contract Period: September 28, 2016 to January 20, 2017 Submitted by:
Andrew Bassford, Chief Executive Officer PT Konsultasi Investasi Kelautan (Marine Change) Gd. Epicentrum Walk Office Unit K-501 Jl. HR. Rasuna Said Karet Kuningan Jakarta 12910 Indonesia Telephone: +62 812 993 72898 Email: [email protected]
This document was produced for review and approval by the United States Agency for International Development/ Regional Development Mission for Asia (USAID/RDMA).

USAID Oceans and Fisheries Partnership Page 2 of 106 Value Chain Assessment: Bitung, Indonesia
Contents
Executive Summary ..................................................................... 9
PART I. VALUE CHAIN ASSESSMENT ................................ 12
1. Overview of tuna in Indonesia ......................................... 12
1.1 Gear types used in tuna fisheries ........................................................................................... 13
1.2 A fishery in transformation ...................................................................................................... 13
1.3 Future fishery strategy to improve food security and reduce IUU ................................ 15
1.4 Industry organization ................................................................................................................. 15
2. Indonesia tuna export and market overview ................ 17
2.1 Indonesian exports overview .................................................................................................. 17
2.2 Tuna export markets................................................................................................................. 20 2.2.1 Import market requirements and specifications ................................................................. 20 2.2.2 Thailand ........................................................................................................................................ 21 2.2.3 United States of America ......................................................................................................... 22 2.2.4 European Union .......................................................................................................................... 24 2.2.5 Japan .............................................................................................................................................. 26 2.2.6 Australia ........................................................................................................................................ 27 2.2.7 Middle-East and other export markets ................................................................................. 27
2.3 Market campaigns and key industry platforms .................................................................... 28
2.4 Bitung overview .......................................................................................................................... 29
2.5 Bitung tuna value chain ............................................................................................................. 30 2.5.1 Fishing vessels .............................................................................................................................. 31 2.5.2 Fishers ........................................................................................................................................... 31 2.5.3 Traders ......................................................................................................................................... 32 2.5.4 Processors.................................................................................................................................... 32 2.5.5 Canneries ..................................................................................................................................... 33
2.6 Bitung export markets and patterns of trade ...................................................................... 34 2.6.1 Changing dynamics in Bitung ................................................................................................... 35 2.6.2 Impressions of traceability by key stakeholders in Bitung ................................................ 40 2.6.3 Bottlenecks to implement a catch documentation and traceability program .............. 44
PART II. TRACEABILITY ......................................................... 46
3. The importance of traceability and current trends ..... 46
2.7 Landscape review of current traceability programs and vendors in use in Indonesia....................................................................................................................................... 46
2.7.1 Data collection and traceability programs past and present ........................................... 47

USAID Oceans and Fisheries Partnership Page 3 of 106 Value Chain Assessment: Bitung, Indonesia
2.7.2 Traceability vendors with programs in Indonesia ............................................................... 52 2.7.3 Other programs supporting traceability ............................................................................... 57 2.7.4 Programs not yet active in tuna in Indonesia ...................................................................... 58
2.8 Importance of traceability ........................................................................................................ 58 2.8.1 Customer preferences .............................................................................................................. 61
2.9 Performance issues for Indonesia to meet market requirements on traceability ...... 62
PART III. SOCIO-ECONOMIC SURVEY ............................. 65
4. Findings from the socio-economic survey ..................... 65
4.1 Survey results .............................................................................................................................. 65 2.9.1 Fishing distance, duration ......................................................................................................... 66 2.9.2 Age, education, family relations .............................................................................................. 66 2.9.3 Healthcare, assets and material wealth ................................................................................. 67 2.9.4 Mobile phone use, information needs, connectivity at sea .............................................. 67 2.9.5 Safety, fishing technology, working relations and contracts ............................................ 68 2.9.6 Alternative livelihoods, monthly expenses and annual income ....................................... 68 2.9.7 Government subsidies and access to credit ........................................................................ 69 2.9.8 Fishery status, management, sustainability views ................................................................ 69 2.9.9 Markets and sales contracts .................................................................................................... 70
2.10 Analysis of the results regarding the CDT implementation............................................. 70 2.10.1 Relative wealth, education and contracts ............................................................................. 70 2.10.2 Subsidies, financial ability .......................................................................................................... 71 2.10.3 Annual non-fishing days ............................................................................................................ 71 2.10.4 Healthcare, insurance and memberships .............................................................................. 72 2.10.5 Communications and information needs/channels ............................................................. 72 2.10.6 Markets, sustainability and traceability .................................................................................. 73
PART IV. Value proposition assessment .............................. 73
5. Value propositon assessment ........................................... 73
5.1 Introduction and methodology ............................................................................................... 73
3.2 Potential users of electronic CDTS ....................................................................................... 74
3.3 Challenges for adoption of electronic CDTS ...................................................................... 75
3.4 Barriers to adopt electronic CDT technology .................................................................... 78
3.5 End-user profiles......................................................................................................................... 79 3.5.1 Fisher user profile ...................................................................................................................... 79 3.5.2 Trader user profile..................................................................................................................... 80 3.5.3 Processor user profile ............................................................................................................... 81 3.5.4 Cannery user profile .................................................................................................................. 81
3.6 Potential incentives for adoption of an electronic CDTS ................................................ 82

USAID Oceans and Fisheries Partnership Page 4 of 106 Value Chain Assessment: Bitung, Indonesia
PART V. THE FUTURE OF TRACEBILITY FOR INDONESIA ................................................................................................ 85
6. Development of the Indonesian Coastal Tuna Sustainability Alliance ......................................................... 85
6.1 Alliance members ....................................................................................................................... 86 6.1.1 Assosiasi Perikanan Pole & Line Handline Indonesia (A2PHI) ......................................... 86 6.1.2 International Pole and Line Foundation (IPNLF) ................................................................ 88 6.1.3 Masyarakat dan Perikanan Indonesia - ‘Happy people many fish’ ................................... 88
6.2 Alliance suitability ....................................................................................................................... 89
6.3 Alliance strategy ......................................................................................................................... 91 6.3.1 Theory of change ....................................................................................................................... 91 6.3.2 Vision ............................................................................................................................................. 92 6.3.3 Mission .......................................................................................................................................... 92 6.3.4 Proposed roles of each organization within the strategy ................................................. 92 6.3.5 Objectives .................................................................................................................................... 93
6.4 Suggestions for further consideration ................................................................................... 93 6.4.1 Other members within the Alliance ...................................................................................... 93
7. The development of a pilot electronic CDTS .............. 94
7.1 Force field analysis ..................................................................................................................... 94
7.2 Value chain roadmap with improvements ............................................................................ 95
7.3 Service bundling for traceability .............................................................................................. 96
8. Conclusion ............................................................................ 98
Appendices ................................................................................ 100
A1. Selected Indonesian Fisheries Figures ................................................................................ 100
A2. Fisheries’ Contribution to Indonesia’s Economy ............................................................. 100
A3. Comparison of Performance Fishery Exports, 2014-2015 ............................................ 101
A4. Key Bitung Fisheries Data ..................................................................................................... 101
A5. Bitung Fish Exports Figures ................................................................................................... 103

USAID Oceans and Fisheries Partnership Page 5 of 106 Value Chain Assessment: Bitung, Indonesia
List of Figures
Figure 1: Indonesian Tuna Landings & Annual Growth ........................................................................ 12 Figure 2: Summary of recent fisheries regulations aimed at Fishery Policy Reform ............................ 14 Figure 3: Summary of tuna industry associations in Indonesia ............................................................. 16 Figure 4: Main exporters of tuna globally by value (US$ Million) between 2010-2015 ....................... 17 Figure 5: Key tuna export figures for Indonesia (2010-2015) .............................................................. 17 Figure 6: Tuna and skipjack exports by type of product and volume (ton) in 2014 and 2015 ............ 18 Figure 7: Tuna and skipjack exports by type of product and value (in US$) in 2014 and 2015 .......... 18 Figure 8: Top 10 export countries by volume (ton) in 2014 and 2015 ............................................... 19 Figure 9: Top 10 export countries by value (US$) in 2014 and 2015 .................................................. 19 Figure 10: Indonesia Tuna Exports 2015 .............................................................................................. 20 Figure 11: World imports of canned tuna and cooked loins 2014 -2015 ............................................ 20 Figure 12: Market Campaigns and Key Industry Platforms .................................................................. 28 Figure 13: Total fish production in Bitung Oceanic Fishing Port (2011-2016) ..................................... 30 Figure 14: Production volume by gear type in Bitung (2011-2016) ........ Error! Bookmark not defined. Figure 15: Key actors in the Bitung tuna value chain ............................................................................ 30 Figure 16: Vessels registered in Bitung by size ..................................................................................... 31 Figure 17: Vessels registered in Bitung by gear type ............................... Error! Bookmark not defined. Figure 18: People engaged in fisheries in the Bitung Fishing Port ........................................................ 31 Figure 19: Installed capacity and production of processors in Bitung .................................................. 32 Figure 20: Tons of raw materials processed by processor types in Bitung ......................................... 33 Figure 21: Registered Canneries in Bitung, 2016 .................................................................................. 33 Figure 22: Performance of the tuna canning industry in Bitung .............. Error! Bookmark not defined. Figure 23: Top 5 export markets for tuna from Bitung 2011-2015 ........ Error! Bookmark not defined. Figure 24: Top 5 export markets for tuna from Bitung in 2015 .......................................................... 34 Figure 25: Impressions of selected canneries in Bitung ........................................................................ 36 Figure 26: Impressions from selected tuna processors in Bitung ........................................................ 38 Figure 27: Examples of import documentation and traceability requirements from UK and U.S. buyers .................................................................................................................................................... 40 Figure 28: Impressions about traceability by selected canneries in Bitung .......................................... 40 Figure 29: Impressions about traceability by selected processors ...................................................... 42 Figure 30: Impressions about traceability by informal trader ............................................................... 43 Figure 31: Summary of bottlenecks to catch documentation and traceability ..................................... 44 Figure 32: Traceability Supply Chain ..................................................................................................... 46 Figure 33: Overview of different traceability programs and vendors that are active in Indonesia ...... 47 Figure 34: I-Fish Features ......................................................................... Error! Bookmark not defined. Figure 35: Summary of the types of licenses for fishery businesses ..................................................... 59 Figure 36: Comparison of the different CDT standards versus current government requirements in Indonesia ............................................................................................................................................... 60 Figure 37: Challenges of current data collection at point of harvest, based on key informant interviews .............................................................................................................................................. 63 Figure 38: Crew interviewed, per gear type ......................................................................................... 65 Figure 39: Average crew number, distance travelled and fishing days per trip for the different gear types ...................................................................................................................................................... 66

USAID Oceans and Fisheries Partnership Page 6 of 106 Value Chain Assessment: Bitung, Indonesia
Figure 40: Level of education of the different groups of respondents ................................................. 66 Figure 41: The stock status opinions of the different gear types ............ Error! Bookmark not defined. Figure 42: Comparison of different vessel monthly earning to minimum wage. .................................. 71 Figure 43: CDT user profiles ................................................................................................................ 74 Figure 44: Parameters for defining user impacts .................................................................................. 75 Figure 45: Snapshot of challenges to adoption of electronic CDTS .................................................... 75 Figure 46: Analysis of the impact of parameters on different users ..................................................... 76 Figure 47: Value Proposition Design ..................................................................................................... 79 Figure 48: Likelihood of influence of benefits on the adoption of electronic CDTS by users ............. 82 Figure 49: Types of incentives that could influence different electronic CDTS users ......................... 83 Figure 50: ICTSA SWOT Analysis ........................................................................................................ 90 Figure 51: Theory of Change ................................................................................................................ 91 Figure 52: Roles for Other ICTSA Member Organizations ................................................................. 93 Figure 53: Force Field Analysis for Electronic CDTS in Bitung ............................................................ 94 Figure 54: Value chain map with traceability improvements for each user .......................................... 96 Figure 55: Services included in the pilot with managing institutions .................................................... 97

USAID Oceans and Fisheries Partnership Page 7 of 106 Value Chain Assessment: Bitung, Indonesia
Acronyms and Abbreviations ACDS ASEAN Catch Documentation Scheme ASEAN Association of Southeast Asian Nations BFAR Bureau of Fisheries and Aquatic Resources CAGR Compound Annual Growth Rate CDTS Catch Documentation and Traceability System CITES Convention on International Trade in Endangered Species of Wild Fauna and Flora COC Chain of custody CT Coral Triangle CTI-CFF Coral Triangle Initiative on Coral Reefs, Fisheries and Food Security DKP Dinas Kelautan dan Perikanan (Department of Marine and Fisheries) DQA Data Quality Assurance DO Development Objective DOI U.S. Department of the Interior DOF Department of Fisheries EAFM Ecosystem Approach to Fisheries Management ECOFISH Ecosystems Improved for Sustainable Fisheries Project FAD Fish aggregating device FAO Food and Agriculture Organization of the United Nations FIS Fisheries Information System FIP Fishery Improvement Project FMA Fisheries Management Area GA Gender Analysis GUC Grants Under Contract IAD Institutional Analysis and Design ICT Information Communications Technology IOTC Indian Ocean Tuna Commission IUU Illegal, Unreported and Unregulated (fishing) IVV Independent Verification and Validation IR Intermediate Result KADIN Kamar Dagang dan Industri (Indonesian Chamber of Commerce and Industry) KKP Kementerian Kelautan dan Perikanan Republic Indonesia (Indonesian Ministry of Marine
Affairs and Fisheries) M&E Monitoring and Evaluation MIS Monitoring Information System MMAF Ministry of Marine Affairs and Fisheries MMPA Marine Mammal Protection Act MT metric tons NGO Non-governmental Organization NOAA National Oceanic and Atmospheric Administration OCC Oceans Consultative Committee PPP Public-Private Partnership RAFMS Rapid Appraisal of Fisheries Management System RFMOs Regional fisheries management organizations RPOA Regional Plan of Action SEA Sustainable Ecosystems Advanced Project SEAFDEC Southeast Asian Fisheries Development Center SFMP Sustainable Fisheries Management Plan SSME Sulu-Sulawesi Marine Ecoregion STTA Short Term Technical Assistance

USAID Oceans and Fisheries Partnership Page 8 of 106 Value Chain Assessment: Bitung, Indonesia
TAG Technical Advisory Group TNC The Nature Conservancy ToT Training of Trainers TWG Technical Working Group RPOA Regional Plan of Action RFMO Regional Fisheries Management Organization SEAFDEC Southeast Asian Fisheries Development Center TOC Theory of Change VCA Value Chain Assessment VMS Vessel Monitoring System USAID U.S. Agency for International Development USAID Oceans USAID Oceans and Fisheries Partnership Activity USG U.S. Government
USAID Oceans and Fisheries Partnership Page 9 of 106 Value Chain Assessment: Bitung, Indonesia
EXECUTIVE SUMMARY
Background
The USAID/Regional Development Mission for Asia’s (RDMA) Oceans and Fisheries Partnership (USAID Oceans) works to strengthen regional cooperation to combat illegal, unreported and unregulated (IUU) fishing and promote sustainable fisheries, in order to conserve marine biodiversity in the Asia-Pacific region. The objectives of USAID Oceans program are to: (i) develop a financially sustainable regional catch documentation and traceability system (CDTS) to combat IUU fishing and seafood fraud in areas where sustainable fisheries management plans (SFMP) are being applied; (ii) expand use of the CDTS to priority biodiversity areas in the Asia Pacific region; (iii) strengthen human and institutional capacity of regional organizations to conserve marine biodiversity through SFMPs, including actions to combat IUU fishing and seafood fraud; and (iv) enhance public-private partnerships (PPPs) to conserve biodiversity, promote sustainable fisheries management, and combat IUU fishing and seafood fraud. Indonesia plays an important role in the international tuna sector – it is considered the world’s largest producer of tuna and has the most abundant tuna fisheries in the world. However, due to rampant IUU fishing,
the country has incurred losses as high as US$3 billion per year.1 In late 2014, the Indonesian Government declared its intention to reshape the Indonesian fishery sector and harness the country’s potential as a leading maritime and fishing nation, setting in motion a reform process by developing a set of new regulations to eliminate IUU. To support the government’s efforts, is working to develop and implement a country-specific, financially sustainable CDTS, initially focused on a tuna pilot in the fishing port and processing hub of Bitung, in North Sulawesi. A functioning CDTS – able to electronically record key data elements for each critical tracking event from catch to export market, throughout all the steps of the value chain – is a crucial instrument for Indonesia’s fight against IUU fishing as it will prevent the commercialization of illegal products. However, many obstacles can hinder the successful implementation of a new CDTS. Tuna value chains are complex and are comprised of numerous actors that provide minimal value added while increasing the number of nodes through which fish pass between the first point of catch, to the processors, and through export.
Value Chain Assessment
USAID Oceans commissioned Marine Change, an advisory firm based in Indonesia that focuses on investments in the Asian marine sector that advance sustainable and financially-rewarding business opportunities, to conduct a rapid value chain assessment (VCA) of the tuna sector in Indonesia, focusing on Bitung. The objectives of the VCA are as follows:
• Map the critical actors in the value chain and identify the key end markets for tuna from Indonesia, both regional and international, with an emphasis on Bitung;
• Identify the CDT requirements of different stakeholders within the tuna industry in Indonesia, focusing on value chains linked to the USAID Oceans learning site at Bitung;
• Identify the various leverage points for CDT and fisheries management data collection and explore the business case for different actors through traceability and differentiation for further research;
• Identify the priority end-markets for Indonesian tuna, weighting the percentage of fish per origin, value per origin and identify current and future import market state traceability requirements that may impact/disrupt current trade flow; and
• Explore end-market requirements in the priority export markets and identify the perceived value (i.e. premium, preferred market access) of improved traceability of seafood products.
1 http://www.economist.com/news/asia/21637451-new-administration-path-prosperity-watery-one-fishing-trips

USAID Oceans and Fisheries Partnership Page 10 of 106 Value Chain Assessment: Bitung, Indonesia
Additionally, Marine Change developed a concept, strategy and joint work plan for three organizations to form the Indonesian Coastal Tuna Sustainability Alliance (ICTSA). Marine Change partnered with Masyaraket dan Perikanan Indonesia (MDPI) to conduct a socioeconomic survey of pole-and-line, handline and purse seine tuna fishers in Bitung to further understand their current socioeconomic condition, awareness about traceability, technology readiness and disposition for adopting new traceability solutions. Marine Change conducted a value proposition assessment to understand the needs of different traceability users, perceived bottlenecks and readiness for new technologies, and developed a proposed approach to engage two key tuna value chain actors, fishers and small scale traders.
Marine Change identified the main actors and stakeholders in tuna value chains from point of catch to final consumer, then used semi-quantitative interview techniques to further capture data and views at the main value chain transaction points. Subsequently, the team conducted extensive ‘on the ground’ interviews. Lastly, the team established positions on CDT drivers, progress and barriers by conducting desktop research and interviews concerning two separate activities: (i) the nature of external market for tuna products and their CDT requirements and (ii) current and emerging customer and preferences and trends. This document provides a comprehensive overview and detailed situational analysis of the tuna sector in Indonesia, with a focus on the Bitung Oceanic Port. It suggests actions that support USAID Ocean’s plans of developing an electronic CDTS to help ensure that fisheries resources from Southeast Asia are legally caught and properly labeled. The document is organized in five chapters:
A. Value chain assessment with an overview of the tuna sector in Indonesia identifying key export markets for Indonesian tuna products, import requirements related to food safety, anti-IUU efforts, an overview of three tuna catch methods in Bitung highlighting the key companies and actors, their relationships and their perceptions about traceability, and changes in Bitung resulting from fishery reform;
B. Traceability overview and landscape analysis of programs and vendors active in Indonesia, summary of traceability requirements and trends, bottlenecks and areas of concern for adopting traceability in the industry at Bitung and Indonesia in general;
C. Socioeconomic survey findings for tuna fishers in Bitung;
D. Value proposition assessment for users of an electronic catch documentation and traceability system; and
E. The future of traceability for Indonesia which includes a comprehensive overview of the Indonesian Coastal Tuna Sustainability Alliance, including its background, its members, analysis of the suitability of the alliance, and overview of the strategy of the alliance. This final chapter also describes a proposed pilot project to further USAID’s efforts to develop a CDTS in Indonesia.
Main Findings and Conclusions
A rapid assessment of the tuna value chain in Bitung revealed the following results:
• Due to fishery policy reform, Bitung experienced a production drop of 59% in 2015, causing important economic impacts in the region and changes in trading dynamics.
• Only 31% of tuna production from Bitung is exported, and not all tuna export markets require full value chain traceability. Buyers in the U.S., EU, and Australia, representing 13%, 11% and 3%, respectively, of the export volume of traded tuna in 2015, have an increasing preference for

USAID Oceans and Fisheries Partnership Page 11 of 106 Value Chain Assessment: Bitung, Indonesia
sustainable and traceable product, while other markets, which represent the majority of Indonesia
tuna’s exports, do not have a specific focus on traceability.2
• Among fishers in Bitung, there is low awareness of the term traceability, on-going traceability initiatives or the potential benefits of traceability to the fishery. There is limited evidence of premium prices paid by exporters, or specific product recognition for fully traceable Indonesian tuna products from Bitung, which discourages local actors from investing in traceability and discredits the notion that the supply chain rewards traceability.
• Currently, as required by different international buyers, value chain actors only comply with the government’s minimum catch documentation requirements, which are perceived as extremely cumbersome. This significantly undermined the government’s ability to gather all necessary data in an accurate manner.
A successful CDTS needs to be underpinned by innovative approaches that incentivize all actors in the tuna value chain to participate, rather than relying solely on assumed financial rewards from international markets. Coordination and collaboration among different stakeholders that are working to improve traceability in Indonesia, through the ICTSA, is also crucial to a successful CDTS, as the member can capitalize on their joint capacity and expertise, minimize duplicative activities and maximize impact. Further, using finance as a catalyst will help drive traceability in a scalable and commercial manner. While this approach has not yet been tested in Indonesia, there is momentum among leading financial intuitions, the government and the Alliance members to test an approach that ‘bundles’ a suite of services, including financial services and traceability, under one joint initiative.
2 UN Comtrade (11 April 2016) (292 HS 6 digit). Preliminary figures for 2015.

USAID Oceans and Fisheries Partnership Page 12 of 106 Value Chain Assessment: Bitung, Indonesia
PART I. VALUE CHAIN ASSESSMENT
1. OVERVIEW OF TUNA IN INDONESIA The fisheries sector plays an important role in Indonesia’s economy, contributing 8.28% of the GDP in 2015.3 Indonesia’s fisheries provide vital support to coastal economic development, creating employment on vessels and in onshore processing facilities, as well as many tens of thousands of indirect jobs – with over 643,105 households directly engaged in fishing activities across the archipelago.4 Indonesia is the world’s ninth largest exporter of fish – shipping over 1.1 million tons of seafood products annually with a US$3.97 billion export value.5 Overall, the fisheries sector has increased in volume by 20% between 2010 and 2015.6
Dynamics of the tuna sector in Indonesia Indonesia is the world’s largest producer of tuna. Indonesia’s waters harbor four commercially important tuna species: yellowfin (Thunnus albacares), big-eye (Thunnus obesus), albacore (Thunnus alalunga) and skipjack (Katsuwormisus pelamis). Indonesia landed over 1.32 million tons of tuna in 2014, more than any other country in the world.7 Japan, the world’s second largest tuna producer, landed over 430,000 tons in 2014.8 In 2015, tuna landings represented 22% of the overall fish catches in Indonesia (6 million tons).9 Eastern little tuna (Euthynnys affinis), which is typically not exported, comprised of 39% of the total tuna landings in 2015, followed by skipjack (38%) and other tuna species (24%) (see Figure 1).
Figure 1: Indonesian Tuna Landings & Annual Growth
3 Wanted: An Integrated Fisheries Policy. Tempo, April 4-10, 2016. Figures include seaweed. 4 Badan Pusat Statistik Indonesia, 2014 figures. https://www.bps.go.id/linkTabelStatis/view/id/1709 5 UN Comtrade. 11 April 2016. 6 Marine and Fisheries in Figures 2015. Center for Data, Statistics and Information. Indonesia. 7 Marine and Fisheries in Figures 2015. Center for Data, Statistics and Information. Indonesia. 8 Netting Billions: A Global Valuation of Tuna. The Pew Charitable Trusts. May 2016. 9 Marine and Fisheries in Figures 2015. Center for Data, Statistics and Information. Indonesia.
Snapshot: Indonesian fishers • Indonesia ranked 2nd globally for wild
capture landings (6.4% of global catch) • 12,800 coastal villages depend on the
fishery as main livelihood provider • 64 million Indonesians live within 10 km
of the coast line • 95% are considered small scale or
artisanal fishers • 40% of fishers are below 39 years of
age

USAID Oceans and Fisheries Partnership Page 13 of 106 Value Chain Assessment: Bitung, Indonesia
The performance of Indonesia’s fisheries has fluctuated between 2010 and 2015. The annual growth rate of tuna landings has outperformed the growth rate of other capture fisheries; tuna landings reported a compound annual growth rate (CAGR) of 8.3%, while the overall catch fisheries reported a CAGR of 3.8% for the 2010-2015 period.10 While the fishery sector had been growing steadily between 2010 and 2014, the growth rate slowed in 2015 to a 0.5% increase in the overall capture fisheries.11 There is no documented information to substantiate a particular reason for this slow-down in growth. However, it is believed that this decline is partly due to the government’s recent regulations establishing sustainable limits for fisheries and focusing on value added over catch volumes.
1.1 Gear types used in tuna fisheries
There are several gear types commonly used to catch tuna in Indonesia: longline, purse seine, pole-and-line, hand-line, troll, and gillnet. In 2014, approximately 51% of tuna was caught via pole-and-line, hand-line and long line; while 31% of tuna was caught via purse seine. Until 2014, pole-and-line catches were declining. The one-by-one method is less productive and more costly than other commercial tuna catch methods. Tuna caught by purse-seine increased in Indonesia between 2010 and 2014 because this catch method, netting the complete school, is more productive. Furthermore, until 2014, the government prioritized industrial purse-seine fisheries to increase landed volumes and drive export value.
However, as noted, the current government supports more sustainable, localized fisheries, the distribution of fisheries resources across many stakeholders within the sector, and an increase in value over volume. Data from recent meetings, not yet published, indicate up to a 61% decrease in tuna caught via purse-seine between 2014 and 2015 within the Western Central Pacific Statistical Area, as a result of a reduction in transshipments, removal of foreign fleet, and the limited number of fishing licenses to vessels over 150 GT. The regulations have favored smaller-scale commercial fisheries such as pole-and-line and hand-line, which have experienced a 14% and 157% increase, respectively.12
1.2 A fishery in transformation
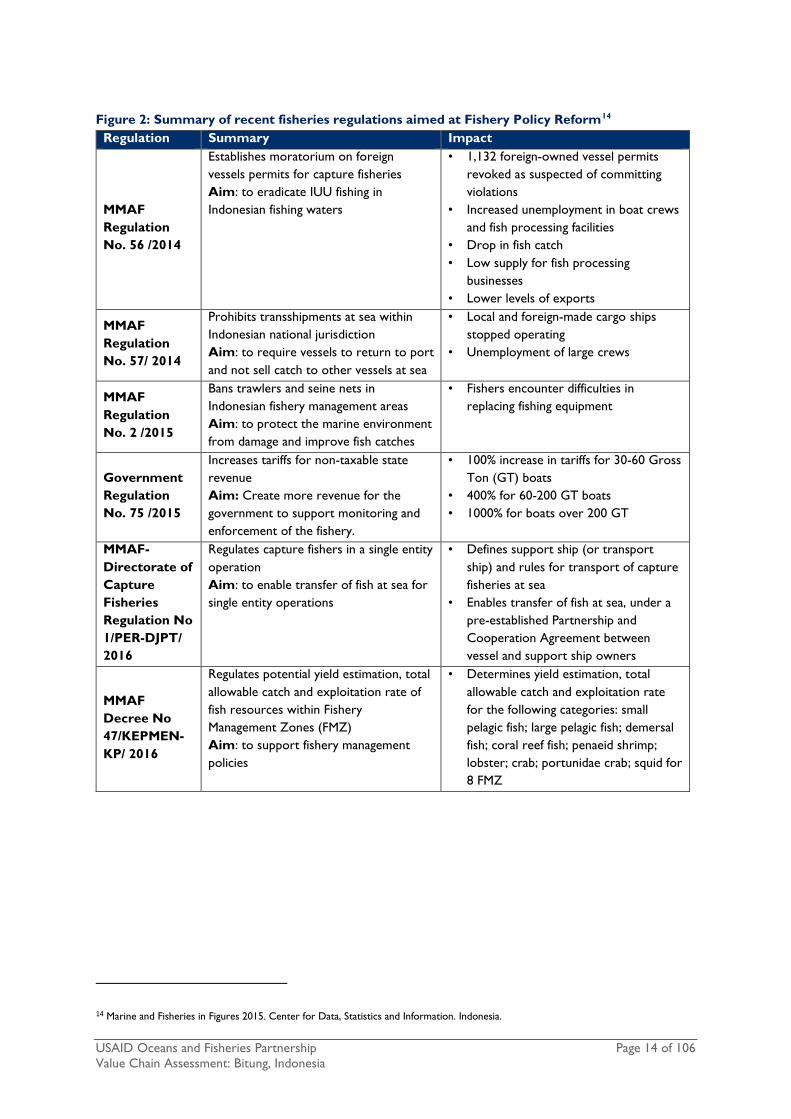
Indonesia’s president, Joko ‘Jokowi’ Widodo considers transforming the fisheries sector to be within his mandate. In support of the president’s vision, since the appointment of Minister of Marine Affairs and Fisheries Susi Pudjiastuti in November 2014, the Ministry of Marine and Fisheries Affairs (MMAF) has made significant strides to tackle the key challenges facing Indonesia’s fisheries. One of the key challenges identified was addressing IUU fishing, which costs the country an estimated US$3 billion annually.13 MMAF issued regulations aimed at Fishery Policy Reform in 2014, seeking to end IUU fishing and support the long-term sustainability and economic prosperity of the fisheries sector (Figure 2).
10 Marine and Fisheries in Figures 2015. Center for Data, Statistics and Information. Indonesia. 11 Ibid. 12 WCPFC Statistical Area preliminary unpublished figures. 13 Indonesia’s marine policy, fishing trips, for the new administration, the path to prosperity is a watery one. The Economist. December 30, 2014.
“We have to work as hard as possible to turn
Indonesia into a maritime nation once again.
Oceans, seas, straits and bays are the future of our civilization.
We’ve turned our back on the seas, oceans, straits and bays for far too long. It is time for us to realize ‘jalesveva jayamahe,’ ‘in the ocean we triumph,’ a motto upheld by our ancestors in
the past.”
President Jokowi in his inauguration speech on October 20, 2014
USAID Oceans and Fisheries Partnership Page 14 of 106 Value Chain Assessment: Bitung, Indonesia
Figure 2: Summary of recent fisheries regulations aimed at Fishery Policy Reform14
Regulation Summary Impact
MMAF Regulation No. 56 /2014
Establishes moratorium on foreign vessels permits for capture fisheries Aim: to eradicate IUU fishing in Indonesian fishing waters
• 1,132 foreign-owned vessel permits revoked as suspected of committing violations
• Increased unemployment in boat crews and fish processing facilities
• Drop in fish catch • Low supply for fish processing
businesses • Lower levels of exports
MMAF Regulation No. 57/ 2014
Prohibits transshipments at sea within Indonesian national jurisdiction Aim: to require vessels to return to port and not sell catch to other vessels at sea
• Local and foreign-made cargo ships stopped operating
• Unemployment of large crews
MMAF Regulation No. 2 /2015
Bans trawlers and seine nets in Indonesian fishery management areas Aim: to protect the marine environment from damage and improve fish catches
• Fishers encounter difficulties in replacing fishing equipment
Government Regulation No. 75 /2015
Increases tariffs for non-taxable state revenue Aim: Create more revenue for the government to support monitoring and enforcement of the fishery.
• 100% increase in tariffs for 30-60 Gross Ton (GT) boats
• 400% for 60-200 GT boats • 1000% for boats over 200 GT
MMAF-Directorate of Capture Fisheries Regulation No 1/PER-DJPT/ 2016
Regulates capture fishers in a single entity operation Aim: to enable transfer of fish at sea for single entity operations
• Defines support ship (or transport ship) and rules for transport of capture fisheries at sea
• Enables transfer of fish at sea, under a pre-established Partnership and Cooperation Agreement between vessel and support ship owners
MMAF Decree No 47/KEPMEN-KP/ 2016
Regulates potential yield estimation, total allowable catch and exploitation rate of fish resources within Fishery Management Zones (FMZ) Aim: to support fishery management policies
• Determines yield estimation, total allowable catch and exploitation rate for the following categories: small pelagic fish; large pelagic fish; demersal fish; coral reef fish; penaeid shrimp; lobster; crab; portunidae crab; squid for 8 FMZ
14 Marine and Fisheries in Figures 2015. Center for Data, Statistics and Information. Indonesia.

USAID Oceans and Fisheries Partnership Page 15 of 106 Value Chain Assessment: Bitung, Indonesia
1.3 Future fishery strategy to improve food security and reduce IUU
MMAF’s 2016-2017 strategy is to continue combatting IUU, develop policies to guarantee a sustainable fishery, increase investments in the fisheries sector, and increase exports of fisheries products to reach a 12% contribution of the country’s GDP. MMAF targets 2.4% production growth for captured fish (to 6.5 million tons in 2016) and 8.72% production growth for cultivated fish (4.7 million tons). The government aims to boost exports efficiently by focusing on improving conditions and infrastructure for coastal fishing communities in remote areas of the country.15
The central government earmarked IDR 13.8 trillion (US$1.02 billion) in the 2016 State Budget for MMAF, an increase of 31.4% from the previous year’s allocation.16 The 2017 budget has been reduced to IDR 9.27 trillion (US$690 million) to align the budget with MMAF’s ability to spend effectively and conduct meeting and capacity/outreach exercises more effectively.
1.4 Industry organization
Indonesia’s tuna industry is comprised of numerous actors that play different roles throughout the supply chain, including fishers, small- and large-scale traders, processors, exporters and industry associations. Tuna supply chains are often complex, with many different nodes between small-scale fishers in remote islands to industrial processors.
Processors, large-scale traders and larger industrial fleets have traditionally been the most influential actors in the industry, influencing its overall direction. Industry associations have typically played an important role in the tuna sector: aggregating the sector, liaising between member companies and national and local governments, and representing the interest of the members to other key stakeholders, such as MMAF, international buyers and foreign investors. There are five tuna industry associations in Indonesia (see Figure 3). These associations aggregate companies involved in the trade and processing of tuna, but they cannot receive direct investments from, or directly invest in member companies. The Indonesian Chamber of Commerce and Industry (KADIN) is the main coordinating organization for industry associations in Indonesia. KADIN’s focus is to represent the industry to government and support foreign investments in Indonesia.
15 Rencana Strategis Pembangunan Kelautan dan Perikanan 2010-2014. http://kkp.go.id/wp-content/uploads/2016/07/Rencana-Strategis-2015-2019.jpg 16 Analysis: Opportunities in maritime and fisheries sectors. Jakarta Post. http://www.thejakartapost.com/news/2015/08/05/analysis-opportunities-maritime-and-fisheries-sectors.html
“I would like to build a strong foundation for the
coastal fishing communities; they are one of the
biggest stakeholders in the field of maritime affairs
and fisheries. What we want to achieve basically, is
to make every island in Indonesia to be self-
sufficient in their needs. For example, in Papua
instead of obtaining fisheries products from Jakarta
or Java, Papua should use its own sources for its
own fisheries needs; there is so much fish in
Papua.”
Statement from Susi Pudjiastuti, Minister of Marine Affairs and Fisheries, in the media.
Ministry of Marine Affairs and Fisheries’ Vision:
To achieve sovereign, independent and sustainable management of marine and fisheries resources for the people’s prosperity.
Pillars:
1. Sovereignty | 2. Sustainability | 3. Prosperity

USAID Oceans and Fisheries Partnership Page 16 of 106 Value Chain Assessment: Bitung, Indonesia
Figure 3: Summary of tuna industry associations in Indonesia
Summary
Indonesian Tuna Association (ASTUIN)
• Established in 1997 • Supports and aggregates a common voice for the purse seine and long-line tuna industry,
representing the industry at national events and Government discussion groups. • Represents 28 members, including:
• 168 vessel owners • 111fish processing plants • 121importers • 672 vessels • 244 vessels registered with regional fisheries management organizations
(RFMOs) 232 vessels registered with the Indian Ocean Tuna Commission (IOTC) 12 vessels registered with the Commission for the Conservation of
Southern Bluefin Tuna (CCSBT) Indonesian Tuna Longline Association (ATLI)
• Established in 2003; separated from ASTUIN • Supports sustainability issues and participates in research and training for mitigation of sea
turtle interactions with fisheries • 61 member companies, primarily (70%) fishing for tuna • 705 vessels using including longline (87%), purse seine, trawl fishing, gill net, pole and line,
bottom longline, squid fishing and shrimp trawl gear • 11,000 vessel crew members • 2,000 on-shore laborers • Members represent:
o IDR 1 trillion in investment value o 18,000 tons of production o US$83 million export value
Indonesian Pole & Line and Handline Fisheries Association (AP2HI)
• Established in 2014 • Seeks to facilitate market expansion by encouraging members to engage in market focused
programs such as fishery improvement programs (FIPs) and Marine Stewardship Council (MSC) certification
• 26 member companies, including canning, processing and upstream fisheries, particularly small-scale tuna fleet, pole-and-line and hand-line fisheries
• 997 vessels • 9,626 employees
Indonesia Tuna Commission (KTI)
• Established in 2015 on an ad-hoc basis by Ministry Decree No. 79/Kepmen-KP/2015 • Delivers input on the national tuna fisheries governance in the country • Members consist of tuna stakeholders including government, business, and academia
Asosiasi Perikanan Tangkap Terpadu (ASPERTADU) (Integrated Capture Fisheries Association)
• Established in 2011; separated from ATLI • A special focus for Southern Bluefin Tuna with the purpose of reporting catches and
quotas to the Commission for the Conservation of Southern Bluefin Tuna • Representing 335 vessels fishing in Indian Ocean and Indonesia Archipelagic Waters and
exporting fresh fish to Japan
Source: www.ap2hi.org, www.astuin.org, www.kadin-indonesia.or.id, Key Informant interviews

USAID Oceans and Fisheries Partnership Page 17 of 106 Value Chain Assessment: Bitung, Indonesia
2. INDONESIA TUNA EXPORT AND MARKET OVERVIEW
Globally, Indonesia is currently the number six tuna exporting country by value. Thailand and Ecuador are number one and two, while Spain, Taiwan and China, with their large, distant water fishing fleets and limited processing are numbers three, four and five. In contrast, the majority of Indonesia’s export value comes from fish caught within its own EEZ.
Figure 4: Main exporters of tuna globally by value (US$ Million) between 2010-2015
Top Tuna exporting countries 2010 2011 2012 2013 2014* 2015** Growth (%) 2010-2014
1. Thailand 1,913 2,345 2,765 2,705 2,453 2,050 7.25
2. Ecuador 379 631 876 1,096 1,065 761 31.85
3. Spain 704 950 1,142 1,170 1,051 869 11.87
4. Taiwan 741 921 1,158 993 911 748 6.85
5. China 234 410 498 685 841 910 39.29
6. Indonesia 383 499 702 706 618 584 14.74
7. Rep. of Korea 353 377 591 536 553 461 14.37
8. Seychelles 292 332 359 486 446 - 12.25
9. Vietnam 208 260 416 439 445 - 22.95
10. Philippines 335 292 411 660 416 286 12.86
11. Others 2,533 3,001 3,967 4,011 4,044 - 13.15
Total (US$ Million) 8,077 10,017 12,886 13,487 12,844 13.14 *preliminary data ** very preliminary data Source: UN Comtrade 2016
2.1 Indonesian exports overview
Indonesia landed over 1.3 million tons of tuna in 2015, a 1.6% increase from the previous year.17 However, of that 1.3 million tons, only 142,023 tons (13%) was exported, a 31% decrease from the previous year. The value of tuna exports has also experienced 29% decrease, from US$692.28 million in 2014 to US$491.98 million.18 Indonesia has an installed fish canning capacity of 630,000 tons and a production level of 315,000 tons.19 Tuna represents 20% of overall installed capacity (100,000 tons), with production levels below the industry standard of 30%, attributed to the reduction in the recent landings of purse-seine sector. The 2015 purse-seine landings only represented 26% of 2013 purse-seine landings (see Figure 5).
Figure 5: Key tuna export figures for Indonesia (2010-2015) Tuna exports 2010 2011 2012 2013 2014 2015
Volume (ton) 122,450 141,774 201,159 209,072 206,553 142,023
% change in volume
16% 42% 4% -1% -31%
Value (million US$) 383.23 498.59 749.99 764.79 692.28 491.98 % change in value
30% 50% 2% -9% -29%
Source: MMAF presentation to Bali Tuna Forum (ICTBF) May 2016.
17 Marine and Fisheries in Figures 2015. Center for Data, Statistics and Information. Indonesia. 18 Marine and Fisheries in Figures 2015. Center for Data, Statistics and Information. Indonesia. 19 MMAF cold storage installed capacity figures.
USAID Oceans and Fisheries Partnership Page 18 of 106 Value Chain Assessment: Bitung, Indonesia
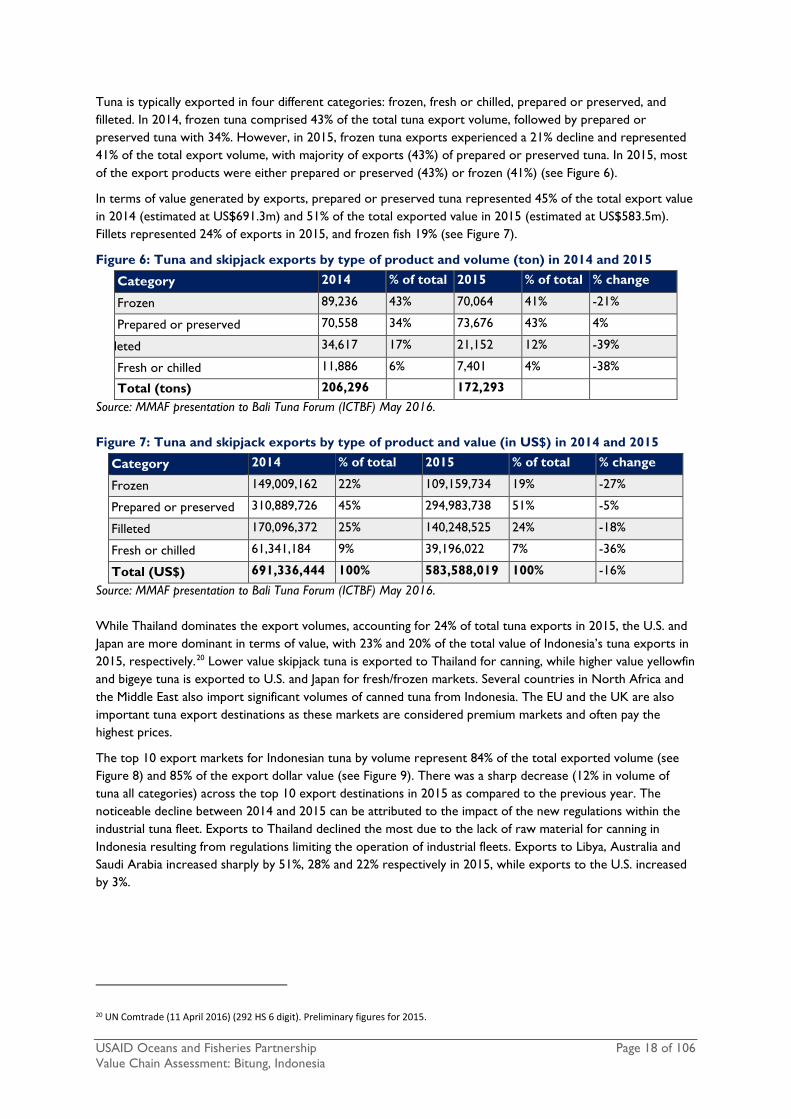
Tuna is typically exported in four different categories: frozen, fresh or chilled, prepared or preserved, and filleted. In 2014, frozen tuna comprised 43% of the total tuna export volume, followed by prepared or preserved tuna with 34%. However, in 2015, frozen tuna exports experienced a 21% decline and represented 41% of the total export volume, with majority of exports (43%) of prepared or preserved tuna. In 2015, most of the export products were either prepared or preserved (43%) or frozen (41%) (see Figure 6).
In terms of value generated by exports, prepared or preserved tuna represented 45% of the total export value in 2014 (estimated at US$691.3m) and 51% of the total exported value in 2015 (estimated at US$583.5m). Fillets represented 24% of exports in 2015, and frozen fish 19% (see Figure 7).
Figure 6: Tuna and skipjack exports by type of product and volume (ton) in 2014 and 2015
Category 2014 % of total 2015 % of total % change
Frozen 89,236 43% 70,064 41% -21%
Prepared or preserved 70,558 34% 73,676 43% 4%
leted 34,617 17% 21,152 12% -39%
Fresh or chilled 11,886 6% 7,401 4% -38%
Total (tons) 206,296 172,293
Source: MMAF presentation to Bali Tuna Forum (ICTBF) May 2016. Figure 7: Tuna and skipjack exports by type of product and value (in US$) in 2014 and 2015
Category 2014 % of total 2015 % of total % change
Frozen 149,009,162 22% 109,159,734 19% -27%
Prepared or preserved 310,889,726 45% 294,983,738 51% -5%
Filleted 170,096,372 25% 140,248,525 24% -18%
Fresh or chilled 61,341,184 9% 39,196,022 7% -36%
Total (US$) 691,336,444 100% 583,588,019 100% -16%
Source: MMAF presentation to Bali Tuna Forum (ICTBF) May 2016. While Thailand dominates the export volumes, accounting for 24% of total tuna exports in 2015, the U.S. and Japan are more dominant in terms of value, with 23% and 20% of the total value of Indonesia’s tuna exports in 2015, respectively.20 Lower value skipjack tuna is exported to Thailand for canning, while higher value yellowfin and bigeye tuna is exported to U.S. and Japan for fresh/frozen markets. Several countries in North Africa and the Middle East also import significant volumes of canned tuna from Indonesia. The EU and the UK are also important tuna export destinations as these markets are considered premium markets and often pay the highest prices.
The top 10 export markets for Indonesian tuna by volume represent 84% of the total exported volume (see Figure 8) and 85% of the export dollar value (see Figure 9). There was a sharp decrease (12% in volume of tuna all categories) across the top 10 export destinations in 2015 as compared to the previous year. The noticeable decline between 2014 and 2015 can be attributed to the impact of the new regulations within the industrial tuna fleet. Exports to Thailand declined the most due to the lack of raw material for canning in Indonesia resulting from regulations limiting the operation of industrial fleets. Exports to Libya, Australia and Saudi Arabia increased sharply by 51%, 28% and 22% respectively in 2015, while exports to the U.S. increased by 3%.
20 UN Comtrade (11 April 2016) (292 HS 6 digit). Preliminary figures for 2015.

USAID Oceans and Fisheries Partnership Page 19 of 106 Value Chain Assessment: Bitung, Indonesia
Figure 8: Top 10 export countries by volume (ton) in 2014 and 2015
Destination country 2014 % of total 2015 % of total % change
Thailand 60,459 29% 41,008 24% -32%
Japan 35,823 17% 35,539 21% -1%
United States 21,980 11% 22,622 13% 3%
Saudi Arabia 11,605 6% 14,106 8% 22%
United Kingdom 9,078 4% 6,648 4% -27%
Italy 6,403 3% 6,292 4% -2%
Australia 4,531 2% 5,789 3% 28%
Spain 6,577 3% 5,615 3% -15%
Iran 5,268 3% 4,180 2% -21%
Libya 2,067 1% 3,111 2% 51%
Total top 10 163,790 79% 144,909 84% -12% Source: UN Comtrade 2016 Tuna export values also fell by 11% from 2014 to 2015, with the highest value drop in Thai and Japan exports, while U.S., Australian, Libya and Saudi Arabian exports rose in value.
Figure 9: Top 10 export countries by value (US$) in 2014 and 2015
Destination country 2014 % of total 2015 % of total % change
United States 128,297,284 19% 135,162,841 23% 5%
Japan 141,900,574 21% 114,390,122 20% -19%
Thailand 97,677,500 14% 68,528,331 12% -30%
Saudi Arabia 55,164,548 8% 61,095,290 10% 11%
Australia 27,655,728 4% 29,656,328 5% 7%
Italy 37,416,770 5% 29,585,525 5% -21%
United Kingdom 35,690,527 5% 29,585,525 5% -17%
Spain 16,849,226 2% 13,553,309 2% -20%
Libya 7,983,885 1% 10,879,685 2% 36%
Iran 8,023,876 1% 5,722,807 1% -29%
Total top 10 556,659,918 81% 498,159,763 85% -11% Source: UN Comtrade 2016 Indonesia has an import to export trade surplus for tuna (2014), while neighboring countries all have a tuna trade deficit with regards to volume. Indonesia’s exports are nearly evenly split between frozen product (often whole-round) and prepared product, although the export value of frozen products was only 37% of the value of prepared product. The government aspires to increase value-added products and reduce exports of lower value unprocessed products. About 89% of Indonesia’s imported fish was imported as frozen product for further value adding, with only 9% of tuna imports in the form of finished product.

USAID Oceans and Fisheries Partnership Page 20 of 106 Value Chain Assessment: Bitung, Indonesia
Figure 10: Indonesia Tuna Exports 2015
Source: UN Comtrade 2016
2.2 Tuna export markets
Global imports of canned tuna and cooked loin witnessed a 6% decrease between 2014 and 2015, dominated by the EU and U.S. (see Figure 11).
Figure 11: World imports of canned tuna and cooked loins 2014 -2015
Country 2014 M/T 2015 M/T Diff % MT
1. EU 676,685 667,220 -1%
2. U.S. 236,869 203,094 -14%
3. Egypt 55.114 70.740 28%
4. Australia 61.361 59,997 -2%
5. Japan 54.256 54.538 1%
6. Canada 33.563 35.386 5%
7. Saudi-Arabia 38.217 33.572 -12%
8. Thailand 25.53 29.91 17%
9. Colombia 30.223 29.409 -3%
10. Libya 39.182 24.419 -38%
11. Others 352.881 279.882 7%
Total 1.603.881 1.502.147 -6% Source: Atuna 2016
2.2.1 Import market requirements and specifications
Most countries have specific legal requirements when it comes to the import documentation and product specifications needed for tuna. As a basic requirement, almost all imports require a health certificate issued by

USAID Oceans and Fisheries Partnership Page 21 of 106 Value Chain Assessment: Bitung, Indonesia
a competent authority at the country of origin. Additionally, the importer must pre-register and receive national approval/authorization. Different markets have varying minimum/maximum level requirements for pesticides, chemicals, heavy metals and microbials, ban entirely the use of certain chemicals and preservatives used in production.
Depending on national laws and how they relate to the producer countries, market requirements for documents and certificates related to conservation (such as the Marine Mammal Protection A (MMPA) in the Eastern Pacific, the Convention on International Trade in Endangered Species of Wild Fauna and Flora (CITES) listed species (which do not yet include tuna), or other measures such as reducing IUU fishing) will vary. In addition to the market country’s legal requirements, buyers, processors and retailers may have their own requirements relating to consumer preferences and market trends.
In general, the emerging markets such as the Middle East, Africa, China and others have fewer demands, beyond the basic hygiene requirements, for traceability and sustainability. They may, however, have strict product requirements purposes, for example, halal certification and halal-approved supply chain.
Most countries require product labels in their language that include the ingredients/raw material, date of expiry, weight, origin and producer.
2.2.2 Thailand
Thailand is the fifth-largest importer of fish and seafood in Asia (2014). In 2013, Thailand imported fish and seafood from 118 countries, 10.4% supplied by the United States, followed by Taiwan (9.9%), China (9.4%), Indonesia (7.6%), and Japan (6.7%).21
Thailand is the largest importer of tuna from Indonesia with a 24% share in 2015 or 41,007 MT, and the third most valuable export market. As part of the ASEAN free trade area there are no tariffs for imports from Indonesia. The tuna exported from Indonesia to Thailand is mainly frozen round tuna or cooked loins destined for tuna canning, primarily for processing and re-export out of Thailand. Volumes of Indonesian tuna exported to Thailand decreased between 2014 and 2015, with 2015 only representing 67% of 2014 traded volumes, attributable to the reduction of the purse seine caught fish in Indonesia. Although volume decreased, value per KG/unit increased by 9%, highlighting a switch from procurement of lower-value skipjack caught via purse-seine towards procurement of higher-value sustainable tuna caught via pole-and-line, which receives a 10% premium, coupled with a move to purchasing more semi-processed over whole-round.
Thailand is the world’s largest tuna canning hub, with the largest exports of canned tuna/pre-cooked loins in the world at 561,365 MT in 2015, a 6% decrease in production and 12% decrease in value from 2014.22 Demand for traditional canned products in some of the major markets in the EU and the U.S. has slowed (see Figure 11). Thailand’s major markets are the EU (through Thai Union Europe, formerly MW Brands with brands such as John West, retailer owned brands, etc.) and the U.S. (Chicken of the Sea and retail owned brands), Japan, and Australia with a combined share of approximately 50% of the total exports. In addition, Thailand exports to many Middle-Eastern, African and other markets, including ASEAN, with another 50% share of the production sent to those areas.
Import requirements
Importation of live, non-living or product of aquatic animals into Thailand must follow the following regulations 1) Fisheries Act, B.E. 2490; 2) Animal Epidemic Act, B.E 2499; 3) Food Act, B.E. 2522;4) Wildlife
21http://www.agr.gc.ca/eng/industry-markets-and-trade/statistics-and-market-information/agriculture-and-food-market-information-by-region/asia/market-intelligence/inside-thailand-the-fish-and-seafood-trade/?id=1433861767469 22 http://www.atuna.com/index.php/en/trade/trade-statistics#.Vbn68vmqpBc

USAID Oceans and Fisheries Partnership Page 22 of 106 Value Chain Assessment: Bitung, Indonesia
Preservation and Protection Act, B.E. 2535; 5). Animal Feed Quality Control Act, B.E. 2525 and Additional B.E.2542; and any other related Acts.23
For tuna, specifically, import requirements in include Import Certificate (for yellowfin tuna) from Department of Fisheries to protect against dolphin catch by using purse seine net in the eastern tropical Pacific Ocean (ETPO), health certificate or approved health document for aquatic animal carcass stating the disease-free status as stated in the list (original copy) issued from the authorized agency of the original country, and a request form for food import (in case of food products). For food manufacturers, a copy of the Food Production Permit from the Ministry of Public Health is required (only for the first application), as well as a copy of the import permit or order permit of food into Thailand from the Ministry of Public Health (only for the first application).Some Thai processors also require the national catch certificates issued by the government or the EU catch certificate issued by the flag state if the product is destined for re-export to the EU.
2.2.3 United States of America
The U.S. is world’s second largest seafood importing country with US$20,317 billion of seafood in value imported in 2014.24 It is also the second largest tuna importer in the world. In 2014 imports of fresh and frozen tuna were 166,272 tons, down 19.7% from 2013. Indonesia is the leading exporter of fresh tuna products to U.S. in volume.
The value of fresh and frozen tuna imports decreased by 11% to US$951 million between 2013 and 2014. Imports of canned tuna were 155,193 tons, down 12.4% from 2013 (see also Figure 11 for 2014-2015 canned tuna and cooked loins volume data). The value of canned tuna imports also decreased, dropping US$94.4 million (12.4 %) from 2013.25 This trend follows a falling per-capita seafood consumption in recent years, which reached the lowest levels since the 1980s in 2014 at 14.6 pounds, but slightly increasing to 15.5 pounds in 2015.26 Canned tuna consumption has also been decreasing, while fresh tuna consumption, due to the increased popularity of sushi style seafood, has increased slightly by 2.3% year on year (2014-2015).27
In the first quarter of 2016, imports of whole/dressed fresh and frozen yellowfin and frozen tuna fillets increased. More than 6,000 MT of frozen tuna fillets were imported during January-March 2016 (+1.6%). Supplies increased from the Philippines, Vietnam, Sri Lanka, Thailand, and the Maldives, but declined from Indonesia, the leading exporter.28
The canned market is split between two products, skipjack (or “light meat” or “chunk tuna”) and albacore (or “white meat”) for which the U.S. consumer has a specific preference. There are three labels that dominate the market place for canned tuna, Chicken of the Sea (Thai Union), Bumble Bee, and Starkist (DongWon), as well as many smaller private labels with the different retailers.
Indonesian tuna exports to the U.S. have been increasing over the last three years; between 2014-2015 there was a consistent 9% growth in both volume and value. The U.S. is the only main market showing both volume and value growth, attributed mainly to the demand for high valued hand-line yellow-fin tuna.
Import requirements
The U.S. seafood imports are regulated by the Food and Drug Administration (FDA), the National Marine Fisheries Service (NMFS) and the Fish and Wildlife service (FWS). The FDA conducts foreign country
23 www.bch.cbd.int/database/attachment/?id=11656 24 https://www.statista.com/statistics/268266/top-importers-of-fish-and-fishery-products/ 25 http://www.st.nmfs.noaa.gov/Assets/commercial/trade/Trade2014.pdf 26 http://peninsulaclarion.com/news/2016-11-06/american-seafood-consumption-stays-the-course 27 http://www.atuna.com/index.php/en/2-news/2878-eating-out-americans-get-more-tuna-on-their-plates?highlight=WyJ1cyIsInVzJyIsInVzJ3MiLCIndXMiLCJ1cycsIiwic3VzaGkiLCJ1cyBzdXNoaSJd 28 http://www.fao.org/in-action/globefish/market-reports/resource-detail/en/c/358022/

USAID Oceans and Fisheries Partnership Page 23 of 106 Value Chain Assessment: Bitung, Indonesia
assessments to ensure all approved producers come from countries able to meet food safety (HACCP) requirements. All producers wanting to export to the U.S. must pre-register with the FDA in order to get a customs clearance code and provide pre-notice of all imports under the Bioterrorism Act.29
The FDA also has strict regulations that require that correct names be used for imports and interstate sales, and that the market name, list of ingredients and the correct filling requirements (for processed products) be on the label.30 Once the product is cleared at customs, it is free for inter-state trade as long as labelling requirements are met.
For tuna products, a dolphin safe declaration on the label is required by the Dolphin Protection Consumer Information Act, part of the MMPA. Tuna companies around the world adhere to the standards on a voluntary basis, verified by the non-governmental organization Earth Island Institute, based in Berkeley, California. The Inter-American Tropical Tuna Commission has promoted an alternative Dolphin Safe label, but, due to pressure given to the market by the Earth Island Institute, these standards are largely confined to Latin America and not currently accepted to the U.S. market (yellowfin tuna from eastern Pacific harvested by purse seine is under embargo).31
In addition, there are specific tuna tracking and verification guidelines for all products, including:
a) A completed National Oceanic and Atmospheric Administration (NOAA) Form 370, including applicable Captain and International Dolphin Conservation Program-member nation certifications, must be submitted to U.S. Customs and Border Protection at the time of, or in advance of, importation via the Automated Commercial Environment (ACE) system;
b) An International Fisheries Trade Permit (IFTP)32 ((since September 2016); and
c) NOAA 370 form with applicable Harmonized Tariff Schedule numbers.33
Future demands and market trends
The U.S. market for imported tuna has been shrinking both due to an ongoing slowing in consumer demand and a rise in domestic tuna production. Domestic production hit a seven-year high in 2015 with 180,000 MT produced by domestic packers in California and American Samoa.34 However, TriMarine is closing its American Samoa processing and canning plant in December 2016, which may result in a reduction in domestic production and a rise in imports.
In addition, a recent trend in the U.S. market is increased sales of canned tuna products marketed as “chunk light” and made of bonito and frigate tunas (Euthynnus affinis and Auxis thazard species) to1200 MT in 2016, an increase of 60%. Sales of the traditional “chunk light” products of skipjack tuna have been further harmed, impacting the Thailand packers. China has been the largest exporter of the new product with 70% market share, followed by Philippines and Vietnam. The U.S. legislation allows this labelling and also has a lower tariff for these species of tuna ((4%) than for skipjack (12%). Given bonito is also a cheaper raw material, this makes the product attractive for the market35 and likely a permanent competitor for traditional skipjack products unless regulators step in. The downside of this trend is that the consumer is being given a cheaper product also labelled as “chunk light, which may undermine existing sustainability and traceability efforts in skipjack fisheries.
29 http://www.fda.gov/Food/GuidanceRegulation/ImportsExports/Importing/ucm2006836.htm 30 http://www.fda.gov/food/guidanceregulation/guidancedocumentsregulatoryinformation/seafood/ucm419606.htm 31 http://www.nmfs.noaa.gov/pr/dolphinsafe/importation_2.htm 32 http://www.nmfs.noaa.gov/ia/slider_stories/2016/07/iftpapplicantsltr.pdf 33 http://www.nmfs.noaa.gov/pr/dolphinsafe/importation_2.htm 34 http://www.atuna.com/index.php/en/2-news/5295-domestic-us-canned-production-hits-7-year-high 35 http://www.atuna.com/index.php/en/2-news/5251-unstoppable-expansion-of-us-fake-tuna-market

USAID Oceans and Fisheries Partnership Page 24 of 106 Value Chain Assessment: Bitung, Indonesia
2.2.4 European Union
The EU is the largest importer of seafood in the world, with 13.8 million MT of import valued at over US$48.7 billion in 2014.36 Imports of tuna and tuna-like species (including swordfish) were nearly 700,000 tons in 2014, worth Euro 2.5 billion. The majority (73%) is processed tuna: canned (80%) and cooked loins (20%).37 The total canned and cooked tuna imports in 2015 were 667,220 tons, with largest imports from Ecuador (26%), Mauritius and Seychelles. Demand for tuna is also supplied by the domestic tuna fishing and aquaculture industry (26%), either landing in Spain or France directly (temperate species), or by their subsidiaries in the Indian Ocean (Seychelles and Mauritius), Atlantic (Ghana) and Pacific Oceans (Ecuador) (for tropical tuna), which are counted as imports.
The average per-capita consumption of all tuna in 2012 in the EU was 2.5kg, with canned tuna consumption representing 2kg of the total amount. However, consumption varies between markets. The largest canned tuna markets are Spain and the UK according to their large populations and consumption preferences. Traditionally two different canned products, lower value skipjack and higher value yellowfin, are preferred by some markets like Italy (usually in olive oil instead of brine or lower quality oil). Now the EU market also has further product differentiation according to sustainability and fishing gears. Tuna products from pole-and-line and Fish Aggregating Device (FAD)-free vessels (Pacifical, MSC) are in high demand, especially with North and West European retailers.
The EU canned tuna market has been decreasing since 2011, reflecting a decline in consumption in several key countries, mainly Spain and Italy.38 The first quarter of 2016, however, saw a 6% increase compared to the prior year due to a 1% increase in imports from Ecuador, which recently concluded a long-term duty free access to EU. During this period, imports of canned and processed tuna increased from Thailand by 4%, from the Seychelles by 20% and from Ghana by 21%.
Among the top ten extra-EU suppliers (2015), volumes declined from Mauritius (3%), China (40%), the Philippines (42%) and Vietnam (20%). Canned and processed tuna imports, primarily cooked loins for further processing, into Spain increased. For direct consumption, the UK, Indonesia’s largest canned tuna market in Europe, imported 3.5% more, while Germany, Indonesia’s second largest EU market reported lower imports (-7%).39 It remains to be seen if the declining trend is reversed in 2016 or if the first quarter was just a temporary hike in demand.
The demand for fresh tuna, especially yellowfin, has also increased in recent years in parts of Northern and Western Europe as Japanese style sushi becomes more popular. In the UK, for example, fresh tuna has seen a year on year (2010-2014) increase of 10.6% in volume to 2,996 tons and 6.5% year on year increase in value to GBP 41 million.40
Import requirements
The import and customs regulations are the same at any port of entrance to the EU; once imported, the product can then be freely distributed within the EU. Tuna, frozen or fresh, is subject to customs duty of 22% unless it originates from one of the countries of the Cotonou Agreement (more recently known as the GSP+), in which case there is no duty. For canned skipjack and bonito, the rate is 24% unless from an exempted country. Indonesia is not one of the exempted countries and is thus subject to the higher rates. If the fish is unprocessed and destined for processing within the EU, the tariff is also 0%.41
36 https://www.eumofa.eu/documents/20178/66003/EN_The+EU+fish+market_Ed+2015.pdf/4cbd01f2-cd49-4bd1-adae-8dbb773d8519 37 https://www.eumofa.eu/documents/20178/66003/EN_The+EU+fish+market_Ed+2015.pdf/4cbd01f2-cd49-4bd1-adae-8dbb773d8519 38 https://www.eumofa.eu/documents/20178/66003/EN_The+EU+fish+market_Ed+2015.pdf/4cbd01f2-cd49-4bd1-adae-8dbb773d8519 39 http://www.fao.org/in-action/globefish/market-reports/resource-detail/en/c/358022/ 40 http://www.atuna.com/index.php/en/2-news/5281-fresh-tuna-sales-snatch-bigger-uk-market-share?highlight=WyJ1ayIsInVrJ3MiXQ 41 http://www.atuna.com/index.php/en/trade/38-tuna-import-regulations

USAID Oceans and Fisheries Partnership Page 25 of 106 Value Chain Assessment: Bitung, Indonesia
All EU processing facilities must be authorized by the EU and given a code to import goods. The goods must be physically labelled with the code, as the documents and goods will be checked at customs. The EU-approved facilities must meet the EU veterinary and hygiene checks.
All wild-caught seafood brought into the EU for sale to consumers’ needs to be labelled with the required information:42 list of ingredients (commercial and scientific name) and percent of weight, fishing gear used, FAO area and sub-area of catch, net quantity, "best before" date, address of the manufacturer or seller established in the EU, place of origin, approval number of the processing facility and, for frozen products, the first day of freezing.
In addition, under EU anti-IUU fishing legislation (EC (European Council) Regulation No. 1005/2008) all imported wild caught seafood must be accompanied by catch certificates or face fines of up to 70,000 Euro. The catch certificates must be issued by the flag state of the vessel that caught the fish and must include when the fishing took place, where the fishing took place and how much fish was caught. An extra certificate is needed at each node of the value chain if the fish is stored or processed in a country other than the flag state. Each country has its own form based on the template EU catch certificate form.
Catch certificates must be validated by the relevant competent authority from the country where the vessel is registered, contain all information included in the template, give accurate weights of the fish imported into the EU, give a 6-digit product code to identify the fish, follow the fish at different nodes of processing and be traceable back to origin.
In order to ensure that smaller vessels can continue to trade to the EU, the European Commission has introduced a simplified catch certificate. Vessels which meet the criteria of a small-scale vessel per article 6 of Commission Regulation 1010/2010.43 Instead, an exporter trading fish from several small vessels need only list the vessels from which he has bought fish but does not have to specify the quantities of fish from each vessel making up the consignment.
Future demands and market trends
Traditional FAD-caught purse seine canned tuna products and their sales have been sluggish and demand for FAD-free MSC Pacific Nation Agreement (PNA) tuna and MSC pole-and-line product is high and rapidly increasing. As of October 2016, the Western Central Pacific Fishing Commission (WCPFC) FAD-ban is in place in the Western Central Pacific Ocean (WCPO) and frozen FAD-free skipjack is being sold at 12-15% premiums44. Over 200 purse seiners and 50 canneries participate in the MSC certified fishery program since there is high demand in the market place for this and other MSC certified tuna products.
Self-certified FAD-free products are now coming to the shelf under German private labels,45originating from the Philippines (Philippine vessels in PNG), where the vessels are complying with the WCPO FAD ban but not participating in the PNA MSC scheme. Tuna caught by Philippines-flagged vessels can enter the EU duty free under EU Free Trade Agreement (FTA), making these products more attractive to retailers than PNA Marine Stewardship Council (MSC) products processed in Thailand. This has led to consumer confusion and a backlash from the PNA. It remains to be seen if self-certified FAD-free products become a market trend or if more of the Philippine producers join the MSC and provide duty-free FAD-free MSC products to EU. Demand for MSC products in the UK market may slow down as a result of Brexit due to the possible weakening of the pound and consumer preference shifting back to traditional non-certified products.
42 https://ec.europa.eu/.../eu-new-fish-and-aquaculture-consumer-labels-pocket 43 In order to ensure that smaller vessels can continue to trade to the EU, the Commission has introduced a simplified catch certificate. Vessels which meet the criteria of a small vessel are laid down in article 6 of Regulation 1010/2010 and exclude the master of such vessels to be identified. Instead, an exporter trading fish stemming from several small vessels only need to list the vessels which he has bought fish from but does not have to specify the quantities of fish used by vessel making up the consignment. A simplified catch certificate may be used if the vessel: (i) has an overall length of less than 12 metres without towed gear, or (ii) has an overall length of 8 metres with towed gear, or (iii) has no superstructure; or(iv) has less than 20GT. 44 Key informant interview: Henk Brus 45 http://www.atuna.com/index.php/en/2-news/5284-self-certified-fad-free-dominates-private-label-in-germany

USAID Oceans and Fisheries Partnership Page 26 of 106 Value Chain Assessment: Bitung, Indonesia
2.2.5 Japan
Japan is the third largest seafood import market globally, with a total value of US$14.84 billion in 2014.46 It also accounts for 14% of the total global consumption of tuna. This market is important especially for the higher value fresh and frozen sashimi tuna (bluefin, bigeye and yellowfin) (62%) as well as smoked skipjack tuna katsuobushi (23%).47 Canned tuna products represent 15% of the tuna consumption.
A large part (61%) of the demand for tuna is also met by Japan’s historically large domestic and distant water fishing fleets, with imports for sashimi tuna at 36%, canned tuna 55% and katsuobushi 4% in 2014.48 Japan is the world’s fifth largest importer of canned tuna and cooked loins with 54,538 MT imported in 2015 (see Figure 7). During the first quarter of 2016, Japanese canned tuna imports increased by 14% to total 14,100 tons with growing supplies from the main import countries of Thailand, the Philippines, Indonesia, China and Vietnam. Nearly 1500 tons of these were cooked/dried katsuobushi products.49 Canned tuna imports are mostly yellowfin flakes in oil.
Japan is the second most valuable market for Indonesian tuna, importing high valued yellowfin and bigeye whole round tuna and preserved skipjack tuna (Katsuobushi, canned tuna). Although export volumes from 2014 to 2015 remained constant, the value dropped by 8%. As the export product mix is varied for Japan, it was difficult to highlight one particular reason for the decrease. Exports from Indonesia to Japan are expected to remain constant, if not increase slightly, as quality improves in the fishery and prices remain relatively low compared to other exporting countries in the region.
Import requirements
Importing seafood to Japan is primarily regulated by Foreign Exchange and Foreign Trade Act, the Food Sanitation Act, and the Customs Act.50 Under the Food Sanitation Act, sales of products that contain harmful or toxic substances or those with poor hygiene are prohibited. Sales of seafood and processed products in containers and packaging are subject to mandatory labelling and provisions concerning safety labeling such as indication of food additives, allergy information, raw ingredients and source, and genetic modification, etc. are applicable. Fresh fish including tuna, yellowtail, etc., may not have carbon dioxide added and must meet standards for pesticide residues, etc. (including feed additives and drugs for animals). Seafood and processed products are subject to food sanitation inspections to assess the types and details of the raw ingredients and the types and contents of additives, pesticide residues, mycotoxins, etc. Accordingly, seafood and processed products must be checked at the production site prior to import.
Future demands and trends
As younger generations are eating more meat, the Japanese seafood market has been decreasing in size from its peak in 2001, shrinking by over 30% between 2001 and 2014.51 The first quarter of 2016, however, generated some optimism for the sashimi trade. After four years of a continuous lull in imports, Japanese air-flown tuna imports increased by 4% during the January-March period compared with the same period in 2015.
Seafood consumption is divided between high value sashimi (bluefin and bigeye) and lower value sashimi (yellowfin, albacore and skipjack), with sushi, tataki and neg between 2001 and itoro style products popular with consumers. Katsuobushi is produced into powders, flakes and sauce, and used in broths. Canned tuna is consumed more in the western style. Due to the demanding and skilled preparation of the fresh sashimi, the majority of tuna is consumed in restaurants, while canned tuna sales focus on retailers.
46 https://www.statista.com/statistics/268266/top-importers-of-fish-and-fishery-products/ 47 For katsuobushi tropical pole and line product is preferred for its higher quality and lower fat content 48 http://infofish.org/v2/images/tunaslide/Taro%20Kawamoto.pdfx.pdf 49 http://www.fao.org/in-action/globefish/market-reports/resource-detail/en/c/358022/ 50 https://www.jetro.go.jp/ext_images/costarica/mercadeo/9Eseafood.pdf 51http://www.japantimes.co.jp/news/2016/05/17/business/japans-fish-consumption-shrinks-lowest-since-1960s/#.WDJKVWWO5p9

USAID Oceans and Fisheries Partnership Page 27 of 106 Value Chain Assessment: Bitung, Indonesia
2.2.6 Australia
Oceania comprises 5% of the global seafood market, with Australia importing the most (just under 60,000 MT of canned and cooked loins in 2015), ranking as fourth largest single market globally (see Figure 7).52 Australia has its own tuna fishing and farming industry that meets much of its fresh and frozen tuna consumption. Canned tuna is, however, entirely imported, with Thailand taking 91% of the market share with major brands like John West, Sirena, Greenseas, Safcol and others. Australia is 3% by volume and 5% by value of the Indonesian tuna exports (2015). The market is developing a strong preference for MSC, pole-and-line and other products that have traceability or sustainability credentials. Demand for halal products is also quite high.
2.2.7 Middle-East and other export markets
The Middle East tuna market comprises 7% of the global tuna markets, with Africa at 3% and rest of Asia (including Indian and China, but excluding Japan) at 21% in 2015). The majority of the consumption in these markets is canned tuna. Egypt ranks as the third largest canned and cooked tuna importing country with 70,740 MT, Saudi-Arabia is seventh with 33,572 MT and Libya it tenth with 24,419 MT of canned tuna and cooked loins imported in 2015. Middle East market have been growing in recent years and many ASEAN producers have sought a larger market share there (see Figures 8 and 9). These markets have traditionally been tongkol,53 markets but are now increasingly purchasing skipjack and yellowfin, also.
Canned tuna imports have increased in New Zealand, Taiwan, Malaysia, Singapore and Sri Lanka during the January-March 2016 period. Export data from Thailand also indicated better sales for canned tuna destined for the Middle East in early 2016.
Import requirements for the Middle East and North Africa
The Middle East and North African markets, as well as other countries with large Muslim populations such as India, U.S., EU, Australia and Malaysia, are increasingly demanding halal certification requirements to ensure the product meets preparation requirements according to the faith.
There are no requirements for a specific method for killing fish for halal certification, so requirements for tuna focus on ingredients added ingredients to processed products. Products need to be certified by one of the halal certification bodies. However, there is currently no globally accepted halal standard and the criteria varies between different countries and products. The requirements generally include elements of traceability in that companies, at a minimum, must have written procedures to ensure raw materials come from appropriate source.54
Some research bodies indicate that many halal certifications are focused on the slaughter of the animal and the ingredients, but they do not have the necessary technology and ability to ensure the “halalness” of the product is preserved though the cold/supply chain.55 This aspect of certification is now receiving more attention with halal traceability systems, research centers and common standards in development in many key halal markets, including Indonesia. Recently, the first halal-certified warehouse was opened in the Netherlands to serve as a major halal product transfer hub for Europe and Africa.
52 http://www.fao.org/in-action/globefish/market-reports/resource-detail/en/c/358022/ 53 Euthynnus affinis 54 http://www.halalmui.org/newMUI/index.php/main/go_to_section/39/1329/page/2 55https://www.researchgate.net/publication/303459476_Understanding_Halal_and_Halal_Certification_Accreditation_System-_A_Brief_Review

USAID Oceans and Fisheries Partnership Page 28 of 106 Value Chain Assessment: Bitung, Indonesia
Future demand and market trends of the middle-east and other export markets
While demand in EU and U.S. markets for traditional tuna products is declining, increases are expected to come from the Middle-East, Latin America and Africa. The Thai Tuna Industry Association (TTIA) stated in early 2016 that approximately half of its production now goes to these markets and the other half to U.S., EU, Japan and Australia. Demand from these markets is expected to rise as the population increases and grows in affluence, and as economic diversification occurs.56
The Middle East is also looking to become more directly involved in seafood production as demonstrated by the October 2016 announcement that an investor from Jordan is considering building a processing plant in Gorontalo, North-Sulawesi and buying raw material at 25MT a day. 57 Processors in Bitung have made it public that the Middle East is part of their expansion policy and some companies are establishing subsidiaries in the Middle East. As such, developing traceability in these halal-based supply chains will be key for these markets to ensure competitiveness.
2.3 Market campaigns and key industry platforms
The most active past and present campaigns that engage the tuna market are summarized below. These campaigns may influence the design of the CDTS and illustrate market preferences. Industry platforms active in the tuna and traceability space are also introduced in Figure 12 below.
Figure 12: Market Campaigns and Key Industry Platforms Campaign Geographic
Focus Description
Greenpeace Consumer markets in U.S., Canada, Australia, NZ and EU
• Ranks tuna brands to pressure brands to improve their practices and retailers to remove unsustainable brands; includes detailed human rights and social aspects
• Ranks food service industry and canneries • Conducts corporate sustainability campaign for Thai Union’s tuna
supply chains • Campaigns on longline fisheries in Taiwan, Korea and Japan, focused
on improving standards and transparency World Wildlife Fund
Consumer markets in U.S., EU, Canada, Australia and NZ
• Asks retailers, food service and tuna labels to source from MSC certified fisheries; if no MSC certified product available, recommends sourcing from FIP or ISSF Proactive Vessel Register vessels
• Works with markets to demand increased speed and transparency in sharing the WCPO observer reports, particularly IUU incidents or human rights violations
• Coordinates a global roundtable on traceability with key industry • Publishes criteria58 for traceability
Environmental Justice Foundation
Developing countries
• Investigates IUU fishing in developing countries, including Indonesia • Focuses on human rights abuses on vessels, particularly in Thai
fishing and processing industry
56 http://www.atuna.com/index.php/en/2-news/4610-thai-industry-believes-exports-have-bottomed?highlight=WyJtaWRkbGUiLCJlYXN0IiwiZWFzdCciLCJlYXN0J3MiLCInZWFzdCIsIm1pZGRsZSBlYXN0Il0 57 http://www.atuna.com/index.php/en/2-news/5204-jordanian-seeks-investment-in-indonesian-tuna?highlight=WyJtaWRkbGUiLCJlYXN0IiwiZWFzdCciLCJlYXN0J3MiLCInZWFzdCIsIm1pZGRsZSBlYXN0Il0 58 http://assets.worldwildlife.org/publications/796/files/original/WWF_Traceability_Principles_for_Wild-Caugh_Fish_April_2015.pdf?1430410438
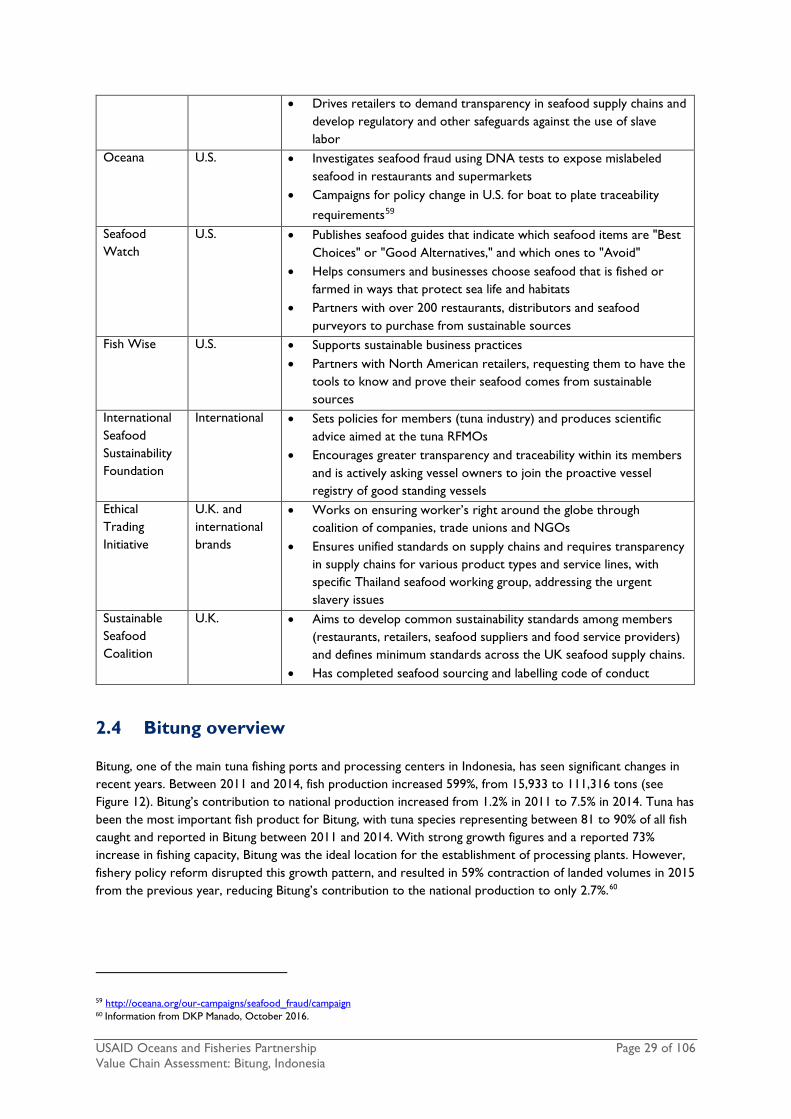
USAID Oceans and Fisheries Partnership Page 29 of 106 Value Chain Assessment: Bitung, Indonesia
• Drives retailers to demand transparency in seafood supply chains and develop regulatory and other safeguards against the use of slave labor
Oceana U.S. • Investigates seafood fraud using DNA tests to expose mislabeled seafood in restaurants and supermarkets
• Campaigns for policy change in U.S. for boat to plate traceability
requirements59 Seafood Watch
U.S. • Publishes seafood guides that indicate which seafood items are "Best Choices" or "Good Alternatives," and which ones to "Avoid"
• Helps consumers and businesses choose seafood that is fished or farmed in ways that protect sea life and habitats
• Partners with over 200 restaurants, distributors and seafood purveyors to purchase from sustainable sources
Fish Wise U.S. • Supports sustainable business practices • Partners with North American retailers, requesting them to have the
tools to know and prove their seafood comes from sustainable sources
International Seafood Sustainability Foundation
International • Sets policies for members (tuna industry) and produces scientific advice aimed at the tuna RFMOs
• Encourages greater transparency and traceability within its members and is actively asking vessel owners to join the proactive vessel registry of good standing vessels
Ethical Trading Initiative
U.K. and international brands
• Works on ensuring worker’s right around the globe through coalition of companies, trade unions and NGOs
• Ensures unified standards on supply chains and requires transparency in supply chains for various product types and service lines, with specific Thailand seafood working group, addressing the urgent slavery issues
Sustainable Seafood Coalition
U.K. • Aims to develop common sustainability standards among members (restaurants, retailers, seafood suppliers and food service providers) and defines minimum standards across the UK seafood supply chains.
• Has completed seafood sourcing and labelling code of conduct
2.4 Bitung overview
Bitung, one of the main tuna fishing ports and processing centers in Indonesia, has seen significant changes in recent years. Between 2011 and 2014, fish production increased 599%, from 15,933 to 111,316 tons (see Figure 12). Bitung’s contribution to national production increased from 1.2% in 2011 to 7.5% in 2014. Tuna has been the most important fish product for Bitung, with tuna species representing between 81 to 90% of all fish caught and reported in Bitung between 2011 and 2014. With strong growth figures and a reported 73% increase in fishing capacity, Bitung was the ideal location for the establishment of processing plants. However, fishery policy reform disrupted this growth pattern, and resulted in 59% contraction of landed volumes in 2015 from the previous year, reducing Bitung’s contribution to the national production to only 2.7%.60
59 http://oceana.org/our-campaigns/seafood_fraud/campaign 60 Information from DKP Manado, October 2016.

USAID Oceans and Fisheries Partnership Page 30 of 106 Value Chain Assessment: Bitung, Indonesia
Three types of fishing gears – purse seine, pole-and-line and handline – represented approximately 95% of the overall fishing production in Bitung between 2011 and 2014. Purse seine production experienced a 776% volume increase from 2011 to 2014, with average annual growth of 113%, the highest increase among the different fishing gears. Pole-and-line and handline catches also increased during the time period, with average annual growth of 48% and 82%, respectively. However, the drop in overall production resulting from fishery policy reform had a particularly acute impact in the purse seine catch, which had a drastic 62% drop from 2014 to 2015, while pole-and-line and handline suffered production drops of 27% and 50%, respectively (see Figure 14).
2.5 Bitung tuna value chain
The Bitung tuna fisheries value chain is comprised of many actors, each playing a discrete role within the fish trade (see Figure 15). These actors are discussed in further detail in the subsequent sections. Figure 16: Key actors in the Bitung tuna value chain
Figure 13: Production volume by gear type in Bitung (2011-2016)
Figure 15: Total fish production in Bitung Oceanic Fishing Port (2011-2016)
Source (Figures 13, 14): DKP North Sulawesi Province
Figure 14: Total fish production in Bitung Oceanic Fishing Port (2011-2016)

USAID Oceans and Fisheries Partnership Page 31 of 106 Value Chain Assessment: Bitung, Indonesia
2.5.1 Fishing vessels
The first actors in the tuna value chain are the fishing vessels. Ownership and composition of the fleet in Bitung varies widely; as of September 2016, 1,040 vessels were registered in Bitung, with approximately 80% of all registered boats under 30 GT. Vessels smaller than 5GT comprise approximately 32% of all registered vessels, indicating the strong prevalence of small scale (mainly hand line) fishing activity (see Figure 16).
According to records from fisheries department Dinas Kelautan dan Perikanan (the Department of Marine and Fisheries) (DKP) in Bitung, there is only one registered vessel larger than 200 GT in Bitung.
Fishing vessels usually employ one type of fishing gear. In Bitung approximately 46% of the registered vessels use handline as the main fishing gear, followed by purse seine (32%), pole-and-line
(3%) and other (19%), which includes the off-shore tuna purse seiners as well as in-shore small pelagic purse seiners (see Figure 17).
2.5.2 Fishers
The typology of fishers varies widely in Bitung, as with many fishing port cities throughout Indonesia. There are small scale independent fishers who own and operate small vessels and conduct daily trips, and fishers employed by small, medium and large businesses that operate fishing boats. While the precise number of people directly engaged in fishing is not available, information from DKP Bitung indicates that there are approximately 6,700 people engaged in fishing activities around the Bitung Fishing Port. According to the data provided, there has been a 42% drop in the number of people engaged in fisheries in Bitung, with the highest drop in factory workers (81%) (see Figure 18).
Figure 19: People engaged in fisheries in the Bitung Fishing Port Type of worker 2011 2012 2013 2014 2015
Assistant 93 96 54 93 60
Merchant 542 595 396 356 350
Factory workers 180 452 1,726 1,700 326
Fisher 6,950 6,602 11,117 9,329 5,878
Employees of other agencies 91 92 130 130 93
Total 7,856 7,837 13,423 11,608 6,707 Source: DKP North Sulawesi Province
Figure 17: Vessels registered in Bitung by size
Figure 18: Vessels registered in Bitung by gear type
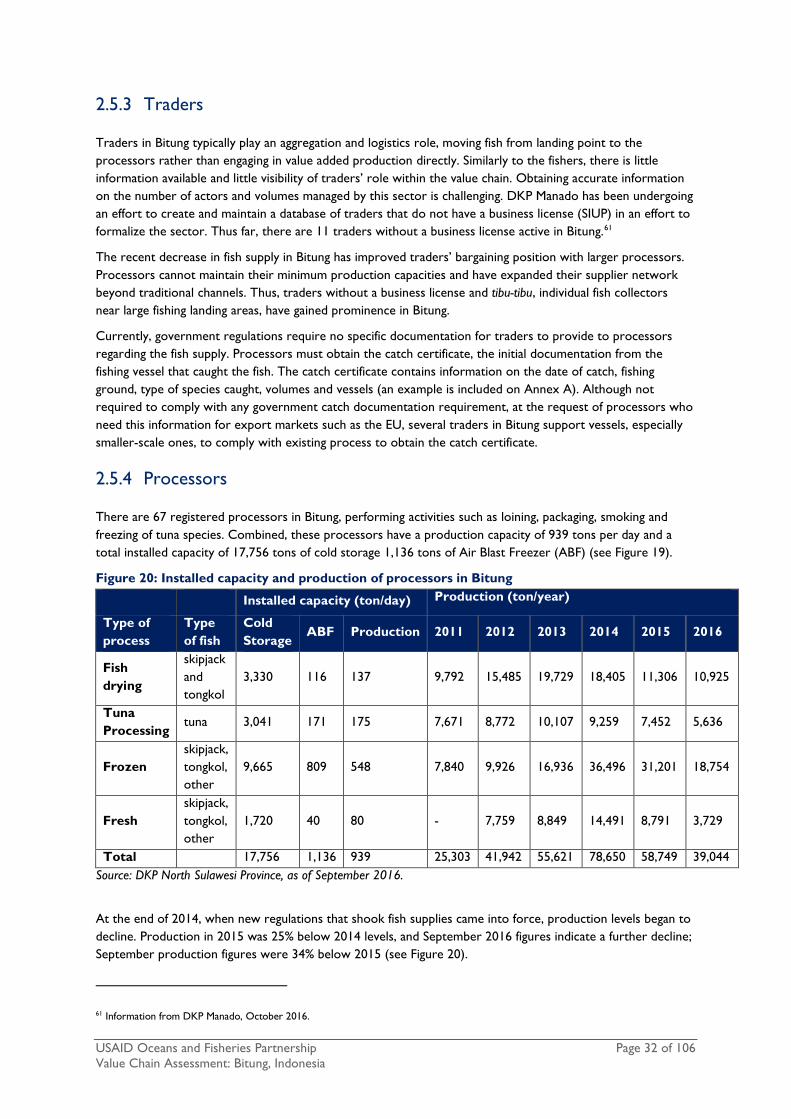
USAID Oceans and Fisheries Partnership Page 32 of 106 Value Chain Assessment: Bitung, Indonesia
2.5.3 Traders
Traders in Bitung typically play an aggregation and logistics role, moving fish from landing point to the processors rather than engaging in value added production directly. Similarly to the fishers, there is little information available and little visibility of traders’ role within the value chain. Obtaining accurate information on the number of actors and volumes managed by this sector is challenging. DKP Manado has been undergoing an effort to create and maintain a database of traders that do not have a business license (SIUP) in an effort to formalize the sector. Thus far, there are 11 traders without a business license active in Bitung.61
The recent decrease in fish supply in Bitung has improved traders’ bargaining position with larger processors. Processors cannot maintain their minimum production capacities and have expanded their supplier network beyond traditional channels. Thus, traders without a business license and tibu-tibu, individual fish collectors near large fishing landing areas, have gained prominence in Bitung.
Currently, government regulations require no specific documentation for traders to provide to processors regarding the fish supply. Processors must obtain the catch certificate, the initial documentation from the fishing vessel that caught the fish. The catch certificate contains information on the date of catch, fishing ground, type of species caught, volumes and vessels (an example is included on Annex A). Although not required to comply with any government catch documentation requirement, at the request of processors who need this information for export markets such as the EU, several traders in Bitung support vessels, especially smaller-scale ones, to comply with existing process to obtain the catch certificate.
2.5.4 Processors
There are 67 registered processors in Bitung, performing activities such as loining, packaging, smoking and freezing of tuna species. Combined, these processors have a production capacity of 939 tons per day and a total installed capacity of 17,756 tons of cold storage 1,136 tons of Air Blast Freezer (ABF) (see Figure 19).
Figure 20: Installed capacity and production of processors in Bitung Installed capacity (ton/day) Production (ton/year)
Type of process
Type of fish
Cold Storage
ABF Production 2011 2012 2013 2014 2015 2016
Fish drying
skipjack and tongkol
3,330 116 137 9,792 15,485 19,729 18,405 11,306 10,925
Tuna Processing
tuna 3,041 171 175 7,671 8,772 10,107 9,259 7,452 5,636
Frozen skipjack, tongkol, other
9,665 809 548 7,840 9,926 16,936 36,496 31,201 18,754
Fresh skipjack, tongkol, other
1,720 40 80 - 7,759 8,849 14,491 8,791 3,729
Total 17,756 1,136 939 25,303 41,942 55,621 78,650 58,749 39,044 Source: DKP North Sulawesi Province, as of September 2016.
At the end of 2014, when new regulations that shook fish supplies came into force, production levels began to decline. Production in 2015 was 25% below 2014 levels, and September 2016 figures indicate a further decline; September production figures were 34% below 2015 (see Figure 20).
61 Information from DKP Manado, October 2016.

USAID Oceans and Fisheries Partnership Page 33 of 106 Value Chain Assessment: Bitung, Indonesia
Figure 21: Tons of raw materials processed by processor types in Bitung
A detailed list of all processors registered in Bitung is included in Appendix 6.
2.5.5 Canneries
There are seven registered tuna canning businesses in Bitung (see Figure 21). Combined, these companies have a total installed capacity of 585 tons of tuna per day, and can store 8,600 tons of raw material.
Figure 22: Registered Canneries in Bitung, 2016 Installed capacity (ton/day) Production (ton/year) #
Cold Storage
ABF Production 2011 2012 2013 2014 2015 2016 (actual-Sept)
1 1,500 9 110 6,184 11,088 5,727 3,773 2 600 50 150 - 453 6,093 7,970 5,440 3,245 3 1,000 12 25 3,075 2,450 1,909 957 167 292 4 600 15 100 8,309 8,703 11,043 10,532 8,643 4,703 5 200 8 30 4,108 6,864 6,042 5,300 3,074 1,748 6 1,200 33 70 - 3,038 5,313 5,891 758 933 7
3,500 - 100 - - - 578 1,056 217
8,600 127 585 15,492 21,509 36,583 42,316 24,865 14,910 Source: DKP North Sulawesi Province, as of September 2016.
Source: DKP North Sulawesi Province

USAID Oceans and Fisheries Partnership Page 34 of 106 Value Chain Assessment: Bitung, Indonesia
As discussed, fishery policy reform had a profound impact in Bitung. Cannery businesses, which had been experiencing sustained production growth, averaging 42% per year between 2011 and 2014, experienced a dramatic 41% decrease in production in 2015 as a result of limited supply of raw material (see Figure 22). This has forced canneries to adapt in a variety of ways, such as changing internal procurement procedures to reduce the minimum purchasing volumes and accept raw material from informal (non-registered) traders, and extending their supply network geographically to areas outside of Bitung, such as North Maluku, South Sulawesi and Papua.
2.6 Bitung export markets and patterns of trade
Between 2011 and 2015, tuna from Bitung was exported to 34 countries in total (for full list see Appendix 5). The top five market destinations, Germany, United Kingdom, Thailand, U.S. and Switzerland, make up 79% of the total 116,662.33 MT of product exported from 2011-2015 (see Figure 23).
The top five export markets in 2015 represent 88% of the total exports out of Bitung. UK is the single largest market, followed by Germany and the U.S. (see Figure 24). Compared to Indonesia’s national export patterns it is interesting that Bitung does not export to any Middle-Eastern or African countries. Given that Bitung is a major canning hub, it is not surprising that Thailand does not dominate the export markets.
Exports from Bitung to Asian countries, besides Thailand, are low. Japan was the only other Asian export market in 2015 with just under 40T of tuna
exported, most likely smoked skipjack (katsuobushi) from Bitung’s smoke houses as well as fresh yellowfin and bigeye tuna. Some tuna from Bitung also be exported through other Indonesian ports, such as Jakarta. However, it was not possible to obtain specific quantities and information about this during this study.
Figure 25: Top 5 export markets for tuna from Bitung in 2015
Top 2015 export markets MT % of total (2015)
United Kingdom 4,182.40 37%
Germany 3,385.25 30%
U.S. 1,178.83 10%
Switzerland 745.22 7%
Australia 450.23 4%
Total 9,941.93 88% Source (Figures 23, 24): DKP North Sulawesi Province
Top 5 Markets (2011-2015) Total MT
Germany 38,274.09
United Kingdom 21,729.02
Thailand 17,336.45
U.S. 9,108.87
Switzerland 5,322.03
Total 91,770.46
Figure 24: Top 5 export markets for tuna from Bitung 2011-2015
Figure 23: Performance of the tuna canning industry in Bitung
Source: DKP North Sulawesi Province

USAID Oceans and Fisheries Partnership Page 35 of 106 Value Chain Assessment: Bitung, Indonesia
2.6.1 Changing dynamics in Bitung
As noted, the regulations issued at the end of 2014 have profoundly impacted all actors in the Bitung tuna value chain. While a full account of the impacts has not yet been documented, key stakeholder interviews conducted in Bitung shed some light in some of changes that have taken place since the end of 2014.
Impressions from fishers
Overall, small scale fishers indicated that they have been positively impacted by the new regulations and the change in dynamics in Bitung. However, depending on gear type, the impacts differ. Unlike small scale handline and pole-and-line fishers, purse seine fishers have suffered massive job loss as a result of these regulations. Some fishers have reported decrease in operation costs, resulting from a reduction in corruption with changes with DKP’s departmental responsibilities in Bitung. Other fishers have expressed that they are able to obtain higher price for their catch and it is easier to sell their product.
Fishers appeared to be unaware of traceability requirements or market pressures concerning traceability. Their only preoccupation is to obtain the catch certificate, which is widely reported as cumbersome and time consuming.
Impressions from processors and canneries
Processors in Bitung have experienced a 25% reduction in production. Generally, processors are uneasy about the changes in the regulations and some displayed apprehension regarding their future operations. Previously planned investments are currently on hold, and the focus is on securing and maintaining supply.
No processor or cannery indicated having written contracts with traders/suppliers. Given the dynamic changes in the market place, it is expected that the current practice of loyalty relationships will continue. Thus, relationships with traders and suppliers have become more crucial, and processors are spending more time to retain suppliers. As the balance of power has tipped towards the fisher, suppliers with strong relationships with fishers have been able to secure more favorable prices and payment terms.
At the same time, processors have also reported stronger pressure from international buyers on traceability, with increased data requests over the last year. Although increasingly requesting more detailed information, international buyers are not off-setting costs for obtaining or maintaining this data. Processors face a challenge in supply this data as they expand their supplier networks and rely more on informal traders for product. In addition, processors and canneries described significant challenges to fulfill all the requirements for Indonesian Catch Certificates and reported long waiting periods for the documentation (see Figure 26).
Of all value chain actors, the cannery sector has expressed and documented the most negative impact from 2014 regulations. Documented production by the seven canneries in Bitung in 2015 was 41% below 2014 levels. 2016 figures indicate production, as of September 2016, is 40% below 2015 levels. Limited raw materials have significantly undermined cannery production. Some canneries indicated they are operating at 8% capacity, with no improvements expected. While accurate information is not available from the fishery department (DKP), it was reported that at least one cannery has closed in Bitung.
Despite limitations in raw material, international demand has continued to rise, forcing canneries in Bitung to adopt measures to overcome supply shortages. As a result, canneries have reported that their supplier networks have expanded geographically, reaching suppliers in regions such as Ambon, Moratai, Sorong, Ternate, but also that their networks reach further down the value chain to informal suppliers. This transition
Key Findings
• Processors and cannery production reduced greatly
• Strong pressure received for traceability from international buyers
• Canneries have been most strongly impacted by 2014 regulations, with production reduced by as much as 41%
• Raw Material prices have risen, up to 25-50%, and unemployment rates
increased due to layoffs

USAID Oceans and Fisheries Partnership Page 36 of 106 Value Chain Assessment: Bitung, Indonesia
can present serious challenges to traceability efforts, as informal suppliers typically lack the necessary capacity to maintain accurate records.
Canneries have faced other challenges as a result of the contraction in supply. Canneries have had to lay off employees, resulting in higher unemployment rates in and around Bitung. Canneries also report an increase in raw material price of 25-50% (2015/16). According to some canneries, the fishers are no longer “price takers;” they now control the market. While businesses have been impacted in different ways, two tuna canneries interview reported similar challenges, namely changes in the number of employees, volumes, raw material prices, supplier network and cash management (see Figure 25).
Figure 26: Impressions of selected canneries in Bitung
Cannery A Cannery B Raw material • Pole and line: 40%
• Purse seine: 60% • Pole and line: 90% • Purse seine: 10%
Final products • Catering: 30% • Retail: 70%
• Catering: 10% • Retail: 90%
Markets • Exports: 95% • National: 5%
• Exports: 100%
International markets
• Australia: 20% • EU: 20% • UK: 10% • Middle East: 25% • Japan: 20% • U.S.: 5%
• UK: 90% • U.S., Middle East: 10%
Impacts of MMAF Fishery Policy Reform Impacts MMAF fishery reform
• Supply has decreased 60% since regulations issued in 2014
• Significantly scaled down operations to 1 shift/day, (previously 3 shifts/day)
• Price is now set weekly, or sometimes per transaction, depending on the supplier
• Changed internal operating procedures to decrease the minimum purchase from an individual supplier from 5 ton/purchase to 1 ton/purchase
• Working with smaller scale and informal traders has changed payment processes to cash payments
• Employees reduced by approximately 30%
• Stopped operations for 3 weeks due to lack of raw material, high raw material price and changing regulations
• Supply purchases focus in on meeting minimum volumes over ensuring quality
• Operating significantly below capacity: o Needs 28 to 30 tons/day raw
material day to operate efficiently
o Previously sourcing 70-80 tons/day
o Now can only obtain 5-10 tons/day
• Previously a high proportion of the raw material supply came from one purse-seine vessel operated by the company; now company is not operating vessels as they are considered foreign boats under the new regulation
• Employee workforce reduced by over 60%
Production volumes
• Current: 25-30 ton/day; approximately 850 ton/month
• Current: 420 ton/month • Prior to regulation: 840 ton/month
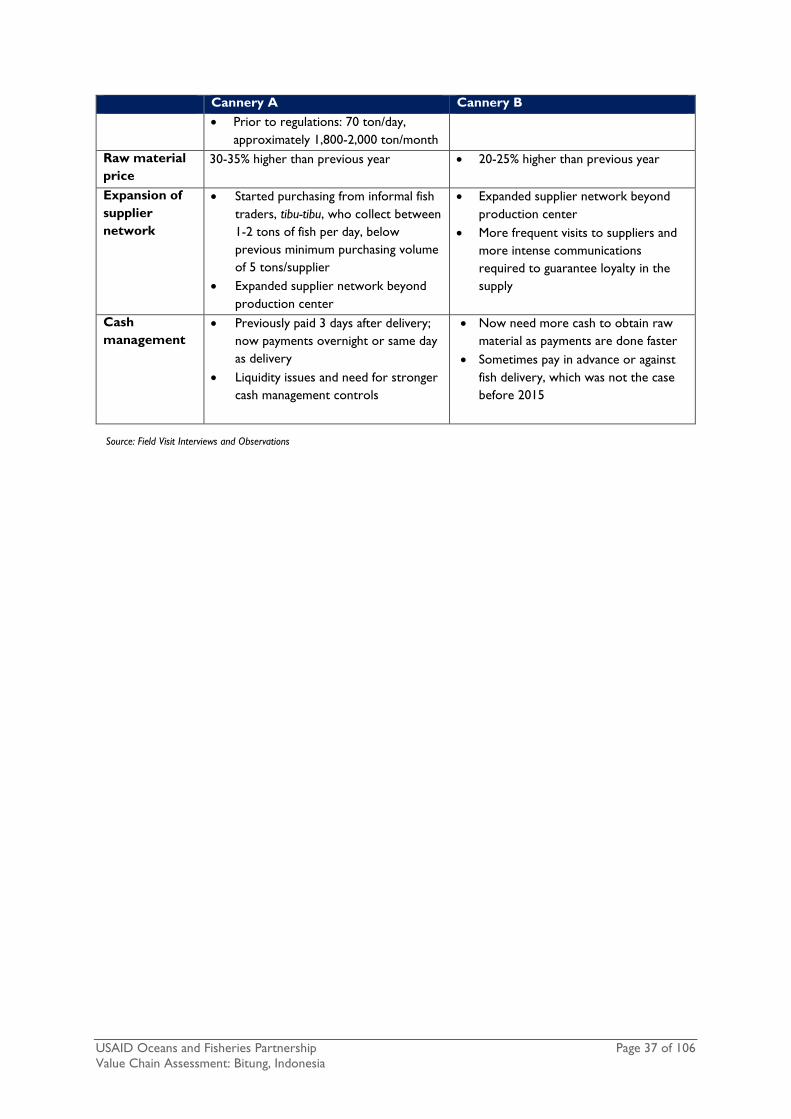
USAID Oceans and Fisheries Partnership Page 37 of 106 Value Chain Assessment: Bitung, Indonesia
Cannery A Cannery B • Prior to regulations: 70 ton/day,
approximately 1,800-2,000 ton/month Raw material price
30-35% higher than previous year • 20-25% higher than previous year
Expansion of supplier network
• Started purchasing from informal fish traders, tibu-tibu, who collect between 1-2 tons of fish per day, below previous minimum purchasing volume of 5 tons/supplier
• Expanded supplier network beyond production center
• Expanded supplier network beyond production center
• More frequent visits to suppliers and more intense communications required to guarantee loyalty in the supply
Cash management
• Previously paid 3 days after delivery; now payments overnight or same day as delivery
• Liquidity issues and need for stronger cash management controls
• Now need more cash to obtain raw material as payments are done faster
• Sometimes pay in advance or against fish delivery, which was not the case before 2015
Source: Field Visit Interviews and Observations
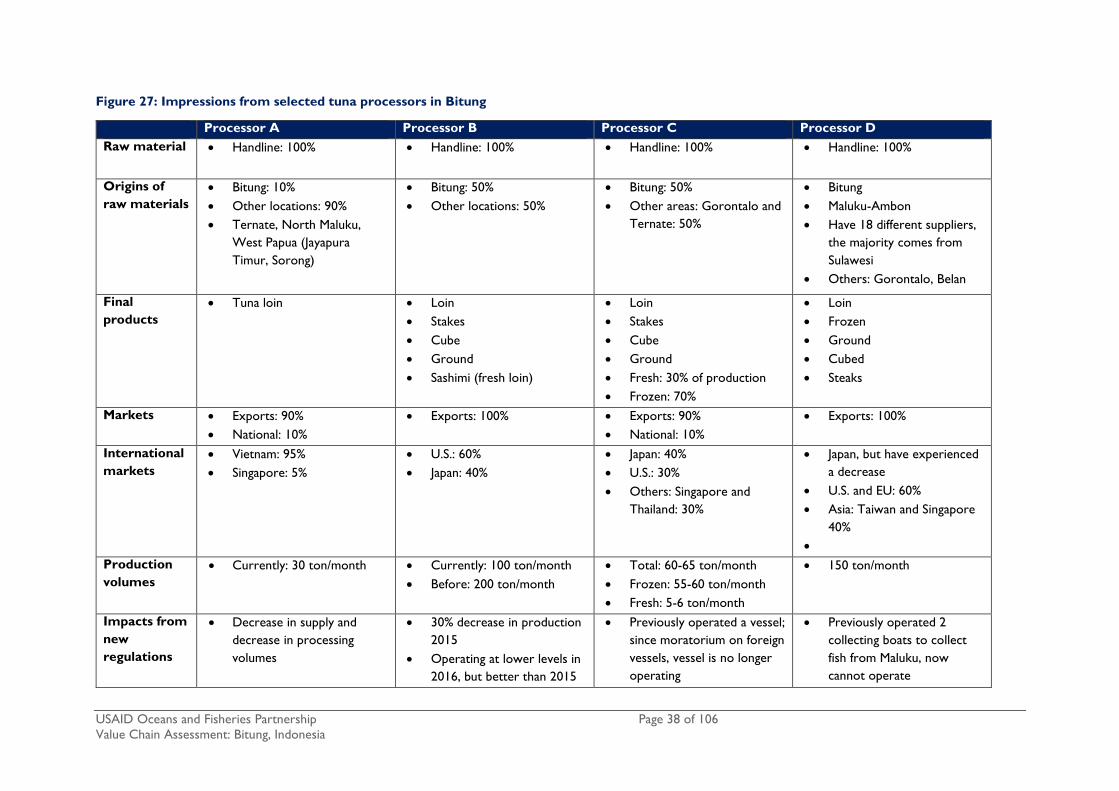
USAID Oceans and Fisheries Partnership Page 38 of 106 Value Chain Assessment: Bitung, Indonesia
Figure 27: Impressions from selected tuna processors in Bitung
Processor A Processor B Processor C Processor D Raw material • Handline: 100% • Handline: 100% • Handline: 100% • Handline: 100%
Origins of raw materials
• Bitung: 10% • Other locations: 90% • Ternate, North Maluku,
West Papua (Jayapura Timur, Sorong)
• Bitung: 50% • Other locations: 50%
• Bitung: 50% • Other areas: Gorontalo and
Ternate: 50%
• Bitung • Maluku-Ambon • Have 18 different suppliers,
the majority comes from Sulawesi
• Others: Gorontalo, Belan
Final products
• Tuna loin • Loin • Stakes • Cube • Ground • Sashimi (fresh loin)
• Loin • Stakes • Cube • Ground • Fresh: 30% of production • Frozen: 70%
• Loin • Frozen • Ground • Cubed • Steaks
Markets • Exports: 90%
• National: 10% • Exports: 100% • Exports: 90%
• National: 10% • Exports: 100%
International markets
• Vietnam: 95% • Singapore: 5%
• U.S.: 60% • Japan: 40%
• Japan: 40% • U.S.: 30% • Others: Singapore and
Thailand: 30%
• Japan, but have experienced a decrease
• U.S. and EU: 60% • Asia: Taiwan and Singapore
40% •
Production volumes
• Currently: 30 ton/month • Currently: 100 ton/month • Before: 200 ton/month
• Total: 60-65 ton/month • Frozen: 55-60 ton/month • Fresh: 5-6 ton/month
• 150 ton/month
Impacts from new regulations
• Decrease in supply and decrease in processing volumes
• 30% decrease in production 2015
• Operating at lower levels in 2016, but better than 2015
• Previously operated a vessel; since moratorium on foreign vessels, vessel is no longer operating
• Previously operated 2 collecting boats to collect fish from Maluku, now cannot operate

USAID Oceans and Fisheries Partnership Page 39 of 106 Value Chain Assessment: Bitung, Indonesia
Processor A Processor B Processor C Processor D • Requirement to install VMS
on all vessels cost IDR 18 million (approx. US$1,332) per unit plus IDR 5.9 million (approx. US$436) per unit/year for service
• Increase in competition for raw material, particularly for high quality fresh product destined for export markets
• Change in payment terms to suppliers (quicker payment must be made) to ensure continual raw material supply
• Difficult to procure grade A product (which goes to UK and France) now
• Have not been shipping to Japan since 2015; cannot meet demand for raw material
Source: Field Visit Interviews and Observations
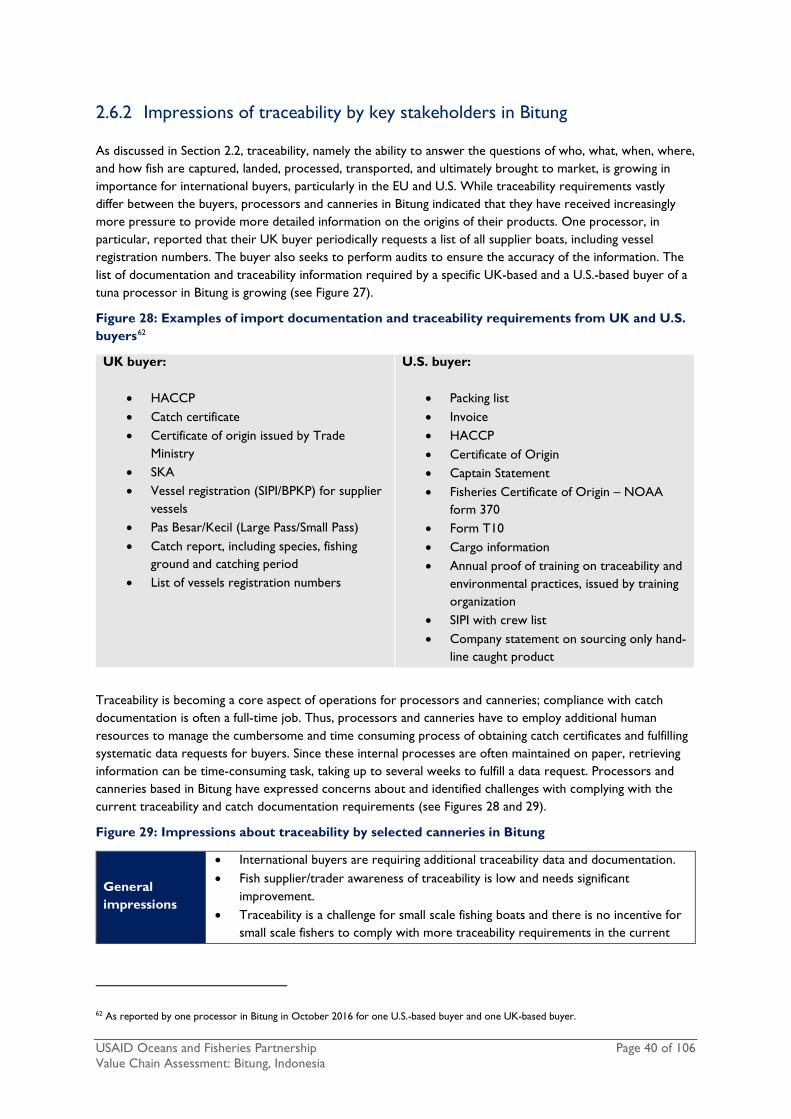
USAID Oceans and Fisheries Partnership Page 40 of 106 Value Chain Assessment: Bitung, Indonesia
2.6.2 Impressions of traceability by key stakeholders in Bitung
As discussed in Section 2.2, traceability, namely the ability to answer the questions of who, what, when, where, and how fish are captured, landed, processed, transported, and ultimately brought to market, is growing in importance for international buyers, particularly in the EU and U.S. While traceability requirements vastly differ between the buyers, processors and canneries in Bitung indicated that they have received increasingly more pressure to provide more detailed information on the origins of their products. One processor, in particular, reported that their UK buyer periodically requests a list of all supplier boats, including vessel registration numbers. The buyer also seeks to perform audits to ensure the accuracy of the information. The list of documentation and traceability information required by a specific UK-based and a U.S.-based buyer of a tuna processor in Bitung is growing (see Figure 27).
Figure 28: Examples of import documentation and traceability requirements from UK and U.S. buyers62
UK buyer:
• HACCP • Catch certificate • Certificate of origin issued by Trade
Ministry • SKA • Vessel registration (SIPI/BPKP) for supplier
vessels • Pas Besar/Kecil (Large Pass/Small Pass) • Catch report, including species, fishing
ground and catching period • List of vessels registration numbers
U.S. buyer:
• Packing list • Invoice • HACCP • Certificate of Origin • Captain Statement • Fisheries Certificate of Origin – NOAA
form 370 • Form T10 • Cargo information • Annual proof of training on traceability and
environmental practices, issued by training organization
• SIPI with crew list • Company statement on sourcing only hand-
line caught product
Traceability is becoming a core aspect of operations for processors and canneries; compliance with catch documentation is often a full-time job. Thus, processors and canneries have to employ additional human resources to manage the cumbersome and time consuming process of obtaining catch certificates and fulfilling systematic data requests for buyers. Since these internal processes are often maintained on paper, retrieving information can be time-consuming task, taking up to several weeks to fulfill a data request. Processors and canneries based in Bitung have expressed concerns about and identified challenges with complying with the current traceability and catch documentation requirements (see Figures 28 and 29).
Figure 29: Impressions about traceability by selected canneries in Bitung
General impressions
• International buyers are requiring additional traceability data and documentation. • Fish supplier/trader awareness of traceability is low and needs significant
improvement. • Traceability is a challenge for small scale fishing boats and there is no incentive for
small scale fishers to comply with more traceability requirements in the current
62 As reported by one processor in Bitung in October 2016 for one U.S.-based buyer and one UK-based buyer.

USAID Oceans and Fisheries Partnership Page 41 of 106 Value Chain Assessment: Bitung, Indonesia
competitive scenario because they can sell to companies that have fewer requirements for same price or higher.
• Do not see the benefits of traceability as there is no premium price paid, just additional costs.
• Hope traceability will translate into more sales since there is not additional price incentive, but sales performance levels do not seem to be influenced by traceability in key end markets.
International market expectations
• Markets require more information but are not providing additional prices or price premiums to companies.
• Middle East countries do not require companies to comply with catch documentation.
• UK and Australia buyers generally perceived as being stricter regarding traceability.
Information management
• Paper based systems are perceived as reliable and efficient. • Excel files are currently used for costs, price and volume information. • SOP indicates they need to trace within 4 hours, but it usually takes significantly
more time to obtain the information. • Some indicated plans to adopt a new management system that will run parallel to
the paper system.
Challenges to comply with current catch documentation
• Time to obtain catch certificate is a challenge: Initial Sheet takes a minimum of 5 days and Derivative Sheet takes more than 5 days.
• One staff member is fully dedicated to processing the government-issued catch certificate.
• Now, with low supply, meeting buyer deadlines is fine, but in higher volume periods processing time will take significantly longer.
Technology readiness
• Staff reluctant to use electronic systems; they are used to paper systems. • Company has capability to adopt new technology (computers, power supply),
however, it has not yet contemplated the use of a system. • Moving towards an electronic system and capability to do so (staff has computers,
the company has stable power supply, etc.).
Source: Field Visit Interviews and Observations
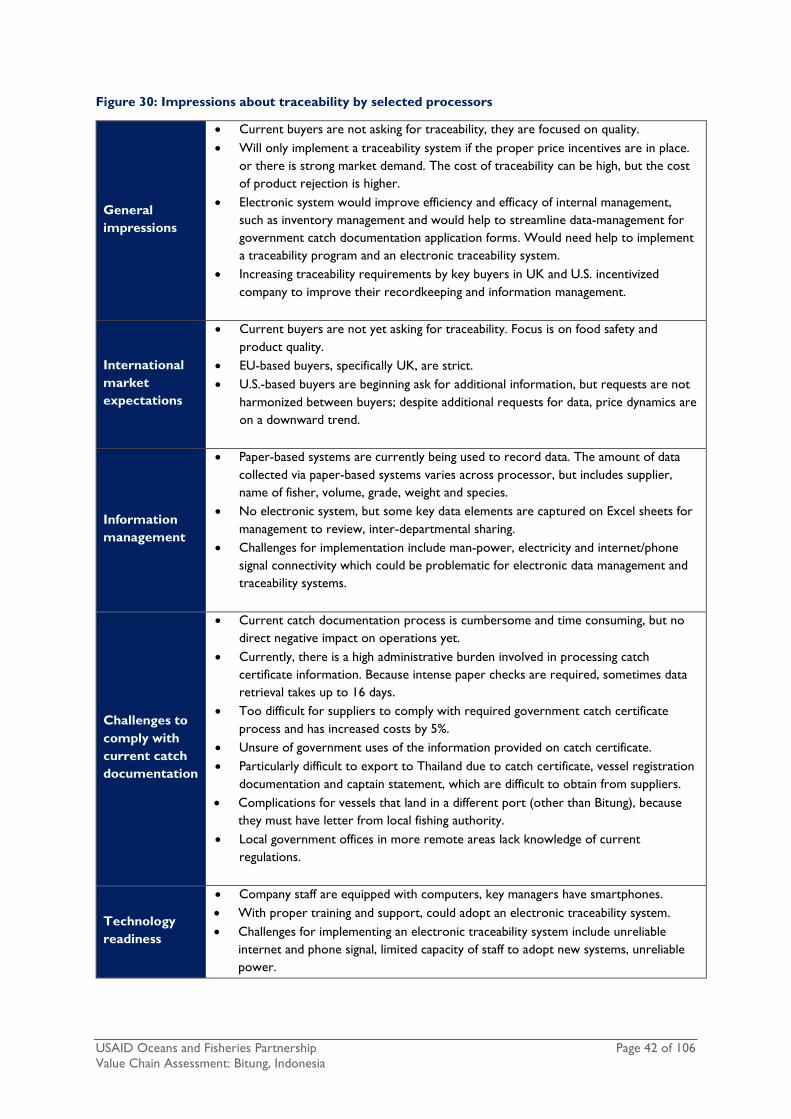
USAID Oceans and Fisheries Partnership Page 42 of 106 Value Chain Assessment: Bitung, Indonesia
Figure 30: Impressions about traceability by selected processors
General impressions
• Current buyers are not asking for traceability, they are focused on quality. • Will only implement a traceability system if the proper price incentives are in place.
or there is strong market demand. The cost of traceability can be high, but the cost of product rejection is higher.
• Electronic system would improve efficiency and efficacy of internal management, such as inventory management and would help to streamline data-management for government catch documentation application forms. Would need help to implement a traceability program and an electronic traceability system.
• Increasing traceability requirements by key buyers in UK and U.S. incentivized company to improve their recordkeeping and information management.
International market expectations
• Current buyers are not yet asking for traceability. Focus is on food safety and product quality.
• EU-based buyers, specifically UK, are strict. • U.S.-based buyers are beginning ask for additional information, but requests are not
harmonized between buyers; despite additional requests for data, price dynamics are on a downward trend.
Information management
• Paper-based systems are currently being used to record data. The amount of data collected via paper-based systems varies across processor, but includes supplier, name of fisher, volume, grade, weight and species.
• No electronic system, but some key data elements are captured on Excel sheets for management to review, inter-departmental sharing.
• Challenges for implementation include man-power, electricity and internet/phone signal connectivity which could be problematic for electronic data management and traceability systems.
Challenges to comply with current catch documentation
• Current catch documentation process is cumbersome and time consuming, but no direct negative impact on operations yet.
• Currently, there is a high administrative burden involved in processing catch certificate information. Because intense paper checks are required, sometimes data retrieval takes up to 16 days.
• Too difficult for suppliers to comply with required government catch certificate process and has increased costs by 5%.
• Unsure of government uses of the information provided on catch certificate. • Particularly difficult to export to Thailand due to catch certificate, vessel registration
documentation and captain statement, which are difficult to obtain from suppliers. • Complications for vessels that land in a different port (other than Bitung), because
they must have letter from local fishing authority. • Local government offices in more remote areas lack knowledge of current
regulations.
Technology readiness
• Company staff are equipped with computers, key managers have smartphones. • With proper training and support, could adopt an electronic traceability system. • Challenges for implementing an electronic traceability system include unreliable
internet and phone signal, limited capacity of staff to adopt new systems, unreliable power.

USAID Oceans and Fisheries Partnership Page 43 of 106 Value Chain Assessment: Bitung, Indonesia
• Mixed response from employees on adoption. Administration staff is young, eager to learn, and enthusiastic about new electronic systems that could make their processes more efficient. Other staff are reluctant to move away from paper based systems.
Strong coordination with other actors within the value chain, such as traders, is necessary to provide key data. However, traders typically have simple recordkeeping systems and limited capacity, presenting new challenges to processors and canneries that face supply constraints. Thus, some companies have taken a more proactive approach and provided training and support to traders to ensure they are able to comply with all the necessary documentation and information requests. One informal trader contacted shared impressions about challenges and expectations (see Figure 30).
Figure 31: Impressions about traceability by informal trader
General impressions
• Unaware of traceability trends. • Generally supportive of traceability initiatives as long as they support
business. • Interested in improving current data management systems.
International market expectations
• Unaware of international market requirements.
Information management
• Maintains detailed records of all expenses: trip expenses, food purchases, fuel, personal fisher expenses, revenues, fish deliveries: boat, KG delivered, price paid, grade and date.
• Recordkeeping conducted in 7 different paper notebooks; some key information entered into Excel spreadsheet.
Challenges to comply with current catch documentation
• Trader does not have to comply with catch documentation. • Trader must provide the Initial Sheet to processors that export products
from the trader’s supplier boats. • Many challenges with the current regulation: takes too much time, is difficult
and too many requirements.
Technology readiness
• Owns a tablet, computer and smart phone and uses internet and mobile banking.
• Strong reliance and preference to use paper notebooks as the main recordkeeping and traceability data-source; however, open, eager and capable to adopt new technologies.
Source: Field Visit Interviews and Observations
Source: Field Visit Interviews and Observations

USAID Oceans and Fisheries Partnership Page 44 of 106 Value Chain Assessment: Bitung, Indonesia
2.6.3 Bottlenecks to implement a catch documentation and traceability program
There are several bottlenecks to implementing the current catch documentation and traceability requirements (see Figure 31). Discussions with key private sector stakeholders in Bitung, such as the canneries and processors, also revealed additional bottlenecks that could have impacts on a future electronic catch documentation and traceability systems.
Figure 32: Summary of bottlenecks to catch documentation and traceability Bottleneck Summary Potential impact Cumbersome and inefficient government catch documentation procedures
• Current catch certificate process involves a lot of paper work for each certificate, such as copies of existing licenses, which is burdensome for vessel operators and processors
• Focusing on burdensome paperwork rather than catch data reported can undermine the accuracy of the information and efforts to maintain the sustainability of the fishery
Difference in requirements for different vessel types
• Catch documentation is not mandatory for small scale fishers (<5GT)
• Larger processors and canneries require government-issued catch certificates for export
• Small scale fishers playing an important role now that supply is scarce, so it is important to support them to obtain the necessary documentation for compliance, as future traceability initiatives must encompass small-scale fisheries
Limited capacity of small scale fishers
• Small scale fishers lack the systems and capacity to maintain accurate and detailed records of their fishing operations
• Fishing boats required to comply with current catch documentation rely on the captain to comply and fulfill requirements
• Smaller scale fishers are not required to provide more detailed logbooks
• Sustainable management of fish stocks can be undermined as fishers operating boats <5GT are not required to comply with detailed log books for every trip, leaving a large proportion of the active fleet in Bitung out of current catch documentation efforts
Lack of financial incentives for compliance
• There is no financial incentive for fishers to comply with additional traceability requirements or catch certificate process (for those with vessels < 5GT)
• Engaging fishers in a voluntary catch documentation and traceability system in the current competitive scenario in which fishers can sell to companies that have fewer requirements for same price or higher will be difficult
• Without adequate financial incentives, fishers might choose to bypass traceability requirements and sell to lower value end-markets that do not require catch certificates or other information

USAID Oceans and Fisheries Partnership Page 45 of 105 Value Chain Assessment: Bitung, Indonesia
Bottleneck Summary Potential impact Limited capacity of traders
• Large number of informal traders are present in Bitung • Traders are not directly regulated, but currently play a
supporting role to the vessels that sell their raw materials by obtaining and passing data and documents for the catch certificate up the value chain
• Traders’ general management capacity and recordkeeping abilities are limited, and they lack robust systems to support growing detailed data needs
• Traders play an important role in the tuna value chain and are controlling an increasing portion of the scarce raw material in Bitung
• Traders and their particular needs, skill levels and capacity must be considered to avoid significantly hampering traceability efforts
Lack of infrastructure and knowledge about current regulations in government offices in remote areas outside Bitung
• Fish landed in areas outside Bitung is increasingly being processed by Bitung-based processors and canneries
• Knowledge and application of current regulations pertaining to catch documentation is not uniform across different government agencies and regions
• In more remote areas, a lack of infrastructure and knowledge about current catch documentation requirements could restrict fish supply from smaller suppliers or restrict their distribution to lower value markets that do not require catch certificates
• As smaller scale fishers generally have limited understanding about the regulation, if not properly instructed, they cannot fulfill the requirements
Limited internal management capacity within government agencies
• There is a growing number of requirements, however, local government agencies are understaffed and required processes are time consuming and redundant
• A traceability program that relies on the government for approval will need to consider balancing the need for proper checks and balances from official agencies, while also maintaining speed, agility and efficiency
• All stakeholders, including government, need to be properly trained and inducted in the new system to ensure its full functionality
Stakeholders’ technology readiness and willingness to adopt systems
• Technology readiness varies widely between different stakeholders
• Processors and canneries are perceived as being more ‘technology ready’ as the administration staff has computers and smartphones and are experienced at managing databases and conduct transactions online
• Fishers and community traders in general, on the other hand, are perceived to have less access to technology, as they do not always own computers and/or smartphones
• Despite being ‘technology ready,’ some stakeholders might be unwilling or reluctant to adopt electronic traceability systems, which could jeopardize the dissemination and implementation of the systems

USAID Oceans and Fisheries Partnership Page 46 of 106 Value Chain Assessment: Bitung, Indonesia
PART II. TRACEABILITY
3. THE IMPORTANCE OF TRACEABILITY AND CURRENT TRENDS
Traceability helps fulfill various market, government and business needs. For example, collecting relevant information and having recall practices in place is common for purposes of fisheries management and food safety. However, these are normally done on a “one up, one down” basis and do not provide end-to-end traceability. In the sourcing countries, both the market and the regulators have their own chain of custody requirements in order to ensure the imported seafood meets domestic requirements to prevent IUU fishing and bears out any sustainability and social claims. The current systems are complex and gather vast quantities of paper-based data. However, through technological innovation this ‘paper mountain’ can be reduced and data collected integrated with the management systems of both businesses and government.
2.7 Landscape review of current traceability programs and vendors in use in Indonesia
Several programs and pilot projects in Indonesia are currently being run by NGOs, the private sector and other bilateral parties to test and develop data collection, chain of custody and full supply chain traceability systems. These programs aim to meet requirements established by governments, RFMOs and the market, as well as making businesses more efficient and better able to manage increasing demands. Some programs are also investigating the practicalities of using these systems and the incentives required for wider adoption and scalability.
This section provides an overview of traceability and data collection programs, past and present, vendors used for technology, other programs supporting traceability and key learnings relevant to the design of a CDTS and the roles they cover in the traceability supply chain (see Figure 32). Figure 33: Traceability Supply Chain
Most of the programs and individual vendors deal mainly with the catch documentation aspect of traceability, focusing on the early part of the supply chain. However, there are also many players who are testing and developing either single systems, or combinations of
different systems that can provide full supply chain traceability. For this reason, this review will first outline the overarching programs that are finding solutions to full chain traceability issues and government data collection needs. Secondly, the review also introduces vendors that are specifically running technology pilots in Indonesia. Figure 33 combines the aspects of the programs, different vendors mentioned and their position in regard to data collection and traceability of information/product along the supply chain.
The information presented is this section is based on publicly available reports and websites, as well as interviews with personnel involved in the projects. The operator’s stated claims have not been independently verified.

USAID Oceans and Fisheries Partnership Page 47 of 106 Value Chain Assessment: Bitung, Indonesia
Figure 34: Overview of different traceability programs and vendors that are active in Indonesia
2.7.1 Data collection and traceability programs past and present
USAID Oceans supports the development of an electronic CDTS to help ensure that fisheries resources from Southeast Asia are legally caught and properly labeled. The CDTS will encourage the collection and analysis of ecological and economic data related to seafood products throughout the supply chain from point-of-harvest to import in key markets. The CDTS will support the capture and validation of key data elements on the seafood product including legality and movement from the point of harvest, throughout the various buyers, processors, shippers, importers, distributers, and retailers that handle the product, all the way to the end-consumer or at minimum the importer. USAID Oceans’ CDTS can learn from Indonesia’s other data collection and traceability programs, both past and present. This section outlines vendors operating within Indonesia and describes the benefits and restraints of each product.
Historically, Indonesia’s data has been collected by government entities. There was no formal structure for the government to receive and use data collected by external parties. I-fish, the Indonesian fisheries information system, was the first attempt by private and non-governmental organizations and government to work together to establish a portal through which external parties could collect and input data onto an open-source platform. In 2003, VMS was introduced into Indonesia under a bi-laterally funded pilot, and in 2009 VMS was opened to the market (currently 5 vendors). Currently (2016), there are around 4000 units deployed across the above 30 GT fleet of which 30% non-active.63 I-Fish (stock assessment tool) I-Fish is a public-private controlled open source database for fisheries data collection for boat owners, captains and managers. It was established to aid data collection and electronic transfer of fisheries data to the government in order to meet RFMO-based requirements and contribute to improved fisheries management. It
63 Key informant interview: CLS Argos
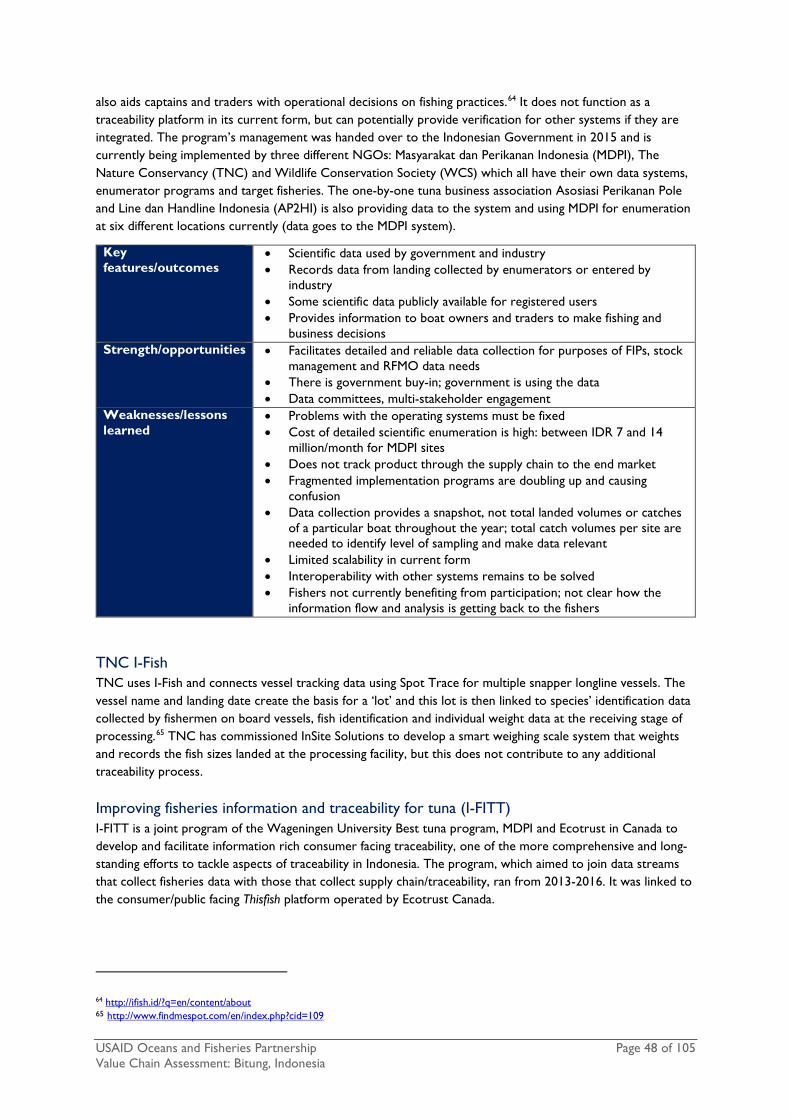
USAID Oceans and Fisheries Partnership Page 48 of 105 Value Chain Assessment: Bitung, Indonesia
also aids captains and traders with operational decisions on fishing practices.64 It does not function as a traceability platform in its current form, but can potentially provide verification for other systems if they are integrated. The program’s management was handed over to the Indonesian Government in 2015 and is currently being implemented by three different NGOs: Masyarakat dan Perikanan Indonesia (MDPI), The Nature Conservancy (TNC) and Wildlife Conservation Society (WCS) which all have their own data systems, enumerator programs and target fisheries. The one-by-one tuna business association Asosiasi Perikanan Pole and Line dan Handline Indonesia (AP2HI) is also providing data to the system and using MDPI for enumeration at six different locations currently (data goes to the MDPI system).
Key features/outcomes
• Scientific data used by government and industry • Records data from landing collected by enumerators or entered by
industry • Some scientific data publicly available for registered users • Provides information to boat owners and traders to make fishing and
business decisions Strength/opportunities • Facilitates detailed and reliable data collection for purposes of FIPs, stock
management and RFMO data needs • There is government buy-in; government is using the data • Data committees, multi-stakeholder engagement
Weaknesses/lessons learned
• Problems with the operating systems must be fixed • Cost of detailed scientific enumeration is high: between IDR 7 and 14
million/month for MDPI sites • Does not track product through the supply chain to the end market • Fragmented implementation programs are doubling up and causing
confusion • Data collection provides a snapshot, not total landed volumes or catches
of a particular boat throughout the year; total catch volumes per site are needed to identify level of sampling and make data relevant
• Limited scalability in current form • Interoperability with other systems remains to be solved • Fishers not currently benefiting from participation; not clear how the
information flow and analysis is getting back to the fishers
TNC I-Fish TNC uses I-Fish and connects vessel tracking data using Spot Trace for multiple snapper longline vessels. The vessel name and landing date create the basis for a ‘lot’ and this lot is then linked to species’ identification data collected by fishermen on board vessels, fish identification and individual weight data at the receiving stage of processing.65 TNC has commissioned InSite Solutions to develop a smart weighing scale system that weights and records the fish sizes landed at the processing facility, but this does not contribute to any additional traceability process. Improving fisheries information and traceability for tuna (I-FITT) I-FITT is a joint program of the Wageningen University Best tuna program, MDPI and Ecotrust in Canada to develop and facilitate information rich consumer facing traceability, one of the more comprehensive and long-standing efforts to tackle aspects of traceability in Indonesia. The program, which aimed to join data streams that collect fisheries data with those that collect supply chain/traceability, ran from 2013-2016. It was linked to the consumer/public facing Thisfish platform operated by Ecotrust Canada.
64 http://ifish.id/?q=en/content/about 65 http://www.findmespot.com/en/index.php?cid=109

USAID Oceans and Fisheries Partnership Page 49 of 105 Value Chain Assessment: Bitung, Indonesia
I-FITT collected and transferred KDEs at each node along the value chain, catch to plate. With this powerful combination of the two data systems, consumers could obtain detailed information of the location, method and type of fish caught by entering the tracking number or bar code of the product on Thisfish website.
Key features/outcomes
• Combines different approaches producing tuna ++ with the I-Fish FIP sustainability credentials and with combined full supply chain traceability tools.
• Program is being regularly evaluated by academic studies and findings used to shape the approaches.
• Lays the basis for development of a risk based framework for a data verification approach.
Strength/opportunities • Supports both government scientific data needs and public facing transparency demanded by markets.
• The programs were experimental and adoptive to the needs and situations of the industry providing a feedback loop on usability.
Weaknesses/lessons learned
• Programs were picked on existing I-Fish enumeration locations, needed to be market led for better results.
• The data needs of the two systems were not compatible. • There was evident mistrust in the companies for external enumerators to
be involved. • The market facing focus positioned IFITT a layer above the needs of the
industry, creates a burden.
MDPI and Netherlands Organization for Scientific Research (NWO) program This program was developed out of IFITT and ran until early 2017. The program aimed to enhance existing systems through technology innovations and make them more efficient and useable for Indonesian supply chain actors to participate in quickly evolving international markets. Technology innovations in this project were geared towards the fishers, dockside enumerators, middlemen/suppliers and processors through systems for improved reporting and information accessibility.
The NWO program tested the Spot trace system as the at-sea technology, in an attempt to incorporate this system’s data into the I-Fish system. The system was connected to a satellite, enabling at-sea coverage unlike mobile phone based technologies. It also connected to I-Fish and with vessel identification codes (VICs) could be easily linked to other I-fish data sets, allowing the Spot Trace data to be used as a verification tool for the port sampling system.
The program also made I-Fish data input into electronic form by using an application designed by Point97. This design feature improved the robustness and speed of the data inputted and minimized possibilities of data manipulation/error at later stages. As a pilot project of Point97 this was done at minimal cost to MDPI.
In addition, the program tested the use of an app called Ourfish developed by the Smithsonian Institute and targeted at the middlemen and processors. This app allows the inputting of data on total volumes and prices, fuel used, and ice usage that are then available for the user to track and analyze their business operations.
In addition, the program developed an electronic internal tally system, Tally-O, contracting Ecotrust Canada.66 This internal system provides a closed network connecting electronic scales, scanners, printers and computers together, speeding up the coding, data entry and labeling of fish at the primary processing place. At every processing station, the software is setup to record data electronically, or, where needed, to create data labels for the product. As the system provides efficiencies in speed and provides downloadable data sheets, it also helps more accurate bookkeeping of the trader. The data supports logistics, stock, inventory and storage management. The starts up costs are equipment related and begin at US$5,000-7,000, making it relatively
66 http://thisfish.info/

USAID Oceans and Fisheries Partnership Page 50 of 105 Value Chain Assessment: Bitung, Indonesia
affordable. MDPI is looking at how Tally-O can provide automatic reports that can be sent to the government and/or I-Fish database.
MDPI is also looking at the necessary interoperability of these different systems as next steps. BESTTuna program researchers examining the costs of the programs and are working to create a formula to estimate the ROI on traceability investments and to determine a unit cost of traceability.
Key features/outcomes
• Focus to facilitate industry in conducting traceability and technological innovations.
• Built on the learnings of the IFITT program. • Piloting of technological features (Spot trace, Point97/electronic I-Fish and
Smithsonian app) aimed at the fisher and processor. • Electronic internal Tally-O system for fast and easy on site monitoring for
processors.
Strength/opportunities • At sea traceability features with satellite connection (Spot trace). • Electronic I-Fish data collection (0.97 application). • Provided a feature targeted at different nodes – middlemen, processors
(Smithsonian, Tally-O). • Complements existing approaches and focus on benefitting the industry
and providing incentives to participate in traceability and data collection. • Looks at system interoperability.
Weaknesses/lessons learned
• Software development costs are expensive versus off the shelf systems which may not be able to incorporate intricacies of small scale fisheries.
• Technology deployment in rural Indonesia is complicated due to issues with connectivity.
• Mistrust by fishermen of Spot Trace systems, feeling watched. • Uptake by users of technology not always easy, due to low capacity of fish
workers. Requires frequent training. Fair-Trade USA Fair Trade USA, established in 2014, requires chain of custody (COC) and a full traceability program. Indonesia’s only Fair Trade certified fish comes from Ambon where the required COC it is being implemented with Anova and PT Harta Samudra. The fair-Trade COC has the ability to track product from shelf to one of the 36 fishing associations participating in the scheme. A consumer can enter the bar code of the product they purchased into the Thisfish system and receive information about the fish, including its origins, sustainability and social credentials.
A total of 72t of Fair Trade yellowfin (processed to fillets) were transported and fully traced to the U.S. market in 2015.
Key features/outcomes
• Provides fully consumer facing traceability. • Provides data to I-Fish.
Strength/opportunities • A model version of an all compassing traceability scheme with both comprehensive data collection and supply chain related information.
• Provides a feedback loop between market and fishers/community. • Clear premiums as a benefit of full transparency to fishers.
Weaknesses/lessons learned
• Full chain not electronic, still has excel based components. • High costs of setup and full implementation, these are being absorbed by
Anova. • The premium available to the community and PT Harta Samudra is the
driving incentive for participation.

USAID Oceans and Fisheries Partnership Page 51 of 105 Value Chain Assessment: Bitung, Indonesia
PT Bali Seafoods PT Bali Seafoods, the Bali subsidiary of North Atlantic Seafood Inc., operates in Sumbawa where it is constructing a processing plant with a view of expanding fish collection from various fisheries around the island with a final processed product going for the U.S. retail market.
In 2017, PT Bali Seafoods is piloting Pelagic data systems on up to 60 small boats. Pelagic data systems are a vessel tracking system (see also below) that records the locations of the vessels in real time via mobile phone connection.67 If the vessels are out of reach, the update happens when the connection is re-established. The data is then submitted to a cloud-based data analytics system and also in this case submitted to a SkyTruth (see further below). The company itself has a dashboard that it uses to monitor the fleets and their movements and the analytics provided.68
The idea is that eventually the system will also provide the following information to the processor: date, time, catch location and on-board storage temperature at sea; species, size, catch weight and grade at landing; as well as the price paid to the fisherman.
For large boats, >30 GT, PT Bali has signed an MOU with Traceall Global (see further below) to implement an Electronic Reporting system (ERS). The ERS system is planned to be compatible with existing satellite vessel monitoring systems (VMS). When interviewed, PT Bali had no update on this program and was focused on working with the smaller vessels. The full roll out and implementation of this technology remains to be seen.
In addition, the PT Bali traceability system includes digital product document requirements of the Trace Register in the U.S. (see also Trace Register below), which is a requirement of many retailer clients of PT Bali. Government receives PT Bali data via the traditional paper based reporting.
Key features/outcomes
• Vessel tracking system to monitor fleet movements. • Pelagic data system is autonomous, solar powered and can store of-line
data for up to a year.
Strength/opportunities • Fishers cannot manipulate/tamper with the data box provided. • Analytics and SkyTruth based technologies are highly scalable and usable
for the benefits of fisheries management as available to partner governments.
Weaknesses/lessons learned
• The system does not provide incentives for fishers as there is no interphase for providing data/information for them.
• It is not clear how the vessel based data is being combined with the Trace register related information and full supply chain traceability technology.
Sustainable Fisheries Partnership/Lini Sustainable Fisheries Partnership (SFP) and its local partner Lini, as part of their Indonesian Fisheries Improvement Projects (FIPs), encourage the FIPs to improve traceability in order to ensure that the origins and status of their products are well-known and sourced from legal fisheries. SFP has a system (Metric System) that is being used by their retailer partners to ask their suppliers inform about their products such as species, fishing gear used and fishing ground – which is then related to database in FishSource profiles.
On yellowfin tuna FIPs: the company PT Intimas Surya, one of the tuna FIP implementers, is trying to improve the traceability of their products coming from Indian Ocean through their long-line vessels and their traditional handline tuna coming from the Banda Sea, with a focus of sea traceability.
On blue swimming crab FIPs: SFP is working with the Indonesia Blue Swimming Crab Processing Association (APRI) on a Control Document to ensure the compliance of the regulations that will also support the documentation and traceability of blue swimming crab products.
67 http://www.pelagicdata.com/#pds 68 http://www.pelagicdata.com/howitworks/

USAID Oceans and Fisheries Partnership Page 52 of 105 Value Chain Assessment: Bitung, Indonesia
2.7.2 Traceability vendors with programs in Indonesia
In addition to the data collection and traceability programs introduced in Section 2.7.1, there are several vendors that are conducting their own independent pilots on data collection and traceability provided by various international and national companies. Please note, this review does not include the registered VMS providers and instead focuses on non-regulatory market driven approaches. EcoHub Solutions: mFish (Artisanal Fishers) mFish was a pilot project run by Future of Fish, 50in10, USAID, the U.S. State Department and Tone in 2015.69 The project was piloted in East Lombok, with MDPI and in West Lombok and North Sulawesi assisted by local NGO, Lini. The project aimed to test the usability of mobile phone based technology provided by Tone as a basis for fishery related data collection.
Handline tuna and tongkol fishers and traders were provided Android smartphones by Tone to test data entry on the location, size, species and other related information to enable origin based traceability. Fisher participation was incentivized with inexpensive call and data time by a network operator XL, yet fishers were still reluctant to supply data.
The fishers fishing within four miles from the shore were quickly able to operationalize the GIS and mapping systems and reduced their fishing effort per day from five hours per day to just one hour, with consequent time and fuel savings, as a result of receiving plankton data on fishing areas. The traders were also able to communicate with the fishers through the system and better anticipate catches and volumes through improved communications. The GPS position, plankton and weather data and the use of WhatsApp for communications were the features that proved to be most beneficial to the fishers. The pilot also showed that even though the data program was provided for free, 85% of the fishers would have been willing to pay for the service and that they would have even purchased the phones themselves if the phones could be purchased in installments.
In Indonesia, EcoHub has signed an agreement with MMAF to link its SmartFisher application into mFish and provide the fishers with port landing data and prices. Further, EcoHub and its partner FishTrax, of Oregon State University, are examining an open access supply chain traceability solution for developing nations. As part of the open access approach users can access the system either free or at very low cost enabling, especially the first mile small-scale users to participate. It remains to be seen how data collection for government as well as any interoperability issues are solved in this next phase. When interviewed, mFish was in talks with other technology providers (e.g. blockchain) over possible collaboration.
Key features/outcomes
• Provides mobile technology based data participated by fishers and traders directly.
• Allows for incentives based operations and provided usability feedback with fishers.
• Can integrate with other traceability applications. Strength/opportunities • The costs of the technology are relatively low compared to enumerators
and provides good scalability. • The partnership with the network operator and incentives created in the
form of the data apps seem to be attractive for fishers. • Provides endless innovation opportunities and features such as online
banking, customer feedback.
Weaknesses/lessons learned
• Depends on mobile network coverage for the operability and incentives to work, adding iridium coverage might scale up the costs too much for small-scale.
• Data accuracy could be an issue. Needs an additional monitoring system to ensure no false data is entered just to receive the incentive (needs a mass balance check system).
69 http://www.tonehome.com/mfish/

USAID Oceans and Fisheries Partnership Page 53 of 105 Value Chain Assessment: Bitung, Indonesia
• No interoperability with other systems included in the pilot (E.g. Inmarsat).
• No specific full chain traceability or connections to government data collection such as I-Fish present currently (this is being addressed by Ecohub and Fishtrax but not yet operational).
Pointrek Since 2003, PT. Sisfo Indonesia has developed Pointrek, an innovative monitoring solution system for the oil and gas and maritime sector with over 1,000 deployments. Pointrek can use General Packet Radio Service (GPRS) technology to provide solutions to minimize operating costs and enable to be combined by GPRS and Satellite to meet all requirements in accordance with the characteristics of monitored vessels/asset.
For on water technology within Indonesia, Pointrek is deploying an e-logbook, VMS, connectivity, safety at sea and traceability package. Currently, the e-logbooks are not feeding into the government e-logbook programs although there is an ongoing dialogue with the government. PT. Sisfo Indonesia envisages the technology to also be able log and track fishing encounters, produce catch certificates and other relevant documentation with the ease of pushing a button.
Connectivity and potential safety at sea is one of Pointrek’s strong points, and they are aiming to be one of the pioneering companies that will be able to offer Wi-Fi accessibility at sea for a reasonable cost. Pointrek is at the top-end of VMS approved suppliers, the group has an established monthly lease structure with state owned bank BNI.
Key features/outcomes
• One of the few authorized VMS providers in Indonesia. • Leading the development of affordable WIFI connectivity on water. • Can track efficiency of fleet, valuable technology for a company managing
a multiple of vessels. • Set up a lease arrangement with BNI state owned bank. • Indonesian owned and operated.
Strength/opportunities • Over 13 years of experience developing technology for the maritime sector.
• Have ongoing close dialogue with MMAF. • Most advanced on connectivity options. • Self-funded and commitment to continue to develop.
Weaknesses/lessons learned
• Cost prohibitive for small scale sector. • Equipment requires sufficient space, prohibitive for the small scale sector.
Provenance Provenance, a UK-based company, has established a platform to improve transparency in the supply chain of certain products. Provenance conducted a 3-day pilot on pole-and-line supply chain in Maluku in 2015 supported by IPNLF to test the suitability of blockchain to meet the traceability needs of the market.70 Blockchain is a digital ledger or record of information that is accessible to everyone but transfers data in a secure way. The goal of the pilot was to obtain robust proof of compliance to standards at origin and along the chain, prevent the “double-spend” of certificates and explore how these new technologies could form the basis for an open system for traceability powering consumer-facing transparency. The core feature of this technology is decentralization that would avoid the issue of a governing 3rd party or monopoly over the system that could then also become the single point of weakness in the system (bribery, social engineering, targeted hacking).
The Provenance application is designed to work through a simple smartphone interface – either through the Provenance application itself or by linking Provenance with existing interfaces and systems for data capture
70 https://www.provenance.org/tracking_tuna_on_the_blockchain

USAID Oceans and Fisheries Partnership Page 54 of 105 Value Chain Assessment: Bitung, Indonesia
along the supply chain. The application links identity, location, material attributes, certifications and audit information with a specific item or batch ID. The data is stored in an immutable, decentralized, globally auditable format which protects identities by default, allowing for secure data verification. Fishermen and other supply chain participants can enter data into the system by simply sending an SMS.
The pilot claimed to have worked parallel to the MDPI project on traceability at the Fair-Trade site, however, it was not confirmed by MDPI and hence, the interoperability aspect with the technology employed is yet to be proven in the fishery context.
Key features/outcomes
• Secure data collection and transfer using mobile phone technology, Blockchain data transfer and electronic tagging.
• Decentralized information system.
Strength/opportunities • Potentially relatively inexpensive technology and scalable. • Decentralization of the data avoids third party monopoly. • Looks at interoperability with existing systems as a core function. • Consumer facing features combined with secure data transfer.
Weaknesses/lessons learned
• At sea capacity to report is limited by mobile phone coverage. • Current pilot did not look at data collection verification issues nor
sharing with government. • No independent monitoring of fishing activity, based on self-reporting by
fishers may require verification.
Pelagic Data Systems (PDS) PDS, a U.S.-based company, has developed an automatic small-scale vessel tracking system that records the locations of the vessels in real time via mobile phone connection.71 If the vessels are out of reach the update happens when the connection is re-established. The data is then submitted to a cloud based data analytics system database accessible to the client.
At the time of this study, PDS had deployed 250 units to date for pilots in four fisheries in Indonesia, however, only one of the pilot sites will start paying for the service in the short-term. PDS’ costs include start-up costs of US$150 for the purchase of the unit and initial subscription and US$20 per month for the data connection and analytics per unit/vessel traced. The expected life-time of a unit is 5 years.72 PDS also offers additional features determined according to customer demand, such as an SOS button connected to satellite to address fisher safety issues which is under discussions.
Key features/outcomes
• Vessel tracking system to monitor fleet movements. • Pelagic data systems is autonomous and solar powered. Can store of-line
data for up to a year.
Strength/opportunities • Fishers cannot manipulate/tamper with the data box provided. • Analytics are highly scalable and usable for the benefits of fisheries
management as available to partner governments. Weaknesses/lessons learned
• No ability to collect catch data. • The system does not provide incentives for fishers as there is no
interface for providing data/information for them. • Interoperability issues with supply chain based traceability systems remain
to be solved/tested.
71 http://www.pelagicdata.com/#pds 72 http://www.pelagicdata.com/howitworks/
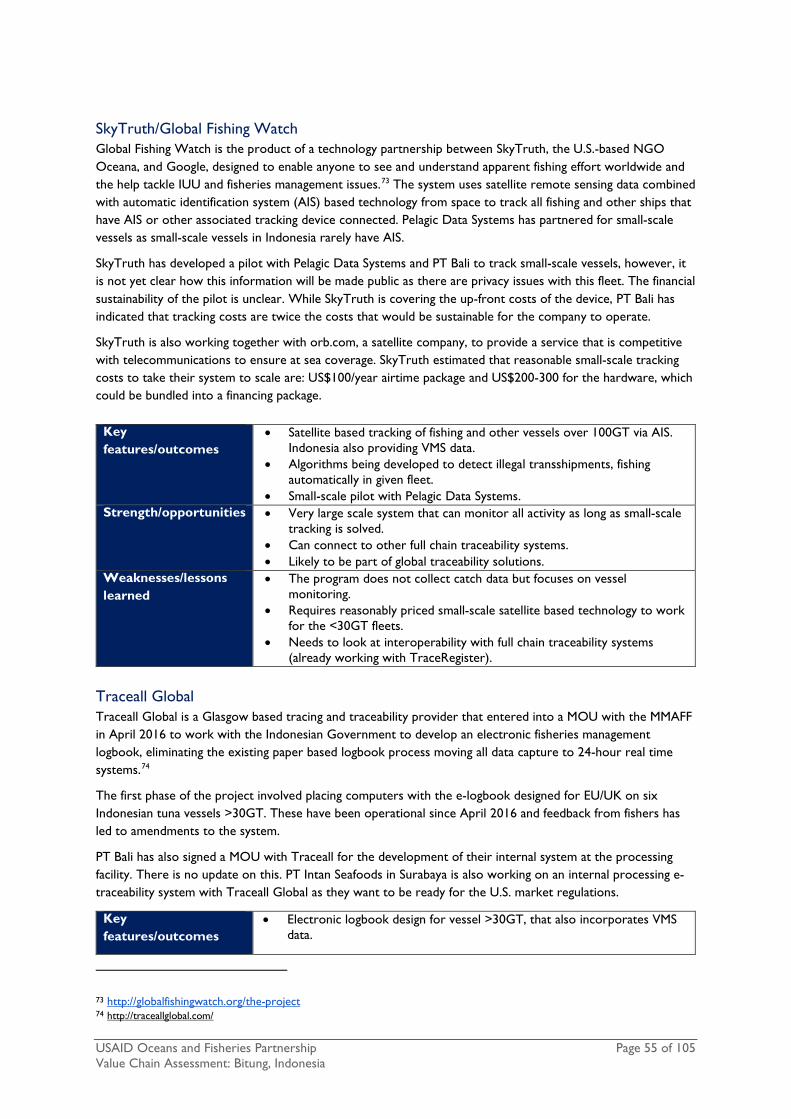
USAID Oceans and Fisheries Partnership Page 55 of 105 Value Chain Assessment: Bitung, Indonesia
SkyTruth/Global Fishing Watch Global Fishing Watch is the product of a technology partnership between SkyTruth, the U.S.-based NGO Oceana, and Google, designed to enable anyone to see and understand apparent fishing effort worldwide and the help tackle IUU and fisheries management issues.73 The system uses satellite remote sensing data combined with automatic identification system (AIS) based technology from space to track all fishing and other ships that have AIS or other associated tracking device connected. Pelagic Data Systems has partnered for small-scale vessels as small-scale vessels in Indonesia rarely have AIS.
SkyTruth has developed a pilot with Pelagic Data Systems and PT Bali to track small-scale vessels, however, it is not yet clear how this information will be made public as there are privacy issues with this fleet. The financial sustainability of the pilot is unclear. While SkyTruth is covering the up-front costs of the device, PT Bali has indicated that tracking costs are twice the costs that would be sustainable for the company to operate.
SkyTruth is also working together with orb.com, a satellite company, to provide a service that is competitive with telecommunications to ensure at sea coverage. SkyTruth estimated that reasonable small-scale tracking costs to take their system to scale are: US$100/year airtime package and US$200-300 for the hardware, which could be bundled into a financing package.
Key features/outcomes
• Satellite based tracking of fishing and other vessels over 100GT via AIS. Indonesia also providing VMS data.
• Algorithms being developed to detect illegal transshipments, fishing automatically in given fleet.
• Small-scale pilot with Pelagic Data Systems. Strength/opportunities • Very large scale system that can monitor all activity as long as small-scale
tracking is solved. • Can connect to other full chain traceability systems. • Likely to be part of global traceability solutions.
Weaknesses/lessons learned
• The program does not collect catch data but focuses on vessel monitoring.
• Requires reasonably priced small-scale satellite based technology to work for the <30GT fleets.
• Needs to look at interoperability with full chain traceability systems (already working with TraceRegister).
Traceall Global Traceall Global is a Glasgow based tracing and traceability provider that entered into a MOU with the MMAFF in April 2016 to work with the Indonesian Government to develop an electronic fisheries management logbook, eliminating the existing paper based logbook process moving all data capture to 24-hour real time systems.74
The first phase of the project involved placing computers with the e-logbook designed for EU/UK on six Indonesian tuna vessels >30GT. These have been operational since April 2016 and feedback from fishers has led to amendments to the system.
PT Bali has also signed a MOU with Traceall for the development of their internal system at the processing facility. There is no update on this. PT Intan Seafoods in Surabaya is also working on an internal processing e-traceability system with Traceall Global as they want to be ready for the U.S. market regulations.
Key features/outcomes
• Electronic logbook design for vessel >30GT, that also incorporates VMS data.
73 http://globalfishingwatch.org/the-project 74 http://traceallglobal.com/

USAID Oceans and Fisheries Partnership Page 56 of 105 Value Chain Assessment: Bitung, Indonesia
Strength/opportunities • Tested design /system that is being simplified for use in Indonesia.
Weaknesses/lessons learned
• Only provides data collection and first mile focused traceability. • Has no solution to small-scale vessel tracking currently (GPS based
technology solution).
Trace Register
Trace Register is a secure web based database offering electronic traceability for food supply chains.75 It is a turnkey online solution that provides secure product registration, unique product level identification, confidential on-line data management and transfer through an independent data repository, and immediate compliance with food traceability regulations and standards. The system allows data entry and sharing at every step of the supply chain, such as safety, quality, regulatory, sustainability, import and compliance information.
The system is used by many U.S. retailers, wholesale buyers and their suppliers. As a result, it operates in over 40 countries that export seafood to the U.S.
It does not provide consumer-facing traceability, does not include at sea/vessel based data, and relies on supply chain providing accurate information. It does have an analytics service that (at cost) can provide summarized catch and trade related data that can also be used by governments. Trace Register has a monopoly in the U.S. market in terms of buy in from the retail sector and participation is required for Indonesian exporters to the U.S. Trace Register is advertising itself as a cost-efficient system but the exact fees and benefits are not clear without becoming a registered user.
Key features/outcomes
• Centralized product document database that is internet based used in the U.S. market.
Strength/opportunities • Provides electronic transfer of information from different nodes on products to ensure legality and meeting U.S. market based requirements.
• Internet based, no special hardware or software needs. • Easy to use and cost efficient. • Can provide analytics on demand (at cost).
Weaknesses/lessons learned
• Companies providing the data have to pay for the analytical part making it less attractive to use the intelligence for operational means.
• Needs to be complemented with on the water and consumer facing platforms and technology separately.
• Data verification is difficult. ShipsInsight ShipsInsight is a UK based company that has developed a vessel tracking application that can be run on any smart phone/tablet and provides location information and monitoring of different parameters onboard such as the freezer temperature and fuel usage, depending on the package purchased.76
The lite program without vessel tracking and operational monitoring is free (just provides a communication platform with vessel/crew) and the monthly fees vary between US$29.99 and US$79.99, depending on the sophistication of the data analysis and alerts applied. The US$29.99 package will provide one tracking device to go with the application, the minimum per vessel fee for vessel tracking. The system is still dependent on mobile phone coverage.
75 http://www.traceregister.com/solutions/ 76 http://www.shipsinsight.com/pages/features

USAID Oceans and Fisheries Partnership Page 57 of 105 Value Chain Assessment: Bitung, Indonesia
The application was tested with a number of tuna boats in Sulawesi, the pilot reportedly was successful in that the vessel movements were easily tracked and the application easy to use for the fleet manager, as it provided greater insight into vessel location, ETAs at landing sites, fuel usage, etc.
Key features/outcomes
• Company facing vessel and operational data monitoring system. • Works on multiple hardware so economic to install.
Strength/opportunities • Vessel tracking and operational data combined. • Provides more incentive for fleet managers. • Data analysis and operational alerts. • Safety alerts included.
Weaknesses/lessons learned
• Does not include other data collection features. • Needs to work out interoperability with other systems. • Requires mobile phone connectivity.
E-Nelayan The Institute of Technology Bandung (ITB) of Indonesia has developed the prototype for a mobile phone application called E-Nelayan targeted at fishermen. The application has been tested in small scale fishers operating vessels below 5GTin Belitung Timur.77
The application can be customized to either use a mobile phone network or radio link. The idea is to use the Android Application Program Interface (API) to display features on smartphone such as: map tracking, satellite database, among others. The ITB is collaborating with the national Meteorology Climatology and Geophysics body, Badan Meteorologi, Klimatologi, dan Geofisika (BMKG), and MMAF to connect content data such as weather forecasting and fish position forecasting via mobile network to E-Nelayan. The application also has a GPS function to track fishers, as well as allow the fishermen enter the catch details and location. E-Nelayan has fishermen-facing incentives such as weather information, price information of certain buyers, and user chat features.
It is not currently clear how widely this application has been tested nor the number of the participants in the pilot, as well as its usability and acceptance by the fishers. The costs of the application are not known. The pilot thus far has used radio link connection mode rather than mobile phone, as the mobile phone networks only operate at a distance up to 7 Km from shore. The fishermen have found the wave height data as the most useful information. The project is assuming that the fishers cannot pay for the device and it would need to be subsidized by MMAF.
2.7.3 Other programs supporting traceability
Over the past years, from 2014, Indonesia has witnessed significant capacity provided by NGOs, industry associations and Government supporting greater transparency and chain of custody. Indonesia has been recognized by the market and regional bodies for these advances, although aware still a long way to go. Below are two such programs:
Pro-active Vessel Reregistration (PVR) for small-scale tuna vessels This is a program initiated by International Seafood Sustainability Foundation (ISSF) and assisted by IPNFL, MDPI and AP2HI on the ground in Indonesia in 2015 and 2016. The aim of the program is to develop a robust system for physically marking and identifying vessels which is essential to enable auditing and verification of vessel details as part of the PVR. The objective of the PRV registration is for tuna vessels to identify themselves as active members of tuna related sustainability and traceability programs such as no shark finning
77 http://www.pme.itb.ac.id

USAID Oceans and Fisheries Partnership Page 58 of 105 Value Chain Assessment: Bitung, Indonesia
on board and no IUU. As ISSF was calling on retailers to request PRV registration from vessels they source tuna from, there was a need for ISSF to see how the small-scale sector can be meaningfully involved in the program.78
Early in the project it became apparent that existing vessel identifiers (e.g., license numbers, vessel names, IMO numbers) were insufficient due to duplication, a lack of ubiquitous application, and difficulties verifying details in the field. While the development of a standard uniform vessel identification (UVI) format for AP2HI member vessels went some way towards solving this challenge, a means of physically marking vessels with this identifier was needed. Initial piloting using vinyl stickers did not withstand the wear and tear onboard a fishing vessel. Subsequent designs using aluminum or acrylic plaques are much more resilient, and have been effective at displaying identifiers in a prominent position onboard pole-and-line vessels. However, production costs are prohibitively high for the large number of vessels within the hand-line fishery. Wallet-size identification cards are currently being piloted, and a means of ensuring that cards remain associated with a single vessel are currently being explored.
As of middle of 2016, 800 handline and 70 pole and line boats have been registered an associated training provided. The project aim is to have all AP2HI one-by-one fishers registered. The program still includes manual data entry for the vessel registry and also for connecting with the R-VIA program described below.
R-VIA Indonesia registry for tuna vessels The government has an online publically available record of vessels authorized to fish for tuna, skipjack tuna and neritic tuna within Indonesia Archipelagic and Territorial Waters and the Indonesian EEZ.79 The database also provides information to the various tuna RFMOs (IOTC, CCSBT, WCPFC). The system also allows for uploading and updating data on the number of fishing vessels by type of fishing gear, owner, operational area, validity of license in a timely manner (near real time) and can be accessed on-line by the public both nationally and internationally. The database currently holds 3,244 records, of which, 593 are below 10GT, 535 are between 10 and 30GT and 2,166 are above 30GT.
2.7.4 Programs not yet active in tuna in Indonesia
Friend of the Sea Friend of the Sea (FOS) is a non-profit organization and international certification for farmed and wild seafood. The FOS criteria are based on the FAO Guidelines for eco-labeling and include a traceability component to the program. The traceability audit checklist is available to download from the FOS website, and has three requirements: that a program must be in place to prevent product mixing with uncertified product, that there is clear identification of the origin and fishing method, and that the fishery uses all available interconnected traceability methods for larger boats as part of a marking system and non-forgeable document tracing system. The form also notes that one test at the beginning and end of a batch of finished product must be conducted, inspecting mass balance, bills, invoices and other relevant documents for conformity to the standard. These audits are conducted by an independent Certification Body.
2.8 Importance of traceability
An effective catch documentation and traceability system (CDTS) should be able to document and trace the movement of seafood through along the value chain from the point of catch through production, processing and distribution. A CDTS that has the ability to capture the movement of fish as is passes through the supply chain can help counter IUU fishing, which has the ability to enter the supply chain at multiple stages.
IUU fishing, both in sovereign waters and adjacent, can jeopardize a country’s food security, especially when straddling stocks such as tuna are involved. There are also significant economic consequences of IUU fishing, as
78 http://iss-foundation.org/knowledge-tools/databases/proactive-vessel-register/ 79 http://rvia.kkp.go.id/
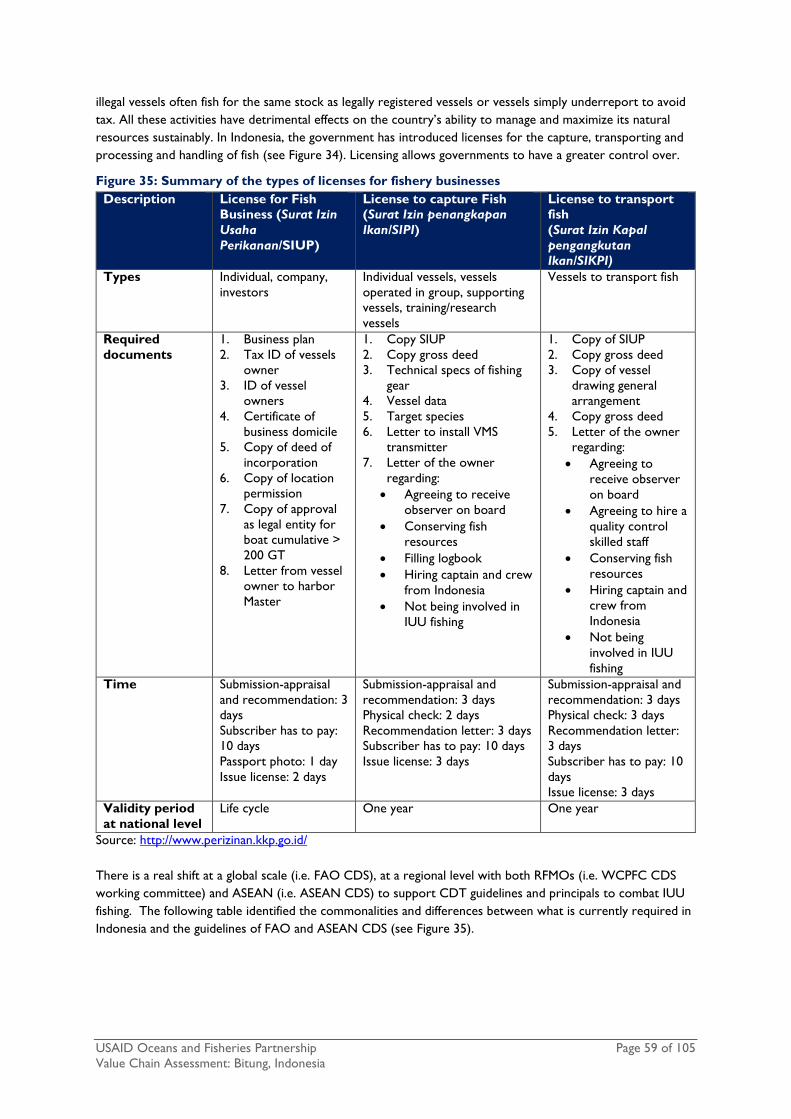
USAID Oceans and Fisheries Partnership Page 59 of 105 Value Chain Assessment: Bitung, Indonesia
illegal vessels often fish for the same stock as legally registered vessels or vessels simply underreport to avoid tax. All these activities have detrimental effects on the country’s ability to manage and maximize its natural resources sustainably. In Indonesia, the government has introduced licenses for the capture, transporting and processing and handling of fish (see Figure 34). Licensing allows governments to have a greater control over.
Figure 35: Summary of the types of licenses for fishery businesses Description License for Fish
Business (Surat Izin Usaha Perikanan/SIUP)
License to capture Fish (Surat Izin penangkapan Ikan/SIPI)
License to transport fish (Surat Izin Kapal pengangkutan Ikan/SIKPI)
Types Individual, company, investors
Individual vessels, vessels operated in group, supporting vessels, training/research vessels
Vessels to transport fish
Required documents
1. Business plan 2. Tax ID of vessels
owner 3. ID of vessel
owners 4. Certificate of
business domicile 5. Copy of deed of
incorporation 6. Copy of location
permission 7. Copy of approval
as legal entity for boat cumulative > 200 GT
8. Letter from vessel owner to harbor Master
1. Copy SIUP 2. Copy gross deed 3. Technical specs of fishing
gear 4. Vessel data 5. Target species 6. Letter to install VMS
transmitter 7. Letter of the owner
regarding: • Agreeing to receive
observer on board • Conserving fish
resources • Filling logbook • Hiring captain and crew
from Indonesia • Not being involved in
IUU fishing
1. Copy of SIUP 2. Copy gross deed 3. Copy of vessel
drawing general arrangement
4. Copy gross deed 5. Letter of the owner
regarding: • Agreeing to
receive observer on board
• Agreeing to hire a quality control skilled staff
• Conserving fish resources
• Hiring captain and crew from Indonesia
• Not being involved in IUU fishing
Time Submission-appraisal and recommendation: 3 days Subscriber has to pay: 10 days Passport photo: 1 day Issue license: 2 days
Submission-appraisal and recommendation: 3 days Physical check: 2 days Recommendation letter: 3 days Subscriber has to pay: 10 days Issue license: 3 days
Submission-appraisal and recommendation: 3 days Physical check: 3 days Recommendation letter: 3 days Subscriber has to pay: 10 days Issue license: 3 days
Validity period at national level
Life cycle One year One year
Source: http://www.perizinan.kkp.go.id/ There is a real shift at a global scale (i.e. FAO CDS), at a regional level with both RFMOs (i.e. WCPFC CDS working committee) and ASEAN (i.e. ASEAN CDS) to support CDT guidelines and principals to combat IUU fishing. The following table identified the commonalities and differences between what is currently required in Indonesia and the guidelines of FAO and ASEAN CDS (see Figure 35).

USAID Oceans and Fisheries Partnership Page 60 of 105 Value Chain Assessment: Bitung, Indonesia
Figure 36: Comparison of the different CDT standards versus current government requirements in Indonesia
Supply Chain Nodes
Government of Indonesia
FAO CDS Recommended Standards
ASEAN CDS Recommended Standards
Fishing Vessel
Requirements: • VMS (>30GT) • Log Books • Observer on Board
(PS) • Fishing License • Catch Certificate • CCTV for
transshipment at sea • Fishery officer at off-
load
Catch certificate: • Unique, secure document
number • Identity and contact details
of issuing competent authority (i.e. name, address, phone, email)
• Identity of fishing vessel (i.e. name, flag, registration number, unique vessel identifier, call sign)
• Fishing dates (from and to) • Description of fish (i.e.
species, area caught, product form, weight)
• Unloading details (i.e. port/location, transshipment)
Recommendations: • Catch declaration or
logbook/log-sheet declared by the captain and reported to the competent authority
• Competent authorities verify catch declaration, logbook, log-sheet
• Competent authorities submit a copy of catch declaration to national authorities and statistics units
Processor Exporter
Requirements: • Fishing business
license • License to transport
fish • Exporters license • HACCP license • BKIPM approved • Certificate of origin • Letter from PSDKP
that the fish is no the product of IUU fishing
• Health certificate
Trade certificate: • Unique, secure document
number • Previous trade certificate
number (if applicable) • Originating catch
certificate number • Identity and contact details
of issuing competent authority (i.e. name, address, telephone, email)
Recommendations: • Catch record (species and
amount used) date, controller name
• Amount of products • Signature from both seller
and buyer • Processing statement by
competent authority • ASEAN Catch Certificate
(ACC) for exportation of fish and fishery products from AMS
• ASEAN Re-export Certificate for export and non-processed fish
The government’s role is to enact policies, regulations and enforcement to enable CDT systems to be implemented nationally. Although there is a trend in the marketplace for traceability to be part of sourcing policies, unfortunately, the marketplace will not solely address these issues of its own accord, but generally requires either regulatory intervention or negative publicity. The actors in the supply chain then react in order to conserve their reputation as acceptable operators.
Similarly, consumers’ demands for traceability and transparency vary. In western markets, the consumer expects that the product is safe, legal, sustainably caught and abuse free and expects that the retailer has the necessary traceability already in place to ensure they can prove the integrity of the individual product. The current paper-based systems claim to do this and it is, in theory, possible to trace a product back to its origin through a “one up, one down” process that requires each of the nodes in the supply chain to have information from the node they from which they purchase as well as the node to which they are selling. If a question related to seafood quality is raised, this system is often so slow that any contaminated seafood is likely to have been sold and distributed by the time the necessary details are recovered all the way up or down the entire

USAID Oceans and Fisheries Partnership Page 61 of 105 Value Chain Assessment: Bitung, Indonesia
supply chain, especially on supply chains as complex those of tropical tuna.80 On a shorter supply chains this system may work better and quicker, especially if the fish is sold fresh and not processed.
Asia-based processors and suppliers are also being pressured by markets to prove specific claims about their supply chains, requiring the electronic management of information.
In the markets such as the UK, retailers are by law required81 to work with their supply chains on transparency and traceability using a preventative risk-based approach to reduce IUU fishing, and ensure sustainability, legality and human rights. Retailers are generally willing to invest time and some money in piloting and developing new systems. However, it is difficult for them to navigate the landscape of different vendors, systems and systems connectivity/interoperability issues. They require a common markets’ based approach, preferably one that works across various supply chains in a compatible manner so that the different systems can be joined up to a single data management platform at the retailer level, for example.
In the U.S., many retailers are now using and requiring all their suppliers to use Trace Register, a cloud-based database that stores product information entered at the different nodes, making it easy to access and check compliance with different regulations. While this system has its advantages in keeping the paper trail electronic, it has limitations in terms of the analytics it provides, the cost to receive them and limited data verification capacity. A more responsive data management system could be more beneficial for the users and, with the interoperability aspect, provide whole chain traceability as needed by the marketplace.
Some early adopting brands are also seeing substantial premiums as a result of the whole supply chain working to ensure the sustainability, legality, and full traceability of a product. Pacific MSC-certified tuna from the PNA fishery, for example, is fully traced via electronic system to the customer warehouse, at which point the end client can develop a consumer facing platform if it will benefit their customers. Abba in Sweden, for example, is building this on their website.
Premium are received for the full-service sustainable, legal, ethical and traceable products—up to a 5% premium compared to other products. The products must be labeled accordingly, which also promises higher returns to the producing PNA countries, providing an element of fair trade to the story. The Indonesian Fair Trade handline yellowfin product gets 30c/kg premium in the U.S. retail market, has a third party audited chain of custody and the associated fairness and sustainability credentials of certification.82
Another recent example of a premium price paid for a traceable product (without the sustainability credentials) is a 20-30% premium for Patagonian tooth fish from a catch documentation scheme set in the Southern Ocean. In contrast, Atlantic bluefin tuna lost 85% of its market value without the appropriate catch certificates.83 These fisheries were very publicly tainted by high levels of IUU fishing, however, and it is not clear if tuna from Indonesia would be able to reach price premiums given the lower level of IUU in the fishery.
2.8.1 Customer preferences
A survey of 16,000 seafood consumers was conducted in early 2016 in 21 different countries84 by GlobeScan. Survey findings show that 72% believe that, to save the oceans, we have to consume seafood only from sustainable sources. About two-thirds said they understand the term ‘sustainable’ (67%) when seen on a product, and believe that people should be prepared to change the seafood they buy to more sustainable options (68%). Almost as many (62%) said ecolabels raise their confidence and trust in a brand, and that
80 S Tolvanen, pers. communication. 81 http://www.legislation.gov.uk/ukpga/2015/30/contents/enacted 82 http://fairtradeusa.org/certification/producers/seafood 83 http://www.seafoodsource.com/commentary/trade-measures-potent-weapont-for-fighting-iuu-fishing?utm_source=informz&utm_medium=email&utm_campaign=newsletter&utm_content=newsletter 84 Australia; Austria; Belgium; Canada; China; Denmark; France; Finland; Germany; Italy; Japan; Netherlands; Norway; Poland; Singapore; South Africa; Spain; Sweden; Switzerland; UK and U.S.

USAID Oceans and Fisheries Partnership Page 62 of 105 Value Chain Assessment: Bitung, Indonesia
independent verification was important to support supermarket and brand claims about sustainability (68%). NGOs and scientists are perceived as contributing the most to protecting the oceans.
Sustainability labels such as MSC and Fair Trade USA are constantly working towards improved consumer recognition and trust. Fair Trade USA, for example, reported a 59% consumer awareness of the label by American in early 2016.85 Commitments to the label by major retail brands outside of boutique ranges helps to bring sustainable and traceable produce to the everyday consumer.86 Interviews by key informants, however, indicate that aggressive marketing and information sharing is also needed to ensure the consumer preference for certified products and the commitment of retailer to move these products.
2.9 Performance issues for Indonesia to meet market requirements on traceability
The Indonesian tuna industry has multiple challenges and performance issues that must be met in order to maintain access to key markets such as the EU and U.S. and meet the increasing demand for timely and accurate traceability.
Several factors need to be considered in conducting traceability: inputs of raw material, management regulations to fulfill global requirements, law enforcement of regulations, human resources, and infrastructure to meet food safety standards. The catch certificate system needs to be implemented for tuna to be exported to either the EU or the U.S. With the current system, only larger vessels would be able to provide sufficient information for a catch certificate. Meanwhile, catch data from small vessels that contribute significantly to tuna production would struggle to meet the requirements. The government is discussing the possibility of a blanket approach to catch certificates, but government and industry must work together to implement a sufficient and efficient CDTS. Each has its role to play. The next section will highlight some of the top line comments from key informant interviews with industry representatives.
Opinions and perceptions of key challenges to meet traceability requirements
Interviews with key industry leaders highlight some of the main challenges and bottlenecks for Indonesia to meet increasing market traceability requirements and implement a CDTS.
• Thomas Dharmawan, Kadin (Indonesia Chamber of Commerce and Industry), Chairman of Permanent Committee on Food and Protein Industry, indicated that the fishing industry complies with CDT regulations for the most part. The biggest concern is the catch certificate at the producer level. Large vessels have to provide catch information from logbook/observer. Small scale vessels have no documentation to present, and catch verification is difficult and time consuming.
• Hendra Sugandhi, Secretary General of Indonesia Tuna Association (Astuin) also highlighted that the critical path is at the producer level because it is difficult to obtain proper catch documentation, especially from small scale vessels that often lack the necessary documentation.
• Ady Surya, Head of Asosiasi Pengalengan Indonesia (APIKI)/Indonesia Fish Cannery Association, mentioned that improving the catch documentation scheme requires improved understanding of the relationships among actors in fishing industry. The fishers or collectors at landing site or local traders will comply with requirements if it is required by the other actors related to their
85 https://fairtradeusa.org/press-room/press_release/fifty-nine-percent-americans-now-aware-fair-trade-certified-products 86 https://www.msc.org/newsroom/news/asc-and-msc-reveal-market-growth-as-they-focus-on-increasing-consumer-demand-and-trust

USAID Oceans and Fisheries Partnership Page 63 of 105 Value Chain Assessment: Bitung, Indonesia
business. He added that Pemda (local government) also plays an important role in informing and enforcing this regulation, especially for the problematic small-scale vessels and managed by Pemda.
• Janti Djuari, Chairwoman of AP2HI, also highlighted a need to support small scale vessels in meeting all the catch documentation and data requirements.
• James Stein, Purse Seine Nusantara, Muara Baru, highlighted the importance of integrating the catch documentation and data with market requirements.
• Hendra Sugandhi, Secretary General of Indonesia Tuna Association (Astuin) also highlighted that fish landings mostly occur outside of office hours when the seaport authority, who has to authorize the catch landing, is not available. This makes it difficult to document the data and receive catch certificates.
Main issues identified
The concerns highlighted by the industry representatives are important as they are the main actors in exporting the products. Their concerns about catch certificates, including obtaining the appropriate information at the harvest level and timely approval of catch certificates, are clearly related to fulfilling export requirements. The processing stage in Indonesia has fewer issues and is not generally considered to be a bottleneck, as most of the processing plants already comply with documentation requirements due to hygiene and safety regulations and enforcement is relatively easy.
Data collection systems are managed by different government agencies with limited cross-checking and validation
Figure 36 is a summary of the current data collection points that can support a catch documentation system and the challenges in obtaining accurate information at the points. Three data systems are used to collect information about tuna catch: 1) captured fisheries production statics, 2) statistics of captured fisheries products transfer at sea, and 3) logbooks.
Figure 37: Challenges of current data collection at point of harvest, based on key informant interviews
Data Source Agent responsible for data collection
Challenges
Captured fisheries production statistics
Fisheries officer • Accuracy • Lack of data on fishing grounds and seasons
Statistics of captured fisheries by observers on board
Observer on board of vessels
• Observers are not required for small scale vessels, so there is limited data collection and cross checking
Logbook Filled by boat master, compiled by harbor master, and processed by DG Captured Fisheries
• Accuracy • Fishers protective of location of fishing grounds • Fishers afraid data will be used for tax purposes • Fishers afraid to report by-catch for fear of
sanctions Source: Field Visit Interviews and Observations Capturing fisheries production statistics is critical to managing the health and sustainability of the fishery. While the current data collected is valuable, there is also a clear awareness that the data is, at times, inaccurate and/or duplicated. There is a tendency for fishers to undervalue the catch documented in the log book to avoid taxes, to prevent others from knowing where their fishing grounds are and to fill in the logbook many days after the catch event.

USAID Oceans and Fisheries Partnership Page 64 of 105 Value Chain Assessment: Bitung, Indonesia
The introduction of catch certificates has been an improvement to Indonesia’s IUU fishing regulations, however, complying with its requirements is often cumbersome and time-consuming, discouraging many fishers from participate and creating incentives for data tampering. Additionally, fishery officers currently collect data by asking the fishers; fishers might provide inaccurate information due to time lags and problems recalling details. Potential reporting inaccuracies and lack of a centralized database between the different government data collecting agencies also decrease the validity of fisheries statistics. The data can only be used to provide a general status update on the fisheries situation rather than a detailed account of the origin of fish.
MMAF put into place a regulation (Regulation No 1, 2013) so observers could be deployed across the tuna fleet according to RFMO and national requirements. Observer programs are an important management tool for capturing sample sets of data on a certain fishing event, such as biological, effort and geographical parameters. However, to date the observer program has had mixed success due to access to vessels and secondly budget restraints.
Limited verification of point of harvest data by small-scale vessels
The Indonesian hand-line tuna fishery is considered artisanal in structure, with vessels ranging from 5-10GT. With relatively low capital requirements compared to other tuna fisheries, there is an opportunity to grow this fishery sustainably. On the other hand, this tuna fishery is the most fragmented, with informal landing sites, networks of traders and most vessels unregistered, an obstacle for meeting tightening export regulations. The point of harvest is critical for CDTS, but there are some systemic failures in Indonesia’s current catch documentation process that hinder the country’s ability to obtain accurate and representative information across the different fishing gears and vessel sizes.
Currently the catch certificate and logbook reporting processes are not mandatory for small-scale vessels of < 5GT and the catch certificate initial sheet is only required for catch exported to the EU. Point of harvest information from small vessels are only provided to the Port Authority on a voluntary basis, or by vessels that are selling their products to exporters that require catch documentation systems. Thus, a significant number of the active artisanal fleet does not provide this information.
Moreover, human capacity constraints coupled with inefficient processes prevent timely capture and dissemination of point of harvest information. As highlighted by the key informants, the availability of personnel needed to verify catch documents can be problematic and the process is time consuming. In practice, it means that only spot checks are performed, leaving significant room for inaccuracies.
In addition, catch documentation for small-scale fisheries is problematic as they often lack the necessary information needed for the verification. Many of these vessels supply very informal traders and supply chains and often land on beaches, making it extremely difficult to monitor. Moving towards an electronic CDTS would allow the government to track fishing days and total fishing effort better, eventually incentivizing or penalizing fishers for not landing at official landing ports, which helps more accurately determine catch volume.
At sea monitoring is restricted to large scale vessels
Under current government regulations, VMS and AIS systems are in place for the vessels >30GT, covering only a small portion of Indonesia’s active fishing fleet. These systems are perceived to be costly. Thus, to attract operators of smaller scale vessels to install them, cost effective and accurate systems will need to be developed and deployed. Improved understanding of where and when the catch was made will be helpful for catch documentation and traceability for globally traded product and will contribute to fisheries management.
Limited automation in data systems and alert processes prevent cross-checking and actionable management
The Indonesian government has made significant strides in drafting regulations that improve the data requirements and collection to prevent IUU fishing and improve transparency within the sector, particularly with the issuance of VMS for vessels. VMS generates a wealth of actionable data that can be used to cross check the accuracy of data provided in catch certificates, performance in different fishing grounds, fishing efficiency and capture, and trespassing on approved fishing grounds. However, the current data management
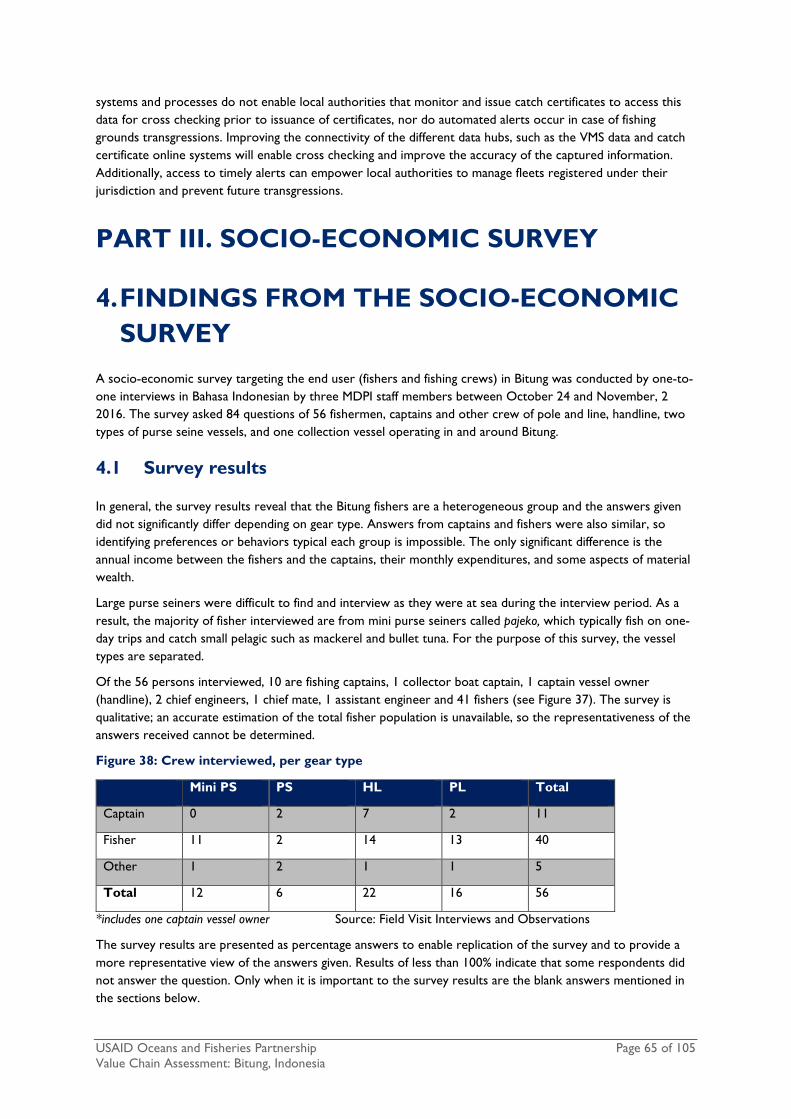
USAID Oceans and Fisheries Partnership Page 65 of 105 Value Chain Assessment: Bitung, Indonesia
systems and processes do not enable local authorities that monitor and issue catch certificates to access this data for cross checking prior to issuance of certificates, nor do automated alerts occur in case of fishing grounds transgressions. Improving the connectivity of the different data hubs, such as the VMS data and catch certificate online systems will enable cross checking and improve the accuracy of the captured information. Additionally, access to timely alerts can empower local authorities to manage fleets registered under their jurisdiction and prevent future transgressions.
PART III. SOCIO-ECONOMIC SURVEY
4. FINDINGS FROM THE SOCIO-ECONOMIC SURVEY
A socio-economic survey targeting the end user (fishers and fishing crews) in Bitung was conducted by one-to-one interviews in Bahasa Indonesian by three MDPI staff members between October 24 and November, 2 2016. The survey asked 84 questions of 56 fishermen, captains and other crew of pole and line, handline, two types of purse seine vessels, and one collection vessel operating in and around Bitung.
4.1 Survey results
In general, the survey results reveal that the Bitung fishers are a heterogeneous group and the answers given did not significantly differ depending on gear type. Answers from captains and fishers were also similar, so identifying preferences or behaviors typical each group is impossible. The only significant difference is the annual income between the fishers and the captains, their monthly expenditures, and some aspects of material wealth.
Large purse seiners were difficult to find and interview as they were at sea during the interview period. As a result, the majority of fisher interviewed are from mini purse seiners called pajeko, which typically fish on one-day trips and catch small pelagic such as mackerel and bullet tuna. For the purpose of this survey, the vessel types are separated.
Of the 56 persons interviewed, 10 are fishing captains, 1 collector boat captain, 1 captain vessel owner (handline), 2 chief engineers, 1 chief mate, 1 assistant engineer and 41 fishers (see Figure 37). The survey is qualitative; an accurate estimation of the total fisher population is unavailable, so the representativeness of the answers received cannot be determined.
Figure 38: Crew interviewed, per gear type
Mini PS PS HL PL Total
Captain 0 2 7 2 11
Fisher 11 2 14 13 40
Other 1 2 1 1 5
Total 12 6 22 16 56
*includes one captain vessel owner Source: Field Visit Interviews and Observations
The survey results are presented as percentage answers to enable replication of the survey and to provide a more representative view of the answers given. Results of less than 100% indicate that some respondents did not answer the question. Only when it is important to the survey results are the blank answers mentioned in the sections below.

USAID Oceans and Fisheries Partnership Page 66 of 105 Value Chain Assessment: Bitung, Indonesia
Some respondents provided clearly wrong answers, such as those in response to the mobile phone carrier. Also, in many cases, the pre-made choices were not used as answers but rather respondents entered free worded answers, thus complicating drawing a resounding conclusion. Different and similar answers were grouped together in order to find some representativeness in the answers, but the free worded answers made this difficult and led to some bias in the results. There is also a high likelihood that some questions such as “are you interested in an insurance” were biased as the type of insurance was not explained.
2.9.1 Fishing distance, duration
The average overall vessel trip distance was 76nm. The collection vessel did the furthest trips of up to 250nm, spending 15 days at sea per trip. The handline fishers went on average 64 nm (6-200nm) on 16 day long average trips. Pole-and-line vessels went on average 77nm (4-100nm), taking 7 days per trip. The mini purse seine travel to 59nm and the large purse seine to 200nm. The large purse seiners do 21-180 day trips while the mini purse seiners go on single day trips (see Figure 38).
Figure 39: Average crew number, distance travelled and fishing days per trip for the different gear types
Mini PS PS HL PL
Average number of crew 19 20 6 27
Average distance travelled (nm) 20nm 180nm 64nm 77nm
Average trip duration (days) 1 21 14 7
2.9.2 Age, education, family relations
The average age of the interviewees was 39 years; the youngest crew member was 21 years old and the oldest 67. The fishers’ average age was 39 years old, the captains 41 and other crew 35.
Figure 40: Level of education of the different groups of respondents
Total Fishers Captains Other
SD: elementary school 9 7 2 0
SMP: junior high school 20 16 3 1
SMA: senior high school 23 13 7 3
SMK: Vocational High School (same level with SMA) 2 2 0 0
STM: technical high school. (same level with SMA) 1 1 0 0
D3: Diploma 3 1 1 0 0
In terms of education, 16% had only finished elementary school, 35.7% junior high school and 46.6% senior high school or equivalent. Only one person, a fisher, had completed an undergraduate diploma. The captains were found to be slightly better educated; over half of those surveyed completed senior high school, whereas less than half of the fishers had reached this level (see Figure 40).
Source (Figures 38, 39): Field Visit Interviews and Observations

USAID Oceans and Fisheries Partnership Page 67 of 105 Value Chain Assessment: Bitung, Indonesia
The average number of dependents was 2.6, with 21.4% of the respondents not having any dependents at all. The average number of children below age of 18 was 1.3, with 0.8 children enrolled at school per interviewee. Out of all the respondents, only 16.1% had a spouse with income. 14.3% had dependents with income, as well.
2.9.3 Healthcare, assets and material wealth
The majority (60.7%) of the respondents do not have access to any healthcare, 37.5% have access to BPJS, 1.8% to Prudential.
Approximately 12.9% of the respondents had a kartu nelayan, a fishermen identification card, recognizing them as a registered fisherman (6 handline, 1 purse seine, 2 fishers, and 5 captains).
About 55.4 % people do not own house or land (including 5 captains). The answers about the size of the house or land were not clear. An estimated 16.1% of the respondents do not own any assets. The majority of the of the respondents (66%) have TV and electricity/generator but no piped water. 8.9% of the respondents have only electricity/generator, and further 14.3% have electricity/generator and also piped water. 12.5% have electricity/generator, piped water and TV, 8.9% have all of that plus a tablet or computer.
64.3% do not own any mode of transport. 32.14 % own a motorbike, 1.8% own a boat (<5GT) and a motorbike and 1.8% a boat (<5GT).
The captains had slightly more material wealth than the fishers in that 100% of the captains owned a motorbike and all of the captains had at least a TV and electricity/generator.
2.9.4 Mobile phone use, information needs, connectivity at sea
12.5% of respondents do not have a mobile phone, 87.5% do. Of these, 30.4% have a smart phone (8 fishers, 1 chief engineer, and all of the captains). None have access to their phone at sea according to the survey. In terms of accessing information at sea, 94.6% of the respondents said it is very important. About 3.6% said it is critical (captain and a fisher on pole-and-line), and for 1.8% it is not important (mini purse seine fisher).
Of the mobile users, 93.9% use SMS or data on their phone. 24.5% use SMS/data connection every day and 6.1% use it other than every day.
The majority of the respondents, 69.9%, do not use the internet at all and 7.1% did not answer the question. Of the 23.3% that use internet (7 fishers, 5 captains, 1 other) 38.5% use it for social media, 53.8% for browsing and social media, and 7.7% for browsing, email and social media (just one person, purse seine fisher). Of the phone users 44.9% use their phone for personal/family purposes only, 10.2% use it for family/personal and social media, 8.2% use it for work also (3 captains and one fisher), the rest were NA.
While they are on land, only one person (1.8%) gets fishing related information from the internet, 1.8% from newspaper/government and the rest (94.6%) obtain relevant fisher information via radio, fisher networks or the government.
While at sea 85.7% of the respondents currently require weather, fishing related info or safety info. 10.7% require weather and safety information only. Only one person (1.8%) reported needing price information (pole-and-line captain).
On non-fishing related information needs, while at sea almost everyone (91.1%) currently only require family related information. 8.9% (all fishers) were also interested in news and other information as well as family. Nobody wanted to reach other kinds of information or conduct transactions while at sea apart from the above mentioned fishing/weather/safety/price and family and social information needs.
The phone carrier/company question was misunderstood during the interviews. As a result, answers were a mix of phone makers and network providers.

USAID Oceans and Fisheries Partnership Page 68 of 105 Value Chain Assessment: Bitung, Indonesia
2.9.5 Safety, fishing technology, working relations and contracts
Only 12.5% of the respondents felt unsafe or discriminated against in their jobs. All but one case (unknown) was due to bad weather.
In terms of vessel based technology and communications 12.5% of respondents had nothing at all (5 mini purse seine, 2 handline), 1.8% had a GPS, 7.1% have a radio and 33.9% has GPS and radio (13 handline, 1 mini purse seine, 4 pole-and-line, 1 collection vessel). 23.3% have GPS, radio, VMS (11 pole-and-line, 2 purse seine), 1.8% (1 purse seine) has all of the above as well as sonar. And 3.6% has the above, sonar, and other (2 purse seine), 7.1% have radio (3 handline, 1 purse seine), 3.8% have radio and VMS (2 purse seine), and the rest left the question blank.
Only 10.7% of respondents (5 handline, 1 mini purse seine) felt they did not have the necessary safety equipment. Most essential safety items listed were life jackets, radio and fire extinguishers (62.5%). 7.1% also mentioned communications with home and family as essential for safety.
2.9.6 Alternative livelihoods, monthly expenses and annual income
Employment and Contracts - 7.1% of the respondents (4 persons), all working on purse seine or collection vessels, have employment contracts and are paid monthly/seasonally. Only the collection vessel captain has a permanent contract. The other 3 are annual contracts (2 captains, 1 fisher, all purse seine).
5.4% of the respondents are employed by family, 1.8% are employed by a friend or neighbor and the rest (92.8%) had no previous relationship the vessel owner/employee.
53.6% of the respondents have no family working for the same boat/company. The rest (46.4%) have a family member or a relative employed in the same boat/company.
Only 5.4% (3 handline fishers) have another livelihood in addition to fishing (agriculture and construction). The rest, 94.6%, are all full time dependent on fishing.
Working Hours - The average number of non-fishing days reported is 77.6 days per year. 33.9% of the respondents have between 30-60 days of non-fishing days annually (7 captains, 1 chief engineer and 11 fishers from a mix of gears); 50% have between 60 and 90 non-fishing days per year. 16% have between 90 and 180 non-fishing days per year (7 fishers, 2 purse seine, 6 handline fishers and 1 handline captain).
Income and Earnings- The majority, 80%, earn income through a catch share program. 1 respondent was an owner operator (handline). Only 12.5% earn a salary (all 3 purse seine captains, 1 chief engineer, 3 fishers). For those who earn a salary, 4 are paid monthly/seasonally (2 purse seine fishers and 2 captain), 3 are paid monthly/seasonally and get a bonus based on premium (2 purse seine captains and 2 chief engineers).
The respondents average monthly expense was IDR 2,065,455 (IDR 24,785,460 annually), including personal and fishing related expenses paid by the respondent. The estimated average yearly earning was IDR 29,222,222.
Of the different vessel types, the mini purse seiner had the lowest average monthly expenses at IDR 1,966,667 (IDR23,600,0004 annually) as well as the lowest average annual earnings at IDR 23,583,333 (IDR 64,611/day). They, however, also had the most non-fishing days at 104 annually.
The pole and line crews had the highest average monthly expenses at IDR 2,181,250 (IDR 26,175,000 annually), but their annual earnings were the second lowest at IDR 25,062,500 (IDR 68,664/day). They also had the lowest number non-fishing days from all the vessel types at 61 days annually.
The hand line vessel crew average monthly expense was the second lowest at IDR 2,057,407 (IDR 24, 688,884 annually) the average annual earnings were IDR 28,903,846 (IDR 79,188/day), below the purse seine earnings, but higher than the mini purse seine or the pole and line. The annual amount non-fishing days was close to the average at 77 days annually.

USAID Oceans and Fisheries Partnership Page 69 of 105 Value Chain Assessment: Bitung, Indonesia
The purse seine crews average monthly expense was IDR 2,080,000 (IDR 24,960,000 annually) the average annual earning was the highest at IDR 36,800,000 (IDR 100,822/day). The non-fishing days was 68 annually.
When comparing the expenses and the incomes between the different roles, the captains’ average monthly expenses were IDR 3,200,000 (IDR38,400,000 annually) and annual earnings were IDR 47,100,000 (including one very high salary of 100,000,000 of the HL vessel owner/captain) or IDR 40,111,111 (IDR 109,894/day) without the one very high vessel owner/captain income. This is 58% higher than the fishers’ annual average income. The average non-fishing days for captains was 54.
Fishers’ average monthly expenses were IDR 1,822,500, 76% lower than the captain’s expenses. The annual earning was IDR 25,425,000 (IDR 69,658/day). The average amount for non-fishing days was 84.
Of the monthly expenses, 12.5% of the respondents reported no costs in relation to fishing activities, whereas 87.5% had fishing-related costs. It is not possible to categorize the costs from the data obtained but they included fishing-related things such as ice, fuel, boat maintenance and other costs.
2.9.7 Government subsidies and access to credit
In terms of subsidies, 12.5% get fuel subsidy from KKP (all handline), and 1 person received their handline vessel as part of a subsidy program. 83.9% have received no subsidies. Only 1 person (handline captain) received direct cash aid from the government. Similarly, only 1.8% or one fisher (purse seine) had received BPJS insurance.
Only 28.65 of the respondents have a bank account (7 captains and 9 fishers from a mix of gears); the rest (71.3%) do not have a bank account. In terms of credit, 83.9% do not borrow any money from traditional financial institutions. 1.8% gets money from co-operatives, 1.8% from bank/credit institution, 1.8% from money lenders, 3.8% from others and 5.4% from the boat owner/investor. 23.2% of the respondents have used ATM or e-banking (6 captains, 7 fishers). Of those who borrow money, all but one person, who borrowed for education, needed to borrow money for daily needs. The length of the loans varied between the duration of one fishing trip and three months, others were unspecified. The interest rates were either 0% (4 respondents who borrowed from an investor/boat owner/other), 20% (from cooperative) or 9.12% (from credit institution).
In addition, the fishers receive fishing trip-related cash advances for the expenses such as fuel, ice cigarettes, etc., which is then deducted from their payment for the fish. This is not seen as borrowing, but rather an operational cash advance.87
93.6% of the respondents said insurance is not interesting for them. 3.8% were interested and 1.8% did not know.
2.9.8 Fishery status, management, sustainability views
The majority of respondents (51.8%) thought the fishery stock is decreasing, 25% thought the fishery is abundant/increasing, 19.6% though it has stayed the same, 1.8% thought it was collapsing, and 1.8% did not know. The opinions of the stock status differed between the different gear types (see Figure 40).
85.7% of the respondents said they knew about current fishing regulations and requirements; 14.3% were unaware of any regulations. In terms of particular requirements, 39.3% of the respondents knew about data and vessel document requirements, 33.9% knew something about the moratorium, foreign vessel controls and Minister Susi, and 5.4% knew about fishing license regulations and changes in areas of fishing. 1.8% knew regulations are stricter now.
87 Personal observation Lalu Hizbulloh, MDPI.

USAID Oceans and Fisheries Partnership Page 70 of 105 Value Chain Assessment: Bitung, Indonesia
Only 5.4% (3 persons) knew about the term sustainability when referenced to fishing activities (1 handline and pole-and-line fisher, 1 pole-and-line captain). Two knew it was related to fish size limits, 1 (handline) fisher was aware of the need to not dump garbage. The majority (96.4%) were willing to support management interventions for sustainability, although it should be clearly stated no clear definition of sustainability was supplied to respondents during this interview. 23.2% of the respondents did not know anything about data collection activities, 41% people thought it was important and would like to see more (2 captains and the rest were fishers, mixed gears), and 33.9%, although aware of data collection, had not personally witnessed any activity themselves. When asked about traceability
specifically, none of the respondents had heard of traceability nor did they know anything about any ongoing traceability activities.
Over half of the respondents (58.9%) were supportive of some management actions. 32.1% were willing to support data collection, reporting IUU, and fulfilling paperwork requests and other orders by the government. 26.8% were also supportive of the moratorium and observers.
2.9.9 Markets and sales contracts
Less than half 41% of the respondents knew where the catch was sold and could provide the name of a local processors/company. The rest (59%) did not know (including 8 captains). Only 7.1% of respondents knew what country the fish is exported to.
3.8% of respondents, all working on a purse seiners, have a long-term contract to sell the fish to a specified buyer, 7.1% sell to the highest bidder (2 handline/2 purse seine). The majority of the sales (85.7%) are arranged by the boat owner and 3.8% by some kind of other arrangement.
2.10 Analysis of the results regarding the CDT implementation
This analysis looks at the main findings and makes observations and recommendations regarding the motivations or possible incentives for the different groups to participate in a CDTS program.
2.10.1 Relative wealth, education and contracts
Between the different vessel types in Bitung, the fishermen and crew are quite a heterogeneous; little difference exists between in their family backgrounds, the way they operate, access information, or view the fishery and management. One major difference is in the average expenses and incomes of fishers in the different fleet types. There is also a significant (58%) difference in between the incomes and some aspects of the material wealth (transport/services) of the captains and the fishers. The minimum wage in North Sulawesi in 2016 was raised by 11% to IDR 2,400,000, but some crew categories of fishers fell below that (see Figure 41).
Figure 41: The stock status opinions of the different gear types
Source: Field Visit Interviews and Observations
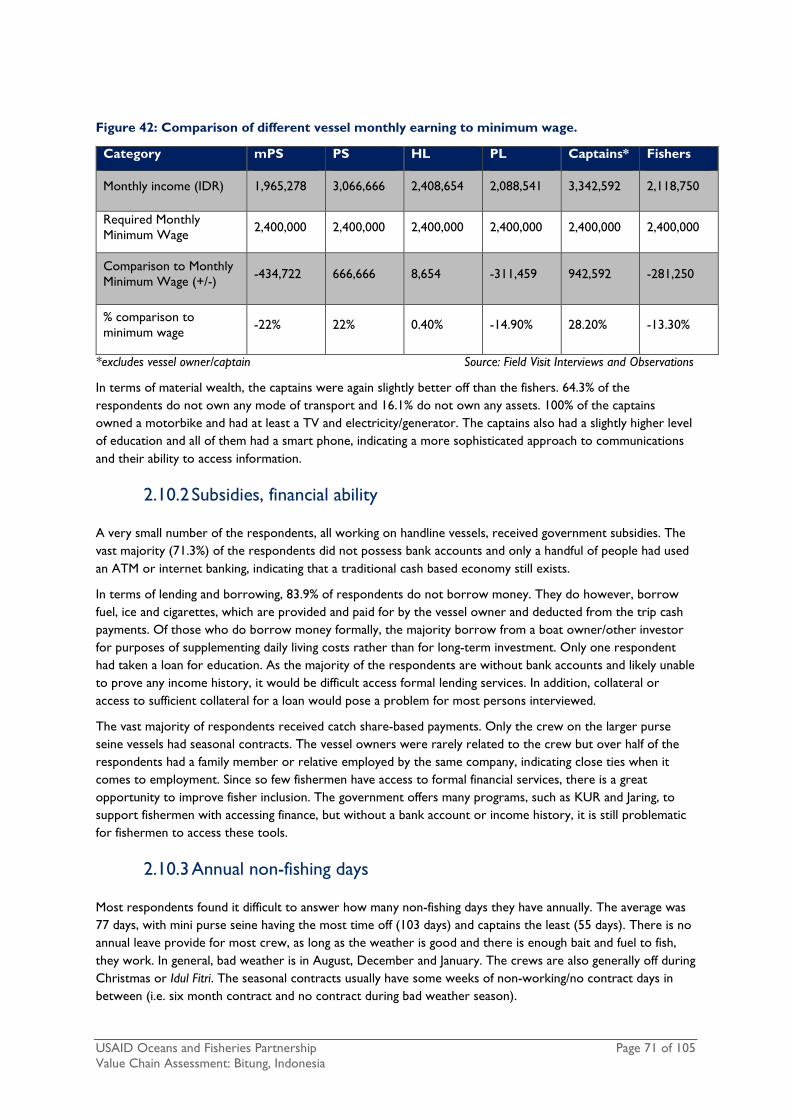
USAID Oceans and Fisheries Partnership Page 71 of 105 Value Chain Assessment: Bitung, Indonesia
Figure 42: Comparison of different vessel monthly earning to minimum wage.
Category mPS PS HL PL Captains* Fishers
Monthly income (IDR) 1,965,278 3,066,666 2,408,654 2,088,541 3,342,592 2,118,750
Required Monthly Minimum Wage 2,400,000 2,400,000 2,400,000 2,400,000 2,400,000 2,400,000
Comparison to Monthly Minimum Wage (+/-) -434,722 666,666 8,654 -311,459 942,592 -281,250
% comparison to minimum wage -22% 22% 0.40% -14.90% 28.20% -13.30%
*excludes vessel owner/captain Source: Field Visit Interviews and Observations
In terms of material wealth, the captains were again slightly better off than the fishers. 64.3% of the respondents do not own any mode of transport and 16.1% do not own any assets. 100% of the captains owned a motorbike and had at least a TV and electricity/generator. The captains also had a slightly higher level of education and all of them had a smart phone, indicating a more sophisticated approach to communications and their ability to access information.
2.10.2 Subsidies, financial ability
A very small number of the respondents, all working on handline vessels, received government subsidies. The vast majority (71.3%) of the respondents did not possess bank accounts and only a handful of people had used an ATM or internet banking, indicating that a traditional cash based economy still exists.
In terms of lending and borrowing, 83.9% of respondents do not borrow money. They do however, borrow fuel, ice and cigarettes, which are provided and paid for by the vessel owner and deducted from the trip cash payments. Of those who do borrow money formally, the majority borrow from a boat owner/other investor for purposes of supplementing daily living costs rather than for long-term investment. Only one respondent had taken a loan for education. As the majority of the respondents are without bank accounts and likely unable to prove any income history, it would be difficult access formal lending services. In addition, collateral or access to sufficient collateral for a loan would pose a problem for most persons interviewed.
The vast majority of respondents received catch share-based payments. Only the crew on the larger purse seine vessels had seasonal contracts. The vessel owners were rarely related to the crew but over half of the respondents had a family member or relative employed by the same company, indicating close ties when it comes to employment. Since so few fishermen have access to formal financial services, there is a great opportunity to improve fisher inclusion. The government offers many programs, such as KUR and Jaring, to support fishermen with accessing finance, but without a bank account or income history, it is still problematic for fishermen to access these tools.
2.10.3 Annual non-fishing days
Most respondents found it difficult to answer how many non-fishing days they have annually. The average was 77 days, with mini purse seine having the most time off (103 days) and captains the least (55 days). There is no annual leave provide for most crew, as long as the weather is good and there is enough bait and fuel to fish, they work. In general, bad weather is in August, December and January. The crews are also generally off during Christmas or Idul Fitri. The seasonal contracts usually have some weeks of non-working/no contract days in between (i.e. six month contract and no contract during bad weather season).

USAID Oceans and Fisheries Partnership Page 72 of 105 Value Chain Assessment: Bitung, Indonesia
2.10.4 Healthcare, insurance and memberships
The majority (60.7%) of respondents do not have access to any healthcare. If this information is also confirmed through other channels, improved healthcare to fishers, captains and their families could certainly be part of any incentives package.
Only 12.9% of the respondents have a kartu nelayan (2 fishers, 5 captains), it is not clear why the number is so low. Given that this registration is essential for receiving government benefits such as healthcare, insurance and other incentives, promoting this registration might be a necessary step for the CDTS pilot.
For the overwhelming majority, all but 3 people, insurance was not of interest. It is not clear if this question needed to be explained better to the fishers. If insurance is considered as part of an incentives package, further surveys of the target population should be conducted, with more details about the present scheme.
2.10.5 Communications and information needs/channels
The vast majority of the respondents (87%) have a mobile phone and 30.4% have a smart phone, including all the captains. According to the survey, there is no access to mobile phones at sea (all answers were blank), although it is assumed they function within usual mobile phone network range of up to 2-4nm from shore. Phones are primarily used for SMS and calls with friends and family, but smart phones users also use social media. A very small amount (8.2%) use the phones for work related purposes. There is a great opportunity to penetrate a larger audience with information supplied by the government using SMS or other smart phone applications (such as WhatsApp).
The use of internet was low, only 23.3%, including 5 captains. Of those who use it, the vast majority use it for social media, some for browsing and very small fraction for emails. While on land, radio is the most important source of information for the respondents, together with their fisher networks and government sources. It is important for the pilot to disseminate information through traditional means in order for the majority of crewmembers to access it.
In terms of accessing critical information at sea, almost everyone said it was important to have weather, fishing or safety information. Most were using radio for this purpose. Most also thought it important to keep in touch with family and personal networks during fishing trips. Not many respondents reported safety or discrimination issues and all but one were related to weather. It seems discrimination is not an issue in the sample set interviewed, but there were concerns of unsafe weather conditions which could be prevented via weather alerts, etc. There was no interest expressed for other kinds of information or transactions that would need to be done while at sea.
Recommendations:
• Any data collection and/or traceability initiatives might be better off aimed at captains rather than just fishermen in general.
• Improved access to formal financial services could be part of an incentives package for fishermen and captains participate in data collection and/or traceability initiatives.
• Training and information sessions on any data collection and/or traceability initiatives should be conducted during non-fishing days.
• Improved healthcare access could be part of an incentive package for fishers and captains to participate in any data collection and/or traceability initiatives.
• Information on data collection and/or traceability initiatives would reach the largest audiences through SMS or smart phone applications such as WhatsApp.
• Vessel owners should be included in any market-facing data collection and/or traceability initiatives.

USAID Oceans and Fisheries Partnership Page 73 of 105 Value Chain Assessment: Bitung, Indonesia
2.10.6 Markets, sustainability and traceability
The majority of the crews were unaware of who was buying the fish; transactions are handled by the vessel owner (85.7%). As such, it is important to include the vessel owners in any market-facing incentive schemes or traceability pilots. Only one vessel owner/captain was interviewed in this survey, so it might be necessary to survey additional vessel owners in more detail.
In terms of sustainability, the majority of the respondents saw the fishery as declining. The survey indicated a high level of compliance and willingness to comply with management and data collection initiatives. Sustainability knowledge was very low and nobody knew anything about traceability. There was willingness to participate, however, with 58.9% supporting management actions. The highest level of support was given to data collection activities. It seems likely that within the right framing about the future of the fishery and any program’s contribution to reversing fishery decline, fishers could be convinced to participate in activities. If the information came from the government directly, it would help, as, in general, fishers generally know about and take government programs seriously (85.7%).
PART IV. VALUE PROPOSITION ASSESSMENT
5. VALUE PROPOSITON ASSESSMENT
5.1 Introduction and methodology
This section provides a value proposition assessment to help develop a high-level cost/benefit analysis for the three sample tuna industries (purse seine, pole-and-line, hand line) present in Bitung. The assessment reviewed the potential users of an electronic CDTS. The analysis contained herein is exclusively based on a series of interviews with key stakeholders in Bitung, and is not representative of the industry as a whole in Bitung, nor does it reflect the overall industry in Indonesia.
A catch documentation process already exists, managed by the Government of Indonesia. iTraceability in the fisheries is understood as the ability to record and track key data points at critical tracking events throughout the supply chain, from point of catch to point of consumption.88 Currently, in Indonesia, there is no standard for traceability mandating key data points, collection methodology or collection timing. The various actors in the supply chain perform different traceability tasks, with different collection methods and data management processes. The lack of specific parameters for the proposed new electronic CDTS presents a challenge in this assessment, as users’ perceptions and actual barriers might differ depending on the actual design of the electronic CDTS.
This section analyzes the potential users of a proposed electronic CDTS and their perceived and actual barriers, deepening the focus on each end user profile. Using the findings of the socio-economic survey and interviews with key stakeholders conducted in Bitung, this section builds detailed profiles for each user and concludes with a proposed prototype for a pilot project targeted at the fishers.
88 The Oceans and Fisheries Partnership – Enhancing Traceability and Fisheries Management in Southeast Asia – Indonesia Briefing Document. USAID Oceans, August 2016.

USAID Oceans and Fisheries Partnership Page 74 of 105 Value Chain Assessment: Bitung, Indonesia
3.2 Potential users of electronic CDTS
There are several actors in the tuna supply chain within the three sample tuna industries (purse seine, pole-and-line, handline) present in Bitung. Each actor, or user of catch documentation and traceability services, engages with the current catch documentation process in a different manner and performs different tasks related to traceability (see Figure 42). Figure 43: CDT user profiles
User Catch Documentation (CD) process Traceability
Fishers • Different requirements for different categories of vessels; smaller vessels (>10GT) are required to comply with CD process, including registration and business licenses.
• Not all fishers within the vessel are required to capture CD data. Typically, the owner, who might not be one of the fishers, is the holder of the registration and business licenses. The vessel captain is responsible for the fish landing data included in the reports that are included within the required catch documentation document. However, it is not always evident who is performing the data collection at sea.
• Fishers may track different data points, or none at all, based on their buyer’s requirements. For example, fishers utilizing small vessels <5GT selling to the local market are not required by their local buyers to track or document any data points.
• Fishers on vessels above 5GT are required, by regulation, to provide a log book, which contains species caught, location of catch, date of catch and volumes. There is no mandatory verification or cross checking of this data at sea.
• Fishers have no data management system to systematically collect, store, and analyze key data points. Data points are collected by hand in a template log-book. Copies of the filled log-books are provided to the government authority that issues Catch Certificates and the original might be retained by the vessel owner.
Traders • Traders that do not export directly are not required to comply with the CD process.
• Traders that export directly must comply with the requirements of the CD process and obtain a catch certificate – derivative sheet prior to export.
• There is no specific CD process for traders that sell their product to exporting processors. However, these traders, both formal and informal, are expected to provide the catch certificate – initial sheet, which is issued to vessels, to the processor.
• Traders track different key data points based on market requirements and desire of owner/key manager.
• Data tracked, tracking capacity, and data management vary widely between traders. One informal trader interviewed had strong record keeping capacity, kept detailed records of each purchase from partner vessels and each sale to the processors.
• Informal traders reportedly do not have record keeping processes and do not record any key data points.
Processing companies and canneries
• Export processing companies are required to comply with CD processes and obtain a catch certificate – derivative sheet.
• Certain markets, such as Japan, do not require catch certificates.
• To comply with the catch certificate – derivative sheet requirements, processing companies must track selected key data points, such as species and volumes purchased, species and volumes to be exported.

USAID Oceans and Fisheries Partnership Page 75 of 105 Value Chain Assessment: Bitung, Indonesia
User Catch Documentation (CD) process Traceability
Other service providers89
Not required to comply with any CD process.
• Unlikely to track and maintain key data points.
Government • The government is the key provider of catch documentation services, as they are the sole entity that can issue catch certificates, licenses and registrations.
• Different agencies manage different parts of the process.
• Government requires several key data elements from the other users.
• Unclear how key data elements are cross checked, monitored and analyzed to prevent redundancies or inaccuracies.
Source: Field Visit Interviews and Observations
3.3 Challenges for adoption of electronic CDTS
Implementation of an electronic CDTS has many challenges with varying impacts on the different users (see Figure 43). This assessment considers the key challenges for adoption of a new electronic CDTS to be human resource availability to use the system, the capacity of those human resources, technology readiness, and availability of capital.
Figure 44: Parameters for defining user impacts
Parameters Human resource availability Number of available human resources to manage traceability related
activities, such as data inputting, monitoring, auditing of data systems to ensure data accuracy.
Capacity of human resources Capacity of existing human resources to manage and use electronic systems, such as Excel, or simple databases.
Time Time required for different users to move product along to the next node of the value chain.
Technology readiness Availability and use of different types of existing technologies and platforms, such as iPads/tablets, computers, smartphones, and databases.
Availability of capital Availability of capital for investment in the adoption of an electronic CDTS, consisting of investments needed to train existing staff, purchase of new equipment and or any additional investments required to adopt an electronic CDTS.
Figure 45: Snapshot of challenges to adoption of electronic CDTS
Figure 44 describes how the different parameters impact the users in further detail, depicting potential challenges that can be incorporated in the design of an electronic CDTS.
89 Other service providers such as transport services, financial services.

USAID Oceans and Fisheries Partnership Page 76 of 106 Value Chain Assessment: Bitung, Indonesia
Figure 46: Analysis of the impact of parameters on different users Parameter Fishers Traders Processors Canneries Government Available human resources
• Very limited human resources to manage administrative activities, such as data recording. Typically, the capital or his assistant records key data points required for the catch documentation
• Smaller boats with one or two fishers will have no human resources available, as the focus is on the fishing activity
• Informal (tibu-tibu) and small-scale traders have only one person performing trading, and thus lack other human resources to support data tracking or collection
• Medium-scale and formal traders might have one assistant supporting the key manager/owner who can provide logistics, administrative support, and data tracking
• Have on average two administrative staff, engaged in the catch documentation system
• Given the inefficiencies of the current system, it is expected that an electronic CDTS would optimize available staff
• Three-seven administrative staff engaged in the catch documentation system
• Given the inefficiencies of the current system, it is expected that an e electronic CDTS would optimize available staff
• Two staff available to input information required under the catch documentation process
• Limited staff for the approval of catch certificate and verification of data contained in the catch certificates
Capacity of human resources
• Fishers have low levels of schooling and limited exposure to electronic systems, computers or databases
• Untrained staff with limited schooling and exposure to electronic systems
• Staff capacity varies depending on the size of processor
• Some processors have highly qualified staff in upper managerial positions, but few qualified staff for data collection across the operation
• Highly qualified and skilled staff
• Available human resources display the necessary capacity to adopt new systems
Time • Time between fishers and the next node of the value chain is very limited, to keep product fresh
• High time sensitivities • Traders of
unprocessed products
• High time sensitivity for processors that must fresh products within 2-3 days
• More flexibility with time as products have a longer shelf life
• Need speed and efficiency to comply with multiple orders
• Needs to be highly time efficient to respond to industry’s demands
Technology readiness
• Ownership of mobile phones is high among fishers, however,
• Ownership of mobile phones is high, and mobile phones are
• Smartphones are ubiquitous
• Smartphones are ubiquitous
• Smartphones are ubiquitous

USAID Oceans and Fisheries Partnership Page 77 of 105 Value Chain Assessment: Bitung, Indonesia
Parameter Fishers Traders Processors Canneries Government smart phone penetration low based on the results of the fisher socioeconomic survey
perceived as a key business communication tool, connecting traders to the next node in the value chain
• Tablet and computer ownership is low
• Computer literacy is very low
• Computer ownership and literacy is high
• Computer ownership and literacy is high
• Access to internet required
• Government offices are equipped with computers for each staff engaged in the catch documentation process
• Access to internet is required
Capital • Fishers have little capital to invest in new equipment such as mobile phones and tablets
• Vessel owners might have capital availability, but their willingness to invest is low
• Low capital available for investments in equipment, systems and training
• Capital available for investments in systems and equipment
• Current market conditions hinder investments, given current sustained losses
• Nonexistence of financial incentives (higher price) for products compliant with traceability requirements diminish the willingness of owners/managers to invest
• Capital available for investments in systems and equipment
• Current market conditions hinder investments, given current sustained losses.
• Nonexistence of financial incentives (higher price) for products compliant with traceability requirements diminish the willingness of owners/managers to invest
• Capital available to invest in the development of new systems and training of staff

USAID Oceans and Fisheries Partnership Page 78 of 106 Value Chain Assessment: Bitung, Indonesia
3.4 Barriers to adopt electronic CDT technology
As noted, traceability requirements vary between end-markets and end-buyers, impacting the level of traceability performed by different actors in the value chain. Interviews with key stakeholders indicated that lack of universal market demand for fully traced products, combined with the inexistence of financial incentives (such as higher price per ton) discouraged the full adoption of traceability across the value chain. Under the current market conditions in Bitung, fishers are able to sell their products for the same price with or without documentation on key data points. Processors have access to high-value markets, such as Japan, without needing to provide key data points or comply with the existing catch documentation process. Canneries indicated that they do not receive a higher price per can or have additional sales in their end market of their product which comply with higher traceability requirements. Buyers in end-markets indicated that until traceability is demanded by all the market, processors will have no incentive to comply as they will have access to other markets of similar or higher value.
The lack of incentives that resonate with the different users is seen as one of the key barriers to adopt an electronic CDTS or technology.
The analysis of the different potential users of electronic CDTS in Bitung revealed that there are no fundamental structural barriers that could prevent adoption of an electronic CDTS or technology. As noted, users have varying degrees of access to the necessary ingredients required to adopt electronic CDTS technology: human resources and access to equipment (smartphones; computers). Users might lack capacity, and will require training and support for the adoption, and other factors might influence the usability of systems, such as access to stable signal (internet/phone) or electricity. These factors can be overcome on the design of the electronic CDTS, which could be designed to allow ‘off-line’ data capture, a low-broad band requirement, and submission when users are near stable signals.
However, the current market conditions can significantly threaten the introduction of an electronic CDTS and new technology. Under the current local market conditions to obtain tuna products in Bitung, highly competitive with limited supply, processors have seen their margins dwindle over the past two years. Global prices, reported by processors and canneries as remaining stable, have further tighten margins. As a result, processors and canneries are extremely cautious about undertaking new unnecessary investments. Additionally, fishers and traders, whose bargaining power has increased over the past two years, are too removed from end markets to perceive differences in their product related to traceability.
There are additional factors, which are particular to each user that will be determining factors for the adoption of an electronic CDTS stem and associated technology: cost and willingness for adoption.
All users interviewed invariably asked about the estimated cost of the electronic CDTS. The current market conditions and fishery reform do not inspire confidence in processors and canneries to undergo additional investments in their operations in Bitung. If these market conditions persist, it is expected that processors, particularly ones partly owned by international conglomerates, will close their operations or focus more on operations in other countries, leaving their operations in Bitung without the possibility of additional investments.
While fishers and traders have seen an improvement in their bargaining position, their margins are still tight and they have limited additional financial resources to invest in elements not considered critical operating costs. Currently, traders and fishers do not consider traceability to be a key part of their operations, and see no detriment to their business to operate without traceability, given the lack of awareness about traceability and the flexibility of actors within the local market to buy products with or without the necessary minimum requirements for catch certificates. Thus, there is no imminent perceived threat to their business or obvious incentive for adoption, making the cost of an electronic CDTS a key determining factor.
In addition to cost, another determining factor will be the willingness of key decision makers to adopt a different system and change current procedures. Consultations with key decision makers and managers of the

USAID Oceans and Fisheries Partnership Page 79 of 105 Value Chain Assessment: Bitung, Indonesia
key users indicated that they seem willing to accept changes as long as those changes provide clear tangible benefits to their business.
Among processors and canneries, there is an overwhelming feeling of being overburdened by government procedures and increased importer demands. Therefore, to ensure a successful deployment and acceptability, an electronic CDTS will have to consider efficiency gains or additional benefits to processors and canneries to persuade them to change procedures. Traders, while not required to provide documentation, are overburdened by supporting fishers, while also trying to efficiently run their businesses. Hence, the electronic CDTS will also need to consider elements of business efficiency and improvements that can support the professionalization of some of the informal traders, such as supporting them to build financial history so they can access financial products.
Even considering these additional benefits, without a prototype or example of the electronic CDTS, it is difficult to gauge different users’ willingness to change and bear associated costs.
Figure 47: Value Proposition Design
3.5 End-user profiles
This section profiles each of the electronic CDTS end-users based on the Value Proposition Design Canvas approach (See Figure 46).90 Understanding end-user profiles supports the development a value map that describes how to best create value for different client segments. The end-user profile identifies the specific ‘jobs’ of each end-user, their challenges (pains) and potential benefits (gains) that can be gained by using an electronic CDTS. The following sections provide a short summary of the user profile for each electronic CDTS user.
3.5.1 Fisher user profile
Fishers Jobs • Earn an income fishing
• Navigation • Ensure safety at sea • Pay family bills (school, food, etc.) • Increase purchasing power to be able to afford more goods and services • Income security (stable fishing income) • Job security (continued employment) • Communication with business partners, friends and family
Pains • Changing government regulations (fishery reform)
90 Osterwalder, Alexander; Pigneur, Yves; et. All. Value Proposition Design: How to Create Products and Services Customers Want (Strategyzer). October 20, 2014.
From the Value Proposition Design Canvas
Create value: the set of value proposition benefits that you design to attract customers. Value proposition: describes the benefits customers can expect from your products and services.
Customer profile
• Jobs: things customers are trying to get done in their work or their life • Pains: things that annoy customers before, during and after trying to get a job done • Gains: what outcomes and benefits the customer wants

USAID Oceans and Fisheries Partnership Page 80 of 105 Value Chain Assessment: Bitung, Indonesia
• Too many steps to comply with government regulations • Too many different agencies to visit to obtain registration documents • Limited time on land • No access to information about bank accounts, government programs, other
programs • Lack of knowledge about procedures to access government programs, obtain bank
accounts, other services • No access to information about sea safety at sea • Limited information about fish prices and end markets • Potential unwillingness to pay taxes and engage in schemes
Gains • Ability to sell products in market place and inform time of arrival/offload • Increased value of catch • Efficiency of fishing operation (more catch within same trip time, shorter trip times,
more valuable trips) • Spend less time in government processes • Have information (weather, fishing grounds) at sea • Access to bank accounts and other financial services
3.5.2 Trader user profile
Trader Jobs • Make a profit with trading activities
• Pay employees • Pay for fish supply • Move fish products to buyers • Pay family bills (school, food, etc.) • Increase profitability • Income security (stable fish trading income) • Communication with friends and family • Communication with business partners (supplier fishers and processors)
Pains • Changing government regulations (fishery reform) • Too much time spent supporting fishers to comply with government regulations • Too many different agencies to visit to obtain registration documents • Confusion about which government agency to seek for different registration
documents • Limited access to information about bank accounts, government programs, other
programs • Lack of or limited knowledge about procedures to access government programs,
obtain bank accounts, other services • No access or communication to fisher suppliers at sea • Fear of losing relationship with partner suppliers (fishers) • Fear of not having necessary cash to maintain relationships with partner suppliers • Possible fear of data collections related to unwillingness to pay taxes and become
formal Gains • Ability to sell products in market place
• Increased value of traded product • Efficiency of trading operation (less buyers to keep track of, more product from each
partner supplier) • Spend less time supporting fishers to comply with government processes • Spend less time providing information to buyers (processors) • Have information of fishing volumes, arrival dates/times from fishers while at sea and
ability to pass onto processors and canneries • Access to bank accounts and other financial services • Liquidity to purchase product • Information about business and financial performance

USAID Oceans and Fisheries Partnership Page 81 of 105 Value Chain Assessment: Bitung, Indonesia
3.5.3 Processor user profile
Processor Jobs • Make a profit with processing activities
• Pay employees • Pay for fish supply • Move fish products to end buyers (importers) • Pay business bills • Increase profitability • Communication with business partners (suppliers, buyers, government) • Comply with government regulations • Satisfy importers’ demands (quality, timing, information) • Ensure the continuation of the business • Move product fast to end market (fresh fish products) • Increase sales
Pains • Changing government regulations (fishery reform) • Too much time spent to comply with government regulations and obtain catch
certificates • Too many different agencies to visit to obtain registration documents • Confusion about government processes • No access or limited access and communication to fisher suppliers at sea • Fear of losing relationship with partner suppliers • Fear of not having necessary cash to maintain relationships with partner suppliers • Fear of changing regulations
Gains • Ability to sell products to high value international markets • Efficiency of processing operation (availability of volumes to keep processing lines at
optimum capacity) • Spend less time supporting fishers to comply with government processes • Spend less time providing information to end-buyers (importers) • Spend less time providing information to government • Spend less time with the catch certificate process • Have information of fishing volumes, arrival dates/times from suppliers prior to
product arrival • Liquidity to purchase product • Information about business performance and financial performance • Ability to move fresh product fast to end-buyers (importers)
3.5.4 Cannery user profile
Cannery Jobs • Make a profit with canning activities
• Pay employees • Pay for fish supply • Move fish products to end buyers (importers) • Pay business bills • Increase profitability
Communication with business partners (suppliers, buyers, government) • Comply with government regulations • Satisfy importers’ demands (quality, timing, information) • Ensure the continuation of the business • Increase sales
Pains • changing government regulations (fishery reform) • too much time spent to comply with government regulations and obtain catch
certificates • too many different agencies to visit to obtain registration documents

USAID Oceans and Fisheries Partnership Page 82 of 105 Value Chain Assessment: Bitung, Indonesia
• confusion about government processes • limited information available from suppliers about expected volumes • fear of losing relationship with partner suppliers • fear of not having necessary cash to maintain relationships with partner suppliers • fear of changing regulations
Gains • ability to sell products to high value international markets • increased value of sold product • efficiency of processing operation (availability of volumes to keep processing lines at
optimum capacity) • spend less time supporting fishers to comply with government processes • spend less time providing information to end-buyers (importers) • spend less time providing information to government • spend less time with the catch certificate process • have information of fishing volumes, arrival dates/times from suppliers prior to
product arrival • liquidity to purchase product • information about business performance and financial performance
3.6 Potential incentives for adoption of an electronic CDTS
There are different benefits and incentives can be incorporated in the design and roll out of an electronic CDTS that can encourage its adoption and ensure its usability overtime.
As noted, price incentives passed along through the supply chain emerged as a key influencing incentive to engage all potential users of an electronic CDTS. However, the local market players indicated there were no financial incentives attached to fully traceable products. There are no price premiums paid for export products that require catch certificates, international buyers requiring additional key data elements than the ones included in the catch certificate do not pay an additional premium, and processors do not pay additional prices to traders and fishers for product that is fully compliant with the required key data elements for the catch certificate. Thus, there is no incremental value, at the moment, to be passed along the value chain. Consequently, promoters of an electronic CDTS need to incorporate other benefits to incentivize adoption and overcome the aforementioned adoption challenges.
The discussion with key stakeholders revealed other benefits that could be incorporated into an electronic CDTS that could support its adoption and penetration in the market, such as access to stable markets, access to financial services (such as banking and loans), access to insurance (health and business), access to other services (such as training, and government services), and efficiency improvements. Figure 47 outlines the potential
impact of these different benefits and their ability to influence each user to adopt an electronic CDTS. Figure 48 indicates the different types of incentives that could influence electronic CDTS users’ adoption.
Figure 48: Likelihood of influence of benefits on the adoption of electronic CDTS by users
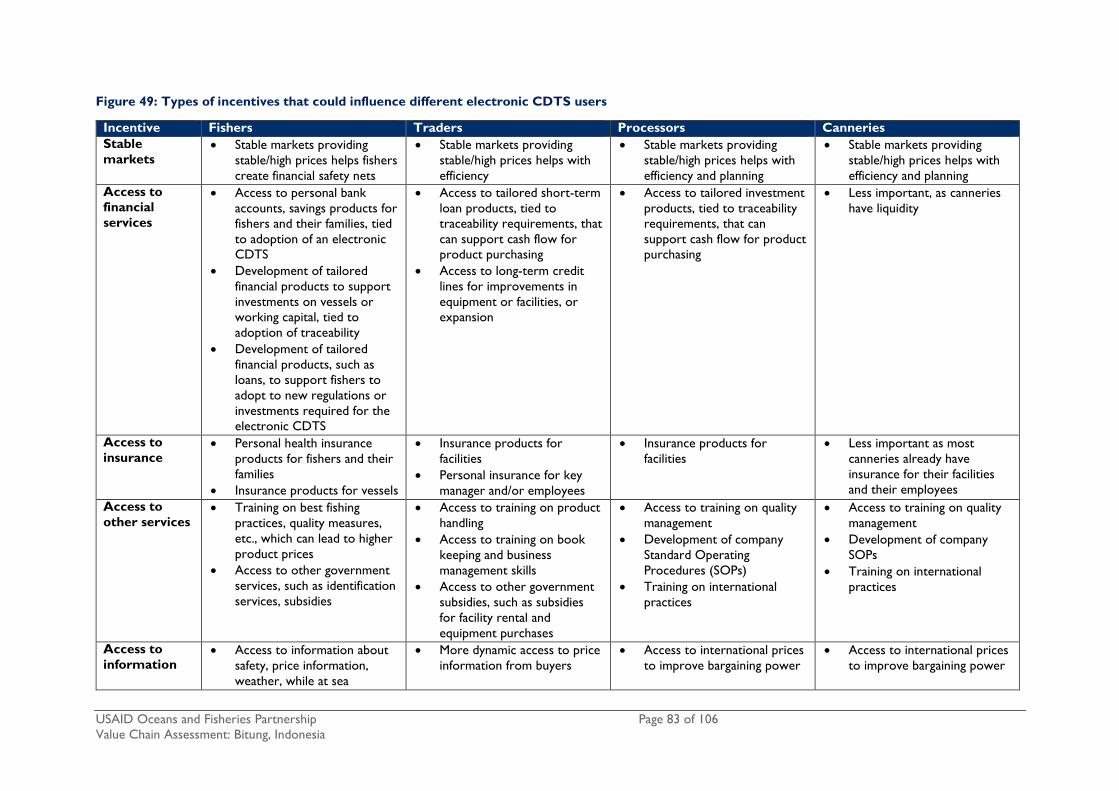
USAID Oceans and Fisheries Partnership Page 83 of 106 Value Chain Assessment: Bitung, Indonesia
Figure 49: Types of incentives that could influence different electronic CDTS users
Incentive Fishers Traders Processors Canneries Stable markets
• Stable markets providing stable/high prices helps fishers create financial safety nets
• Stable markets providing stable/high prices helps with efficiency
• Stable markets providing stable/high prices helps with efficiency and planning
• Stable markets providing stable/high prices helps with efficiency and planning
Access to financial services
• Access to personal bank accounts, savings products for fishers and their families, tied to adoption of an electronic CDTS
• Development of tailored financial products to support investments on vessels or working capital, tied to adoption of traceability
• Development of tailored financial products, such as loans, to support fishers to adopt to new regulations or investments required for the electronic CDTS
• Access to tailored short-term loan products, tied to traceability requirements, that can support cash flow for product purchasing
• Access to long-term credit lines for improvements in equipment or facilities, or expansion
• Access to tailored investment products, tied to traceability requirements, that can support cash flow for product purchasing
• Less important, as canneries have liquidity
Access to insurance
• Personal health insurance products for fishers and their families
• Insurance products for vessels
• Insurance products for facilities
• Personal insurance for key manager and/or employees
• Insurance products for facilities
• Less important as most canneries already have insurance for their facilities and their employees
Access to other services
• Training on best fishing practices, quality measures, etc., which can lead to higher product prices
• Access to other government services, such as identification services, subsidies
• Access to training on product handling
• Access to training on book keeping and business management skills
• Access to other government subsidies, such as subsidies for facility rental and equipment purchases
• Access to training on quality management
• Development of company Standard Operating Procedures (SOPs)
• Training on international practices
• Access to training on quality management
• Development of company SOPs
• Training on international practices
Access to information
• Access to information about safety, price information, weather, while at sea
• More dynamic access to price information from buyers
• Access to international prices to improve bargaining power
• Access to international prices to improve bargaining power

USAID Oceans and Fisheries Partnership Page 84 of 105 Value Chain Assessment: Bitung, Indonesia
Incentive Fishers Traders Processors Canneries • Access to information about
fishing grounds • Access to information about
price of key operating expenses (example: fuel)
• Access to information about changing regulations, government subsidy programs
• Access to information about government trainings, changing regulations
Efficiency improvements
• Access to data on efficient routes to fishing grounds, leading to reduction in operating expenses
• Streamlining of catch documentation processes, leading to less time on land
• Streamlining transactions between fishers and processors, leading to quicker transitions
• Ability to generate key simple management reports to support cash management and business improvement
• Development of business financial history
• Reduction of internal paperwork required for catch documentation process
• Reduction of paperwork and redundant processes to comply with different end-buyers (importers) traceability requirements
• Ability to generate performance reports and provide key business performance data to drive management decisions
• Streamlining transactions with suppliers, leading to quicker transitions

USAID Oceans and Fisheries Partnership Page 85 of 106 Value Chain Assessment: Bitung, Indonesia
PART V. THE FUTURE OF TRACEBILITY FOR INDONESIA
6. DEVELOPMENT OF THE INDONESIAN COASTAL TUNA SUSTAINABILITY ALLIANCE
Over the last 3-5 years, different groups, both NGOs and industry driven associations, have entered the small-scale tuna fisheries scene in Indonesia with a similar purpose and mission. Some of the groups, such as MDPI and AP2HI are established organizations with Indonesian staff, local legal structures and long term programs. Others have long term global programs, such as IPNLF. There are also some smaller programs or collaborations in Indonesia, such as the groups working on testing and piloting traceability technology (m-fish, Future of Fish) or groups that have research interests in the issue, such as the BESTTuna Programme.
While the groups mainly share similar or closely related objectives, there is a threat of a great deal of replication in terms of tasks, objectives and resources. Also, the results of all the programs do not get effectively communicated and absorbed, leading into inefficient learning and application of program results. This is also (in part) causing inefficiencies in communicating and coordinating with the government.
Three organizations active in Indonesia, Masyarakat dan Perikanan Indonesia (MDPI), Assosiasi Perikanan Pole & Line Handline Indonesia (AP2HI) and the International Pole and line Foundation (IPNLF), share common objectives to enable Indonesian coastal tuna caught one-by-one to enter the market at a premium price under various certification schemes and with full traceability in place. They also aim to create benefits at the community level for the small-scale fishers involved.
The work includes improving the data, science and management practices for tuna, as well as improving capacity, industry standards, and returns to the community. These groups have been collaborative in terms of sharing information and results, but they have primarily operated independently. They work on their own particular fisheries and approaches, leading to fragmented implementation and standards, as well as to somewhat ineffective leveraging of market pressures.
Where collaboration has taken place, it has sometimes resulted in frustrations and misunderstandings concerning the roles and responsibilities of each of the groups, often due to unclear agreements, objectives and work plans. Other times, when each organization had a clear role to play, as in the Proactive Vessel Registration (PVR) project, they have been more successful and together achieved good results.
As the organizations and their programs expand, there is a risk that they will start to replicate each other and create competition, rather than collaborating and coordinating approaches. The competition can hinder progress with both industry and government, as confusion and frustration would be inevitable. The frustration would also be felt at the organizations themselves, leading to individual dissatisfaction and conflicts.
The organizations might also start competing for philanthropic and Corporate Social Responsibility (CSR) funding unless a broader strategy and parameters are agreed upon concerning how the companies support the work and each other, and how funding is most effectively distributed amongst them.
In May 2016, the leadership of these three organizations, together with the USAID Oceans team, agreed on the need to develop an alliance, the Indonesian Coastal Tuna Sustainability Alliance (ICTSA), to move forward towards common goals, with a clear five-year strategy and plan for the 2016 – 2019 period. USAID and the three organizations also agreed that two additional organizations, Marine Change and Future of Fish, will

USAID Oceans and Fisheries Partnership Page 86 of 105 Value Chain Assessment: Bitung, Indonesia
provide key support for the development of the alliance and the partnership with USAID Oceans, in the analysis of the traceability system and building a sustainable business model to scale and sustain the CDTS in the long-term. Between May and July 2016, the proposed ICTSA members, USAID Oceans, Marine Change and Future of Fish developed an initial draft phased strategy:
• Phase 1 (September – December 2016): research and understanding of the traceability landscape, CDTS gaps assessment, value chain analysis, alliance business model development and initial design of the demonstration/testing phase (phase 2)
• Phase 2 (2017): deploy the CDTS demonstration, monitor and review performance, communication successes and challenges, identify resources and develop long-term expansion and scaling strategy for the wider tuna sector in Indonesia
• Phase 3 (2018-2019): scale the CDTS to other sites and incorporate more companies and features, and become self-funded by end of phase 3
Marine Change’s role in the development of the ICTSA
Marine Change provided support in the structuring of the ICTSA as part of USAID Ocean’s broader strategy. This support was specifically in outlining the common objectives of the members, providing guidance on the development of the alliance by providing background on other successful coalitions, development of vision for the coalition, convening the proposed members to prepare a joint work-plan and strategy. It is envisaged that ICTSA can play key role to assist USAID Oceans in Indonesia to:
1. Develop and implement the CDT implementation plan and other supporting USAID Oceans activities in the demonstration site in Bitung;
2. Support the implementation and monitoring of USAID Oceans demonstration site activities;
3. Support the scaling and wider adoption of the CDT system in the tuna industry in Indonesia, and share experiences with other fisheries in Indonesia; and
4. Coordinate and build support for USAID Oceans with the Indonesian government and the regional bodies (SEAFDEC), as well as key markets for Indonesia tuna products.
The following subsections outline the proposed coalition members, vision and mission, strategy, and proposed key activities.
6.1 Alliance members
Currently, ICTSA is comprised of the organizations mentioned in the previous section: Masyarakat dan Perikanan Indonesia (MDPI), Assosiasi Perikanan Pole & Line Handline Indonesia (AP2HI) and the International Pole and line Foundation (IPNLF). This section provides a summary of each organization’s mission, vision, objectives and strategy.
6.1.1 Assosiasi Perikanan Pole & Line Handline Indonesia (A2PHI)
Website www.ap2hi.org
Type of organization Industry association, registered in Indonesia
Number of staff 6
Office locations Jakarta
Annual budget < US$500k
Scope of work Indonesia

USAID Oceans and Fisheries Partnership Page 87 of 105 Value Chain Assessment: Bitung, Indonesia
Year of establishment 2014 (initial set up in 2012)
Funding model Membership fee and philanthropic and bilateral funding. Business model for MSC tuna in preparation.
Membership criteria:
Indonesian tuna companies, fishing and processing that are involved in hand-line and pole and line fishing. Memberships has to agree to a code of conduct by AP2HI and also has an international honorary membership.91
Vision: AP2HI’s vision is pioneering tuna fisheries development through an ecosystem approach for business and society.
Mission:
1. Gather, unify and act as a “shared voice” for the diverse businesses engaged in Indonesia’s pole-and-line and hand-line industry;
2. Promote fair, transparent and sustainable utilization of the tuna resource, particularly in the Republic of Indonesia;
3. Ensure the industry conducts itself in a responsible and insightful manner in regards to both the environment and dependent communities;
4. Increase concern of business players to pursue sustainable fisheries business;
5. Encourage and facilitate partnerships between companies from fishing (upstream) to processing (downstream);
6. Represent and promote the industry nationally and internationally, with governments and other relevant organizations, to foster further support for Indonesia’s coastal tuna fisheries;
7. Drive innovation, transparency and traceability by becoming a credible partner for ecolabel certifications in accordance with the needs of local, national and international markets.
Activities: As an industry association, AP2HI’s strategy is to represent the industry to government and market partners and to coordinate activities that can help benefit its membership. The current work plan is heavily focused on preparing the members for the MSC certification in terms of the environmental requirements and the COC standard. The main component of this work is the ongoing FIP program and the development of harvest control rules to enable the certification. The AP2HI strategy is to become the certification holder and to develop a more brand related business model around it.
Other work strands of the current 2016-2017 work plan of AP2HI consists of the following activities:
• Strengthen industry capacity through FIP implementation
• Improve government coordination through FIP SC, harvest strategy, compliance review, and others
• Data monitoring (port sampling) and improve traceability system with service provider and NGO partners
• Conduct independent data monitoring (independent onboard observer deployment)
• Strengthen fisheries communities (training to fishermen)
• Market driven certification goals (MSC, etc.)
• Self-initiative on small scale research of milkfish cultivation as alternative bait
91 AP2HI Code of Conduct: http://www.ap2hi.org/?page_id=658

USAID Oceans and Fisheries Partnership Page 88 of 105 Value Chain Assessment: Bitung, Indonesia
6.1.2 International Pole and Line Foundation (IPNLF)
Website www.IPNLF.org
Type of organization NGO with Industry membership, UK and Maldives registered.
Number of staff 12 (mix of part and full time) as well as trustee’s and consultant associates who contribute in-kind time.
Office locations London, Maldives, Jakarta
Annual budget > US$1 million
Scope of work Global, with priority focus on Maldives and Indonesia
Year of establishment 2012
Funding model IPNLF’s work is primarily funded by its Member organizations (with annual fees tiered according to size of business); project sponsorship from corporate and charitable organizations; and philanthropic grants.
Membership criteria:
Processor, supplier, retailer or fishing association that support one by one fishing. Currently these are mainly canned skipjack related but there are plans for expanding this over the coming 3 years.
Vision: To see a future where coastal fishing communities and their fisheries thrive.
Mission: To develop socially and environmentally responsible one-by-one fisheries, and demonstrate their value.
Strategy: In August 2016, IPNLF completed a three-year strategic planning process focused around five key areas of work: 1) development and support, 2) demonstrate and promote, 3) social spotlight, 4) policy and advocacy and 5) science and evidence. Its program is wrapped under this umbrella, with each area having its own 1-3 year objectives and deliverables.92 The areas of work under the development strands is heavily focused on the Indonesian tuna FIP and MSC certification, as is its policy and outreach work.
In addition to the Indonesian tuna harvest strategy, IPNLF attends and presents the sector at the tuna RFMO meetings with the objective of delivering legislation that can support the wellbeing of the sector. In addition to the standards and certification work, IPNLF also has a work plan for both biological and social scientific research in order to improve the ecological case and understanding and to adequately measure the impact of the sector on coastal communities. IPNLF also plans to aggressively market and promote the sector and increase its member phase (and income) over the coming period.
6.1.3 Masyarakat dan Perikanan Indonesia - ‘Happy people many fish’
Website www.mdpi.org
Type of organization NGO, registered in Indonesia
Number of staff approximately 80
Office locations Denpasar (Main Office), 15 Field offices distributed across the following provinces: Maluku, West Nusa Tenggara, East Nusa Tenggara, North Sulawesi, South Sulawesi Central Sulawesi, West Papua.
Annual budget < US$1 million
Scope of work Indonesia (for now)
92 The detailed strategy is available on the link http://ipnlf.org/resources/ipnlf-documents/strategic-focus

USAID Oceans and Fisheries Partnership Page 89 of 105 Value Chain Assessment: Bitung, Indonesia
Year of establishment
2013
Funding model Philanthropic and bilateral grants, corporate CSR donations
Vision: To be among the best implementers and innovators of field based programs that aim towards improving life in fishing communities through sustainable fisheries in Indonesia and the region.
Mission: To empower fishing communities to achieve sustainability by harnessing market forces.
Objectives:
Together with its partners and collaborators, MDPI focuses on many and varied objectives with aimed activities and improvements generally falling below one or more of the following broad topics:
• Fishing Practices
• Fishery Management
• Fisherman Welfare
• Community Development
• Value Chain and Food Safety
Strategy: The MDPI strategy is threefold, focused on 1) better data collection and management leading to fishery improvements, 2) socially supporting fishing communities through Fair Trade implementation 3) the implementation of traceability and supporting technology.
Currently key activities focus on supporting Indonesia tuna FIP objectives, namely, 1) data collection including an extensive enumerator based program implemented in 15 sites in West Nusa Tenggara Barat, East Nusa Tenggara, South Sulawesi, Central Sulawesi, North Sulawesi, West Papua and Maluku provinces which focuses on fisheries data as well as interaction with Endangered threatened and protected species; 2) fishery improvement work includes support and the development of institutionalization of co-management through ‘Data management Committees’ in 3 (+) provinces as well as; 3) participation in the harvest control rule work at the national level.
The data and fishery improvement approach also includes the implementation of the first ever pilot site for Fairtrade USA Standard on Capture Fisheries. The traceability program includes the implementation of ‘Improving Fisheries Information and Traceability in Tuna (IFITT) in collaboration with Wageningen University as well as collaboration with various technology providers and groups in testing technology.
In addition, MDPI runs social/community development activities in the locations it is active which include awareness programs; alternative livelihoods; safety and quality in seafood projects; ‘adopt a school’; supporting clean water systems for schools and orphanages and ‘helmets for children’ events.
6.2 Alliance suitability
In theory, the core objectives and missions of the three organizations are very compatible. Seen in the context of the role each organization plays, ideally, the potential collaboration would achieve a whole or complete picture from grass-root community engagement and fisher interaction, to scientific expertise, to industry relationships from up to downstream, international reach, market relationships, international recognition and presence, government relationships and interaction, certification experience and expertise and a range of other capacities.
ICTSA should not absorb its members, who will still remain committed to their own individual vision, mission and objectives, but it does have to reflect the core mission and values of each organization or they will, over time, feel conflicted or alienated in the work of the coalition.

USAID Oceans and Fisheries Partnership Page 90 of 105 Value Chain Assessment: Bitung, Indonesia
For example, MDPI is first and foremost a community organization (whilst employing market and supply chain forces to achieve its objectives), whilst the other two ICTSA members have a clearer industry and market facing priorities. In addition, IPNLF membership mainly consists of retailer and processors that trade and process skipjack tuna. Unless this focus is changed to be more inclusive of the hand line industry internationally, this may eventually end up compromising the ability of IPNLF to support the work MDPI wants to see done in the coalition.
Similarly, balance needs to be kept within AP2HI so that the members that catch and process skipjack (pole and line) as well as those dealing with yellowfin (hand line) get equal attention and representation in the policy debates.
An obvious example of a possible conflict in this regard is the impact of the current government policies for the yellowfin industry versus the problems it is causing for the skipjack processing sector. How can the needs of both industries be balanced? In order to mitigate these individual mission-versus-coalition strategy issues, a clear conversation needs to be had and possibly corrective actions taken.
Figure 50: ICTSA SWOT Analysis Strengths Weaknesses
• Scale in 3 organizations • Entire supply chain included • Range of expertise and skills • Complimentary skills and roles • Good reputations and joint recognition of 3
organizations • Local presence • Timing • Relationship with government • Organizations can work more effectively
together than they could on their own • Learning and capacity building across the
organizations • Sharing of resources • Helps local organizations have global reach
and reputation • Helps analyze and share intellectual power,
which can speed up work potentially
• Young organizations • Limited capacity • Confusion in standards and industry • Complexity of issues • Organizational set up can be demanding
and a draw of resources • Internal competition for funding or other
things • Coordination willingness between
organizations may be a hindrance
Opportunities Threats
• Indonesia funders focus • Government support for one-by-one
fishers • Additional funding for the Alliance • Improved overseas markets access • Ability to go beyond supply chain – out of
box thinking in approaches resulting from varied skill sets
• Aim to become world leader in small-scale fisheries innovation/solutions
• Current MMAF minister is progressive • Competitiveness of industry involved,
stabilized prizing
• Not enough funding to establish the coordination needed
• Government policy and changing landscape • Getting a bad name with government and
becoming ineffective in policy engagement • WWF or other players confusing the space
and industry/government • Unforeseen market sifts/trends in one by
one tuna demand • Not meeting the needs of its industry allies • Lack of commitments from the members to
fully believe in it (including from the industry members of ICTSA)
• U.S. National Fisheries Institute • Being late in entering markets, too
saturated and confused market • WWF/GP confusing industry with different
standards • Funders short vision/funding cycles

USAID Oceans and Fisheries Partnership Page 91 of 105 Value Chain Assessment: Bitung, Indonesia
6.3 Alliance strategy
The strategy section is comprised of the theory of change for the alliance, the vision, mission and proposed roles of each member organization, as well as short-term and medium term objectives.
6.3.1 Theory of change
Problem statement: Indonesia is the world’s largest tuna fishing country. In 2015 Indonesian tuna landings were 142,023 tons, down 29% from 2014. Approximately 30% of this by volume is caught by one-by-one fishing gears, handline and pole-and-line. There are 3,932 registered pole-and-line tuna fishers and 170,561 registered handline fishers in Indonesia.93 Despite this perceived abundance, small-scale fishers and their communities are some of the poorest in the country, with average income of just US$85 per month. In addition, many key tuna species, especially bigeye and yellowfin, are in decline, resulting in a need to regulate and monitor the fishery better in order to ensure long-term sustainability, livelihoods, and market access for these one-by-one products.
Long-term goals: ICTSA is an alliance of NGOs and industry groups that want to work towards scalable solutions needed to ensure the long-term sustainability and well-being of Indonesia’s coastal communities and market access for one-by-one tuna.
Preconditions: As tuna stocks decline globally, the Indian and Pacific Ocean RFMOs are increasingly demanding data and good management practices from Indonesia. This, together with the Jokowi administration established in 2014, has led to strict action by the government to ensure the long-term sustainability of tuna stocks over short-term profit, as well as the elimination of foreign and many IUU fishing players from the fishery. This governing policy setting has resulted increased prosperity for some small-scale fisheries, including those for tuna, and local food security. In addition, the government is working towards meeting modern management requirements by establishing harvest control rules and other measures that would enable the sustainable one-by one fisheries to achieve a MSC sustainability certification. Sustainable and traceable tuna products by one-by-one fishers are highly sought by the high-end markets, especially in the EU and the U.S., and preferred market access, if the necessary market conditions such as catch documentation are met. On the other hand, these players are also at risk of being excluded from these markets unless they can meet these increasing demands.
Assumptions: With the backdrop of sustainable long-term management and the market demand for traceable sustainable product, a vast opportunity now exists for the one-by-one tuna sector, under the membership of AP2HI, to sell their products as sustainable and to achieve higher returns, and prosperity for fishing communities in the process. At the same time, the sector also faces challenges in building the necessary capacity, both human and technological to meet these requirements. This is specially pressing in supply chains that are fragmented and where the small-scale fisher rarely benefits from the market benefits, but is met with the burden of increased compliance. The price of the tuna also often fluctuates according to supply and demand, leading into instability and unwillingness to invest and improve practices.
As the Indonesian one-by-one tuna sector has to adjust to both domestic and international regulations as well as international market demands, it requires support at many different levels. Domestic and international
93 Indonesia Fisheries Statistics, 2014.
A Theory of Change (TOC) should include the following:
1. Problem statement 2. Identifying long-term goals 3. Backwards mapping and connecting the
preconditions or requirements necessary to achieve that goal and explaining why these preconditions are necessary and sufficient.
4. Identifying your basic assumptions about the context.
5. Identifying the interventions that your initiative will perform to create your desired change.
Figure 51: Theory of Change

USAID Oceans and Fisheries Partnership Page 92 of 105 Value Chain Assessment: Bitung, Indonesia
policy/market/resource dynamics are not easily accessible to a just single organization. Similarly, in order to harness both market and industry-based support and adapt solutions at large scale internationally, either a very large and diverse organization is needed. Alternatively, multiple groups with the necessary skills, or a view of developing those skills, need to come together to enable comprehensive and timely progress.
Interventions: ICTSA, with its diverse core expertise, is needed to drive the solutions at all the different levels: science, domestic and international policy, technology, the market, and socio-economic benefits. At the same time, ICTSA needs to ensure the industry is adequately involved and consulted so that the solutions are adopted in a timely and efficient manner, and that the government is creating an enabling environment for these positive changes.
6.3.2 Vision
Indonesia’s sustainable one-by-one tuna fisheries enable business competitiveness and community well-being.
6.3.3 Mission
To leverage the collective strengths and leadership of our members to innovate and implement coordinated and scalable programs throughout the tuna supply chain that enhance the recognition of Indonesia's sustainable one by one tuna fisheries and deliver benefit to the environment, people and businesses.
6.3.4 Proposed roles of each organization within the strategy
Figure 52: Organizational Roles IPNLF AP2HI MDPI
• Align international market players to support ICTSA (incl. fixed price for skipjack)
• Provide funding and resources for ICTSA
• Conduct scientific research (biological and socio-economic) support of ICTSA
• Provide international policy support for coastal tuna fisheries at the key RFMOs
• Leverage international trends, innovation and other resources for the benefit of ICTSA
• Serve as the international face of and provide publicity for ICTSA
• Serve as the main point of contact, engagement, and coordination for the Indonesian industry members (both pole and line/hand line industry)
• Require new members and ensure broad adaptation of solutions such as the CDT technology, labor practices, and safety
• Coordinate policy work/lobbying with members and government and serve main point of contact with government for the Alliance
• Coordinate Alliance to work together for towards the industry’s main goal of MSC certification
• Serve as on-the-ground implementer and evaluator of initiatives (technology, etc)
• Provide capacity to projects and integrate approaches of the different players
• Collaborate with Indonesian non-industry stakeholders and ensuring their input into policy processes
• Build capacity of upstream supply chain
• Provide scientific input to management development

USAID Oceans and Fisheries Partnership Page 93 of 105 Value Chain Assessment: Bitung, Indonesia
6.3.5 Objectives
The leadership of the proposed members of the Alliance met in January 2017 and developed a draft workplan. However, the workplan is still pending final agreement of the members and is not complete at the time of writing.
6.4 Suggestions for further consideration
6.4.1 Other members within the Alliance
ICTSA has to decide if, and how, it wants to include other members and associates. It suggested that at the start the core membership is limited to the three organizations only in order to establish a good working routine between the group. Through that process, the member becomes both imbedded in the work and brings value to the coalition, avoiding the resource sink or sleeping member challenge.
In addition, ICTSA must determine whether associate members, other groups that are supportive of the goals of the alliance, will strengthen ICTSA and its value proposition. These associate members can also bring specific expertise or networks that can help ICTSA reach its objectives, but may not be able to commit to a full work plan and could work with ICTSA on mutual as-needed basis. In order not to burden the core members, associate members should not necessarily be part of the core operations of ICTSA, at least in the beginning. Other possible stakeholders or future members, along with their current roles within the coalition, are outlined in Figure 52.
Figure 53: Roles for Other ICTSA Member Organizations Organization Possible role/intervention
USAID Oceans and Fisheries Partnership
Coordination and funding of the Bitung CDTS pilot and related activities
Future of Fish Technological support on traceability and global standards development
WWF international Engagement on global traceability standards development and industry round table engagement (overlap with ICTSA members); support for MSC in the market
Greenpeace Driving market demand for traceability and sustainability; moving strategic players in the supply chain (industry coordination)
Environmental Justice Foundation Exposure of supply chain human rights issues and driving corporate lead demand for traceability
Seafood Watch Communicating with U.S. markets and promotion of ICTSA
WWF Indonesia Collaboration with the Indonesia tuna FIP and traceability of their Seafood Savers program
SFP Market support for ICTSA, adaptation of standards to their FIP work
TNC /WCS Collaboration on the development of i-fish data collection and government policy
Sekolah Tinggi Perikanan Fishery development
Universities – IPB, Universitas Indonesia, Institut Teknologi Bandung
Research, technology and scientific support

USAID Oceans and Fisheries Partnership Page 94 of 105 Value Chain Assessment: Bitung, Indonesia
Associations: APIKI, GAPINDO, KADIN-PERIKANAN
Recruit members and expertise; increase lobbying power
Government – KKP, Deperindag, KPDT
Implementation
7. THE DEVELOPMENT OF A PILOT ELECTRONIC CDTS
There is significant momentum for the development of an electronic CDTS to support Indonesia’s plans to curb IUU fishing, capitalize on the learnings from the existing traceability pilots, and take advantage of the unified capacity and expertise of the members of the newly formed ICTSA. This section concentrates on the rationale for the implementation of an electronic catch documentation and traceability scheme, with a focus in Bitung, and concludes with a proposed way forward for its implementation.
7.1 Force field analysis
The rationale includes a Force Field Analysis, which includes the driving and restraining forces for the implementation of the electronic CDTS in Bitung. It outlines the critical elements that could impact the pilot based on the learnings from the VCA, the socio-economic survey and the value proposition assessment.
Objective: To implement electronic catch documentation and traceability scheme (pilot) in Bitung.
Figure 54: Force Field Analysis for Electronic CDTS in Bitung Driving forces (pros) Restraining forces (cons)
Food safety requirements and existing practices at the processor level.
Capacity to administrate at the small and medium business level.
Retailers and large processor internal requirements for standards and contribution to better traceability.
Granularity of the traceability required for safety and quality may not meet the emerging standards from EU and U.S. related to CDT
Drive to combat IUU fishing in Indonesia domestically.
Limited electronic catch documentation systems have been deployed for food security reasons, hence skill set for electronic catch documentation not developed.
Technological innovation and cost savings/efficiencies for businesses.
Time and skills required to do the paper work/data entry on board fishing vessels and at first mile
The fishers, captains and others are interested in technology and particularly in aspects that can help them stay connected to friends and family.
Disconnect between national level policy development and provincial level policy implementation.
Opportunity to make fishers, captains and others more connected to incentive schemes such as Kartu Nelayan, financial services and other services.
Current skills of the participants in the first mile.
Informal traders can be inefficient in their operations due to lack of oversight, applications such as Smithsonian can help provide business benefits and participation in traceability.
Market demand for fish without traceability requirements from domestic and other markets (middle east, Asia).

USAID Oceans and Fisheries Partnership Page 95 of 105 Value Chain Assessment: Bitung, Indonesia
Industry down turn in Bitung, possibility to differentiate product for the EU/U.S. market and vitalize Bitung.
Many technological solutions and pilots taking place, no coordinated approach of learnings and best practices can lead to inefficient innovation and implementation.
Fishing sector generally willing to comply with management and especially data collection.
Capacity of officials to process necessary paper work and delays and complications with corruption.
ICTSA provides an opportunity for more coordinated and efficient approach, better reach to government and covering different stakeholders in a comprehensive manner. International standards and platform in development will push for a more united market requirements over coming years.
Fragmented supply chains and the informal nature of many traders.
Joint ASEAN approach will even the playing field and competitiveness issues for the region and different sectors.
Industry down turn in Bitung, fragmented supply chains towards smaller players and potential unwillingness to cooperate in schemes as possibly burnt by recent collaboration. Low incentives to implement traceability requirements, as middlemen have a strong bargaining power due to low product availability, and are able to sell to markets without requirements. Limited current understanding of sustainability and traceability within fishing sector. Current policy setting is disadvantaging some sectors and their ability/willingness to participate. The costs of a full chain system are not clear, therefore it is not clear who can and should pay. Industry believes that data sharing will increase their requirement to pay taxes.
7.2 Value chain roadmap with improvements
As described throughout, there are no standards regarding traceability in Indonesia and current government required documentation does not cover all the fish produced in the country. Traceability initiatives are scattered and focus on address specific market requests or specific buyer preferences. Thus, several improvements are needed to establish a comprehensive and all-encompassing catch documentation and traceability system, commencing by improvements and simplifications of the government mandated catch documentation process, forms and information.
The current catch certificate documentation process can be simplified and integrated into one standard database that tracks VMS data, fish landing information and has the ability to cross check with the databases that contain other information such as vessel registration numbers, to reduce redundancy in the forms. The ability to integrate this data with the information provided by the processors will significantly reduce paperwork and the time required for the government to issue catch certificates.
Other users, such as fishers, traders and processors, will significantly benefit from the introduction of an electronic data entering system that can be connected to the government forms and linked seamlessly with the nodes of the value chain. This will reduce time spent copying the same information into different paper forms and improve efficiency across the value chain (see Figure 54).

USAID Oceans and Fisheries Partnership Page 96 of 105 Value Chain Assessment: Bitung, Indonesia
Figure 55: Value chain map with traceability improvements for each user
7.3 Service bundling for traceability
Fishers are the starting point of traceability, as they are the holders of the information pertaining to the key data points at the beginning of the traceability process, such as location and date of product catch and product volume. However, fishers are also the most tenuous users of a potential electronic CDTS and can be one of biggest bottlenecks to traceability unless attractive incentives are introduced. As highlighted, end-markets are not providing financial incentives for tuna fishery products that comply with full traceability, there is no standard generally accepted for key data elements throughout the value chain and fishers operating in small vessels (<5GT) are not required to adhere to the catch documentation process unless their product is intended for export to the EU market, making full traceability extremely challenging in Indonesia. Additionally, fishers on vessels that are required to obtain catch certificates struggle to comply with the current process. A pilot project is being proposed to ‘bundle’ several services under a ‘One Window Card’ approach to break some of these barriers to traceability by creating a safety net for fishers alongside the adoption.
The proposed pilot will leverage lessons learned from existing initiatives such the Unified Database (BDT) of Indonesia’s Tim Nasional Percepatan Penanggulangan Kemiskinan (TNP2K) – The National Team for the Acceleration of Poverty Reduction. BDT is a recently launched a national initiative to develop a linking existing government subsidy programs, financial services providers responsible for the delivery of the subsidies and other service providers under one platform. This platform will enable efficiency and transparency in the delivery of government subsidies, integration between different government databases and the opportunity for financial service providers to reach additional users, increasing access to financial services within the country.
The proposed pilot will utilize existing processes and platforms to develop an integrated solution to engage fishers in a traceability system while providing them with additional services (benefits) that will support them to increase productivity, reduce poverty, and contribute to economic growth. The proposed pilot utilizes ICTSA’s supply chain, fisher and market connections and other services, such as financial services and insurance (see Figure 55). The pilot can start with financial services linked to traceability and include other services throughout its implementation, as partnerships with the managing organizations are established.

USAID Oceans and Fisheries Partnership Page 97 of 105 Value Chain Assessment: Bitung, Indonesia
Figure 56: Services included in the pilot with managing institutions
Service Managing organization
Fisher identification MMAF
Life and disability insurance MMAF
Government subsidies directed at fishers MMAF
Other government subsidies and services Other government agencies
Traceability ICTSA
Financial services (bank accounts, savings, loans) BNI/BRI
Market services (investments back to fisher communities and certification)
ICTSA
Training on fishing best practices ICTSA
Opportunities for innovative new services
An integrated platform linking all these services can serve as a hub to test other innovations in addition to the above already existing services, such as specific financing lines to support fishers to adopt new government regulations and other innovations from the fin-tech space, such as mobile money transfers. One example of these innovations is the development of a direct a financing line through the platform directly to participating fishers specifically for the purchase of VMS for small scale boats. Another example of innovative financing is to direct market premium payments directly to fishers. As AP2HI enters the Marine Stewardship Council (MSC) certification in 2017, it can use the platform to direct premium payments from end-markets in Europe or U.S. directly for support programs for fishers participating in the MSC certification program.
Opportunity to take traceability to scale94
The inclusion of financial services within the bundle of services available under the above proposed structure will enable financial institutions to directly link lending programs, such as Jaring and KUR95, to traceability efforts and direct support investments required for the adoption of new regulations (i.e. preferential lending). Such investments could be to support upfront costs of hardware or have traceability incorporated within both programs constitutions so CDT would be a condition of finance. This will support efforts to curb IUU fishing by supporting the adoption of traceability by fishers. Additionally, bundling other services with traceability will create demand for traceability, setting a foundation for innovation within traceability market solutions and supporting Indonesia to be a technology innovation leader in Southeast Asia.
Furthermore, innovations by traceability technology service providers can support fishers to understand their costs, promote fisher efficiency and cost reductions. The data collected by traceability technology providers can support the development of new products and services tailored to the specific needs of fishers, thus supporting further innovation in the sector. Ultimately, the integrated approach can be a vehicle for scalability of traceability across Indonesia.
94 OJK JARING (net) program seeks to facilitate low interest loans to fishers to finance sustainable developments. As of July 2016, the JARING program had disbursed IDR 4.4 trillion (US$327 million) and has maintained a strong portfolio performance, with non-performing loans of 2.2% of the overall portfolio. There is an unequal disbursement of the financing for processing and trade. 95 Kredit Usaha Rakyat (KUR) which aims to increase financing to stimulate the small and medium enterprise (SME) sector. As of August 2016, KUR has disbursed IDR 498 billion (US$ 37 million) – only 1.18% of KUR’s national invested amount – in the fisheries sector.

USAID Oceans and Fisheries Partnership Page 98 of 105 Value Chain Assessment: Bitung, Indonesia
Creating efficiency throughout the value chain
The development of an integrated traceability system, commencing by linking fishers under the same platform, will create inherent efficiencies for fishers, traders, processors and the government. Once the integrated database is developed with the necessary data security measures and safeguards, information can be safely transferred between nodes of the value chain, abolishing paper forms currently used and creating seamless transactions. This system will decrease dock waiting time for vessels, improving the efficiency of fishers, reducing government staff time spent copying logbooks and reviewing redundant information required as part of the existing catch documentation forms, and reducing traders’ time spent shuffling between government offices and processors.
8. CONCLUSION There is a significant opportunity for Indonesia to be a leader in Southeast Asia by developing a national electronic CDTS. The government has a clear desire to move in this direction and curtail IUU fishing practices within its waters: there has been a very public and visual campaign to remove foreign vessels from fishing in Indonesian sovereign waters. The government now faces the challenge of improving reporting and registration across the sector. Although VMS has been introduced for >30GT vessels, compliance is still a major hurdle. There are clear opportunities to pilot eCDTS and demonstrate both the effectiveness and demand from the industry to adopt.
Industry’s willingness to incorporate electronic CDTS into their supply chains currently is only moderate. Even for exporters as there are no extra premiums offered by the markets, so adoption of an electronic CDTS would eat into the tuna industry’s bottom line profits, which have steadily been eroded by regulation changes imposed over the past few years.
ICTSA is well positioned to conduct the pilot as it has been successful in achieving MSC certification for pole-and-line and handline tuna fisheries in certain locations (including Bitung). The initial costs of the electronic CDTS are also a prohibitive factor for adoption, so bundling a range of services and financing options will also be paramount.
Currently, VMS is seen as a cost burden for the industry, but there are some substantial efficiency gains and cost savings from improved electronic CDTS, eliminating current time lags with processing time for required documentation. It is suggested as a follow on step to further analyze and calculate the efficiency and business performance gains compared to the added costs of eCDTS. Solution providers, such as Pointrek, are making in-roads with user facing (M2M) services (i.e. logbooks, WIFI) and, if there is a large enough market for electronic CDTS, then the solution provider space will become more competitive and costs of these applications will reduce in time. Pointrek has also negotiated a payment scheme with an Indonesian national bank in which the upfront costs of the equipment are paid in monthly installments across a 48-month tenure.
Prior to deployment of the pilot electronic CDTS, conducting a baseline survey of operational costs and crew welfare would be beneficial. Currently, most VMS providers offer emergency support by way of a panic button, but due to a need to minimize airtime costs, the information flow is only one-way. In the future, two-way communication will improve the emergency assistance provided, as it will allow for evaluation of the situation and vessel-to-vessel communication will improve first response time. As fuel is the largest operational cost, improvements in vessel efficiency will have great costs savings, and potentially could offset any costs of adopting new technology. A cost/benefit analysis is highly recommended.
Furthermore, bundling CDTS with improved access to government subsidies and financial packages will greatly improve adoption across the small-scale fleet, both for export and domestic orientated species. It should also be noted, market benefits are not necessarily limited price paid but also to the stability of payment, access to technical assistance, and other indirect benefits (i.e. insurance, community development programs). Access to these other benefits would greatly benefit the community.

USAID Oceans and Fisheries Partnership Page 99 of 105 Value Chain Assessment: Bitung, Indonesia
Finally, the government aspired to improve overall VMS compliance and improve the visibility of the product as it moves between the different nodes within the supply chain. To achieve this goal, the value proposition needs to be articulated for the industry, showing clear benefits, but central platform also needs to be developed for the government departments to expedite processing time and increase data sharing within the relevant departments.
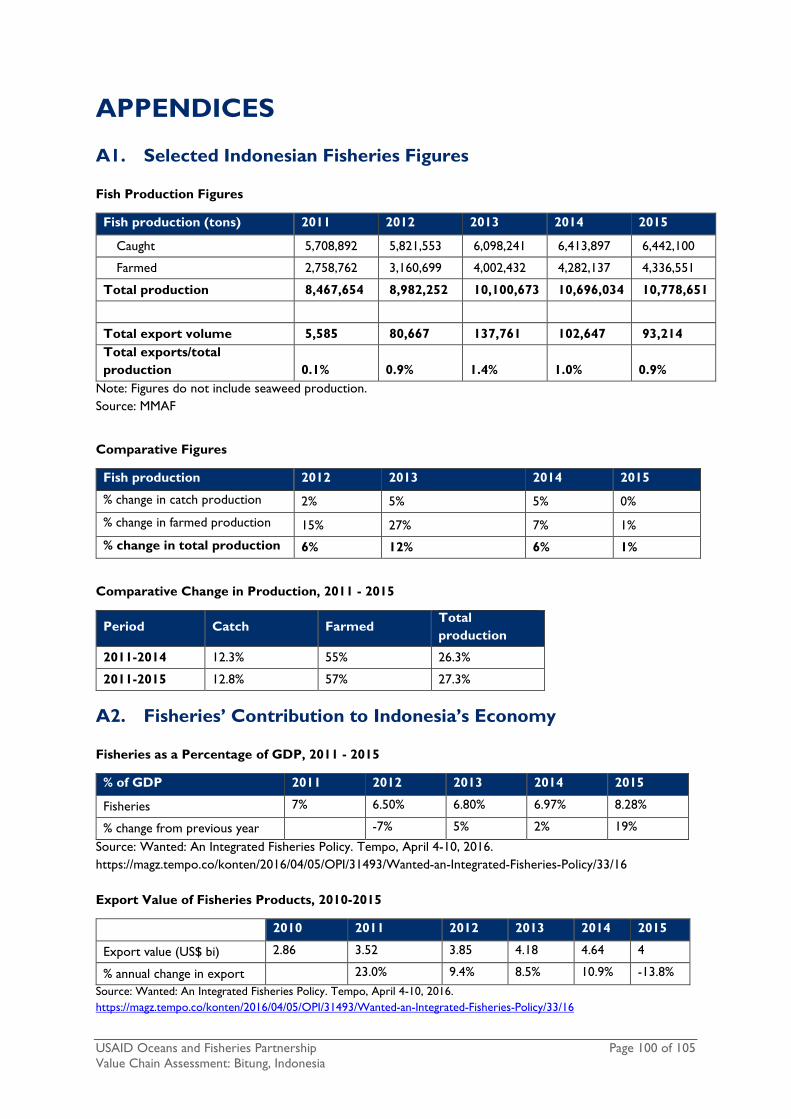
USAID Oceans and Fisheries Partnership Page 100 of 105 Value Chain Assessment: Bitung, Indonesia
APPENDICES
A1. Selected Indonesian Fisheries Figures
Fish Production Figures
Fish production (tons) 2011 2012 2013 2014 2015
Caught 5,708,892 5,821,553 6,098,241 6,413,897 6,442,100
Farmed 2,758,762 3,160,699 4,002,432 4,282,137 4,336,551
Total production 8,467,654 8,982,252 10,100,673 10,696,034 10,778,651
Total export volume 5,585 80,667 137,761 102,647 93,214 Total exports/total production 0.1% 0.9% 1.4% 1.0% 0.9%
Note: Figures do not include seaweed production. Source: MMAF
Comparative Figures
Fish production 2012 2013 2014 2015
% change in catch production 2% 5% 5% 0%
% change in farmed production 15% 27% 7% 1%
% change in total production 6% 12% 6% 1%
Comparative Change in Production, 2011 - 2015
Period Catch Farmed Total production
2011-2014 12.3% 55% 26.3%
2011-2015 12.8% 57% 27.3%
A2. Fisheries’ Contribution to Indonesia’s Economy
Fisheries as a Percentage of GDP, 2011 - 2015
% of GDP 2011 2012 2013 2014 2015
Fisheries 7% 6.50% 6.80% 6.97% 8.28%
% change from previous year -7% 5% 2% 19%
Source: Wanted: An Integrated Fisheries Policy. Tempo, April 4-10, 2016. https://magz.tempo.co/konten/2016/04/05/OPI/31493/Wanted-an-Integrated-Fisheries-Policy/33/16 Export Value of Fisheries Products, 2010-2015
2010 2011 2012 2013 2014 2015
Export value (US$ bi) 2.86 3.52 3.85 4.18 4.64 4
% annual change in export 23.0% 9.4% 8.5% 10.9% -13.8% Source: Wanted: An Integrated Fisheries Policy. Tempo, April 4-10, 2016. https://magz.tempo.co/konten/2016/04/05/OPI/31493/Wanted-an-Integrated-Fisheries-Policy/33/16

USAID Oceans and Fisheries Partnership Page 101 of 105 Value Chain Assessment: Bitung, Indonesia
A3. Comparison of Performance Fishery Exports, 2014-2015
Fishery Product Export Volumes
Volume ('000 ton) Value ('000 US$)
Fishery product 2014 2015 % change 2014 2015 % change
Shrimp 89.56 96.75 8.03% 989,522 851,182 -13.98%
Tuna 93.28 73.41 -21.30% 321,468 286,270 -10.95%
Blue Swimming Crab 14.66 13.09 -10.70% 206,221 187,390 -9.13%
Seaweed 91.50 105.71 15.54% 129,302 114,446 -11.49%
Squid, Cuttlefish, Octopus 32.59 39.81 22.14% 68,732 80,362 16.92%
Others 283.23 185.86 -34.38% 490,122 496,821 1.37%
Total 604.82 514.64 -14.91% 2,205,367 2,016,471 -8.57% Source: MMAF, BPS Fishery Product Exports as a Percentage of Total Exports
% of total export volume % of total export value Fishery product 2014 2015 2014 2015
Shrimp 15% 19% 45% 42%
Tuna 15% 14% 15% 14%
Blue Swimming Crab 2% 3% 9% 9%
Seaweed 15% 21% 6% 6%
Squid, Cuttlefish, Octopus 5% 8% 3% 4%
Others 47% 36% 22% 25%
Total 100% 100% 100% 100%
A4. Key Bitung Fisheries Data
Bitung Oceanic Fish Port Fisheries Production Volume for Tuna, Skipjack and Longtail Tuna (tons)
Fish species 2011 2012 2013 2014 2015 2016 (sept)
Yellowfin 1,556.5 4,593.4 11,314.7 21,982.2 9,662.7 7,274.3
Skipjack 10,871.9 20,611.7 47,597.3 68,755.1 18,263.1 9,938.7
Eastern little tuna 63.1 20.7 354.6 145.0 53.9 170.6
Frigate 340.2 1,211.2 4,768.0 7,860.0 8,746.5 9,487.4
Bigeye - - 11.4 87.7 116.4 24.6
Longtail - - - 825.0 - -
Other species 3,101.3 3,581.7 8,980.1 11,660.5 8,366.0 5,784.3
total tons 15,933.0 30,018.7 73,026.1 111,315.5 45,208.5 32,679.9 Source: DKP Bitung. Laporan Statistik PPS Bitung, 2015.

USAID Oceans and Fisheries Partnership Page 102 of 105 Value Chain Assessment: Bitung, Indonesia
Monthly Bitung Oceanic Fish Port Fishery Production Volumes (tons)
Month 2011 2012 2013 2014 2015 2016
January 824.8 1,475.4 4,489.7 5,287.4 2,346.4 2,660.8
February 882.7 1,876.8 5,255.2 6,508.3 1,726.5 3,032.2
March 1,011.6 2,118.3 6,688.2 8,185.7 2,863.4 3,213.7
April 1,603.9 2,323.8 6,736.1 10,721.6 3,792.0 2,807.5
May 1,614.7 2,421.6 6,017.9 12,712.9 4,813.0 4,576.0
June 1,032.0 1,861.8 6,254.1 11,269.8 5,928.7 4,547.9
July 1,145.7 2,072.5 6,931.4 11,940.6 2,700.7 3,940.6
August 1,157.1 3,058.2 5,674.8 14,074.9 3,232.8 3,158.1
September 1,405.9 3,824.8 6,013.5 8,737.0 4,402.9 4,743.2
October 1,784.4 4,330.2 6,808.9 10,813.6 4,484.0
November 1,754.5 2,724.3 6,611.7 7,406.1 5,365.5
December 1,715.8 1,931.0 5,544.8 3,657.7 3,552.6
Total 15,933.0 30,018.7 73,026.1 111,315.5 45,208.5 32,679.9 Monthly average
1,327.7 2,501.6 6,085.5 9,276.3 3,767.4 3,631.1
Source: DKP Bitung. Laporan Statistik PPS Bitung, 2015. Bitung Oceanic Fish Port Fisheries Production Volume by Gear Type (tons)
Gear type 2011 2012 2013 2014 2015 2016 (sept)
Purse seine 10,099.1 17,908.3 52,091.7 88,494.2 33,431.2 25,550.9
Pole and line 4,568.5 9,672.0 14,254.0 12,251.9 9,002.4 3,496.4
Hand line 694.7 1,444.2 3,027.8 3,856.5 1,912.1 2,887.5
Beach seine 194.4 182.4 391.3 506.8 93.6 20.6
Gill net 55.6 438.1 1,106.6 4,271.4 614.1 664.5
Rawai tuna 180.3 116.5 1,812.2 1,091.6 155.1 60.1
Bottom longline 71.1 70.5 211.7 480.8 - -
Other 69.3 187.7 130.9 362.3 - -
Total 15,932.9 30,019.7 73,026.1 111,315.5 45,208.5 32,680.0 Source: DKP Bitung. Laporan Statistik PPS Bitung, 2015. Monthly Bitung Oceanic Fish Port Production Volumes for Tuna, Skipjack, Little Tuna (tons)
Month total production
tuna skipjack little tuna T, SJ, LT T, SJ, LT % of total
January 2,346.4 452.5 1,067.2 385.8 1,905.5 81%
February 1,726.5 432.6 637.3 216.5 1,286.5 75%
March 2,863.4 580.1 1,365.0 376.0 2,321.1 81%
April 3,792.0 1,060.3 1,574.5 374.6 3,009.4 79%
May 4,813.0 914.4 2,120.9 883.1 3,918.4 81%
June 5,928.7 1,012.3 2,843.6 973.0 4,828.9 81%

USAID Oceans and Fisheries Partnership Page 103 of 105 Value Chain Assessment: Bitung, Indonesia
July 2,700.7 675.2 971.4 290.3 1,936.9 72%
August 3,232.8 579.3 1,578.6 422.3 2,580.2 80%
September 4,402.9 825.7 1,892.0 746.0 3,463.7 79%
October 4,484.0 933.3 1,484.7 1,446.5 3,864.4 86%
November 5,365.5 1,254.8 1,740.7 1,805.4 4,800.8 89%
December 3,552.6 942.0 987.3 880.9 2,810.2 79%
Total 45,208.5 9,662.7 18,263.1 8,800.4 36,726.1 81%
Monthly average
3,767.4 805.2 1,521.9 733.4 3,060.5
Source: DKP Bitung. Laporan Statistik PPS Bitung, 2015.
A5. Bitung Fish Exports Figures
Export Volume by Destination Country (tons)
# Country 2011 2012 2013 2014 2015
1 UK 2,617 8,053 7,526 7,403 4,182
2 Germany 9,945 7,951 9,346 7,598 3,385
3 U.S. 1,432 1,580 1,902 3,016 1,179
4 Switzerland 1,001 1,640 1,268 668 745
5 Australia - - - 81 450
6 Spain 213 4 355 1,566 377
7 Netherlands 1,444 389 1,048 376 299
8 Denmark 295 338 325 343 162
9 Belgium 813 893 388 - 117
10 Italy 58 53 423 689 73
11 Austria 106 203 75 489 71
12 France 79 123 172 24 67
13 Thailand 1,313 7,647 3,817 4,495 64
14 Japan 77 261 1,141 467 40
15 Cyprus - - - - 35
16 Sweden - - - - 30
17 Malta - - - - 12
18 Canada - - 7 244 9
19 Hungary 11 24 - 31 -
20 Czech Republic 145 - 277 307 -
21 Albania 25 22 - - -
22 Greece 89 10 20 36 -
23 Lithuania 13 - - 26 -
24 Macedonia 13 - - - -
25 Poland 90 - 77 - -
26 South Korea - - - 25 -
27 Ireland - 24 - - -

USAID Oceans and Fisheries Partnership Page 104 of 105 Value Chain Assessment: Bitung, Indonesia
28 Russia - 38 - - -
29 Ukraine - - 141 - -
30 Vietnam - - 50 - -
31 Singapore - - 12 - -
32 Portugal - - 0 26 -
33 Brunei Darussalam - - - 26 -
34 Slovakia - - - 28 -
Total 19,778 29,253 28,369 27,965 11,297
Source: DKP Bitung. Laporan Statistik PPS Bitung, 2015. 2015 Export Volume by Destination Country and Species (tons)
Country/ Species
Kastuwonus pelamis
Thunnus Albacares
Xyphia Gladius
Octopus Cyaneus
Thunnus Obesus
Lutjanus argentimacula
Total
Australia 159.1 291.2 - - - - 450.2
Austria 27.0 43.8 - - - - 70.8
Belgium 116.7 - - - - - 116.7
Cyprus - 34.6 - 0.0 - - 34.6
Denmark 161.7 - - - - - 161.7
Germany 3,352.3 33.0 - - - - 3,385.2
UK 4,085.0 97.4 - - - - 4,182.4
Italy 31.5 32.2 - 9.0 - - 72.7
Japan - - 39.4 - 0.3 - 39.7
Canada 9.2 - - - - - 9.2
Netherlands 283.2 16.1 - - - - 299.3
France - 55.3 - 12.1 - - 67.4
Spain 163.3 213.5 - - - - 376.8
Sweden 30.1 - - - - - 30.1
Switzerland 219.4 525.8 - - - - 745.2
Thailand 64.3 - - - - - 64.3
U.S. 26.9 1,152.0 - - - - 1,178.8
Malta - - - 11.0 - 0.9 11.9
Total 8,729.5 2,494.8 39.4 32.1 0.3 0.9 11,297.1
Source: DKP Bitung. Laporan Statistik PPS Bitung, 2015

USAID Oceans and Fisheries Partnership Page 105 of 105 Value Chain Assessment: Bitung, Indonesia
A6. Contributing Organizations This Value Chain Assessment was developed by Marine Change through a consultative research process that included desk research; a socioeconomic survey of pole-and-line, handline and purse seine tuna fishers in Bitung; a value proposition assessment and interviews of the main actors and stakeholders in the tuna value chains from point of catch to final consumer.
Contributing organizations and interviewees included individuals from:
Entity name Type of organization
Anova/MDPI U.S. processor, Fair Trade
Hatten consultancy/IPNFL
IPNLF NGO
m-fish Technology
PT Bali seafood processor U.S. market
ShipsInSight Technology
I-FITT Technology
ATUNA Trader
Sainsbury Retailer
TriMarine Trader
SFP NGO
Skytruth Technology
Traceall-Global Technology
Best tuna Academia
Thai Union Processor
MMAF-Directorate of Investment Development Government
The National Team for the Acceleration of Poverty Reduction (TNP2K) Government
BNI Financial institution
BRI Financial institution
Transformasi NGO