convergence.journalism.missouri.educonvergence.journalism.missouri.edu/.../2013/01/openva… ·...
TRANSCRIPT

EXECUTIVE SUMMARY
The rise of mobile technology in the form of tablets and smart phones has presented a
challenge to journalists and their outlets as to how best engage their audiences through those
devices. One idea that has been suggested is that of a second-screen experience where users can
engage with what they are watching through their mobile device. Because a 2012 study by
Forrester Research indicates 85 percent of tablet users use their devices while watching
television, the possibility exists to tie the two devices together through a second-screen
experience to better engage the user.
The purpose of this project was to develop a potential second-screen experience that
would be used by the audience in a real-world situation. It was decided the 2012 presidential
election and the numerous sub-federal elections would provide an ideal environment to test the
project with mid-Missourians.
The team, with the help of Reuben Stern and Stephen Bock of the Reynolds Journalism
Institute and Ryanne Dolan of the MU College of Engineering’s Computer Science department,
developed and built a virtual watch party on a mobile-enhanced website that would be active
during election night. The party would allow “attendees” to chat with other attendees about what
they were seeing and hearing on television and news sites.
After election night was over, the team analyzed the data and information from both the
site analytics and a survey posted on the party’s site. The analytics showed there were more than
1,600 unique visitors with more than 2,500 pageviews. The majority of visits came from Boone
County though the analytics showed visitors from St. Charles County, Missouri had the longest
average time on the site.

Roadman & Smith 2
Analytics also showed the vast majority of visitors came from KOMU.com, suggesting
that as suspected, broadcast would provide the best medium for complementing the experience.
At the same time, while KOMU.com provided the largest number of unique visitors, they were
the least engaged of the top-five referral sites. Facebook was found to have provided the largest
average time-on-page and the lowest bounce rate of the top-five referral sites.
When asked in a survey what else they were doing during the party, 80 percent of
respondents said they were watching television and 70 percent were visiting news websites. The
survey also showed 70 percent of respondents found the experience either somewhat satisfying
or highly satisfying.
The basis of the project suggested the possibility of a second-screen experience between
mobile technology and an outlet such as broadcast television. But the data suggested this was in
fact not completely practical. Of the almost 1,900 visitors, fewer than a third used a mobile
device to access the site. The others came from laptops or personal computers.
Because those who truly engaged in the party were the ones targeted, the possibility of a
second-screen experience as a whole still seems viable. But the idea of a purely mobile
experience centered in chatting and communicating with others does not seem to yet have firm
standing.
-Melissa Roadman & Adam Smith
Roadman & Smith 3
THE VIRTUAL WATCH PARTY AS A SECOND-SCREEN EXPERIENCE
Why the Second Screen?
In technology terms, the mobile or tablet device is nothing new; Apple’s iPhone alone
has been available to the public for more than five years and the iPad more than two years. And
there have been many additions to the smart phone and tablet market from other manufacturers.
But in that time, journalists have still not quite discovered how best to engage an
audience in the content that is being released. Almost every major news outlets and many local
television stations and newspaper have put out apps for mobile devices. Some of these have been
very innovative and make great use of the available technology, e.g. WIRED magazine’s
electronic edition on the iPad. But the vast majority of these applications are not specifically
designed to allow the back-and-forth passing of news, information and discussion between the
outlet and the audience.
Journalists and their employers must find a way to engage their audience and set
themselves apart from their competitors as they battle for views and advertising dollars.
One of the ways journalists and their outlets, particularly broadcast, can leverage mobile
is to develop some type of second-screen experience for their audiences. Studies suggest that
doing so would not require convincing the audience to really do anything different than what it is
are already doing. A 2012 study by Forrester Research showed tablets in particular are becoming
the “couch computer” of choice for Americans. The study says 85 percent of U.S. tablet users
use their tablet while watching television (Epps). According to Nielsen, 30 percent of the total
time users spend with their devices is in front of the television (Nielsen). Ericsson reported in
August 2012, that 62 percent of media consumers are using social media while watching
television while 67 percent use some form of a mobile device while watching television

Roadman & Smith 4
(Ericsson 3). A study done by Viaccess-Orca, a company that analyzes second-screen content
engagement, showed that 61 percent check their email and 47 percent use social media. Thirty-
seven check information about the program they are watching. (Barr) The data strongly suggests
the audience and market would be open to a second-screen experience by a journalistic
organization if it was properly target and implemented.
The Project
Taking the knowledge already gained from background research, we designed a survey in
order to confirm our findings with mid-Missourians thoughts. We publicized this survey on
Facebook and the Missourian’s website, but only received four responses. These responses did
confirm that people would like to talk with political experts and others in a live chat, but not in a
video chat. In addition, people wanted to see a stream of news from the local media and
information regarding the candidates.
Based on this knowledge, the team began devising how to put together and gauge
whether the implementation of a second-screen experience would garner the participation and
reactions the research suggested there could be. There was a limited time to produce the website,
so we prioritized what the most important features would be—the live chat, Twitter stream, and
incorporating the news streams—in order to make sure there was a product to be used.
The 2012 fall semester proved to be an excellent time to test this concept with the U.S.
presidential race in full-swing by the time the semester started and the actual election falling at a
good point during the semester.
Working with Reuben Stern and Stephen Bock of the Reynolds Journalism Institute and
Ryanne Dolan of the Computer Science department at the MU College of Engineering, the team
designed and built a mobile-enhanced website that would serve as a virtual “watch party” for

Roadman & Smith 5
election night. Though targeted for mid-Missourians, this allowed anyone with an Internet
connection, whether on a computer or mobile device, to join the party and discuss the election
results in real-time. In addition to Reuben as the moderator, we opted to solicit VIPs to come and
join our party. These people were political experts or local politicians who could contribute to
the conversation and answer questions the public might have, such as the impact of legislation or
why news media were reacting and passing on information the way there were.
During the last presidential debate, we were able to test with a small group of mid-
Missourians to see if the functionality worked and the website would support a high amount of
traffic. We were able to make some key observations on the interactivity and ease of use that
were all fixed before we launched the party on election night.
Our main advertising strategy was to use the newsrooms we worked with on Project
OpenVault in order to spread the word and make it easy for people to link to the party from the
newsroom’s websites. In addition, KBIA ran promotions the week leading up to the election, and
KOMU advertised the party while on-air.
Promotional material examples:

Roadman & Smith 6
On election night, our application had multiple rooms and functions that we had intended:
Mingle Home Screen- provided an introduction to the application and all of the features that were offered. We felt there needed to be an additional page after the jump screen in order to explain more in-depth what each of the tabs included.

Roadman & Smith 7
Mingle – Participants were able to speak to other users about the news. Reuben acted as a moderator while Adam and I watched the news and reported what was made official. There were five different rooms: President, U.S. Senate, State Elections, Ballot Issues and the VIP Room. The president room was the first one that users landed on and ended up being the one with the most traffic. A Twitter stream of related hashtags was also available through the Mingle tabs.
Read- an RSS feed of all of the news related to the election being posted by the Columbia Missourian. When the links were clicked on, it would go to the Missourian’s website in another window, providing content without the paywall.
VIP Room- information regarding each of the VIP members who were joined us throughout the night. Users could link to the VIP section of the Mingle tab directly from this screen.
Help- anyone who ran into trouble with the application could chat directly with Reuben in order to solve any problems. Reuben also had access to kick people out of the conversation if they were being uncivil, but this did not have to be used.
About Us- background information on Project OpenVault, with a link to the website. We placed our survey on this tab and mentioned it during the conversation multiple times.

Roadman & Smith 8
Analysis & Commentary
In order to determine whether or not a virtual watch party would be a viable option for a
news organization to engage with the audience, we performed both qualitative and quantitative
research. We collected analytics from the night of the watch party as well as asked participants to
fill out a survey about their behavior and satisfaction with the overall experience. A total of 51
people signed in with their Twitter handles, so those were the people we reached out to with the
survey. We had a total of 10 responses.
Viewing the analytics data for November 6 (Election Day) and November 7 (to allow for
people either on late on the East Coast or those who remained late in CST) showed we had 1,623
unique visitors visiting VirtualWatchParty.com 1,877 times. Although there were a significant
number of pageviews, there were 51 users who signed in using Twitter, and not all of these users
contributed to the conversation.
After reviewing the results of both research methods, we have determined that this
concept can be considered a second-screen experience. According to the survey, people were
also engaged in other activities besides participating in the watch party. When asked what else
participants were doing while attending our party, 80 percent said they were
watching TV and 70 percent said
they were visiting news websites
(Chart 1). This allows us to see
that people were using our
application as a supplement to
watching the media, which was
our goal.
Chart 1

Roadman & Smith 9
What is particularly interesting with this data is that even with only 10 respondents, the
visitors almost perfectly matched similar research about what people are doing with mobile
devices as was mentioned above. It should be remembered Forrester Research reported 85
percent of U.S. tablet owners use their device while watching television; the survey showed 80
percent of respondents watching television while participating in the virtual watch party. For
social media, Ericsson reported 62 percent of media consumers engage in social media while
watching television; the survey showed 60 percent of respondents using social media while
participating in the watch party.
Overall, the majority of the people who filled out the survey were somewhat satisfied
with the experience. In addition, most people reported the live chat section of the application as
their favorite feature [Chart 2].
Participants mainly enjoyed reading other comments as opposed to contributing. In
addition, the use of Twitter names was helpful for identification purposes, but could have
included a photo. Many of the improvements focused on the conversations. The suggestions
include: inviting professional journalists and journalism students from around the country to
participate, more advertising, creating an easier to navigate home screen, more visual elements
Chart 2

Roadman & Smith 10
for the chat room, fixing connectivity issues with Internet Explorer, being able to sign in without
a Twitter account and have bigger squares for the conversation. Some innovative ideas that were
suggested were creating a design similar to TweetDeck in order to monitor the different
conversations as well as incorporating conversation prompts in order to engage participants.
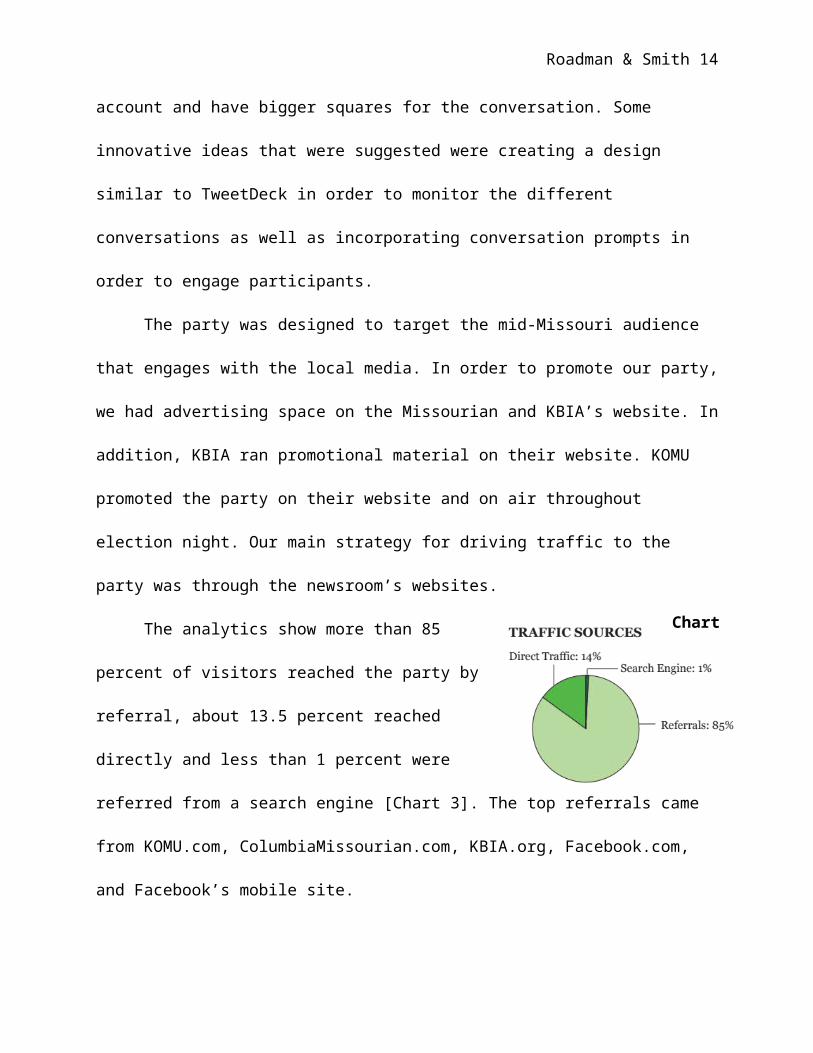
The party was designed to target the mid-Missouri audience that engages with the local
media. In order to promote our party, we had advertising space on the Missourian and KBIA’s
website. In addition, KBIA ran promotional material on their website. KOMU promoted the
party on their website and on air throughout election night. Our main strategy for driving traffic
to the party was through the newsroom’s websites.
The analytics show more than 85 percent of visitors
reached the party by referral, about 13.5 percent reached
directly and less than 1 percent were referred from a search
engine [Chart 3]. The top referrals came from KOMU.com,
ColumbiaMissourian.com, KBIA.org, Facebook.com, and
Facebook’s mobile site.
Within referrals, perhaps the most important for determining engagement and second-
screen potential, traffic from KOMU.com was by far the largest source as more than 71 percent
of visitors came from KOMU’s webpage. The next two largest sources were the Missourian and
KBIA webpages. KOMU was able to push a lot of visitors to the page, which is to be expected as
it has the largest audience of the three newsrooms promoting the party. KOMU.com traffic had
the highest bounce rate (percent of visitors who view one page and leave) of the top five,
indicating there may have been some misreporting or users unintentionally clicking on the
advertisement. That traffic also had significantly lower average visit durations (1 minute, 4
Chart 3

Roadman & Smith 11
seconds) than any of the other top five referrals [Chart 4]. In contrast, Facebook appears to have
the source from which the most engaged visitors came. Facebook’s full website sent 75 people to
the party who averaged just under 5 minutes on the site with a bounce rate under 71 percent, both
numbers are the best for any referral source in the top 5. The Missourian was the next best whose
152 visitors averaged 2 minutes, 19 seconds on the site with a bounce rate just
under 80 percent. While it is difficult to say which sources provided the best visitors, it seems
clear posting the link on a television station’s website drove the most traffic to the party, but
social media, namely Facebook, provided a higher percentage of engaged visitors.
This would suggest the vast majority of people turn to television for the most up-to-date
information on key election nights. But they also may turn to other media like newspapers and
radio stations. The data seems to suggest that, at least in this case, while television may provide a
high quantity of visitors to a second-screen experience site, social media would provide better a
better quality of engaged visitors.
In addition, we looked at what devices people were using to engage in the virtual watch
party. The analytics reporting on mobile device usage suggest almost 70 percent of visitors did
not use a mobile device to access the site. Tablets are categorizes as mobile devices in the
analytics. Of those using “mobile” technology, 66 percent were using smart phones; therefore, a

Roadman & Smith 12
tablet was the least used device. The
majority of people were using iOS
devices. Those using computers were
mainly on Windows and then
Macintosh computers [Chart 5]. Those
on mobile devices and tablets averaged
one minute and 45 seconds for their
visit duration while users on computers stayed on for slightly longer with an average visit
duration of two minutes and two seconds.
How visitors reached the site is one of the most important sets of data to analyze as it
cannot only suggest what media were most effective in sending visitors to the party but can also
suggest effectiveness as a second-screen experience, particularly for television.
In order to evaluate our effectiveness as a virtual watch party, we looked at the pageviews
and duration on pages of unique users. Although there were 1,877 unique visitors and more than
2,000 pageviews, the numbers appear to be skewed. Nearly 1,600 visits lasted for less than 10
seconds. It is difficult to determine what exactly caused so many (83.8 percent of total visits) to
last for such a short time and there could be several factors for it. It was realized early on in the
party there were accessibility issues for anyone using Internet Explorer (one VIP needed to be
guided through setting up a different Internet browser). It could also be people just stumbled
upon on the site or just wanted to check out briefly what it was after seeing it promoted. There is
also the possibility some visitors did not find it engaging enough to spend their time with it.
When looking at those who spent more than 10 seconds at the party, there was a large
difference in the level of engagement [Chart 6]. It was discovered that while many did not spend
Chart 5

Roadman & Smith 13
more than 10 seconds in the party, the next largest group were those who spent
a considerable amount of time. If spending more
than three minutes on the site can be considered
being engaged, though perhaps not actively, then
about 9.5 percent of our visitors were engaged and
more than a quarter of our total pageviews came
from visitors spending more than three minutes on
the site.
When looking just at the numbers for those deemed to be engaged, it is seen that almost
half of those engaged spent between 10 and 30 minutes; 34 percent spent between 3 minutes
and 10 minutes; and 17 percent more than 30 minutes. And
when it is broken down as the percentage of pageviews for
those engaged, the visitors who spent a significant amount of
time (longer than 10 minutes) were quite active between
pages [Chart 7].
Chart 7
Roadman & Smith 14
Location was another factor we needed to consider when looking at our audience. We
reached all over the
nation [Chart 8],
and some other
countries, including
engaged users in
Mexico and
Germany. The
analytics show the
idea of branding the watch party as a mid-Missouri event was correct as visitors from Columbia
and Jefferson City made up just more than 51 percent of our total visits. Smaller mid-Missouri
cities, like Moberly, Mexico and Auxvasse, also were in Google Analytics’ top ten site visitors
contributing between 1.4 and 2.3 percent of visitors. However, we were also able to draw
between 2.7 percent and 4 percent of our visits from the metropolitan areas of Kansas City,
Chicago and St. Louis.
Taking a closer look at Missouri, the main audience visiting the page was from Boone
County, which makes sense because that was a primary audience. However, we reached into the
rural areas of Missouri as well. In a comparison between the number of unique visitors and the
average duration of each visitor by county, the most engaged people were in St. Charles County,
even though there were many fewer of them than in Boone County [Chart 9]. We had many
fewer visitors in the rural areas of Missouri, however, their engagement was fairly equivalent to
those across the state with the exception of St. Charles County. For the entire site, the average
duration of the site was approximately two minutes. Boone, Cole, Cooper, Macon, Pettis,
Chart 8

Roadman & Smith 15
Randolph and Audrain counties all had average durations within one to three minutes. Johnson,
Christian, Lafayette and St. Charles counties all had average durations that were more than two
minutes than the site average.
There are some discrepancies with the data that are known and should be considered
when looking at the average pageviews. There is multiple times in which Google Analytics
records a zero-second page view. There were more counties in Missouri that registered
pageviews, but the visitors did not stay long enough for it to register any activity on the site.
Those people in the counties that had an average duration of more than one second were counted
in this data. For example, in Boone County, there was a total of 746 unique visitors but an
average visit duration of two minutes and 17 seconds. However, when looking at the total of the
time spent on the website by every person in Boone County, the number is more than 34 hours.
In this, we must consider that the five of us who worked on the project were on it for more than
three hours each. However, the average is so low because there were many people who
registered site visits of less than one minute. The analytics do not break it down far enough to
eliminate all people who registered zero second site visits.

Roadman & Smith 16
Overall, the research indicates that people are engaging in second-screen experiences,
regardless of their location. Those who visited the website did not stay for an extended period of
time, but those who chose to engage comprised about a quarter of our total pageviews. People
elected to use computers and laptops more than mobile devices and tablets. One possible
explanation for this is the ease of typing and contributing to a text chat on a keyboard as opposed
to touch screen. The strategy of using newsrooms as the way to drive traffic to the site was
beneficial. Television and radio proved to be the best medium for advertising, confirming that
many people still turn to these broadcast mediums for their election night coverage. We see this
form of virtual watch party working in the future for a variety of events. Because we have tested
this using an event that incorporated a news peg, it would be interesting to compare the
effectiveness of such a party for an entertainment event such as the Academy Awards and a
major sporting event. More entertainment-focused events could drive more traffic because the
talk would not be controversial and less intellectual. After performing tests with all three of these
categories, the data will reveal when people are most willing to engage in conversation with
news organizations.

Roadman & Smith 17
Works Cited
Barr, Nicholas. "Infographic: The Second Screen Phenomena." The Second Scream RSS. N.p., 28
Aug. 2012. Web. 10 Sept. 2012.
Epps, Sarah R. "The Tablet-TV Connection." Forrester.com. Forrester Research, 11 Apr. 2012.
Web. 6 Sept. 2012.
Ericsson. TV and Video: An Analysis of Evolving Consumer Habits. Rep. Ericsson Consumerlab,
Aug. 2012. Web. 6 Sept. 2012.
Nielsen. "In the U.S., Tablets Are TV Buddies While EReaders Make Great Bedfellows."
Nielsen Wire. Nielsen Company, 19 May 2011. Web. 6 Sept. 2012.