transphorm · emission factors for shipping ... tion by power production first and then multiplying...
TRANSCRIPT

TRANSPHORM
Transport related Air Pollution and Health impacts –
Integrated Methodologies for Assessing Particulate Matter
Collaborative Project, Large-scale Integrating Project
SEVENTH FRAMEWORK PROGRAMME
ENV.2009.1.2.2.1 Transport related air pollution and health impacts
Deliverable D1.2.3, type R
Emission factors for shipping – final dataset for use in Transphorm
emission inventories
Due date of deliverable: project month 18
Actual submission date: project month 24
Start date of project: 1 January 2010 Duration: 48 months
Organisation name of lead contractor for this deliverable: IVL
Scientist responsible for this deliverable: Jana Moldanová
Revision: [1]

D1.2.1 TRANSPHORM Deliverable
2 of 27
Contents
Emission factors for shipping – final data for use in Transphorm emission inventories 3
Introduction 3
International legislation on emissions from shipping 5
Legislation for inland waterways in Europe 7
Abatement techniques for reduction of air pollution 8
Comparing to Emission factors for biofuels with conventional fuels 9
Emission factors for SO2 and CO2 11
Emission factors for VOC and CO 12
Emission factors for NOX 13
Emissions factors for PM mass 15
Emissions factors for particle number concentration 20
Emissions factors for PAHs 22
Conclusions 25
References 26

Deliverable TRANSPHORM D1.2.1
3 of 27
Emission factors for shipping – final data for use in
Transphorm emission inventories
Jana Moldanová1, Erik Fridell
1, Andreas Petzold
2, Jukka-Pekka Jalkanen
3, Zissis Samaras
4
1 IVL, Swedish Environmental Research Institute, Box 5302, 40014 Gothenburg, Sweden
2 Deutche Zentrum für Luft- und Raumfahrt, Institut für Physik der Atmosphäre, Oberpfaffenhofen, 82234 Wess-
ling, Germany 3 Finish Meteorological Institute, P.O. Box 503, 00101 Helsinki, Finland
4 Department of Mechanical Engineering, Aristotle University, 54124 Thessaloniki, Greece
Introduction
This report is a final version of review and recommendations of emission factors for particulate
matter (PM) expressed as mass, number size-distribution as well as some characteristics of the par-
ticle emissions such as black carbon, organic carbon and PAHs. Emission factors for a number of
other compounds gas-phase compounds are described briefly. Effects of engine type, fuel quality as
well as emission cleaning technologies on emission factors are described. Chapter is also devoted to
legislation for emissions from inland and national and international maritime shipping. The recom-
mended emission factors include data reported in open literature, data measured and reported by
Transphorm partners within other projects and a new dataset produced in Transphorm measurement
campaign.
Emissions from a fleet of ships are usually calculated by means of quantifying the fuel consump-
tion by power production first and then multiplying the consumption by emission factors. Some
inventories use the bunker sales statistics as a direct estimate of the fuel consumption together with
an assumption of a distribution of ship and engines types. Others, including the bottom-up invento-
ries, estimate the power production, and thus the fuel consumption of individual ships, from fleet
movement statistics. Emission factors (EF) used are then related either to the generated power EFp
(g(species)/kWh) or to the fuel consumed EFf (g(species)/kg(fuel)), where the first one multiplied by the
specific fuel consumption (SFC, unit g(fuel)/kWh) is equal to the second one.
Emissions from a marine engine will depend on the type of fuel used as well as on characteristics
of the engine. The most important fuel parameters are if the fuel is heavy fuel oil (residual fuel,
HFO) or marine distillates (marine gasoil, MGO or marine diesel, MDO) and the sulphur content
(FSC). The emissions likely depend on the viscosity and the aromatics content of the fuel but there
is not sufficient data to link emission factors to these parameters. There are some other fuels that are
much more uncommon such as biodiesel, coal and natural gas.
Emissions have been found to vary significantly between engines. Probably the maintenance and
age of the engine are important for certain emission factors. For calculating emissions one usually
considers the engine power, the engine speed and the emissions standard. The latter applies to ni-
trogen oxides only. However, one can suspect that the emissions standard also will influence the
emissions of, e.g. particles and hydrocarbons, although there is, for most cases, not enough data
available to draw conclusions about this.
The engines on ships are usually one or several main engines, used for propulsions and a number
of auxiliary engines, used for thrusters, electricity generation, pumps etc. The main engine is often
equipped with a shaft generator that produces electricity when the main engine is in operation. In
addition there are usually a number of boilers for steam and hot water production fuel heating etc.
Dominating sources of emissions at open sea are the main engines. At berth these are usually turned
off while the auxiliary engines still are being used. For those engines on ships operating with a

D1.2.1 TRANSPHORM Deliverable
4 of 27
power plant principle, main engines are used for electricity generation and electrical motors are
used for propulsion. In these cases main engines are used both for propulsion and all additional
equipment power needs thus obviating the need for separate auxiliary engines. Here, main engines
are run also during harbour visits.
The engines are usually divided by engine speed into slow speed (60 – 300 rpm), medium speed
(300 – 1000 rpm) and high speed (1000 – 3000 rpm). Most modern cargo ships use slow speed, two
stroke engines or medium speed, four stroke engines. Later are common in passenger vessels. Some
smaller vessels may use high speed, four stroke diesel engines. The specific fuel consumption
(SFC), expressed as mass of fuel per unit of work by the engine (g/kWh), depend on the engine type
and on the type of fuel used. Typical values can be found in Table 1. Note that the SFC varies be-
tween different engines and will typically be lower for larger engines than for smaller. The fuel
consumptions in Table 1 are for typical design speeds which usually correspond to an engine load
of 80-85% of the maximum engine power. If the engine is used at lower or higher loads the specific
fuel consumption is typically higher. Variation of SFC with engine load and engine speed can be
seen in Figure 1.
Table 1. Specific fuel consumption for marine engines (Cooper and Gustafsson, 2005)
Engine type Fuel type SFC (g/kWh)
Slow speed Residual oil 195
Marine distillates 185
Medium speed Residual oil 215
Marine distillates 205
High speed Residual oil 215
Marine distillates 205
Figure 1. The relative specific fuel-oil consumption (SFOC) as a function of the relative engine load, based on the
data of three engine manufacturers: Wärtsilä, Caterpillar and MAN. Figure from Jalkanen et al. (2011).
0.9
0.95
1
1.05
1.1
1.15
1.2
1.25
1.3
1.35
1.4
0.1 0.2 0.3 0.4 0.5 0.6 0.7 0.8 0.9 1
Rel
ativ
e fu
el c
on
sum
pti
on
rat
e [*
10
0%
]
Engine Load [*100%]
Wärtsilä
CAT
MAN
Deliverable TRANSPHORM D1.2.1
5 of 27
Emissions of some species like SO2, CO2 and metals are directly proportional to the SFC and fuel composition, regardless the type of engine or its operation regime (abatement techniques not accounted). Others, like NOX, VOC, CO and PM are dependent on combustion regime and thus on type of engine, its power setting and on physical properties of the fuel.
International legislation on emissions from shipping
Legislation is in force to control the emissions from shipping through Annex VI of the Marine Pol-
lution Convention (MARPOL) that was adopted in 1997 by the Marine Environmental Protection
Committee (MEPC) of the International Maritime Organisation (IMO) and came into force in May
2005 (IMO, 2006). Annex VI with its amendment from October 2008 put limits on emissions of
SO2 and NOX globally and contains provisions allowing establishment of Emission Control Areas
(ECA) with more stringent reductions of fuel–sulphur content and of emissions of NOX, or both
(IMO, 2009). Emission Control Areas for PM are mentioned in Annex VI as well, however no regu-
lation for PM as such is given and the PM reduction is expected to come from the reduction of fuel-
sulphur.
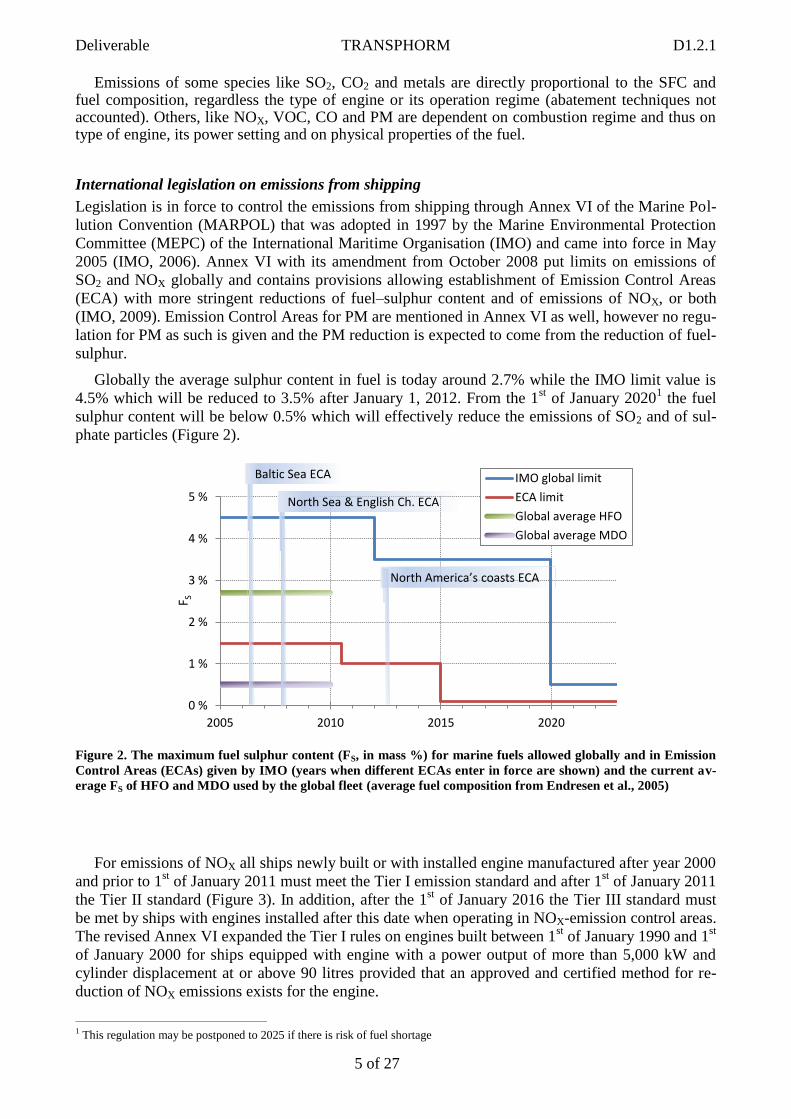
Globally the average sulphur content in fuel is today around 2.7% while the IMO limit value is
4.5% which will be reduced to 3.5% after January 1, 2012. From the 1st of January 2020
1 the fuel
sulphur content will be below 0.5% which will effectively reduce the emissions of SO2 and of sul-
phate particles (Figure 2).
Figure 2. The maximum fuel sulphur content (FS, in mass %) for marine fuels allowed globally and in Emission
Control Areas (ECAs) given by IMO (years when different ECAs enter in force are shown) and the current av-
erage FS of HFO and MDO used by the global fleet (average fuel composition from Endresen et al., 2005)
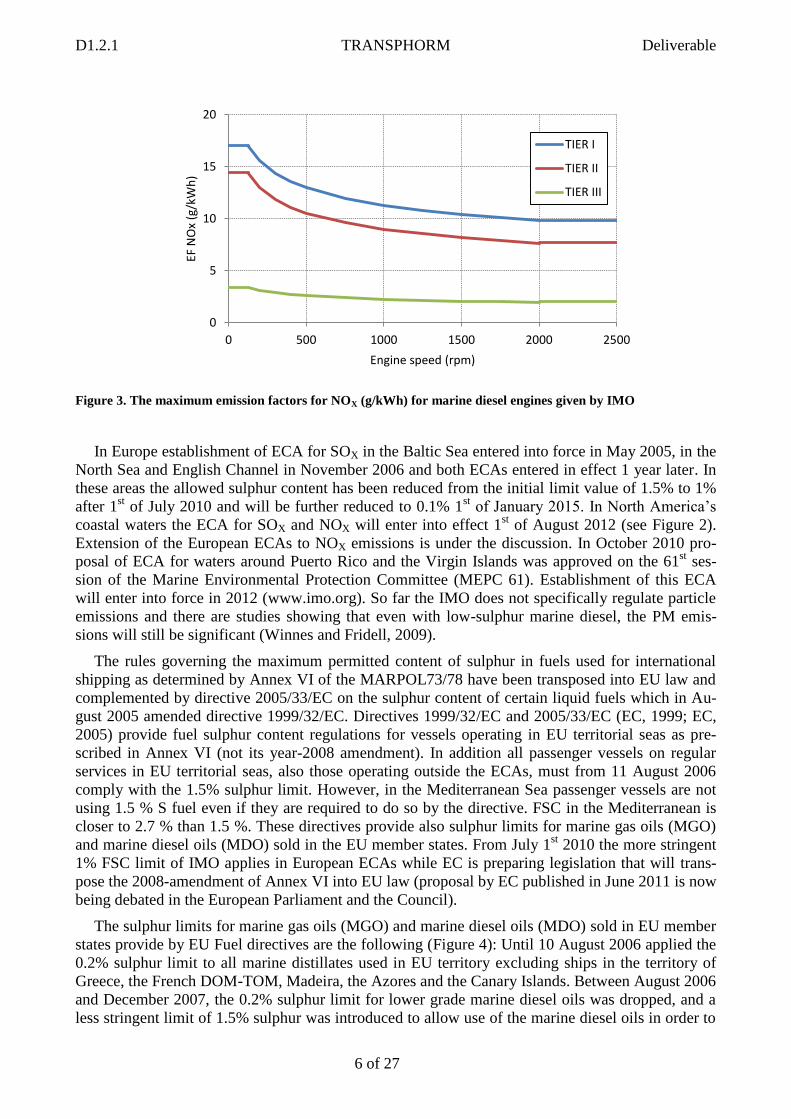
For emissions of NOX all ships newly built or with installed engine manufactured after year 2000
and prior to 1st of January 2011 must meet the Tier I emission standard and after 1
st of January 2011
the Tier II standard (Figure 3). In addition, after the 1st of January 2016 the Tier III standard must
be met by ships with engines installed after this date when operating in NOX-emission control areas.
The revised Annex VI expanded the Tier I rules on engines built between 1st of January 1990 and 1
st
of January 2000 for ships equipped with engine with a power output of more than 5,000 kW and
cylinder displacement at or above 90 litres provided that an approved and certified method for re-
duction of NOX emissions exists for the engine.
1 This regulation may be postponed to 2025 if there is risk of fuel shortage
0 %
1 %
2 %
3 %
4 %
5 %
2005 2010 2015 2020
F S
IMO global limit
ECA limit
Global average HFO
Global average MDO
Baltic Sea ECA
North Sea & English Ch. ECA
North America’s coasts ECA
D1.2.1 TRANSPHORM Deliverable
6 of 27
Figure 3. The maximum emission factors for NOX (g/kWh) for marine diesel engines given by IMO
In Europe establishment of ECA for SOX in the Baltic Sea entered into force in May 2005, in the
North Sea and English Channel in November 2006 and both ECAs entered in effect 1 year later. In
these areas the allowed sulphur content has been reduced from the initial limit value of 1.5% to 1%
after 1st of July 2010 and will be further reduced to 0.1% 1
st of January 2015. In North America’s
coastal waters the ECA for SOX and NOX will enter into effect 1st of August 2012 (see Figure 2).
Extension of the European ECAs to NOX emissions is under the discussion. In October 2010 pro-
posal of ECA for waters around Puerto Rico and the Virgin Islands was approved on the 61st ses-
sion of the Marine Environmental Protection Committee (MEPC 61). Establishment of this ECA
will enter into force in 2012 (www.imo.org). So far the IMO does not specifically regulate particle
emissions and there are studies showing that even with low-sulphur marine diesel, the PM emis-
sions will still be significant (Winnes and Fridell, 2009).
The rules governing the maximum permitted content of sulphur in fuels used for international
shipping as determined by Annex VI of the MARPOL73/78 have been transposed into EU law and
complemented by directive 2005/33/EC on the sulphur content of certain liquid fuels which in Au-
gust 2005 amended directive 1999/32/EC. Directives 1999/32/EC and 2005/33/EC (EC, 1999; EC,
2005) provide fuel sulphur content regulations for vessels operating in EU territorial seas as pre-
scribed in Annex VI (not its year-2008 amendment). In addition all passenger vessels on regular
services in EU territorial seas, also those operating outside the ECAs, must from 11 August 2006
comply with the 1.5% sulphur limit. However, in the Mediterranean Sea passenger vessels are not
using 1.5 % S fuel even if they are required to do so by the directive. FSC in the Mediterranean is
closer to 2.7 % than 1.5 %. These directives provide also sulphur limits for marine gas oils (MGO)
and marine diesel oils (MDO) sold in the EU member states. From July 1st 2010 the more stringent
1% FSC limit of IMO applies in European ECAs while EC is preparing legislation that will trans-
pose the 2008-amendment of Annex VI into EU law (proposal by EC published in June 2011 is now
being debated in the European Parliament and the Council).
The sulphur limits for marine gas oils (MGO) and marine diesel oils (MDO) sold in EU member
states provide by EU Fuel directives are the following (Figure 4): Until 10 August 2006 applied the
0.2% sulphur limit to all marine distillates used in EU territory excluding ships in the territory of
Greece, the French DOM-TOM, Madeira, the Azores and the Canary Islands. Between August 2006
and December 2007, the 0.2% sulphur limit for lower grade marine diesel oils was dropped, and a
less stringent limit of 1.5% sulphur was introduced to allow use of the marine diesel oils in order to
0
5
10
15
20
0 500 1000 1500 2000 2500
EF N
Ox
(g/k
Wh
)
Engine speed (rpm)
TIER I
TIER II
TIER III

Deliverable TRANSPHORM D1.2.1
7 of 27
comply with the SOX Emission Control Areas, in case supplies of 1.5% S heavy fuel oil were insuf-
ficient. The exemption for Greece and the outermost regions continued to apply. Between January
2008 and December 2009 a more stringent 0.1% sulphur limit applied to high grade marine gas oils
used in EU territory while the 1.5% sulphur limit for the low grade marine diesel oils continued to
apply. The exemption for Greece and the outermost regions continued to apply. From 1 January
2010, the provisions originating from directive 1999/32 and relating to the use of marine gas oils in
EU territory (described above) were deleted. Instead a 0.1% sulphur limit was introduced for all
marine gas oils placed on the market in EU Member States’ territory. At the same time a 0.1% sul-
phur limit started to apply to all types of marine fuel used by ships at berth in EU ports and by in-
land waterway vessels. This applies to any use of the fuel e.g. in auxiliary engines, main engines,
boilers. This legislation goes beyond IMO’s Annex VI. There are following exemptions from this
0.1% limit: for ships which spend according to published timetables less than 2 hours at berth, for
hybrid sea-river vessels while they are at sea, and for ships at berth which switch off all engines and
use shore-side electricity. The outermost EU regions continue to be exempt from this provision, but
Greece does not, apart from a 2-year derogation for 16 named Greek vessels until 2012.
Figure 4. The maximum fuel sulphur content (FS, in mass %) for marine fuels allowed in EU territorial waters
and EU inland waterways given by Directives 1999/32 and 2005/33/EC.
Legislation for inland waterways in Europe
There are regulations regarding emissions for ships on inland waterways in Europe for NOX, HC, CO and PM as well as for the sulphur content in the fuel used. The emission limits are regulated in Directive 97/68/EG and the sulphur content in the fuel in Directive 97/70/EG. The permitted emis-sions are expressed as mass of emissions per engine work (g/kWh) and depend on the cylinder vol-ume and the net power of the engine. The regulations, given for CO, HC + NOX and PM, can be found in Table 2. Fuel sulphur content used by inland navigation has been limited in EU since 2008 when a limit of 1000 ppm-wt. = 0.1 % was set. From Jan. 1
st 2011, the maximum allowed sulphur
content in the fuel is 10 ppm-wt. although 20 ppm can be accepted in some cases.
0.0%
0.5%
1.0%
1.5%
2.0%
2005 2007 2009 2011 2013 2015
F S
Marine fuels used in EU ECAs (as established)
Marine fuels used by passenger vessels in all territorial seas
Marine fuels used in EU ports by ships at berts& in inland waters
MGO sold in EU
lower grade MDO&MGO (transient)
MDO sold in EU

D1.2.1 TRANSPHORM Deliverable
8 of 27
Table 2. Regulations on emissions from engines for inland waterways
Category: volume/net power (SV/P) (liter per cylinder/kW)
Date CO (g/kWh) HC + NOX (g/kWh)
PM (g/kWh)
V1:1 SV<0.9 och P ≥ 37 kW 2007.01 5.0 7.5 0.40
V1:2 0.9 ≤ SV ≤ 1.2 2007.01 5.0 7.2 0.30
V1:3 1.2 ≤ SV ≤ 2.5 2007.01 5.0 7.2 0.20
V1:4 2.5 ≤ SV ≤ 5 2009.01 5.0 7.2 0.20
V2:1 5 ≤ SV ≤ 15 2009.01 5.0 7.8 0.27
V2:2 15 ≤ SV ≤ 20 och P <3 300 kW 2009.01 5.0 8.7 0.50
V2:3 15 ≤ SV ≤ 20 och P ≥ 3 300 kW 2009.01 5.0 9.8 0.50
V2:4 20 ≤ SV < 25 2009.01 5.0 9.8 0.50
V2:5 25 ≤ SV < 30 2009.01 5.0 11.0 0.50
Abatement techniques for reduction of air pollution
Emission factors need to take into account effects of abatement techniques. Some reductions of emission factors are summarized in Table 3. Most abatement techniques focus on the emissions of NOX. The most effective technique is selective catalytic reduction (SCR) where NOX react with an added reducing agent (normally urea) over a catalyst to produce nitrogen gas. The process is very efficient and reduction factors of 95% can be reached. There is however a certain minimum exhaust temperature needed for the reaction to take place. Pre-turbo installations of SCR on 2-stroke en-gines can be problematic. Many SCR installations are equipped with an oxidation catalyst in order to minimise the ammonia slip. This will also lead to the oxidation of CO and hydrocarbons thus reducing those emissions. Further, an SCR will also influence the PM emissions although the de-tails are not quite clear. Other techniques for NOX reduction includes exhaust gas recirculation (EGR), engine modifications and different techniques to introduce water into the engine (humid air motor, HAM, direct water injection, DWI, emulsifier). These techniques can be used in combina-tions as e.g. Fuel-Water emulsion and EGR which together can reduce 90% of NOx.
Scrubber techniques can be used to reduce the emissions of sulphur oxides to the atmosphere. The scrubbers can operate either with seawater or with freshwater under the addition of an alkaline compound. The scrubbers will trap the SOX as sulphates in the water. The efficiency will depend on, among other things, the alkalinity of the water and the volumes. Scrubbers will also capture particles but the efficiency varies between different reports.
Table 3. The various abatement techniques and their evaluated emission reduction efficiencies.
Abatement technique EFNOx EFSOx EFCO EFVOC EFPM EFNH3
Low NOX engine technologies1 −20% ±0
* ±0
† ±0
†
Exhaust gas recirculation1 −30 - −40%
Direct Water Injection1 −50 - −60% ±0 ±0 ±0
Humid Air Motor1 −70 - −85% ±0 ±0 ±0
Selective Catalytic Reduction1 −91% ±0 ±0 ±0 +0.1 g/kWh
SCR + oxidation catalyst2 −90% −70% −80%
Sea Water Scrubber3 ±0 −95% ±0-80%
‡
Fuel Emulsifier3 −10%
Wetpac3 −50%
* Some increase possible
† Unconfirmed up to 50 % reduction
‡ Value from Jalkanen et al. (2011). According to Corbett (2010) reductions range from -98% to -45%, largest fractions
of PM are reduced more effectively than the small ones. 1 Lövblad and Fridell, 2006
2 Cooper and Gustafsson, 2004
3 Jalkanen et al., 2009
Deliverable TRANSPHORM D1.2.1
9 of 27
Comparing to Emission factors for biofuels with conventional fuels
The modification of emissions of exhaust compounds CO2, NOx, hydrocarbons, and particulate matter from medium-speed marine diesel engines was studied for a set of fossil and biogenic fuels in the German project BIOCLEAN (Petzold et al., 2011). Applied fossil fuels were the reference HFO and the low-sulphur MGO, biogenic fuels were palm oil, soybean oil, sunflower oil, and ani-mal fat. Emissions of core gaseous species CO2, CO and NOX do not vary significantly between fossil high-sulphur HFO (FSC 2.7wt.%) and low-sulphur fossil and biogenic fuels. Emissions of gaseous hydrocarbon compounds relative to HFO are significantly increased for MGO while re-spective emissions for biogenic fuels are similar to HFO (10% load) or reduced at most to 40% (75% load). The increase in HC emissions for MGO may be linked to the measurement method, because for MGO exhaust the FID sensor detects all HC in the gas phase while for HFO some of the hydrocarbons appear in the condensed phase. Neither EF(HC) of Cooper and Gustafsson (2004) nor Transphorm measurements show an increase in EF(HC) from HFO and MGO. Figure 5 summa-rises the emissions relative to HFO for an engine load of 75% representing cruise conditions.
When using low-sulphur fuels (MGO, biogenic fuels), the emissions of particulate matter (PM) by mass is strongly reduced compared to HFO. This effect is of similar magnitude for all low-sulphur fuels of either fossil or biogenic origin. The reduction in PM mass emissions can be at-tributed primarily to the reduction in sulphate emissions, but also BC emissions are significantly lower. For all investigated fuels including HFO, emissions of PM and BC are strongest at low load-ing and decrease with higher loading. Considering all investigated engine load conditions, PM emissions relative to HFO are reduced to 6-25% for MGO and to 6-60% for biogenic fuels. Reduc-tions in BC relative emissions vary from 13% to 30%, with MGO showing the strongest reduction to 13%, while soybean oil was found to emit significantly higher BC than the other low-sulphur fuels.
Particle size distributions measured in the exhaust are shown in Figure 6. Both exhaust aerosols are characterized by a strong nucleation particle mode (Mode 1) in the size range dp < 10 nm. For palm oil, Mode 2 is centred at dg = 13 nm, while the respective mode for HFO is centred at dg = 25-27 nm. This mode likely contains primary BC particles. At 100% load the size distribution of HFO exhaust aerosol features a pronounced peak at dg = 55 nm, while the size spectrum for biogen-ic fuels shows Mode 3 at dg = 85 nm. In this particular size range, Mode 3 is reduced in number density by up to two orders of magnitude at 100% load, and still by a factor of two at 10% load. Modes 3 and 4 are assumed to be made up of BC agglomerates.
The reduced soot particle mode coincides with a strong reduction in BC mass emission, and in emissions of nonvolatile PM by number for biogenic fuels. The increased emission of total PM by number (see Figure 5) is mirrored in the exceedance of particle size spectra for biogenic fuels com-pared to HFO particularly for nucleation mode particles with dp < 20 nm. Emissions of BC and particle number provide a consistent picture of the modification of PM emissions from marine die-sel engines when switching from HFO to low-sulphur fuels of biogenic origin.
PM emitted from biogenic fuels is composed almost entirely of carbonaceous matter like OM and EC; see Figure 7 for a comparison of relative chemical compositions for fuels HFO, palm oil and animal fat. Sulphate and sulphate-associated water which dominate PM from HFO, do not con-tribute to PM from biogenic fuels. Changes in emissions were predominantly related to particulate sulphate, while differences between low-sulphur fossil fuels and low-sulphur biogenic fuels were of minor significance.

D1.2.1 TRANSPHORM Deliverable
10 of 27
Figure 5. Emissions of gaseous (top row) and particulate (bottom row) compounds per kWh of generated power
relative to heavy fuel oil (HFO) as the fossil sulfur-rich reference fuel for investigated fuels marine gas oil
(MGO) and biogenic fuels at 75% engine load; used abbreviations for particulate matter compounds are ex-
plained in the text.
Figure 6. Particle number size distribution at 10% load (a) and 100% load (b) for HFO as the reference fuel and
for palm oil representing biogenic fuels; particle size spectra were measured by DMA (dp = 5 – 200 nm) and by
OPC (dp > 250 nm) instruments, solid lines represent 4-modal log-normal size distributions fitted to the data.
0.01
0.1
1
CH2OHCCONO
x
CO2
Fuel sequence from left to right:
MGO - Palm oil - Animal fat - Soybean oil - Sunflower oil
0.01
0.1
1
N nonvol
N total
BCOM
em
issio
n p
er
kW
h r
ela
tive
to
HF
O
(75
% lo
ad
)PM
10 100 100010
-1
100
101
102
103
104
105
106
107
108
109
10 100 1000
dN
/ d
log
dp
cm
-3 S
TP
particle diameter dp, nm
10% load HFO
Palm oil
(a) (b)
100% load HFO
Palm oil
particle diameter dp, nm

Deliverable TRANSPHORM D1.2.1
11 of 27
Figure 7. Fractional chemical composition of particulate matter emitted from a large Diesel engine operating on
fossil sulfur-rich heavy fuel oil (HFO), and on biogenic low-sulfur fuels palm oil and animal fat.
Emission factors for SO2 and CO2
The emission of SO2 is proportional to the fuel consumption and the sulphur content in the fuel.
This is because virtually all the sulphur in the fuel will be oxidised into SO2 in the engine. The
emission factor expressed as mass of SO2 emitted per mass of fuel consumed is therefore
EFSO2 (g/kg fuel) = fS(%) * 20, (E 1)
where fS is the mass fraction of S in the fuel (in weight per cent) and factor 20 (19.97) comes from
recalculation of the molar weight from S to SO2 and from % to g/kg. To express the emission in
mass per engine work the specific fuel consumption must be used. In a more detailed analysis one
should consider that some sulphur is oxidised further into SO3 and may form sulphate particles.
This is typically on the order of 1-5 per cent of the S-content in the fuel, depending on the engine
load (Petzold et al., 2010). Some measurements indicates much higher loss of S from the gas phase
(10-20%), the fate of this S is, however, up to date unknown and more research on this issue is
needed before any recommendation on EF modification can be made.
In a corresponding way the emissions of CO2 will be dependent on the carbon content in the fuel
and the fuel consumption. This then neglect the small fraction of the carbon that will be emitted as
carbon monoxide, organic compounds and soot. The sum of these will typically be two to three or-
ders of magnitude lower than the CO2-emissions. The carbon content in marine fuels can vary
somewhat but is normally around 87%. Table 4 shows the emission factors for SO2 and CO2 for
different engine types expressed in mass of emission per engine work and mass of emission per
mass of fuel consumed.
For inland waterways the sulphur content will be around 10 ppm giving an emission factor for
SO2 of 20 mg/kg fuel. The CO2 emission factor will be about the same as for marine gasoil.
0 20 40 60 80 100
0
10
20
30
40
50
60
70
80
90
100Animal fatHeavy fuel oil
EC
OM
Ash
SO4
H2Om
ass f
ractio
n ,
%
engine load , %
Palm oil
0 20 40 60 80 100
0 20 40 60 80 100

D1.2.1 TRANSPHORM Deliverable
12 of 27
Table 4 Emission factors for CO2 and SO2 from Cooper and Gustafsson (2004)
Engine type Fuel type FSC EFCO2
(g/kWh)
EFCO2
(g/kgfuel)
EFSO2
(g/kWh)
EFSO2
(g/kgfuel)
Slow speed Residual oil 2.7% 620 3 179 10.5 54.0
Residual oil 1% 620 3 179 3.90 20.0
Marine distillates 0.5% 588 3 179 1.85 10.0
Marine gas oil 0.1% 588 3 179 0.37 2.0
Medium Residual oil 2.7% 683 3 179 10.6 54.0
speed Residual oil 1% 683 3 179 4.30 20.0
Marine distillates 0.5% 652 3 179 2.05 10.0
Marine gas oil 0.1% 652 3 179 0.41 2.0
High speed Residual oil 2.7% 683 3 179 10.6 54.0
Residual oil 1% 683 3 179 4.30 20.0
Marine distillates 0.5% 652 3 179 2.05 10.0
Marine gas oil 0.1% 652 3 179 0.41 2.0
Emission factors for VOC and CO
The emissions of hydrocarbons and carbon monoxide represent incomplete combustion of the fuel.
These emissions from marine diesel engines are typically small due to the lean burning conditions
and stable engine loads, but sharp increases may occur during rapid load changes of engines (accel-
eration/deceleration phases) because of incomplete combustion of fuel. Typical emission factors can
be found in Table 5. Emission of CO and HC also increase at lower load. The details in the emis-
sions at lower loads will depend on the operation and on the individual engine. Figure 8 summarizes
variation of EF CO with engine load. For CO the trend found in Transphorm 2 campaign were low-
er comparing to Sarvi et al. and more similar to Cooper and Gustafsson (2004). For HC the variabil-
ity of EF was found to be large in the Transphorm campaign and the trend for EF(HC) dependence
on the engine load was drawn through the data of Sarvi et al. (2008) and Cooper and Gustafsson
(2004).
The emission factors for engines for inland waterways will be similar to those in Table 5. The
emission regulation for CO on 5.0 g/kWh will likely have little impact on the emissions.
Table 5. Emission factors for CO (EFCO) and HC (EFHC) from Cooper and Gustafsson (2004).
Engine type Fuel type Operational
mode
EFCO
(g/kWh)
EFCO
(g/kgfuel)
EFHC
(g/kWh)
EFHC
(g/kgfuel)
Slow speed Residual oil At sea 0.5 2.5 0.3 1.6
Manoeuvring 1.0 4.6 0.6 2.8
Marine distillates At sea 0.5 2.7 0.3 1.5
Manoeuvring 1.0 4.9 0.6 2.9
Medium speed Residual oil At sea 1.1 5.1 0.2 0.9
Manoeuvring 2.2 9.2 0.4 1.7
Marine distillates At sea 1.1 5.3 0.2 1.0
Manoeuvring 2.2 9.7 0.4 1.8
High speed Residual oil At sea 1.1 5.1 0.2 0.9
Manoeuvring 2.2 9.3 0.4 1.7
Marine distillates At sea 1.1 5.4 0.2 1.0
Manoeuvring 2.2 9.8 0.4 1.8

Deliverable TRANSPHORM D1.2.1
13 of 27
Figure 8. Effect of engine load on emission factors (in g/kWh) for CO(a) and HC(b). All tested engines are four-
stroke MSD. a - The thick grey line is polynomial trend in all datapoints (EF(CO) = 0.0004*EL2 - 0.075*EL +
3.83, EL = engine load in % of max, R2 = 0.64), the dashed line is trend drawn through Cooper and Gustafsson
(2004) and Transphorm 1 HFO datapoints. b - The thick grey line is polynomial trend drawn through Sarvi et al
(2008) and Cooper and Gustafsson (2004) (EF(HC)= 5E-05*EL2 - 0.0083*EL + 0.503, R
2 = 0.72).
Emission factors for NOX
The larger part (~90%) of the nitrogen oxides emitted from marine engines is formed from nitrogen
in the air at the high temperatures prevailing in the combustion zones in the cylinders. The emis-
sions of nitrogen oxides is as mentioned earlier regulated for engines manufactured after the year
2000 and for engines with a power output of more than 5,000 kW and cylinder displacement at or
above 90 litres after 1990. The emission standards define the maximum allowed NOx emission fac-
tor (in g/kWh) determined by the year of installation of the ship engine and by its rated speed n.
This NOx emission factor is a weighted emission factor for a certain driving cycle at standard en-
gine inlet air humidity (10.71 g/kg) and temperature (25ºC). The driving cycle depends on type of
engine (cycles C1 for variable-speed, variable-load auxiliary engine, D2 for constant-speed auxilia-
ry engine, E2 for “Constant-speed main propulsion” application including diesel-electric drive and
all controllable-pitch propeller installations, E3 for propeller-law-operated main and auxiliary en-
gines) and the measured emission factor is corrected to the standard conditions. Determination of
the NOx emission factors is in detail described in the NOx Technical Code (Annex 14 i.e. revised
Annex VI of MARPOL from 2008, for Tier I is until 2011 possible to use Annex VI from 1997).
Emission factors in Tier I standard represents engine standard of year 2000, for older vessels an
engine upgrade may be needed but that is obligatory only provided that an approved and certified
0
0.5
1
1.5
2
2.5
3
0 20 40 60 80 100
EF (
g/k
Wh
)
Sarvi et al. 2008 (HFO)Cooper et al. 2004 (HFO, MGO)Transphorm 1 HFOTransphorm 2 HFOTransphorm 1 MGOTransphorm 2 MGO
a)
0
0.1
0.2
0.3
0.4
0.5
0 20 40 60 80 100
EF (
g/k
Wh
)
Engine load, % of max
b)

D1.2.1 TRANSPHORM Deliverable
14 of 27
method for reduction of NOX emissions exists. Tier II standard represents c.a. 20% emission reduc-
tion from Tier I and is expected to be met by internal engine combustion optimization measures.
The parameters examined by engine manufacturers include fuel injection timing, pressure, and rate
(rate shaping), fuel nozzle flow area, exhaust valve timing, and cylinder compression volume. Tier
III standard represents c.a. 80% reduction and requires dedicated NOx emission control technolo-
gies such as various forms of water induction into the combustion process (with fuel, scavenging
air, or in-cylinder), exhaust gas recirculation, or selective catalytic reduction. Typical emission fac-
tors for the different Tiers and engines speeds can be found in Table 6. Emission factors measured
on Transphorm campaigns were generally lower than Tier I standard, also for engine of pre-Tier I
standard.
Table 6. Emission factors for NOX from Cooper and Gustafsson (2004) (no Tier) and IMO regulations. The emis-
sion factors in g/kgfuel assume that the SFC will not change between the Tiers.
Engine type Fuel type Emission
class
EFNOx
(g/kWh)
EFNOx
(g/kgfuel)
Slow speed Residual oil No Tier 18.1 87.4
Tier 1 17.0 82.1
Tier 2 14.4 69.5
Tier 3 3.4 16.4
Marine distillates No Tier 17.0 91.6
Tier 1 17.0 91.6
Tier 2 14.4 77.6
Tier 3 3.4 18.3
Medium speed Residual oil No Tier 14.0 61.7
Tier 1* 11.3 49.8
Tier 2† 8.98 39.6
Tier 3‡ 2.26 10.0
Marine distillates No Tier 13.0 63.2
Tier 1* 11.3 54.9
Tier 2† 8.98 43.7
Tier 3‡ 2.26 11.0
High speed Residual oil No Tier 12.7 58.9
Tier 1 9.8 45.5
Tier 2 7.7 35.7
Tier 3 1.96 9.1
Marine distillates No Tier 12.0 58.3
Tier 1 9.8 47.6
Tier 2 7.7 37.4
Tier 3 1.96 9.5 * EF for engine speed n = 1000 to 2000 rpm, EF = 45 · n
(-0.2) in Tier I.
† EF for engine speed n = 1000 to 2000 rpm, EF = 44 · n
(-0.23) in Tier II.
‡ EF for engine speed n = 1000 to 2000 rpm, EF = 9 · n
(-0.2) in Tier III.
For inland waterways the regulations put limits on the NOX emissions. For older engines (older
than 2007 or 2009, see Table 2) the values in Table 6 can be used. For more recent engines the
regulation limits for HC+ NOX can be used (Table 2). If the engine characteristics are not known a
value of 9.0 g/kWh can be used corresponding to approximately 40 g/kgfuel.
Deliverable TRANSPHORM D1.2.1
15 of 27
Emissions factors for PM mass
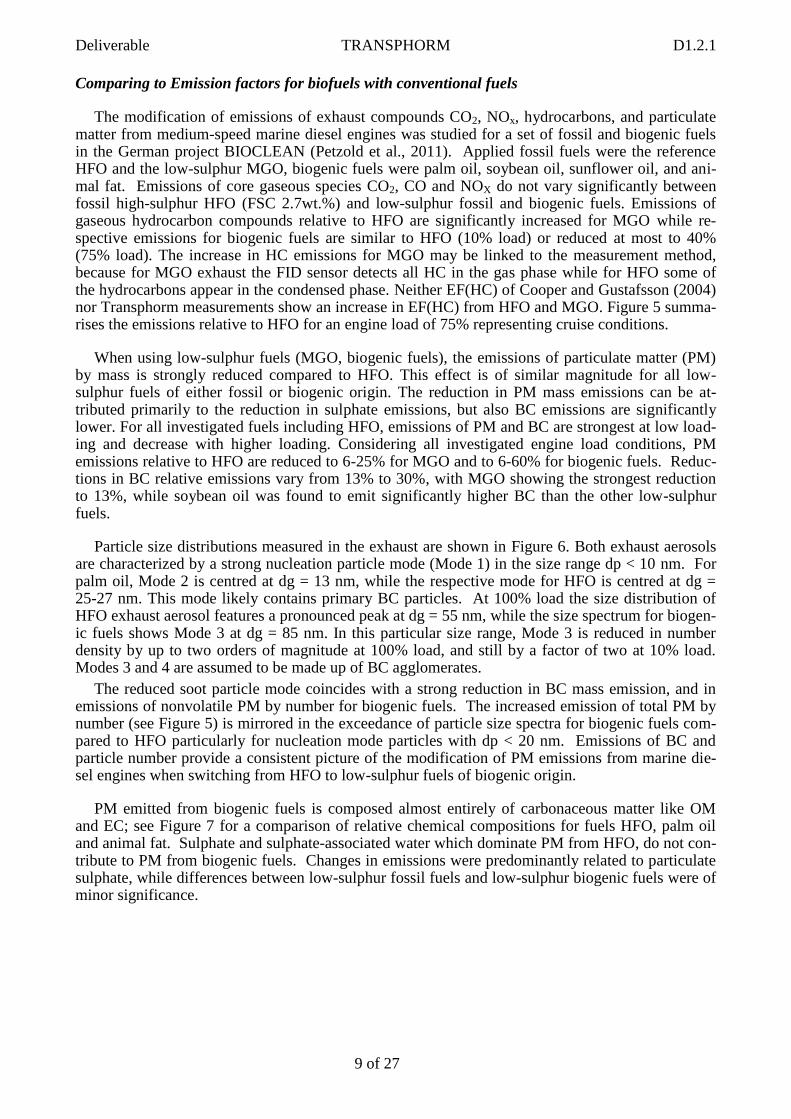
Particles emitted by marine engines consist of a volatile and non-volatile fraction. Volatiles are
mainly sulphate with associated water and organic compounds. Non-volatiles consist of elemental
carbon (soot, char) and of ash and mineral compounds containing Ca, V, Ni and other elements.
Because of the high content of condensable matter in the exhaust the methodology of sampling im-
pacts the PM mass found. Sampling directly in the hot exhaust captures to a large extend only the
non-volatile part of PM while sampling in the diluted and cooled exhaust captures also some of the
volatiles. The amount, however, depends on the dilution and temperature program of the sampling.
Figure 8 shows the difference between PM sampled in the hot and diluted exhaust from a slow-
speed diesel engine running on HFO with 1.9% sulphur.
Figure 9. Composition of PM (as EF) collected on filters in the diluted and hot exhaust gas (Moldanová et al.,
2009).
Emissions of PM varies with fuel type, fuel sulphur content and engine operation mode. Table 7
shows EFPM for cruise conditions published by Cooper and Gustafsson (2004) for different marine
engines for HFO and MDO fuels together with EFPM from the Lloyds emission database (European
Commission, 2002). These emission factors are based on larger number of measurements (c.a. 45
measurements at IVL database and 25 in Lloyd’s database). The mean FSC in Cooper and Gus-
tafsson (2004) was 2.3% and in EC (2002) 2.7%. The PM measurements reviewed in these reports
were performed using the partial dilution equipment, i.e. corresponding to the PM in ‘diluted’ ex-
haust in Figure 8.
When more recent data from individual engines are added, one can see a span of EFPM for en-gines using RO between 1 and 13 g/kg fuel with the mean around 7, and for engines using MD be-tween 0.2 and 1 g/kg fuel. Figure 10 shows a plot of the available data on EFPM at cruise conditions (engine load 75-90%) against the fuel-sulphur content (FSC). We can see a clear positive trend in emission factor for PM against the FSC for data measured on engines using RO. Emission factor for MSD engines from Cooper and Gustafsson (2004) are lower comparing to other data, however there are only few more individual measurements for this engine and fuel category available. The Lloyds EF for SSD engines are included (EC, 2002) assuming FSC 2.7% which is Lloyd’s estimate of the global mean FSC for RO.
0
1
2
3
4
5
dilluted hot
EF [
g/k
g-fu
el]
unidentified
sulph. assoc. water
sulphate
OC
EC
ash

D1.2.1 TRANSPHORM Deliverable
16 of 27
Table 7. Emission factors for PM mass (EFPM) for cruise and manoeuvring conditions from Cooper and Gus-
tafsson (2004) for different marine engines for residual oil (RO) and marine distillates (MD). The mean FSC is
2.3 wt.% for RO and 0.4 wt.% for MDO. EFPM for cruise conditions from the Lloyds emission database (Euro-
pean Commission, 2002) for the global fleet, these EFPM are weighted for fuels used by the engine category. The
global FSC in this study is 2.7 wt.%.
Cooper & Gustafsson (2004) EC (2002)
Engine type Fuel type EFPM at sea EFPM manoeuvring EFPM at sea
g/kWh g/kgfuel g/kWh g/kgfuel g/kg fuel
SSD MD 0.2 1.08 0.4 1.97 7.6*
SSD RO 1.3 6.67 2.6 12.12
MSD MD 0.2 0.98 0.4 1.77 1.2*
MSD RO 0.5 2.33 1.0 4.23
HSD MD 0.2 0.98 0.4 1.77
HSD RO 0.5 2.33 1.0 4.23 * Mixture of MD and RO
Figure 10. Emission factors for particle mass EFPM as a function of FSC (in wt. %). EFPM for RO is plotted in
blue, EFPM for MD is plotted in green. Datapoints with crosses (Tr.) are from the Transphorm measurement
campaigns (the dashed line fitted through the RO data has equation EF(PM) = 2.084*FSC1.4633
, R2 = 0.75)
PM mass emission factors change with the engine load. In the stack typically between 1 and 5%
of sulphur is oxidized to SO3 (Moldanová et al., 2009; Petzold et al., 2010; D2.1.4) and contributes
to the exhaust PM. Petzold et al. (2010) showed a positive correlation between the SO2 in-stack
oxidation and the engine load for engines using HFO with similar fuel sulphur content (between 2 –
2.5%) (Figure 11a), Transphorm measurements showed an increase in S oxidation from 0.2 to
1.4%. While EF for sulphate is positively correlated to the engine power, i.e. contributes most to the
PM emissions at high engine loads, emissions of black or elemental carbon and of organic carbon
are higher at low engine loads and have their minima at loads around 50% and increases somewhat
at cruise conditions (Figure 11b, Petzold et al., 2010). The resulting dependence of EFPM on engine
load thus varies with fuel sulphur content and potentially also with fuel type. One should also re-
member that the fuel consumption of course also varies with the engine load making the emissions
(in g/hour) higher at cruising that at low loads.
0
2
4
6
8
10
12
14
0 1 2 3 4
EFP
M [
g/kg
fu
el]
FSC [wt.%]
RORO Tr.MDMD Tr.
EC (2002)
Cooper (2004)
Cooper (2004)

Deliverable TRANSPHORM D1.2.1
17 of 27
In the STEAM2 model Jalkanen et al. (2011) use EFPM (emission factor for total particulate mat-
ter mass) and emission factors for 5 different PM components: EC, OC, sulphate, ash and the sul-
phate-associated water as a function of engine load and the FSC. The FSC dependence is built on
data from the 2nd IMO GHG study (IMO, 2009) and the dependence on engine load on data from
Agrawal et al. (2008a), Petzold et al. (2008) and Moldanova et al. (2009). Table 8 and Table 9 show
emission factors from STEAM2 for a span of FSC and engine loads. The increasing trend in S oxi-
dation with increasing engine load as shown in the previous paragraph and in Figure 11 is however
not present in Jalkanen et al. (2011).
The recommended EFs For EC are for HFO 0.5 g/kg fuel at low engine load and 0.2 g/kg-fuel for high engine load and for MGO 0.3 g/kg-fuel at low and 0.1 g/kg fuel at high engine loads (MGO based on D2.1.4).
a)
b)
Figure 11. a - Efficiency for converting fuel sulphur to particulate-matter sulphate at various engine loads and
for fuels with different sulphur contents given in wt-%; the dashed lines represent linear relationships between
part of sulphur in exhaust converted to sulphate and engine load, the grey for HFO, the orange for MGO. (Ref
(1): Petzold et al., 2010, Ref (2): Agrawal et al., 2008a; Ref (3): Agrawal et al., 2008b; Ref (4): Moldanová et al.,
2009; Ref (5): Kurok, unpublished, Ref (6): Kasper et al., 2007, Tr1, Tr2: Data from Transphorm campaigns S1
and S2, D2.1.4). b - Mass emission factors for carbon-containing compounds, sulphate and PM in the raw ex-
haust gas, FSC 2.40wt-% (filled symbols) and 0.91% (open symbols) (EC - elemental carbon, OM – organic mat-
ter, both analysed by multi-step combustion method) (from Petzold et al. 2010, data in their Table 1 and from
D2.1.4).
Table 8. Total PM2.5 emission factors (g/kWh) at selected engine loads and fuel sulphur content (wt-%)
Load 0.1% S 1.0% S 1.5% S 2.7% S 3.5% S
20% 0.41 0.99 1.31 2.08 2.60
40% 0.38 0.91 1.21 1.92 2.40
60% 0.36 0.87 1.15 1.83 2.28
80% 0.35 0.86 1.14 1.80 2.25
100% 0.36 0.88 1.16 1.84 2.30
0
1
2
3
4
5
6
0 20 40 60 80 100 120
S co
nve
rsin
, %
Engine load, % of max
Ref (1) 2.32%Ref (1) 2.21%Ref (2), 2.05%Ref (3), 2.85%Ref (4), 1.95%Ref (5)Tr1, 0.91%Tr2, 0.96%Tr2, 0.58%Ref (6), 0.16%Tr1, 0.1%
0
2
4
6
8
0
0.5
1
1.5
2
0 20 40 60 80 100 120
SO4
=, P
M [
g/kg
fu
el]
EC, O
M [
g/kg
fu
el]
Engine load, % of max
EC OM SO4= PM

D1.2.1 TRANSPHORM Deliverable
18 of 27
Table 9. The emission factors of PM2.5 subcomponents (g/kWh) as a function of engine load. The fuel sulphur
content is 1.5 wt-%
Load EC OC Ash SO4= H2O Total PM
20% 0.06 0.23 0.06 0.54 0.42 1.31
40% 0.05 0.21 0.05 0.50 0.39 1.21
60% 0.05 0.20 0.05 0.48 0.37 1.15
80% 0.05 0.20 0.05 0.47 0.37 1.14
100% 0.05 0.20 0.05 0.48 0.37 1.16
In the atmosphere the oxidation of the emitted SO2 proceeds and in ship plumes sulphate be-
comes the dominant component of the PM. If all sulphur corresponding to 1% FSC would be oxi-
dised into H2SO4 and this H2SO4 would condense on particles in the ship plume, one would get an
emission factor for particulate H2SO4 of 30.6 g/kg fuel and, further, if also the water associated to
sulphate is accounted for an emission factor of 67 g/kg fuel is obtained. The plume studies (D1.2.2)
have shown that between ~1% (polluted urban air, winter conditions) and 60% (clean background,
summer conditions) of emitted SO2 contributes to the PM, giving EF(H2SO4·nH2O) 1-40 g/kg fuel.
These numbers can be compared to the typical EFPM that are a few grams per kg fuel.
Cooper and Gustafsson (2004) assumed that PM emissions from ship diesel engines are domi-
nated by particles with diameters less than 1 µm (i.e. TSP = PM10 = PM2.5) based on ‘general con-
sensus’ at that time. However, measurements of Cooper (2003) indicate that about 50 - 70% of the
total suspended particles (TSP) could be as PM2.5 and the remainder as PM10 (Cooper, 2003). Other
studies show presence of larger (tar-like and re-entrained) particles in the exhaust from engines us-
ing heavy fuel oil (Lyyränen et al., 1999; Fridell et al., 2008; Moldanova et al., 2009) indicating that
TSP may be larger than PM10. One can anticipate that the particle size distribution will be depend-
ent on fuel type, engine type, operation and age of the gas plume.
Emission factors of different metals obtained from x-ray fluorescence analyses (XRF) of filter
PM deposits are summarised in Table 10. The composition of fuel with respect to S, V, Ni and ash
content is shown together with the EFs. One can see a large variability in fuel composition affecting
the EFs for metals. This effect is often larger than effect of engine load. Ca, Zn and P are associated
with lubricant oil.
Emissions from inland waterways have been regulated first in 2007-2009 for PM mass (Table 2),
in 2010 for FSC with limit 0.1% and in 2011 with FSC limit of 10 ppm. Emission factors for year
2010 would be thus similar to those for MGO, EFs after 2011 are difficult to assess mainly because
the regulation is very recent and no measurements have been found with this fuel. Further, it seems
unlikely that the emissions are close to the permitted values in Table 2 when considering that meas-
urements on marine engines using gasoil (with 100 times more sulphur) show lower values (Table 7
and Table 8). A linear extrapolation of the data in Table 8 gives an emission factor of about 0.30
g/kWh corresponding to about 1.5 g/kgfuel. PM emitted from large pre-Euro and Euro I Diesel en-
gines has 51% of EC and 35% of EC. These numbers can be used as proxy for inland navigation
emission factors until new measurements are available.

Table 10. Emission factors (in g/kg fuel) for metals and other elements obtained from XRF analyses of PM filter deposits. EF from Ref 1 - Agrawal et al. (2008b), Ref 2 - Agrawal et al. (2008a) and from Transphorm campaigns (D2.1.4) are compared. Column 2-5 are concentrations in fuel.
Ash S V Ni Mg Al Si P S K Ca V Cr Mn Fe Co Ni Cu Zn
Fuel wt.% Fuel mg/kg g/kg fuel
HFO, 25-30% load Ref 1 0.02 2.85 118 52 <d.l. 0.0488 <d.l. 0.0198 0.8002 <d.l. 0.0150 0.1030 <d.l. <d.l. 0.0216 0.0007 0.0461 0.0004 0.0013
0.072 2.05 259 26 <d.l. 0.0477 <d.l. 0.0089 0.7347 <d.l. 0.0218 0.2400 <d.l. <d.l. 0.0140 0.0007 0.0525 0.0003 0.0006
Tr1 0.02 0.91 34 16 <d.l. <d.l. <d.l. <d.l. 0.0180 0.0022 0.0018 0.0100 <d.l. <d.l. 0.0031 <d.l. 0.0081 0.0025 0.0029
HFO, ~50% load Ref 1 0.02 2.85 118 52 <d.l. 0.0442 <d.l. 0.0072 0.6623 <d.l. 0.0144 0.0908 <d.l. <d.l. 0.0271 0.0005 0.0404 0.0002 0.0012
Ref 2 0.072 2.05 259 26 <d.l. 0.0556 <d.l. 0.0212 0.8416 <d.l. 0.0247 0.2416 <d.l. <d.l. 0.0112 0.0007 0.0540 0.0003 0.0005
Tr2 a 0.02 0.96 20 15 0.0008 0.0004 0.0005 <d.l. 0.0303 <d.l. 0.0018 0.0071 0.0001 <d.l. 0.0011 0.0003 0.0066 <d.l. 0.0002
Tr2 b 0.01 0.58 6 9 0.0004 0.0004 <d.l. <d.l. 0.0184 <d.l. 0.0013 0.0018 0.0001 <d.l. 0.0005 0.0003 0.0046 <d.l. 0.0002
HFO, 70-85% load Ref 1 0.02 2.85 118 52 <d.l. 0.0831 <d.l. 0.0306 1.1611 <d.l. 0.0253 0.0959 <d.l. <d.l. 0.0246 0.0007 0.0421 0.0004 0.0012
Ref 2 0.072 2.05 259 26 <d.l. 0.0836 <d.l. 0.0319 1.2255 0.0004 0.0249 0.2723 <d.l. <d.l. 0.0189 0.0009 0.0618 0.0005 0.0007
Tr1 0.02 0.91 34 16 0.0037 0.0027 0.0022 0.0014 0.0848 0.0002 0.0105 0.0204 0.0003 0.0001 0.0054 <d.l. 0.0145 0.0001 0.0019
MGO 50-75% load Ref 1 <0.01 0.06 <1 <1 0.0022 <d.l. <d.l. 0.0009 0.0278 <d.l. 0.0121 0.0005 <d.l. <d.l. 0.0005 <d.l. 0.0002 0.0000 0.0013
Tr1 <0.01 0.03 <1 <1 <d.l. <d.l. <d.l. <d.l. 0.0026 <d.l. 0.0105 <d.l. <d.l. <d.l. <d.l. <d.l. <d.l. <d.l. 0.0016
Tr2 <.01 0.1 <1 <1 <d.l. <d.l. 0.0002 <d.l. 0.0011 <d.l. 0.0010 0.0002 0.0001 <d.l. 0.0000 <d.l. 0.0001 <d.l. 0.0002
MGO 25% load Ref 1 <0.01 0.06 <1 <1 <d.l. 0.0477 <d.l. 0.0089 0.7347 <d.l. 0.0218 0.2400 <d.l. <d.l. 0.0140 0.0007 0.0525 0.0003 0.0006

Emissions factors for particle number concentration
Emission factors for particle number concentrations are in the order of magnitude of 1016
/kg fuel. Measurements, presented by Petzold et al. (2010), on a 4-stroke MSD burning RO show emission factors for total particle number, EFN, between 1 and 4.5 x 10
16/kg fuel, with a positive correlation
between EFN and the engine load (Figure 12a). Transphorm measurements showed consistent, for 80% engine load operation mode somewhat higher EFN (0.5 – 10 x10
16/kg fuel), also these with
positive correlation between EFN and engine load. Airborne measurements in ship plumes have shown EFN of the same order of magnitude (Lack et al., 2009; Petzold et al., 2008; Murphy et al, 2009; Jonsson et al., 2011) (Figure 12a, Jonsson et al. (2011) do not have engine load, 50% is an estimate).
Petzold et al. (2010) investigated the volatility of the emitted particles in exhaust from a 4-stroke MSD test engine using a thermo denuder. They found that 2/3 of the particles at high load and 1/3 at low load were volatile and that the number of non-volatile particles did not change for loads >20%. The increase in total particle emissions with load by a factor of 3 was almost entirely attributed to sulphuric acid-water droplets. Figure 12b shows the number concentrations of particles in the ac-cumulation mode, i.e. those with diameters in the range 0.1-3 µm, measured on test engines and in ship plumes. The Transphorm measurements have shown lower proportion of volatile particles (~1/3). This is consistent with lower sulphate content of the measured particles partly resulted from lower FSC of the fuel.
a)
b)
Figure 12. Emission factors for particle numbers measured on test engine burning RO with FSC 2.21 (test en-
gine), and 0.91 (Tr1) and in airborne measurements in ship plumes. a – total and non-volatile particles, b – parti-
cles in accumulation mode. (from Petzold et al., 2010, D2.1.4 and Jonsson et al., 2011)
Jonsson et al. (2011) found in measurements of ship plumes of 4 identified ships performed with
and without thermodenuder from the coast next to the shipping line that 1/3-2/3 of particles were
volatile. Pirjola et al (2011) found in similar measurements that the volatile particles were responsi-
ble for 55-61% of the total particulate number. These measurements also showed the growth of par-
ticle diameter by condensation of volatiles (Figure 13). The data of Pirjola et al. (2011) include con-
0
0.1
0.2
0.3
0.4
0.0E+00
5.0E-03
1.0E-02
1.5E-02
2.0E-02
0 20 40 60 80 100 120
EFN(a
irb
orn
e) [
10
16 /
kg f
uel
]
EFN [
10
16 /
kg f
uel
]
Engine load, % of max
N(0.1-3 μm) (test e.) N(0.1-3 μm) (Tr1)
0
2
4
6
8
10
0 20 40 60 80 100
EFN [
10
16 /
kg f
uel
]
Engine load, % of max
total (test engine) total (airborne)total (Tr1) total (Tr1, MGO)nonvolatile (test e.) nonvolatile (airborne)nonvolatile (Tr1)

Deliverable TRANSPHORM D1.2.1
21 of 27
tribution of the local scale dispersion. The plots of particle number size distributions in plume at
different distances from the source (Figure 14) show that PM concentration levels in ship plumes
typically reach background concentration levels in ~12 minutes and at a distance of five kilometres
downwind from the source.
Figure 13. Number size distributions of total (w/o denu) and non-volatile (with denu) part of PM in plumes from
2 different ships measured next to the shipping lane. Figure according to Pirjola et al. (2011)
Figure 14. Particle number size distributions in ship plumes at different distances downwind the source. Lines
correspond to distances (in km) between observation point and the vessel. Image from Pirjola et al (2011)
There are no data on EF(PN) for inland shipping. The existing data for MGO indicate EF(PN)
around 1x10¹⁶
#/kg-fuel. As already mentioned the fuel used in inland shipping differs now from
marine fuels, among others in FSC. Petzold et al. (2011) investigated EF(PN) from different bio-
diesels, fuels with FSC close to that of fuel used in inland shipping but with differences in composi-
tion with respect to other compounds. As can be seen in Figure 5, these fuels show EF(PN) higher

D1.2.1 TRANSPHORM Deliverable
22 of 27
than that for HFO by factor 2-3, while for non-volatile particles the emission factor for biofuels is
lower by similar factor. Based on these data we recommend to use EF(PN) = 1x10¹⁶
#/kg-fuel for
distilled fuel used by inland navigation prior to the year 2011 until more data are available.
From 2011 the maximum FSC for inland shipping is 10 ppm. Since there are no measurements on
ship engines using this fuel, data for the large Euro-I and Conventional-standard road diesels can be
used as a proxy. These EF(PN):s are listed in Table 11. When the average EF(PN) is scaled to the
recommended EF(PM-mass) of 1.5 g/kg-fuel, EF(PN) of 0.3x10¹⁶
#/kg-fuel is obtained (0.2x10¹⁶
for 1g/kg-fuel). This value is recommended for inland navigation after year 2011.
Table 11. Emission factors for PM mass and number of solid and total particles for EURO-I and conventional
large road diesel engines.
Engine Standard EF(PM-mass)
(g/kg fuel) EF(PN-solid) (#/kg fuel)
EF(PN-total) (#/kg fuel)
Articulated 40 - 50 t Euro I 1.42 1.09E+15 2.89E+15
Articulated 40 - 50 t Conventional 1.64 9.58E+14 2.55E+15
Articulated 50 - 60 t Euro I 1.38 9.26E+14 2.31E+15
Articulated 50 - 60 t Conventional 1.66 8.09E+14 2.15E+15
Rigid 26 - 28 t Euro I 1.35 1.60E+15 3.92E+15
Rigid 26 - 28 t Conventional 1.59 1.38E+15 3.40E+15
Rigid 28 - 32 t Euro I 1.28 1.43E+15 3.45E+15
Rigid 28 - 32 t Conventional 1.65 1.26E+15 3.06E+15
Average
1.49 1.18E+15 2.97E+15
Standard deviation 0.15 2.61E+14 5.73E+14
Ship I
1.50 1.19E+15 2.98E+15
Ship II 1.00 7.91E+14 1.98E+15
Emissions factors for PAHs
Polycyclic aromatic hydrocarbons (PAH) are compounds that consist of fused aromatic rings and do not contain heteroatoms or carry substituents. PAH cover a large group where naphthalene is the simplest species. There are several different groupings of PAH compounds defined for criteria pol-lutant critical levels. Widely used are EPA’s 16 priority PAH “PAH-16” and EPA’s 7 carcinogenic “PAH-7’. In Europe “Total PAH-6” and “Total PAH-4” are defined for emission reporting to the European Commission (EC, 2000). Species included in these groups are shown in Table 12.
There are only few data on emissions of PAHs from shipping. Publications of Lloyds (1995), Cooper et al. (1996), Cooper (2001; 2003) and Agrawal et al. (2008; 2010) present a limited set of Emission Factors of PAHs for a range of marine engines covering the most commonly used marine fuels. Publications of Cooper et al. and Agrawal et al. are in agreement in that napthalenes and phe-nanthrenes account for 80-90% of the measured PAH species. Cooper and Gustafsson (2004) pre-sented, based on the first 4 publications, EFPAH for the EC’s “Total PAH-4” for different engines and fuels. The data used, however, do not cover the whole presented emission matrix. Transphorm measurements showed good agreement of EF for PAH-4 species with Cooper and Gustafsson (2004) for MGO. For RO a difference of factor ~5 was find between 2 investigated ships/engines both using RO with FSC 1%. Higher EFs were found for low engine load comparing to optimum load. Comparing these EFs with data from individual measurements found in literature one can ob-serve that 1) the measured EFs are largely variable with fuel and engine operation mode but rela tively large variability is present also for data obtained at similar conditions, 2) agreement between different EF estimates for marine engines at full load operation using marine distillate fuels seems fairly good and the EF is ~1x10
-6 g/kWh, 3) different EF estimates for engines using heavy fuel oil
differ for PAH-4 by factor 100 at most, Cooper and Gustafsson (2004) being lower than Agrawal et al. (2008b, 2010). Measurements of Agrawal et al. indicate that emission factors of these species for engines running on HFO are much higher than those for engines running on distillate fuel.

Deliverable TRANSPHORM D1.2.1
23 of 27
Table 12. PAH compounds and groups as defined by EPA and EC.
PAH species
Naphthalene
EP
A’s
PA
H-1
6
Acenaphthylene
Acenaphthene
Fluorene
Phenanthrene
Anthracene
Pyrene
Benzo(a)anthracene
EP
A’s
PA
H-7
Chrysene
Dibenzo(ah)anthracene
Benzo(a)pyrene
EC
’s
Tota
l P
AH
-6
EC
’s
Tota
l P
AH
-4
Benzo(b)fluoranthene Benzo(k)flouranthene Indeno(1,2,3-cd)pyrene
Benzo(ghi)perylene
Fluoranthene
Emission factors for PAH (Total-4) benzo(a)pyrene, benzo(b)fluoranthene, benzo(k)fluoranthene
and indeno[1,2,3-cd]pyrene are summarised in Table 13. Measurements reported by Agrawal et al.
(2008b, 2010) show that PAH emissions at low engine loads tend to be substantially higher than
emissions at optimum load. Figure 15 shows differences between EFs of several PAH species and
groups at different engine loads and the same EFs at optimum engine load expressed relatively to
the EF at optimum load. We can see that large increase in EFs is in the 15% load mode. However,
large variability in the data exists as can be seen on difference between data points at 50% engine
load.
Figure 15. Difference between emission factors of various PAH species and groups and emission factors of the
same PAH species/groups at optimum engine load of 75-85% expressed relatively to the EF at optimum engine
load (i.e. 1 means EF 100% higher than at optimum load) (data from Agrawal et al., 2008b and 2010).

D1.2.1 TRANSPHORM Deliverable
24 of 27
Table 13. Emission factors for PAH (Total PAH-4), benzo(a)pyrene. benzo(b)fluoranthene, benzo(k)fluoranthene
and indeno[1,2,3-cd]pyrene; Mean FSC of RO in Cooper and Gustafsson is 2.3 wt.%, Ref.1=Agrawal et al.
(2008b) (RO FSC 2.85 wt.%), Ref.2=Agrawal et al., 2010 (RO FSC 3.01 wt.%), for these references ± is standard
deviation of the data. Tr1 and Tr2 are the Transphorm campaign data (D1.2.4), for TR1 RO FSC is 0.91 wt.%
and for Tr2, RO FSC is 0.96 wt.% and for values in parentheses is 0.58 wt.%.
Engine
type
Engine
load
Fuel
Cooper and Gustafsson (2004) Ref.1 Ref.2 Tr1 Tr1 Tr2
at sea
manoeu-
vring Full load (at sea)
80%
load
30%
load
57% load
type μg/kgfuel μg/kWh μg/kWh μg/kWh μg/kWh μg/kWh μg/kWh μg/kWh
Total PAH-4
SSD MD 32.0 5.92 5.37
SSD RO 31.0 6.05 5.46 150±140 1300±380
MSD&SSD MD 29.0 5.95 5.54 5.3±0.8 4.99 <1.37
MSD&SSD RO 28.0 6.02 5.38 22.8 30.3 3.23 (1.58)
GT&ST MD 20.0 6.00 5.94
GT&ST RO 20.0 6.10 6.05
Benzo(a)pyrene
SSD MD 5.4 1.00 0.91
SSD RO 5.1 0.99 0.92 120±120 200±120
MSD&SSD MD 4.9 1.00 0.90 0.97 <0.22
MSD&SSD RO 4.7 1.01 0.90 1.7±0.3 2.86 4.93 <0.27 (0.49)
GT&ST MD 3.3 0.99 0.99
GT&ST RO 3.3 1.01 1.01
Benzo(b) fluoranthene
SSD MD 11.0 2.00 1.81
SSD RO 10.0 2.01 1.81 3.9±2.3 21±6.1
MSD&SSD MD 9.8 2.01 1.82 0.7±0.1 1.28 <0.17
MSD&SSD RO 9.3 2.00 1.83 11.6 13.2 3.00 (1.09)
GT&ST MD 6.7 2.01 1.83
GT&ST RO 6.6 2.01 1.83
Benzo(k)fluoranthene
SSD MD 5.4 1.00 0.91
SSD RO 5.1 1.00 0.92 5.9±1.9 65±13
MSD&SSD MD 4.9 1.00 0.90 1.4±0.2 0.73 <0.09
MSD&SSD RO 4.7 1.01 0.90 3.39 5.08 2.33 (<0.09)
GT&ST MD 3.3 0.99 0.90
GT&ST RO 3.3 1.01 0.92
Indeno[1,2,3-cd]pyrene
SSD MD 11.0 2.00 1.81
SSD RO 10.0 2.01 1.81 23±22 990±240
MSD&SSD MD 9.8 2.01 1.82 1.5±0.2 2.01 <0.89
MSD&SSD RO 9.3 2.00 1.83 4.92 7.07 <0.93 (<0.89)
GT&ST MD 6.7 2.01 1.83
GT&ST RO 6.6 2.01 1.83
Emission factors for PAHs for inland shipping are bound up with the same difficulties as EFs for PM mass and PM compounds, lack of measured data. To use EFs for MGO would be an option, however, composition of fuels used in inland shipping differs with respect to aromatic and PAH content from the marine fuels, presumably leading to lower EF for PAHs. EFs for locomotive en-gines could be used as another proxy. The available EF(BaP) for a train locomotive published by Sawant et al. (2007) of 34 µg/kg-fuel is higher than any EF(BaP) for marine engines using MGO listed in Figure 11, where EF(BaP) are below 5 in µg/kg-fuel. From this fragmentary information we can recommend the use of EFs for MGO also for inland shipping until more data are available for this sector.

Deliverable TRANSPHORM D1.2.1
25 of 27
All findings on EFs for PAHs are quite consistent with how PAHs are formed, which is during incomplete combustion of organic matter including the petroleum products. The EFs are then ex-pected to be higher from combustion of fuel with higher PAH concentration and at low load condi-tions. In publications dealing with PAH emissions from shipping only Cooper et al. (2001) analysed fuels for PAH content. They found total PAH content of 1% in MGO and 6.6% in MDO (0.5%S). Older study of Neff (1979) gives examples of total PAH (BaP) concentrations in a crude oil 1% (2.8 mg/kg), No. 2 fuel oil 9% (0.6 mg/kg) and Bunker C residual oil 3% (44 mg/kg). In this study naph-thalenes and phenanthrenes make up together 99.6 - 91.0 % of the total.
Conclusions
This report summarizes emission factors of gaseous and particulate species from shipping. It shows a rather complex picture:
1) Emission factors for CO2 and SO2 are directly proportional to the C and S content in fuel burned, NOx and directly emitted particulate sulphate are more efficiently produced in effi-cient combustion meaning high engine loads.
2) CO, VOCs, particulate BC, OC and PAHs are more efficiently emitted in incomplete com-bustion meaning low engine loads.
3) Emissions of PAH and some other HC species are also dependent on their concentration in the fuel. Available EF(PAH-4) for RO vary between 6 and 11300 g/kWh, with most of the values between 6 and 100 g/kg fuel.
4) Particles emitted by marine engines consist of a volatile and non-volatile fraction, volatiles are mainly sulphate with associated water and organic compounds, non-volatiles consist of elemental carbon (soot, char) and ash and mineral compounds containing Ca, V, Ni and other elements. Emission factors vary with fuel composition, engine type and operation mode.
5) EFPM for engines using RO are between 1 and 13 g/kg fuel with the mean around 7 (RO with low S content ~2g/kg), and for engines using MD between 0.2 and 1 g/kg fuel.
6) PM mass emission factors change with the engine load: While sulphate EF increases with in-creasing load, emissions of black or elemental carbon and of organic carbon are higher at low engine loads and have their minima at loads around 50%, increasing somewhat at cruise con-ditions.
7) For EC the recommended EFs are for HFO 0.5 g/kg fuel at low engine load and 0.2 g/kg-fuel for high engine load and for MGO 0.3 g/kg-fuel at low and 0.1 g/kg fuel at high engine loads.
8) Emission factors for metals are dependent on fuel composition, in case of Ca and Zn on composition and consumption of the lubricant. Some variability of metal EF with engine load has also been observed.
9) In the atmosphere the oxidation of the emitted SO2 proceeds and in ship plumes sulphate of-
ten becomes the dominant component of the PM. If all sulphur corresponding to 1% FSC
would be oxidised into H2SO4 and this H2SO4 would condense on particles in the ship plume,
one would get an emission factor for particulate H2SO4 of 30.6 g/kg fuel and, further, if also
the water associated to sulphate is accounted for an emission factor of 67 g/kg fuel is ob-
tained. The plume studies (D1.2.2) have shown that between ~1% (polluted urban air, winter
conditions) and 60% (clean background, summer conditions) of emitted SO2 contributes to
the PM, giving EF(H2SO4·nH2O) 1-40 g/kg fuel. These numbers can be compared to the typ-
ical EFPM that are a few grams per kg fuel.
10) Emission factors for particle number concentrations are in the order of magnitude of 1016
#/kg-fuel with a positive correlation between EFPN and the engine load. Between 1/3 and 2/3 of particles have been found to be volatile.
11) Emission factors of S, CO, HC, NOX and PM for inland shipping are affected by Directives 97/68/EG and 97/70/EG (Table 14). The EF(CO2) as well as CO, HC will be about the same as for marine gasoil. The EF(NOX) of newer engines are limited by 97/68/EG, for engines older than 2007 or 2009 EFs for MGO can be used. For and PM and PAHs EF(PAH) no data

D1.2.1 TRANSPHORM Deliverable
26 of 27
are available. From correlation between FSC and EF(PM) one can extrapolate for the new FSC limit EF(PM) = 1.5g/kg-fuel. For EF(EC) and EF(OC) proportion between EC and PM-mass and OC and PM-mass can be approximated by PM composition of large pre-Euro and Euro-I road diesel engines which is 51% for EC/PM-mass and 35% for OC/PM-mass. For EF(PN) use of EF 0.3x10
16 #/kg-fuel is recommended and for EF(PAH) use of EF for MGO
is recommended.
Table 14. Overview of fuel sulphur content- and emission limits for shipping in EU.
Year Navigation FSC (%-wt) Note FSC NOx & other pollutants
Note NOx & other poll.
2005 All 2.7% HFO Global average Tier I
0.2% MGO Fuel Directive
2010 Maritime 2.7% HFO Global average Tier I
0.1% MGO Fuel Directive (lowered 2008)
1.5 - 1% limit SECA (Jul 2010)
1.5% limit
EU passenger vessels in regular services (Aug 2006)*
Port 0.1% limit Fuel directive (Jan 2010) Tier I
Inland 0.1% limit Fuel directive (January 2010)
Regulation on CO, NOx + VOC, PM
From 2007-2009
2020 Maritime 0.5% limit Global, IMO (Jan 2020) Tier II From Jan 2011
0.1% limit ECA (lowered Jan 2015) Tier III From Jan 2016
Ports 0.1% limit Fuel directive Tier II
Inland 10 ppm limit Fuel directive (lowered Jan 2011) Same as 2010
* In the Mediterranean Sea passenger vessels are not using 1.5 wt-% S fuel even if they are required to do so by the
directive. FSC in the Mediterranean is closer to 2.7 wt-% than 1.5 wt-%.
Emission factors are apparently a function of fuel type, fuel content of sulphur, metal elements and other compounds, type of engine and engine operation conditions. The activity data needed for cal-culation of emission inventory is than use of fuels of different quality (at least MGO, MD and HFO), types of engines using the fuel, including information on equipment with different clean technologies and information on distribution of engine operation in different operation modes. Con-sidering that the changes of EF against the engine load mostly deviate for very low loads (15-25%), separation on cruise and manoeuvring is the most important.
Emission factors for CO2, NOx, SO2 CO and HC presented here are based on a large number of measurements in Lloyd’s and IVL’s databases. These emission factors are widely used, however many other data and compiled emission factors exist. We have not performed a complete review of data for these species as focus of this report is on PM. Data on emission factors for PM mass, num-ber and composition for shipping are very limited. The existing emission inventories of PM mass emissions from shipping use ENTEC data on PM mass emission factors (EC and ENTEC, 2002). The existing data on PM number and composition are reviewed here.
References
Transphorm deliverables:
D1.2.1 Moldanová, J., Fridell, E., Petzold, A., Jalkanen, J.-P. Report on shipping emission factors.
D2.1.4 Moldanová, J., Fridell, E., Winnes, H., Jedynska, A. Physical and chemical PM characterization from the
measurement campaigns on shipping emissions.

Deliverable TRANSPHORM D1.2.1
27 of 27
Agrawal, H.; Malloy, Q. G. J.; Welch, W. A.; Wayne Miller, J.; Cocker III., D. R., (2008a). In-use gaseous and particu-late matter emissions from a modern ocean going container vessel. Atmos. Environ. 42, 5504–5510.
Agrawal, H.; Welch, W. A.; Miller, J. W.; Cocker III, D. R. (2008b). Emission measurements from a crude oil tanker at sea. Environ. Sci. Technol. 42, 7098–7103.
Agrawal, H., Welch, W.A., Henningsen, S., Miller, J.W., Cocker III, D.R. (2010). Emissions from main propulsion engine on container ship at sea. J. Geophys. Res. 115, D23205.
Cooper, D. A., and K. Peterson (1996), Hydrocarbon, PAH and PCB emissions from ferries: A case study in the Skagerak‐Kattegatt‐Oresund region, Atmos. Environ., 30, 2463–2473.
Cooper, D. A. (2001) ‘Exhaust emissions from high speed passenger ferries’, Atmos. Environ. 35, pp 4189-4200.
Cooper, D. A. (2003). Exhaust emissions from ships at berth, Atmospheric Environment 37, 3917-3830.
Cooper, D., Gustafsson, T. (2004). Methodology for calculating emissions from ships: 1. Update of emission factors. SMED Project report 4/2004, www.smed.se.
EC (1999) Council Directive 1999/32/EC of 26 April 1999 relating to a reduction in the sulphur content of certain liq-uid fuels, http://europa.eu/legislation_summaries/environment/air_pollution/l21050_en.htm
EC (2005). Directive 2005/33/EC of the European Parliament and of the Council of 6 July 2005 amending Directive
1999/32/EC, http://europa.eu/legislation_summaries/environment/air_pollution/l21050_en.htm
EC and ENTEC UK Limited, 2002. Quantification of Emissions from Ships Associated with Ship Movements between Ports in the European Community. European Commission. DG ENV.C1.
Endresen, Ø., Bakke, J., Sørgård, E., Berglen, T. F., Holmvang, P. (2005). Improved modelling of ship SO2 emissions –A fuel based approach. Atmospheric Environment 39, 3621-3628.
European Commission (2000) ‘Guidance document for EPER (European Pollutant Emission Register) implementation’ November 2000. Refers to Council Directive 96/61 EC concerning IPPC (Integrated Pollution Prevention and Con-trol).
Fridell, E., Steen, E., Peterson, K. (2008). Primary particles in ship emissions. Atmospheric Environment 42, 1160.
International Maritime Organization (IMO) (2009). Second IMO GHG Study 2009, London, UK; Buhaug, Ø., Corbett, J.J., Endresen, Ø., Eyring, V., Faber, J., Hanayama, S., Lee, D.S., Lee, D., Lindstad, H., Markowska, A.Z., Mjelde, A., Nelissen, D., Nilsen, J., Pålsson, C., Winebrake, J.J., Wu, W., Yoshida, K.
Jalkanen, J.-P., Brink, A., Kalli, J., Pettersson, H., Kukkonen, J., Stipa, T. (2009). A modelling system for the exhaust emissions of marine traffic and its application in the Baltic Sea area. Atmos. Chem. Phys., 9, 9209–9223.
Jalkanen, J.-P., Johansson, L., Kukkonen, J., Brink, A., Kalli, J., Stipa, T. (2011), ”Extension of Ship Traffic Emission Assessment Model for Particulate Matter and Carbon Monoxide”, Atmos. Chem. Phys. Discuss., 11, 22129–22172.
Jonsson, Å. M., Westerlund, J., Hallquist, M., 2011. Size‐resolved particle emission factors for individual ships. Geo-physical Research Letters 38, L13809, doi:10.1029/2011GL047672.
Kasper, A.; Aufdenblatten, S.; Forss, A.; Mohr, M.; Burtscher, H. (2007). Particulate emissions from a low-speed ma-rine diesel engine. Aerosol Sci. Technol. 41, 24–32.
Lack, D. A.; Corbett, J. J.; Onasch, T.; Lerner, B.; Massoli, P.; Quinn, P. K.; Bates, T. S.; Covert, D. S.; Coffman, D.; Sierau, B. et al. (2009). Particulate emissions from commercial shipping: Chemical, physical, and optical properties. J. Geophys. Res. 114, D00F04.
Lloyd’s Register Engineering Services (1995). Marine exhaust emissions research programme. London, England.
Lövblad, G., Fridell, E. (2006). Experiences from use of some techniques to reduce emissions from ships. Swedish Maritime Administration, Göteborg, Sweden.
Lyyränen, J., Jokiniemi, J., Kauppinen, E.I., Joutsensaari, J. (1999). Aerosol characterisation in medium-speed diesel engines operating with heavy fuel oils. Journal of Aerosol Science 30, 771–784.
Moldanová, J.; Fridell, E.; Popovicheva, O.; Demirdjian, B.; Tishkova, V.; Faccinetto, A.; Focsa, C. (2009). Characteri-sation of particulate matter and gaseous emissions from a large ship diesel engine. Atmos. Environ. 43, 2632–2641.
Petzold, A.; Hasselbach, J.; Lauer, P.; Baumann, R.; Franke, K.; Gurk, C.; Schlager, H.; Weingartner, E. (2008). Exper-imental studies on particle emissions from cruising ship, their characteristic properties, transformation and atmos-pheric lifetime in the marine boundary layer. Atmos. Chem. Phys. 8, 2387–2403.
Petzold, A.; Weingartner, E.; Hasselbach, J.; Lauer, P.; Kurok, C.; Fleischer, F. (2010). Physical properties, chemical composition, and cloud forming potential of particulate emissions from marine diesel engines at various load condi-tions. Environ. Sci. Technol. 44, 3800–3805.
Petzold, A., Lauer, P., Fritsche, U., Hasselbach, J., Lichtenstern, M., Schlager, H. and Fleischer, F. (2011): Operation of Marine Diesel Engines on Biogenic Fuels: Modification of Emissions and Resulting Climate Effects, Environmental Science & Technology, 45, 10394-10400, 10.1021/es2021439.
Pirjola, L., Pajunoja, A., Malinen, A., Walden, J., Jalkanen, J.-P., Rönkkö. T. and Lähde, T. (2011), Mobile measure-ments of ship emissions in two harbor areas in Finland, European Aerosol Conference, Abstract N:o 973.
Sarvi, A., Fogelholm, C.-J., Zevenhoven, R. (2008). Emissions from large-scale medium-speed diesel engines: 1. Influ-ence of engine operation mode and turbocharger. Fuel Proc. Tech., 89, 510-519.
Winnes, H., Fridell, E. (2009) Particle emissions from ships; dependence on fuel type. Journal of Air and Waste Man-agement Association, 59, 1391–1398.