˘ˇˆ˙˝˛˚˜ - fourin · ˘ˇˆ˙˝˛˚˜ !" 16.06 million units, operating ratio dropping...
TRANSCRIPT


���������� ��� ���� ��������
����� ����� !"���
66.2%
59.4%
77.2%
85.1%
65.9%
64.2%
62.3%
59.6%
53.5%
0%
20%
40%
60%
80%
100%
0
20
40
60
80
100
2007 2008 2009 2010 2011 2012 2013 2014 2015
(Million units)
Overcapacity of the Chinese Automotive Industry:
Factory Operating Rate Drops Below 60 Percent,
Reorganization Becoming Urgent Issue
Overcapacity in China’s automotive industry began to significantly increase in 2011. By the end of 2014, excess capacity stood at
16.06 million units, operating ratio dropping below 60 percent for the first time in six years. Operating ratio differs from maker to
maker, European, US and Korean automakers are operating at over 90 percent capacity while Japanese at 78.8 percent. In contrast,
Chinese manufacturers’ operating ratio was a mere at 43.5 percent in 2014, putting pressure on business performance.
Chinese automakers’ overcapacity problem is deeply tied to stagnating sales. Chinese consumers prefer large automobiles, while the
core products of Chinese automakers are A (mini) and B (small) segment models whose market decreased 5.5 percent to 2.14 million
units in 2014. In addition, the introduction of China 4 emission standard on diesel vehicles negatively impacted the commercial vehicle
market, driving down sales of Chinese automakers. In addition, registration restriction of new vehicles introduced by Beijing,
Shanghai, Tianjin and other large cities increases ownership cost, turning away consumers in these cities from Chinese automobiles
and channeling them toward high-quality foreign products. Moreover, foreign brands quickly reacted to stagnating sales by reducing
prices, making an effort to control sales decline. Chinese automakers haphazard facility investment was another reason for ballooning
overcapacity. Triggered by an over 30 percent annual increase in automobile production for two consecutive years in 2009 and 2010,
local automakers built new plants without stopping for the next five years.
Under these circumstances, some local automakers, which face mounting business difficulties, are bought by Sino-foreign joint
ventures. In March 2015, Changan Ford announced that it purchased Hafei Motor’s manufacturing facility in Heilongjiang province,
leaving the Chinese automaker only with one plant in Shandong province. Annual production capacity of the acquired plant is 200,000
units. Changan Ford intends to keep the existing production line, which was used for the manufacturing of Changan Automobile’s
Alsvin V3, and install a new production line as well for Ford brand models. Although the purchase of local automakers by Sino-foreign
manufacturers is one way of dealing with overcapacity, it could also cause the rapid decline of Chinese automakers. Therefore, the
central government cannot actively promote such trend in the automotive industry.
For this reason, in order to resolve the issue of overcapacity, Chinese automakers must engage in reorganization and consolidation.
In China, there are dozens of local automakers which were set up by regional governments in an effort to develop the local economy;
however, many of them suffer from low operating ratio. Medium and small automakers should be absorbed by SAIC, Changan,
Dongfeng and other major Chinese manufacturers in order to eliminate overcapacity. In the long term, product appeal of large Chinese
automakers must be improved to adequately address overcapacity. Instead of forceful reorganization directed by the central
government, R&D support would be necessary to boost product power. Regarding the Chinese automotive market, low growth is
projected to continue in the coming years. Therefore, if Chinese automakers cannot tackle overcapacity early on, they will fall even
further behind Sino-foreign manufacturers. (Yongxue JIN)
��������
China: Automobile Production Capacity, Production Scale and Operating Ratio (Actual 2007–2014, Forecast 2015)
Overcapacity
Production
volume
Note: Production capacity is based on announcements by automakers; however, the number of shifts at each plant is unknown.
Bar graph: Production capacity (left scale). Line graph: Operating ratio (right scale). (Created by FOURIN)
���������� ��� ���� ��������
����� ����� !"���
FOURIN Asia Automotive Intelligence
Global Automobile Sales in 2014:
Toyota Maintains Top Position,
but Volkswagen Is Closely Behind
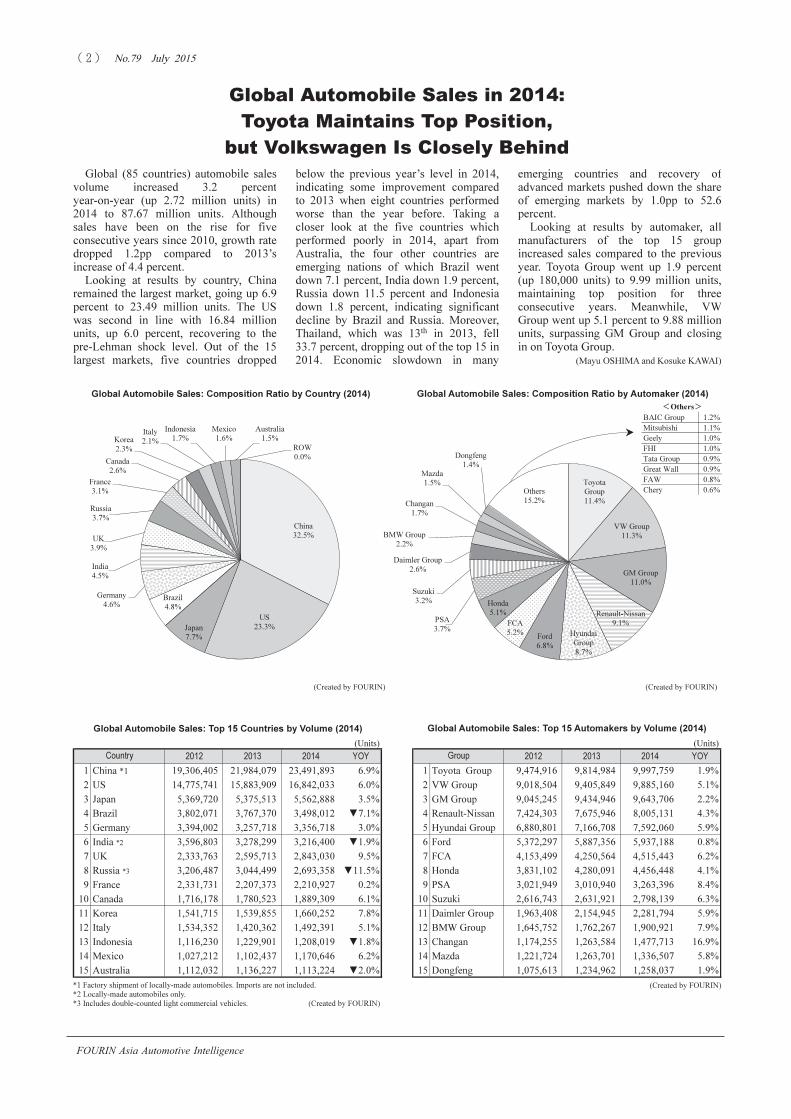
Global (85 countries) automobile sales
volume increased 3.2 percent
year-on-year (up 2.72 million units) in
2014 to 87.67 million units. Although
sales have been on the rise for five
consecutive years since 2010, growth rate
dropped 1.2pp compared to 2013’s
increase of 4.4 percent.
Looking at results by country, China
remained the largest market, going up 6.9
percent to 23.49 million units. The US
was second in line with 16.84 million
units, up 6.0 percent, recovering to the
pre-Lehman shock level. Out of the 15
largest markets, five countries dropped
emerging countries and recovery of
advanced markets pushed down the share
of emerging markets by 1.0pp to 52.6
percent.
Looking at results by automaker, all
manufacturers of the top 15 group
increased sales compared to the previous
year. Toyota Group went up 1.9 percent
(up 180,000 units) to 9.99 million units,
maintaining top position for three
consecutive years. Meanwhile, VW
Group went up 5.1 percent to 9.88 million
units, surpassing GM Group and closing
in on Toyota Group.
(Mayu OSHIMA and Kosuke KAWAI)
below the previous year’s level in 2014,
indicating some improvement compared
to 2013 when eight countries performed
worse than the year before. Taking a
closer look at the five countries which
performed poorly in 2014, apart from
Australia, the four other countries are
emerging nations of which Brazil went
down 7.1 percent, India down 1.9 percent,
Russia down 11.5 percent and Indonesia
down 1.8 percent, indicating significant
decline by Brazil and Russia. Moreover,
Thailand, which was 13th
in 2013, fell
33.7 percent, dropping out of the top 15 in
2014. Economic slowdown in many
Global Automobile Sales: Composition Ratio by Country (2014) Global Automobile Sales: Composition Ratio by Automaker (2014)
Global Automobile Sales: Top 15 Countries by Volume (2014) Global Automobile Sales: Top 15 Automakers by Volume (2014)
(Created by FOURIN) (Created by FOURIN)
(Created by FOURIN)*1 Factory shipment of locally-made automobiles. Imports are not included.
*2 Locally-made automobiles only.
*3 Includes double-counted light commercial vehicles. (Created by FOURIN)
(Units)
2012 2013 2014 YOY
1 China *1 19,306,405 21,984,079 23,491,893 6.9%
2 US 14,775,741 15,883,909 16,842,033 6.0%
3 Japan 5,369,720 5,375,513 5,562,888 3.5%
4 Brazil 3,802,071 3,767,370 3,498,012 ▼7.1%
5 Germany 3,394,002 3,257,718 3,356,718 3.0%
6 India *2 3,596,803 3,278,299 3,216,400 ▼1.9%
7 UK 2,333,763 2,595,713 2,843,030 9.5%
8 Russia *3 3,206,487 3,044,499 2,693,358 ▼11.5%
9 France 2,331,731 2,207,373 2,210,927 0.2%
10 Canada 1,716,178 1,780,523 1,889,309 6.1%
11 Korea 1,541,715 1,539,855 1,660,252 7.8%
12 Italy 1,534,352 1,420,362 1,492,391 5.1%
13 Indonesia 1,116,230 1,229,901 1,208,019 ▼1.8%
14 Mexico 1,027,212 1,102,437 1,170,646 6.2%
15 Australia 1,112,032 1,136,227 1,113,224 ▼2.0%
Country
China
32.5%
US
23.3%Japan
7.7%
Brazil
4.8%
Germany
4.6%
India
4.5%
UK
3.9%
Russia
3.7%
France
3.1%
Canada
2.6%
Korea
2.3%
Italy
2.1%
Indonesia
1.7%
Mexico
1.6%
Australia
1.5%
ROW
0.0%
BAIC Group 1.2%
Mitsubishi 1.1%
Geely 1.0%
FHI 1.0%
Tata Group 0.9%
Great Wall 0.9%
FAW 0.8%
Chery 0.6%
�Others�
(Units)
2012 2013 2014 YOY
1 Toyota Group 9,474,916 9,814,984 9,997,759 1.9%
2 VW Group 9,018,504 9,405,849 9,885,160 5.1%
3 GM Group 9,045,245 9,434,946 9,643,706 2.2%
4 Renault-Nissan 7,424,303 7,675,946 8,005,131 4.3%
5 Hyundai Group 6,880,801 7,166,708 7,592,060 5.9%
6 Ford 5,372,297 5,887,356 5,937,188 0.8%
7 FCA 4,153,499 4,250,564 4,515,443 6.2%
8 Honda 3,831,102 4,280,091 4,456,448 4.1%
9 PSA 3,021,949 3,010,940 3,263,396 8.4%
10 Suzuki 2,616,743 2,631,921 2,798,139 6.3%
11 Daimler Group 1,963,408 2,154,945 2,281,794 5.9%
12 BMW Group 1,645,752 1,762,267 1,900,921 7.9%
13 Changan 1,174,255 1,263,584 1,477,713 16.9%
14 Mazda 1,221,724 1,263,701 1,336,507 5.8%
15 Dongfeng 1,075,613 1,234,962 1,258,037 1.9%
Group
Toyota
Group
11.4%
VW Group
11.3%
GM Group
11.0%
Renault-Nissan
9.1%
Hyundai
Group
8.7%
Ford
6.8%
FCA
5.2%
Honda
5.1%
PSA
3.7%
Suzuki
3.2%
Daimler Group
2.6%
BMW Group
2.2%
Changan
1.7%
Mazda
1.5%
Dongfeng
1.4%
Others
15.2%
���������� ��� ���� ��������
����� ����� !"���
FOURIN Asia Automotive Intelligence
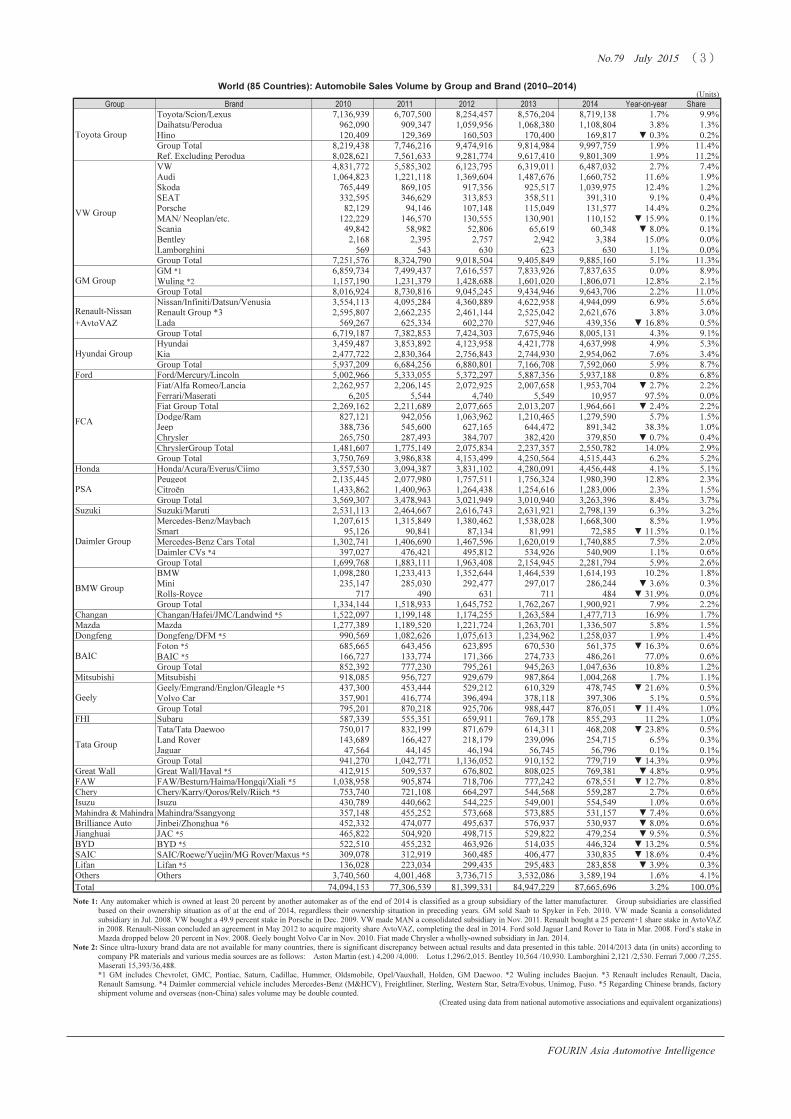
World (85 Countries): Automobile Sales Volume by Group and Brand (2010–2014)
Note 1: Any automaker which is owned at least 20 percent by another automaker as of the end of 2014 is classified as a group subsidiary of the latter manufacturer. Group subsidiaries are classified
based on their ownership situation as of at the end of 2014, regardless their ownership situation in preceding years. GM sold Saab to Spyker in Feb. 2010. VW made Scania a consolidated
subsidiary in Jul. 2008. VW bought a 49.9 percent stake in Porsche in Dec. 2009. VW made MAN a consolidated subsidiary in Nov. 2011. Renault bought a 25 percent+1 share stake in AvtoVAZ
in 2008. Renault-Nissan concluded an agreement in May 2012 to acquire majority share AvtoVAZ, completing the deal in 2014. Ford sold Jaguar Land Rover to Tata in Mar. 2008. Ford’s stake in
Mazda dropped below 20 percent in Nov. 2008. Geely bought Volvo Car in Nov. 2010. Fiat made Chrysler a wholly-owned subsidiary in Jan. 2014.
Note 2: Since ultra-luxury brand data are not available for many countries, there is significant discrepancy between actual results and data presented in this table. 2014/2013 data (in units) according to
company PR materials and various media sources are as follows: Aston Martin (est.) 4,200 /4,000. Lotus 1,296/2,015. Bentley 10,564 /10,930. Lamborghini 2,121 /2,530. Ferrari 7,000 /7,255.
Maserati 15,393/36,488.
*1 GM includes Chevrolet, GMC, Pontiac, Saturn, Cadillac, Hummer, Oldsmobile, Opel/Vauxhall, Holden, GM Daewoo. *2 Wuling includes Baojun. *3 Renault includes Renault, Dacia,
Renault Samsung. *4 Daimler commercial vehicle includes Mercedes-Benz (M&HCV), Freightliner, Sterling, Western Star, Setra/Evobus, Unimog, Fuso. *5 Regarding Chinese brands, factory
shipment volume and overseas (non-China) sales volume may be double counted.
(Created using data from national automotive associations and equivalent organizations)
(Units)
Group Brand 2010 2011 2012 2013 2014 Year-on-year Share
Toyota/Scion/Lexus 7,136,939 6,707,500 8,254,457 8,576,204 8,719,138 1.7% 9.9%
Daihatsu/Perodua 962,090 909,347 1,059,956 1,068,380 1,108,804 3.8% 1.3%
Hino 120,409 129,369 160,503 170,400 169,817 ▼ 0.3% 0.2%
Group Total 8,219,438 7,746,216 9,474,916 9,814,984 9,997,759 1.9% 11.4%
Ref. Excluding Perodua 8,028,621 7,561,633 9,281,774 9,617,410 9,801,309 1.9% 11.2%
VW 4,831,772 5,585,302 6,123,795 6,319,011 6,487,032 2.7% 7.4%
Audi 1,064,823 1,221,118 1,369,604 1,487,676 1,660,752 11.6% 1.9%
Skoda 765,449 869,105 917,356 925,517 1,039,975 12.4% 1.2%
SEAT 332,595 346,629 313,853 358,511 391,310 9.1% 0.4%
Porsche 82,129 94,146 107,148 115,049 131,577 14.4% 0.2%
MAN/ Neoplan/etc. 122,229 146,570 130,555 130,901 110,152 ▼ 15.9% 0.1%
Scania 49,842 58,982 52,806 65,619 60,348 ▼ 8.0% 0.1%
Bentley 2,168 2,395 2,757 2,942 3,384 15.0% 0.0%
Lamborghini 569 543 630 623 630 1.1% 0.0%
Group Total 7,251,576 8,324,790 9,018,504 9,405,849 9,885,160 5.1% 11.3%
GM *1 6,859,734 7,499,437 7,616,557 7,833,926 7,837,635 0.0% 8.9%
Wuling *2 1,157,190 1,231,379 1,428,688 1,601,020 1,806,071 12.8% 2.1%
Group Total 8,016,924 8,730,816 9,045,245 9,434,946 9,643,706 2.2% 11.0%
Nissan/Infiniti/Datsun/Venusia 3,554,113 4,095,284 4,360,889 4,622,958 4,944,099 6.9% 5.6%
Renault Group *3 2,595,807 2,662,235 2,461,144 2,525,042 2,621,676 3.8% 3.0%
Lada 569,267 625,334 602,270 527,946 439,356 ▼ 16.8% 0.5%
Group Total 6,719,187 7,382,853 7,424,303 7,675,946 8,005,131 4.3% 9.1%
Hyundai 3,459,487 3,853,892 4,123,958 4,421,778 4,637,998 4.9% 5.3%
Kia 2,477,722 2,830,364 2,756,843 2,744,930 2,954,062 7.6% 3.4%
Group Total 5,937,209 6,684,256 6,880,801 7,166,708 7,592,060 5.9% 8.7%
Ford Ford/Mercury/Lincoln 5,002,966 5,333,055 5,372,297 5,887,356 5,937,188 0.8% 6.8%
Fiat/Alfa Romeo/Lancia 2,262,957 2,206,145 2,072,925 2,007,658 1,953,704 ▼ 2.7% 2.2%
Ferrari/Maserati 6,205 5,544 4,740 5,549 10,957 97.5% 0.0%
Fiat Group Total 2,269,162 2,211,689 2,077,665 2,013,207 1,964,661 ▼ 2.4% 2.2%
Dodge/Ram 827,121 942,056 1,063,962 1,210,465 1,279,590 5.7% 1.5%
Jeep 388,736 545,600 627,165 644,472 891,342 38.3% 1.0%
Chrysler 265,750 287,493 384,707 382,420 379,850 ▼ 0.7% 0.4%
ChryslerGroup Total 1,481,607 1,775,149 2,075,834 2,237,357 2,550,782 14.0% 2.9%
Group Total 3,750,769 3,986,838 4,153,499 4,250,564 4,515,443 6.2% 5.2%
Honda Honda/Acura/Everus/Ciimo 3,557,530 3,094,387 3,831,102 4,280,091 4,456,448 4.1% 5.1%
Peugeot 2,135,445 2,077,980 1,757,511 1,756,324 1,980,390 12.8% 2.3%
Citroën 1,433,862 1,400,963 1,264,438 1,254,616 1,283,006 2.3% 1.5%
Group Total 3,569,307 3,478,943 3,021,949 3,010,940 3,263,396 8.4% 3.7%
Suzuki Suzuki/Maruti 2,531,113 2,464,667 2,616,743 2,631,921 2,798,139 6.3% 3.2%
Mercedes-Benz/Maybach 1,207,615 1,315,849 1,380,462 1,538,028 1,668,300 8.5% 1.9%
Smart 95,126 90,841 87,134 81,991 72,585 ▼ 11.5% 0.1%
Mercedes-Benz Cars Total 1,302,741 1,406,690 1,467,596 1,620,019 1,740,885 7.5% 2.0%
Daimler CVs *4 397,027 476,421 495,812 534,926 540,909 1.1% 0.6%
Group Total 1,699,768 1,883,111 1,963,408 2,154,945 2,281,794 5.9% 2.6%
BMW 1,098,280 1,233,413 1,352,644 1,464,539 1,614,193 10.2% 1.8%
Mini 235,147 285,030 292,477 297,017 286,244 ▼ 3.6% 0.3%
Rolls-Royce 717 490 631 711 484 ▼ 31.9% 0.0%
Group Total 1,334,144 1,518,933 1,645,752 1,762,267 1,900,921 7.9% 2.2%
Changan Changan/Hafei/JMC/Landwind *5 1,522,097 1,199,148 1,174,255 1,263,584 1,477,713 16.9% 1.7%
Mazda Mazda 1,277,389 1,189,520 1,221,724 1,263,701 1,336,507 5.8% 1.5%
Dongfeng Dongfeng/DFM *5 990,569 1,082,626 1,075,613 1,234,962 1,258,037 1.9% 1.4%
Foton *5 685,665 643,456 623,895 670,530 561,375 ▼ 16.3% 0.6%
BAIC *5 166,727 133,774 171,366 274,733 486,261 77.0% 0.6%
Group Total 852,392 777,230 795,261 945,263 1,047,636 10.8% 1.2%
Mitsubishi Mitsubishi 918,085 956,727 929,679 987,864 1,004,268 1.7% 1.1%
Geely/Emgrand/Englon/Gleagle *5 437,300 453,444 529,212 610,329 478,745 ▼ 21.6% 0.5%
Volvo Car 357,901 416,774 396,494 378,118 397,306 5.1% 0.5%
Group Total 795,201 870,218 925,706 988,447 876,051 ▼ 11.4% 1.0%
FHI Subaru 587,339 555,351 659,911 769,178 855,293 11.2% 1.0%
Tata/Tata Daewoo 750,017 832,199 871,679 614,311 468,208 ▼ 23.8% 0.5%
Land Rover 143,689 166,427 218,179 239,096 254,715 6.5% 0.3%
Jaguar 47,564 44,145 46,194 56,745 56,796 0.1% 0.1%
Group Total 941,270 1,042,771 1,136,052 910,152 779,719 ▼ 14.3% 0.9%
Great Wall Great Wall/Haval *5 412,915 509,537 676,802 808,025 769,381 ▼ 4.8% 0.9%
FAW FAW/Besturn/Haima/Hongqi/Xiali *5 1,038,958 905,874 718,706 777,242 678,551 ▼ 12.7% 0.8%
Chery Chery/Karry/Qoros/Rely/Riich *5 753,740 721,108 664,297 544,568 559,287 2.7% 0.6%
Isuzu Isuzu 430,789 440,662 544,225 549,001 554,549 1.0% 0.6%
Mahindra & Mahindra Mahindra/Ssangyong 357,148 455,252 573,668 573,885 531,157 ▼ 7.4% 0.6%
Brilliance Auto Jinbei/Zhonghua *6 452,332 474,077 495,637 576,937 530,937 ▼ 8.0% 0.6%
Jianghuai JAC *5 465,822 504,920 498,715 529,822 479,254 ▼ 9.5% 0.5%
BYD BYD *5 522,510 455,232 463,926 514,035 446,324 ▼ 13.2% 0.5%
SAIC SAIC/Roewe/Yuejin/MG Rover/Maxus *5 309,078 312,919 360,485 406,477 330,835 ▼ 18.6% 0.4%
Lifan Lifan *5 136,028 223,034 299,435 295,483 283,858 ▼ 3.9% 0.3%
Others Others 3,740,560 4,001,468 3,736,715 3,532,086 3,589,194 1.6% 4.1%
Total 74,094,153 77,306,539 81,399,331 84,947,229 87,665,696 3.2% 100.0%
Tata Group
Toyota Group
VW Group
GM Group
Renault-Nissan
+AvtoVAZ
Hyundai Group
FCA
PSA
Daimler Group
BMW Group
BAIC
Geely
���������� ��� ���� ��������
����� ����� !"���
FOURIN Asia Automotive Intelligence
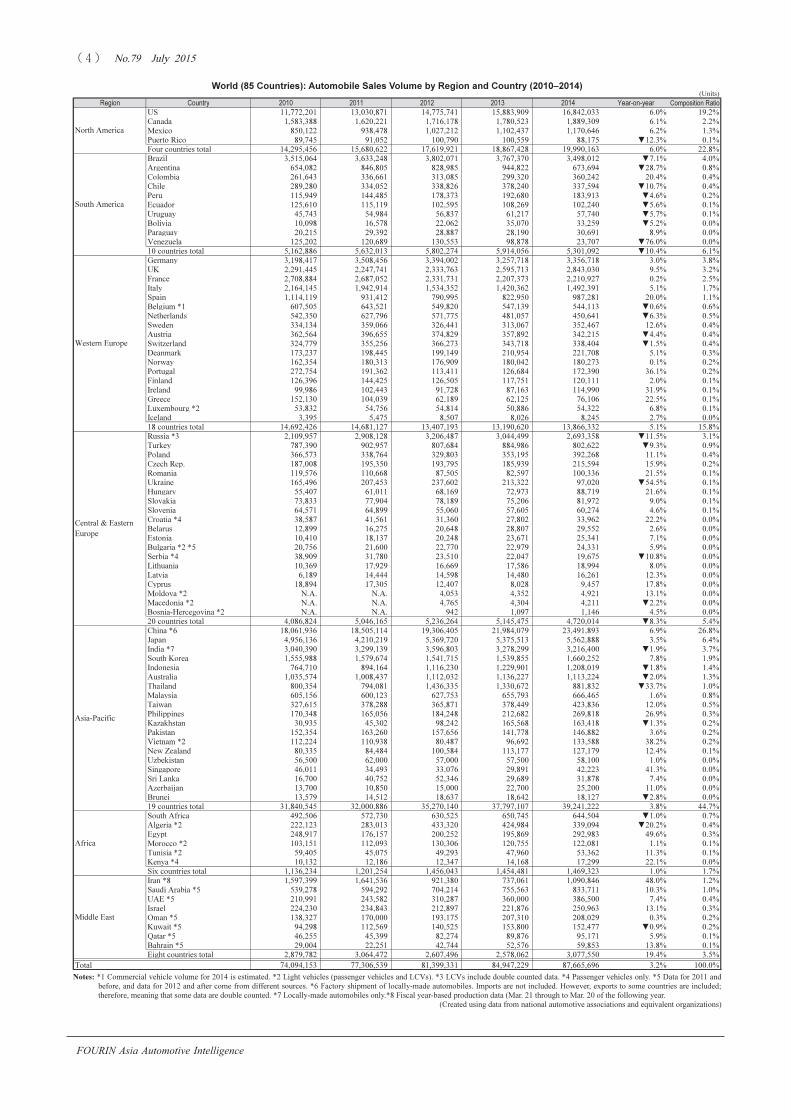
World (85 Countries): Automobile Sales Volume by Region and Country (2010–2014)�
Notes: *1 Commercial vehicle volume for 2014 is estimated. *2 Light vehicles (passenger vehicles and LCVs). *3 LCVs include double counted data. *4 Passenger vehicles only. *5 Data for 2011 and
before, and data for 2012 and after come from different sources. *6 Factory shipment of locally-made automobiles. Imports are not included. However, exports to some countries are included;
therefore, meaning that some data are double counted. *7 Locally-made automobiles only.*8 Fiscal year-based production data (Mar. 21 through to Mar. 20 of the following year.
(Created using data from national automotive associations and equivalent organizations)
(Units)
Region Country 2010 2011 2012 2013 2014 Year-on-year Composition Ratio
US 11,772,201 13,030,871 14,775,741 15,883,909 16,842,033 6.0% 19.2%
Canada 1,583,388 1,620,221 1,716,178 1,780,523 1,889,309 6.1% 2.2%
Mexico 850,122 938,478 1,027,212 1,102,437 1,170,646 6.2% 1.3%
Puerto Rico 89,745 91,052 100,790 100,559 88,175 ▼12.3% 0.1%
Four countries total 14,295,456 15,680,622 17,619,921 18,867,428 19,990,163 6.0% 22.8%
Brazil 3,515,064 3,633,248 3,802,071 3,767,370 3,498,012 ▼7.1% 4.0%
Argentina 654,082 846,805 828,985 944,822 673,694 ▼28.7% 0.8%
Colombia 261,643 336,661 313,085 299,320 360,242 20.4% 0.4%
Chile 289,280 334,052 338,826 378,240 337,594 ▼10.7% 0.4%
Peru 115,949 144,485 178,373 192,680 183,913 ▼4.6% 0.2%
Ecuador 125,610 115,119 102,595 108,269 102,240 ▼5.6% 0.1%
Uruguay 45,743 54,984 56,837 61,217 57,740 ▼5.7% 0.1%
Bolivia 10,098 16,578 22,062 35,070 33,259 ▼5.2% 0.0%
Paraguay 20,215 29,392 28,887 28,190 30,691 8.9% 0.0%
Venezuela 125,202 120,689 130,553 98,878 23,707 ▼76.0% 0.0%
10 countries total 5,162,886 5,632,013 5,802,274 5,914,056 5,301,092 ▼10.4% 6.1%
Germany 3,198,417 3,508,456 3,394,002 3,257,718 3,356,718 3.0% 3.8%
UK 2,291,445 2,247,741 2,333,763 2,595,713 2,843,030 9.5% 3.2%
France 2,708,884 2,687,052 2,331,731 2,207,373 2,210,927 0.2% 2.5%
Italy 2,164,145 1,942,914 1,534,352 1,420,362 1,492,391 5.1% 1.7%
Spain 1,114,119 931,412 790,995 822,950 987,281 20.0% 1.1%
Belgium *1 607,505 643,521 549,820 547,139 544,113 ▼0.6% 0.6%
Netherlands 542,350 627,796 571,775 481,057 450,641 ▼6.3% 0.5%
Sweden 334,134 359,066 326,441 313,067 352,467 12.6% 0.4%
Austria 362,564 396,655 374,829 357,892 342,215 ▼4.4% 0.4%
Switzerland 324,779 355,256 366,273 343,718 338,404 ▼1.5% 0.4%
Deanmark 173,237 198,445 199,149 210,954 221,708 5.1% 0.3%
Norway 162,354 180,313 176,909 180,042 180,273 0.1% 0.2%
Portugal 272,754 191,362 113,411 126,684 172,390 36.1% 0.2%
Finland 126,396 144,425 126,505 117,751 120,111 2.0% 0.1%
Ireland 99,986 102,443 91,728 87,163 114,990 31.9% 0.1%
Greece 152,130 104,039 62,189 62,125 76,106 22.5% 0.1%
Luxembourg *2 53,832 54,756 54,814 50,886 54,322 6.8% 0.1%
Iceland 3,395 5,475 8,507 8,026 8,245 2.7% 0.0%
18 countries total 14,692,426 14,681,127 13,407,193 13,190,620 13,866,332 5.1% 15.8%
Russia *3 2,109,957 2,908,128 3,206,487 3,044,499 2,693,358 ▼11.5% 3.1%
Turkey 787,390 902,957 807,684 884,986 802,622 ▼9.3% 0.9%
Poland 366,573 338,764 329,803 353,195 392,268 11.1% 0.4%
Czech Rep. 187,008 195,350 193,795 185,939 215,594 15.9% 0.2%
Romania 119,576 110,668 87,505 82,597 100,336 21.5% 0.1%
Ukraine 165,496 207,453 237,602 213,322 97,020 ▼54.5% 0.1%
Hungary 55,407 61,011 68,169 72,973 88,719 21.6% 0.1%
Slovakia 73,833 77,904 78,189 75,206 81,972 9.0% 0.1%
Slovenia 64,571 64,899 55,060 57,605 60,274 4.6% 0.1%
Croatia *4 38,587 41,561 31,360 27,802 33,962 22.2% 0.0%
Belarus 12,899 16,275 20,648 28,807 29,552 2.6% 0.0%
Estonia 10,410 18,137 20,248 23,671 25,341 7.1% 0.0%
Bulgaria *2 *5 20,756 21,600 22,770 22,979 24,331 5.9% 0.0%
Serbia *4 38,909 31,780 23,510 22,047 19,675 ▼10.8% 0.0%
Lithuania 10,369 17,929 16,669 17,586 18,994 8.0% 0.0%
Latvia 6,189 14,444 14,598 14,480 16,261 12.3% 0.0%
Cyprus 18,894 17,305 12,407 8,028 9,457 17.8% 0.0%
Moldova *2 N.A. N.A. 4,053 4,352 4,921 13.1% 0.0%
Macedonia *2 N.A. N.A. 4,765 4,304 4,211 ▼2.2% 0.0%
Bosnia-Hercegovina *2 N.A. N.A. 942 1,097 1,146 4.5% 0.0%
20 countries total 4,086,824 5,046,165 5,236,264 5,145,475 4,720,014 ▼8.3% 5.4%
China *6 18,061,936 18,505,114 19,306,405 21,984,079 23,491,893 6.9% 26.8%
Japan 4,956,136 4,210,219 5,369,720 5,375,513 5,562,888 3.5% 6.4%
India *7 3,040,390 3,299,139 3,596,803 3,278,299 3,216,400 ▼1.9% 3.7%
South Korea 1,555,988 1,579,674 1,541,715 1,539,855 1,660,252 7.8% 1.9%
Indonesia 764,710 894,164 1,116,230 1,229,901 1,208,019 ▼1.8% 1.4%
Australia 1,035,574 1,008,437 1,112,032 1,136,227 1,113,224 ▼2.0% 1.3%
Thailand 800,354 794,081 1,436,335 1,330,672 881,832 ▼33.7% 1.0%
Malaysia 605,156 600,123 627,753 655,793 666,465 1.6% 0.8%
Taiwan 327,615 378,288 365,871 378,449 423,836 12.0% 0.5%
Philippines 170,348 165,056 184,248 212,682 269,818 26.9% 0.3%
Kazakhstan 30,935 45,302 98,242 165,568 163,418 ▼1.3% 0.2%
Pakistan 152,354 163,260 157,656 141,778 146,882 3.6% 0.2%
Vietnam *2 112,224 110,938 80,487 96,692 133,588 38.2% 0.2%
New Zealand 80,335 84,484 100,584 113,177 127,179 12.4% 0.1%
Uzbekistan 56,500 62,000 57,000 57,500 58,100 1.0% 0.0%
Singapore 46,011 34,493 33,076 29,891 42,223 41.3% 0.0%
Sri Lanka 16,700 40,752 52,346 29,689 31,878 7.4% 0.0%
Azerbaijan 13,700 10,850 15,000 22,700 25,200 11.0% 0.0%
Brunei 13,579 14,512 18,637 18,642 18,127 ▼2.8% 0.0%
19 countries total 31,840,545 32,000,886 35,270,140 37,797,107 39,241,222 3.8% 44.7%
South Africa 492,506 572,730 630,525 650,745 644,504 ▼1.0% 0.7%
Algeria *2 222,123 283,013 433,320 424,984 339,094 ▼20.2% 0.4%
Egypt 248,917 176,157 200,252 195,869 292,983 49.6% 0.3%
Morocco *2 103,151 112,093 130,306 120,755 122,081 1.1% 0.1%
Tunisia *2 59,405 45,075 49,293 47,960 53,362 11.3% 0.1%
Kenya *4 10,132 12,186 12,347 14,168 17,299 22.1% 0.0%
Six countries total 1,136,234 1,201,254 1,456,043 1,454,481 1,469,323 1.0% 1.7%
Iran *8 1,597,399 1,641,536 921,380 737,061 1,090,846 48.0% 1.2%
Saudi Arabia *5 539,278 594,292 704,214 755,563 833,711 10.3% 1.0%
UAE *5 210,991 243,582 310,287 360,000 386,500 7.4% 0.4%
Israel 224,230 234,843 212,897 221,876 250,963 13.1% 0.3%
Oman *5 138,327 170,000 193,175 207,310 208,029 0.3% 0.2%
Kuwait *5 94,298 112,569 140,525 153,800 152,477 ▼0.9% 0.2%
Qatar *5 46,255 45,399 82,274 89,876 95,171 5.9% 0.1%
Bahrain *5 29,004 22,251 42,744 52,576 59,853 13.8% 0.1%
Eight countries total 2,879,782 3,064,472 2,607,496 2,578,062 3,077,550 19.4% 3.5%
Total 74,094,153 77,306,539 81,399,331 84,947,229 87,665,696 3.2% 100.0%
Middle East
North America
South America
Western Europe
Central & Eastern
Europe
Asia-Pacific
Africa

���������� ��� ���� ��������
����� ����� !"���
FOURIN Asia Automotive Intelligence
Toyota Group / VW Group (83 Countries): Automobile Sales Volume by Region and Country (2012–2014)
Notes: On the following pages, Azerbaijan and Uzbekistan are not included, and Iran’s data include some estimates.� *1 Toyota Group includes Toyota, Scion, Lexus, Daihatsu, Dario, Perodua, Hino.
*2 VW Group includes VW, Audi, Škoda, SEAT, Bentley, Lamborghini, Porsche, MAN, Scania. (Created using data from national automotive associations and equivalent organizations)
(Units)
2012 2013 2014 Year-on-year 2012 2013 2014 Year-on-year
US 2,088,809 2,243,423 2,382,901 6.2% 612,486 608,088 595,987 ▼2.0%
Canada 193,784 197,056 202,752 2.9% 82,135 86,854 95,124 9.5%
Mexico 57,318 61,953 70,888 14.4% 166,871 191,895 197,146 2.7%
Puerto Rico 28,485 27,492 25,301 ▼8.0% 921 1,314 1,190 ▼9.4%
Four countries total 2,368,396 2,529,924 2,681,842 6.0% 862,413 888,151 889,447 0.1%
Brazil 113,804 176,268 195,682 11.0% 834,932 744,116 646,997 ▼13.1%
Argentina 45,005 53,737 64,595 20.2% 172,659 170,077 116,774 ▼31.3%
Colombia 1,605 1,566 2,225 42.1% - - - -
Chile 27,892 29,432 24,558 ▼16.6% 9,930 10,595 8,779 ▼17.1%
Peru 34,050 38,501 37,367 ▼2.9% 9,407 8,247 6,212 ▼24.7%
Ecuador 9,007 6,682 6,024 ▼9.8% 1,529 1,580 1,844 16.7%
Uruguay 1,507 1,580 1,316 ▼16.7% 8,120 7,293 5,736 ▼21.3%
Bolivia 4,076 5,598 5,976 6.8% 673 1,166 1,001 ▼14.2%
Paraguay 3,885 4,040 4,241 5.0% 2,447 2,390 2,326 ▼2.7%
Venezuela 17,742 11,601 3,327 ▼71.3% 1,860 1,791 25 ▼98.6%
10 countries total 258,573 329,005 345,311 5.0% 1,041,557 947,255 789,694 ▼16.6%
Germany 87,226 77,812 74,357 ▼4.4% 1,263,713 1,241,611 1,297,082 4.5%
UK 101,328 106,094 115,358 8.7% 448,951 506,435 562,586 11.1%
France 75,320 78,624 74,930 ▼4.7% 289,978 270,058 267,960 ▼0.8%
Italy 58,486 56,304 63,558 12.9% 197,780 183,875 198,707 8.1%
Spain 39,640 40,561 46,668 15.1% 179,465 184,217 216,247 17.4%
Belgium 18,869 19,597 21,076 7.5% 116,848 111,254 113,671 2.2%
Netherlands 38,302 30,633 22,852 ▼25.4% 128,549 107,450 106,707 ▼0.7%
Sweden 19,001 19,473 21,999 13.0% 89,683 86,187 96,490 12.0%
Austria 9,076 9,771 8,168 ▼16.4% 131,430 126,827 119,753 ▼5.6%
Switzerland 16,267 14,212 13,258 ▼6.7% 104,254 99,544 101,143 1.6%
Deanmark 17,125 15,894 14,790 ▼6.9% 45,103 55,835 54,229 ▼2.9%
Norway 20,209 20,799 19,338 ▼7.0% 49,291 47,022 48,483 3.1%
Portugal 5,040 6,032 8,752 45.1% 22,705 24,433 34,538 41.4%
Finland 15,130 13,333 13,818 3.6% 34,471 32,710 34,724 6.2%
Ireland 11,244 8,643 11,798 36.5% 22,856 22,766 28,028 23.1%
Greece 6,641 7,326 9,114 24.4% 12,278 13,718 15,152 10.5%
Luxembourg 1,239 880 1,030 17.0% 14,487 13,746 14,915 8.5%
Iceland 1,401 1,213 1,338 10.3% 2,097 2,010 1,562 ▼22.3%
18 countries total 541,544 527,201 542,202 2.8% 3,153,939 3,129,698 3,311,977 5.8%
Russia 168,700 170,580 181,103 6.2% 321,071 304,610 266,944 ▼12.4%
Turkey 34,576 38,443 35,991 ▼6.4% 123,948 151,888 154,415 1.7%
Poland 21,237 25,674 33,248 29.5% 72,160 81,790 98,129 20.0%
Czech Rep. 4,405 4,590 4,445 ▼3.2% 80,147 76,973 91,410 18.8%
Romania 2,616 2,597 2,876 10.7% 19,655 17,873 22,468 25.7%
Ukraine 17,597 16,963 11,158 ▼34.2% 32,486 27,678 12,295 ▼55.6%
Hungary 3,107 3,903 4,711 20.7% 14,904 15,992 18,135 13.4%
Slovakia 2,152 2,287 2,319 1.4% 26,407 23,856 27,586 15.6%
Slovenia 1,087 1,386 1,481 6.9% 13,500 14,504 17,631 21.6%
Croatia 999 1,056 1,519 43.8% 7,613 7,942 10,683 34.5%
Belarus 638 1,037 1,514 46.0% 4,562 6,626 5,764 ▼13.0%
Estonia 2,955 2,735 3,381 23.6% 4,807 4,755 5,275 10.9%
Bulgaria 2,116 2,210 2,399 8.6% 5,311 4,880 5,202 6.6%
Serbia 804 643 995 54.7% 6,341 5,998 6,054 0.9%
Lithuania 1,387 1,522 1,785 17.3% 4,591 4,931 5,306 7.6%
Latvia 1,647 1,699 2,027 19.3% 3,744 3,703 4,663 25.9%
Cyprus 1,223 913 1,157 26.7% 1,748 1,164 1,261 8.3%
Moldova 380 436 402 ▼7.8% 754 875 867 ▼0.9%
Macedonia 140 214 284 32.7% 1,322 1,510 1,256 ▼16.8%
Bosnia-Hercegovina 19 18 11 ▼38.9% 406 431 469 8.8%
20 countries total 267,785 278,906 292,806 5.0% 745,477 757,979 755,813 ▼0.3%
China 756,150 867,642 962,445 10.9% 2,608,896 3,037,895 3,505,893 15.4%
Japan 2,409,700 2,293,911 2,318,996 1.1% 85,408 101,310 104,740 3.4%
India 172,241 145,132 132,778 ▼8.5% 110,561 92,235 70,405 ▼23.7%
South Korea 15,771 12,863 13,304 3.4% 35,172 47,898 61,256 27.9%
Indonesia 603,240 655,003 613,465 ▼6.3% 1,907 1,972 1,537 ▼22.1%
Australia 192,433 191,926 183,493 ▼4.4% 92,668 91,136 86,906 ▼4.6%
Thailand 533,145 464,464 338,767 ▼27.1% 1,261 1,180 957 ▼18.9%
Malaysia 303,644 296,750 306,802 3.4% 15,446 13,726 11,728 ▼14.6%
Taiwan 130,526 132,514 145,086 9.5% 22,581 19,069 25,006 31.1%
Philippines 66,012 76,426 107,341 40.5% 227 284 884 3.1-fold
Kazakhstan 9,114 13,369 13,337 ▼0.2% 3,328 7,397 9,881 33.6%
Pakistan 46,672 39,614 43,376 9.5% - - - -
Vietnam 25,559 34,697 43,961 26.7% 32 7 - ▼100.0%
New Zealand 22,815 25,013 26,004 4.0% 6,395 8,225 8,934 8.6%
Singapore 5,747 5,462 9,622 76.2% 6,492 5,809 5,267 ▼9.3%
Sri Lanka 5,428 3,118 2,977 ▼4.5% 314 200 151 ▼24.5%
Brunei 4,641 4,588 4,396 ▼4.2% 319 483 1,206 2.5-fold
17 countries total 5,302,838 5,262,492 5,266,150 0.1% 2,991,007 3,428,826 3,894,751 13.6%
South Africa 121,276 128,898 129,141 0.2% 113,303 117,861 113,048 ▼4.1%
Algeria 36,705 33,590 24,903 ▼25.9% 37,266 65,411 57,778 ▼11.7%
Egypt 16,601 20,668 28,417 37.5% 8,912 5,257 10,348 96.8%
Morocco 4,758 3,832 5,138 34.1% 11,448 9,965 6,557 ▼34.2%
Tunisia 883 1,859 2,573 38.4% 7,986 6,714 5,039 ▼24.9%
Kenya 3,062 3,415 4,751 39.1% 334 367 507 38.1%
Six countries total 183,285 192,262 194,923 1.4% 179,249 205,575 193,277 ▼6.0%
Iran - - - - 740 139 201 44.6%
Israel 20,650 23,538 28,529 21.2% 30,416 31,610 32,553 3.0%
GCC (six countries) 531,845 671,656 645,996 ▼3.8% 13,706 16,616 17,447 5.0%
Eight countries total 552,495 695,194 674,525 ▼3.0% 44,862 48,365 50,201 3.8%
World 83 countries total 9,474,916 9,814,984 9,997,759 1.9% 9,018,504 9,405,849 9,885,160 5.1%
Central & Eastern
Europe
Western Europe
Middle East
Asia-Pacific
Africa
South America
North America
Region Country
Toyota Group *1 VW Group *2
���������� ��� ���� ��������
����� ����� !"���
FOURIN Asia Automotive Intelligence
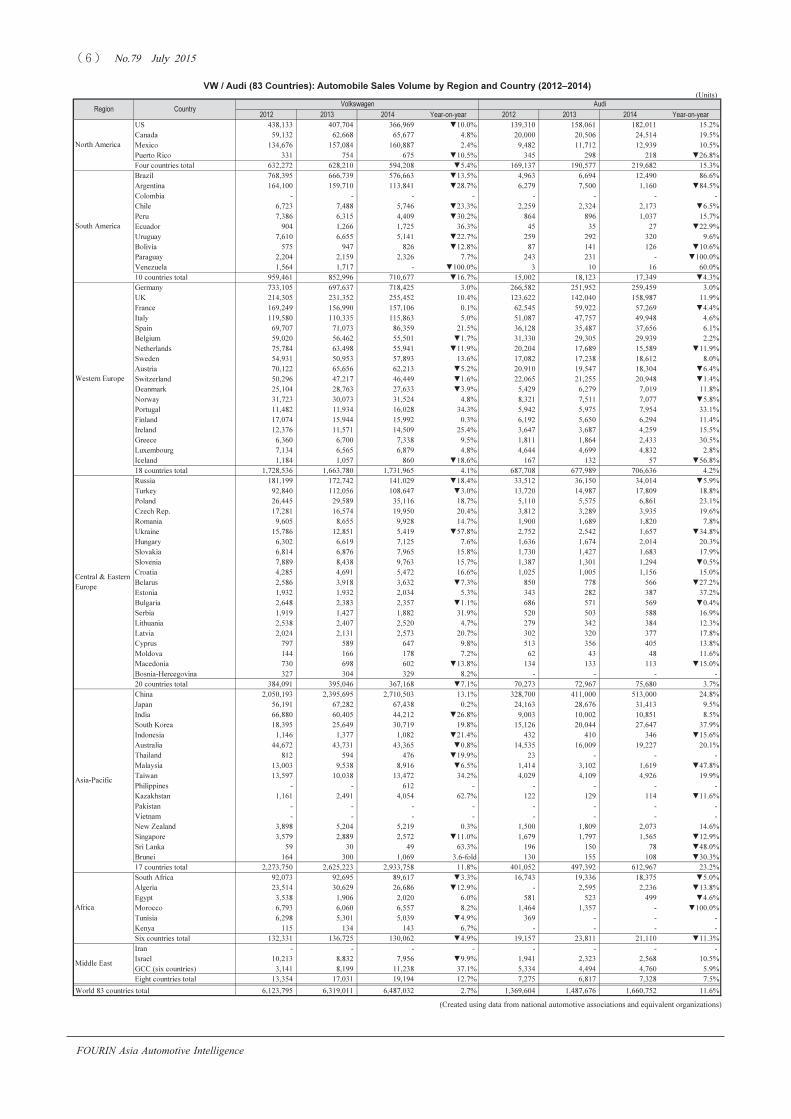
VW / Audi (83 Countries): Automobile Sales Volume by Region and Country (2012–2014)� �
(Created using data from national automotive associations and equivalent organizations)
(Units)
2012 2013 2014 Year-on-year 2012 2013 2014 Year-on-year
US 438,133 407,704 366,969 ▼10.0% 139,310 158,061 182,011 15.2%
Canada 59,132 62,668 65,677 4.8% 20,000 20,506 24,514 19.5%
Mexico 134,676 157,084 160,887 2.4% 9,482 11,712 12,939 10.5%
Puerto Rico 331 754 675 ▼10.5% 345 298 218 ▼26.8%
Four countries total 632,272 628,210 594,208 ▼5.4% 169,137 190,577 219,682 15.3%
Brazil 768,395 666,739 576,663 ▼13.5% 4,963 6,694 12,490 86.6%
Argentina 164,100 159,710 113,841 ▼28.7% 6,279 7,500 1,160 ▼84.5%
Colombia - - - - - - - -
Chile 6,723 7,488 5,746 ▼23.3% 2,259 2,324 2,173 ▼6.5%
Peru 7,386 6,315 4,409 ▼30.2% 864 896 1,037 15.7%
Ecuador 904 1,266 1,725 36.3% 45 35 27 ▼22.9%
Uruguay 7,610 6,655 5,141 ▼22.7% 259 292 320 9.6%
Bolivia 575 947 826 ▼12.8% 87 141 126 ▼10.6%
Paraguay 2,204 2,159 2,326 7.7% 243 231 - ▼100.0%
Venezuela 1,564 1,717 - ▼100.0% 3 10 16 60.0%
10 countries total 959,461 852,996 710,677 ▼16.7% 15,002 18,123 17,349 ▼4.3%
Germany 733,105 697,637 718,425 3.0% 266,582 251,952 259,459 3.0%
UK 214,305 231,352 255,452 10.4% 123,622 142,040 158,987 11.9%
France 169,249 156,990 157,106 0.1% 62,545 59,922 57,269 ▼4.4%
Italy 119,580 110,335 115,863 5.0% 51,087 47,757 49,948 4.6%
Spain 69,707 71,073 86,359 21.5% 36,128 35,487 37,656 6.1%
Belgium 59,020 56,462 55,501 ▼1.7% 31,330 29,305 29,939 2.2%
Netherlands 75,784 63,498 55,941 ▼11.9% 20,204 17,689 15,589 ▼11.9%
Sweden 54,931 50,953 57,893 13.6% 17,082 17,238 18,612 8.0%
Austria 70,122 65,656 62,213 ▼5.2% 20,910 19,547 18,304 ▼6.4%
Switzerland 50,296 47,217 46,449 ▼1.6% 22,065 21,255 20,948 ▼1.4%
Deanmark 25,104 28,763 27,633 ▼3.9% 5,429 6,279 7,019 11.8%
Norway 31,723 30,073 31,524 4.8% 8,321 7,511 7,077 ▼5.8%
Portugal 11,482 11,934 16,028 34.3% 5,942 5,975 7,954 33.1%
Finland 17,074 15,944 15,992 0.3% 6,192 5,650 6,294 11.4%
Ireland 12,376 11,571 14,509 25.4% 3,647 3,687 4,259 15.5%
Greece 6,360 6,700 7,338 9.5% 1,811 1,864 2,433 30.5%
Luxembourg 7,134 6,565 6,879 4.8% 4,644 4,699 4,832 2.8%
Iceland 1,184 1,057 860 ▼18.6% 167 132 57 ▼56.8%
18 countries total 1,728,536 1,663,780 1,731,965 4.1% 687,708 677,989 706,636 4.2%
Russia 181,199 172,742 141,029 ▼18.4% 33,512 36,150 34,014 ▼5.9%
Turkey 92,840 112,056 108,647 ▼3.0% 13,720 14,987 17,809 18.8%
Poland 26,445 29,589 35,116 18.7% 5,110 5,575 6,861 23.1%
Czech Rep. 17,281 16,574 19,950 20.4% 3,812 3,289 3,935 19.6%
Romania 9,605 8,655 9,928 14.7% 1,900 1,689 1,820 7.8%
Ukraine 15,786 12,851 5,419 ▼57.8% 2,752 2,542 1,657 ▼34.8%
Hungary 6,302 6,619 7,125 7.6% 1,636 1,674 2,014 20.3%
Slovakia 6,814 6,876 7,965 15.8% 1,730 1,427 1,683 17.9%
Slovenia 7,889 8,438 9,763 15.7% 1,387 1,301 1,294 ▼0.5%
Croatia 4,285 4,691 5,472 16.6% 1,025 1,005 1,156 15.0%
Belarus 2,586 3,918 3,632 ▼7.3% 850 778 566 ▼27.2%
Estonia 1,932 1,932 2,034 5.3% 343 282 387 37.2%
Bulgaria 2,648 2,383 2,357 ▼1.1% 686 571 569 ▼0.4%
Serbia 1,919 1,427 1,882 31.9% 520 503 588 16.9%
Lithuania 2,538 2,407 2,520 4.7% 279 342 384 12.3%
Latvia 2,024 2,131 2,573 20.7% 302 320 377 17.8%
Cyprus 797 589 647 9.8% 513 356 405 13.8%
Moldova 144 166 178 7.2% 62 43 48 11.6%
Macedonia 730 698 602 ▼13.8% 134 133 113 ▼15.0%
Bosnia-Hercegovina 327 304 329 8.2% - - - -
20 countries total 384,091 395,046 367,168 ▼7.1% 70,273 72,967 75,680 3.7%
China 2,050,193 2,395,695 2,710,503 13.1% 328,700 411,000 513,000 24.8%
Japan 56,191 67,282 67,438 0.2% 24,163 28,676 31,413 9.5%
India 66,880 60,405 44,212 ▼26.8% 9,003 10,002 10,851 8.5%
South Korea 18,395 25,649 30,719 19.8% 15,126 20,044 27,647 37.9%
Indonesia 1,146 1,377 1,082 ▼21.4% 432 410 346 ▼15.6%
Australia 44,672 43,731 43,365 ▼0.8% 14,535 16,009 19,227 20.1%
Thailand 812 594 476 ▼19.9% 23 - - -
Malaysia 13,003 9,538 8,916 ▼6.5% 1,414 3,102 1,619 ▼47.8%
Taiwan 13,597 10,038 13,472 34.2% 4,029 4,109 4,926 19.9%
Philippines - - 612 - - - - -
Kazakhstan 1,161 2,491 4,054 62.7% 122 129 114 ▼11.6%
Pakistan - - - - - - - -
Vietnam - - - - - - - -
New Zealand 3,898 5,204 5,219 0.3% 1,500 1,809 2,073 14.6%
Singapore 3,579 2,889 2,572 ▼11.0% 1,679 1,797 1,565 ▼12.9%
Sri Lanka 59 30 49 63.3% 196 150 78 ▼48.0%
Brunei 164 300 1,069 3.6-fold 130 155 108 ▼30.3%
17 countries total 2,273,750 2,625,223 2,933,758 11.8% 401,052 497,392 612,967 23.2%
South Africa 92,073 92,695 89,617 ▼3.3% 16,743 19,336 18,375 ▼5.0%
Algeria 23,514 30,629 26,686 ▼12.9% - 2,595 2,236 ▼13.8%
Egypt 3,538 1,906 2,020 6.0% 581 523 499 ▼4.6%
Morocco 6,793 6,060 6,557 8.2% 1,464 1,357 - ▼100.0%
Tunisia 6,298 5,301 5,039 ▼4.9% 369 - - -
Kenya 115 134 143 6.7% - - - -
Six countries total 132,331 136,725 130,062 ▼4.9% 19,157 23,811 21,110 ▼11.3%
Iran - - - - - - - -
Israel 10,213 8,832 7,956 ▼9.9% 1,941 2,323 2,568 10.5%
GCC (six countries) 3,141 8,199 11,238 37.1% 5,334 4,494 4,760 5.9%
Eight countries total 13,354 17,031 19,194 12.7% 7,275 6,817 7,328 7.5%
World 83 countries total 6,123,795 6,319,011 6,487,032 2.7% 1,369,604 1,487,676 1,660,752 11.6%
Region Country
Volkswagen Audi
North America
South America
Central & Eastern
Europe
Western Europe
Africa
Asia-Pacific
Middle East
���������� ��� ���� ��������
����� ����� !"���
FOURIN Asia Automotive Intelligence
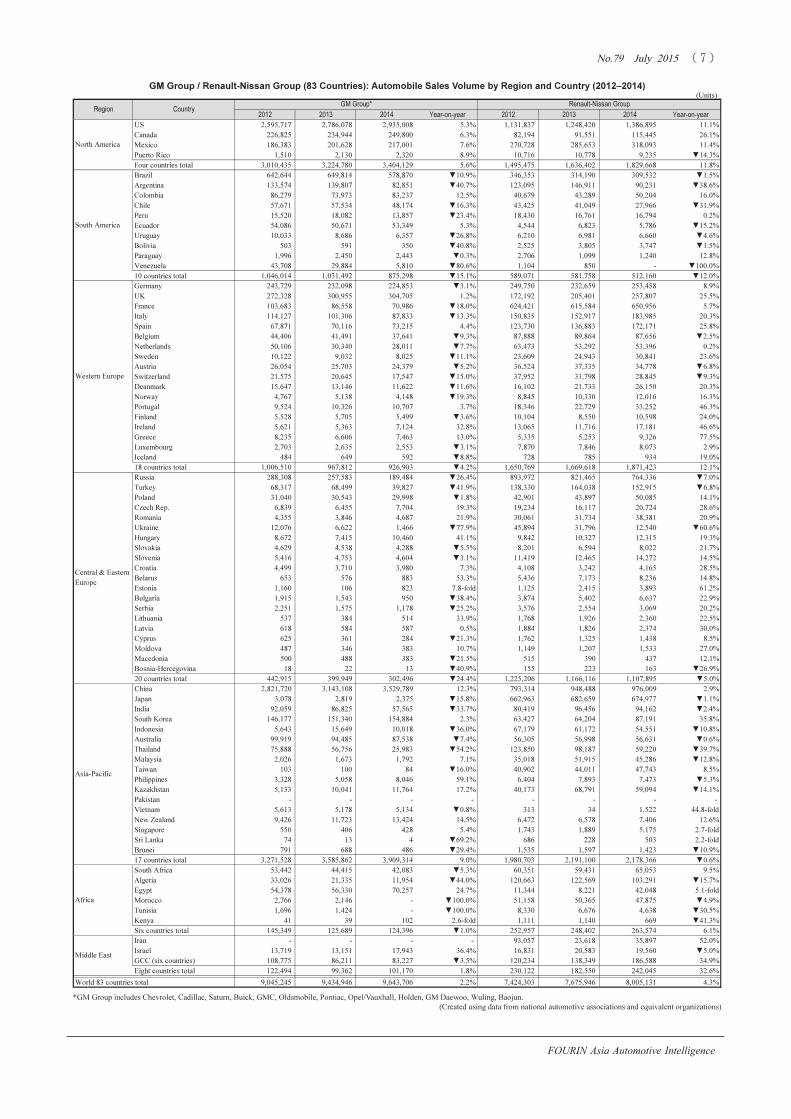
GM Group / Renault-Nissan Group (83 Countries): Automobile Sales Volume by Region and Country (2012–2014)� �
*GM Group includes Chevrolet, Cadillac, Saturn, Buick, GMC, Oldsmobile, Pontiac, Opel/Vauxhall, Holden, GM Daewoo, Wuling, Baojun.
(Created using data from national automotive associations and equivalent organizations)
(Units)
2012 2013 2014 Year-on-year 2012 2013 2014 Year-on-year
US 2,595,717 2,786,078 2,935,008 5.3% 1,131,837 1,248,420 1,386,895 11.1%
Canada 226,825 234,944 249,800 6.3% 82,194 91,551 115,445 26.1%
Mexico 186,383 201,628 217,001 7.6% 270,728 285,653 318,093 11.4%
Puerto Rico 1,510 2,130 2,320 8.9% 10,716 10,778 9,235 ▼14.3%
Four countries total 3,010,435 3,224,780 3,404,129 5.6% 1,495,475 1,636,402 1,829,668 11.8%
Brazil 642,644 649,814 578,870 ▼10.9% 346,353 314,190 309,532 ▼1.5%
Argentina 133,574 139,807 82,851 ▼40.7% 123,095 146,911 90,231 ▼38.6%
Colombia 86,279 73,973 83,237 12.5% 40,679 43,289 50,204 16.0%
Chile 57,671 57,534 48,174 ▼16.3% 43,425 41,049 27,966 ▼31.9%
Peru 15,520 18,082 13,857 ▼23.4% 18,430 16,761 16,794 0.2%
Ecuador 54,086 50,671 53,349 5.3% 4,544 6,823 5,786 ▼15.2%
Uruguay 10,033 8,686 6,357 ▼26.8% 6,210 6,981 6,660 ▼4.6%
Bolivia 503 591 350 ▼40.8% 2,525 3,805 3,747 ▼1.5%
Paraguay 1,996 2,450 2,443 ▼0.3% 2,706 1,099 1,240 12.8%
Venezuela 43,708 29,884 5,810 ▼80.6% 1,104 850 - ▼100.0%
10 countries total 1,046,014 1,031,492 875,298 ▼15.1% 589,071 581,758 512,160 ▼12.0%
Germany 243,729 232,098 224,853 ▼3.1% 249,750 232,659 253,458 8.9%
UK 272,328 300,955 304,705 1.2% 172,192 205,401 257,807 25.5%
France 103,683 86,558 70,986 ▼18.0% 624,421 615,584 650,956 5.7%
Italy 114,127 101,306 87,833 ▼13.3% 150,835 152,917 183,985 20.3%
Spain 67,871 70,116 73,215 4.4% 123,730 136,883 172,171 25.8%
Belgium 44,406 41,491 37,641 ▼9.3% 87,888 89,864 87,656 ▼2.5%
Netherlands 50,106 30,340 28,011 ▼7.7% 63,473 53,292 53,396 0.2%
Sweden 10,122 9,032 8,025 ▼11.1% 23,609 24,943 30,841 23.6%
Austria 26,054 25,703 24,379 ▼5.2% 36,524 37,335 34,778 ▼6.8%
Switzerland 21,575 20,645 17,547 ▼15.0% 37,952 31,798 28,845 ▼9.3%
Deanmark 15,647 13,146 11,622 ▼11.6% 16,102 21,733 26,150 20.3%
Norway 4,767 5,138 4,148 ▼19.3% 8,845 10,330 12,016 16.3%
Portugal 9,524 10,326 10,707 3.7% 18,346 22,729 33,252 46.3%
Finland 5,528 5,705 5,499 ▼3.6% 10,104 8,550 10,598 24.0%
Ireland 5,621 5,363 7,124 32.8% 13,065 11,716 17,181 46.6%
Greece 8,235 6,606 7,463 13.0% 5,335 5,253 9,326 77.5%
Luxembourg 2,703 2,635 2,553 ▼3.1% 7,870 7,846 8,073 2.9%
Iceland 484 649 592 ▼8.8% 728 785 934 19.0%
18 countries total 1,006,510 967,812 926,903 ▼4.2% 1,650,769 1,669,618 1,871,423 12.1%
Russia 288,308 257,583 189,484 ▼26.4% 893,972 821,465 764,336 ▼7.0%
Turkey 68,317 68,499 39,827 ▼41.9% 138,330 164,038 152,915 ▼6.8%
Poland 31,040 30,543 29,998 ▼1.8% 42,901 43,897 50,085 14.1%
Czech Rep. 6,839 6,455 7,704 19.3% 19,234 16,117 20,724 28.6%
Romania 4,355 3,846 4,687 21.9% 30,061 31,734 38,381 20.9%
Ukraine 12,076 6,622 1,466 ▼77.9% 45,894 31,796 12,540 ▼60.6%
Hungary 8,672 7,415 10,460 41.1% 9,842 10,327 12,315 19.3%
Slovakia 4,629 4,538 4,288 ▼5.5% 8,201 6,594 8,022 21.7%
Slovenia 5,416 4,753 4,604 ▼3.1% 11,419 12,465 14,272 14.5%
Croatia 4,499 3,710 3,980 7.3% 4,108 3,242 4,165 28.5%
Belarus 653 576 883 53.3% 5,436 7,173 8,236 14.8%
Estonia 1,160 106 823 7.8-fold 1,125 2,415 3,893 61.2%
Bulgaria 1,915 1,543 950 ▼38.4% 3,874 5,402 6,637 22.9%
Serbia 2,251 1,575 1,178 ▼25.2% 3,576 2,554 3,069 20.2%
Lithuania 537 384 514 33.9% 1,768 1,926 2,360 22.5%
Latvia 618 584 587 0.5% 1,884 1,826 2,374 30.0%
Cyprus 625 361 284 ▼21.3% 1,762 1,325 1,438 8.5%
Moldova 487 346 383 10.7% 1,149 1,207 1,533 27.0%
Macedonia 500 488 383 ▼21.5% 515 390 437 12.1%
Bosnia-Hercegovina 18 22 13 ▼40.9% 155 223 163 ▼26.9%
20 countries total 442,915 399,949 302,496 ▼24.4% 1,225,206 1,166,116 1,107,895 ▼5.0%
China 2,821,720 3,143,108 3,529,789 12.3% 793,314 948,488 976,009 2.9%
Japan 3,078 2,819 2,375 ▼15.8% 662,963 682,659 674,977 ▼1.1%
India 92,059 86,825 57,565 ▼33.7% 80,419 96,456 94,162 ▼2.4%
South Korea 146,177 151,340 154,884 2.3% 63,427 64,204 87,191 35.8%
Indonesia 5,643 15,649 10,018 ▼36.0% 67,179 61,172 54,551 ▼10.8%
Australia 99,919 94,485 87,538 ▼7.4% 56,305 56,998 56,631 ▼0.6%
Thailand 75,888 56,756 25,983 ▼54.2% 123,850 98,187 59,220 ▼39.7%
Malaysia 2,026 1,673 1,792 7.1% 35,018 51,915 45,286 ▼12.8%
Taiwan 103 100 84 ▼16.0% 40,902 44,011 47,743 8.5%
Philippines 3,328 5,058 8,046 59.1% 6,404 7,893 7,473 ▼5.3%
Kazakhstan 5,133 10,041 11,764 17.2% 40,173 68,791 59,094 ▼14.1%
Pakistan - - - - - - - -
Vietnam 5,613 5,178 5,134 ▼0.8% 313 34 1,522 44.8-fold
New Zealand 9,426 11,723 13,424 14.5% 6,472 6,578 7,406 12.6%
Singapore 550 406 428 5.4% 1,743 1,889 5,175 2.7-fold
Sri Lanka 74 13 4 ▼69.2% 686 228 503 2.2-fold
Brunei 791 688 486 ▼29.4% 1,535 1,597 1,423 ▼10.9%
17 countries total 3,271,528 3,585,862 3,909,314 9.0% 1,980,703 2,191,100 2,178,366 ▼0.6%
South Africa 53,442 44,415 42,083 ▼5.3% 60,351 59,431 65,053 9.5%
Algeria 33,026 21,335 11,954 ▼44.0% 120,663 122,569 103,291 ▼15.7%
Egypt 54,378 56,330 70,257 24.7% 11,344 8,221 42,048 5.1-fold
Morocco 2,766 2,146 - ▼100.0% 51,158 50,365 47,875 ▼4.9%
Tunisia 1,696 1,424 - ▼100.0% 8,330 6,676 4,638 ▼30.5%
Kenya 41 39 102 2.6-fold 1,111 1,140 669 ▼41.3%
Six countries total 145,349 125,689 124,396 ▼1.0% 252,957 248,402 263,574 6.1%
Iran - - - - 93,057 23,618 35,897 52.0%
Israel 13,719 13,151 17,943 36.4% 16,831 20,583 19,560 ▼5.0%
GCC (six countries) 108,775 86,211 83,227 ▼3.5% 120,234 138,349 186,588 34.9%
Eight countries total 122,494 99,362 101,170 1.8% 230,122 182,550 242,045 32.6%
World 83 countries total 9,045,245 9,434,946 9,643,706 2.2% 7,424,303 7,675,946 8,005,131 4.3%
Region Country
GM Group* Renault-Nissan Group
North America
South America
Central & Eastern
Europe
Western Europe
Africa
Asia-Pacific
Middle East

���������� ��� ���� ��������
����� ����� !"���
FOURIN Asia Automotive Intelligence
Renault + AvtoVAZ / Nissan (83 Countries): Automobile Sales Volume by Region and Country (2012–2014)� �
*1 Renault includes Renault, Dacia, Renault Samsung. *2 Nissan includes Nissan, Datsun. (Created using data from national automotive associations and equivalent organizations)
(Units)
2012 2013 2014 Year-on-year 2012 2013 2014 Year-on-year
US - - - - 1,131,837 1,248,420 1,386,895 11.1%
Canada - - - - 82,194 91,551 115,445 26.1%
Mexico 25,030 21,187 24,889 17.5% 245,698 264,466 293,204 10.9%
Puerto Rico - - - - 10,716 10,778 9,235 ▼14.3%
Four countries total 25,030 21,187 24,889 17.5% 1,470,445 1,615,215 1,804,779 11.7%
Brazil 241,573 236,364 237,168 0.3% 104,780 77,826 72,364 ▼7.0%
Argentina 119,002 141,208 84,315 ▼40.3% 4,093 5,703 5,916 3.7%
Colombia 40,679 43,289 50,204 16.0% - - - -
Chile 9,301 11,047 7,267 ▼34.2% 34,124 30,002 20,699 ▼31.0%
Peru 3,221 4,085 4,315 5.6% 15,209 12,676 12,479 ▼1.6%
Ecuador 1,711 196 1,084 5.5-fold 2,833 6,627 4,702 ▼29.0%
Uruguay 2,382 2,746 3,187 16.1% 3,828 4,235 3,473 ▼18.0%
Bolivia 225 905 1,099 21.4% 2,300 2,900 2,648 ▼8.7%
Paraguay 378 431 - ▼100.0% 2,328 668 1,240 85.6%
Venezuela 1,093 668 - ▼100.0% 11 182 - ▼100.0%
10 countries total 419,565 440,939 388,639 ▼11.9% 169,506 140,819 123,521 ▼12.3%
Germany 171,049 162,537 173,290 6.6% 78,701 70,122 80,168 14.3%
UK 55,685 76,414 108,440 41.9% 116,507 128,987 149,367 15.8%
France 545,609 543,793 574,238 5.6% 78,812 71,791 76,718 6.9%
Italy 96,572 101,602 131,014 28.9% 54,263 51,315 52,971 3.2%
Spain 82,803 97,591 127,178 30.3% 40,927 39,292 44,993 14.5%
Belgium 68,854 71,695 70,587 ▼1.5% 19,034 18,169 17,069 ▼6.1%
Netherlands 53,241 45,786 41,021 ▼10.4% 10,232 7,506 12,375 64.9%
Sweden 14,298 15,843 19,928 25.8% 9,311 9,100 10,913 19.9%
Austria 27,047 27,843 27,532 ▼1.1% 9,477 9,492 7,246 ▼23.7%
Switzerland 27,300 22,783 20,349 ▼10.7% 10,652 9,015 8,496 ▼5.8%
Deanmark 10,524 14,391 17,115 18.9% 5,578 7,342 9,035 23.1%
Norway 1,184 1,475 2,247 52.3% 7,661 8,855 9,769 10.3%
Portugal 14,106 18,004 25,607 42.2% 4,240 4,725 7,645 61.8%
Finland 2,473 2,165 3,636 67.9% 7,631 6,385 6,962 9.0%
Ireland 6,521 5,769 9,188 59.3% 6,544 5,947 7,993 34.4%
Greece 1,489 1,520 3,007 97.8% 3,846 3,733 6,319 69.3%
Luxembourg 6,369 6,000 6,665 11.1% 1,501 1,846 1,408 ▼23.7%
Iceland 263 453 578 27.6% 465 332 356 7.2%
18 countries total 1,185,387 1,215,664 1,361,620 12.0% 465,382 453,954 509,803 12.3%
Russia 731,016 666,469 581,929 ▼12.7% 162,956 154,996 182,407 17.7%
Turkey 118,169 144,706 133,212 ▼7.9% 20,161 19,332 19,703 1.9%
Poland 28,487 32,326 37,760 16.8% 14,414 11,571 12,325 6.5%
Czech Rep. 15,877 13,148 17,517 33.2% 3,357 2,969 3,207 8.0%
Romania 28,213 29,984 36,366 21.3% 1,848 1,750 2,015 15.1%
Ukraine 33,285 20,469 7,787 ▼62.0% 12,609 11,327 4,753 ▼58.0%
Hungary 7,015 7,345 8,890 21.0% 2,827 2,982 3,425 14.9%
Slovakia 6,284 5,601 6,639 18.5% 1,917 993 1,383 39.3%
Slovenia 9,902 10,950 12,276 12.1% 1,517 1,515 1,996 31.7%
Croatia 3,198 2,479 3,179 28.2% 910 763 986 29.2%
Belarus 5,018 6,280 6,369 1.4% 418 893 1,867 2.1-fold
Estonia - 1,928 2,594 34.5% 1,125 487 1,299 2.7-fold
Bulgaria 3,379 4,265 5,184 21.5% 495 1,137 1,453 27.8%
Serbia 3,147 2,182 2,689 23.2% 429 372 380 2.2%
Lithuania 877 1,100 1,186 7.8% 891 826 1,174 42.1%
Latvia 1,122 1,157 1,423 23.0% 762 669 951 42.2%
Cyprus 354 434 428 ▼1.4% 1,408 891 1,010 13.4%
Moldova 952 1,093 1,403 28.4% 197 114 130 14.0%
Macedonia 479 348 386 10.9% 36 42 51 21.4%
Bosnia-Hercegovina 148 210 155 ▼26.2% 7 13 8 ▼38.5%
20 countries total 996,922 952,474 867,372 ▼8.9% 228,284 213,642 240,523 12.6%
China - - - - 793,314 948,488 976,009 2.9%
Japan 3,108 3,772 4,662 23.6% 659,855 678,887 670,315 ▼1.3%
India 35,157 64,368 44,849 ▼30.3% 45,262 32,088 49,313 53.7%
South Korea 59,926 60,027 80,003 33.3% 3,501 4,177 7,188 72.1%
Indonesia - 37 234 6.3-fold 67,179 61,135 54,317 ▼11.2%
Australia 3,792 4,717 6,621 40.4% 52,513 52,281 50,010 ▼4.3%
Thailand - - - - 123,850 98,187 59,220 ▼39.7%
Malaysia 52 40 228 5.7-fold 34,966 51,875 45,058 ▼13.1%
Taiwan 1 1 1 0.0% 40,901 44,010 47,742 8.5%
Philippines - - - - 6,404 7,893 7,473 ▼5.3%
Kazakhstan 36,324 62,399 53,335 ▼14.5% 3,849 6,392 5,759 ▼9.9%
Pakistan - - - - - - - -
Vietnam - - - - 313 34 1,522 44.8-fold
New Zealand 113 175 296 69.1% 6,359 6,403 7,110 11.0%
Singapore 143 144 195 35.4% 1,600 1,745 4,980 2.9-fold
Sri Lanka - 1 - ▼100.0% 686 227 503 2.2-fold
Brunei 13 14 - ▼100.0% 1,522 1,583 1,423 ▼10.1%
17 countries total 138,629 195,695 190,424 ▼2.7% 1,842,074 1,995,405 1,987,942 ▼0.4%
South Africa 10,424 12,280 18,686 52.2% 49,927 47,151 46,367 ▼1.7%
Algeria 113,657 111,378 91,800 ▼17.6% 7,006 11,191 11,491 2.7%
Egypt 11,344 8,221 11,506 40.0% - - 30,542 -
Morocco 47,709 47,030 45,209 ▼3.9% 3,449 3,335 2,666 ▼20.1%
Tunisia 7,866 6,676 4,638 ▼30.5% 464 - - -
Kenya - - - - 1,111 1,140 669 ▼41.3%
Six countries total 191,000 185,585 171,839 ▼7.4% 61,957 62,817 91,735 46.0%
Iran 90,310 21,892 33,404 52.6% 2,747 1,726 2,493 44.4%
Israel 6,645 9,930 9,436 ▼5.0% 10,186 10,653 10,120 ▼5.0%
GCC (six countries) 9,926 9,622 13,409 39.4% 110,308 128,727 173,183 34.5%
Eight countries total 106,881 41,444 56,249 35.7% 123,241 141,106 185,796 31.7%
World 83 countries total 3,063,414 3,052,988 3,061,032 2.6% 4,360,889 4,622,958 4,944,099 6.9%
Region Country
Renault *1 / AvtoVAZ Nissan (Nissan *2 / Infiniti / Venucia)
North America
South America
Central & Eastern
Europe
Western Europe
Africa
Asia-Pacific
Middle East

���������� ��� ���� ��������
����� ����� !"���
FOURIN Asia Automotive Intelligence
Hyundai Group / Ford Group (83 Countries): Automobile Sales Volume by Region and Country (2012–2014)
*Ford includes Ford, Lincoln, Mercury. (Created using data from national automotive associations and equivalent organizations)
(Units)
2012 2013 2014 Year-on-year 2012 2013 2014 Year-on-year
US 1,260,606 1,255,962 1,305,952 4.0% 2,250,165 2,493,918 2,480,636 ▼0.5%
Canada 214,083 209,549 208,111 ▼0.7% 276,068 283,588 291,842 2.9%
Mexico - - 12,064 - 86,517 89,110 82,580 ▼7.3%
Puerto Rico 18,622 20,065 16,995 ▼15.3% 11,017 9,215 6,689 ▼27.4%
Four countries total 1,493,311 1,485,576 1,543,122 3.9% 2,623,767 2,875,831 2,861,747 ▼0.5%
Brazil 109,840 213,212 237,845 11.6% 345,467 355,471 327,791 ▼7.8%
Argentina 5,576 7,284 3,291 ▼54.8% 101,617 119,036 94,859 ▼20.3%
Colombia - - - - 102 - - -
Chile 64,039 66,866 64,234 ▼3.9% 11,032 14,737 13,606 ▼7.7%
Peru 43,101 46,587 47,302 1.5% 1,199 2,258 1,379 ▼38.9%
Ecuador 16,111 23,185 15,576 ▼32.8% 3,000 3,271 2,948 ▼9.9%
Uruguay 3,606 3,983 4,689 17.7% 1,904 1,615 1,548 ▼4.1%
Bolivia 1,251 2,296 2,181 ▼5.0% 328 1,154 856 ▼25.8%
Paraguay 8,499 9,086 10,926 20.3% 243 558 608 9.0%
Venezuela 10,618 5,395 151 ▼97.2% 23,447 13,695 4,735 ▼65.4%
10 countries total 262,641 377,894 386,195 2.2% 488,339 511,795 448,330 ▼12.4%
Germany 156,213 157,620 153,972 ▼2.3% 230,882 223,716 238,732 6.7%
UK 141,293 149,248 159,684 7.0% 347,168 381,686 411,014 7.7%
France 62,304 59,894 45,739 ▼23.6% 110,946 93,399 95,362 2.1%
Italy 70,698 68,372 74,587 9.1% 105,091 93,414 99,892 6.9%
Spain 47,827 52,098 66,506 27.7% 59,588 55,841 70,635 26.5%
Belgium 26,831 32,054 33,059 3.1% 32,569 30,787 29,950 ▼2.7%
Netherlands 49,159 34,709 25,602 ▼26.2% 40,449 36,329 26,673 ▼26.6%
Sweden 28,027 25,375 26,562 4.7% 17,405 14,738 16,565 12.4%
Austria 32,078 30,651 28,434 ▼7.2% 25,531 23,712 23,612 ▼0.4%
Switzerland 16,279 14,241 16,509 15.9% 20,990 17,678 16,461 ▼6.9%
Deanmark 20,172 19,234 19,240 0.0% 16,044 18,466 20,022 8.4%
Norway 10,833 9,443 6,791 ▼28.1% 13,801 12,805 11,891 ▼7.1%
Portugal 3,094 2,585 3,721 43.9% 5,589 5,119 7,298 42.6%
Finland 10,777 9,615 8,197 ▼14.7% 11,002 10,196 10,105 ▼0.9%
Ireland 8,518 9,754 13,145 34.8% 10,841 10,160 13,778 35.6%
Greece 4,134 4,945 5,161 4.4% 3,348 3,168 4,368 37.9%
Luxembourg 2,240 2,039 2,348 15.2% 2,831 2,383 2,692 13.0%
Iceland 1,179 972 1,203 23.8% 551 393 421 7.1%
18 countries total 691,656 682,849 690,460 1.1% 1,054,626 1,033,990 1,099,471 6.3%
Russia 364,069 380,352 377,297 ▼0.8% 145,930 125,600 74,210 ▼40.9%
Turkey 58,834 63,250 59,549 ▼5.9% 112,278 114,073 93,998 ▼17.6%
Poland 30,747 34,378 32,552 ▼5.3% 19,836 22,665 27,470 21.2%
Czech Rep. 23,787 22,624 25,663 13.4% 14,512 11,016 14,405 30.8%
Romania 4,310 3,451 3,890 12.7% 6,342 5,080 6,978 37.4%
Ukraine 38,979 31,225 9,281 ▼70.3% 10,238 10,721 4,506 ▼58.0%
Hungary 3,032 3,104 4,069 31.1% 7,250 7,886 10,887 38.1%
Slovakia 10,084 10,317 11,124 7.8% 2,389 2,475 2,514 1.6%
Slovenia 5,003 5,311 3,436 ▼35.3% 2,823 2,949 3,081 4.5%
Croatia 3,733 3,499 2,844 ▼18.7% 1,402 1,204 1,754 45.7%
Belarus 1,782 3,572 3,360 ▼5.9% 656 778 521 ▼33.0%
Estonia 1,824 14 1,709 122.1-fold 1,100 1,858 1,100 ▼40.8%
Bulgaria 1,215 1,473 1,066 ▼27.6% 1,592 1,226 1,971 60.8%
Serbia 2,679 2,713 2,456 ▼9.5% 1,763 1,116 1,054 ▼5.6%
Lithuania 1,078 1,082 981 ▼9.3% 555 570 753 32.1%
Latvia 854 1,053 883 ▼16.1% 702 672 522 ▼22.3%
Cyprus 1,895 917 1,017 10.9% 1,622 1,024 989 ▼3.4%
Moldova 255 428 512 19.6% 139 115 99 ▼13.9%
Macedonia 407 233 299 28.3% 241 347 374 7.8%
Bosnia-Hercegovina - - 12 - 54 80 13 ▼83.8%
20 countries total 554,567 568,996 542,000 ▼4.7% 331,424 311,455 247,199 ▼20.6%
China 1,340,038 1,577,474 1,766,054 12.0% 418,501 678,951 801,603 18.1%
Japan 110 70 92 31.4% 3,952 4,189 4,783 14.2%
India 391,276 380,002 411,471 8.3% 87,600 80,431 77,140 ▼4.1%
South Korea 1,149,837 1,098,865 1,150,391 4.7% 5,126 7,214 8,718 20.8%
Indonesia 20,035 15,990 11,223 ▼29.8% 11,958 9,907 12,008 21.2%
Australia 116,366 122,813 123,672 0.7% 90,408 87,236 79,703 ▼8.6%
Thailand 6,280 5,034 4,764 ▼5.4% 54,865 51,223 38,087 ▼25.6%
Malaysia 8,975 10,943 13,423 22.7% 7,108 10,660 13,938 30.8%
Taiwan 16,524 15,150 16,891 11.5% 18,466 24,107 24,712 2.5%
Philippines 29,523 27,983 31,195 11.5% 9,398 13,286 20,341 53.1%
Kazakhstan 12,817 25,203 32,190 27.7% 269 407 355 ▼12.8%
Pakistan - 341 539 58.1% - - - -
Vietnam 17,640 17,503 23,394 33.7% 4,790 8,166 13,988 71.3%
New Zealand 10,545 10,566 11,152 5.5% 11,051 12,780 13,972 9.3%
Singapore 1,823 1,163 2,397 2.1-fold 350 207 206 ▼0.5%
Sri Lanka 2,528 679 998 47.0% 101 50 96 92.0%
Brunei 5,053 3,998 4,464 11.7% 403 606 250 ▼58.7%
17 countries total 3,129,370 3,313,777 3,604,310 8.8% 724,346 989,420 1,109,900 12.2%
South Africa - 72,355 65,193 ▼9.9% 42,436 58,649 70,888 20.9%
Algeria 72,396 55,197 64,533 16.9% 7,897 8,445 5,039 ▼40.3%
Egypt 62,228 43,136 62,262 44.3% 867 559 938 67.8%
Morocco 13,042 10,230 9,056 ▼11.5% 10,030 10,305 11,194 8.6%
Tunisia 3,867 4,392 7,060 60.7% 2,918 2,340 2,527 8.0%
Kenya 180 54 168 3.1-fold 352 543 579 6.6%
Six countries total 151,713 185,364 208,272 12.4% 64,500 80,841 91,165 12.8%
Iran 281,711 218,979 250,526 14.4% - - - -
Israel 50,752 53,064 57,741 8.8% 20,265 12,416 8,122 ▼34.6%
GCC (six countries) 265,080 280,209 309,434 10.4% 65,030 71,608 71,254 ▼0.5%
Eight countries total 597,543 552,252 617,701 11.9% 85,295 84,024 79,376 ▼5.5%
World 83 countries total 6,880,801 7,166,708 7,592,060 5.9% 5,372,297 5,887,356 5,937,188 0.8%
Region Country
Hyundai Group (Hyundai / Kia) Ford Group *
North America
South America
Central & Eastern
Europe
Western Europe
Africa
Asia-Pacific
Middle East

���������� ��� ���� ��������
����� ����� !"����
FOURIN Asia Automotive Intelligence
FCA / Fiat Group (83 Countries): Automobile Sales Volume by Region and Country (2012–2014)� �
*Fiat Group includes Fiat, Alfa Romeo, Lancia, Ferrari, Maserati. (Created using data from national automotive associations and equivalent organizations)
(Units)
2012 2013 2014 Year-on-year 2012 2013 2014 Year-on-year
US 1,651,787 1,800,368 2,090,639 16.1% 43,772 43,236 46,212 6.9%
Canada 243,845 260,015 289,988 11.5% 8,474 7,710 8,029 4.1%
Mexico 93,666 87,497 77,025 ▼12.0% 5,131 8,332 8,010 ▼3.9%
Puerto Rico 9,759 8,792 8,130 ▼7.5% 730 500 484 ▼3.2%
Four countries total 1,999,057 2,156,672 2,465,782 14.3% 58,107 59,778 62,735 4.9%
Brazil 838,218 762,980 698,236 ▼8.5% 838,218 762,980 698,236 ▼8.5%
Argentina 85,125 110,111 87,404 ▼20.6% 80,682 104,987 84,832 ▼19.2%
Colombia - - - - - - - -
Chile 12,736 15,323 13,138 ▼14.3% 4,562 6,539 5,645 ▼13.7%
Peru 2,352 2,291 2,446 6.8% 612 587 874 48.9%
Ecuador 415 185 125 ▼32.4% 335 23 102 4.4-fold
Uruguay 3,960 5,274 4,941 ▼6.3% 3,661 5,035 4,714 ▼6.4%
Bolivia 353 516 385 ▼25.4% 55 149 161 8.1%
Paraguay 1,993 1,365 1,354 ▼0.8% 1,427 1,159 973 ▼16.0%
Venezuela 10,473 7,989 1,511 ▼81.1% 1,050 1,929 1 ▼99.9%
10 countries total 955,625 906,034 809,540 ▼10.7% 930,602 883,388 795,538 ▼9.9%
Germany 109,250 98,092 102,429 4.4% 101,292 89,588 89,993 0.5%
UK 72,876 85,550 95,354 11.5% 67,237 80,806 89,463 10.7%
France 97,681 96,339 94,724 ▼1.7% 93,711 94,020 90,875 ▼3.3%
Italy 461,118 412,514 423,691 2.7% 454,559 406,687 412,357 1.4%
Spain 30,015 34,310 46,599 35.8% 28,341 33,028 44,898 35.9%
Belgium 23,313 23,680 21,229 ▼10.4% 22,559 23,033 20,029 ▼13.0%
Netherlands 27,385 19,720 19,945 1.1% 26,523 19,070 18,912 ▼0.8%
Sweden 7,786 8,105 9,629 18.8% 7,233 7,722 8,699 12.7%
Austria 19,765 17,193 16,608 ▼3.4% 18,758 16,279 15,061 ▼7.5%
Switzerland 20,919 18,755 18,011 ▼4.0% 17,852 16,446 16,130 ▼1.9%
Deanmark 9,823 7,948 5,801 ▼27.0% 9,816 7,945 5,767 ▼27.4%
Norway 2,500 1,940 1,513 ▼22.0% 2,033 1,668 1,182 ▼29.1%
Portugal 7,664 8,150 9,343 14.6% 7,481 8,058 9,236 14.6%
Finland 1,695 1,447 538 ▼62.8% 1,438 1,371 431 ▼68.6%
Ireland 1,306 800 1,108 38.5% 1,189 788 1,085 37.7%
Greece 5,511 5,756 5,888 2.3% 5,435 5,735 5,841 1.8%
Luxembourg 2,542 2,554 2,516 ▼1.5% 2,279 2,316 2,172 ▼6.2%
Iceland 52 47 83 76.6% - 21 13 ▼38.1%
18 countries total 901,201 842,900 875,009 3.8% 867,736 814,581 832,144 2.2%
Russia 15,188 15,859 18,038 13.7% 10,084 10,258 9,661 ▼5.8%
Turkey 104,598 100,441 92,359 ▼8.0% 103,799 99,468 90,399 ▼9.1%
Poland 25,474 22,050 21,673 ▼1.7% 24,468 20,940 19,985 ▼4.6%
Czech Rep. 5,136 5,444 5,812 6.8% 4,690 4,974 5,197 4.5%
Romania 3,070 2,393 3,230 35.0% 2,887 2,209 2,982 35.0%
Ukraine 2,118 2,106 760 ▼63.9% 2,118 2,106 760 ▼63.9%
Hungary 4,342 3,684 4,511 22.4% 4,288 3,585 4,394 22.6%
Slovakia 3,123 2,493 2,608 4.6% 2,939 2,353 2,398 1.9%
Slovenia 2,257 2,563 2,730 6.5% 2,220 2,547 2,691 5.7%
Croatia 712 338 708 2.1-fold 673 288 662 2.3-fold
Belarus 183 - - - 145 - - -
Estonia 385 1,730 702 ▼59.4% 242 503 490 ▼2.6%
Bulgaria 450 282 347 23.0% 450 282 347 23.0%
Serbia 3,256 4,598 2,979 ▼35.2% 3,197 4,553 2,919 ▼35.9%
Lithuania 1,149 1,533 2,668 74.0% 1,108 1,489 2,566 72.3%
Latvia 297 415 551 32.8% 249 345 408 18.3%
Cyprus 308 198 224 13.1% 285 171 202 18.1%
Moldova 8 5 38 7.6-fold 7 3 36 12.0-fold
Macedonia 464 343 343 0.0% 450 320 324 1.3%
Bosnia-Hercegovina 54 166 228 37.3% 54 166 228 37.3%
20 countries total 172,572 166,641 160,509 ▼3.7% 164,353 156,560 146,649 ▼6.3%
China 11,338 48,397 68,090 40.7% 11,288 48,375 68,090 40.8%
Japan 17,917 18,698 20,800 11.2% 11,073 11,267 12,312 9.3%
India 10,626 8,746 12,366 41.4% 10,626 8,746 12,366 41.4%
South Korea 4,123 4,650 6,407 37.8% - 507 1,163 2.3-fold
Indonesia 485 902 1,172 29.9% - - 164 -
Australia 24,839 35,784 45,978 28.5% 2,649 7,782 10,059 29.3%
Thailand 34 43 69 60.5% 34 43 69 60.5%
Malaysia - - - - - - - -
Taiwan 191 317 536 69.1% 171 278 477 71.6%
Philippines - - 333 - - - - -
Kazakhstan - - - - - - - -
Pakistan - - - - - - - -
Vietnam - - - - - - - -
New Zealand 1,760 2,004 3,024 50.9% 352 499 1,046 2.1-fold
Singapore 274 180 154 ▼14.4% 236 149 127 ▼14.8%
Sri Lanka 41 26 16 ▼38.5% 34 14 7 ▼50.0%
Brunei 249 300 256 ▼14.7% - - - -
17 countries total 71,877 120,047 159,201 32.6% 36,463 77,660 105,880 36.3%
South Africa 14,493 14,319 11,838 ▼17.3% 4,907 5,051 3,197 ▼36.7%
Algeria - - - - - - - -
Egypt 2,517 1,763 2,312 31.1% 535 198 355 79.3%
Morocco 6,955 7,521 9,025 20.0% 6,772 7,384 9,025 22.2%
Tunisia 3,977 3,722 3,557 ▼4.4% 3,977 3,722 3,557 ▼4.4%
Kenya 54 59 100 69.5% - - - -
Six countries total 27,996 27,384 26,832 ▼2.0% 16,191 16,355 16,134 ▼1.4%
Iran - - - - - - - -
Israel 5,989 6,043 6,856 13.5% 4,213 4,885 5,581 14.2%
GCC (six countries) 19,182 24,843 11,714 ▼52.8% - - - -
Eight countries total 25,171 30,886 18,570 ▼39.9% 4,213 4,885 5,581 14.2%
World 83 countries total 4,153,499 4,250,564 4,515,443 6.2% 2,077,665 2,013,207 1,964,661 ▼2.4%
Region Country
FCA (Fiat Chrysler Automobiles) Fiat Group *
North America
South America
Western Europe
Central & Eastern
Europe
Africa
Asia-Pacific
Middle East

���������� ��� ���� ��������
����� ����� !"����
FOURIN Asia Automotive Intelligence
Chrysler Group / Honda (83 Countries): Automobile Sales Volume by Region and Country (2012–2014)� �
(Created using data from national automotive associations and equivalent organizations)
(Units)
2012 2013 2014 Year-on-year 2012 2013 2014 Year-on-year
US 1,608,015 1,757,132 2,044,427 16.4% 1,422,785 1,525,308 1,540,872 1.0%
Canada 235,371 252,305 281,959 11.8% 148,712 164,236 172,426 5.0%
Mexico 88,535 79,165 69,015 ▼12.8% 54,515 60,951 62,723 2.9%
Puerto Rico 9,029 8,292 7,646 ▼7.8% 5,401 6,268 5,564 ▼11.2%
Four countries total 1,940,950 2,096,894 2,403,047 14.6% 1,631,413 1,756,763 1,781,585 1.4%
Brazil - - - - 134,956 139,279 137,905 ▼1.0%
Argentina 4,443 5,124 2,572 ▼49.8% 16,143 12,357 8,950 ▼27.6%
Colombia - - - - - - - -
Chile 8,174 8,784 7,493 ▼14.7% 3,038 3,404 3,701 8.7%
Peru 1,740 1,704 1,572 ▼7.7% 1,830 2,289 1,979 ▼13.5%
Ecuador 80 162 23 ▼85.8% 16 34 75 2.2-fold
Uruguay 299 239 227 ▼5.0% 527 594 436 ▼26.6%
Bolivia 298 367 224 ▼39.0% 254 235 83 ▼64.7%
Paraguay 566 206 381 85.0% 144 164 - ▼100.0%
Venezuela 9,423 6,060 1,510 ▼75.1% - - - -
10 countries total 25,023 22,646 14,002 ▼38.2% 156,908 158,356 153,129 ▼3.3%
Germany 7,958 8,504 12,436 46.2% 26,306 22,873 22,573 ▼1.3%
UK 5,639 4,744 5,891 24.2% 54,208 55,660 53,544 ▼3.8%
France 3,970 2,319 3,849 66.0% 8,406 8,846 7,091 ▼19.8%
Italy 6,559 5,827 11,334 94.5% 5,315 4,377 4,390 0.3%
Spain 1,674 1,282 1,701 32.7% 5,917 6,704 7,472 11.5%
Belgium 754 647 1,200 85.5% 2,439 2,850 2,735 ▼4.0%
Netherlands 862 650 1,033 58.9% 2,968 2,016 1,501 ▼25.5%
Sweden 553 383 930 2.4-fold 2,837 3,638 3,442 ▼5.4%
Austria 1,007 914 1,547 69.3% 2,200 2,153 1,748 ▼18.8%
Switzerland 3,067 2,309 1,881 ▼18.5% 5,536 5,595 4,499 ▼19.6%
Deanmark 7 3 34 11.3-fold 2,129 1,807 2,081 15.2%
Norway 467 272 331 21.7% 1,731 2,655 2,127 ▼19.9%
Portugal 183 92 107 16.3% 1,487 1,718 1,800 4.8%
Finland 257 76 107 40.8% 3,144 2,911 2,935 0.8%
Ireland 117 12 23 91.7% 1,102 1,003 1,365 36.1%
Greece 76 21 47 2.2-fold 657 618 592 ▼4.2%
Luxembourg 263 238 344 44.5% 233 213 453 2.1-fold
Iceland 52 26 70 2.7-fold 281 348 170 ▼51.1%
18 countries total 33,465 28,319 42,865 51.4% 126,896 125,985 120,518 ▼4.3%
Russia 5,104 5,601 8,377 49.6% 21,512 25,741 21,761 ▼15.5%
Turkey 799 973 1,960 2.0-fold 16,516 15,415 13,790 ▼10.5%
Poland 1,006 1,110 1,688 52.1% 6,896 6,433 5,520 ▼14.2%
Czech Rep. 446 470 615 30.9% 1,680 1,860 1,861 0.1%
Romania 183 184 248 34.8% 553 503 523 4.0%
Ukraine - - - - 3,752 3,502 1,360 ▼61.2%
Hungary 54 99 117 18.2% 1,065 1,054 1,067 1.2%
Slovakia 184 140 210 50.0% 1,100 1,164 1,051 ▼9.7%
Slovenia 37 16 39 2.4-fold 300 412 302 ▼26.7%
Croatia 39 50 46 ▼8.0% 322 326 253 ▼22.4%
Belarus 38 - - - 131 - 48 -
Estonia 143 1,227 212 ▼82.7% 1,001 807 1,384 71.5%
Bulgaria - - - - 178 260 199 ▼23.5%
Serbia 59 45 60 33.3% 391 475 315 ▼33.7%
Lithuania 41 44 102 2.3-fold 214 308 180 ▼41.6%
Latvia 48 70 143 2.0-fold 191 326 309 ▼5.2%
Cyprus 23 27 22 ▼18.5% 265 194 355 83.0%
Moldova 1 2 2 0.0% 30 53 51 ▼3.8%
Macedonia 14 23 19 ▼17.4% 82 36 52 44.4%
Bosnia-Hercegovina - - - - - - - -
20 countries total 8,219 10,081 13,860 37.5% 56,179 58,869 50,381 ▼14.4%
China 50 22 - ▼100.0% 627,610 780,986 810,960 3.8%
Japan 6,844 7,431 8,488 14.2% 745,204 763,388 848,753 11.2%
India - - - - 73,127 107,661 179,816 67.0%
South Korea 4,123 4,143 5,244 26.6% 3,944 4,856 3,601 ▼25.8%
Indonesia 485 902 1,008 11.8% 69,320 91,493 159,147 73.9%
Australia 22,190 28,002 35,919 28.3% 35,812 39,258 32,998 ▼15.9%
Thailand - - - - 171,208 213,155 106,482 ▼50.0%
Malaysia - - - - 34,950 51,544 77,495 50.3%
Taiwan 20 39 59 51.3% 18,794 25,588 24,597 ▼3.9%
Philippines - - 333 - 12,653 13,356 13,378 0.2%
Kazakhstan - - - - 138 534 426 ▼20.2%
Pakistan - - - - 13,551 22,931 22,263 ▼2.9%
Vietnam - - - - 1,804 4,593 6,492 41.3%
New Zealand 1,408 1,505 1,978 31.4% 3,003 3,120 3,554 13.9%
Singapore 38 31 27 ▼12.9% 473 417 1,230 2.9-fold
Sri Lanka 7 12 9 ▼25.0% 169 144 365 2.5-fold
Brunei 249 300 256 ▼14.7% 260 348 555 59.5%
17 countries total 35,414 42,387 53,321 25.8% 1,812,020 2,123,372 2,292,112 7.9%
South Africa 9,586 9,268 8,641 ▼6.8% 9,093 12,904 10,169 ▼21.2%
Algeria - - - - - - - -
Egypt 1,982 1,565 1,957 25.0% 691 693 580 ▼16.3%
Morocco 183 137 - ▼100.0% 922 707 - ▼100.0%
Tunisia - - - - - - - -
Kenya 54 59 100 69.5% - - - -
Six countries total 11,805 11,029 10,698 ▼3.0% 10,706 14,304 10,749 ▼24.9%
Iran - - - - - - - -
Israel 1,776 1,158 1,275 10.1% 6,112 7,058 8,427 19.4%
GCC (six countries) 19,182 24,843 11,714 ▼52.8% 30,868 35,384 39,547 11.8%
Eight countries total 20,958 26,001 12,989 ▼50.0% 36,980 42,442 47,974 13.0%
World 83 countries total 2,075,834 2,237,357 2,550,782 14.0% 3,831,102 4,280,091 4,456,448 4.1%
Chrysler Group (Chrysler / Dodge / Jeep / Ram) Honda (Honda / Acura / Everus / Ciimo)
North America
Region Country
South America
Central & Eastern
Europe
Western Europe
Africa
Asia-Pacific
Middle East

���������� ��� ���� ��������
����� ����� !"����
FOURIN Asia Automotive Intelligence
PSA / Suzuki (83 Countries): Automobile Sales Volume by Region and Country (2012–2014)�
*Suzuki includes Maruti. (Created using data from national automotive associations and equivalent organizations)
(Units)
2012 2013 2014 Year-on-year 2012 2013 2014 Year-on-year
US - - - - 25,358 5,949 - ▼100.0%
Canada - - - - 5,458 3,071 - ▼100.0%
Mexico 5,204 6,941 6,147 ▼11.4% 10,733 11,190 12,510 11.8%
Puerto Rico - - - - 3,556 2,280 268 ▼88.2%
Four countries total 5,204 6,941 6,147 ▼11.4% 45,105 22,490 12,778 ▼43.2%
Brazil 146,656 123,623 94,336 ▼23.7% - - - -
Argentina 111,325 139,984 98,296 ▼29.8% 20 1 134 134.0-fold
Colombia - - - - - - - -
Chile 13,821 18,130 16,809 ▼7.3% 17,389 21,943 21,723 ▼1.0%
Peru 1,165 1,178 1,012 ▼14.1% 7,176 9,072 8,746 ▼3.6%
Ecuador 346 195 282 44.6% 1 - - -
Uruguay 3,683 4,082 3,568 ▼12.6% 3,290 3,282 4,937 50.4%
Bolivia - 13 - ▼100.0% 5,021 9,800 10,002 2.1%
Paraguay - 121 - ▼100.0% 578 584 804 37.7%
Venezuela 2,322 2,132 - ▼100.0% - - - -
10 countries total 279,318 289,458 214,303 ▼26.0% 33,475 44,682 46,346 3.7%
Germany 153,835 122,244 124,098 1.5% 30,843 26,863 27,835 3.6%
UK 213,156 228,213 246,462 8.0% 24,893 33,088 37,395 13.0%
France 700,887 650,704 659,197 1.3% 16,350 15,936 15,847 ▼0.6%
Italy 155,607 136,734 141,997 3.8% 14,798 13,949 15,929 14.2%
Spain 133,182 131,562 153,023 16.3% 3,717 3,102 2,400 ▼22.6%
Belgium 91,871 87,498 85,573 ▼2.2% 5,100 5,244 6,098 16.3%
Netherlands 74,751 57,960 63,907 10.3% 12,520 8,714 8,527 ▼2.1%
Sweden 22,445 17,205 18,327 6.5% 2,694 2,566 2,440 ▼4.9%
Austria 28,847 20,936 21,057 0.6% 6,079 5,646 4,619 ▼18.2%
Switzerland 28,033 26,554 26,235 ▼1.2% 7,692 8,364 8,514 1.8%
Deanmark 31,810 29,734 34,439 15.8% 6,560 5,557 6,158 10.8%
Norway 15,042 13,066 13,956 6.8% 2,060 2,319 2,848 22.8%
Portugal 17,939 19,821 28,105 41.8% 169 76 25 ▼67.1%
Finland 7,055 5,805 5,345 ▼7.9% 814 623 648 4.0%
Ireland 4,449 4,607 5,814 26.2% 630 578 653 13.0%
Greece 7,076 5,058 6,228 23.1% 2,278 2,212 3,347 51.3%
Luxembourg 7,081 5,389 5,677 5.3% 589 571 529 ▼7.4%
Iceland 262 161 263 63.4% 536 489 543 11.0%
18 countries total 1,693,328 1,563,251 1,639,703 4.9% 138,322 135,897 144,355 6.2%
Russia 79,739 64,826 43,498 ▼32.9% 32,684 27,724 19,931 ▼28.1%
Turkey 60,106 64,037 46,635 ▼27.2% 1,780 1,623 958 ▼41.0%
Poland 29,276 29,770 30,302 1.8% 5,988 5,995 5,891 ▼1.7%
Czech Rep. 14,582 15,798 15,179 ▼3.9% 2,340 2,285 2,350 2.8%
Romania 4,393 3,714 3,912 5.3% 1,638 1,226 1,223 ▼0.2%
Ukraine 6,867 8,799 3,697 ▼58.0% 1,687 1,763 1,344 ▼23.8%
Hungary 4,626 5,726 6,402 11.8% 3,300 3,933 4,735 20.4%
Slovakia 7,865 8,890 8,760 ▼1.5% 2,431 2,772 2,611 ▼5.8%
Slovenia 9,472 9,400 8,653 ▼7.9% 204 238 405 70.2%
Croatia 5,124 3,725 4,230 13.6% 642 447 540 20.8%
Belarus 742 1,209 1,188 ▼1.7% 44 - 432 -
Estonia 2,589 1,474 3,111 2.1-fold 208 166 329 98.2%
Bulgaria 2,443 2,743 2,568 ▼6.4% 185 106 115 8.5%
Serbia 295 286 282 ▼1.4% 460 484 329 ▼32.0%
Lithuania 1,120 492 380 ▼22.8% 81 140 155 10.7%
Latvia 1,423 1,349 1,496 10.9% 192 16 181 11.3-fold
Cyprus 470 318 437 37.4% 223 120 152 26.7%
Moldova 73 102 134 31.4% 67 72 59 ▼18.1%
Macedonia 558 464 467 0.6% 107 85 58 ▼31.8%
Bosnia-Hercegovina 189 110 168 52.7% - - 4 -
20 countries total 231,952 223,232 181,499 ▼18.7% 54,261 49,195 41,802 ▼15.0%
China 440,028 552,559 727,024 31.6% 251,127 230,315 262,779 14.1%
Japan 9,445 8,917 8,117 ▼9.0% 673,138 701,472 787,361 12.2%
India - - - - 1,063,599 1,063,964 1,152,128 8.3%
South Korea 2,662 3,252 3,738 14.9% - - - -
Indonesia 333 270 65 ▼75.9% 126,577 164,004 154,923 ▼5.5%
Australia 6,631 5,422 5,610 3.5% 23,572 21,603 16,935 ▼21.6%
Thailand 331 232 130 ▼44.0% 24,685 45,292 20,183 ▼55.4%
Malaysia 6,114 6,505 5,498 ▼15.5% 8,087 4,962 4,273 ▼13.9%
Taiwan 935 1,107 1,291 16.6% 4,008 5,146 5,859 13.9%
Philippines - - - - 4,501 4,978 6,884 38.3%
Kazakhstan - 258 1,219 4.7-fold 569 838 357 ▼57.4%
Pakistan - - - - 95,763 76,818 77,817 1.3%
Vietnam - - 100 - 3,409 3,765 4,386 16.5%
New Zealand 1,266 1,411 1,473 4.4% 5,412 4,818 4,827 0.2%
Singapore 974 531 614 15.6% 143 85 107 25.9%
Sri Lanka 50 51 33 ▼35.3% 6,573 2,615 4,237 62.0%
Brunei 66 68 67 ▼1.5% 1,698 1,693 1,666 ▼1.6%
17 countries total 468,835 580,583 754,979 30.0% 2,292,861 2,332,368 2,504,722 7.4%
South Africa 5,944 5,804 3,251 ▼44.0% 4,724 4,865 6,469 33.0%
Algeria 76,946 89,215 50,914 ▼42.9% 21,730 17,610 12,877 ▼26.9%
Egypt 1,728 4,662 7,927 70.0% 7,524 8,592 11,821 37.6%
Morocco 17,670 15,489 14,283 ▼7.8% 1,474 632 - ▼100.0%
Tunisia 12,820 10,837 10,651 ▼1.7% - - - -
Kenya - - - - 151 119 116 ▼2.5%
Six countries total 115,108 126,007 87,026 ▼30.9% 35,603 31,818 31,283 ▼1.7%
Iran 213,229 208,644 370,922 77.8% 2,137 496 743 49.8%
Israel 12,507 11,043 8,817 ▼20.2% 9,540 10,988 13,799 25.6%
GCC (six countries) 2,468 1,781 - ▼100.0% 5,439 3,987 2,311 ▼42.0%
Eight countries total 228,204 221,468 379,739 71.5% 17,116 15,471 16,853 8.9%
World 83 countries total 3,021,949 3,010,940 3,263,396 8.4% 2,616,743 2,631,921 2,798,139 6.3%
Region Country
North America
PSA (Peugeot / Citroën) Suzuki *
South America
Central & Eastern
Europe
Western Europe
Africa
Asia-Pacific
Middle East

���������� ��� ���� ��������
����� ����� !"����
FOURIN Asia Automotive Intelligence
Daimler Group / Mercedes-Benz Cars (83 Countries): Automobile Sales Volume by Region and Country (2012–2014)�
*Daimler Group includes Mercedes-Benz Cars/Vans (Mercedes-Benz cars/LCVs, Maybach, Smart), Daimler Trucks/Buses (Mercedes-Benz M&HCVs, Setra, Evobus, Unimog, Freightliner, Sterling,
Western Star, Fuso. (Created using data from national automotive associations and equivalent organizations)
(Units)
2012 2013 2014 Year-on-year 2012 2013 2014 Year-on-year
US 408,205 460,018 497,901 8.2% 304,993 343,588 366,589 6.7%
Canada 44,658 45,186 49,301 9.1% 35,503 37,018 40,555 9.6%
Mexico 21,050 21,100 20,215 ▼4.2% 10,600 10,547 10,565 0.2%
Puerto Rico 1,148 1,143 1,013 ▼11.4% 1,148 1,143 1,013 ▼11.4%
Four countries total 475,061 527,447 568,430 7.8% 352,244 392,296 418,722 6.7%
Brazil 58,480 69,596 68,797 ▼1.1% 11,065 17,798 20,161 13.3%
Argentina 15,106 19,657 12,675 ▼35.5% 7,129 10,947 5,705 ▼47.9%
Colombia - - - - - - - -
Chile 3,475 5,620 5,305 ▼5.6% 3,475 5,620 5,305 ▼5.6%
Peru 4,560 5,239 3,242 ▼38.1% 678 888 997 12.3%
Ecuador 774 901 809 ▼10.2% 48 31 20 ▼35.5%
Uruguay 749 829 1,102 32.9% 513 566 616 8.8%
Bolivia 73 211 212 0.5% - - - -
Paraguay 555 558 540 ▼3.2% 555 558 540 ▼3.2%
Venezuela 1,121 1,832 803 ▼56.2% 18 1 5 5.0-fold
10 countries total 84,893 104,443 93,485 ▼10.5% 23,481 36,409 33,349 ▼8.4%
Germany 393,221 388,817 382,610 ▼1.6% 311,059 303,382 294,974 ▼2.8%
UK 127,356 151,877 168,744 11.1% 118,526 140,437 159,225 13.4%
France 80,423 80,190 79,007 ▼1.5% 71,283 70,257 71,007 1.1%
Italy 70,857 72,141 68,689 ▼4.8% 68,590 70,100 66,528 ▼5.1%
Spain 30,137 33,316 42,656 28.0% 27,693 30,654 39,564 29.1%
Belgium 28,848 31,381 32,096 2.3% 22,043 25,081 25,772 2.8%
Netherlands 21,207 21,404 21,681 1.3% 19,280 18,806 19,683 4.7%
Sweden 15,572 13,486 16,116 19.5% 14,530 12,585 14,968 18.9%
Austria 15,372 16,899 17,664 4.5% 13,855 15,316 15,885 3.7%
Switzerland 23,901 23,224 25,006 7.7% 21,784 21,536 23,156 7.5%
Deanmark 7,076 8,450 9,840 16.4% 6,296 7,417 8,860 19.5%
Norway 8,981 9,951 10,088 1.4% 7,795 8,942 8,966 0.3%
Portugal 8,368 10,120 13,626 34.6% 7,941 9,521 12,815 34.6%
Finland 7,342 7,155 7,498 4.8% 6,303 6,197 6,575 6.1%
Ireland 2,243 1,955 3,194 63.4% 2,123 1,796 2,841 58.2%
Greece 1,846 2,476 3,310 33.7% 1,846 2,476 3,310 33.7%
Luxembourg 4,050 4,167 4,398 5.5% 3,714 3,825 4,092 7.0%
Iceland 203 258 279 8.1% 156 196 219 11.7%
18 countries total 847,003 877,267 906,502 3.3% 724,817 748,524 778,440 4.0%
Russia 46,931 58,758 69,444 18.2% 41,441 49,816 60,553 21.6%
Turkey 35,407 44,903 52,048 15.9% 22,060 30,554 31,204 2.1%
Poland 11,620 12,872 14,698 14.2% 8,431 9,223 10,749 16.5%
Czech Rep. 5,835 6,056 7,325 21.0% 4,125 4,155 5,067 21.9%
Romania 3,302 3,396 4,778 40.7% 2,136 2,023 2,811 39.0%
Ukraine 2,791 3,260 1,703 ▼47.8% 2,791 3,260 1,703 ▼47.8%
Hungary 1,979 2,528 2,444 ▼3.3% 1,392 1,730 1,835 6.1%
Slovakia 2,569 3,036 3,276 7.9% 2,023 2,347 2,641 12.5%
Slovenia 968 938 967 3.1% 961 938 966 3.0%
Croatia 334 509 741 45.6% 334 509 741 45.6%
Belarus 293 375 227 ▼39.5% 293 375 227 ▼39.5%
Estonia 472 370 609 64.6% 331 143 458 3.2-fold
Bulgaria - - - - - - - -
Serbia 552 572 5 ▼99.1% 552 572 5 ▼99.1%
Lithuania 701 899 964 7.2% 234 295 315 6.8%
Latvia 529 628 565 ▼10.0% 326 329 340 3.3%
Cyprus 658 560 566 1.1% 614 533 547 2.6%
Moldova 211 220 244 10.9% 211 220 244 10.9%
Macedonia 61 - - - 61 - - -
Bosnia-Hercegovina 16 17 31 82.4% 16 17 31 82.4%
20 countries total 115,229 139,897 160,635 14.8% 88,332 107,039 120,437 12.5%
China 101,130 126,079 155,907 23.7% 101,130 126,079 155,907 23.7%
Japan 78,050 91,767 104,466 13.8% 43,315 55,023 61,948 12.6%
India 8,240 16,003 17,401 8.7% 6,840 9,003 10,201 13.3%
South Korea 20,389 24,780 35,213 42.1% 20,389 24,780 35,213 42.1%
Indonesia 68,150 71,234 59,967 ▼15.8% 3,711 3,506 2,992 ▼14.7%
Australia 39,729 46,955 49,901 6.3% 30,797 37,393 40,577 8.5%
Thailand 8,372 11,979 12,574 5.0% 6,551 10,180 11,484 12.8%
Malaysia 8,085 8,082 9,419 16.5% 5,818 5,413 6,954 28.5%
Taiwan 24,954 24,208 27,796 14.8% 14,047 17,747 20,633 16.3%
Philippines 1,444 1,539 1,781 15.7% 447 404 422 4.5%
Kazakhstan 291 374 420 12.3% 291 374 420 12.3%
Pakistan - - - - - - - -
Vietnam 2,383 2,486 3,106 24.9% 1,929 1,725 2,412 39.8%
New Zealand 2,180 2,745 3,504 27.7% 1,408 1,900 2,118 11.5%
Singapore 5,387 5,324 7,263 36.4% 4,323 3,871 4,651 20.1%
Sri Lanka 174 259 385 48.6% 128 220 311 41.4%
Brunei 408 488 409 ▼16.2% 337 384 279 ▼27.3%
17 countries total 369,366 434,302 489,512 12.7% 241,461 298,002 356,522 19.6%
South Africa 30,339 31,938 36,958 15.7% 23,095 23,967 29,344 22.4%
Algeria - 2,262 1,709 ▼24.4% - 2,262 1,709 ▼24.4%
Egypt 2,293 2,057 3,698 79.8% - 3 - ▼100.0%
Morocco 1,757 1,976 - ▼100.0% 1,757 1,976 - ▼100.0%
Tunisia 496 - - - 496 - - -
Kenya 483 564 345 ▼38.8% 483 564 345 ▼38.8%
Six countries total 35,368 38,797 42,710 10.1% 25,831 28,772 31,398 9.1%
Iran 2,060 1,797 4,008 2.2-fold - - - -
Israel 2,689 3,668 3,956 7.9% 1,171 1,756 2,017 14.9%
GCC (six countries) 31,739 27,327 12,556 ▼54.1% 10,259 7,221 - ▼100.0%
Eight countries total 36,488 32,792 20,520 ▼37.4% 11,430 8,977 2,017 ▼77.5%
World 83 countries total 1,963,408 2,154,945 2,281,794 5.9% 1,467,596 1,620,019 1,740,885 7.5%
Middle East
Africa
Asia-Pacific
Central & Eastern
Europe
Western Europe
North America
South America
Region Country
Daimler Group * Mercedes-Benz Cars
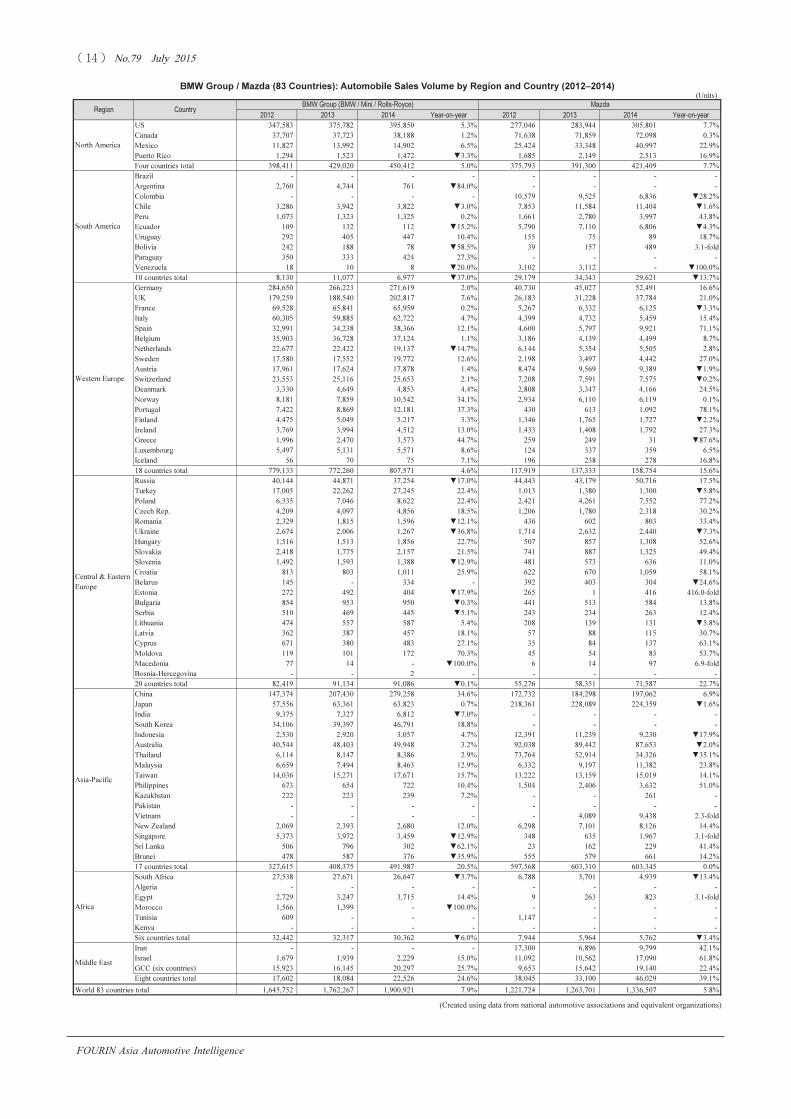
���������� ��� ���� ��������
����� ����� !"����
FOURIN Asia Automotive Intelligence
BMW Group / Mazda (83 Countries): Automobile Sales Volume by Region and Country (2012–2014)�
(Created using data from national automotive associations and equivalent organizations)
(Units)
2012 2013 2014 Year-on-year 2012 2013 2014 Year-on-year
US 347,583 375,782 395,850 5.3% 277,046 283,944 305,801 7.7%
Canada 37,707 37,723 38,188 1.2% 71,638 71,859 72,098 0.3%
Mexico 11,827 13,992 14,902 6.5% 25,424 33,348 40,997 22.9%
Puerto Rico 1,294 1,523 1,472 ▼3.3% 1,685 2,149 2,513 16.9%
Four countries total 398,411 429,020 450,412 5.0% 375,793 391,300 421,409 7.7%
Brazil - - - - - - - -
Argentina 2,760 4,744 761 ▼84.0% - - - -
Colombia - - - - 10,579 9,525 6,836 ▼28.2%
Chile 3,286 3,942 3,822 ▼3.0% 7,853 11,584 11,404 ▼1.6%
Peru 1,073 1,323 1,325 0.2% 1,661 2,780 3,997 43.8%
Ecuador 109 132 112 ▼15.2% 5,790 7,110 6,806 ▼4.3%
Uruguay 292 405 447 10.4% 155 75 89 18.7%
Bolivia 242 188 78 ▼58.5% 39 157 489 3.1-fold
Paraguay 350 333 424 27.3% - - - -
Venezuela 18 10 8 ▼20.0% 3,102 3,112 - ▼100.0%
10 countries total 8,130 11,077 6,977 ▼37.0% 29,179 34,343 29,621 ▼13.7%
Germany 284,650 266,223 271,619 2.0% 40,730 45,027 52,491 16.6%
UK 179,259 188,540 202,817 7.6% 26,183 31,228 37,784 21.0%
France 69,528 65,841 65,959 0.2% 5,267 6,332 6,125 ▼3.3%
Italy 60,305 59,885 62,722 4.7% 4,399 4,732 5,459 15.4%
Spain 32,991 34,238 38,366 12.1% 4,600 5,797 9,921 71.1%
Belgium 35,903 36,728 37,124 1.1% 3,186 4,139 4,499 8.7%
Netherlands 22,677 22,422 19,137 ▼14.7% 6,144 5,354 5,505 2.8%
Sweden 17,580 17,552 19,772 12.6% 2,198 3,497 4,442 27.0%
Austria 17,961 17,624 17,878 1.4% 8,474 9,569 9,389 ▼1.9%
Switzerland 23,553 25,116 25,653 2.1% 7,208 7,591 7,575 ▼0.2%
Deanmark 3,330 4,649 4,853 4.4% 2,808 3,347 4,166 24.5%
Norway 8,181 7,859 10,542 34.1% 2,934 6,110 6,119 0.1%
Portugal 7,422 8,869 12,181 37.3% 430 613 1,092 78.1%
Finland 4,475 5,049 5,217 3.3% 1,346 1,765 1,727 ▼2.2%
Ireland 3,769 3,994 4,512 13.0% 1,433 1,408 1,792 27.3%
Greece 1,996 2,470 3,573 44.7% 259 249 31 ▼87.6%
Luxembourg 5,497 5,131 5,571 8.6% 124 337 359 6.5%
Iceland 56 70 75 7.1% 196 238 278 16.8%
18 countries total 779,133 772,260 807,571 4.6% 117,919 137,333 158,754 15.6%
Russia 40,144 44,871 37,254 ▼17.0% 44,443 43,179 50,716 17.5%
Turkey 17,005 22,262 27,245 22.4% 1,013 1,380 1,300 ▼5.8%
Poland 6,335 7,046 8,622 22.4% 2,421 4,261 7,552 77.2%
Czech Rep. 4,209 4,097 4,856 18.5% 1,206 1,780 2,318 30.2%
Romania 2,329 1,815 1,596 ▼12.1% 436 602 803 33.4%
Ukraine 2,674 2,006 1,267 ▼36.8% 1,714 2,632 2,440 ▼7.3%
Hungary 1,516 1,513 1,856 22.7% 507 857 1,308 52.6%
Slovakia 2,418 1,775 2,157 21.5% 741 887 1,325 49.4%
Slovenia 1,492 1,593 1,388 ▼12.9% 481 573 636 11.0%
Croatia 813 803 1,011 25.9% 622 670 1,059 58.1%
Belarus 145 - 334 - 392 403 304 ▼24.6%
Estonia 272 492 404 ▼17.9% 265 1 416 416.0-fold
Bulgaria 854 953 950 ▼0.3% 441 513 584 13.8%
Serbia 510 469 445 ▼5.1% 243 234 263 12.4%
Lithuania 474 557 587 5.4% 208 139 131 ▼5.8%
Latvia 362 387 457 18.1% 57 88 115 30.7%
Cyprus 671 380 483 27.1% 35 84 137 63.1%
Moldova 119 101 172 70.3% 45 54 83 53.7%
Macedonia 77 14 - ▼100.0% 6 14 97 6.9-fold
Bosnia-Hercegovina - - 2 - - - - -
20 countries total 82,419 91,134 91,086 ▼0.1% 55,276 58,351 71,587 22.7%
China 147,374 207,430 279,258 34.6% 172,732 184,298 197,062 6.9%
Japan 57,556 63,361 63,823 0.7% 218,361 228,089 224,359 ▼1.6%
India 9,375 7,327 6,812 ▼7.0% - - - -
South Korea 34,106 39,397 46,791 18.8% - - - -
Indonesia 2,530 2,920 3,057 4.7% 12,391 11,239 9,230 ▼17.9%
Australia 40,544 48,403 49,948 3.2% 92,038 89,442 87,653 ▼2.0%
Thailand 6,114 8,147 8,386 2.9% 73,764 52,914 34,326 ▼35.1%
Malaysia 6,659 7,494 8,463 12.9% 6,332 9,197 11,382 23.8%
Taiwan 14,036 15,271 17,671 15.7% 13,222 13,159 15,019 14.1%
Philippines 673 654 722 10.4% 1,504 2,406 3,632 51.0%
Kazakhstan 222 223 239 7.2% - - 261 -
Pakistan - - - - - - - -
Vietnam - - - - - 4,089 9,438 2.3-fold
New Zealand 2,069 2,393 2,680 12.0% 6,298 7,101 8,126 14.4%
Singapore 5,373 3,972 3,459 ▼12.9% 348 635 1,967 3.1-fold
Sri Lanka 506 796 302 ▼62.1% 23 162 229 41.4%
Brunei 478 587 376 ▼35.9% 555 579 661 14.2%
17 countries total 327,615 408,375 491,987 20.5% 597,568 603,310 603,345 0.0%
South Africa 27,538 27,671 26,647 ▼3.7% 6,788 5,701 4,939 ▼13.4%
Algeria - - - - - - - -
Egypt 2,729 3,247 3,715 14.4% 9 263 823 3.1-fold
Morocco 1,566 1,399 - ▼100.0% - - - -
Tunisia 609 - - - 1,147 - - -
Kenya - - - - - - - -
Six countries total 32,442 32,317 30,362 ▼6.0% 7,944 5,964 5,762 ▼3.4%
Iran - - - - 17,300 6,896 9,799 42.1%
Israel 1,679 1,939 2,229 15.0% 11,092 10,562 17,090 61.8%
GCC (six countries) 15,923 16,145 20,297 25.7% 9,653 15,642 19,140 22.4%
Eight countries total 17,602 18,084 22,526 24.6% 38,045 33,100 46,029 39.1%
World 83 countries total 1,645,752 1,762,267 1,900,921 7.9% 1,221,724 1,263,701 1,336,507 5.8%
Middle East
Western Europe
Africa
Asia-Pacific
Central & Eastern
Europe
North America
South America
Region Country
BMW Group (BMW / Mini / Rolls-Royce) Mazda

���������� ��� ���� ��������
����� ����� !"����
FOURIN Asia Automotive Intelligence
Mitsubishi Motors / FHI (83 Countries): Automobile Sales Volume by Region and Country (2012–2014)�
(Created using data from national automotive associations and equivalent organizations)
(Units)
2012 2013 2014 Year-on-year 2012 2013 2014 Year-on-year
US 57,790 62,227 77,643 24.8% 336,441 424,683 513,693 21.0%
Canada 19,671 21,104 22,704 7.6% 31,003 36,760 42,035 14.3%
Mexico 8,753 8,997 11,780 30.9% 283 533 1,410 2.6-fold
Puerto Rico 6,172 6,935 7,073 2.0% 184 194 146 ▼24.7%
Four countries total 92,386 99,263 119,200 20.1% 367,911 462,170 557,284 20.6%
Brazil 60,577 58,174 59,280 1.9% - 738 1,123 52.2%
Argentina 597 684 419 ▼38.7% 270 455 70 ▼84.6%
Colombia 138 - - - - - - -
Chile 8,599 10,678 14,160 32.6% 3,926 5,069 5,793 14.3%
Peru 2,272 2,621 4,895 86.8% 1,047 1,419 2,101 48.1%
Ecuador 246 333 130 ▼61.0% 2 - 2 -
Uruguay 161 341 1,167 3.4-fold 29 66 121 83.3%
Bolivia 813 722 908 25.8% - 29 11 ▼62.1%
Paraguay 295 282 331 17.4% - - - -
Venezuela 7,308 9,561 3,073 ▼67.9% - - - -
10 countries total 81,006 83,396 84,363 1.2% 5,274 7,776 9,221 18.6%
Germany 25,831 23,234 26,190 12.7% 9,457 7,456 6,218 ▼16.6%
UK 11,402 14,971 22,751 52.0% 2,023 2,271 2,793 23.0%
France 5,355 5,073 4,837 ▼4.7% 971 928 731 ▼21.2%
Italy 4,305 3,401 4,420 30.0% 3,722 3,263 2,659 ▼18.5%
Spain 4,305 3,860 5,900 52.8% 993 1,186 1,305 10.0%
Belgium 3,782 3,537 2,952 ▼16.5% 528 631 546 ▼13.5%
Netherlands 3,774 12,372 12,182 ▼1.5% 951 701 643 ▼8.3%
Sweden 4,299 3,272 5,776 76.5% 4,306 4,925 4,285 ▼13.0%
Austria 4,243 3,703 3,964 7.0% 1,516 823 743 ▼9.7%
Switzerland 4,899 4,660 3,705 ▼20.5% 8,483 7,563 6,277 ▼17.0%
Deanmark 492 142 2,367 16.7-fold 64 171 220 28.7%
Norway 5,457 6,311 5,856 ▼7.2% 3,559 3,233 2,478 ▼23.4%
Portugal 1,517 1,646 2,265 37.6% 3 2 - ▼100.0%
Finland 1,377 904 1,653 82.9% 1,031 1,040 1,006 ▼3.3%
Ireland 525 644 882 37.0% 157 120 174 45.0%
Greece 768 482 421 ▼12.7% 41 25 67 2.7-fold
Luxembourg 186 156 129 ▼17.3% 110 78 68 ▼12.8%
Iceland 92 34 44 29.4% 92 101 115 13.9%
18 countries total 82,609 88,402 106,294 20.2% 38,007 34,517 30,328 ▼12.1%
Russia 74,294 78,747 80,134 1.8% 14,296 16,831 17,557 4.3%
Turkey 4,465 5,240 5,538 5.7% 640 1,101 1,402 27.3%
Poland 4,594 4,450 5,706 28.2% 1,160 1,449 1,525 5.2%
Czech Rep. 1,205 1,117 1,769 58.4% 879 828 805 ▼2.8%
Romania 1,020 698 754 8.0% 175 48 2 ▼95.8%
Ukraine 5,501 5,298 2,193 ▼58.6% 1,142 1,543 1,206 ▼21.8%
Hungary 312 334 908 2.7-fold 100 115 116 0.9%
Slovakia 497 574 911 58.7% 237 303 246 ▼18.8%
Slovenia 112 155 260 67.7% 75 56 40 ▼28.6%
Croatia 158 51 208 4.1-fold 25 27 46 70.4%
Belarus 283 519 454 ▼12.5% 78 - 192 -
Estonia 242 1,221 206 ▼83.1% 956 1,011 992 ▼1.9%
Bulgaria 273 219 260 18.7% 62 5 - ▼100.0%
Serbia 88 121 70 ▼42.1% 23 26 28 7.7%
Lithuania 199 163 189 16.0% 317 296 296 0.0%
Latvia 280 189 216 14.3% 208 195 227 16.4%
Cyprus 142 39 61 56.4% 12 48 35 ▼27.1%
Moldova 120 132 73 ▼44.7% - 2 3 50.0%
Macedonia 145 85 101 18.8% 5 4 - ▼100.0%
Bosnia-Hercegovina 1 - - - - - - -
20 countries total 93,931 99,352 100,011 0.7% 20,390 23,888 24,718 3.5%
China 30,239 62,541 73,255 17.1% - - - -
Japan 140,493 139,016 125,083 ▼10.0% 177,722 180,824 169,552 ▼6.2%
India - - - - - - - -
South Korea 81 146 - ▼100.0% 627 - - -
Indonesia 85,376 91,091 85,607 ▼6.0% 321 1,210 828 ▼31.6%
Australia 39,744 46,639 44,377 ▼4.9% 40,674 40,672 40,989 0.8%
Thailand 129,460 104,687 62,885 ▼39.9% 118 2,641 1,966 ▼25.6%
Malaysia 11,652 12,348 14,322 16.0% 53 1,084 1,644 51.7%
Taiwan 41,097 37,742 38,423 1.8% 1,612 3,926 5,625 43.3%
Philippines 34,272 42,361 48,793 15.2% 1,752 2,938 3,068 4.4%
Kazakhstan 2,128 3,477 2,050 ▼41.0% 581 1,192 1,033 ▼13.3%
Pakistan - - - - - - - -
Vietnam 1,141 1,425 2,011 41.1% - - - -
New Zealand 5,174 6,004 7,525 25.3% 1,686 1,748 1,818 4.0%
Singapore 99 71 177 2.5-fold 121 199 625 3.1-fold
Sri Lanka 3,539 2,019 1,551 ▼23.2% 2 - 24 -
Brunei 1,073 1,264 1,141 ▼9.7% 82 150 85 ▼43.3%
17 countries total 525,568 550,831 507,200 ▼7.9% 225,351 236,584 227,257 ▼3.9%
South Africa 3,577 4,486 4,643 3.5% 861 1,153 1,263 9.5%
Algeria 1,236 1,610 2,017 25.3% - - - -
Egypt 5,843 7,227 6,789 ▼6.1% 270 534 746 39.7%
Morocco 2,245 2,396 - ▼100.0% - - - -
Tunisia 1,654 - - - - - - -
Kenya 1,523 2,154 2,774 28.8% 101 121 146 20.7%
Six countries total 16,078 17,873 16,223 ▼9.2% 1,232 1,808 2,155 19.2%
Iran - - - - - - - -
Israel 2,694 6,447 13,224 2.1-fold 1,746 2,435 4,330 77.8%
GCC (six countries) 35,407 42,300 57,753 36.5% - - - -
Eight countries total 38,101 48,747 70,977 45.6% 1,746 2,435 4,330 77.8%
World 83 countries total 929,679 987,864 1,004,268 1.7% 659,911 769,178 855,293 11.2%
Middle East
Western Europe
Africa
Asia-Pacific
Central & Eastern
Europe
North America
South America
Mitsubishi Motors Fuji Heavy Industries (Subaru)
Region Country
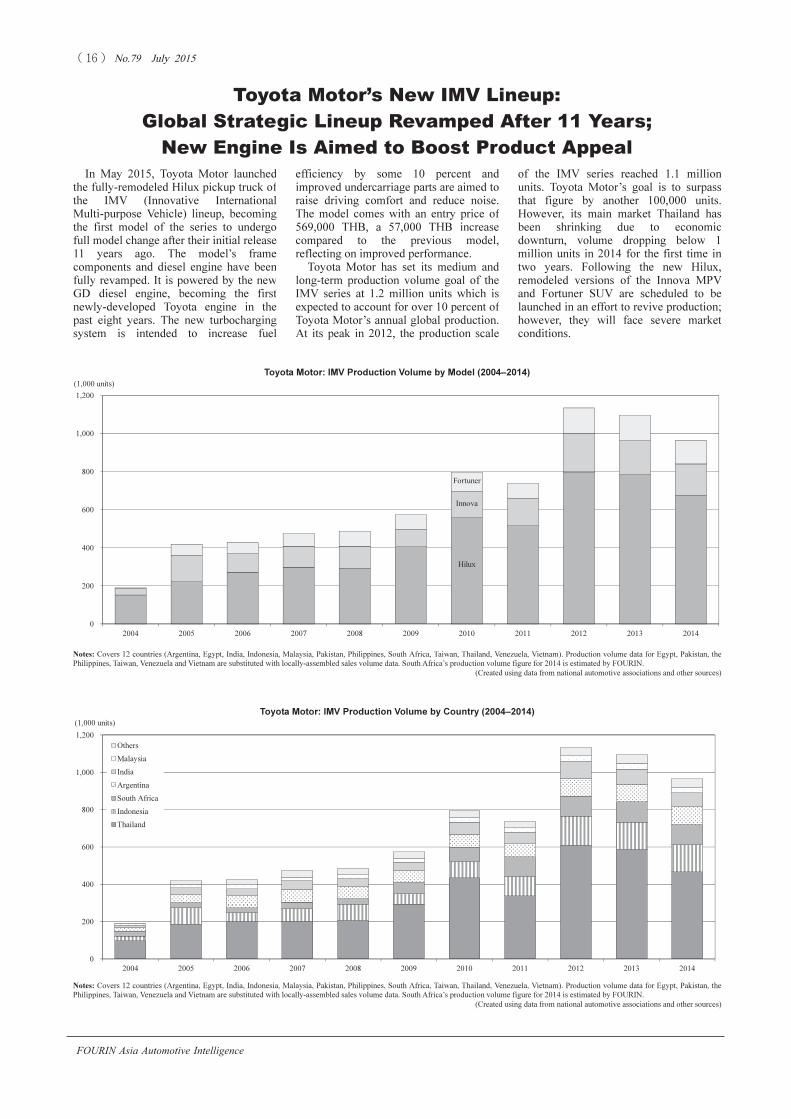
���������� ��� ���� ��������
����� ����� !"����
FOURIN Asia Automotive Intelligence
Toyota Motor’s New IMV Lineup:
Global Strategic Lineup Revamped After 11 Years;
New Engine Is Aimed to Boost Product Appeal
In May 2015, Toyota Motor launched
the fully-remodeled Hilux pickup truck of
the IMV (Innovative International
Multi-purpose Vehicle) lineup, becoming
the first model of the series to undergo
full model change after their initial release
11 years ago. The model’s frame
components and diesel engine have been
fully revamped. It is powered by the new
GD diesel engine, becoming the first
newly-developed Toyota engine in the
past eight years. The new turbocharging
system is intended to increase fuel
of the IMV series reached 1.1 million
units. Toyota Motor’s goal is to surpass
that figure by another 100,000 units.
However, its main market Thailand has
been shrinking due to economic
downturn, volume dropping below 1
million units in 2014 for the first time in
two years. Following the new Hilux,
remodeled versions of the Innova MPV
and Fortuner SUV are scheduled to be
launched in an effort to revive production;
however, they will face severe market
conditions.
efficiency by some 10 percent and
improved undercarriage parts are aimed to
raise driving comfort and reduce noise.
The model comes with an entry price of
569,000 THB, a 57,000 THB increase
compared to the previous model,
reflecting on improved performance.
Toyota Motor has set its medium and
long-term production volume goal of the
IMV series at 1.2 million units which is
expected to account for over 10 percent of
Toyota Motor’s annual global production.
At its peak in 2012, the production scale
Toyota Motor: IMV Production Volume by Model (2004–2014)
Toyota Motor: IMV Production Volume by Country (2004–2014)
Notes: Covers 12 countries (Argentina, Egypt, India, Indonesia, Malaysia, Pakistan, Philippines, South Africa, Taiwan, Thailand, Venezuela, Vietnam). Production volume data for Egypt, Pakistan, the
Philippines, Taiwan, Venezuela and Vietnam are substituted with locally-assembled sales volume data. South Africa’s production volume figure for 2014 is estimated by FOURIN.
(Created using data from national automotive associations and other sources)
0
200
400
600
800
1,000
1,200
2004 2005 2006 2007 2008 2009 2010 2011 2012 2013 2014
(1,000 units)
Others
Malaysia
India
Argentina
South Africa
Indonesia
Thailand
0
200
400
600
800
1,000
1,200
2004 2005 2006 2007 2008 2009 2010 2011 2012 2013 2014
(1,000 units)
Fortuner
Hilux
Innova
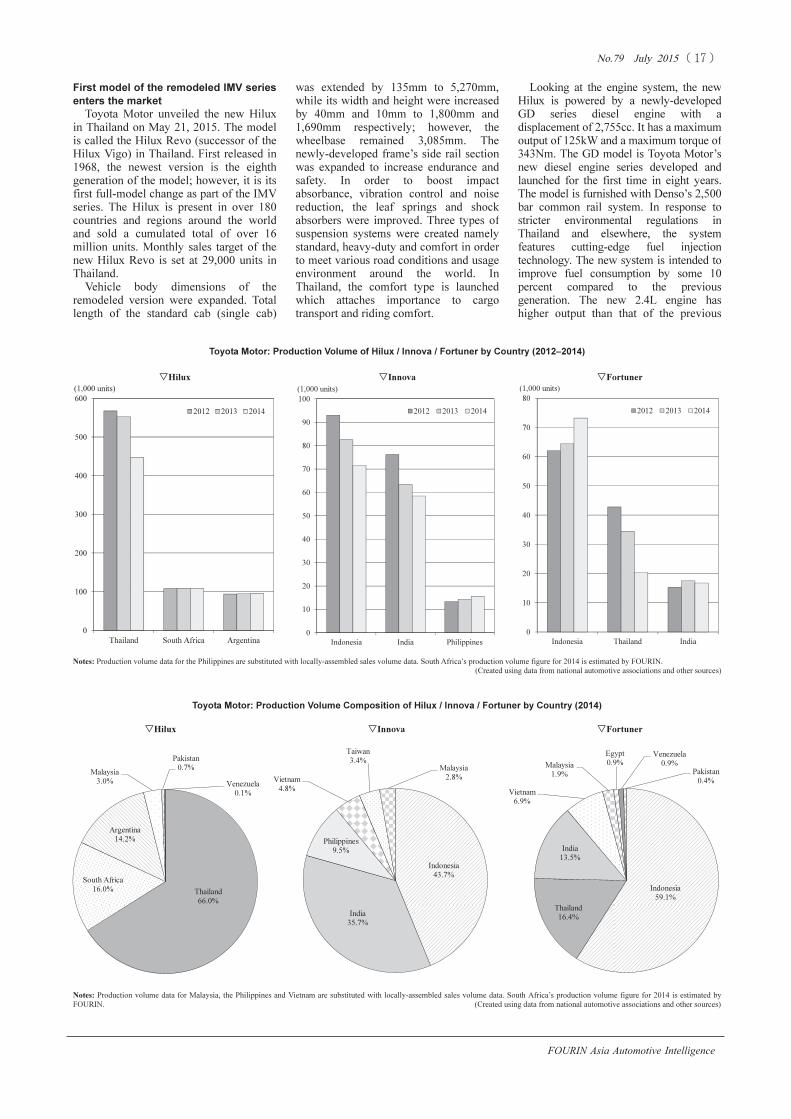
���������� ��� ���� ��������
����� ����� !"����
FOURIN Asia Automotive Intelligence
First model of the remodeled IMV series
enters the market
Toyota Motor unveiled the new Hilux
in Thailand on May 21, 2015. The model
is called the Hilux Revo (successor of the
Hilux Vigo) in Thailand. First released in
1968, the newest version is the eighth
generation of the model; however, it is its
first full-model change as part of the IMV
series. The Hilux is present in over 180
countries and regions around the world
and sold a cumulated total of over 16
million units. Monthly sales target of the
new Hilux Revo is set at 29,000 units in
Thailand.
Vehicle body dimensions of the
remodeled version were expanded. Total
length of the standard cab (single cab)
Looking at the engine system, the new
Hilux is powered by a newly-developed
GD series diesel engine with a
displacement of 2,755cc. It has a maximum
output of 125kW and a maximum torque of
343Nm. The GD model is Toyota Motor’s
new diesel engine series developed and
launched for the first time in eight years.
The model is furnished with Denso’s 2,500
bar common rail system. In response to
stricter environmental regulations in
Thailand and elsewhere, the system
features cutting-edge fuel injection
technology. The new system is intended to
improve fuel consumption by some 10
percent compared to the previous
generation. The new 2.4L engine has
higher output than that of the previous
was extended by 135mm to 5,270mm,
while its width and height were increased
by 40mm and 10mm to 1,800mm and
1,690mm respectively; however, the
wheelbase remained 3,085mm. The
newly-developed frame’s side rail section
was expanded to increase endurance and
safety. In order to boost impact
absorbance, vibration control and noise
reduction, the leaf springs and shock
absorbers were improved. Three types of
suspension systems were created namely
standard, heavy-duty and comfort in order
to meet various road conditions and usage
environment around the world. In
Thailand, the comfort type is launched
which attaches importance to cargo
transport and riding comfort.
Toyota Motor: Production Volume of Hilux / Innova / Fortuner by Country (2012–2014)
Toyota Motor: Production Volume Composition of Hilux / Innova / Fortuner by Country (2014)
�Hilux
Notes: Production volume data for Malaysia, the Philippines and Vietnam are substituted with locally-assembled sales volume data. South Africa’s production volume figure for 2014 is estimated by
FOURIN.� � (Created using data from national automotive associations and other sources)
�Innova �Fortuner
Notes: Production volume data for the Philippines are substituted with locally-assembled sales volume data. South Africa’s production volume figure for 2014 is estimated by FOURIN.
(Created using data from national automotive associations and other sources)
�
�Hilux �Innova �Fortuner
0
100
200
300
400
500
600
Thailand South Africa Argentina
(1,000 units)
2012 2013 2014
Thailand
66.0%
South Africa
16.0%
Argentina
14.2%
Malaysia
3.0%
Pakistan
0.7%
Venezuela
0.1%
Indonesia
43.7%
India
35.7%
Philippines
9.5%
Vietnam
4.8%
Taiwan
3.4%
Malaysia
2.8%
Indonesia
59.1%
Thailand
16.4%
India
13.5%
Vietnam
6.9%
Malaysia
1.9%
Egypt
0.9%
Venezuela
0.9%
Pakistan
0.4%
0
10
20
30
40
50
60
70
80
Indonesia Thailand India
(1,000 units)
2012 2013 2014
0
10
20
30
40
50
60
70
80
90
100
Indonesia India Philippines
(1,000 units)
2012 2013 2014
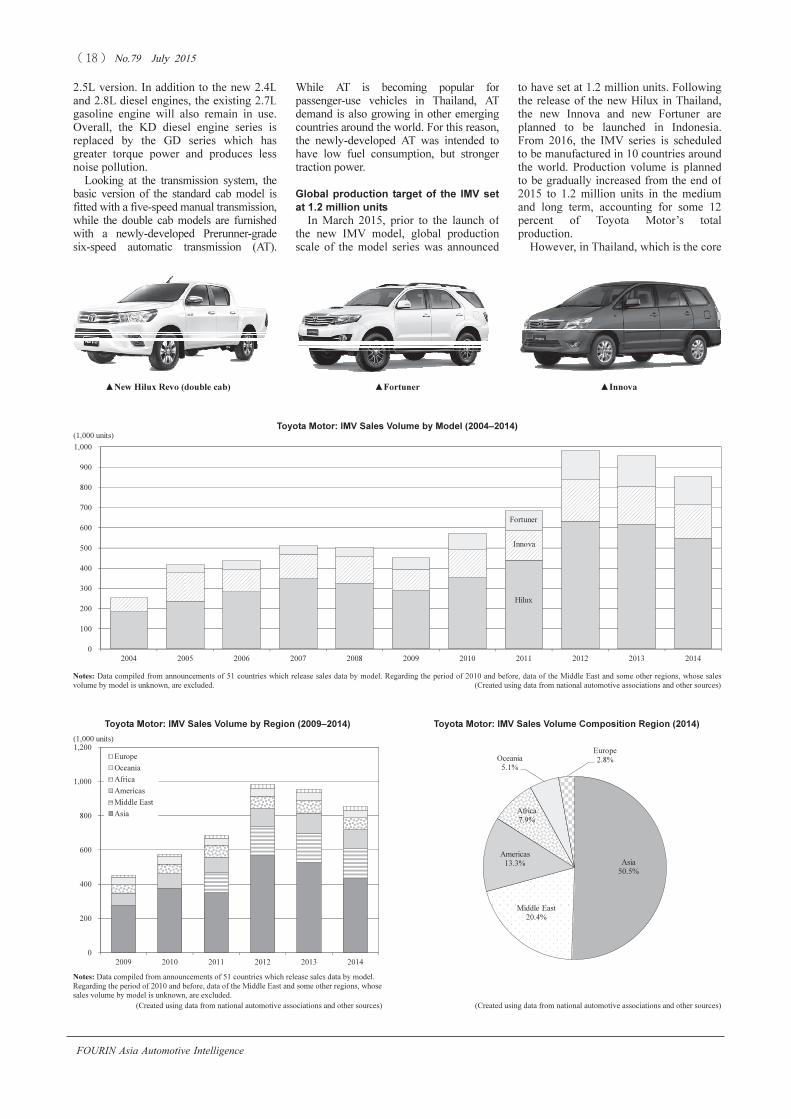
���������� ��� ���� ��������
����� ����� !"����
FOURIN Asia Automotive Intelligence
2.5L version. In addition to the new 2.4L
and 2.8L diesel engines, the existing 2.7L
gasoline engine will also remain in use.
Overall, the KD diesel engine series is
replaced by the GD series which has
greater torque power and produces less
noise pollution.
Looking at the transmission system, the
basic version of the standard cab model is
fitted with a five-speed manual transmission,
while the double cab models are furnished
with a newly-developed Prerunner-grade
six-speed automatic transmission (AT).
While AT is becoming popular for
passenger-use vehicles in Thailand, AT
demand is also growing in other emerging
countries around the world. For this reason,
the newly-developed AT was intended to
have low fuel consumption, but stronger
traction power.
Global production target of the IMV set
at 1.2 million units
In March 2015, prior to the launch of
the new IMV model, global production
scale of the model series was announced
to have set at 1.2 million units. Following
the release of the new Hilux in Thailand,
the new Innova and new Fortuner are
planned to be launched in Indonesia.
From 2016, the IMV series is scheduled
to be manufactured in 10 countries around
the world. Production volume is planned
to be gradually increased from the end of
2015 to 1.2 million units in the medium
and long term, accounting for some 12
percent of Toyota Motor’s total
production.
However, in Thailand, which is the core
Toyota Motor: IMV Sales Volume by Region (2009–2014)
Toyota Motor: IMV Sales Volume by Model (2004–2014)
Notes: Data compiled from announcements of 51 countries which release sales data by model. Regarding the period of 2010 and before, data of the Middle East and some other regions, whose sales
volume by model is unknown, are excluded.� � (Created using data from national automotive associations and other sources)
�
Toyota Motor: IMV Sales Volume Composition Region (2014)
(Created using data from national automotive associations and other sources)
Notes: Data compiled from announcements of 51 countries which release sales data by model.
Regarding the period of 2010 and before, data of the Middle East and some other regions, whose
sales volume by model is unknown, are excluded.
(Created using data from national automotive associations and other sources)
▲New Hilux Revo (double cab) ▲Fortuner ▲Innova
0
100
200
300
400
500
600
700
800
900
1,000
2004 2005 2006 2007 2008 2009 2010 2011 2012 2013 2014
(1,000 units)
Fortuner
Hilux
Innova
0
200
400
600
800
1,000
1,200
2009 2010 2011 2012 2013 2014
(1,000 units)
Europe
Oceania
Africa
Americas
Middle East
Asia
Asia
50.5%
Middle East
20.4%
Americas
13.3%
Africa
7.9%
Oceania
5.1%
Europe
2.8%
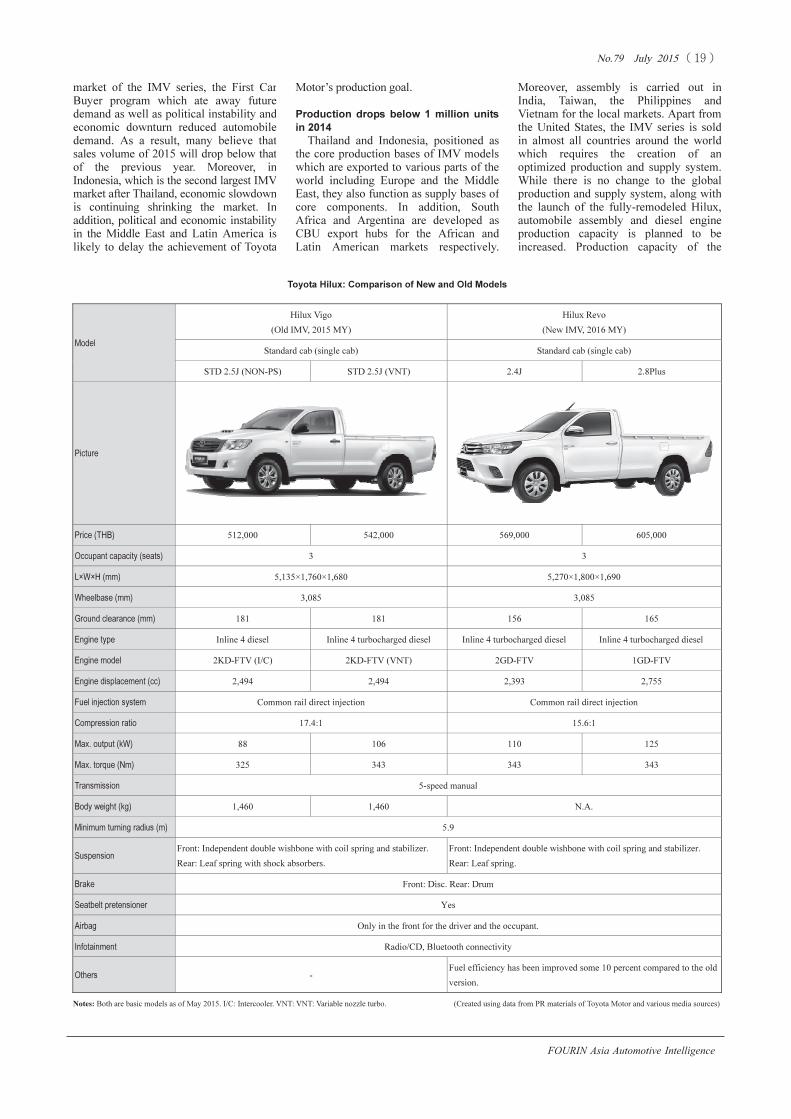
���������� ��� ���� ��������
����� ����� !"����
FOURIN Asia Automotive Intelligence
market of the IMV series, the First Car
Buyer program which ate away future
demand as well as political instability and
economic downturn reduced automobile
demand. As a result, many believe that
sales volume of 2015 will drop below that
of the previous year. Moreover, in
Indonesia, which is the second largest IMV
market after Thailand, economic slowdown
is continuing shrinking the market. In
addition, political and economic instability
in the Middle East and Latin America is
likely to delay the achievement of Toyota
Motor’s production goal.
Production drops below 1 million units
in 2014
Thailand and Indonesia, positioned as
the core production bases of IMV models
which are exported to various parts of the
world including Europe and the Middle
East, they also function as supply bases of
core components. In addition, South
Africa and Argentina are developed as
CBU export hubs for the African and
Latin American markets respectively.
Moreover, assembly is carried out in
India, Taiwan, the Philippines and
Vietnam for the local markets. Apart from
the United States, the IMV series is sold
in almost all countries around the world
which requires the creation of an
optimized production and supply system.
While there is no change to the global
production and supply system, along with
the launch of the fully-remodeled Hilux,
automobile assembly and diesel engine
production capacity is planned to be
increased. Production capacity of the
Toyota Hilux: Comparison of New and Old Models
Notes: Both are basic models as of May 2015. I/C: Intercooler. VNT: VNT: Variable nozzle turbo. (Created using data from PR materials of Toyota Motor and various media sources)
Model
Hilux Vigo
(Old IMV, 2015 MY)
Hilux Revo
(New IMV, 2016 MY)
Standard cab (single cab) Standard cab (single cab)
STD 2.5J (NON-PS) STD 2.5J (VNT) 2.4J 2.8Plus
Picture
Price (THB) 512,000 542,000 569,000 605,000
Occupant capacity (seats) 3 3
L×W×H (mm) 5,135×1,760×1,680 5,270×1,800×1,690
Wheelbase (mm) 3,085 3,085
Ground clearance (mm) 181 181 156 165
Engine type Inline 4 diesel Inline 4 turbocharged diesel Inline 4 turbocharged diesel Inline 4 turbocharged diesel
Engine model 2KD-FTV (I/C) 2KD-FTV (VNT) 2GD-FTV 1GD-FTV
Engine displacement (cc) 2,494 2,494 2,393 2,755
Fuel injection system Common rail direct injection Common rail direct injection
Compression ratio 17.4:1 15.6:1
Max. output (kW) 88 106 110 125
Max. torque (Nm) 325 343 343 343
Transmission 5-speed manual
Body weight (kg) 1,460 1,460 N.A.
Minimum turning radius (m) 5.9
Suspension
Front: Independent double wishbone with coil spring and stabilizer.
Rear: Leaf spring with shock absorbers.
Front: Independent double wishbone with coil spring and stabilizer.
Rear: Leaf spring.
Brake Front: Disc. Rear: Drum
Seatbelt pretensioner Yes
Airbag Only in the front for the driver and the occupant.
Infotainment Radio/CD, Bluetooth connectivity
Others -
Fuel efficiency has been improved some 10 percent compared to the old
version.

���������� ��� ���� ��������
����� ����� !"����
FOURIN Asia Automotive Intelligence
automobile plant in Argentina is
scheduled to be raised as well to 140,000
units.
After coming off the line in 2004,
global production volume of the IMV
series significantly increased in the
second year of manufacturing and
remained between 400,000 and 500,000
units during the 2005 to 2008 period, after
which it rose to 800,000 units in 2010
driven by market expansion in Thailand.
After a slight drop in 2011, volume
reached its peak level of over 1.1 million
units in 2012. Due to the contraction of
the Thai market in 2013 and 2014,
volume declined for two consecutive
years. In 2014, global volume shrank 12.0
percent to 964,000 units, Hilux, which
accounts for 70 percent of IMV sales,
down 13.8 percent to 676,000 units,
Innova down 8.2 percent to 164,000 units
and Fortuner down 6.6 percent to 124,000
units. In the largest manufacturing base
Thailand, production volume went down
20.5 percent to 467,000 units, posting the
largest fall among the 12 countries which
make IMV models. (Gangbok LEE)
Toyota Motor: IMV Production Bases (As of Dec. 2014)
(Created using data from PR materials of Toyota Motor and various media sources)
Region Country Local Company [Abbr.] Ownership SOP (Est.) Plant (Location)
Products
(including IMV only)
Annual Production
Capacity (units)
Asia
Thailand
Toyota Motor Thailand Co., Ltd.
[TMT]
Toyota 86.4%
1964
Samrong plant
(Samutprakarn)
Hilux
230,000
→290,000
(2015)
2007
Ban Pho plant
(Chachoengsao)
Hilux, Fortuner
220,000
→280,000
(2015)
Siam Toyota Mfg. Co., Ltd.
[STM]
Toyota 96% 1989
Bangpakong plant
(Chachoengsao)
Gasoline, diesel engines
for IMV, propeller shaft
GE: 680,000
DE: 320,000
→610,000
(2015)
Indonesia
P.T. Toyota Motor Mfg., Indonesia
[TMMIN]
Toyota 95%
1998
Karawang No. 1 plant
(Karawang
International Industrial
City, West Java
province)
Kijang Innova, Fortuner 130,000
1973
Sunter No. 1 plant
(Jakarta Sunter)
Gasoline engines for
IMV (2.0L and larger)
195,000
Malaysia Assembly Services [ASSB]
UMW Toyota
Motor 100%
(1968) (Selangor state) Hilux, Innova, Fortuner
85,000
(two shifts)
Philippines
Toyota Motor Philippines Corp. [TMP] Toyota 34%
1989
(1988)
(Santa Rosa,
Laguna state)
Innova 37,000
Toyota Autoparts Philippines Co., Ltd.
[TAP]
TMP 95%
1964
(1963)
(Santa Rosa,
Laguna state)
Manual transmissions,
constant velocity joints
MT: 330,000
CVJ: 200,000
Vietnam
Toyota Motor Vietnam Co., Ltd.
[TMV]
Toyota 70%
1996
(1995)
(Vinh Phuc province) Innova, Fortuner
36,000
(two shifts)
Taiwan Kuozui Motors, Ltd. Toyota 65%
1995
(1984)
Kuanying plant
(Taoyuan county)
Innova 118,000
India
Toyota Kirloskar Motor Pvt. Ltd.
[TKM]
Toyota 89% 1999
No. 1 plant
(Near Bangalore,
Karnataka state)
Innova, Fortuner 100,000
Toyota Kirloskar Auto Parts Pvt. Ltd.
[TKAP]
Toyota 64% 2002
No. 1 plant
(Near Bangalore,
Karnataka state)
Five-speed manual
transmissions, front/rear
axles, propeller shafts
MT: 180,000
Pakistan Indus Motor Company Ltd. [IMC] N.A. 1993 (Karachi) Hilux, Fortuner 50,000
Kazakhstan
Saryarka AvtoProm
(consignment production)
- 2014 (Kostanay province) Fortuner 3,000
Africa
South Africa
Toyota South Africa Motors (Pty) Ltd.
[TSAM]
N.A. 1962 (Sandton) Hilux, Fortuner 220,000
Egypt
Arab American Vehicle Co.
[AAV]
Toyota 40% N.A. (Cairo)
Fortuner
(Consignment production
from Apr. 2012)
3,000
Central &
South
America
Venezuela
Toyota de Venezuela Compania
Anonima [TDV]
Toyota 90% 1981 (Cumaná, Sucre) Fortuner, Hilux 24,000
Argentina
Toyota Argentina S.A.
[TASA]
N.A. 1997 (Buenos Aires) Hilux, Fortuner
92,000
→140,000
(end of 2015)
Brazil Toyota do Brasil S.A. [TDB] N.A. 1959 (São Paulo)
Undercarriage parts of
Hilux
N.A.
�

���������� ��� ���� ��������
����� ����� !"����
FOURIN Asia Automotive Intelligence
Toyota Motor: IMV Production Volume by Region/Country and Model (2009–2014)
Toyota Motor: Suppliers of Main Parts for the IMV Series (As of Jun. 2015)
(Created using data from PR materials of Toyota Motor and various media sources)
Notes: Includes only regions/countries with available model-specific production volume. Production volume data for Egypt, the Philippines and Vietnam are substituted with locally-assembled sales
volume data. (Created using data from PR materials of Toyota Motor and various media sources)
Area Supplier Component Area Supplier Component
Toyota in-house
(Siam Toyota Mfg.)
GD engine assembly KYB Shock absorbers
Toyota Industries
Turbochargers for GD engines
(procured from Japan)
ADVICS Brake systems
Aisin Takaoka Manifolds etc. JTEKT Electric power steering systems
Aichi Stel
Crankshafts, connecting rods, gears,
etc.
Chuo Spring Springs
Taiho Kogyo Vacuum pumps Toyoda Iron Works Brake pedals
Denso
Common rail systems, fuel injection
systems, etc.
Hino Rear axle frames
Nippon Gasket Gaskets for cylinder heads Yorozu Rear suspension etc.
Musashi Seimitsu Industry Engine gears JTEKT Bearings
Transmission Aisin AI 5/6-speed manual transmissions NTN Bearings
Exhaust Sango Exhaust pipes NSK Bearings
AC Denso AC systems Iida Industry Noise control materials
Sumitomo Electric Industries Wire harnesses Sumitomo Riko Anti-vibration rubber
Shiroki Window regulators Chuo Precision Industrial Aluminum/steel wheels
Tokai Rika Switches Murakami Side mirrors
Safety Toyoda Gosei Airbags Interior Toyota Boshoku Seats
Engine
Undercarriage
Bearing
Vibration and
noise control
Electrical
Exterior
(Units)
Region Country Model 2009 2010 2011 2012 2013 2014 Year-on-year
Hilux 262,452 389,816 318,507 567,229 552,612 446,650 ▼19.2%
Fortuner 31,467 45,408 19,418 42,782 34,398 20,297 ▼41.0%
Total 293,919 435,224 337,925 610,011 587,010 466,947 ▼20.5%
Innova 43,783 63,939 67,488 93,026 82,469 71,527 ▼13.3%
Fortuner 11,504 23,101 37,091 62,066 64,418 73,183 13.6%
Total 55,287 87,040 104,579 155,092 146,887 144,710 ▼1.5%
Innova 22,632 45,855 51,839 76,148 63,265 58,457 ▼7.6%
Fortuner 22,239 18,428 10,791 15,305 17,515 16,756 ▼4.3%
Total 44,871 64,283 62,630 91,453 80,780 75,213 ▼6.9%
Hilux 14,028 16,564 17,010 22,724 23,513 20,550 ▼12.6%
Innova 5,005 5,644 4,745 5,566 5,939 4,651 ▼21.7%
Fortuner 1,958 1,937 1,751 2,218 3,055 2,389 ▼21.8%
Total 20,991 24,145 23,506 30,508 32,507 27,590 ▼15.1%
Innova 8,475 7,419 6,005 4,233 6,014 7,895 31.3%
Fortuner 5,877 6,551 5,762 6,129 8,067 8,589 6.5%
Total 14,352 13,970 11,767 10,362 14,081 16,484 17.1%
Philippines Innova 10,328 12,608 11,805 13,379 14,376 15,566 8.3%
Taiwan Innova 2,060 2,625 3,233 9,529 6,289 5,634 ▼10.4%
Hilux 1,735 2,206 4,091 4,566 4,002 4,406 10.1%
Fortuner - - - - 1,073 552 ▼48.6%
Total 1,735 2,206 4,091 4,566 5,075 4,958 ▼2.3%
Total 443,543 642,101 559,536 924,900 887,005 757,102 ▼14.6%
South Africa Hilux 61,616 77,225 105,071 108,120 108,276 108,300 0.0%
Egypt Fortuner - - - 1,116 985 1,084 10.1%
Total 61,616 77,225 105,071 109,236 109,261 109,384 0.1%
Argentina Hilux 62,545 70,032 68,929 93,570 94,468 95,959 1.6%
Fortuner 3,016 4,693 3,458 4,300 3,220 1,080 ▼66.5%
Hilux 2,967 2,558 1,860 2,030 1,450 520 ▼64.1%
Total 5,983 7,251 5,318 6,330 4,670 1,600 ▼65.7%
Total 68,528 77,283 74,247 99,900 99,138 97,559 ▼1.6%
IMV production volume total 573,687 796,609 738,854 1,134,036 1,095,404 964,045 ▼12.0%
Hilux 405,343 558,401 515,468 798,239 784,321 676,385 ▼13.8%
Innova 92,283 138,090 145,115 201,881 178,352 163,730 ▼8.2%
Fortuner 76,061 100,118 78,271 133,916 132,731 123,930 ▼6.6%
Asia 443,543 642,101 559,536 924,900 887,005 757,102 ▼14.6%
Africa 61,616 77,225 105,071 109,236 109,261 109,384 0.1%
Americas 68,528 77,283 74,247 99,900 99,138 97,559 ▼1.6%
Africa
Americas Venezuela
Asia
Thailand
Indonesia
India
Malaysia
Vietnam
Pakistan

���������� ��� ���� ��������
����� ����� !"����
FOURIN Asia Automotive Intelligence
Toyota Motor: IMV Sales Volume by Region/Country and Model (2009–2014)
(Units)
Region Country Model 2009 2010 2011 2012 2013 2014 Year-on-year
Hilux *1 102,026 144,190 121,887 233,393 206,936 144,693 ▼30.1%
Fortuner 15,226 20,605 13,083 36,329 29,815 20,156 ▼32.4%
Innova 1,361 3,158 3,769 6,233 3,736 1,816 ▼51.4%
Total 118,613 167,953 138,739 275,955 240,487 166,665 ▼30.7%
Innova 35,989 53,824 54,763 71,685 64,539 56,157 ▼13.0%
Fortuner 7,967 10,712 13,111 20,498 17,974 18,916 5.2%
Hilux 4,746 7,687 8,301 12,556 14,129 9,206 ▼34.8%
Total 48,702 72,223 76,175 104,739 96,642 84,279 ▼12.8%
Innova 42,003 51,303 51,930 75,911 70,592 59,447 ▼15.8%
Fortuner 3,310 11,892 10,849 15,112 19,812 16,991 ▼14.2%
Total 45,313 63,195 62,779 91,023 90,404 76,438 ▼15.4%
Fortuner 5,839 7,548 7,774 11,617 13,106 18,643 42.2%
Innova 10,328 12,608 11,805 13,379 14,376 15,566 8.3%
Hilux 4,071 4,322 4,538 5,942 6,750 7,239 7.2%
Total 20,238 24,478 24,117 30,938 34,232 41,448 21.1%
Hilux 14,572 18,601 21,471 26,014 27,420 25,693 ▼6.3%
Innova 4,956 5,544 4,767 9,905 5,237 4,739 ▼9.5%
Fortuner 1,798 1,895 1,652 1,439 2,666 2,321 ▼12.9%
Total 21,326 26,040 27,890 37,358 35,323 32,753 ▼7.3%
Fortuner 5,877 6,551 5,762 6,129 8,067 8,589 6.5%
Innova 8,475 7,419 6,005 4,233 6,014 7,895 31.3%
Hilux 772 1,195 1,255 1,229 1,435 1,569 9.3%
Total 15,124 15,165 13,022 11,591 15,516 18,053 16.4%
Taiwan Innova 2,411 2,566 3,003 8,850 6,785 6,024 ▼11.2%
Hilux 1,652 2,006 4,327 4,450 4,160 4,236 1.8%
Fortuner - - - - 1,039 484 ▼53.4%
Total 1,652 2,006 4,327 4,450 5,199 4,720 ▼9.2%
Fortuner 366 383 268 368 384 593 54.4%
Innova 283 327 278 362 340 285 ▼16.2%
Hilux 344 337 244 225 254 219 ▼13.8%
Total 993 1,047 790 955 978 1,097 12.2%
Fortuner 142 92 104 83 46 N.A. -
Hilux 10 10 8 8 13 N.A. -
Total 152 102 112 91 59 N.A. -
Total 274,524 374,775 350,954 565,950 525,625 431,477 ▼17.9%
Hilux N.A. N.A. 44,744 68,016 67,899 68,278 0.6%
Fortuner N.A. N.A. 13,275 14,872 16,304 17,024 4.4%
Innova N.A. N.A. 6,770 9,345 10,451 11,057 5.8%
Total N.A. N.A. 64,789 92,233 94,654 96,359 1.8%
Hilux N.A. N.A. 18,996 29,929 26,760 23,538 ▼12.0%
Fortuner N.A. N.A. 1,520 2,139 2,903 2,565 ▼11.6%
Innova N.A. N.A. 717 679 616 N.A. -
Total N.A. N.A. 21,233 32,747 30,279 26,103 ▼13.8%
Hilux N.A. N.A. 11,416 19,904 17,140 20,098 17.3%
Fortuner N.A. N.A. 3,745 4,807 5,836 5,308 ▼9.0%
Innova N.A. N.A. 957 1,016 1,572 N.A. -
Total N.A. N.A. 16,118 25,727 24,548 25,406 3.5%
Hilux N.A. N.A. 5,551 8,367 7,545 11,555 53.1%
Innova N.A. N.A. 906 943 1,563 1,616 3.4%
Fortuner N.A. N.A. 420 624 600 N.A. -
Total N.A. N.A. 6,877 9,934 9,708 13,171 35.7%
Fortuner N.A. N.A. 353 504 779 866 11.2%
Hilux N.A. N.A. 5,079 7,053 6,770 6,516 ▼3.8%
Total N.A. N.A. 5,432 7,557 7,549 7,382 ▼2.2%
Middle East
Saudi Arabia
Oman
UAE
Kuwait
Qatar
Asia
Thailand
Indonesia
India
Philippines
Malaysia
Vietnam
Pakistan
Brunei
Singapore
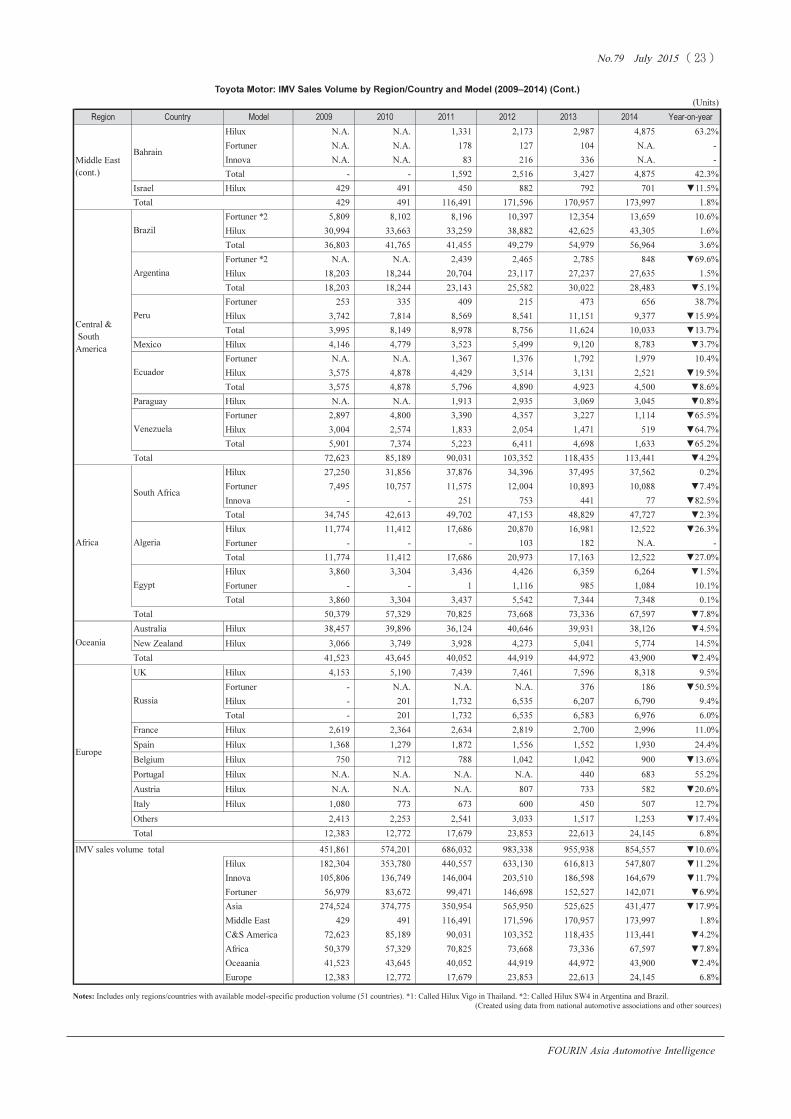
���������� ��� ���� ��������
����� ����� !"����
FOURIN Asia Automotive Intelligence
Notes: Includes only regions/countries with available model-specific production volume (51 countries). *1: Called Hilux Vigo in Thailand. *2: Called Hilux SW4 in Argentina and Brazil.
(Created using data from national automotive associations and other sources)
Toyota Motor: IMV Sales Volume by Region/Country and Model (2009–2014) (Cont.)�
(Units)
Region Country Model 2009 2010 2011 2012 2013 2014 Year-on-year
Hilux N.A. N.A. 1,331 2,173 2,987 4,875 63.2%
Fortuner N.A. N.A. 178 127 104 N.A. -
Innova N.A. N.A. 83 216 336 N.A. -
Total - - 1,592 2,516 3,427 4,875 42.3%
Israel Hilux 429 491 450 882 792 701 ▼11.5%
Total 429 491 116,491 171,596 170,957 173,997 1.8%
Fortuner *2 5,809 8,102 8,196 10,397 12,354 13,659 10.6%
Hilux 30,994 33,663 33,259 38,882 42,625 43,305 1.6%
Total 36,803 41,765 41,455 49,279 54,979 56,964 3.6%
Fortuner *2 N.A. N.A. 2,439 2,465 2,785 848 ▼69.6%
Hilux 18,203 18,244 20,704 23,117 27,237 27,635 1.5%
Total 18,203 18,244 23,143 25,582 30,022 28,483 ▼5.1%
Fortuner 253 335 409 215 473 656 38.7%
Hilux 3,742 7,814 8,569 8,541 11,151 9,377 ▼15.9%
Total 3,995 8,149 8,978 8,756 11,624 10,033 ▼13.7%
Mexico Hilux 4,146 4,779 3,523 5,499 9,120 8,783 ▼3.7%
Fortuner N.A. N.A. 1,367 1,376 1,792 1,979 10.4%
Hilux 3,575 4,878 4,429 3,514 3,131 2,521 ▼19.5%
Total 3,575 4,878 5,796 4,890 4,923 4,500 ▼8.6%
Paraguay Hilux N.A. N.A. 1,913 2,935 3,069 3,045 ▼0.8%
Fortuner 2,897 4,800 3,390 4,357 3,227 1,114 ▼65.5%
Hilux 3,004 2,574 1,833 2,054 1,471 519 ▼64.7%
Total 5,901 7,374 5,223 6,411 4,698 1,633 ▼65.2%
Total 72,623 85,189 90,031 103,352 118,435 113,441 ▼4.2%
Hilux 27,250 31,856 37,876 34,396 37,495 37,562 0.2%
Fortuner 7,495 10,757 11,575 12,004 10,893 10,088 ▼7.4%
Innova - - 251 753 441 77 ▼82.5%
Total 34,745 42,613 49,702 47,153 48,829 47,727 ▼2.3%
Hilux 11,774 11,412 17,686 20,870 16,981 12,522 ▼26.3%
Fortuner - - - 103 182 N.A. -
Total 11,774 11,412 17,686 20,973 17,163 12,522 ▼27.0%
Hilux 3,860 3,304 3,436 4,426 6,359 6,264 ▼1.5%
Fortuner - - 1 1,116 985 1,084 10.1%
Total 3,860 3,304 3,437 5,542 7,344 7,348 0.1%
Total 50,379 57,329 70,825 73,668 73,336 67,597 ▼7.8%
Australia Hilux 38,457 39,896 36,124 40,646 39,931 38,126 ▼4.5%
New Zealand Hilux 3,066 3,749 3,928 4,273 5,041 5,774 14.5%
Total 41,523 43,645 40,052 44,919 44,972 43,900 ▼2.4%
UK Hilux 4,153 5,190 7,439 7,461 7,596 8,318 9.5%
Fortuner - N.A. N.A. N.A. 376 186 ▼50.5%
Hilux - 201 1,732 6,535 6,207 6,790 9.4%
Total - 201 1,732 6,535 6,583 6,976 6.0%
France Hilux 2,619 2,364 2,634 2,819 2,700 2,996 11.0%
Spain Hilux 1,368 1,279 1,872 1,556 1,552 1,930 24.4%
Belgium Hilux 750 712 788 1,042 1,042 900 ▼13.6%
Portugal Hilux N.A. N.A. N.A. N.A. 440 683 55.2%
Austria Hilux N.A. N.A. N.A. 807 733 582 ▼20.6%
Italy Hilux 1,080 773 673 600 450 507 12.7%
Others 2,413 2,253 2,541 3,033 1,517 1,253 ▼17.4%
Total 12,383 12,772 17,679 23,853 22,613 24,145 6.8%
IMV sales volume total 451,861 574,201 686,032 983,338 955,938 854,557 ▼10.6%
Hilux 182,304 353,780 440,557 633,130 616,813 547,807 ▼11.2%
Innova 105,806 136,749 146,004 203,510 186,598 164,679 ▼11.7%
Fortuner 56,979 83,672 99,471 146,698 152,527 142,071 ▼6.9%
Asia 274,524 374,775 350,954 565,950 525,625 431,477 ▼17.9%
Middle East 429 491 116,491 171,596 170,957 173,997 1.8%
C&S America 72,623 85,189 90,031 103,352 118,435 113,441 ▼4.2%
Africa 50,379 57,329 70,825 73,668 73,336 67,597 ▼7.8%
Oceaania 41,523 43,645 40,052 44,919 44,972 43,900 ▼2.4%
Europe 12,383 12,772 17,679 23,853 22,613 24,145 6.8%
Europe
Russia
Middle East
(cont.)
Bahrain
Central &
South
America
Brazil
Argentina
Peru
Ecuador
Venezuela
Africa
South Africa
Algeria
Egypt
Oceania
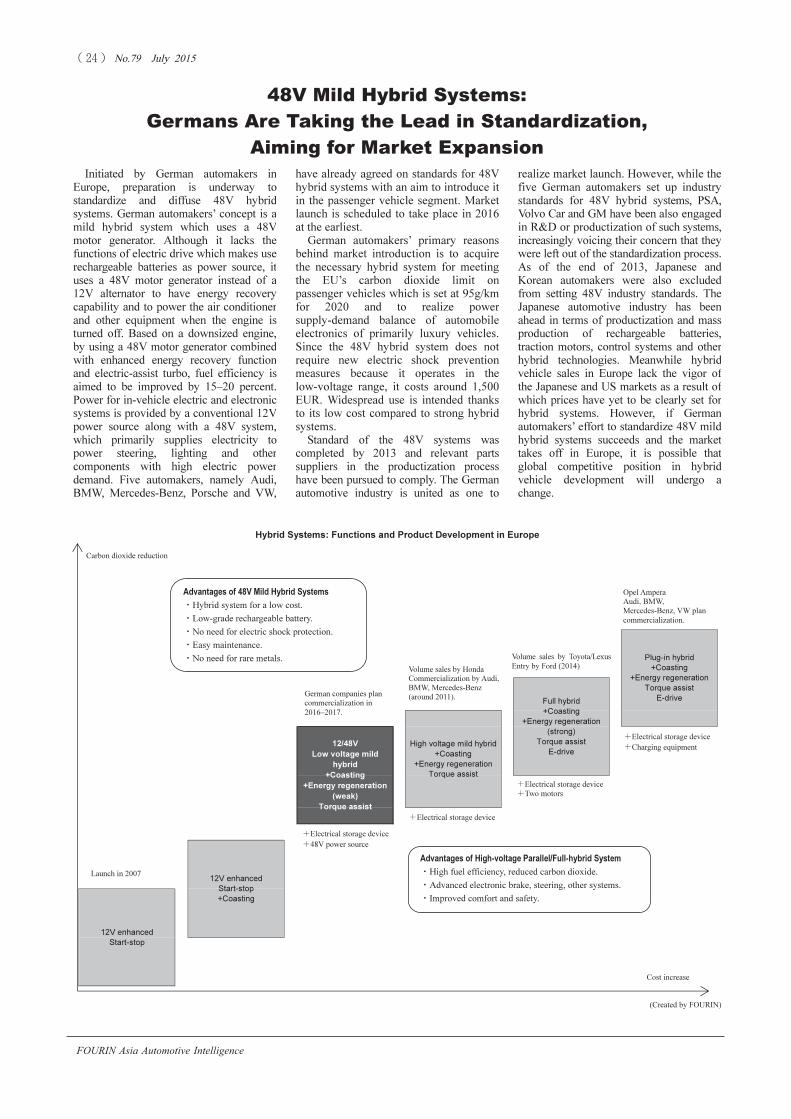
���������� ��� ���� ��������
����� ����� !"����
FOURIN Asia Automotive Intelligence
48V Mild Hybrid Systems:
Germans Are Taking the Lead in Standardization,
Aiming for Market Expansion
Initiated by German automakers in
Europe, preparation is underway to
standardize and diffuse 48V hybrid
systems. German automakers’ concept is a
mild hybrid system which uses a 48V
motor generator. Although it lacks the
functions of electric drive which makes use
rechargeable batteries as power source, it
uses a 48V motor generator instead of a
12V alternator to have energy recovery
capability and to power the air conditioner
and other equipment when the engine is
turned off. Based on a downsized engine,
by using a 48V motor generator combined
with enhanced energy recovery function
and electric-assist turbo, fuel efficiency is
aimed to be improved by 15–20 percent.
Power for in-vehicle electric and electronic
systems is provided by a conventional 12V
power source along with a 48V system,
which primarily supplies electricity to
power steering, lighting and other
components with high electric power
demand. Five automakers, namely Audi,
BMW, Mercedes-Benz, Porsche and VW,
realize market launch. However, while the
five German automakers set up industry
standards for 48V hybrid systems, PSA,
Volvo Car and GM have been also engaged
in R&D or productization of such systems,
increasingly voicing their concern that they
were left out of the standardization process.
As of the end of 2013, Japanese and
Korean automakers were also excluded
from setting 48V industry standards. The
Japanese automotive industry has been
ahead in terms of productization and mass
production of rechargeable batteries,
traction motors, control systems and other
hybrid technologies. Meanwhile hybrid
vehicle sales in Europe lack the vigor of
the Japanese and US markets as a result of
which prices have yet to be clearly set for
hybrid systems. However, if German
automakers’ effort to standardize 48V mild
hybrid systems succeeds and the market
takes off in Europe, it is possible that
global competitive position in hybrid
vehicle development will undergo a
change.
have already agreed on standards for 48V
hybrid systems with an aim to introduce it
in the passenger vehicle segment. Market
launch is scheduled to take place in 2016
at the earliest.
German automakers’ primary reasons
behind market introduction is to acquire
the necessary hybrid system for meeting
the EU’s carbon dioxide limit on
passenger vehicles which is set at 95g/km
for 2020 and to realize power
supply-demand balance of automobile
electronics of primarily luxury vehicles.
Since the 48V hybrid system does not
require new electric shock prevention
measures because it operates in the
low-voltage range, it costs around 1,500
EUR. Widespread use is intended thanks
to its low cost compared to strong hybrid
systems.
Standard of the 48V systems was
completed by 2013 and relevant parts
suppliers in the productization process
have been pursued to comply. The German
automotive industry is united as one to
(Created by FOURIN)
Hybrid Systems: Functions and Product Development in Europe
Advantages of 48V Mild Hybrid Systems
�Hybrid system for a low cost.
�Low-grade rechargeable battery.
�No need for electric shock protection.
�Easy maintenance.
�No need for rare metals.
Advantages of High-voltage Parallel/Full-hybrid System
�High fuel efficiency, reduced carbon dioxide.
�Advanced electronic brake, steering, other systems.
�Improved comfort and safety.
�Electrical storage device
�48V power source
German companies plan
commercialization in
2016–2017.
Volume sales by Honda
Commercialization by Audi,
BMW, Mercedes-Benz
(around 2011).
Volume sales by Toyota/Lexus
Entry by Ford (2014)
Opel Ampera
Audi, BMW,
Mercedes-Benz, VW plan
commercialization.
�Electrical storage device
�Electrical storage device
�Two motors
�Electrical storage device
�Charging equipment
Carbon dioxide reduction
Cost increase
Launch in 2007
�
12V enhanced
Start-stop
Plug-in hybrid
+Coasting
+Energy regeneration
Torque assist
E-driveFull hybrid
+Coasting
+Energy regeneration
(strong)
Torque assist
E-drive
High voltage mild hybrid
+Coasting
+Energy regeneration
Torque assist
12/48V
Low voltage mild
hybrid
+Coasting
+Energy regeneration
(weak)
Torque assist
12V enhanced
Start-stop
+Coasting
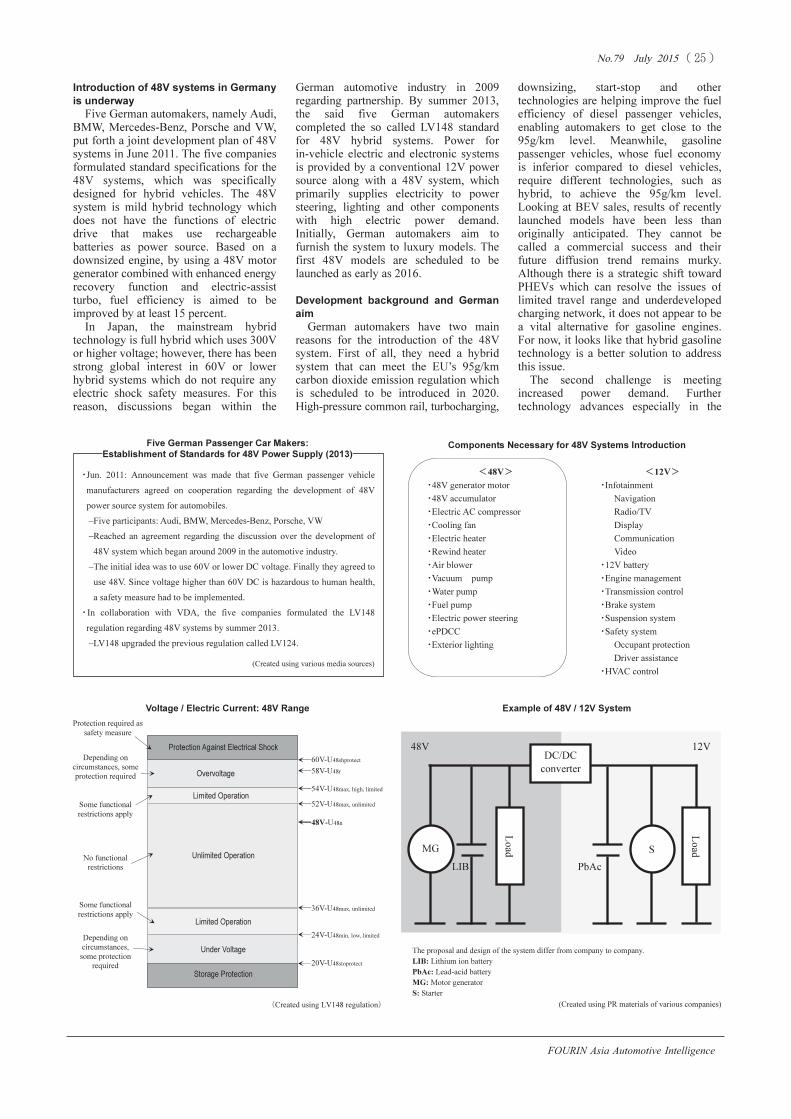
���������� ��� ���� ��������
����� ����� !"����
FOURIN Asia Automotive Intelligence
�Jun. 2011: Announcement was made that five German passenger vehicle
manufacturers agreed on cooperation regarding the development of 48V
power source system for automobiles.
–Five participants: Audi, BMW, Mercedes-Benz, Porsche, VW
–Reached an agreement regarding the discussion over the development of
48V system which began around 2009 in the automotive industry.
–The initial idea was to use 60V or lower DC voltage. Finally they agreed to
use 48V. Since voltage higher than 60V DC is hazardous to human health,
a safety measure had to be implemented.
�In collaboration with VDA, the five companies formulated the LV148
regulation regarding 48V systems by summer 2013.
–LV148 upgraded the previous regulation called LV124.
Introduction of 48V systems in Germany
is underway
Five German automakers, namely Audi,
BMW, Mercedes-Benz, Porsche and VW,
put forth a joint development plan of 48V
systems in June 2011. The five companies
formulated standard specifications for the
48V systems, which was specifically
designed for hybrid vehicles. The 48V
system is mild hybrid technology which
does not have the functions of electric
drive that makes use rechargeable
batteries as power source. Based on a
downsized engine, by using a 48V motor
generator combined with enhanced energy
recovery function and electric-assist
turbo, fuel efficiency is aimed to be
improved by at least 15 percent.
In Japan, the mainstream hybrid
technology is full hybrid which uses 300V
or higher voltage; however, there has been
strong global interest in 60V or lower
hybrid systems which do not require any
electric shock safety measures. For this
reason, discussions began within the
downsizing, start-stop and other
technologies are helping improve the fuel
efficiency of diesel passenger vehicles,
enabling automakers to get close to the
95g/km level. Meanwhile, gasoline
passenger vehicles, whose fuel economy
is inferior compared to diesel vehicles,
require different technologies, such as
hybrid, to achieve the 95g/km level.
Looking at BEV sales, results of recently
launched models have been less than
originally anticipated. They cannot be
called a commercial success and their
future diffusion trend remains murky.
Although there is a strategic shift toward
PHEVs which can resolve the issues of
limited travel range and underdeveloped
charging network, it does not appear to be
a vital alternative for gasoline engines.
For now, it looks like that hybrid gasoline
technology is a better solution to address
this issue.
The second challenge is meeting
increased power demand. Further
technology advances especially in the
German automotive industry in 2009
regarding partnership. By summer 2013,
the said five German automakers
completed the so called LV148 standard
for 48V hybrid systems. Power for
in-vehicle electric and electronic systems
is provided by a conventional 12V power
source along with a 48V system, which
primarily supplies electricity to power
steering, lighting and other components
with high electric power demand.
Initially, German automakers aim to
furnish the system to luxury models. The
first 48V models are scheduled to be
launched as early as 2016.
Development background and German
aim
German automakers have two main
reasons for the introduction of the 48V
system. First of all, they need a hybrid
system that can meet the EU’s 95g/km
carbon dioxide emission regulation which
is scheduled to be introduced in 2020.
High-pressure common rail, turbocharging,
60V-U48shprotect
58V-U48r
54V-U48max, high, limited
52V-U48max, unlimited
48V-U48n
36V-U48max, unlimited
24V-U48min, low, limited
20V-U48stoprotect
The proposal and design of the system differ from company to company.
LIB: Lithium ion battery
PbAc: Lead-acid battery
MG: Motor generator
S: Starter�
Voltage / Electric Current: 48V Range
�Created using LV148 regulation�
(Created using various media sources)
(Created using PR materials of various companies)
Example of 48V / 12V System
�48V� �12V�
�48V generator motor �Infotainment
�48V accumulator Navigation
�Electric AC compressor Radio/TV
�Cooling fan Display
�Electric heater Communication
�Rewind heater Video
�Air blower �12V battery
�Vacuum pump �Engine management
�Water pump �Transmission control
�Fuel pump �Brake system
�Electric power steering �Suspension system
�ePDCC �Safety system
�Exterior lighting Occupant protection
Driver assistance
�HVAC control
Components Necessary for 48V Systems Introduction Five German Passenger Car Makers:
Establishment of Standards for 48V Power Supply (2013)
Some functional
restrictions apply
Depending on
circumstances, some
protection required
Protection required as
safety measure
Overvoltage
Limited Operation
Unlimited Operation
Limited Operation
Under Voltage
Depending on
circumstances,
some protection
required
Some functional
restrictions apply
No functional
restrictions
DC/DC
converter
Lo
ad
S
Lo
ad
LIB PbAc
48V 12V
MG
Protection Against Electrical Shock
Storage Protection
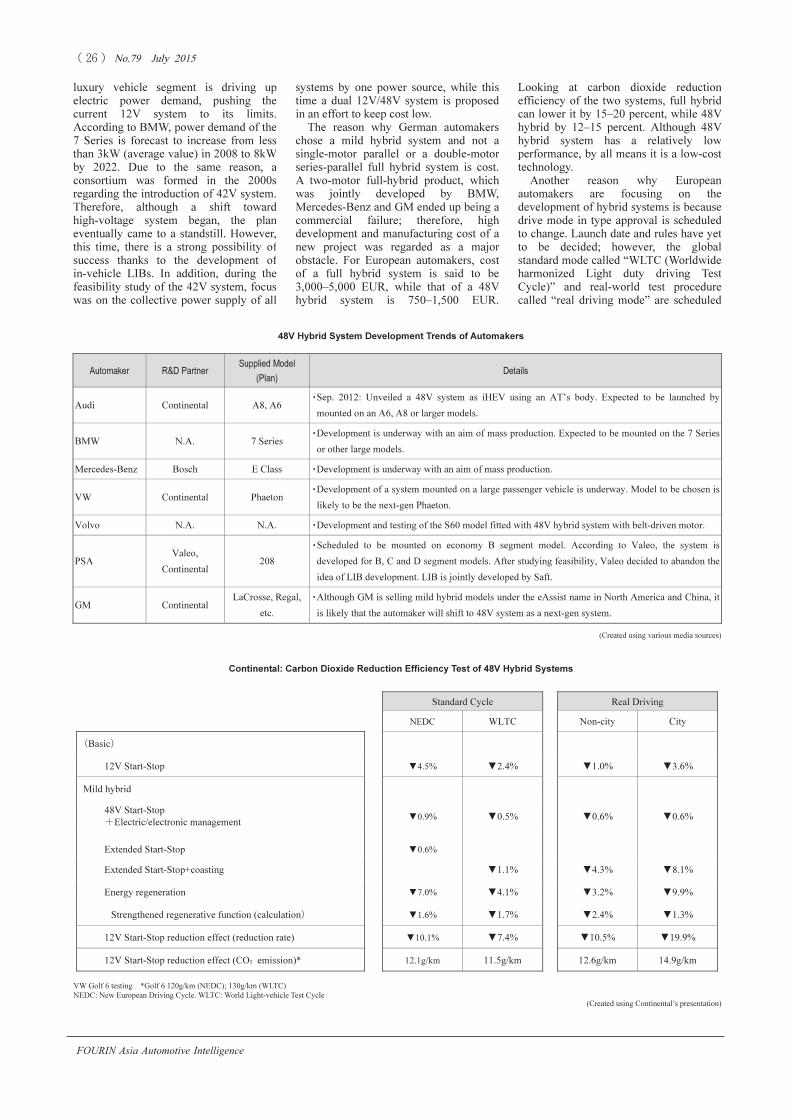
���������� ��� ���� ��������
����� ����� !"����
FOURIN Asia Automotive Intelligence
luxury vehicle segment is driving up
electric power demand, pushing the
current 12V system to its limits.
According to BMW, power demand of the
7 Series is forecast to increase from less
than 3kW (average value) in 2008 to 8kW
by 2022. Due to the same reason, a
consortium was formed in the 2000s
regarding the introduction of 42V system.
Therefore, although a shift toward
high-voltage system began, the plan
eventually came to a standstill. However,
this time, there is a strong possibility of
success thanks to the development of
in-vehicle LIBs. In addition, during the
feasibility study of the 42V system, focus
was on the collective power supply of all
systems by one power source, while this
time a dual 12V/48V system is proposed
in an effort to keep cost low.
The reason why German automakers
chose a mild hybrid system and not a
single-motor parallel or a double-motor
series-parallel full hybrid system is cost.
A two-motor full-hybrid product, which
was jointly developed by BMW,
Mercedes-Benz and GM ended up being a
commercial failure; therefore, high
development and manufacturing cost of a
new project was regarded as a major
obstacle. For European automakers, cost
of a full hybrid system is said to be
3,000–5,000 EUR, while that of a 48V
hybrid system is 750–1,500 EUR.
Looking at carbon dioxide reduction
efficiency of the two systems, full hybrid
can lower it by 15–20 percent, while 48V
hybrid by 12–15 percent. Although 48V
hybrid system has a relatively low
performance, by all means it is a low-cost
technology.
Another reason why European
automakers are focusing on the
development of hybrid systems is because
drive mode in type approval is scheduled
to change. Launch date and rules have yet
to be decided; however, the global
standard mode called “WLTC (Worldwide
harmonized Light duty driving Test
Cycle)” and real-world test procedure
called “real driving mode” are scheduled
VW Golf 6 testing *Golf 6 120g/km (NEDC); 130g/km (WLTC)� � �
NEDC: New European Driving Cycle. WLTC: World Light-vehicle Test Cycle�
Automaker R&D Partner
Supplied Model
(Plan)
Details
Audi Continental A8, A6
�Sep. 2012: Unveiled a 48V system as iHEV using an AT’s body. Expected to be launched by
mounted on an A6, A8 or larger models.
BMW N.A. 7 Series
�Development is underway with an aim of mass production. Expected to be mounted on the 7 Series
or other large models.
Mercedes-Benz Bosch E Class �Development is underway with an aim of mass production.
VW Continental Phaeton
�Development of a system mounted on a large passenger vehicle is underway. Model to be chosen is
likely to be the next-gen Phaeton.
Volvo N.A. N.A. �Development and testing of the S60 model fitted with 48V hybrid system with belt-driven motor.
PSA
Valeo,
Continental
208
�Scheduled to be mounted on economy B segment model. According to Valeo, the system is
developed for B, C and D segment models. After studying feasibility, Valeo decided to abandon the
idea of LIB development. LIB is jointly developed by Saft.
GM Continental
LaCrosse, Regal,
etc.
�Although GM is selling mild hybrid models under the eAssist name in North America and China, it
is likely that the automaker will shift to 48V system as a next-gen system.
48V Hybrid System Development Trends of Automakers
� � Standard Cycle Real Driving
� �
�
NEDC WLTC
�
Non-city City
�Basic� � � � �
� 12V Start-Stop �
�
▼4.5% ▼2.4% �
�
▼1.0% ▼3.6%
Mild hybrid � � � �
�
48V Start-Stop
�Electric/electronic management
▼0.9% ▼0.5% ▼0.6% ▼0.6%
�
Extended Start-Stop ▼0.6% � � �
� Extended Start-Stop+coasting � ▼1.1% ▼4.3% ▼8.1%
� Energy regeneration ▼7.0% ▼4.1% ▼3.2% ▼9.9%
� � Strengthened regenerative function (calculation�
�
�
▼1.6% ▼1.7%
�
�
▼2.4% ▼1.3%
� 12V Start-Stop reduction effect (reduction rate) ▼10.1% ▼7.4% ▼10.5% ▼19.9%
� 12V Start-Stop reduction effect (CO� emission)* 12.1g/km 11.5g/km 12.6g/km 14.9g/km
Continental: Carbon Dioxide Reduction Efficiency Test of 48V Hybrid Systems
(Created using Continental’s presentation)
� (Created using various media sources)
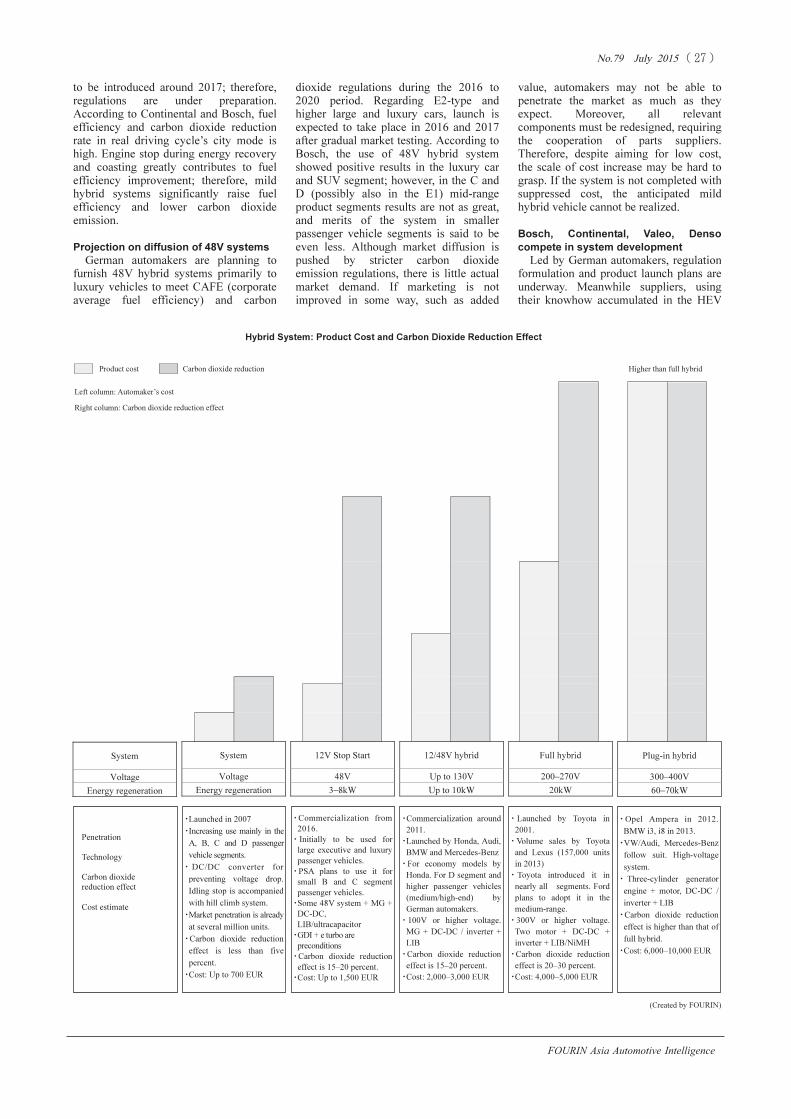
���������� ��� ���� ��������
����� ����� !"����
FOURIN Asia Automotive Intelligence
to be introduced around 2017; therefore,
regulations are under preparation.
According to Continental and Bosch, fuel
efficiency and carbon dioxide reduction
rate in real driving cycle’s city mode is
high. Engine stop during energy recovery
and coasting greatly contributes to fuel
efficiency improvement; therefore, mild
hybrid systems significantly raise fuel
efficiency and lower carbon dioxide
emission.
Projection on diffusion of 48V systems
German automakers are planning to
furnish 48V hybrid systems primarily to
luxury vehicles to meet CAFE (corporate
average fuel efficiency) and carbon
dioxide regulations during the 2016 to
2020 period. Regarding E2-type and
higher large and luxury cars, launch is
expected to take place in 2016 and 2017
after gradual market testing. According to
Bosch, the use of 48V hybrid system
showed positive results in the luxury car
and SUV segment; however, in the C and
D (possibly also in the E1) mid-range
product segments results are not as great,
and merits of the system in smaller
passenger vehicle segments is said to be
even less. Although market diffusion is
pushed by stricter carbon dioxide
emission regulations, there is little actual
market demand. If marketing is not
improved in some way, such as added
value, automakers may not be able to
penetrate the market as much as they
expect. Moreover, all relevant
components must be redesigned, requiring
the cooperation of parts suppliers.
Therefore, despite aiming for low cost,
the scale of cost increase may be hard to
grasp. If the system is not completed with
suppressed cost, the anticipated mild
hybrid vehicle cannot be realized.
Bosch, Continental, Valeo, Denso
compete in system development
Led by German automakers, regulation
formulation and product launch plans are
underway. Meanwhile suppliers, using
their knowhow accumulated in the HEV
Hybrid System: Product Cost and Carbon Dioxide Reduction Effect
Left column: Automaker’s cost
Right column: Carbon dioxide reduction effect
Penetration
Technology
Carbon dioxide
reduction effect
Cost estimate
(Created by FOURIN)
System
Voltage
Energy regeneration
12/48V hybrid
Up to 130V
Up to 10kW
12V Stop Start
48V
3–8kW
System
Voltage
Energy regeneration
Full hybrid
200–270V
20kW
Plug-in hybrid
300–400V
60–70kW
�Launched in 2007
�Increasing use mainly in the
A, B, C and D passenger
vehicle segments.
� DC/DC converter for
preventing voltage drop.
Idling stop is accompanied
with hill climb system.
�Market penetration is already
at several million units.
�Carbon dioxide reduction
effect is less than five
percent.
�Cost: Up to 700 EUR
�Commercialization from
2016.
� Initially to be used for
large executive and luxury
passenger vehicles.
�PSA plans to use it for
small B and C segment
passenger vehicles.
�Some 48V system + MG +
DC-DC,
LIB/ultracapacitor
�GDI + e turbo are
preconditions
�Carbon dioxide reduction
effect is 15–20 percent.
�Cost: Up to 1,500 EUR
�Commercialization around
2011.
�Launched by Honda, Audi,
BMW and Mercedes-Benz
�For economy models by
Honda. For D segment and
higher passenger vehicles
(medium/high-end) by
German automakers.
� 100V or higher voltage.
MG + DC-DC / inverter +
LIB
�Carbon dioxide reduction
effect is 15–20 percent.
�Cost: 2,000–3,000 EUR
� Launched by Toyota in
2001.
�Volume sales by Toyota
and Lexus (157,000 units
in 2013)
� Toyota introduced it in
nearly all segments. Ford
plans to adopt it in the
medium-range.
� 300V or higher voltage.
Two motor + DC-DC +
inverter + LIB/NiMH
�Carbon dioxide reduction
effect is 20–30 percent.
�Cost: 4,000–5,000 EUR
�Opel Ampera in 2012.
BMW i3, i8 in 2013.
�VW/Audi, Mercedes-Benz
follow suit. High-voltage
system.
� Three-cylinder generator
engine + motor, DC-DC /
inverter + LIB
�Carbon dioxide reduction
effect is higher than that of
full hybrid.
�Cost: 6,000–10,000 EUR
Carbon dioxide reduction Product cost Higher than full hybrid
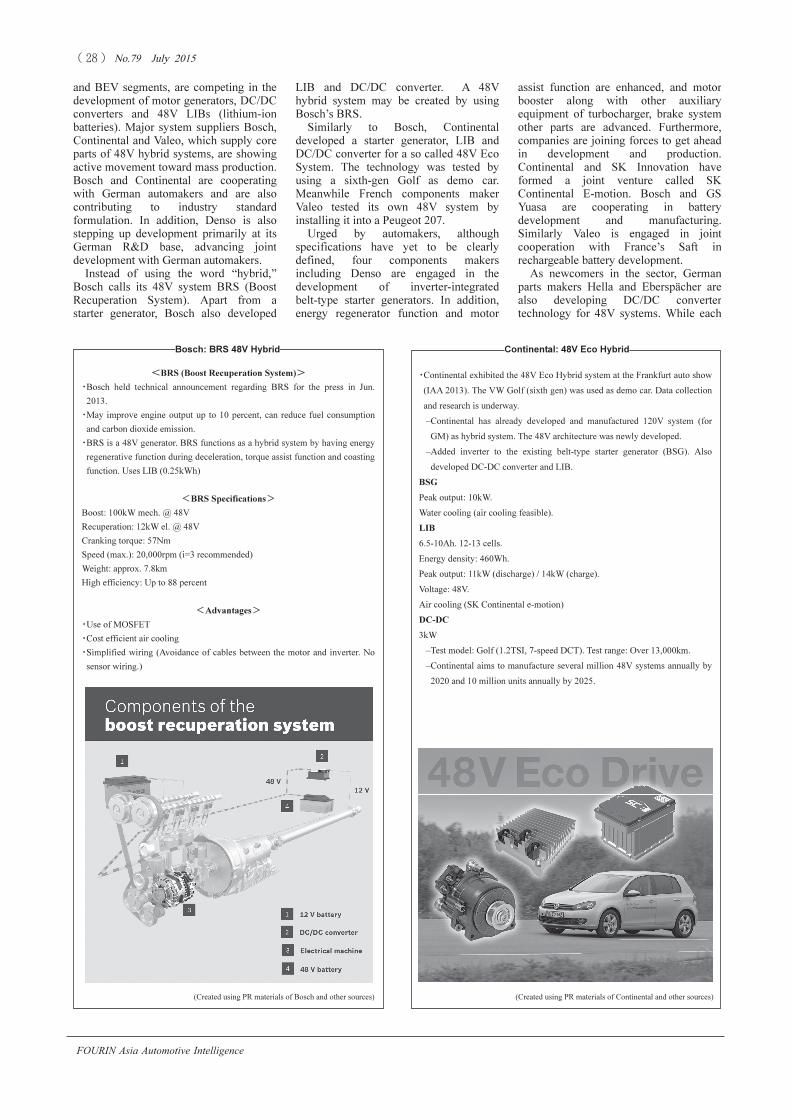
���������� ��� ���� ��������
����� ����� !"����
FOURIN Asia Automotive Intelligence
and BEV segments, are competing in the
development of motor generators, DC/DC
converters and 48V LIBs (lithium-ion
batteries). Major system suppliers Bosch,
Continental and Valeo, which supply core
parts of 48V hybrid systems, are showing
active movement toward mass production.
Bosch and Continental are cooperating
with German automakers and are also
contributing to industry standard
formulation. In addition, Denso is also
stepping up development primarily at its
German R&D base, advancing joint
development with German automakers.
Instead of using the word “hybrid,”
Bosch calls its 48V system BRS (Boost
Recuperation System). Apart from a
starter generator, Bosch also developed
LIB and DC/DC converter. A 48V
hybrid system may be created by using
Bosch’s BRS.
Similarly to Bosch, Continental
developed a starter generator, LIB and
DC/DC converter for a so called 48V Eco
System. The technology was tested by
using a sixth-gen Golf as demo car.
Meanwhile French components maker
Valeo tested its own 48V system by
installing it into a Peugeot 207.
Urged by automakers, although
specifications have yet to be clearly
defined, four components makers
including Denso are engaged in the
development of inverter-integrated
belt-type starter generators. In addition,
energy regenerator function and motor
assist function are enhanced, and motor
booster along with other auxiliary
equipment of turbocharger, brake system
other parts are advanced. Furthermore,
companies are joining forces to get ahead
in development and production.
Continental and SK Innovation have
formed a joint venture called SK
Continental E-motion. Bosch and GS
Yuasa are cooperating in battery
development and manufacturing.
Similarly Valeo is engaged in joint
cooperation with France’s Saft in
rechargeable battery development.
As newcomers in the sector, German
parts makers Hella and Eberspächer are
also developing DC/DC converter
technology for 48V systems. While each
�BRS (Boost Recuperation System)�
�Bosch held technical announcement regarding BRS for the press in Jun.
2013.
�May improve engine output up to 10 percent, can reduce fuel consumption
and carbon dioxide emission.
�BRS is a 48V generator. BRS functions as a hybrid system by having energy
regenerative function during deceleration, torque assist function and coasting
function. Uses LIB (0.25kWh)
�BRS Specifications�
Boost: 100kW mech. @ 48V
Recuperation: 12kW el. @ 48V
Cranking torque: 57Nm
Speed (max.): 20,000rpm (i=3 recommended)
Weight: approx. 7.8km
High efficiency: Up to 88 percent
�Advantages�
�Use of MOSFET
�Cost efficient air cooling
�Simplified wiring (Avoidance of cables between the motor and inverter. No
sensor wiring.)
�Continental exhibited the 48V Eco Hybrid system at the Frankfurt auto show
(IAA 2013). The VW Golf (sixth gen) was used as demo car. Data collection
and research is underway.
–Continental has already developed and manufactured 120V system (for
GM) as hybrid system. The 48V architecture was newly developed.
–Added inverter to the existing belt-type starter generator (BSG). Also
developed DC-DC converter and LIB.
BSG
Peak output: 10kW.
Water cooling (air cooling feasible).
LIB
6.5-10Ah. 12-13 cells.
Energy density: 460Wh.
Peak output: 11kW (discharge) / 14kW (charge).
Voltage: 48V.
Air cooling (SK Continental e-motion)
DC-DC
3kW
–Test model: Golf (1.2TSI, 7-speed DCT). Test range: Over 13,000km.
–Continental aims to manufacture several million 48V systems annually by
2020 and 10 million units annually by 2025.
(Created using PR materials of Bosch and other sources)
Bosch: BRS 48V Hybrid Continental: 48V Eco Hybrid
� (Created using PR materials of Continental and other sources)

���������� ��� ���� ��������
����� ����� !"����
FOURIN Asia Automotive Intelligence
�Hella is developing and manufacturing 12V start-stop system and DC/DC
converter for the said system.
–The start-stop system is supplied to the Ford Fusion (2013MY) which was
launched in North America.
–Began supplying DC/DC converters used for start-stop systems to
European automakers in 2007. Annual production scale stood at 1.5 million
units as of spring 2013.
–Supplies Mazda in Japan.
–Also developing DC/DC converters for electrical storage device which
save deceleration energy during braking.
�Hella is currently developing a high-powered DC/DC converter for 48V/12V
system.
–Maximum output of both is 3kW.
�An energy storage device is also under development.
�Put forth a proposal to limit carbon dioxide emission at 95g/km by 2020,
developing a 48V hybrid system called Hybrid4All. The system was
unveiled at the Paris auto show in Sep. 2012.
–Motor generator with 48V system. Engine is located in the front, while the
transmission is in the back. The system may be placed anywhere between
the engine and transmission.
–For A, B and C segment medium and small passenger vehicles.
–Proposed as an inexpensive solution. Costs 50 percent less than existing
hybrid systems. May improve fuel efficiency 13–15 percent.
�Developed belt-type i-BSG and DC/DC converter. The i-BSG is combined
with a converter. Uses LIB.
–As a system for B segment models, a 6–8kW BSG is best in terms of cost
effectiveness.
–Valeo is collaborating with France’s Saft to develop LIBs.
�The Peugeot 207 1.6 Turbo GDi is used as demo car for testing.
�According to Valeo, total cost of this product (motor generator, inverter,
batteries, DC/DC converter, auxiliary equipment) as a mild hybrid system is
currently 1,000–1,400 EUR. However, if annual production scale were
40,000 units it would be a little over 1,200 EUR, if 150,000 units it would be
a little over 1,000 EUR and if 1 million units it would be less than 800 EUR.
�Valeo projects that hybrids will account for 10-12 percent of the global light
vehicle market by 2020, of which mild hybrids will account for five percent.
By 2025, Valeo predicts that hybrids will account for 21 percent of which
mild hybrids for nine percent. In Europe, Valeo forecasts that hybrids will
account for 21 percent in 2020 (mild 10 percent) and for 36 percent in 2025
(mild 17 percent).
company specializes in components,
namely lighting and emission
respectively, they are stepping up
development in the electronics sector
including investing in human resources.
Standardization and next-gen hybrid
system innovation
Joint standardization by the five German
automakers must not be overlooked.
Speaking of five manufacturers, in fact
there are only three parties, because Audi
and Porsche are subsidiaries of the VW
Group. Standardization has been already
completed and relevant parts suppliers are
urged to supply the necessary components,
unifying the entire German automotive
industry behind this new trend. However,
PSA, Ford, Opel, Volvo Car, Valeo and
other US and European auto and parts
makers did not participate in setting up
48V standards similarly to Japanese and
Korean automakers.
The Japanese automotive industry is
ahead in both commercialization and
mass production of hybrid systems
including rechargeable batteries, traction
motors, power electronics and auxiliary
equipment. However, since the European
market lacks the kind of market expansion
which is present in the Japanese and US
markets and market evaluation of hybrid
vehicles has yet to be concluded Japanese
automakers are taking a wait-and-see
stance. A united front in standardization
by the latecomer German automotive
industry could be also looked at as a joint
countermeasure against Japanese
automakers. If German vehicle
manufacturers take the offensive by using
the 48V system, they may gain
momentum in hybrid vehicle diffusion in
Europe and they could even charge the
global status quo. Next-gen hybrid
vehicles will be evaluated by the market
depending on their overall advantages
including development and manufacturing
cost, environmental performance,
drivability and comfort among other
factors. The future will bring about
competition between Japanese and
German automakers in the hybrid
segment regarding cost and technology.
(Yachiyo TANAKA)
(Created using PR materials of Valeo)
Hella: Development of Start-Stop-type DC/DC for 48V System Valeo: Development of Hybrid4All 48V System
Hella: DC/DC converter
Valeo: BSG
�Eberspächer has developed
DC/DC converters for
plug-in hybrid and
48V/12V hybrid systems.
The products were
exhibited at the Frankfurt
auto show in Sep. 2013.�
� (Created using PR materials of Hella)
� (Created using PR materials of Eberspächer)
Eberspächer:
48V DC/DC converter
Eberspächer: Development of DC/DC for 48V Hybrid System
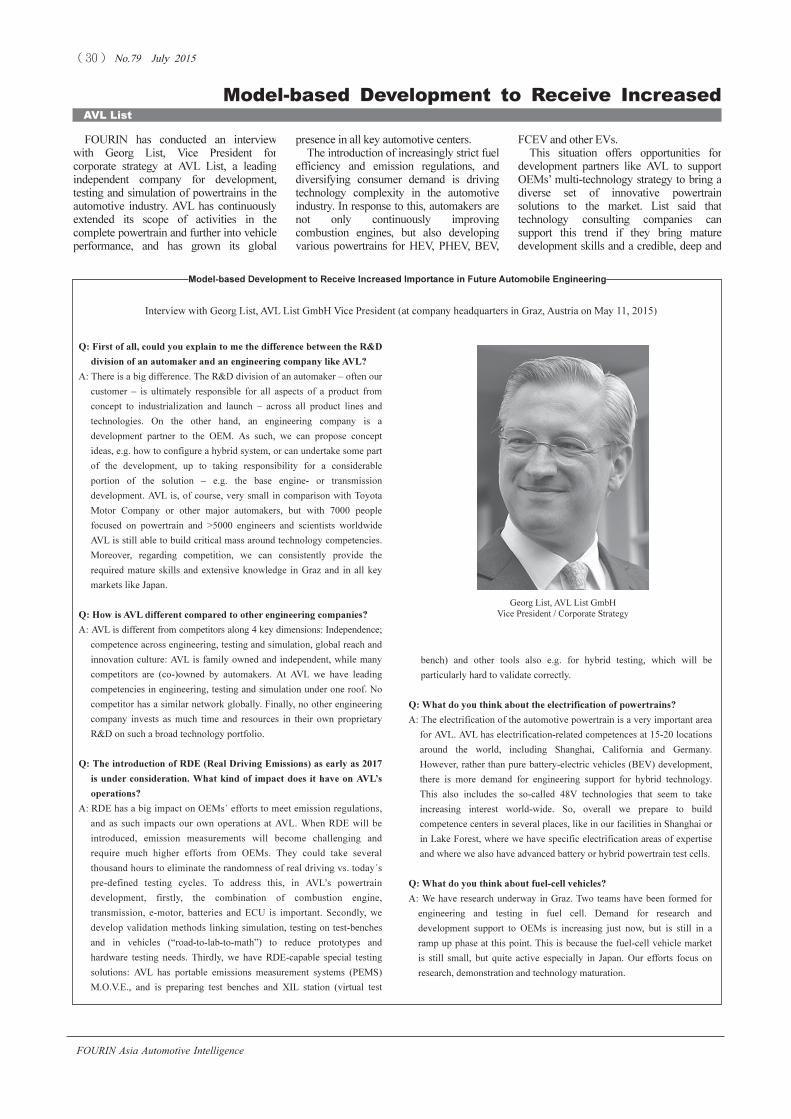
���������� ��� ���� ��������
����� ����� !"����
FOURIN Asia Automotive Intelligence
FOURIN has conducted an interview
with Georg List, Vice President for
corporate strategy at AVL List, a leading
independent company for development,
testing and simulation of powertrains in the
automotive industry. AVL has continuously
extended its scope of activities in the
complete powertrain and further into vehicle
performance, and has grown its global
� � � � Model-based Development to Receive Increased
AVL List
FCEV and other EVs.
This situation offers opportunities for
development partners like AVL to support
OEMs’ multi-technology strategy to bring a
diverse set of innovative powertrain
solutions to the market. List said that
technology consulting companies can
support this trend if they bring mature
development skills and a credible, deep and
presence in all key automotive centers.
The introduction of increasingly strict fuel
efficiency and emission regulations, and
diversifying consumer demand is driving
technology complexity in the automotive
industry. In response to this, automakers are
not only continuously improving
combustion engines, but also developing
various powertrains for HEV, PHEV, BEV,
Model-based Development to Receive Increased Importance in Future Automobile Engineering
Q: First of all, could you explain to me the difference between the R&D
division of an automaker and an engineering company like AVL?
A: There is a big difference. The R&D division of an automaker – often our
customer – is ultimately responsible for all aspects of a product from
concept to industrialization and launch – across all product lines and
technologies. On the other hand, an engineering company is a
development partner to the OEM. As such, we can propose concept
ideas, e.g. how to configure a hybrid system, or can undertake some part
of the development, up to taking responsibility for a considerable
portion of the solution – e.g. the base engine- or transmission
development. AVL is, of course, very small in comparison with Toyota
Motor Company or other major automakers, but with 7000 people
focused on powertrain and >5000 engineers and scientists worldwide
AVL is still able to build critical mass around technology competencies.
Moreover, regarding competition, we can consistently provide the
required mature skills and extensive knowledge in Graz and in all key
markets like Japan.
Q: How is AVL different compared to other engineering companies?
A: AVL is different from competitors along 4 key dimensions: Independence;
competence across engineering, testing and simulation, global reach and
innovation culture: AVL is family owned and independent, while many
competitors are (co-)owned by automakers. At AVL we have leading
competencies in engineering, testing and simulation under one roof. No
competitor has a similar network globally. Finally, no other engineering
company invests as much time and resources in their own proprietary
R&D on such a broad technology portfolio.
Q: The introduction of RDE (Real Driving Emissions) as early as 2017
is under consideration. What kind of impact does it have on AVL’s
operations?
A: RDE has a big impact on OEMs´ efforts to meet emission regulations,
and as such impacts our own operations at AVL. When RDE will be
introduced, emission measurements will become challenging and
require much higher efforts from OEMs. They could take several
thousand hours to eliminate the randomness of real driving vs. today´s
pre-defined testing cycles. To address this, in AVL’s powertrain
development, firstly, the combination of combustion engine,
transmission, e-motor, batteries and ECU is important. Secondly, we
develop validation methods linking simulation, testing on test-benches
and in vehicles (“road-to-lab-to-math”) to reduce prototypes and
hardware testing needs. Thirdly, we have RDE-capable special testing
solutions: AVL has portable emissions measurement systems (PEMS)
M.O.V.E., and is preparing test benches and XIL station (virtual test
bench) and other tools also e.g. for hybrid testing, which will be
particularly hard to validate correctly.
Q: What do you think about the electrification of powertrains?
A: The electrification of the automotive powertrain is a very important area
for AVL. AVL has electrification-related competences at 15-20 locations
around the world, including Shanghai, California and Germany.
However, rather than pure battery-electric vehicles (BEV) development,
there is more demand for engineering support for hybrid technology.
This also includes the so-called 48V technologies that seem to take
increasing interest world-wide. So, overall we prepare to build
competence centers in several places, like in our facilities in Shanghai or
in Lake Forest, where we have specific electrification areas of expertise
and where we also have advanced battery or hybrid powertrain test cells.
Q: What do you think about fuel-cell vehicles?
A: We have research underway in Graz. Two teams have been formed for
engineering and testing in fuel cell. Demand for research and
development support to OEMs is increasing just now, but is still in a
ramp up phase at this point. This is because the fuel-cell vehicle market
is still small, but quite active especially in Japan. Our efforts focus on
research, demonstration and technology maturation.
Interview with Georg List, AVL List GmbH Vice President (at company headquarters in Graz, Austria on May 11, 2015)
Georg List, AVL List GmbH
Vice President / Corporate Strategy�
���������� ��� ���� ��������
����� ����� !"����
FOURIN Asia Automotive Intelligence
Technology Reports
Importance in Future Automobile Engineering
broad technology competence.
Another upcoming challenge for
automakers is RDE (Real Driving
Emissions). A portable emissions
measurement system (PEMS) called
M.O.V.E. iS is one of the company’s
solutions in RDE. AVL is also integrating
real and virtual emission validation by
combining on-the-road and test bench
measurements and using xIL stations and
simulation. This is all intended to eliminate
randomness factors in RDE and reduce
development time and expenses said List.
But for both challenges – powertrain
technology diversity and RDE –
model-based development is likely to
become more and more important in the
future. Instead of optimizing each
component separately, there is a huge
potential to optimize the entire system and
the vehicle. AVL aims to bring the
knowledge of the best combination of the
five powertrain elements, namely
combustion engine, transmission, e-motor,
ECU and batteries in order to optimize its
powertrain solutions for Japanese and other
automakers. (Naofumi HIGASHI)
Q: How do you view the Japanese market as a globally active engineering
company?
A: The Japanese market is a leading market for automotive technology
and innovation. We have been present in Japan and committed to
Japanese customers for a considerable time. We have several facilities
in Japan. The engineering center – today located at AVL Japan
headquarters in Kawasaki – will move to a new tech center with
advanced testing capabilities. The groundbreaking ceremony for this
new technical center has just been held.
Over the past years, we have been successful in building close
partnerships with several leading Japanese OEMs. We have been
involved in many engine developments with gasoline direct injection
systems, in base engine developments for cars or commercial vehicles,
diesel engine/ aftertreatment development and calibration or
transmission systems and increasingly also in electrification solutions
as well as software and controls. Also, Japanese OEMs are seeking very
innovative development tools and advanced methodologies, where we
cooperate closely.
Q: How do you view China and Southeast Asia?
A: China is becoming an important automotive market, also for engineering
companies. AVL has a technical center in Shanghai, in Tianjin a
technical center was opened recently. AVL has secured a good market
position in China. Currently, AVL’s most important market is still
Europe, with Germany in particular, but we are investing heavily in
Japan and China and they are both growing fast for AVL. Naturally,
AVL has also technical centers in India and Korea.
Q: How do you view the future of the automotive industry?
A: I believe powertrain technology diversity will further increase in the
automotive industry. For instance, Toyota is developing combustion
engines, hybrid and fuel-cell vehicles. Each of these solutions will be
important, none of them will be a dominant for all customer segments.
Demand is different between cities and suburbs or between Tokyo and
Germany. And reduction of emission and CO2 drives the technology
race forward. In cities, emphasis on e-mobility will likely increase. For
company car users in Germany traveling more than 30,000km annually
a mild hybrid diesel engine is likely to be essential. In the US many
people own SUVs, which require different solutions. In other words,
consumers purchase specific models which suit their individual form of
usage. As a result, automakers must cover a wide scope in terms of
powertrain technology. This offers opportunities to bring innovations to
automakers for companies like AVL.
Combustion engines will likely power over half of all new vehicles even
10 years from now. When plug-in hybrid and other electric vehicles gain
traction, combustion engines will remain important and there is a lot of
potential left in gasoline, diesel and also gas, e.g. in improving their
thermal efficiency. In the long term, there is lots of room for
improvement; however, either way, combustion engines are not
expected to disappear for the time being.
Q: What do you plan to focus on the most in the future?
A: AVL invests approximately 10 percent of its sales revenue in our own
R&D every year. So we pursue a wide array of technologies and
innovations.
In order to improve the thermal efficiency of combustion engines, we
are pursuing countless ideas. Moreover, research is underway regarding
fuel-cell and other alternative energy technologies. Another area we
invest in is research in the “connected powertrain” parallel to the
connected and intelligent vehicle.
Across all this, AVL has set a priority to push forward competencies in
system engineering and model based development. The optimal
configuration of the five elements of the powertrain, namely
combustion engine, transmission, e-motor, ECU and batteries offers
great potential over and above the optimization of each powertrain
element.
And then, the powertrain is one system in the vehicle. Our core
competence is to optimize propulsion in the vehicle and we hope to
contribute in optimizing the vehicle given propulsion choices.
Customers do not buy powertrains. They buy attractive vehicles with
attractive performance. For that, powertrain, and vehicle should be
optimized in order to improve fuel efficiency, comfort, drivability,
safety and all that meeting emission regulations. That´s what we want
to participate in with system engineering and model based
development. (FOURIN)
Model-based Development to Receive Increased Importance in Future Automobile Engineering (Cont.)
AVL List GmbH
Headquarters: Hans-List-Platz 1, A-8020 Graz, Austria
Phone: +43 (0) 316 787-0
URL: www.avl.com
Established: 1948
Sales revenue: 1.15 billion EUR (2014)
Employees: 7,470 persons (2014)
Facilities: There are 26 technical centers in Germany, Sweden, the UK,
France, Hungary, Turkey, the US, Brazil, China, Japan, South Korea,
India and Australia, with over 220 test beds around the world.
AVL Japan:� KDX Musashi-Kosugi Building 2F, 3-1200, Shin-Maruko
Higashi, Nakahara-ku, Kawasaki-shi, Kanagawa, 211-0004
(New Japan Tech Center to open end of 2016 in Shinkawasaki)
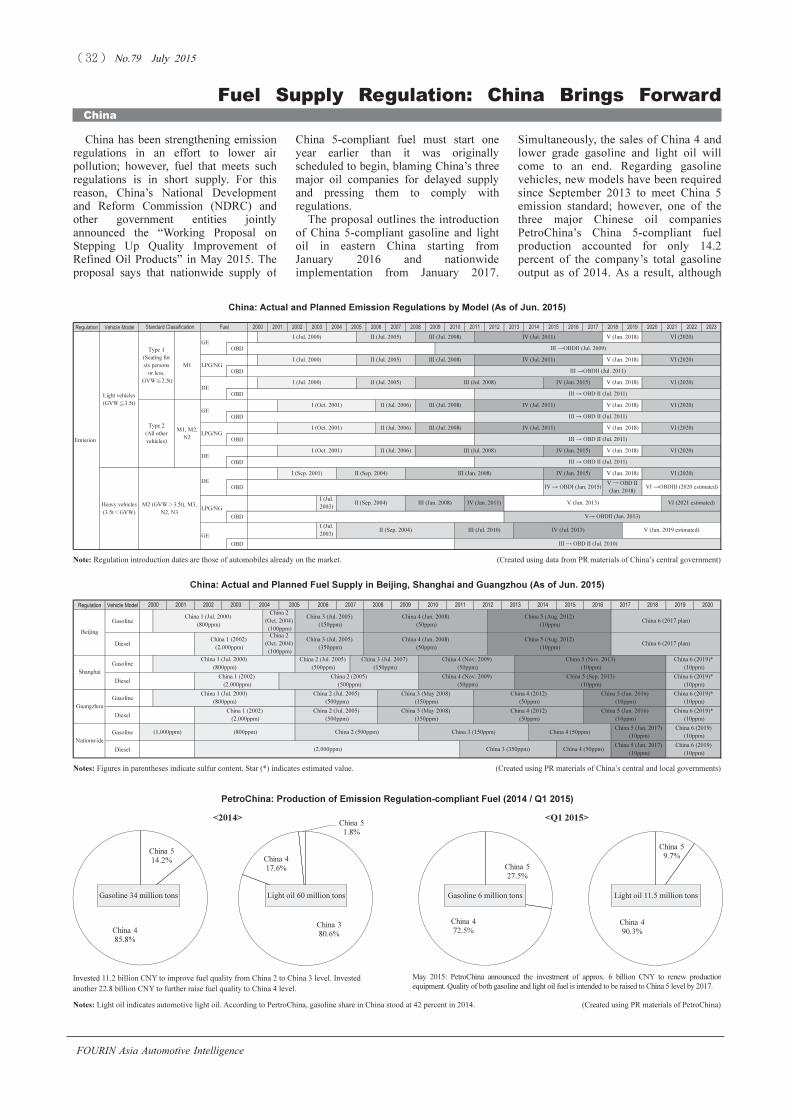
���������� ��� ���� ��������
����� ����� !"����
FOURIN Asia Automotive Intelligence
China 5
27.5%
China 4
72.5%
China 3
80.6%
China 4
17.6%
China 5
1.8%
China 5
14.2%
China 4
85.8%
China 5
9.7%
China 4
90.3%
China has been strengthening emission
regulations in an effort to lower air
pollution; however, fuel that meets such
regulations is in short supply. For this
reason, China’s National Development
and Reform Commission (NDRC) and
other government entities jointly
announced the “Working Proposal on
Stepping Up Quality Improvement of
Refined Oil Products” in May 2015. The
proposal says that nationwide supply of
Fuel Supply Regulation: China Brings Forward
China
Simultaneously, the sales of China 4 and
lower grade gasoline and light oil will
come to an end. Regarding gasoline
vehicles, new models have been required
since September 2013 to meet China 5
emission standard; however, one of the
three major Chinese oil companies
PetroChina’s China 5-compliant fuel
production accounted for only 14.2
percent of the company’s total gasoline
output as of 2014. As a result, although
China 5-compliant fuel must start one
year earlier than it was originally
scheduled to begin, blaming China’s three
major oil companies for delayed supply
and pressing them to comply with
regulations.
The proposal outlines the introduction
of China 5-compliant gasoline and light
oil in eastern China starting from
January 2016 and nationwide
implementation from January 2017.
China: Actual and Planned Emission Regulations by Model (As of Jun. 2015)
<2014> <Q1 2015>
Light oil 11.5 million tonsGasoline 6 million tonsLight oil 60 million tons
Notes: Light oil indicates automotive light oil. According to PertroChina, gasoline share in China stood at 42 percent in 2014. (Created using PR materials of PetroChina)
�
PetroChina: Production of Emission Regulation-compliant Fuel (2014 / Q1 2015)
May 2015: PetroChina announced the investment of approx. 6 billion CNY to renew production
equipment. Quality of both gasoline and light oil fuel is intended to be raised to China 5 level by 2017.
Note: Regulation introduction dates are those of automobiles already on the market. (Created using data from PR materials of China’s central government)
China: Actual and Planned Fuel Supply in Beijing, Shanghai and Guangzhou (As of Jun. 2015)
Invested 11.2 billion CNY to improve fuel quality from China 2 to China 3 level. Invested
another 22.8 billion CNY to further raise fuel quality to China 4 level.�
Notes: Figures in parentheses indicate sulfur content. Star (*) indicates estimated value. (Created using PR materials of China’s central and local governments)
Gasoline 34 million tons
Regulation Vehicle Model
OBD
OBD
OBD
OBD
OBD
OBD
OBD
OBD
OBD
III → OBD II (Jul. 2011)
I (Oct. 2001) II (Jul. 2006) III (Jul. 2008)
I (Jul.
2003)
II (Sep. 2004) III (Jul. 2010)
III → OBD II (Jul. 2011)
I (Oct. 2001) II (Jul. 2006) III (Jul. 2008) IV (Jan. 2015) V (Jan. 2018) VI (2020)
Light vehicles
(GVW�3.5t)
Type 1
(Seating for
six persons
or less,
GVW�2.5t)
M1
Heavy vehicles
(3.5t�GVW)
M2 (GVW�3.5t), M3,
N2, N3
Emission
GE
LPG/NG
DE
GE
LPG/NG
DE
DE
LPG/NG
GE
IV (Jul. 2013) V (Jan. 2019 estimated)
III → OBD II (Jul. 2010)
V→ OBDII (Jan. 2013)
I (Jul.
2003)
II (Sep. 2004) III (Jan. 2008) IV (Jan. 2011) V (Jan. 2013) VI (2021 estimated)
IV → OBDI (Jan. 2015)
V � OBD II
(Jan. 2018)
VI →OBDIII (2020 estimated)
I (Sep. 2001) II (Sep. 2004) III (Jan. 2008) IV (Jan. 2015) V (Jan. 2018) VI (2020)
III → OBD II (Jul. 2011)
Type 2
(All other
vehicles)
M1, M2,
N2
I (Jul. 2000) II (Jul. 2005) III (Jul. 2008) IV (Jan. 2015) V (Jan. 2018) VI (2020)
IV (Jul. 2011) V (Jan. 2018) VI (2020)
III → OBD II (Jul. 2011)
I (Oct. 2001) II (Jul. 2006) III (Jul. 2008) IV (Jul. 2011) V (Jan. 2018) VI (2020)
III →OBDII (Jul. 2011)
I (Jul. 2000) II (Jul. 2005) III (Jul. 2008) IV (Jul. 2011) V (Jan. 2018) VI (2020)
III �OBDII (Jul. 2009)
I (Jul. 2000) II (Jul. 2005) III (Jul. 2008) IV (Jul. 2011) V (Jan. 2018) VI (2020)
2022 20232016 2017 2018 2019 2020 20212010 2011 2012 2013 2014 20152004 2005 2006 2007 2008 2009Standard Classification Fuel 2000 2001 2002 2003
Regulation Vehicle Model
Gasoline
Diesel
Gasoline
Diesel
Gasoline
Diesel
Gasoline
Diesel
Beijing
Shanghai
Guangzhou
China 1 (2002)
(2,000ppm)
China 2 (2005)
(500ppm)
China 3 (Jul. 2005)
(350ppm)
China 4 (Jan. 2008)
(50ppm)
China 2 (Jul. 2005)
(500ppm)
China 3 (Jul. 2007)
(150ppm)
China 4 (Nov. 2009)
(50ppm)
China 2
(Oct. 2004)
(100ppm)
China 3 (Jul. 2005)
(150ppm)
China 4 (Jan. 2008)
(50ppm)
China 1 (2002)
(2,000ppm)
China 2
(Oct. 2004)
(100ppm)
Nationwide
China 5 (Aug. 2012)
(10ppm)
China 6 (2017 plan)
2016 2017 2018 2019 2020
China 5 (Jan. 2017)
(10ppm)
China 6 (2017 plan)
China 5 (Aug. 2012)
(10ppm)
China 4 (2012)
(50ppm)
China 4 (2012)
(50ppm)
China 6 (2019)*
(10ppm)
China 5 (Sep. 2013)
(10ppm)
China 5 (Nov. 2013)
(10ppm)
China 5 (Jan. 2017)
(10ppm)
China 3 (May 2008)
(350ppm)
China 4 (Nov. 2009)
(50ppm)
China 3 (May 2008)
(150ppm)
China 6 (2019)*
(10ppm)
China 5 (Jan. 2016)
(10ppm)
China 5 (Jan. 2016)
(10ppm)
China 6 (2019)*
(10ppm)
China 6 (2019)*
(10ppm)
China 6 (2019)
(10ppm)
China 4 (50ppm)
China 6 (2019)
(10ppm)
(2,000ppm)
China 1 (Jul. 2000)
(800ppm)
China 1 (2002)
(2,000ppm)
China 2 (Jul. 2005)
(500ppm)
China 2 (Jul. 2005)
(500ppm)
2014 20152004 2005 2006 2007 2008 2009
China 3 (350ppm) China 4 (50ppm)
China 1 (Jul. 2000)
(800ppm)
China 1 (Jul. 2000)
(800ppm)
2000 2001 2002 2003
(1,000ppm) (800ppm) China 2 (500ppm) China 3 (150ppm)
2010 2011 2012 2013

���������� ��� ���� ��������
����� ����� !"����
FOURIN Asia Automotive Intelligence
Asia Country Reports
Launch of China 5 to 2017; China 6 to Start in 2019
China 5-compliant automobiles are
already on the market, short supply of
appropriate fuel weakens the
effectiveness of emission regulations.
The proposal also requires oil companies
to increase supply capacity of China
5-compliant gasoline to 110.9 million
tons by the end of 2016, pushing them to
invest in China 5-compliant fuel
production. In response to the proposal,
PetroChina announced to invest some 6
billion CNY to raise gasoline and light
oil grade to China 5 level. PetroChina is
stepping up production in order to meet
the nationwide launch of China 5 fuel
regulation on automobiles already on the
market in January 2018.
While the nationwide supply of China
5 fuel is scheduled to start in 2017, the
proposal calls for the introduction of
China 6 fuel in 2019, leaving only two
years for oil companies to upgrade fuel
to China 6 level. PetroChina invested
11.2 billion CNY to raise fuel grade from
China 2 to China 3 level, another 22.8
billion CNY to reach China 4 level and
an additional 6 billion to achieve China 5
level. Growing expenses of oil
companies impact fuel prices, which in
turn increases the burden on consumers.
The trend may force the central
government to control oil prices.
(Takaharu HIRANO)
Working Proposal on Stepping Up Quality Improvement of Refined Oil Products (May 2015, Announced by NDRC Etc.)
Notes: Light oil in China is separated into regular light oil and automotive light oil. Regular light oil is used for tractors, construction machinery, ships, low-speed trucks and three wheelers among other
vehicles, while automotive light oil is used for all other automobiles. In the main text, light oil refers to automotive light oil, excluding regular light oil.
(Created using data from PR materials of China’s central government)
Administrative Unit Details
Beijing
�Jun. 1, 2016: China 5 emission regulation was introduced on diesel-powered heavy trucks.
�According to Beijing municipality, there are approx. 220,000 diesel heavy trucks in the city. Although they account for only 4 percent of
Beijing total vehicle fleet, they are responsible for 50 percent of all NOx emission and over 90 percent of PM. The implementation of
China 5 emission regulation on diesel heavy trucks is expected to reduce NOx emission by approx. 40 percent in Beijing.
�Beijing provides subsidies up to 21,500 CNY for the replacement of diesel heavy trucks.
�As of Jun. 2015, Beijing was engaged in the formulation of its own China 6-compliant fuel standard. The standard is expected to be
announced in 2015 and implemented in 2017.
Tianjin
�Starting from Jun. 1, 2015, newly-purchased large diesel public buses, garbage trucks and postal vans must meet China 5 emission standard.
�Simultaneously, China 4 and lower grade diesel public buses, garbage trucks and postal vans can be no longer registered.
�Starting from Sep. 1, 2015, newly-purchased light gasoline vehicles must meet China 5 emission standard and equipped with OBD to
monitor NOx emission.
Beijing / Tianjin: Emission Regulation and Fuel Supply Trends (As of Jun. 2015)
(Created using data from PR materials of China’s central government)
Subject Details
Expansion of regional supply of China
5-compliant gasoline and light oil
�Until now, Jingjinji (national capital region), Yangtze River Delta and Pearl River Delta enjoyed priority in terms of China
5-compliant fuel supply; however, the supplied area now includes 11 administrative units of the Coastal Region (Beijing,
Tianjin, Hebei, Liaoning, Shanghai, Jiangsu, Zhejiang, Fujian, Shandong, Guangdong, Hainan).
�By Oct. 31, 2015, suppliers of refined oil products of the Coastal Region plan to increase production capacity of China
5-compliant gasoline (incl. ethanol-gasoline mixture) and light oil.
�Starting from Jan. 1, 2016, the comprehensive supply of China 5-compliant gasoline (incl. E10 ethanol-gasoline mixture)
and light oil (incl. B5 biodiesel-petroleum diesel mixture) is scheduled to start in eastern China.
Beginning to supply China 5-compliant
gasoline and light oil ahead of schedule
�The nationwide supply of China 5-compliant fuel is planned to start one year earlier than it was originally scheduled to
begin on Jan. 1, 2018.
�By Oct. 31, 2015, suppliers of refined oil products plan to increase production capacity of China 5-compliant gasoline
(incl. ethanol-gasoline mixture) and light oil. Starting from Jan. 1, 2017, the nationwide supply of China 5-compliant
gasoline (incl. E10 ethanol-gasoline mixture) and light oil (incl. B5 biodiesel-petroleum diesel mixture) is scheduled to
start. Simultaneously, the sales of China 4 and lower grade gasoline and light oil are scheduled to end.
Regulation on quality improvement of light oil
�Starting from Jan. 1, 2016, the supply of China 4-compliant regular light oil is scheduled to begin in 11 administrative
units in eastern China.
�Starting from Jul. 1, 2017, the nationwide supply of China 4-compliant regular light oil is scheduled to start.
Simultaneously, the sales of China 3 and lower grade regular light oil are scheduled to end.
�Starting from Jan. 1, 2018, the nationwide supply of China 5-compliant regular light oil is scheduled to start.
Simultaneously, the sales of China 4 and lower grade regular light oil are scheduled to end.
Fuel supply quality requirements
�By the end of 2015, suppliers of refined oil products are expected to increase their combined supply capacity to 52.7
million tons of China 5-compliant gasoline and 61.7 million tons of China 5-compliant light oil.
–In 2016, production capacity in eastern China is expected to reach the required level of 64 million tons of gasoline and
53.1 million tons of light oil.
�By the end of 2016, nationwide production capacity is expected to reach the required level of 110.9 million tons of China
5-compliant gasoline and 155.9 million tons of China 5-compliant light oil.
Planned announcement of new quality standard
�By the end of Jun. 2015, a new compulsory national standard on light oil is scheduled to be announced
�National standard on China 6-compliant gasoline and light oil is scheduled to be announced at the end of 2016 and
implemented in 2019.
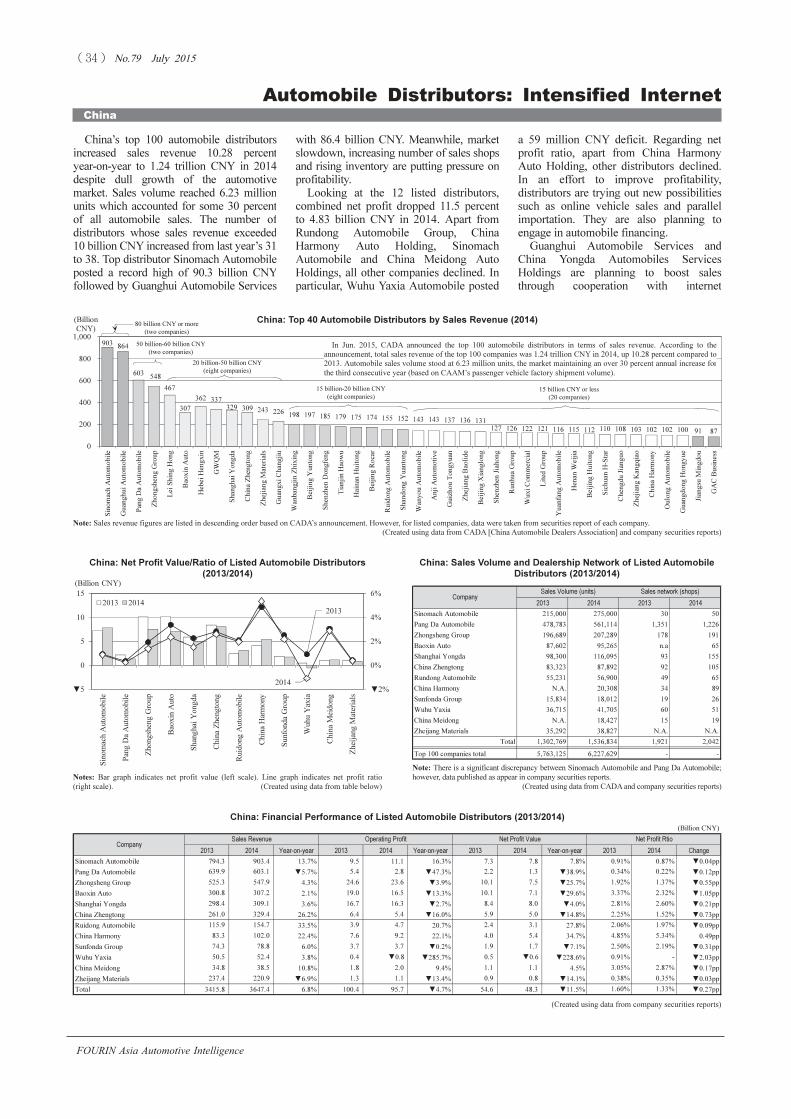
���������� ��� ���� ��������
����� ����� !"����
FOURIN Asia Automotive Intelligence
903 864
603
548
467
307
362 337
329 309 243
226 198 197
185 179 175 174 155 152 143 143 137 136 131
127 126 122 121 116 115 112 110 108 103 102 102 100 91 87
0
200
400
600
800
1,000
Sin
om
ach
A
utom
ob
ile
Gu
an
gh
ui A
uto
mob
ile
Pan
g D
a A
uto
mo
bile
Zh
on
gshen
g G
ro
up
Lei S
hin
g H
on
g
Bao
xin A
uto
Heb
ei H
en
gx
in
GW
QM
Shan
gh
ai Y
on
gd
a
Ch
in
a Z
hen
gto
ng
Zh
ejian
g M
aterials
Gu
an
gx
i C
han
gjiu
Wan
ban
gjin
Z
hix
in
g
Beijin
g Y
un
to
ng
Shen
zh
en
D
on
gfen
g
Tianjin H
ao
wu
Hain
an
H
uito
ng
Beijing R
ocar
Ru
id
on
g A
uto
mo
bile
Shan
do
ng
Y
uan
to
ng
Wan
yo
u A
uto
mo
bile
An
ji A
uto
mo
tiv
e
Gu
izh
ou
T
on
gy
uan
Zh
ejian
g B
ao
lid
e
Beijin
g X
ian
glo
ng
Shen
zh
en
Jiaho
ng
Ru
nh
ua G
ro
up
Wu
xi C
om
mercial
Lited
G
rou
p
Yu
an
fan
g A
uto
mo
bile
Hen
an W
eijia
Beijing
H
uito
ng
Sichuan H
-S
tar
Ch
en
gd
u Jian
gu
o
Zh
ejian
g K
an
gq
iao
Ch
in
a H
arm
on
y
Ou
lo
ng
A
uto
mo
bile
Guan
gd
on
g H
on
gy
ue
Jian
gsu
M
in
gd
ou
GA
C B
usin
ess
(Billion
CNY)
China’s top 100 automobile distributors
increased sales revenue 10.28 percent
year-on-year to 1.24 trillion CNY in 2014
despite dull growth of the automotive
market. Sales volume reached 6.23 million
units which accounted for some 30 percent
of all automobile sales. The number of
distributors whose sales revenue exceeded
10 billion CNY increased from last year’s 31
to 38. Top distributor Sinomach Automobile
posted a record high of 90.3 billion CNY
followed by Guanghui Automobile Services
� � � � � � Automobile Distributors: Intensified Internet
China
a 59 million CNY deficit. Regarding net
profit ratio, apart from China Harmony
Auto Holding, other distributors declined.
In an effort to improve profitability,
distributors are trying out new possibilities
such as online vehicle sales and parallel
importation. They are also planning to
engage in automobile financing.
Guanghui Automobile Services and
China Yongda Automobiles Services
Holdings are planning to boost sales
through cooperation with internet
with 86.4 billion CNY. Meanwhile, market
slowdown, increasing number of sales shops
and rising inventory are putting pressure on
profitability.
Looking at the 12 listed distributors,
combined net profit dropped 11.5 percent
to 4.83 billion CNY in 2014. Apart from
Rundong Automobile Group, China
Harmony Auto Holding, Sinomach
Automobile and China Meidong Auto
Holdings, all other companies declined. In
particular, Wuhu Yaxia Automobile posted
China: Top 40 Automobile Distributors by Sales Revenue (2014)
China: Net Profit Value/Ratio of Listed Automobile Distributors
(2013/2014)
China: Financial Performance of Listed Automobile Distributors (2013/2014)
Note: Sales revenue figures are listed in descending order based on CADA’s announcement. However, for listed companies, data were taken from securities report of each company.
(Created using data from CADA [China Automobile Dealers Association] and company securities reports)
China: Sales Volume and Dealership Network of Listed Automobile
Distributors (2013/2014)
Note: There is a significant discrepancy between Sinomach Automobile and Pang Da Automobile;
however, data published as appear in company securities reports.
(Created using data from CADA and company securities reports)
(Created using data from company securities reports)
In Jun. 2015, CADA announced the top 100 automobile distributors in terms of sales revenue. According to the
announcement, total sales revenue of the top 100 companies was 1.24 trillion CNY in 2014, up 10.28 percent compared to
2013. Automobile sales volume stood at 6.23 million units, the market maintaining an over 30 percent annual increase for
the third consecutive year (based on CAAM’s passenger vehicle factory shipment volume).�
80 billion CNY or more
(two companies)
50 billion-60 billion CNY
(two companies)
20 billion-50 billion CNY
(eight companies)�
15 billion-20 billion CNY
(eight companies)�
15 billion CNY or less
(20 companies)
Notes: Bar graph indicates net profit value (left scale). Line graph indicates net profit ratio
(right scale). (Created using data from table below)
(Billion CNY)
2013 2014 Year-on-year 2013 2014 Year-on-year 2013 2014 Year-on-year 2013 2014 Change
Sinomach Automobile 794.3 903.4 13.7% 9.5 11.1 16.3% 7.3 7.8 7.8% 0.91% 0.87% ▼0.04pp
Pang Da Automobile 639.9 603.1 ▼5.7% 5.4 2.8 ▼47.3% 2.2 1.3 ▼38.9% 0.34% 0.22% ▼0.12pp
Zhongsheng Group 525.3 547.9 4.3% 24.6 23.6 ▼3.9% 10.1 7.5 ▼25.7% 1.92% 1.37% ▼0.55pp
Baoxin Auto 300.8 307.2 2.1% 19.0 16.5 ▼13.3% 10.1 7.1 ▼29.6% 3.37% 2.32% ▼1.05pp
Shanghai Yongda 298.4 309.1 3.6% 16.7 16.3 ▼2.7% 8.4 8.0 ▼4.0% 2.81% 2.60% ▼0.21pp
China Zhengtong 261.0 329.4 26.2% 6.4 5.4 ▼16.0% 5.9 5.0 ▼14.8% 2.25% 1.52% ▼0.73pp
Ruidong Automobile 115.9 154.7 33.5% 3.9 4.7 20.7% 2.4 3.1 27.8% 2.06% 1.97% ▼0.09pp
China Harmony 83.3 102.0 22.4% 7.6 9.2 22.1% 4.0 5.4 34.7% 4.85% 5.34% 0.49pp
Sunfonda Group 74.3 78.8 6.0% 3.7 3.7 ▼0.2% 1.9 1.7 ▼7.1% 2.50% 2.19% ▼0.31pp
Wuhu Yaxia 50.5 52.4 3.8% 0.4 ▼0.8 ▼285.7% 0.5 ▼0.6 ▼228.6% 0.91% - ▼2.03pp
China Meidong 34.8 38.5 10.8% 1.8 2.0 9.4% 1.1 1.1 4.5% 3.05% 2.87% ▼0.17pp
Zheijang Materials 237.4 220.9 ▼6.9% 1.3 1.1 ▼13.4% 0.9 0.8 ▼14.1% 0.38% 0.35% ▼0.03pp
Total 3415.8 3647.4 6.8% 100.4 95.7 ▼4.7% 54.6 48.3 ▼11.5% 1.60% 1.33% ▼0.27pp
Sales Revenue Operating Profit Net Profit Value Net Profit Rtio
Company
2013 2014 2013 2014
Sinomach Automobile 215,000 275,000 30 50
Pang Da Automobile 478,783 561,114 1,351 1,226
Zhongsheng Group 196,689 207,289 178 191
Baoxin Auto 87,602 95,265 n.a 65
Shanghai Yongda 98,300 116,095 93 155
China Zhengtong 83,323 87,892 92 105
Rundong Automobile 55,231 56,900 49 65
China Harmony N.A. 20,308 34 89
Sunfonda Group 15,834 18,012 19 26
Wuhu Yaxia 36,715 41,705 60 51
China Meidong N.A. 18,427 15 19
Zheijang Materials 35,292 38,827 N.A. N.A.
Total 1,302,769 1,536,834 1,921 2,042
Top 100 companies total 5,763,125 6,227,629 - -
Company
Sales Volume (units) Sales network (shops)
2013
2014
▼2%
0%
2%
4%
6%
▼5
0
5
10
15
Sinom
ach A
utom
obile
Pang D
a A
utom
obile
Zhongsheng G
roup
Baoxin A
uto
Shanghai Y
ongda
China Z
hengtong
Ruidong A
utom
obile
China H
arm
ony
Sunfonda G
roup
Wuhu Y
axia
China M
eidong
Zheijang M
aterials
(Billion CNY)
2013 2014
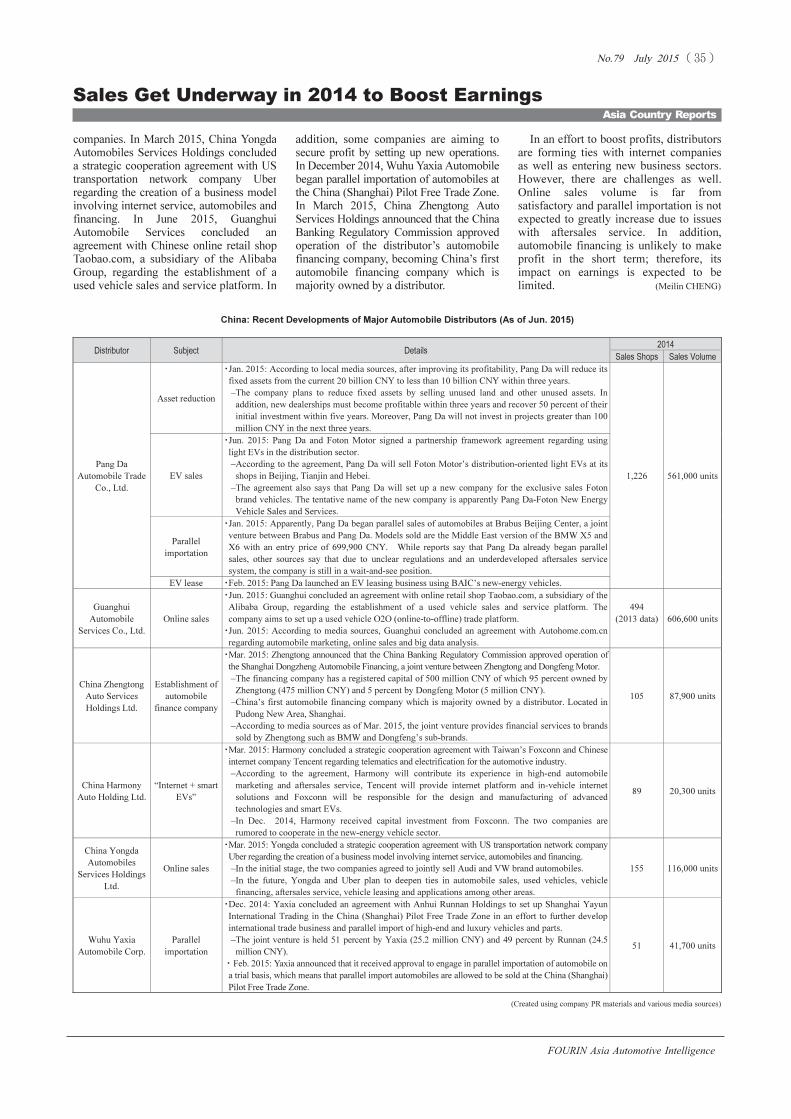
���������� ��� ���� ��������
����� ����� !"����
FOURIN Asia Automotive Intelligence
Asia Country Reports
Sales Get Underway in 2014 to Boost Earnings
companies. In March 2015, China Yongda
Automobiles Services Holdings concluded
a strategic cooperation agreement with US
transportation network company Uber
regarding the creation of a business model
involving internet service, automobiles and
financing. In June 2015, Guanghui
Automobile Services concluded an
agreement with Chinese online retail shop
Taobao.com, a subsidiary of the Alibaba
Group, regarding the establishment of a
used vehicle sales and service platform. In
addition, some companies are aiming to
secure profit by setting up new operations.
In December 2014, Wuhu Yaxia Automobile
began parallel importation of automobiles at
the China (Shanghai) Pilot Free Trade Zone.
In March 2015, China Zhengtong Auto
Services Holdings announced that the China
Banking Regulatory Commission approved
operation of the distributor’s automobile
financing company, becoming China’s first
automobile financing company which is
majority owned by a distributor.
In an effort to boost profits, distributors
are forming ties with internet companies
as well as entering new business sectors.
However, there are challenges as well.
Online sales volume is far from
satisfactory and parallel importation is not
expected to greatly increase due to issues
with aftersales service. In addition,
automobile financing is unlikely to make
profit in the short term; therefore, its
impact on earnings is expected to be
limited. (Meilin CHENG)
China: Recent Developments of Major Automobile Distributors (As of Jun. 2015)
(Created using company PR materials and various media sources)
Distributor Subject Details
2014
Sales Shops Sales Volume
Pang Da
Automobile Trade
Co., Ltd.
Asset reduction
�Jan. 2015: According to local media sources, after improving its profitability, Pang Da will reduce its
fixed assets from the current 20 billion CNY to less than 10 billion CNY within three years.
–The company plans to reduce fixed assets by selling unused land and other unused assets. In
addition, new dealerships must become profitable within three years and recover 50 percent of their
initial investment within five years. Moreover, Pang Da will not invest in projects greater than 100
million CNY in the next three years.
1,226 561,000 unitsEV sales
�Jun. 2015: Pang Da and Foton Motor signed a partnership framework agreement regarding using
light EVs in the distribution sector.
–According to the agreement, Pang Da will sell Foton Motor’s distribution-oriented light EVs at its
shops in Beijing, Tianjin and Hebei.
–The agreement also says that Pang Da will set up a new company for the exclusive sales Foton
brand vehicles. The tentative name of the new company is apparently Pang Da-Foton New Energy
Vehicle Sales and Services.
Parallel
importation
�Jan. 2015: Apparently, Pang Da began parallel sales of automobiles at Brabus Beijing Center, a joint
venture between Brabus and Pang Da. Models sold are the Middle East version of the BMW X5 and
X6 with an entry price of 699,900 CNY. While reports say that Pang Da already began parallel
sales, other sources say that due to unclear regulations and an underdeveloped aftersales service
system, the company is still in a wait-and-see position.
EV lease �Feb. 2015: Pang Da launched an EV leasing business using BAIC’s new-energy vehicles.
Guanghui
Automobile
Services Co., Ltd.
Online sales
�Jun. 2015: Guanghui concluded an agreement with online retail shop Taobao.com, a subsidiary of the
Alibaba Group, regarding the establishment of a used vehicle sales and service platform. The
company aims to set up a used vehicle O2O (online-to-offline) trade platform.
�Jun. 2015: According to media sources, Guanghui concluded an agreement with Autohome.com.cn
regarding automobile marketing, online sales and big data analysis.
494
(2013 data)
606,600 units
China Zhengtong
Auto Services
Holdings Ltd.
Establishment of
automobile
finance company
�Mar. 2015: Zhengtong announced that the China Banking Regulatory Commission approved operation of
the Shanghai Dongzheng Automobile Financing, a joint venture between Zhengtong and Dongfeng Motor.
–The financing company has a registered capital of 500 million CNY of which 95 percent owned by
Zhengtong (475 million CNY) and 5 percent by Dongfeng Motor (5 million CNY).
–China’s first automobile financing company which is majority owned by a distributor. Located in
Pudong New Area, Shanghai.
–According to media sources as of Mar. 2015, the joint venture provides financial services to brands
sold by Zhengtong such as BMW and Dongfeng’s sub-brands.
105 87,900 units
China Harmony
Auto Holding Ltd.
“Internet + smart
EVs”
�Mar. 2015: Harmony concluded a strategic cooperation agreement with Taiwan’s Foxconn and Chinese
internet company Tencent regarding telematics and electrification for the automotive industry.
–According to the agreement, Harmony will contribute its experience in high-end automobile
marketing and aftersales service, Tencent will provide internet platform and in-vehicle internet
solutions and Foxconn will be responsible for the design and manufacturing of advanced
technologies and smart EVs.
–In Dec. 2014, Harmony received capital investment from Foxconn. The two companies are
rumored to cooperate in the new-energy vehicle sector.
89 20,300 units
China Yongda
Automobiles
Services Holdings
Ltd.
Online sales
�Mar. 2015: Yongda concluded a strategic cooperation agreement with US transportation network company
Uber regarding the creation of a business model involving internet service, automobiles and financing.
–In the initial stage, the two companies agreed to jointly sell Audi and VW brand automobiles.
–In the future, Yongda and Uber plan to deepen ties in automobile sales, used vehicles, vehicle
financing, aftersales service, vehicle leasing and applications among other areas.
155 116,000 units
Wuhu Yaxia
Automobile Corp.
Parallel
importation
�Dec. 2014: Yaxia concluded an agreement with Anhui Runnan Holdings to set up Shanghai Yayun
International Trading in the China (Shanghai) Pilot Free Trade Zone in an effort to further develop
international trade business and parallel import of high-end and luxury vehicles and parts.
–The joint venture is held 51 percent by Yaxia (25.2 million CNY) and 49 percent by Runnan (24.5
million CNY).
�Feb. 2015: Yaxia announced that it received approval to engage in parallel importation of automobile on
a trial basis, which means that parallel import automobiles are allowed to be sold at the China (Shanghai)
Pilot Free Trade Zone.
51 41,700 units
�

���������� ��� ���� ��������
����� ����� !"����
FOURIN Asia Automotive Intelligence
Indonesia’s automobile market dropped
1.8 percent year-on-year to 1.2 million
units in 2014 due economic downturn
triggered by rising prices following the
weakening of the Indonesian currency
against the US dollar. While most
segments declined, the mini segment went
up 2.5-fold to 129,000 units driven by the
launch of government-subsidized Low
Cost Green Cars and rising fuel prices due
to the reduction of fuel subsidies. Apart
from mini cars, only mini trucks (up 7.5
percent) and luxury cars (up 10.7 percent)
increased, the latter of which was driven
by the expansion of the wealthy class. The
overall passenger car segment went up
2014 Segmented Automobile Sales: Economic Downturn
Indonesia
Avanza fell 24.1 percent to 162,000 units.
Due to the same reason, the Suzuki Ertiga
and Daihatsu Xenia also dropped double
digits. Although the Mobilio sold 79,000
units, it failed to expand the MPV market.
The SUV segment fell 16.0 percent to
114,000 units due to double-digit decline
of small, medium-large and luxury SUVs.
Although the Toyota Fortuner went up 5.2
percent and the Nissan X-Trail increased
2.6-fold, most other models declined. In
the commercial vehicle segment, which is
strongly affected by economic changes,
one-ton pickup trucks, light trucks and
medium-heavy commercial vehicles all
went down double digits. (Hisashi ANDO)
33.9 percent to 277,000 units thanks to
good performance of mini and luxury
cars, posting an increase for the fifth
consecutive year. Nevertheless, the
compact segment fell 1.6 percent to
135,000 units, showing a drop for the first
time in six years, while small, medium
and sports cars declined double digits.
Low-price MPVs, which represent the
volume-selling segment of Indonesia,
decreased 4.7 percent to 391,000 units
despite the launch of the Honda Mobilio
and Datsun Go+. Although the Toyota
Avanza maintained its best-selling model
title, demand was strongly affected by the
release of the Mobilio. As a result, the
Notes: *LCGC-compliant vehicle. **Including HEV.
Indonesia: Automobile Sales Volume by Segment and Model (2009–2014)
(Units)
Model 2009 2010 2011 2012 2013 2014 Year-on-year Share
Toyota Agya* - - - - 22,376 67,074 3.0-fold 51.9%
Daihatsu Ayla* - - - - 19,141 40,775 2.1-fold 31.6%
Suzuki Karimun Wagon R* - - - - 4,705 17,068 3.6-fold 13.2%
Kia Picanto 1,785 4,311 5,098 7,675 6,379 3,716 ▼41.7% 2.9%
Others 2,672 5,278 5,013 3,699 41 524 12.8-fold 0.4%
Total 4,457 9,589 10,111 11,374 52,642 129,157 2.5-fold 100.0%
Honda Brio Satya* - - - - 4,958 26,683 5.4-fold 19.8%
Honda Jazz** 15,713 22,758 19,440 21,244 27,803 22,329 ▼19.7% 16.6%
Toyota Yaris 7,505 16,979 16,448 27,809 13,728 17,774 29.5% 13.2%
Honda Brio - - - 8,002 12,207 12,010 ▼1.6% 8.9%
Toyota Etios Valco - - - - 14,927 10,050 ▼32.7% 7.5%
Toyota Vios 7,298 11,823 9,375 14,060 12,695 8,913 ▼29.8% 6.6%
Nissan March - 1,915 12,345 7,740 7,968 6,110 ▼23.3% 4.5%
Mitsubishi Mirage - - - 3,164 6,183 5,373 ▼13.1% 4.0%
Kia Rio 376 682 1,619 3,234 3,326 3,586 7.8% 2.7%
Daihatsu Sirion 470 1,030 2,857 5,474 7,170 3,387 ▼52.8% 2.5%
Suzuki Splash - 4,849 7,016 5,890 6,396 3,338 ▼47.8% 2.5%
Suzuki Swift 3,753 4,004 3,618 2,346 4,635 3,323 ▼28.3% 2.5%
Ford Fiesta - 1,483 7,313 6,393 5,105 3,016 ▼40.9% 2.2%
Mazda2 327 3,311 5,433 5,253 3,456 2,814 ▼18.6% 2.1%
Datsun Go* - - - - - 2,733 - 2.0%
Others 10,753 13,419 11,223 10,164 6,510 3,437 ▼47.2% 2.5%
Total 46,195 82,253 96,687 120,773 137,067 134,876 ▼1.6% 100.0%
Toyota Corolla Altis 1,203 1,635 1,697 1,888 1,340 1,874 39.9% 46.7%
Honda Civic** 1,653 2,357 1,063 1,672 2,259 630 ▼72.1% 15.7%
Nissan Latio/Almera 118 553 49 209 498 502 0.8% 12.5%
Others 1,554 1,068 1,163 1,729 1,738 1,011 ▼41.8% 25.2%
Total 4,528 5,613 3,972 5,498 5,835 4,017 ▼31.2% 100.0%
Toyota Camry** 1,175 2,484 2,005 2,744 2,603 1,668 ▼35.9% 62.3%
Honda Accord 666 1,736 1,234 1,034 1,724 395 ▼77.1% 14.7%
Mazda6 72 93 136 175 295 277 ▼6.1% 10.3%
Others 194 488 389 1,173 461 338 ▼26.7% 12.6%
Total 2,107 4,801 3,764 5,126 5,083 2,678 ▼47.3% 100.0%
BMW 3 Series 546 534 528 760 915 1,158 26.6% 22.7%
BMW 5 Series 208 354 450 600 588 494 ▼16.0% 9.7%
Audi A4 38 62 125 178 141 161 14.2% 3.2%
Others 2,808 3,530 3,714 3,163 2,956 3,278 10.9% 64.4%
Total 3,600 4,480 4,817 4,701 4,600 5,091 10.7% 100.0%
MINI Cooper - - 37 270 355 510 43.7% 49.4%
Honda CR-Z - - - - 429 119 ▼72.3% 11.5%
BMW 4 Series - - - - 1 100 100.0-fold 9.7%
Others 154 270 601 1,065 685 303 ▼55.8% 29.4%
Total 154 270 638 1,335 1,470 1,032 ▼29.8% 100.0%
61,041 107,006 119,989 148,807 206,697 276,851 33.9% -
Passenger
car
Mini
(A)
Sports
Luxury
Medium
(D)
Small
(C)
Compact
(B)
Segment
Total

���������� ��� ���� ��������
����� ����� !"����
FOURIN Asia Automotive Intelligence
Asia Country Reports
Shrinks Market; Volume-selling Budget MPVs Drop 4.7 Percent
Notes: Segmentation by FOURIN based on price, engine displacement, vehicle body size and others factors. Share is that of each segment.
(Created using data from GAIKINDO [Association of Indonesian Automotive Industries])
Indonesia: Automobile Sales Volume by Segment and Model (2009–2014) (Cont.)�
(Units)
Model 2009 2010 2011 2012 2013 2014 Year-on-year Share
Toyota Rush 12,965 18,420 25,012 34,033 35,004 29,609 ▼15.4% 59.6%
Daihatsu Terios 13,149 16,485 22,416 23,949 25,674 18,774 ▼26.9% 37.8%
Others - - 9,573 6,564 3,155 1,305 ▼58.6% 2.6%
Total 26,114 34,905 57,001 64,546 63,833 49,688 ▼22.2% 100.0%
Toyota Fortuner 7,967 10,712 13,111 20,498 17,974 18,916 5.2% 30.1%
Mitsubishi Pajero Sport 3,298 11,024 13,212 13,935 12,908 11,868 ▼8.1% 18.9%
Honda CR-V 10,114 16,961 11,760 14,753 20,385 8,551 ▼58.1% 13.6%
Ford EcoSport - - - - - 5,603 - 8.9%
Nissan X-Trail 4,528 4,682 3,179 2,438 1,558 4,112 2.6-fold 6.5%
Mitsubishi Outlander Sport - - - 5,118 4,706 3,888 ▼17.4% 6.2%
Mazda CX-5 - - - 2,481 3,594 3,659 1.8% 5.8%
Others 5,570 6,348 9,935 9,591 8,861 6,290 ▼29.0% 10.0%
Total 31,477 49,727 51,197 68,814 69,986 62,887 ▼10.1% 100.0%
Lexus RX** 135 122 287 368 380 367 ▼3.4% 26.4%
BMW X1 - 97 218 385 453 261 ▼42.4% 18.8%
Others 344 468 675 783 1,101 762 ▼30.8% 54.8%
Total 479 687 1,180 1,536 1,934 1,390 ▼28.1% 100.0%
58,070 85,319 109,378 134,896 135,753 113,965 ▼16.0% -
Toyota Avanza 100,065 141,799 162,367 192,146 213,474 162,070 ▼24.1% 41.4%
Honda Mobilio - - - - - 79,288 - 20.3%
Suzuki Ertiga - - - 34,074 63,318 47,015 ▼25.7% 12.0%
Daihatsu Xenia 43,409 65,901 66,835 73,418 64,611 46,710 ▼27.7% 11.9%
Datsun Go+* - - - - - 17,787 - 4.5%
Nissan Grand Livina 10,028 22,560 25,324 34,129 35,422 15,716 ▼55.6% 4.0%
Others 16,634 21,414 20,588 27,806 33,621 22,740 ▼32.4% 5.8%
Total 170,136 251,674 275,114 361,573 410,446 391,326 ▼4.7% 100.0%
Honda Freed 8,900 13,500 10,112 19,811 18,595 6,517 ▼65.0% 45.7%
Nissan Serena 2,116 3,166 2,175 2,304 4,008 1,712 ▼57.3% 12.0%
Mazda Biante - - - 1,298 2,072 1,485 ▼28.3% 10.4%
Toyota Alphard 182 198 319 2,833 914 1,146 25.4% 8.0%
Others 1,645 2,615 3,922 7,185 7,492 3,409 ▼54.5% 23.9%
Total 12,843 19,479 16,528 33,431 33,081 14,269 ▼56.9% 100.0%
182,979 271,153 291,642 395,004 443,527 405,595 ▼8.6% -
Toyota Innova 35,989 53,824 54,763 71,685 64,539 56,157 ▼13.0% 94.8%
Isuzu Panther 4,443 5,636 5,134 4,990 3,948 2,994 ▼24.2% 5.1%
Others 287 181 18 - 21 66 3.1-fold 0.1%
Total 40,719 59,641 59,915 76,675 68,508 59,217 ▼13.6% 100.0%
Daihatsu Gran Max (MB) 5,882 9,977 10,924 14,644 15,678 14,125 ▼9.9% 66.0%
Daihatsu Luxio 5,104 5,799 6,672 7,309 5,656 4,304 ▼23.9% 20.1%
Suzuki Futura Van 2,528 2,763 3,323 2,958 3,755 2,326 ▼38.1% 10.9%
Others 1,018 925 510 761 799 646 ▼19.1% 3.0%
Total 14,532 19,464 21,429 25,672 25,888 21,401 ▼17.3% 100.0%
Toyota Hiace - - - 560 680 1,380 2.0-fold 58.1%
Mitsubishi L300 (MB) 1,195 1,069 1,235 1,052 852 716 ▼16.0% 30.2%
Others 233 451 386 296 112 278 2.5-fold 11.7%
Total 1,428 1,520 1,621 1,908 1,644 2,374 44.4% 100.0%
15,960 20,984 23,050 27,580 27,532 23,775 ▼13.6% -
Daihatsu Gran Max (PU) 9,499 19,401 29,840 37,948 48,012 57,151 19.0% 30.3%
Suzuki Futura PU 15,987 30,711 41,543 43,926 46,208 49,662 7.5% 26.3%
Mitsubishi T120 SS (PU) 7,700 16,907 23,734 25,935 29,662 29,378 ▼1.0% 15.6%
Mitsubishi L300 (PU) 12,451 19,527 27,428 27,652 27,498 26,394 ▼4.0% 14.0%
Suzuki APV PU - - 11,740 15,744 19,567 21,221 8.5% 11.3%
Others 5,185 6,805 5,784 6,063 4,521 4,741 4.9% 2.5%
Total 50,822 93,351 140,069 157,268 175,468 188,547 7.5% 100.0%
Toyota Hilux 4,746 7,687 8,301 12,556 14,129 9,206 ▼34.8% 45.8%
Mitsubishi Strada Triton (L200) 4,803 6,169 8,144 7,610 8,547 7,201 ▼15.7% 35.8%
Ford Ranger 4,057 5,651 6,359 3,467 3,232 2,669 ▼17.4% 13.3%
Others 1,509 3,179 3,167 4,640 2,939 1,011 ▼65.6% 5.0%
Total 15,115 22,686 25,971 28,273 28,847 20,087 ▼30.4% 100.0%
Fuso Canter 28,703 45,968 54,066 55,604 60,175 52,086 ▼13.4% 54.2%
Isuzu Elf 6,731 12,146 16,482 18,099 19,181 17,390 ▼9.3% 18.1%
Others 8,886 24,758 27,953 37,584 31,455 26,544 ▼15.6% 27.6%
Total 44,320 82,872 98,501 111,287 110,811 96,020 ▼13.3% 100.0%
Hino trucks (500 Series etc.) 11,540 11,650 13,386 18,925 17,793 12,611 ▼29.1% 52.6%
Fuso trucks 2,646 4,861 5,946 7,847 6,039 4,258 ▼29.5% 17.8%
Isuzu F Series (Giga) 121 59 803 3,213 3,323 3,439 3.5% 14.4%
Others 2,728 5,126 5,514 6,455 5,603 3,654 ▼34.8% 15.2%
Total 17,035 21,696 25,649 36,440 32,758 23,962 ▼26.9% 100.0%
486,061 764,708 894,164 1,116,230 1,229,901 1,208,019 ▼1.8% -
Medium/
large
Low price
MPV
Luxury
Medium/
large
Small
SUV
Segment
Automobile Sales Total
Total
Total
Total
AUV
Large
Small
Van
Medium/
heavy commercial vehicle
Light truck
One-ton pickup truck
Mini truck
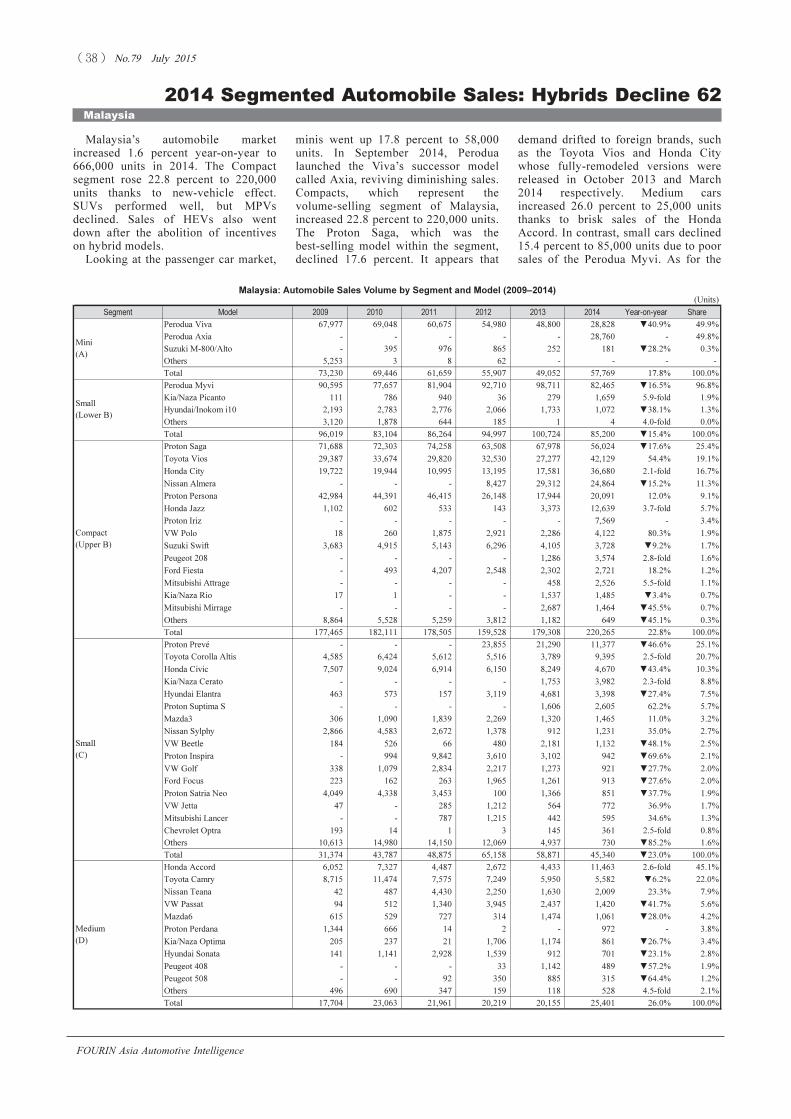
���������� ��� ���� ��������
����� ����� !"����
FOURIN Asia Automotive Intelligence
Malaysia’s automobile market
increased 1.6 percent year-on-year to
666,000 units in 2014. The Compact
segment rose 22.8 percent to 220,000
units thanks to new-vehicle effect.
SUVs performed well, but MPVs
declined. Sales of HEVs also went
down after the abolition of incentives
on hybrid models.
Looking at the passenger car market,
2014 Segmented Automobile Sales: Hybrids Decline 62
Malaysia
demand drifted to foreign brands, such
as the Toyota Vios and Honda City
whose fully-remodeled versions were
released in October 2013 and March
2014 respectively. Medium cars
increased 26.0 percent to 25,000 units
thanks to brisk sales of the Honda
Accord. In contrast, small cars declined
15.4 percent to 85,000 units due to poor
sales of the Perodua Myvi. As for the
minis went up 17.8 percent to 58,000
units. In September 2014, Perodua
launched the Viva’s successor model
called Axia, reviving diminishing sales.
Compacts, which represent the
volume-selling segment of Malaysia,
increased 22.8 percent to 220,000 units.
The Proton Saga, which was the
best-selling model within the segment,
declined 17.6 percent. It appears that
Malaysia: Automobile Sales Volume by Segment and Model (2009–2014)
(Units)
Segment Model 2009 2010 2011 2012 2013 2014 Year-on-year Share
Perodua Viva 67,977 69,048 60,675 54,980 48,800 28,828 ▼40.9% 49.9%
Perodua Axia - - - - - 28,760 - 49.8%
Suzuki M-800/Alto - 395 976 865 252 181 ▼28.2% 0.3%
Others 5,253 3 8 62 - - - -
Total 73,230 69,446 61,659 55,907 49,052 57,769 17.8% 100.0%
Perodua Myvi 90,595 77,657 81,904 92,710 98,711 82,465 ▼16.5% 96.8%
Kia/Naza Picanto 111 786 940 36 279 1,659 5.9-fold 1.9%
Hyundai/Inokom i10 2,193 2,783 2,776 2,066 1,733 1,072 ▼38.1% 1.3%
Others 3,120 1,878 644 185 1 4 4.0-fold 0.0%
Total 96,019 83,104 86,264 94,997 100,724 85,200 ▼15.4% 100.0%
Proton Saga 71,688 72,303 74,258 63,508 67,978 56,024 ▼17.6% 25.4%
Toyota Vios 29,387 33,674 29,820 32,530 27,277 42,129 54.4% 19.1%
Honda City 19,722 19,944 10,995 13,195 17,581 36,680 2.1-fold 16.7%
Nissan Almera - - - 8,427 29,312 24,864 ▼15.2% 11.3%
Proton Persona 42,984 44,391 46,415 26,148 17,944 20,091 12.0% 9.1%
Honda Jazz 1,102 602 533 143 3,373 12,639 3.7-fold 5.7%
Proton Iriz - - - - - 7,569 - 3.4%
VW Polo 18 260 1,875 2,921 2,286 4,122 80.3% 1.9%
Suzuki Swift 3,683 4,915 5,143 6,296 4,105 3,728 ▼9.2% 1.7%
Peugeot 208 - - - - 1,286 3,574 2.8-fold 1.6%
Ford Fiesta - 493 4,207 2,548 2,302 2,721 18.2% 1.2%
Mitsubishi Attrage - - - - 458 2,526 5.5-fold 1.1%
Kia/Naza Rio 17 1 - - 1,537 1,485 ▼3.4% 0.7%
Mitsubishi Mirrage - - - - 2,687 1,464 ▼45.5% 0.7%
Others 8,864 5,528 5,259 3,812 1,182 649 ▼45.1% 0.3%
Total 177,465 182,111 178,505 159,528 179,308 220,265 22.8% 100.0%
Proton Prevé - - - 23,855 21,290 11,377 ▼46.6% 25.1%
Toyota Corolla Altis 4,585 6,424 5,612 5,516 3,789 9,395 2.5-fold 20.7%
Honda Civic 7,507 9,024 6,914 6,150 8,249 4,670 ▼43.4% 10.3%
Kia/Naza Cerato - - - - 1,753 3,982 2.3-fold 8.8%
Hyundai Elantra 463 573 157 3,119 4,681 3,398 ▼27.4% 7.5%
Proton Suptima S - - - - 1,606 2,605 62.2% 5.7%
Mazda3 306 1,090 1,839 2,269 1,320 1,465 11.0% 3.2%
Nissan Sylphy 2,866 4,583 2,672 1,378 912 1,231 35.0% 2.7%
VW Beetle 184 526 66 480 2,181 1,132 ▼48.1% 2.5%
Proton Inspira - 994 9,842 3,610 3,102 942 ▼69.6% 2.1%
VW Golf 338 1,079 2,834 2,217 1,273 921 ▼27.7% 2.0%
Ford Focus 223 162 263 1,965 1,261 913 ▼27.6% 2.0%
Proton Satria Neo 4,049 4,338 3,453 100 1,366 851 ▼37.7% 1.9%
VW Jetta 47 - 285 1,212 564 772 36.9% 1.7%
Mitsubishi Lancer - - 787 1,215 442 595 34.6% 1.3%
Chevrolet Optra 193 14 1 3 145 361 2.5-fold 0.8%
Others 10,613 14,980 14,150 12,069 4,937 730 ▼85.2% 1.6%
Total 31,374 43,787 48,875 65,158 58,871 45,340 ▼23.0% 100.0%
Honda Accord 6,052 7,327 4,487 2,672 4,433 11,463 2.6-fold 45.1%
Toyota Camry 8,715 11,474 7,575 7,249 5,950 5,582 ▼6.2% 22.0%
Nissan Teana 42 487 4,430 2,250 1,630 2,009 23.3% 7.9%
VW Passat 94 512 1,340 3,945 2,437 1,420 ▼41.7% 5.6%
Mazda6 615 529 727 314 1,474 1,061 ▼28.0% 4.2%
Proton Perdana 1,344 666 14 2 - 972 - 3.8%
Kia/Naza Optima 205 237 21 1,706 1,174 861 ▼26.7% 3.4%
Hyundai Sonata 141 1,141 2,928 1,539 912 701 ▼23.1% 2.8%
Peugeot 408 - - - 33 1,142 489 ▼57.2% 1.9%
Peugeot 508 - - 92 350 885 315 ▼64.4% 1.2%
Others 496 690 347 159 118 528 4.5-fold 2.1%
Total 17,704 23,063 21,961 20,219 20,155 25,401 26.0% 100.0%
Mini
(A)
Small
(Lower B)
Compact
(Upper B)
Small
(C)
Medium
(D)

���������� ��� ���� ��������
����� ����� !"����
FOURIN Asia Automotive Intelligence
Asia Country Reports
Percent upon the Ending of Preferential Measures
small segment, sales dropped 23.0
percent to 45,000 units. Although the
fully-remodeled Toyota Corolla Altis,
launched in January 2014, sold well, the
Proton Prevé and Honda Civic among
others performed badly, resulting in an
overall drop.
Looking at other segments, luxury
cars increased 12.2 percent to 16,000
units thanks to sound economic growth.
SUVs went up 5.8 percent to 32,000
units driven up by the release of several
new models in recent years. In contrast,
MPVs dropped 3.1 percent to 96,000
units. While most models declined, the
Perodua Alza sold some 55,000 units.
HEV models fell 62.2 percent. The
marked decline came after the
introduction of the National Automotive
Policy 2014 in January 2014 which
abolished all import and commodity tax
breaks on all imported CBU HEV and
BEV models. As a result, apart from the
locally-assembled Jazz HEV and
Mercedes-Benz S400 HEV, all other
HEVs significantly declined. For this
reason, Toyota Motor replaced the
imported Prius with the locally-made
Camry HEV, launched in March 2015, in
the Malaysian market (Takashi HORII)
Malaysia: Automobile Sales Volume by Segment and Model (2009–2014) (Cont.)�
Notes: Segmentation by FOURIN based on price, engine displacement, vehicle body size and others factors. Share is that of each segment.
(Created using data from MAA [Malaysian Automotive Association])
(Units)
Segment Model 2009 2010 2011 2012 2013 2014 Year-on-year Share
BMW 3,331 3,625 4,316 5,894 6,576 7,109 8.1% 44.1%
Mercedes-Benz 3,322 4,363 4,372 5,028 4,661 6,338 36.0% 39.3%
Lexus 79 102 54 66 301 1,013 3.4-fold 6.3%
Audi 311 428 487 1,109 2,471 999 ▼59.6% 6.2%
Volvo car 365 405 470 393 345 602 74.5% 3.7%
Others 7 35 85 86 29 71 2.4-fold 0.4%
Total 7,415 8,958 9,784 12,576 14,383 16,132 12.2% 100.0%
Hyundai Veloster - - - 16 281 151 ▼46.3% 44.5%
Porsche Carrera 8 4 - 23 - 68 - 20.1%
Others 158 229 328 2,166 215 120 ▼44.2% 35.4%
Total 166 233 328 2,205 496 339 ▼31.7% 100.0%
BEV - - - 11 8 - ▼100.0%
Honda Jazz HEV - - - 2,508 3,591 3,466 ▼3.5% 61.1%
Honda CR-Z - - 69 2,520 1,671 592 ▼64.6% 10.4%
Mercedes-Benz S400 HEV - - - - - 580 - 10.2%
Toyota Prius 52 198 2,457 2,315 5,806 507 ▼91.3% 8.9%
Honda Civic HEV 215 129 30 1,391 2,804 390 ▼86.1% 6.9%
Honda Insight - - 4,566 2,293 484 55 ▼88.6% 1.0%
Others - 4 1,262 1,552 645 84 ▼87.0% 1.5%
Total 267 331 8,384 12,579 15,001 5,674 ▼62.2% 100.0%
Honda CR-V 3,474 5,543 4,108 2,546 8,669 6,971 ▼19.6% 21.9%
Mazda CX-5 - - - 1,215 4,115 5,743 39.6% 18.0%
Mitsubishi ASX - 199 - - 703 3,038 4.3-fold 9.5%
Toyota Fortuner 1,798 1,895 1,652 1,439 2,666 2,321 ▼12.9% 7.3%
Hyundai Santa Fe - - 952 798 1,208 1,725 42.8% 5.4%
Subaru XV - - - - 918 1,456 58.6% 4.6%
Ford Kuga - - - - 517 1,246 2.4-fold 3.9%
Kia/Naza Sportage 636 143 639 1,642 1,407 1,195 ▼15.1% 3.8%
Hyundai Tucson 153 972 2,004 1,541 1,163 951 ▼18.2% 3.0%
Mitsubishi Pajero - 26 1,571 1,519 982 699 ▼28.8% 2.2%
Land Rover Range Rover 13 85 61 316 818 674 ▼17.6% 2.1%
Others 9,521 11,941 11,038 8,077 6,953 5,845 ▼15.9% 18.3%
Total 15,595 20,804 22,025 19,093 30,119 31,864 5.8% 100.0%
Perodua Alza 2,850 41,933 37,402 41,385 48,560 55,322 13.9% 57.9%
Proton Exora 18,451 26,787 21,064 22,438 22,983 15,352 ▼33.2% 16.1%
Nissan Livina/Grand Livina 12,287 14,177 13,188 12,818 8,620 7,804 ▼9.5% 8.2%
Toyota Avanza 11,468 7,781 6,985 14,515 6,950 5,043 ▼27.4% 5.3%
Toyota Innova 4,956 5,544 4,767 9,905 5,237 4,739 ▼9.5% 5.0%
Nissan Serena 362 475 351 223 2,093 2,402 14.8% 2.5%
Hyundai Starex - - 976 1,349 1,374 1,354 ▼1.5% 1.4%
Mazda Biante - - - - 21 1,145 54.5-fold 1.2%
Others 11,635 9,181 8,400 6,182 2,837 2,426 ▼14.5% 2.5%
Total 62,009 105,878 93,133 108,815 98,675 95,587 ▼3.1% 100.0%
Toyota Hilux 14,572 18,601 21,471 26,014 27,420 25,693 ▼6.3% 48.7%
Ford Ranger 1,475 1,897 2,349 2,179 5,761 8,577 48.9% 16.2%
Isuzu D-Max 5,048 6,018 5,962 4,998 5,737 6,042 5.3% 11.4%
Mitsubishi Triton 463 623 8,299 7,990 7,063 5,999 ▼15.1% 11.4%
Nissan Navara 1,302 3,277 3,911 4,616 4,193 3,783 ▼9.8% 7.2%
Mazda BT-50 - 65 312 270 1,064 1,517 42.6% 2.9%
Others 6,593 8,870 1,436 2,180 2,193 1,193 ▼45.6% 2.3%
Total 29,453 39,351 43,740 48,247 53,431 52,804 ▼1.2% 100.0%
Panel van/window van 10,513 10,578 7,005 8,913 9,576 9,677 1.1%
14,633 16,431 16,426 18,755 20,538 19,570 ▼4.7%
Bus 1,062 1,081 1,602 717 305 363 19.0%
Unknown - - - 33 5,151 480 ▼90.7%
536,905 605,156 599,691 627,753 655,793 666,465 1.6%
Mediumand heavy trucks
Automobile sales total
MPV
Pickup truck
Luxury
Sports
HEV
SUV

���������� ��� ���� ��������
����� ����� !"����
FOURIN Asia Automotive Intelligence
Thailand’s automobile market dropped
33.7 percent year-on-year to 882,000 units
in 2014. Luxury cars slightly increased,
SUVs’ decline shrank to 2.6 percent,
one-ton pickup trucks, which is
Thailand’s volume-selling segment,
dropped 29.6 percent and compact cars
fell 46.7 percent.
Compact cars decreased 46.7 percent to
� � 2014 Segmented Automobile Sales: Volume-selling
Thailand
Eco Car sales of other manufacturers,
Mitsubishi dropped some 50 percent,
Nissan and Suzuki each fell some 60
percent and Honda decreased by around
80 percent. Meanwhile, Toyota’s share in
the Eco Car market increased to 44.6
percent. Small cars dropped 27.1 percent
to 68,000 units. Although the
fully-remodeled Toyota Corolla Altis,
245,000 units. Sales were relatively
strong in 2013 thanks to backlog of orders
from the previous year; however, volume
in 2014 significantly declined. The Eco
Car-compliant Yaris, fully-remodeled
version launched in October 2013, went
up 2.5-fold to 53,000 units, dethroning the
Toyota Vios which has been segment
leader for a number of years. Looking at
Thailand: Automobile Sales Volume by Segment and Model (2009–2014)
(Units)
Segment Model 2009 2010 2011 2012 2013 2014 Year-on-year Share
Proton Savvy 1,427 1,429 674 94 4 5 25.0% 100.0%
Chery QQ 331 772 539 17 - - - -
Others 175 13 31 1 5 - ▼100.0% -
Total 1,933 2,214 1,244 112 9 5 ▼44.4% 100.0%
Toyota Yaris* 9,199 12,494 7,866 18,868 21,139 52,809 2.5-fold 21.6%
Toyota Soluna Vios/Vios 49,522 67,314 61,987 108,176 103,115 47,800 ▼53.6% 19.5%
Honda City 35,155 48,853 28,191 76,435 93,252 44,444 ▼52.3% 18.2%
Honda Jazz (incl. HEV) 18,188 17,710 20,164 31,285 21,745 16,553 ▼23.9% 6.8%
Nissan Almera* - - 5,444 59,476 49,206 15,559 ▼68.4% 6.4%
Suzuki Swift* 59 2,267 3,816 17,098 36,495 13,340 ▼63.4% 5.5%
Mitsubishi Attrage* - - - - 13,370 11,722 ▼12.3% 4.8%
Mitsubishi Mirage* - - - 38,762 29,863 10,990 ▼63.2% 4.5%
Mazda2 2,794 22,537 27,714 39,577 21,586 6,800 ▼68.5% 2.8%
Nissan March* - 18,740 32,563 31,390 10,487 6,044 ▼42.4% 2.5%
Ford Fiesta - 5,002 17,697 28,645 16,855 5,595 ▼66.8% 2.3%
Chevrolet Sonic - - - 8,256 14,088 4,549 ▼67.7% 1.9%
Honda Brio Amaze* - - - 25 22,112 4,297 ▼80.6% 1.8%
Honda Brio* - - 3,177 15,927 4,711 1,896 ▼59.8% 0.8%
SuzukiCelerio* - - - - - 1,862 - 0.8%
Kia Picanto 85 198 328 674 265 258 ▼2.6% 0.1%
Chevrolet Aveo 2,940 4,309 8,351 4,400 377 149 ▼60.5% 0.1%
Others 39 294 1,396 886 157 49 ▼68.8% 0.0%
Total 117,981 199,718 218,694 479,880 458,823 244,716 ▼46.7% 100.0%
Toyota Corolla Altis 25,374 38,485 38,947 53,945 35,260 36,593 3.8% 53.5%
Honda Civic (incl. HEV) 29,149 28,978 19,344 26,064 28,252 11,385 ▼59.7% 16.6%
Mazda3 4,800 5,798 5,476 5,727 4,028 8,938 2.2-fold 13.1%
Nissan Sylphy - - - 5,616 10,454 3,645 ▼65.1% 5.3%
Chevrolet Cruze - 274 8,296 8,824 4,126 1,732 ▼58.0% 2.5%
Ford Focus 1,025 1,680 2,046 5,335 5,219 1,700 ▼67.4% 2.5%
Nissan Pulsar - - - - 1,695 1,580 ▼6.8% 2.3%
Toyota Prius - 574 7,785 5,861 2,831 941 ▼66.8% 1.4%
Mitsubishi Lancer 2,994 7,026 6,409 3,655 1,227 675 ▼45.0% 1.0%
Hyundai Elantra - - - 163 68 240 3.5-fold 0.4%
MG (MG3/MG6) - - - - - 204 - 0.3%
Proton Preve - - - 10 127 141 11.0% 0.2%
VW Scirocco 49 122 83 113 29 23 ▼20.7% 0.0%
VW Golf 10 105 111 126 57 21 ▼63.2% 0.0%
Subaru Impreza 80 56 88 23 10 19 90.0% 0.0%
Kia Soul - 45 64 23 28 13 ▼53.6% 0.0%
Citroen DS3 - - 153 81 33 13 ▼60.6% 0.0%
Others 11,351 11,587 7,373 3,061 450 599 33.1% 0.9%
Total 74,832 94,730 96,175 118,627 93,894 68,462 ▼27.1% 100.0%
Honda Accord 5,611 6,041 6,039 4,950 15,080 8,744 ▼42.0% 45.0%
Toyota Camry (incl. HEV) 12,214 16,011 13,070 21,638 14,957 6,847 ▼54.2% 35.2%
Nissan Teana 4,384 5,553 5,375 6,237 4,199 3,752 ▼10.6% 19.3%
Peugeot 408 etc. 17 12 7 68 102 64 ▼37.3% 0.3%
Subaru Outback 1 - 24 41 42 14 ▼66.7% 0.1%
Subaru Legacy 16 18 7 12 18 6 ▼66.7% 0.0%
Hyundai Sonata 347 16 136 121 23 6 ▼73.9% 0.0%
Others 41 78 46 67 32 12 ▼62.5% 0.1%
Total 22,631 27,729 24,704 33,134 34,453 19,445 ▼43.6% 100.0%
Mercedes-Benz 3,854 4,750 3,746 6,374 10,269 11,182 8.9% 52.9%
BMW 2,356 3,016 3,053 6,114 8,187 7,836 ▼4.3% 37.1%
Volvo Car 435 838 922 1,887 1,610 1,260 ▼21.7% 6.0%
Lexus 270 337 622 769 756 571 ▼24.5% 2.7%
Others 256 256 348 383 79 284 3.6-fold 1.3%
Total 7,171 9,197 8,691 15,527 20,901 21,133 1.1% 100.0%
Sports 72 62 69 189 316 93 ▼70.6% 100.0%
Passenger car sales total 224,620 333,650 349,577 647,469 608,396 353,854 ▼41.8%
Mini
(A)
Compact
(B)
Small
(C)
Medium
(D)
Luxury

���������� ��� ���� ��������
����� ����� !"����
FOURIN Asia Automotive Intelligence
Asia Country Reports
One-ton Pickup Trucks, B Segment Sharply Decline
released in January 2014, and Mazda3,
which features Skyactiv technology,
among other models performed better
compared to the previous year, the Honda
Civic and Nissan Sylphy greatly declined.
Luxury cars slightly increased, up 1.1
percent to 21,000 units.
Although SUVs dropped 2.6 percent to
88,000 units, sales volume of this segment
ranked third after one-ton pickup trucks
and compact cars. Prior to its full model
change in 2015, the Toyota Fortuner
declined 32.4 percent to 20,000 units. In
contrast, the Isuzu MU-7, fully
remodeled in November 2013, went up
4.2-fold to 19,000 units and the Nissan
Juke, newly launched in November
2013, increased 17.0-fold to 10,000
units. One-ton pickup trucks dropped
29.6 percent to 372,000 units, all models
posting double-digit decline ranging
between 10 to 50 percent. The Toyota
Hilux Vigo, Thailand’s best-selling
model, is scheduled to be fully
remodeled in 2015. The new model is
anticipated to bring about market
recovery. (Kiyoko YAMAMOTO)
Thailand: Automobile Sales Volume by Segment and Model (2009–2014) (Cont.)�
Notes: Segmentation by FOURIN based on price, engine displacement, vehicle body size and others factors. Share is that of each segment. MPL – maximum payload. (Created by FOURIN)
(Units)
Segment Model 2009 2010 2011 2012 2013 2014 Year-on-year Share
Toyota Avanza 1,606 3,032 4,030 8,718 7,885 4,181 ▼47.0% 19.4%
Honda Freed 21 2,338 1,018 7,816 6,434 3,251 ▼49.5% 15.1%
Honda Mobilio - - - - - 3,101 - 14.4%
Hyundai H-1/Grand Starex 1,327 2,846 4,162 4,089 2,754 3,066 11.3% 14.3%
Toyota Innova 1,361 3,158 3,769 6,233 3,736 1,816 ▼51.4% 8.4%
Suzuki Ertiga - - - - 2,066 1,538 ▼25.6% 7.1%
Nissan Livina - - - - - 1,147 - 5.3%
Others 3,097 4,456 3,546 4,002 4,793 3,412 ▼28.8% 15.9%
Total 7,412 15,830 16,525 30,858 27,668 21,512 ▼22.2% 100.0%
Toyota Fortuner 15,226 20,605 13,083 36,329 29,815 20,156 ▼32.4% 22.8%
Isuzu MU-7 6,052 8,037 6,075 5,091 4,515 19,041 4.2-fold 21.5%
Nissan Juke - - - - 603 10,236 17.0-fold 11.6%
Honda CR-V 5,284 9,540 6,019 7,766 20,030 8,398 ▼58.1% 9.5%
Mitsubishi Pajero Sport 5,960 10,873 17,547 26,021 17,930 6,394 ▼64.3% 7.2%
Ford EcoSport - - - - - 6,289 - 7.1%
Mazda CX-5 - - - - 1,299 5,634 4.3-fold 6.4%
Honda HR-V - - - - - 3,764 - 4.3%
Chevrolet Trailblazer - - - 5,495 6,359 2,848 ▼55.2% 3.2%
Chevrolet Captiva 2,237 4,078 6,095 11,170 6,249 2,530 ▼59.5% 2.9%
Subaru XV - - - - 2,468 1,797 ▼27.2% 2.0%
Nissan X-Trail 37 422 358 430 167 574 3.4-fold 0.6%
Others 1,281 1,943 2,203 1,860 1,341 779 ▼41.9% 0.9%
Total 36,077 55,498 51,380 94,162 90,776 88,440 ▼2.6% 100.0%
Toyota Hiace 12,498 19,280 16,718 21,083 18,164 10,094 ▼44.4% 86.3%
Nissan Urvan 277 149 192 90 347 906 2.6-fold 7.7%
VW Caravelle 367 331 495 544 507 430 ▼15.2% 3.7%
Dongfeng Sokon - 107 223 405 296 237 ▼19.9% 2.0%
Others 224 365 450 571 268 35 ▼86.9% 0.3%
Total 13,366 20,232 18,078 22,693 19,582 11,702 ▼40.2% 100.0%
Toyota Hilux Vigo 102,026 144,190 121,887 233,393 206,936 144,693 ▼30.1% 38.9%
Isuzu D-Max 97,431 133,766 113,839 189,645 178,564 127,878 ▼28.4% 34.4%
Mitsubishi Triton 9,440 20,344 40,613 61,012 42,292 33,104 ▼21.7% 8.9%
Ford Ranger 5,599 5,435 7,944 19,745 28,287 23,977 ▼15.2% 6.4%
Nissan Navara 20,541 23,744 20,713 19,826 20,939 15,777 ▼24.7% 4.2%
Mazda BT-50 5,574 6,711 8,744 28,433 25,984 12,931 ▼50.2% 3.5%
Chevrolet Colorado 5,710 7,855 8,788 37,306 24,320 12,860 ▼47.1% 3.5%
Tata Motors Xenon 1,566 5,269 4,935 3,365 1,669 962 ▼42.4% 0.3%
Wuling - - - - - 58 - 0.0%
Total 247,887 347,314 327,463 592,725 528,991 372,240 ▼29.6% 100.0%
Suzuki Carry 2,092 2,949 4,820 6,563 6,305 3,437 ▼45.5% 66.9%
Dongfeng V21 etc. - 596 1,339 1,753 1,617 1,608 ▼0.6% 31.3%
Others 151 146 116 133 116 95 ▼18.1% 1.8%
Total 2,243 3,691 6,275 8,449 8,038 5,140 ▼36.1% 100.0%
Tata Super Ace - - 227 1,426 1,223 669 ▼45.3% 68.8%
Kia K2900 etc. 101 251 357 470 362 303 ▼16.3% 31.2%
Hyundai H100 (Porter) 122 109 77 16 - - - -
Total 223 360 661 1,912 1,585 972 ▼38.7% 100.0%
Isuzu Elf etc. 3,697 5,785 5,449 6,873 9,597 5,707 ▼40.5% 56.3%
Hino 300 Series 2,447 2,881 3,240 5,334 6,513 4,270 ▼34.4% 42.1%
Fuso Canter etc. 305 245 90 139 150 163 8.7% 1.6%
Total 6,449 8,911 8,779 12,346 16,260 10,140 ▼37.6% 100.0%
Isuzu 3,789 5,199 6,553 11,771 13,557 7,660 ▼43.5% 43.0%
Hino 4,476 6,980 6,898 11,725 12,487 7,470 ▼40.2% 41.9%
Volvo 395 356 654 959 1,107 1,001 ▼9.6% 5.6%
Fuso 935 545 552 1,522 1,519 887 ▼41.6% 5.0%
Scania 264 159 263 312 465 419 ▼9.9% 2.3%
Others 735 753 184 117 124 395 3.2-fold 2.2%
Total 10,594 13,992 15,104 26,406 29,259 17,832 ▼39.1% 100.0%
Automobile sales total) 548,871 799,478 793,842 1,437,020 1,330,555 881,832 ▼33.7%
Heavy commercial
vehicle
(MPL above 4t)
SUV
(incl. PPV)
Van
One-ton pickup truck
Light truck
(MPL below 1t)
Light truck
(MPL 1.5t)
Medium truck
(MPL 2-4t)
MPV
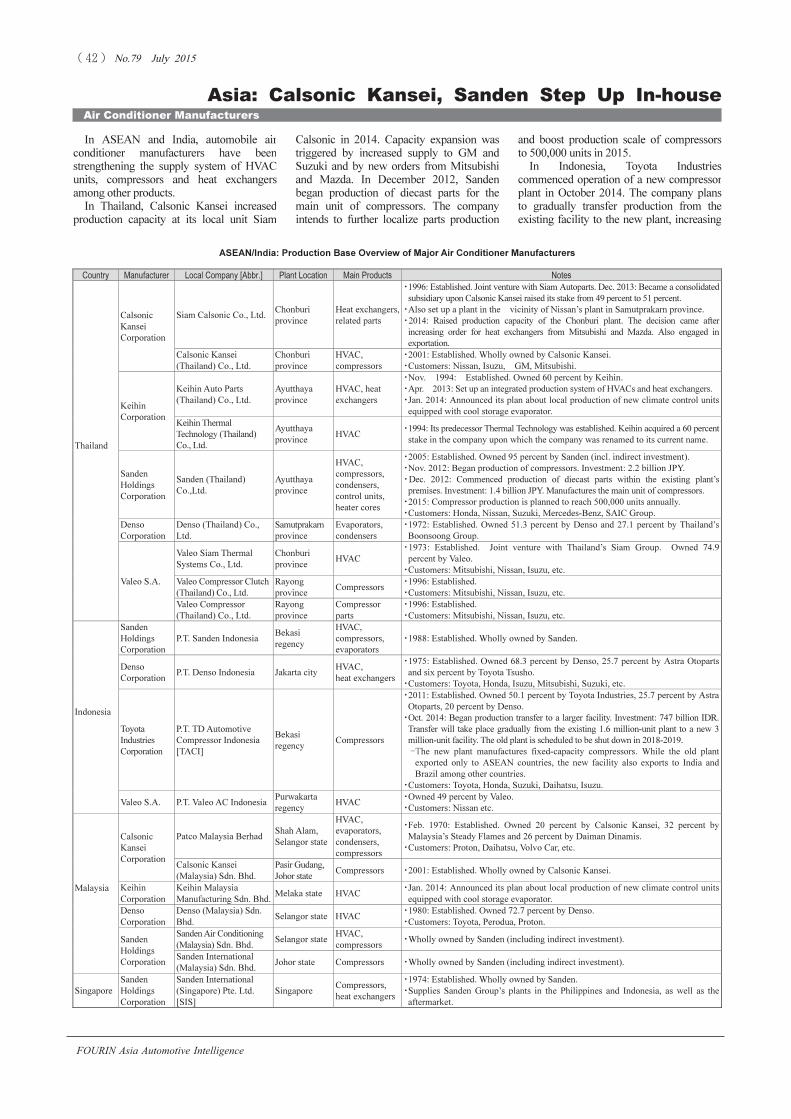
���������� ��� ���� ��������
����� ����� !"����
FOURIN Asia Automotive Intelligence
In ASEAN and India, automobile air
conditioner manufacturers have been
strengthening the supply system of HVAC
units, compressors and heat exchangers
among other products.
In Thailand, Calsonic Kansei increased
production capacity at its local unit Siam
� � � Asia: Calsonic Kansei, Sanden Step Up In-house
Air Conditioner Manufacturers
and boost production scale of compressors
to 500,000 units in 2015.
In Indonesia, Toyota Industries
commenced operation of a new compressor
plant in October 2014. The company plans
to gradually transfer production from the
existing facility to the new plant, increasing
Calsonic in 2014. Capacity expansion was
triggered by increased supply to GM and
Suzuki and by new orders from Mitsubishi
and Mazda. In December 2012, Sanden
began production of diecast parts for the
main unit of compressors. The company
intends to further localize parts production
Country Manufacturer Local Company [Abbr.] Plant Location Main Products Notes
Thailand
Calsonic
Kansei
Corporation
Siam Calsonic Co., Ltd.
Chonburi
province
Heat exchangers,
related parts
�1996: Established. Joint venture with Siam Autoparts. Dec. 2013: Became a consolidated
subsidiary upon Calsonic Kansei raised its stake from 49 percent to 51 percent.
�Also set up a plant in the vicinity of Nissan’s plant in Samutprakarn province.
�2014: Raised production capacity of the Chonburi plant. The decision came after
increasing order for heat exchangers from Mitsubishi and Mazda. Also engaged in
exportation.
Calsonic Kansei
(Thailand) Co., Ltd.
Chonburi
province
HVAC,
compressors
�2001: Established. Wholly owned by Calsonic Kansei.
�Customers: Nissan, Isuzu, GM, Mitsubishi.
Keihin
Corporation
Keihin Auto Parts
(Thailand) Co., Ltd.
Ayutthaya
province
HVAC, heat
exchangers
�Nov. 1994: Established. Owned 60 percent by Keihin.
�Apr. 2013: Set up an integrated production system of HVACs and heat exchangers.
�Jan. 2014: Announced its plan about local production of new climate control units
equipped with cool storage evaporator.
Keihin Thermal
Technology (Thailand)
Co., Ltd.
Ayutthaya
province
HVAC
�1994: Its predecessor Thermal Technology was established. Keihin acquired a 60 percent
stake in the company upon which the company was renamed to its current name.
Sanden
Holdings
Corporation
Sanden (Thailand)
Co.,Ltd.
Ayutthaya
province
HVAC,
compressors,
condensers,
control units,
heater cores
�2005: Established. Owned 95 percent by Sanden (incl. indirect investment).
�Nov. 2012: Began production of compressors. Investment: 2.2 billion JPY.
�Dec. 2012: Commenced production of diecast parts within the existing plant’s
premises. Investment: 1.4 billion JPY. Manufactures the main unit of compressors.
�2015: Compressor production is planned to reach 500,000 units annually.
�Customers: Honda, Nissan, Suzuki, Mercedes-Benz, SAIC Group.
Denso
Corporation
Denso (Thailand) Co.,
Ltd.
Samutprakarn
province
Evaporators,
condensers
�1972: Established. Owned 51.3 percent by Denso and 27.1 percent by Thailand’s
Boonsoong Group.
Valeo S.A.
Valeo Siam Thermal
Systems Co., Ltd.
Chonburi
province
HVAC
�1973: Established. Joint venture with Thailand’s Siam Group. Owned 74.9
percent by Valeo.
�Customers: Mitsubishi, Nissan, Isuzu, etc.
Valeo Compressor Clutch
(Thailand) Co., Ltd.
Rayong
province
Compressors
�1996: Established.
�Customers: Mitsubishi, Nissan, Isuzu, etc.
Valeo Compressor
(Thailand) Co., Ltd.
Rayong
province
Compressor
parts
�1996: Established.
�Customers: Mitsubishi, Nissan, Isuzu, etc.
Indonesia
Sanden
Holdings
Corporation
P.T. Sanden Indonesia
Bekasi
regency
HVAC,
compressors,
evaporators
�1988: Established. Wholly owned by Sanden.
Denso
Corporation
P.T. Denso Indonesia Jakarta city
HVAC,
heat exchangers
�1975: Established. Owned 68.3 percent by Denso, 25.7 percent by Astra Otoparts
and six percent by Toyota Tsusho.
�Customers: Toyota, Honda, Isuzu, Mitsubishi, Suzuki, etc.
Toyota
Industries
Corporation
P.T. TD Automotive
Compressor Indonesia
[TACI]
Bekasi
regency
Compressors
�2011: Established. Owned 50.1 percent by Toyota Industries, 25.7 percent by Astra
Otoparts, 20 percent by Denso.
�Oct. 2014: Began production transfer to a larger facility. Investment: 747 billion IDR.
Transfer will take place gradually from the existing 1.6 million-unit plant to a new 3
million-unit facility. The old plant is scheduled to be shut down in 2018-2019.
��he new plant manufactures fixed-capacity compressors. While the old plant
exported only to ASEAN countries, the new facility also exports to India and
Brazil among other countries.
�Customers: Toyota, Honda, Suzuki, Daihatsu, Isuzu.
Valeo S.A. P.T. Valeo AC Indonesia
Purwakarta
regency
HVAC
�Owned 49 percent by Valeo.
�Customers: Nissan etc.
Malaysia
Calsonic
Kansei
Corporation
Patco Malaysia Berhad
Shah Alam,
Selangor state
HVAC,
evaporators,
condensers,
compressors
�Feb. 1970: Established. Owned 20 percent by Calsonic Kansei, 32 percent by
Malaysia’s Steady Flames and 26 percent by Daiman Dinamis.
�Customers: Proton, Daihatsu, Volvo Car, etc.
Calsonic Kansei
(Malaysia) Sdn. Bhd.
Pasir Gudang,
Johor state
Compressors �2001: Established. Wholly owned by Calsonic Kansei.
Keihin
Corporation
Keihin Malaysia
Manufacturing Sdn. Bhd.
Melaka state HVAC
�Jan. 2014: Announced its plan about local production of new climate control units
equipped with cool storage evaporator.
Denso
Corporation
Denso (Malaysia) Sdn.
Bhd.
Selangor state HVAC
�1980: Established. Owned 72.7 percent by Denso.
�Customers: Toyota, Perodua, Proton.
Sanden
Holdings
Corporation
Sanden Air Conditioning
(Malaysia) Sdn. Bhd.
Selangor state
HVAC,
compressors
�Wholly owned by Sanden (including indirect investment).
Sanden International
(Malaysia) Sdn. Bhd.
Johor state Compressors �Wholly owned by Sanden (including indirect investment).
Singapore
Sanden
Holdings
Corporation
Sanden International
(Singapore) Pte. Ltd.
[SIS]
Singapore
Compressors,
heat exchangers
�1974: Established. Wholly owned by Sanden.
�Supplies Sanden Group’s plants in the Philippines and Indonesia, as well as the
aftermarket.
ASEAN/India: Production Base Overview of Major Air Conditioner Manufacturers�

���������� ��� ���� ��������
����� ����� !"����
FOURIN Asia Automotive Intelligence
Asia Country Reports
Production; Halla, Valeo Establish Plant in India
annual production capacity to 3 million units
in 2018–2019.
In India, leading local manufacturer
Subros commenced operation of a new plant
in Chennai in fiscal 2013. Meanwhile
Sanden and its local partner Vikas began
production of aluminum tubes for heat
exchangers at a new plant in February 2014.
Calsonic Kansei and its local partner
Motherson Sumi Systems commenced
operation of a compressor plant in
September 2014. The joint venture plans to
start production of aluminum vane rotary
compressors with an annual scale of
600,000 units in the second half of 2015.
Denso started production at its Jhajjar plant
in summer 2013. In 2015, Valeo and Halla
Visteon Climate Control each began
operation at their respective facility in
Sanand to supply Ford’s new Sanand plant.
(Kiyoko YAMAMOTO)
Country Manufacturer Local Company [Abbr.] Plant Location Main Products Notes
Philippines
Denso
Corporation
Philippine Auto
Components Inc.
Laguna state HVAC
�1995: Established. Wholly owned by Denso.
�Customers Toyota, Mitsubishi, Honda, etc.
Sanden
Holdings
Corporation
Automotive
Air-conditioning
Technology
Philippines, Inc. [ATP]
Laguna state
HVAC, condensers,
evaporators
�Owned 99 percent by Sanden.
�Customers: Toyota, Honda, Isuzu, Mitsubishi, etc. Also exports to Europe.
India
Calsonic
Kansei
Corporation
Calsonic Kansei
Motherson Auto
Products Ltd.
[CKM]
Manesar (HR);
Chennai (TN);
Ahmedabad (GJ)
HVAC,
compressors,
heat exchangers
�2007: Established. Owned 51 percent by Calsonic Kansei and 49 percent by
Motherson Sumi Systems.
�Fiscal 2011: Commenced operation at Chennai plant for Renault-Nissan.
�Customers: Renault-Nissan, Maruti Suzuki, etc.
�Sep. 2014: Commenced operation of a new compressor plant. Parts manufacturing
takes place locally which reduces transportation and production cost.
�H2 2015: Plans to start production of aluminum vane rotary compressors
with an annual scale of 600,000 units.
Keihin
Corporation
Keihin India
Manufacturing Pvt. Ltd.
Noida (UP) HVAC
�Formerly called Keihin Panalfa.
�Currently wholly-owned subsidiary of Keihin.
Denso
Corporation
Denso Kirloskar
Industries Pvt. Ltd.
Bengaluru (KA)
HVAC, condensers,
radiators, air cleaners,
intercoolers, heater cores
�1998: Established. Owned 97.87 percent by Denso.
�Customers: Maruti Suzuki, Toyota, etc.
Denso Faridabad Pvt.
Ltd.
Faridabad (HR) HVAC, heaters �1999: Established. Wholly owned by Denso.
Denso Thermal
Systems Pune Pvt. Ltd.
Pune (MH) HVAC, heaters
�2001: Established. Wholly owned by Denso.
�Customers: Fiat etc.
Denso Haryana Pune
Pvt. Ltd.
Jhajjar (HR) HVAC
�Summer 2013: Commenced operation of a new plant in Jhajjar, Haryana
state. Investment: 4.2 billion JPY.
Sanden
Holdings
Corporation
Sanden Vikas (India)
Ltd.
Faridabad (HR)
HVAC, compressors,
evaporators,
condensers, hoses,
pipes
�1984: Established. Joint venture with local partner Vikas. Owned 50 percent
by Sanden (indirect investment).
�Nov. 2012: Began production of small scroll compressors. Investment: 500
million JPY.
�Customers: Maruti Suzuki, Honda, Ford, Tata Motors, Mahindra & Mahindra, etc.
Sanden Vikas Precision
Parts Pvt. Ltd.
Neemrana (RJ) Compressor parts
�Joint venture with local partner Vikas.
�Oct. 2013: Commenced operation.
Pranav Vikas (India)
Ltd.
Faridabad/
Palwal (HR);
Pune (MH)
Condensers,
evaporators,
heater cores
�Joint venture with local partner Vikas.
Vikas Altech Pvt. Ltd. Pune (MH) Heat exchangers
�Joint venture with local partner Vikas.
�Feb. 2014: Commenced operation.
�Manufactures aluminum tubes for heat exchangers. Annual production capacity
is over 4 million units.
Valeo S.A. N.A. Sanand (GJ)
Radiators,
charge air controller,
fan systems, condensers
�Site/building area: 60,000/4,400m². Investment: 1 billion INR (excl. land price).
�Dec. 2014: Began pilot production. Regular production is scheduled to start
in mid-2015.
�Sixty percent of production is intended for Ford, while the rest is aimed to be
supplied to Maruti Suzuki among others.
Delphi
Automotive
PLC
Delphi Automotive
Systems Pvt. Ltd.
Greater Noida
(UP)
HVAC, condensers,
intercoolers,
aluminum radiators
�1998: Established. Wholly owned by Delphi.
�Customers: Hyundai, Mahindra & Mahindra, Tata Motors, Ashok Leyland, etc.
�Feb. 2015: Delphi concluded an agreement to sell its thermal management division
to Mahle. Apparently, operations in India are also included in the agreement.
Halla Visteon
Climate
Control
Corporation
Visteon Automotive
Systems India Pvt. Ltd.
Chennai (TN);
Pune (MH);
Sanand (GJ)
Heat exchangers,
HVAC,
condensers, hoses
�1997: Established. Wholly owned by Halla Visteon Climate Control.
�Mar. 2015: Commenced operation of the Sanand plant. Building area:
8,890m². Annual production capacity is set at 2 million units; however, it
may be doubled depending on demand.
Halla Visteon Climate
Systems India Ltd.
Bhiwadi (RJ)
Radiators,
heater cores
�1993: Established. Joint venture with Maruti Suzuki. Owned 61 percent by
Halla Visteon Climate Control.
Subros Ltd.
Noida (UP);
Chennai (TN)
HVAC,
compressors,
condensers,
evaporators
�1985: Established. Owned 40 percent by India’s Suri family, 13 percent by
Denso and 13 percent by Suzuki among others.
�Fiscal 2010: Expanded production capacity of five plants. Investment: 300
million INR.
�Fiscal 2013: Commenced operation of the Chennai plant.
�
ASEAN/India: Production Base Overview of Major Air Conditioner Manufacturers (Cont.)�
GJ: Gujarat state. HR: Haryana state. KA: Karnataka state. MH: Maharashtra state. RJ: Rajasthan state. TN: Tamil Nadu state. UP: Uttar Pradesh state.
(Created using company PR materials and media sources)

���������� ��� ���� ��������
����� ����� !"����
FOURIN Asia Automotive Intelligence
In ASEAN and India, brake friction
material manufacturers have been
increasing production capacity as well as
boosting automatization and localization
in an effort to reduce cost.
In Thailand, Nisshinbo Brake invested
700 million JPY in 2012 to raise monthly
production capacity of its plant by 35
percent to 500,000 units. A second plant
Asia: Capacity Expansion in ASEAN, India; Improvement
Brake Friction Materials Manufacturers
cutting-edge equipment and
improvement of the existing production
lines. Japan Brake Industrial, a
subsidiary of Hitachi Chemical, set up a
second plant in 2013, doubling
production capacity. Aisin Chemical
invested 1 billion JPY to increase
monthly production capacity of disc
brake pads to 800,000 units by 2015 and
commenced operation in March 2014
which specializes in drum brakes,
allowing the existing facility to
exclusively manufacture friction
materials. The existing workforce of
approximately 450 persons at the first
plant was divided between the two
facilities. Automatization is intended to
be realized by the introduction of
Country Manufacturer [Abbr.] Local Company [Abbr.] Plant Location Main Products Notes
Thailand
Aisin Chemical
Co., Ltd.
Aisin Chemical
(Thailand) Co.,
Ltd. [ACT]
Rayong province Brake pads etc.
�2000: Established.
�2013: Began production capacity expansion. Monthly production capacity of disc
brake pads increased from 700,000 units in 2014 to 800,000 units by Mar. 2015 and
is planned to reach 1 million units in 2018. Total investment: Approx. 1 billion JPY.
�Main customers: Toyota, Aisin AW, Nissan, etc. Also exports to Indonesia.
Akebono Brake
Industry Co., Ltd.
Akebono Brake
(Thailand) Co.,
Ltd.
Chonburi province Disc brake pads
�Aug. 2006: Established. Fully invested by Akebono Brake Industry.
�Jan. 2009: Began production of brake pads for local OEMs and the aftermarket
market.
�Fiscal 2012: Set up an additional production line to increase monthly production
capacity of friction materials from 200,000 units to 400,000 units. Supplies the
Mitsubishi Mirage and Attrage.
�2012–2015: Aims to concentrate friction material production for the aftermarket
in Thailand.
Nisshinbo Brake
Inc.
Nisshinbo
Somboon
Automotive Co.,
Ltd. [NSA]
Rayong province
Linings, disc
brake pads, etc.
�Jun. 1996: Established. Owned 97.1 percent by Nisshinbo, 2.9 percent by
Bangkok Spring Industries.
�Jul. 2012: Invested 700 million JPY to expand manufacturing equipment,
increasing monthly production capacity by 35 percent to 500,000 units.
�Mar. 2014: Began regular production at second plant.
–Investment: Approx. 6 billion JPY. Site area: Approx. 30,000m².
–Gradually increased production capacity for three years between 2013 and
2015. The facility specializes in drum brakes, while the NO. 1 plant is planned
to specialize in linings, pads and other friction materials.
–Automatization is intended to be realized by the introduction of cutting-edge
equipment and improvement of existing production lines. The existing
workforce of approx. 450 persons at the No. 1 plant are planned to be divided
between the two facilities.
�Sales revenue in 2016 is aimed to be in the 10 billion JPY range.
�Main customers: Honda, AAT, Ford, Hino, Isuzu, Fuso, Mitsubishi, Nissan,
Suzuki, etc. Also exports to Indonesia.
Nissin Kogyo
Co., Ltd.
Nissin Brake
(Thailand) Co.,
Ltd.
Nakorn Ratchasrima
province;
Pathumthani province;
Khon Kaen province
Brake pads
�1973: Established M.N. Industry. Merged with other two other affiliated
companies in 2000 to form Nissin Brake (Thailand).
�Supplies Honda and other automobile as well as motorcycle manufacturers.
�Aims to boost local content by over 10 percent in the medium term.
Japan Brake
Industrial Co.,
Ltd. [JBI]
Japan Brake
(Thailand) Co.,
Ltd.
Ayutthaya province;
Chachoengsao
province
Disc brake pads,
etc.
�May 2002: Established as a joint venture between Japan Brake Industrial and
Nissin Kogyo. Nissin Kogyo transferred its entire stake in the joint venture to
Hitachi Chemical in 2012.
�2013: Set up a second plant, to double production capacity.
�Sep. 2014: Hitachi Chemical announced its plan to consolidate its affiliated
subsidiaries in Thailand. In Apr. 2015, Japan Brake (Thailand) merged with
Hitachi Powdered Metals’ Thai subsidiary Hitachi Powdered Metals (Thailand)
to form Hitachi Chemical Asia (Thailand).
Indonesia
Akebono Brake
Industry Co., Ltd.
PT. Akebono
Brake Astra
Indonesia [AAIJ]
Jakarta city
Brake pads, brake
linings
�1981: Established as Tri Dharma Wisesa. Akebono Brake Industry acquired a 30
percent stake in Tri Dharma Wisesa in 1996, which was raised to 50 percent in
2006. Now, the joint venture, which received its current name in Aug. 2010, is
50/50 owned by Akebono Brake Industry and Astra Group.
�Main customers: Yamaha, Daihatsu, Toyota.
A&A Material
Corp.
PT. Ask Technica
Indonesia
Karawang regency Brake linings
�1990: Established. Ask Technica handles automotive business of its parent
company A&A Material.
�2008: Began production of brake linings for motorcycles. Increased monthly
production capacity in Jun. 2011 to 1 million units by investing 200 million JPY.
�2013: Renamed from Satonas Utama.
PT. Chemco
Harapan
Nusantara
-
Bekasi regency;
Karawang regency
Disc brake pads,
linings, etc.
�1984: Established. Nissin Kogyo acquired a 40 percent stake in the company in 1987.
�Main customers: Honda (motorcycles, automobiles), Yamaha, Daihatsu, etc.
�Apr. 2013: According to media sources, Nissin Kogyo purchased land in the
vicinity of the plant for approx. 1 billion JPY. Site area: 192,000m².
PT. Indoprima
Gemilang
- Surabaya city Brake linings
�1976: Set up a brake lining division.
�Products, which are based on licensed technology from Mitsubishi Materials
Kenzai, are sold under the IBK brand.
�Supplies trucks and buses. Main customers: Isuzu, Hino, Fuso, Nissan, Toyota,
Renault Trucks, Volvo, Mercedes-Benz, Ford.
Malaysia
FBK Automotive
Components
Malaysia Sdn. Bhd.
- Selangor state
Brake pads, brake
linings, shoes
�1983: Established.
�Malaysia’s largest friction materials supplier.
�Main customers: Proton, Nissan, Toyota, Mazda, Ford, Isuzu, etc.
�
ASEAN: Production Base Overview of Major Brake Friction Material Manufacturers
(Created using company PR materials and various media sources)

���������� ��� ���� ��������
����� ����� !"����
FOURIN Asia Automotive Intelligence
Asia Company Reports
of Productivity, Localization Are Also Underway
to 1 million units by 2018.
In Indonesia, Chemco Harapan
Nusantara, 40 percent owned by Nissin
Kogyo, purchased land in the vicinity of
its existing plant apparently with an aim
to boost production capacity. Chemco
Harapan Nusantara supplies motorcycle
and automobile manufacturers including
Honda, Yamaha and Daihatsu.
In India, local industry leader Rane
Brake Lining operates four facilities
nationwide, while another local entity
Masu Brakes, which has been supplying
commercial vehicles, began production
of brake pads for passenger vehicles at a
new plant in 2014. Hitachi Chemical
commenced regular operation in 2013
with a plan to increase sales revenue to 4
billion JPY in fiscal 2015. Nissin Kogyo
intends to increase local content by 20
percent compared to the current level in
order to further increase competitiveness.
Meanwhile, Akebono Brake Industry put
on hold its plan to enter India due to
financial reasons and plans to focus on
Thailand and Indonesia instead.
(Kiyoko YAMAMOTO)
Manufacturer [Abbr.] Local Company Plant Location Main Products Notes
Nissin Kogyo Co.,
Ltd.
Nissin Brake India
Pvt. Ltd.
Neemrana (RJ) Brake pads
�Apr. 2007: Established. Wholly owned by Nissin Kogyo.
�Customers: Honda Cars India, Ashok Leyland, Eicher, Hero MotoCorp, etc.
�Local content is planned to be increased by 20 percent compared to the current
level in the medium term.
Hitachi Chemical Co.,
Ltd.
Allied JB Friction
Pvt. Ltd.
Neemrana (RJ)
Brake pads, brake
linings
�May 2011: Established as a joint venture by Hitachi Chemical, JBI and ANL.
The former two companies control 51 percent of shares.
�Site/building area: 30,000/16,000m². Construction cost (excl. land price): 700
million INR.
�Dec. 2012: SOP. Employees: 320 persons (initially) → 560 persons (2015)
� Took over ANL’s friction material supply to OEMs. Supplies Japanese
manufacturers.
�Sales revenue in fiscal 2015 is aimed to reach 4 billion JPY.
Sangsin Brake Co.,
Ltd.
Sangsin Brake India
Pvt. Ltd.
Chennai (TN)
Brake pads, brake
linings
�Feb. 2010: Established as a wholly-owned subsidiary of Korea’s Sangsin Brake.
�Customers: Hyundai Motor India etc.
Allied Nippon Ltd.
[ANL]
-
Ghaziabad (UP);
Gurgaon (HR);
Parwanoo (HP)
Brake pads, brake
linings, brake shoes
�Subsidiary of India’s Talwar Group.
�1982: Began technical collaboration with JBI to manufacture brake lining. 1983:
Began production of brake lining and other products. 1991: Capital participation
by Hitachi Chemical and JBI. 2004: Began production of commercial vehicle
disc brake pads for Japanese automakers. 2005: Began production of motorcycle
disc brake pads.
�Customers: Local motorcycle manufacturers, Maruti Suzuki, etc.
�May 2011: Allied Motors, Hitachi Chemicals and JBI ended their capital tie-up.
The decision came after Hitachi Chemical’s failed attempt to capture controlling
share in the joint venture.
AVS Brake Linings
Pvt. Ltd.
- Palwal (HR)
Brake pads, brake
linings
�1977: Established.
�Customers: Tata Motors, Eicher Motors, etc.
Brakewel Automotive
Components India Pvt.
Ltd.
- Noida (UP) Brake linings, disc pads
�1983: Established.
�Customers: Maruti Suzuki, Mahindra & Mahindra, Tata Motors, Ashok Leyland,
Ford, etc.
KB Autosys India Pvt.
Ltd.
(formerly KB Brake
India Pvt. Ltd.)
- Chennai (TN)
Brake pads, brake
linings
�Mar. 2007: Established its predecessor KB Brake India. Renamed to its current
name in Dec. 2009.
�Oct. 2010: SOP. Receives licensed technology from Ask Technica.
�Customers: Hyundai Motor India etc. Also exports to Germany, the Netherlands,
Italy, the UK, Saudi Arabia and elsewhere.
M.K. Auto Industries - Kala Amb (HP)
Brake pads, brake
linings, etc.
�Subsidiary of MK Group.
�1959: Established.
�2012: Began production of brake liners among other products.
�Customers: Bajaj Auto etc.
Makino Auto
Industries Pvt. Ltd.
- Noida (UP)
Motorcycle brake
linings, disc pads
�Aug. 1990: Established.
�Customers: Yamaha Motors India, TVS Motor, Bajaj Auto, Hero MotoCorp, etc.
Masu Brakes Pvt. Ltd. - Bahadurgarh (HR)
Brake linings, Semi
metallic brake disc pads
for commercial vehicles
�1982: Established. 1995: Began production of brake linings. 2008: Began
production of brake disc pads for commercial vehicles.
�2014: Set up a new plant to manufacture brake pads for passenger vehicles. An
R&D center was established as well.
�Customers: Ashok Leyland etc.
Rane Brake Lining
Ltd.
-
Chennai/Trichy/
Puducherry (TN);
Hyderabad (AP)
Brake pads, brake
linings
�1964: Established. Capital participation by Nisshinbo Holdings in 1996, raising
its share to 20.15 percent in 2009.
�Customers: Maruti Suzuki, Toyota Kirloskar Motor, etc. Controls 50 percent of
the Indian market.
�2011: SOP of new plant in Trichy, Tamil Nadu state. 2012: Expanded capacity.
Sundaram Brake
Linings Ltd.
-
Chennai/
Virudhunagar/
Chengalpet (TN)
etc.
Brake pads, brake
shoes, etc.
�Subsidiary of TVS Group.
�1976: Began production.
�Customers: Tata Motors, Ashok Leyland, TVS Motor, etc.
�Employees: 1,500 persons
�Facilities: Five plants nationwide.
�Export accounts for 35 percent of total production. Exports to 54 countries
including the UK and the US. Maintains strong presence in India’s OEM and
aftermarket.
�
India: Production Base Overview of Major Brake Friction Material Manufacturers�
(Created using company PR materials and various media sources)
AP: Andhra Pradesh state. HP: Himachal Pradesh state. HR: Haryana state. MP: Madhya Pradesh state. RJ: Rajasthan state. TN: Tamil Nadu state. UP: Uttar Pradesh state.

���������� ��� ���� ��������
����� ����� !"����
FOURIN Asia Automotive Intelligence
Hella, a German automobile lighting
equipment and electronic products
supplier, increased sales revenue 10.4
percent year-on-year in fiscal 2013/2014
(June 2013-May 2014) to 5.3 billion
EUR. The company revealed that sales
were driven by rising demand for new
products in the expanding markets of
China and the Americas. Hella is
attaching importance especially to the
Asian and Chinese market, naming Jörg
Buchheim president and CEO of Hella’s
� � � � � � China: Enhances Product Lineup, Production
Hella
production capacity expansion, the
introduction of energy-saving products is
under consideration. In January 2015,
Hella Shanghai Electronics introduced
an X-ray inspection system to examine
the internal structure and packaging of
electronic and other products in an effort
to raise product quality. In the same
month, Hella’s Chinese electronics
division executive vice president Frank
Petznick said that currently Hella is in
partnership with all automakers in China
China operations in January 2014.
Buchheim said that annual sales revenue
in China is aimed to reach 10 billion
CNY by 2017. The company plans to
invest 500 million CNY annually in
China, conclude tie-ups with local
companies and improve local
development capability.
Looking at the automobile electronics
sector, business development is carried
out through local subsidiaries. Apart
from product quality improvement and
(Created using various media sources)
Hella: Main Electronic Products Facilities in China (As of Jun. 2015)
Notes: Fiscal year is from June through to May of the following year. Fiscal 2013/2014 is from June 2013 through to May 2014.
Area
Company Location Established
Registered
Capital
Ownership Ratio
Products
(Annual Production Capacity)
Notes
Prod
uction
Hella Shanghai
Electronics Co.,
Ltd.
[HSE]
Shanghai Dec. 1995
110 million
CNY
Hella 100%
Actuators, sensors, lamps,
central control units,
keyless entry systems,
driver assist systems, etc.
� Sales revenue in fiscal 2013/2014: 2.18 billion CNY.
Employees: 1,116 persons. Supplies Shanghai VW, FAW-VW,
Shanghai GM, Chery, Brilliance, Jianghuai, Changan, etc.
�R&D and manufacturing base of electronic products for Asia.
�Jan. 2015: Hella’s Chinese electronics division executive vice
president Frank Petznick said that the 48V system is planned to
be initially introduced in China by installed into a concept car.
Regarding ADAS, Petznick said that it has been already
launched in China, and ADAS localization and research is
underway at an independently established R&D center in
Nanjing.
�Jan. 2015: Invested 1 million CNY to improve product quality.
Introduced the phoenix x|aminer X-ray inspection system to
examine the internal structure and packaging of electronic and
other products.
Behr-Hella
Thermocontrol
(Shanghai) Co.,
Ltd.
[BHTS]
Shanghai Oct. 2004
10 million
USD
Hella 50%, Behr
50%
Automobile air
conditioner control units
�Supplies Shanghai VW (Tiguan, Passat, Lavida), FAW-VW
(Golf, Magotan), GM (Epsilon, Delta platforms).
�Mar. 2015: Announced the construction of a new plant to
manufacture automobile AC control units. Site/building area:
13,000/7,637m². In phase one (2015), APC was set at 800,000
sets. APC is to reach 3 million sets in phase two (2016) and 5
million sets in phase three (2019). Two hundred new workers are
planned to be hired.
Hella (Xiamen)
Automotive
Electronics Co.,
Ltd.
[HAE]
Xiamen,
Fujian
Dec. 2003
5.12
million
USD
Hella 100% Automobile relays
� Sales revenue in fiscal 2013/2014: 310 million CNY.
Employees: 315 persons. Supplies VW, Audi, Daimler, Ford,
GM, Chrysler, etc. Exports to Europe, North America and Asia.
�Jan. 2015: Hella’s Chinese electronics division executive vice
president Frank Petznick said that currently Hella is in
partnership with all automakers in China in the electronics
sector. Business is especially booming in recent years,
increasing about six-fold in the past seven years. HAE’s APC
tripled since it commenced operation.
Hella (Xiamen)
Electronic
Device Co., Ltd.
[HED]
Xiamen,
Fujian
Aug. 2011
12 million
CNY
HSE 100%
S2, Micro and other
automobile relays, sensors
�Supplies automakers (Shanghai VW, FAW-VW, Shanghai GM,
Hyundai, etc.) and parts makers (Delphi, Yazaki, etc.).
�Sales revenue in fiscal 2013/2014: 75 million CNY. Employees:
114 persons.
Mando-Hella
Electronics
(Suzhou) Co.,
Ltd.
[MHES]
Suzhou,
Jiangsu
Jul. 2011
25 million
USD
Hella, Mando
Components for ECUs and
sensors used for ABS,
chassis electronic control
systems, driver assist
system
�Nov. 2012: SOP. Investment: 75 million USD. Supplies Mando
(Suzhou) Automotive Chassis System which in turn supplies
assembled products to Shanghai GM, Beijing Hyundai,
Dongfeng Yueda-Kia, etc.
�Nov. 2014: According to media sources, MHES added an extra
production line in 2014 and plans to add four more lines in 2015
and 2016.
–In 2014, sales revenue increased 30 percent to 450 million
CNY and is projected to reach 700 million CNY in 2015 and
1.5 billion CNY in 2017.
R&
D Hella Nanjing
Technical Center
[HNTC]
Nanjing,
Jiangsu
Jun. 2012 N.A. Hella 100%
Development of
automobile electronics and
lighting equipment.
�Investment: 90 million CNY
�Engaged in the development of LED lamps, driver assist
systems, energy control systems and other new technologies to
improve safety and reduce emissions.
�Ninety percent of R&D is intended for China, while the rest for
the global market. The engineer team is intended to consist of
400 persons as of at the end of 2015.
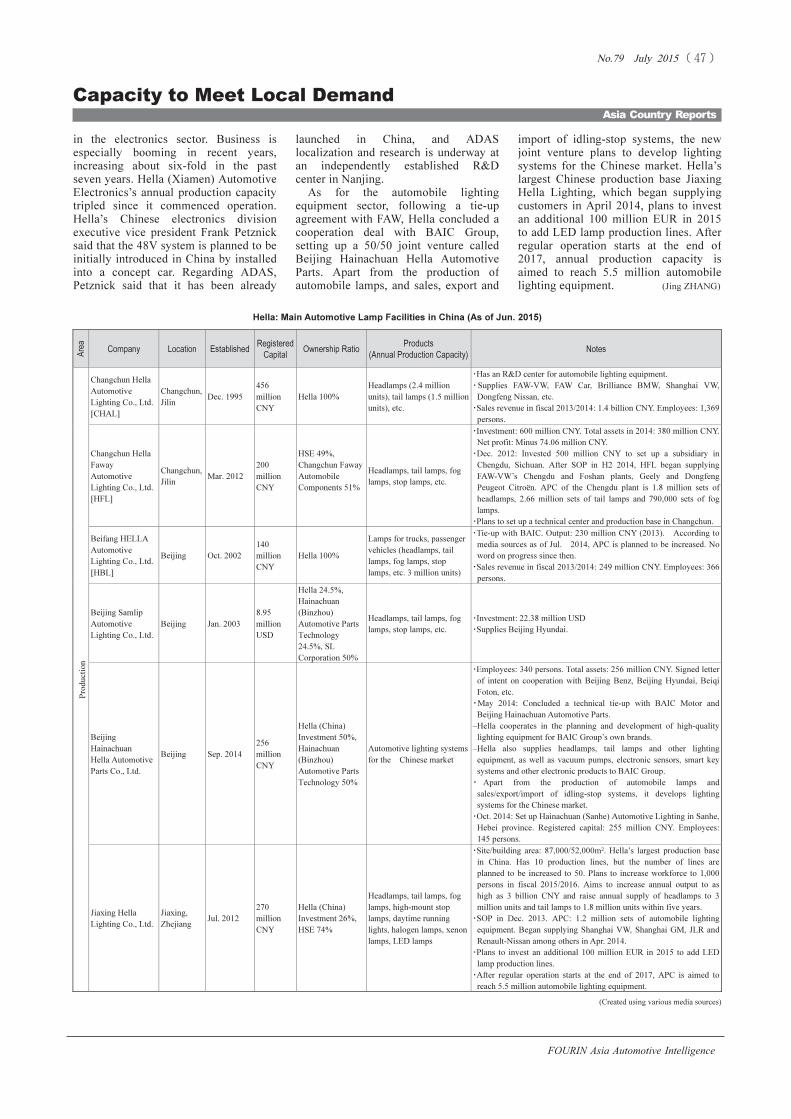
���������� ��� ���� ��������
����� ����� !"����
FOURIN Asia Automotive Intelligence
Asia Country Reports
Capacity to Meet Local Demand
in the electronics sector. Business is
especially booming in recent years,
increasing about six-fold in the past
seven years. Hella (Xiamen) Automotive
Electronics’s annual production capacity
tripled since it commenced operation.
Hella’s Chinese electronics division
executive vice president Frank Petznick
said that the 48V system is planned to be
initially introduced in China by installed
into a concept car. Regarding ADAS,
Petznick said that it has been already
launched in China, and ADAS
localization and research is underway at
an independently established R&D
center in Nanjing.
As for the automobile lighting
equipment sector, following a tie-up
agreement with FAW, Hella concluded a
cooperation deal with BAIC Group,
setting up a 50/50 joint venture called
Beijing Hainachuan Hella Automotive
Parts. Apart from the production of
automobile lamps, and sales, export and
import of idling-stop systems, the new
joint venture plans to develop lighting
systems for the Chinese market. Hella’s
largest Chinese production base Jiaxing
Hella Lighting, which began supplying
customers in April 2014, plans to invest
an additional 100 million EUR in 2015
to add LED lamp production lines. After
regular operation starts at the end of
2017, annual production capacity is
aimed to reach 5.5 million automobile
lighting equipment. (Jing ZHANG)
� (Created using various media sources)
Area
Company Location Established
Registered
Capital
Ownership Ratio
Products
(Annual Production Capacity)
Notes
Production
Changchun Hella
Automotive
Lighting Co., Ltd.
[CHAL]
Changchun,
Jilin
Dec. 1995
456
million
CNY
Hella 100%
Headlamps (2.4 million
units), tail lamps (1.5 million
units), etc.
�Has an R&D center for automobile lighting equipment.
�Supplies FAW-VW, FAW Car, Brilliance BMW, Shanghai VW,
Dongfeng Nissan, etc.
�Sales revenue in fiscal 2013/2014: 1.4 billion CNY. Employees: 1,369
persons.
Changchun Hella
Faway
Automotive
Lighting Co., Ltd.
[HFL]
Changchun,
Jilin
Mar. 2012
200
million
CNY
HSE 49%,
Changchun Faway
Automobile
Components 51%
Headlamps, tail lamps, fog
lamps, stop lamps, etc.
�Investment: 600 million CNY. Total assets in 2014: 380 million CNY.
Net profit: Minus 74.06 million CNY.
�Dec. 2012: Invested 500 million CNY to set up a subsidiary in
Chengdu, Sichuan. After SOP in H2 2014, HFL began supplying
FAW-VW’s Chengdu and Foshan plants, Geely and Dongfeng
Peugeot Citroën. APC of the Chengdu plant is 1.8 million sets of
headlamps, 2.66 million sets of tail lamps and 790,000 sets of fog
lamps.
�Plans to set up a technical center and production base in Changchun.
Beifang HELLA
Automotive
Lighting Co., Ltd.
[HBL]
Beijing Oct. 2002
140
million
CNY
Hella 100%
Lamps for trucks, passenger
vehicles (headlamps, tail
lamps, fog lamps, stop
lamps, etc. 3 million units)
�Tie-up with BAIC. Output: 230 million CNY (2013). According to
media sources as of Jul. 2014, APC is planned to be increased. No
word on progress since then.
�Sales revenue in fiscal 2013/2014: 249 million CNY. Employees: 366
persons.
Beijing Samlip
Automotive
Lighting Co., Ltd.
Beijing Jan. 2003
8.95
million
USD
Hella 24.5%,
Hainachuan
(Binzhou)
Automotive Parts
Technology
24.5%, SL
Corporation 50%
Headlamps, tail lamps, fog
lamps, stop lamps, etc.
�Investment: 22.38 million USD
�Supplies Beijing Hyundai.
Beijing
Hainachuan
Hella Automotive
Parts Co., Ltd.
Beijing Sep. 2014
256
million
CNY
Hella (China)
Investment 50%,
Hainachuan
(Binzhou)
Automotive Parts
Technology 50%
Automotive lighting systems
for the Chinese market
�Employees: 340 persons. Total assets: 256 million CNY. Signed letter
of intent on cooperation with Beijing Benz, Beijing Hyundai, Beiqi
Foton, etc.
�May 2014: Concluded a technical tie-up with BAIC Motor and
Beijing Hainachuan Automotive Parts.
–Hella cooperates in the planning and development of high-quality
lighting equipment for BAIC Group’s own brands.
–Hella also supplies headlamps, tail lamps and other lighting
equipment, as well as vacuum pumps, electronic sensors, smart key
systems and other electronic products to BAIC Group.
� Apart from the production of automobile lamps and
sales/export/import of idling-stop systems, it develops lighting
systems for the Chinese market.
�Oct. 2014: Set up Hainachuan (Sanhe) Automotive Lighting in Sanhe,
Hebei province. Registered capital: 255 million CNY. Employees:
145 persons.
Jiaxing Hella
Lighting Co., Ltd.
Jiaxing,
Zhejiang
Jul. 2012
270
million
CNY
Hella (China)
Investment 26%,
HSE 74%
Headlamps, tail lamps, fog
lamps, high-mount stop
lamps, daytime running
lights, halogen lamps, xenon
lamps, LED lamps
�Site/building area: 87,000/52,000m². Hella’s largest production base
in China. Has 10 production lines, but the number of lines are
planned to be increased to 50. Plans to increase workforce to 1,000
persons in fiscal 2015/2016. Aims to increase annual output to as
high as 3 billion CNY and raise annual supply of headlamps to 3
million units and tail lamps to 1.8 million units within five years.
�SOP in Dec. 2013. APC: 1.2 million sets of automobile lighting
equipment. Began supplying Shanghai VW, Shanghai GM, JLR and
Renault-Nissan among others in Apr. 2014.
�Plans to invest an additional 100 million EUR in 2015 to add LED
lamp production lines.
�After regular operation starts at the end of 2017, APC is aimed to
reach 5.5 million automobile lighting equipment.
Hella: Main Automotive Lamp Facilities in China (As of Jun. 2015)

���������� ��� ���� ��������
����� ����� !"����
FOURIN Asia Automotive Intelligence
Japan: Monthly HEV/PHEV/BEV Passenger Vehicle Sales Volume (Jan.–Mar. 2015)
Sales
March 2015: HEV/PHEV/BEV Passenger Vehicle Sales Volume Down 20.3 Percent to 110,000 Units
�Overall: Sales volume of HEV/PHEVs went down 20.5 percent compared to the same period of 2013 to 109,103 units, BEVs increased 1.0 percent to 1,380 units.
�Toyota/Lexus: HEV/PHEV sales volume decreased 18.1 percent to 78,851 units. Toyota brand dropped 17.6 percent to 75,088 units due to the year-on-year decline of
most models except the fully-remodeled Alphard, Vellfire and Esquire. Lexus brand decreased 26.2 percent to 3,763 units due to the drop of most models except the
NX300h and RC300h which have been seeing rising sales this year.
�Honda: HEV/PHEV sales volume decreased 18.6 percent to 26,702 units. Apart from the Vezel, which was recalled last year, and three newly-launched models, all other
models declined.
Japan: HEV/PHEV/BEV Passenger Vehicle Sales Volume by Brand and Model (Jan.–Mar.�2015)
Notes: Processed based on data independently acquired by FOURIN.�
(Unit: Vehicles)
Brand Model Jan Feb Mar
Period-on-
period
Apr May Jun Jul Aug Sep Oct Nov Dec YTD Total
Period-on-
period
Aqua 19,968 22,788 30,414 ▼2.4% 73,170 ▼6.2%
Corolla Hybrid 3,762 4,554 4,590 ▼34.3% 12,906 ▼29.8%
Prius incl. Prius α, Prius PHV 11,206 13,122 18,605 ▼34.2% 42,933 ▼40.3%
Of which Prius α 5,188 5,952 8,496 ▼31.0% 19,636 ▼39.3%
Of which Prius PHV 223 239 180 ▼16.7% 642 ▼37.2%
SAI 778 884 1,206 ▼59.3% 2,868 ▼65.1%
Camry 672 760 1,082 ▼8.0% 2,514 ▼9.1%
Crown Hybrid 2,555 2,633 3,975 ▼26.2% 9,163 ▼31.4%
Harrier Hybrid 1,819 1,645 2,320 ▼19.7% 5,784 ▼1.2%
Voxy Hybrid 2,508 2,452 2,630 ▼51.7% 7,590 31.8%
Noah Hybrid 1,931 2,423 3,224 ▼23.7% 7,578 69.5%
Estima Hybrid 405 401 523 ▼46.4% 1,329 ▼44.5%
Alphard Hybrid 100 830 1,561 57.0% 2,491 6.0%
Vellfire Hybrid 96 1,137 1,871 2.6-fold 3,104 74.0%
Esquire 3,066 2,981 3,087 - 9,134 -
Total 48,866 56,610 75,088 ▼17.6% 180,564 ▼16.1%
CT200h 435 489 817 ▼45.9% 1,741 ▼45.0%
HS250h 177 187 313 ▼46.7% 677 ▼47.4%
IS300h 442 421 680 ▼46.9% 1,543 ▼54.6%
GS300h 153 150 206 ▼51.0% 509 ▼53.9%
GS450h 73 68 100 ▼41.2% 241 ▼39.9%
LS600h 158 150 368 ▼8.9% 676 ▼21.8%
RX450h 106 109 124 ▼83.1% 339 ▼79.8%
NX300h 600 697 681 - 1,978 -
RC300h 216 230 474 - 920 -
Total 2,360 2,501 3,763 ▼26.2% 8,624 ▼27.5%
Toyota / Lexus Total 51,226 59,111 78,851 ▼18.1% 189,188 ▼16.7%
Fit Hybrid 6,778 6,305 8,182 ▼55.1% 21,265 ▼48.1%
Fit Shuttle Hybrid 198 305 460 ▼82.7% 963 ▼82.2%
Insight 9 10 4 ▼98.0% 23 ▼97.0%
Accord Hybrid 221 358 474 ▼51.9% 1,053 ▼71.2%
Of which Accord PHV 5 7 4 ▼60.0% 16 ▼73.3%
Vezel Hybrid 5,017 4,967 7,850 12.5% 17,834 26.5%
CR-Z 71 32 90 ▼71.2% 193 ▼70.2%
Freed Hybrid 1,241 1,635 2,584 ▼11.6% 5,460 ▼16.2%
Freed Spike Hybrid 432 - - ▼100.0% 432 ▼77.2%
Grace 3,667 3,010 4,155 - 10,832 -
Jade - 2,789 2,174 - 4,963 -
Legend - 202 729 - 931 -
Total 17,634 19,613 26,702 ▼18.6% 63,949 ▼13.5%
Fuga Hybrid 57 254 423 3.3-fold 734 115.2%
Cima 15 17 35 ▼63.5% 67 ▼65.1%
Skyline Hybrid 215 524 557 ▼82.0% 1,296 ▼72.0%
Total 287 795 1,015 ▼69.4% 2,097 ▼59.4%
Dignity 1 1 2 ▼50.0% 4 ▼50.0%
Outlander PHEV 830 603 796 8.2% 2,229 ▼39.2%
Total 831 604 798 7.8% 2,233 ▼39.2%
Mazda Axela 275 268 379 ▼73.0% 922 ▼74.5%
Subaru XV Hybrid 456 327 635 ▼67.7% 1,418 ▼73.0%
Altis 6 7 5 25.0% 18 38.5%
Mebius 17 24 30 ▼46.4% 71 ▼36.6%
Total 23 31 35 ▼41.7% 89 ▼28.8%
A6 hybrid - 1 - ▼100.0% 1 ▼97.6%
A8 hybrid - 1 - ▼100.0% 1 ▼75.0%
Q5 hybrid - 2 - ▼100.0% 2 ▼89.5%
Total - 4 - ▼100.0% 4 ▼93.8%
ActiveHybrid 3 7 42 30 ▼53.8% 79 ▼46.6%
ActiveHybrid 5 9 14 28 ▼24.3% 51 ▼33.8%
ActiveHybrid 7 8 3 12 ▼87.1% 23 ▼86.0%
i8 39 30 39 - 108 -
Total 63 89 109 ▼44.1% 261 ▼32.9%
E400 17 9 16 ▼73.8% 42 ▼59.6%
S400 Hybrid 174 197 480 14.8% 851 ▼8.4%
S550 Plug-in Hybrid 24 25 24 - 73 -
Total 215 231 520 8.6% 966 ▼6.5%
Cayenne S Hybrid - 1 - ▼100.0% 1 ▼95.5%
Cayenne SE Hybrid - 7 48 - 55 77.4%
Panamera S Hybrid 5 6 11 ▼64.5% 22 ▼58.5%
Total 5 14 59 37.2% 78 5.6-fold
VW Touareg Hybrid - - - ▼100.0% - -
Japan HEV/PHEV Passenger Vehicle Sales Total 71,015 81,087 109,103 ▼20.5% 261,205 ▼18.5%
Period-on-period ▼23.8% ▼9.9% ▼20.5% ▼18.5%
20.6% 19.6% 18.6%
(Unit: Vehicles)
Brand Model Jan Feb Mar
Period-on-
period
Apr May Jun Jul Aug Sep Oct Nov Dec YTD Total
Period-on-
period
Toyota eQ - - - - - -
Honda Fit EV 1 - - - 1 ▼90.9%
Nissan Leaf 999 1,612 1,231 2.5% 3,842 ▼11.6%
Mitsubishi i-MiEV 84 81 60 ▼53.8% 225 ▼46.8%
BMW i3 24 54 89 17.8-fold 167 2.5-fold
smart fortwo 9 6 N.A. - 15 ▼86.4%
Tesla Model S N.A. N.A. N.A. - - -
VW e-up! N.A. N.A. N.A. - - -
Japan HEV/PHEV Passenger Vehicle Sales Total 1,117 1,753 1,380 1.0% 4,250 ▼14.3%
Period-on-period ▼16.1% ▼22.4% 1.0% ▼14.3%
0.3% 0.4% 0.2%
HEV/PHEV Composition Ratio of Passenger Vehicle Market
HEV/PHEV Composition Ratio of Passenger Vehicle Market
�HEV/PHEV
�BEV
Porsche
Daihatsu
Audi
Mercedes-Benz
Toyota
Lexus
Honda
Nissan
Mitsubishi
BMW

���������� ��� ���� ��������
����� ����� !"����
FOURIN Asia Automotive Intelligence
Production/Sales
Japan: Monthly Vehicle Production/Sales Volume of Japanese Automakers (Jan.-Apr. 2015)
Japan: Vehicle Production of Japanese Automakers (Jan.-Apr. 2015)
Japan: Vehicle Sales of Japanese Automakers (Jan.-Apr. 2015)
Japan: Vehicle Production of Japanese Automakers by Type and Growth Rate (May 2013�Apr. 2015)
Japan: Vehicle Sales of Japanese Automakers by Type and Growth Rate (May 2013�Apr. 2015)
Note: * indicates corrected data.
�100%
�80%
�60%
�40%
�20%
0%
20%
40%
60%
80%
100%
0
100
200
300
400
500
600
700
800
900
1,000
May Jun Jul Aug Sep Oct Nov Dec Jan Feb Mar Apr May Jun Jul Aug Sep Oct Nov Dec Jan Feb Mar Apr
2013 2014 2015
(Year-on-year growth)(1,000 units)
Passenger vehicle Commercial vehicle Growth rate
�80%
�60%
�40%
�20%
0%
20%
40%
60%
80%
100%
120%
140%
160%
180%
0
100
200
300
400
500
600
700
800
900
1,000
1,100
1,200
1,300
May Jun Jul Aug Sep Oct Nov Dec Jan Feb Mar Apr May Jun Jul Aug Sep Oct Nov Dec Jan Feb Mar Apr
2014 2015
(Year-on-year growth)
Passenger vehicle Commercial vehicle Growth rate
Automaker Jan Feb Mar Apr May Jun Jul Aug Sep Oct Nov Dec YTD Total
Daihatsu Motor 74,089 73,793 76,895 52,951 277,728
Fuji Heavy Industries 56,229 58,593 64,682 53,358 232,862
Hino Motors 12,446 12,008 13,040 12,167 49,661
Honda Motor 60,132 57,197 62,840 51,944 232,113
Isuzu Motors 23,514 23,497 24,268 22,440 93,719
Mazda Motor 72,959 77,621 86,437 68,174 305,191
Mitsubishi Fuso Truck and Bus 7,489 8,499 10,285 8,648 34,921
Mitsubishi Motors 52,074 57,359 64,259 46,475 220,167
Nissan Motor 83,653 85,239 77,069 63,311 309,272
Suzuki Motor 81,861 86,304 102,556 84,635 355,356
Toyota Motor 251,814 275,839 294,514 247,247 1,069,414
UD Trucks 1,396 1,441 1,643 1,805 6,285
12 Total 777,656 817,390 878,488 713,155 3,186,689
(Unit: Vehicles)
Automaker Jan Feb Mar Apr May Jun Jul Aug Sep Oct Nov Dec YTD Total
Daihatsu Motor 51,079 63,130 *89,382 36,280 239,871
Fuji Heavy Industries 13,861 16,752 28,329 9,555 68,497
Hino Motors 4,038 4,844 9,242 3,065 21,189
Honda Motor 63,605 71,651 103,406 41,672 280,334
Isuzu Motors 4,967 6,622 10,829 3,720 26,138
Mazda Motor 22,757 24,806 34,496 15,745 97,804
Mitsubishi Fuso Truck and Bus 2,414 3,337 6,364 2,516 14,631
Mitsubishi Motors 8,878 10,490 16,324 4,213 39,905
Nissan Motor 56,865 64,720 84,816 32,968 239,369
Suzuki Motor 47,058 58,189 83,391 49,523 238,161
Toyota Motor 107,985 133,313 187,477 104,386 533,161
UD Trucks 674 922 1,506 664 3,766
12 Total 384,181 458,776 655,562 304,307 1,802,826
(Unit: Vehicles)
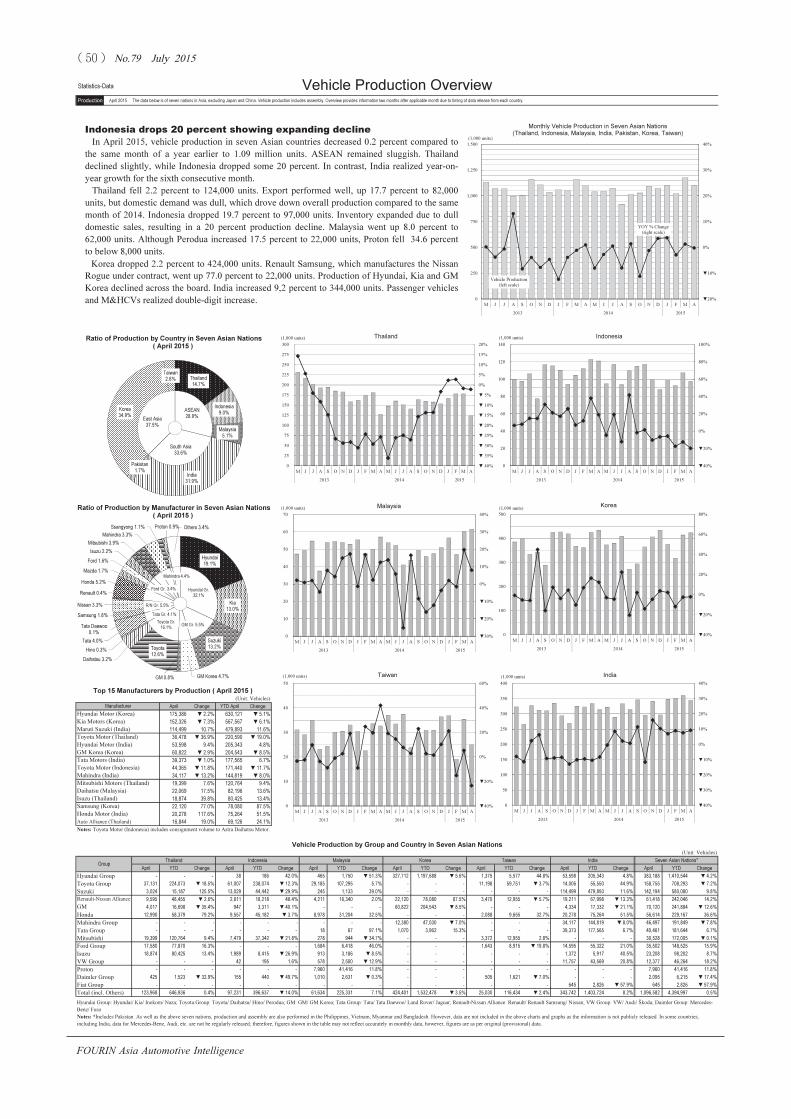
���������� ��� ���� ��������
����� ����� !"����
Production April 2015 The data below is of seven nations in Asia, excluding Japan and China. Vehicle production includes assembly. Overview provides information two months after applicable month due to timing of data release from each country.
(Unit: Vehicles)
April Change YTD April Change
Hyundai Motor (Korea) 175,386 ▼2.2% 630,121 ▼5.1%
Kia Motors (Korea) 152,326 ▼7.3% 567,567 ▼6.1%
Maruti Suzuki (India) 114,499 10.7% 479,893 11.6%
Toyota Motor (Thailand) 36,478 ▼36.9% 220,590 ▼19.0%
Hyundai Motor (India) 53,598 9.4% 205,343 4.8%
GM Korea (Korea) 60,822 ▼2.9% 204,543 ▼8.5%
Tata Motors (India) 39,373 ▼1.0% 177,565 6.7%
Toyota Motor (Indonesia) 44,365 ▼11.8% 171,440 ▼11.7%
Mahindra (India) 34,117 ▼13.2% 144,819 ▼8.0%
Mitsubishi Motors (Thailand) 19,399 7.6% 120,764 9.4%
Daihatsu (Malaysia) 22,069 17.5% 82,196 13.6%
Isuzu (Thailand) 18,874 39.8% 80,425 13.4%
Samsung (Korea) 22,120 77.0% 78,080 87.5%
Honda Motor (India) 20,278 117.6% 75,264 51.5%
Auto Alliance (Thailand) 16,844 19.0% 69,126 24.1%
Notes: Toyota Motor (Indonesia) includes consignment volume to Astra Daihatsu Motor.
(Unit: Vehicles)
Thailand Indonesia Malaysia Korea Taiwan India Seven Asian Nations*
April YTD Change April YTD Change April YTD Change April YTD Change April YTD Change April YTD Change April YTD Change
Hyundai Group - - - 38 186 42.0% 465 1,750 ▼51.3% 327,712 1,197,688 ▼5.6% 1,375 5,577 44.8% 53,598 205,343 4.8% 383,188 1,410,544 ▼4.2%
Toyota Group 37,131 224,073 ▼18.5% 61,007 238,074 ▼12.3% 29,185 107,295 5.7% - - - 11,198 59,751 ▼3.7% 14,006 55,550 44.9% 158,755 708,293 ▼7.2%
Suzuki 3,024 15,187 125.5% 13,029 44,442 ▼29.9% 245 1,133 39.0% - - - - - - 114,499 479,893 11.6% 142,194 580,080 9.8%
9,595 48,455 ▼2.6% 2,811 18,218 48.4% 4,211 16,340 2.0% 22,120 78,080 87.5% 3,470 12,955 ▼5.7% 19,211 67,998 ▼13.3% 61,418 242,046 14.2%
4,017 16,698 ▼35.4% 947 3,311 ▼40.1% - - - 60,822 204,543 ▼8.5% - - - 4,334 17,332 ▼21.1% 70,120 241,884 ▼12.6%
Honda 12,990 58,379 79.2% 9,557 45,182 ▼3.7% 8,978 31,204 32.5% - - - 2,088 9,655 32.7% 20,278 75,264 51.5% 56,614 229,167 36.6%
Mahindra Group - - - - - - - - - 12,380 47,030 ▼7.0% - - - 34,117 144,819 ▼8.0% 46,497 191,849 ▼7.8%
Tata Group - - - - - - 18 67 97.1% 1,070 3,962 15.3% - - - 39,373 177,565 6.7% 40,461 181,644 6.7%
Mitsubishi 19,399 120,764 9.4% 7,479 37,342 ▼21.8% 278 944 ▼34.7% - - - 3,372 12,955 2.8% - - - 30,528 172,005 ▼0.1%
Ford Group 17,580 77,870 16.3% - - - 1,684 6,418 46.0% - - - 1,643 8,915 ▼19.8% 14,595 55,322 21.0% 35,502 148,525 15.9%
Isuzu 18,874 80,425 13.4% 1,989 8,415 ▼26.9% 913 3,186 ▼8.5% - - - - - - 1,372 5,917 40.5% 23,208 98,202 8.7%
VW Group - - - 42 195 1.6% 578 2,500 ▼12.9% - - - - - - 11,757 43,569 20.8% 12,377 46,264 18.2%
Proton - - - - - - 7,960 41,416 11.8% - - - - - - - - - 7,960 41,416 11.8%
Daimler Group 425 1,523 ▼32.9% 155 440 ▼49.7% 1,010 2,631 ▼0.3% - - - 505 1,621 ▼7.0% - - - 2,095 6,215 ▼17.4%
Fiat Group - - - - - - - - - - - - - - - 645 2,826 ▼57.9% 645 2,826 ▼57.9%
Total (incl. Others) 123,968 646,936 0.4% 97,231 396,637 ▼14.0% 61,634 225,331 7.1% 424,401 1,532,478 ▼3.5% 25,030 116,434 ▼2.4% 343,742 1,403,724 8.2% 1,096,582 4,394,997 0.5%
Vehicle Production Overview
Ratio of Production by Country in Seven Asian Nations
( April 2015 )
Group
GM
Hyundai Group: Hyundai/ Kia/ Inokom/ Naza; Toyota Group: Toyota/ Daihatsu/ Hino/ Perodua; GM: GM/ GM Korea; Tata Group: Tata/ Tata Daewoo/ Land Rover/ Jaguar; Renault-Nissan Alliance: Renault/ Renault Samsung/ Nissan; VW Group: VW/ Audi/ Škoda; Daimler Group: Mercedes-
Benz/ Fuso
Notes: *Includes Pakistan. As well as the above seven nations, production and assembly are also performed in the Philippines, Vietnam, Myanmar and Bangladesh. However, data are not included in the above charts and graphs as the information is not publicly released. In some countries,
including India, data for Mercedes-Benz, Audi, etc. are not be regularly released; therefore, figures shown in the table may not reflect accurately in monthly data, however, figures are as per original (provisional) data.
Ratio of Production by Manufacturer in Seven Asian Nations
( April 2015 )
Top 15 Manufacturers by Production ( April 2015 )
Manufacturer
Vehicle Production by Group and Country in Seven Asian Nations
Renault-Nissan Alliance
▼40%
▼20%
0%
20%
40%
60%
0
10
20
30
40
50
M J J A S O N D J F M A M J J A S O N D J F M A
2013 2014 2015
(1,000 units) Taiwan
Vehicle Production
(left scale)
YOY % Change
(right scale)
▼20%
▼10%
0%
10%
20%
30%
40%
0
250
500
750
1,000
1,250
1,500
M J J A S O N D J F M A M J J A S O N D J F M A
2013 2014 2015
(1,000 units)
Monthly Vehicle Production in Seven Asian Nations
(Thailand, Indonesia, Malaysia, India, Pakistan, Korea, Taiwan)
▼ 40%
▼ 35%
▼ 30%
▼ 25%
▼ 20%
▼ 15%
▼ 10%
▼ 5%
0%
5%
10%
15%
20%
0
25
50
75
100
125
150
175
200
225
250
275
300
M J J A S O N D J F M A M J J A S O N D J F M A
2013 2014 2015
(1,000 units)Thailand
ASEAN
28.9%
South Asia
33.6%
East Asia
37.5%
Thailand
14.7%
Indonesia
9.0%
Malaysia
5.1%
India
31.9%
Pakistan
1.7%
Korea
34.9%
Taiwan
2.6%
▼30%
▼20%
▼10%
0%
10%
20%
30%
40%
0
10
20
30
40
50
60
70
M J J A S O N D J F M A M J J A S O N D J F M A
2013 2014 2015
(1,000 units)Malaysia
▼40%
▼30%
▼20%
▼10%
0%
10%
20%
30%
40%
0
50
100
150
200
250
300
350
400
M J J A S O N D J F M A M J J A S O N D J F M A
2013 2014 2015
(1,000 units)India
▼40%
▼20%
0%
20%
40%
60%
80%
100%
0
20
40
60
80
100
120
140
M J J A S O N D J F M A M J J A S O N D J F M A
2013 2014 2015
(1,000 units) Indonesia
▼40%
▼20%
0%
20%
40%
60%
80%
0
100
200
300
400
500
M J J A S O N D J F M A M J J A S O N D J F M A
2013 2014 2015
(1,000 units)Korea
Statistics-Data
Indonesia drops 20 percent showing expanding decline
In April 2015, vehicle production in seven Asian countries decreased 0.2 percent compared to
the same month of a year earlier to 1.09 million units. ASEAN remained sluggish. Thailand
declined slightly, while Indonesia dropped some 20 percent. In contrast, India realized year-on-
year growth for the sixth consecutive month.
Thailand fell 2.2 percent to 124,000 units. Export performed well, up 17.7 percent to 82,000
units, but domestic demand was dull, which drove down overall production compared to the same
month of 2014. Indonesia dropped 19.7 percent to 97,000 units. Inventory expanded due to dull
domestic sales, resulting in a 20 percent production decline. Malaysia went up 8.0 percent to
62,000 units. Although Perodua increased 17.5 percent to 22,000 units, Proton fell 34.6 percent
to below 8,000 units.
Korea dropped 2.2 percent to 424,000 units. Renault Samsung, which manufactures the Nissan
Rogue under contract, went up 77.0 percent to 22,000 units. Production of Hyundai, Kia and GM
Korea declined across the board. India increased 9,2 percent to 344,000 units. Passenger vehicles
and M&HCVs realized double-digit increase.
Hyundai Gr.
32.1%
GM Gr. 5.5%
Toyota Gr.
16.1%
Tata Gr. 4.1%
R/N Gr. 5.5%
Ford Gr. 3.4%
Mahindra 4.4%
Hyundai
19.1%
Kia
13.0%
Suzuki
13.2%
GM Korea 4.7%GM 0.8%
Toyota
12.6%
Daihatsu 3.2%
Hino 0.3%
Tata 4.0%
Tata Daewoo
0.1%
Samsung 1.8%
Nissan 3.3%
Renault 0.4%
Honda 5.2%
Mazda 1.7%
Ford 1.6%
Isuzu 2.2%
Mitsubishi 3.9%
Mahindra 3.3%
Ssangyong 1.1% Proton 0.9% Others 3.4%

���������� ��� ���� ��������
����� ����� !"����
Data printed here are based on preliminary figures. Some totals or year-to-date figures may reflect corrections of past data. April 2015 Sales
(Unit: Vehicles)
April Change YTD April Change
Suzuki (incl. Maruti Suzuki) 122,688 17.8% 514,801 8.3%
Toyota/Lexus 94,217 ▼14.3% 399,397 ▼8.8%
Hyundai 103,772 0.1% 377,201 1.1%
Honda 45,590 6.6% 220,576 19.9%
Kia 46,830 7.4% 171,594 5.3%
Tata 32,597 ▼8.8% 159,218 3.2%
Daihatsu (incl. Perodua) 32,547 ▼2.5% 135,360 4.7%
Mahindra 30,420 ▼0.5% 129,173 ▼8.6%
Nissan/Infiniti 18,726 ▼11.8% 92,209 ▼2.1%
Isuzu 17,261 ▼9.3% 71,173 ▼9.2%
Mitsubishi 18,137 ▼16.2% 69,960 ▼21.4%
Ford 14,324 ▼11.2% 65,803 2.6%
GM Korea 12,707 ▼3.5% 47,016 ▼1.2%
VW 8,272 1.7% 34,931 7.5%
Proton 4,993 ▼50.8% 32,774 ▼23.9%
(Unit: Vehicles)
April YTD Change April YTD Change April YTD Change April YTD Change April YTD Change April YTD Change April YTD Change
Toyota Group 13,997 85,783 ▼25.0% 46,318 183,463 ▼20.7% 24,191 99,545 1.9% 1,220 4,859 31.9% 11,346 46,027 6.1% 12,325 50,110 36.2% 130,447 551,633 ▼5.9%
Hyundai Group 454 1,459 9.3% 424 1,774 ▼57.5% 313 2,430 ▼45.3% 106,100 375,849 0.6% 1,224 5,542 13.1% 38,601 150,211 9.1% 150,602 548,795 2.4%
Suzuki 1,808 6,920 ▼9.2% 8,019 43,106 ▼23.1% 207 1,320 ▼33.7% - - - 456 2,012 19.0% 100,709 417,879 10.6% 122,688 514,801 8.3%
Honda 8,603 39,031 32.1% 10,583 55,071 12.2% 6,562 28,707 27.3% 322 1,624 31.2% 2,099 9,035 33.9% 12,636 70,565 18.2% 45,590 220,576 19.9%
Tata Group 117 471 ▼35.7% 134 447 480.5% 33 334 2.5% 1,124 5,211 23.9% 47 207 ▼1.0% 32,359 158,338 3.2% 33,871 165,439 3.7%
4,109 18,971 ▼14.3% 3,032 20,799 43.8% 3,026 16,340 8.8% 7,731 26,675 14.3% 3,135 14,558 ▼11.8% 8,260 32,096 ▼10.3% 29,806 131,852 0.3%
Ford Group 5,439 20,148 ▼18.5% 1,116 4,751 ▼13.7% 1,078 9,061 20.2% 1,044 3,564 22.6% 3,556 14,337 5.4% 4,931 22,790 ▼7.7% 22,301 97,350 6.6%
GM 1,516 5,715 ▼43.5% 230 1,806 ▼65.8% 81 378 ▼43.2% 12,740 47,109 ▼0.8% 29 116 ▼44.5% 3,423 15,462 ▼26.3% 18,584 72,741 ▼15.9%
Isuzu 11,672 47,577 ▼15.2% 1,458 7,506 ▼26.5% 762 3,671 10.1% - - - 190 641 43.4% 938 4,791 49.9% 17,261 71,173 ▼9.2%
Mitsubishi 3,682 16,549 ▼25.2% 6,440 27,246 ▼13.4% 311 3,920 ▼21.9% - - - 3,115 13,120 ▼2.2% - - - 18,137 69,960 ▼21.4%
VW Group 44 161 ▼9.0% 17 71 ▼26.8% 784 2,667 ▼38.4% 3,664 22,855 23.3% 1,752 6,925 15.0% 4,792 20,826 6.2% 11,520 55,223 10.6%
Daimler Group 1,156 3,941 33.9% 3,460 16,132 ▼33.2% 1,127 3,695 24.3% 4,136 15,197 35.0% 2,595 8,902 4.0% - - - 13,475 51,664 ▼2.9%
Proton 19 86 ▼52.0% - - - 4,972 32,654 ▼23.8% - - - 5 39 ▼44.3% - - - 4,996 32,779 ▼23.9%
BMW Group 770 2,744 ▼5.6% 130 761 ▼14.8% 534 2,036 ▼21.2% 4,530 16,037 6.7% 2,107 7,238 45.8% - - - 8,448 29,847 7.3%
Fiat Group - 10 42.9% - - - - - - 585 2,311 26.1% 67 250 115.5% 640 2,844 ▼43.3% 1,340 5,576 ▼22.3%
Total (incl. Others) 54,058 251,845 ▼15.3% 81,600 363,942 ▼16.4% 45,187 213,493 ▼2.4% 152,833 556,365 5.0% 34,665 141,475 5.9% 263,821 1,140,794 6.1% 694,706 2,905,005 1.7%
( April 2015 )
Vehicle Sales Overview
Ratio of Sales by Region and Country in Ten Asian Nations
( April 2015 )
Ratio of Sales by Brand in Ten Asian Nations
Ten Asian Nations
Renault-Nissan Alliance
Hyundai Group: Hyundai/ Kia; Toyota Group: Toyota/ Lexus/Daihatsu/ Hino/Peroduaa; Tata Group: Tata/ Tata Daewoo/ Land Rover/ Jaguar; Renault-Nissan Alliance: Renault/ Samsung/ Nissan/ Inifiniti; GM: GM/Cadillac/ GM Korea (formerly GM Daewoo);Daimler Group: Mercedes-Benz/
Smart/ Fuso; VW Group: VW/ Audi/ Škoda. *Includes other Ford brands, such as Aston Martin and Lincoln.
Notes: Ten Asian Nations cover Thailand, Malaysia, Indonesia, the Philippines, Singapore, Vietnam, Korea, Taiwan, India and Pakistan. From Jan. 2012, Hyundai volume excludes that of Inokom. In some countries, including India, figures for Mercedes-Benz, Audi, etc. are not regularly released;
therefore, may not reflect accurately in monthly data, however, figures are as per original (provisional) data.
Top 15 Selling Brands in Ten Asian Nations ( April 2015 )
Brand
Vehicle Sales by Group and Major Country in Ten Asian Nations
Group
Thailand Indonesia Malaysia Korea Taiwan India
ASEAN
34.1%
South Asia
41.9%
East Asia
24.0%
Thailand
8.7%
Indonesia
12.5%
Malaysia
7.3%
Philippines
2.9%
Singapore
0.6%
Vietnam
2.0%India
39.3%
Pakistan
2.7%
Korea
19.2%
Taiwan
4.9%
Hyundai Gr.
18.9%
Toyota Gr.
19.0%
Tata Gr. 5.7%
R/N Gr. 4.5%
GM Gr.2.5%
Ford Gr. 3.3%
Mahindra Gr. 5.5%
Hyundai
13.0%
Kia
5.9%
Suzuki
17.7%
Toyota
13.7%
Daihatsu
4.7%
Hino 0.6%
Tata
5.5%Tata Daewoo
0.1%
Land Rover 0.1%
Honda
7.6%
Nissan 3.2%
Samsung 0.8%
Renault 0.5%
GM 0.9%
Daewoo 1.6%
Ford 2.3%
Mazda 1.1%
Mahindra 4.4%
Ssangyong 1.0%
Mitsubishi 2.4%
Isuzu 2.5%
Proton 1.1%
Others
9.3%
▼50%
▼25%
0%
25%
50%
75%
0
10
20
30
40
50
M J J A S O N D J F M A M J J A S O N D J F M A
2013 2014 2015
(1,000 units)Taiwan
Vehicle Sales
(left scale)
YOY % Change
(right scale)
▼20%
▼10%
0%
10%
20%
30%
0
200
400
600
800
1,000
M J J A S O N D J F M A M J J A S O N D J F M A
2013 2014 2015
(1,000 units)
Monthly Vehicle Sales in Ten Asian Nations
▼30%
▼20%
▼10%
0%
10%
20%
30%
40%
0
10
20
30
40
50
60
70
M J J A S O N D J F M A M J J A S O N D J F M A
2013 2014 2015
(1,000 units)Malaysia
▼40%
▼30%
▼20%
▼10%
0%
10%
20%
30%
40%
0
50
100
150
200
250
300
350
400
M J J A S O N D J F M A M J J A S O N D J F M A
2013 2014 2015
(1,000 units) India
▼50%
▼25%
0%
25%
50%
75%
0
25
50
75
100
125
M J J A S O N D J F M A M J J A S O N D J F M A
2013 2014 2015
(1,000 units) Indonesia
▼75%
▼50%
▼25%
0%
25%
50%
0
25
50
75
100
125
M J J A S O N D J F M A M J J A S O N D J F M A
2013 2014 2015
(1,000 units)Thailand
▼20%
▼10%
0%
10%
20%
30%
40%
50%
0
25
50
75
100
125
150
175
M J J A S O N D J F M A M J J A S O N D J F M A
2013 2014 2015
(1,000 units)Korea
Statistics-Data
Indonesia, Thailand are sluggish more than ever before, India excels
In April 2015, vehicle sales in 10 Asian countries decreased 0.9 percent compared to the same
month of a year earlier to 695,000 units. Indonesia and Thailand are sluggish more than ever
before, while Malaysia, which has been performing relatively well, dropped double digits.
Thailand dropped 26.2 percent to 54,000 units. Amid delayed economic recovery, purchase
intention remains dull resulting in negative growth for the 24th consecutive month. In Indonesia,
against the backdrop of higher interest rates, some automakers increased prices, becoming one of
the reasons for Indonesia to drop 23.6 percent to 82,000 units. Malaysia also fell double digits,
down 23.1 percent to 45,000 units. The introduction of new consumption tax in April reduced
overall family budgets, cooling down purchase interest.
Korea went up 3.4 percent to 153,000 units. SUVs performed well, up 33.9 percent to 39,000
units. In contrast, Hyundai, whose Avante and other core products are reaching the end of their
model cycle, decreased 4.3 percent to 63,000 units.
India went up 11. 4 percent to 264,000 units, posting high growth for the first time since October
2012. Consumption, especially in cities, is experiencing full-scale recovery.
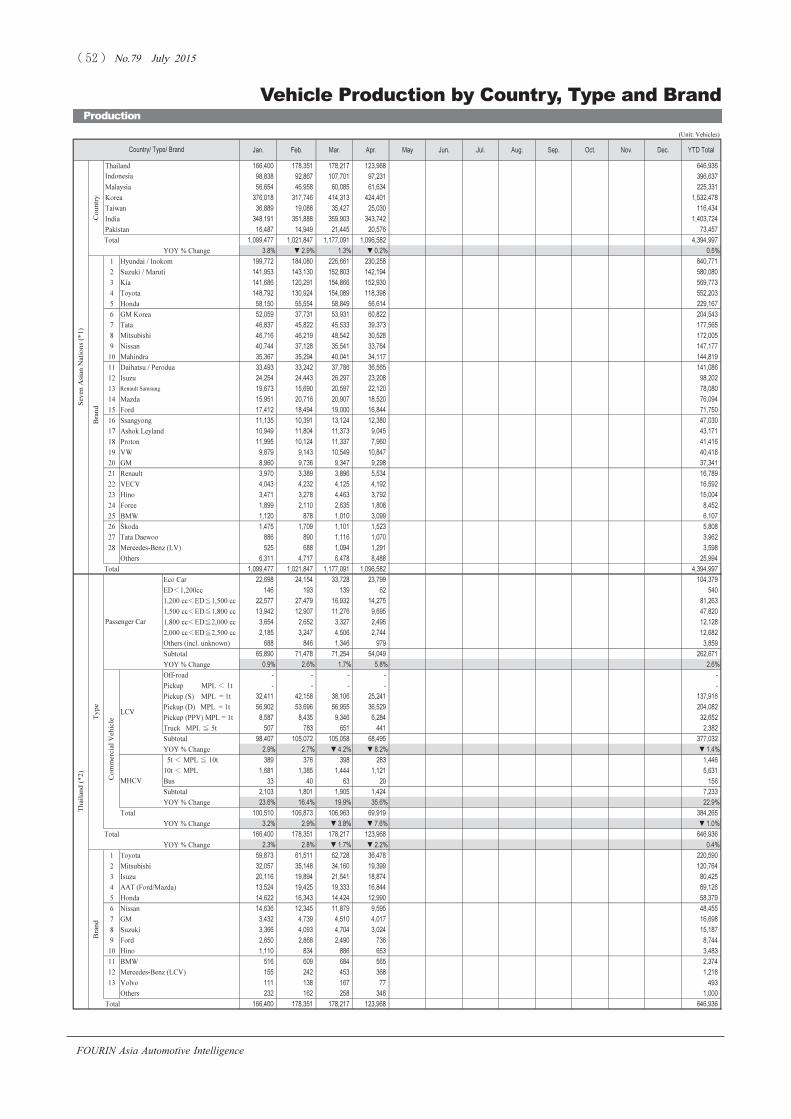
���������� ��� ���� ��������
����� ����� !"����
FOURIN Asia Automotive Intelligence
Vehicle Production by Country, Type and Brand
Production
(Unit: Vehicles)
Jan. Feb. Mar. Apr. May Jun. Jul. Aug. Sep. Oct. Nov. Dec. YTD Total
Thailand 166,400 178,351 178,217 123,968 646,936
98,838 92,867 107,701 97,231 396,637
Malaysia 56,654 46,958 60,085 61,634 225,331
Korea 376,018 317,746 414,313 424,401 1,532,478
Taiwan 36,889 19,088 35,427 25,030 116,434
India 348,191 351,888 359,903 343,742 1,403,724
Pakistan 16,487 14,949 21,445 20,576 73,457
Total 1,099,477 1,021,847 1,177,091 1,096,582 4,394,997
YOY % Change 3.8% ▼2.9% 1.3% ▼0.2% 0.5%
1 Hyundai / Inokom 199,772 184,080 226,661 230,258 840,771
2 Suzuki / Maruti 141,953 143,130 152,803 142,194 580,080
3 Kia 141,686 120,291 154,866 152,930 569,773
4 Toyota 148,792 130,924 154,089 118,398 552,203
5 Honda 58,150 55,554 58,849 56,614 229,167
6 GM Korea 52,059 37,731 53,931 60,822 204,543
7 Tata 46,837 45,822 45,533 39,373 177,565
8 Mitsubishi 46,716 46,219 48,542 30,528 172,005
9 Nissan 40,744 37,128 35,541 33,764 147,177
10 Mahindra 35,367 35,294 40,041 34,117 144,819
11 Daihatsu / Perodua 33,493 33,242 37,786 36,565 141,086
12 Isuzu 24,254 24,443 26,297 23,208 98,202
13 Renault Samsung 19,673 15,690 20,597 22,120 78,080
14 Mazda 15,951 20,716 20,907 18,520 76,094
15 Ford 17,412 18,494 19,000 16,844 71,750
16 Ssangyong 11,135 10,391 13,124 12,380 47,030
17 Ashok Leyland 10,949 11,804 11,373 9,045 43,171
18 Proton 11,995 10,124 11,337 7,960 41,416
19 VW 9,879 9,143 10,549 10,847 40,418
20 GM 8,960 9,736 9,347 9,298 37,341
21 Renault 3,970 3,389 3,896 5,534 16,789
22 VECV 4,043 4,232 4,125 4,192 16,592
23 Hino 3,471 3,278 4,463 3,792 15,004
24 Force 1,899 2,110 2,635 1,808 8,452
25 BMW 1,120 878 1,010 3,099 6,107
26 Škoda 1,475 1,709 1,101 1,523 5,808
27 Tata Daewoo 886 890 1,116 1,070 3,962
28 Mercedes-Benz (LV) 525 688 1,094 1,291 3,598
Others 6,311 4,717 6,478 8,488 25,994
Total 1,099,477 1,021,847 1,177,091 1,096,582 4,394,997
Eco Car 22,698 24,154 33,728 23,799 104,379
ED�1,200cc 146 193 139 62 540
1,200 cc�ED�1,500 cc 22,577 27,479 16,932 14,275 81,263
1,500 cc�ED�1,800 cc 13,942 12,907 11,276 9,695 47,820
1,800 cc�ED�2,000 cc 3,654 2,652 3,327 2,495 12,128
2,000 cc�ED�2,500 cc 2,185 3,247 4,506 2,744 12,682
Others (incl. unknown) 688 846 1,346 979 3,859
Subtotal 65,890 71,478 71,254 54,049 262,671
YOY % Change 0.9% 2.6% 1.7% 5.8% 2.6%
Off-road - - - - -
Pickup MPL � 1t - - - - -
Pickup (S) MPL = 1t 32,411 42,158 38,106 25,241 137,916
Pickup (D) MPL = 1t 56,902 53,696 56,955 36,529 204,082
Pickup (PPV) MPL = 1t 8,587 8,435 9,346 6,284 32,652
Truck MPL � 5t 507 783 651 441 2,382
Subtotal 98,407 105,072 105,058 68,495 377,032
YOY % Change 2.9% 2.7% ▼4.2% ▼8.2% ▼1.4%
5t � MPL � 10t 389 376 398 283 1,446
10t � MPL 1,681 1,385 1,444 1,121 5,631
Bus 33 40 63 20 156
Subtotal 2,103 1,801 1,905 1,424 7,233
YOY % Change 23.6% 16.4% 19.9% 35.6% 22.9%
Total 100,510 106,873 106,963 69,919 384,265
YOY % Change 3.2% 2.9% ▼3.8% ▼7.6% ▼1.0%
Total 166,400 178,351 178,217 123,968 646,936
YOY % Change 2.3% 2.8% ▼1.7% ▼2.2% 0.4%
1 Toyota 59,873 61,511 62,728 36,478 220,590
2 Mitsubishi 32,057 35,148 34,160 19,399 120,764
3 Isuzu 20,116 19,894 21,541 18,874 80,425
4 AAT (Ford/Mazda) 13,524 19,425 19,333 16,844 69,126
5 Honda 14,622 16,343 14,424 12,990 58,379
6 Nissan 14,636 12,345 11,879 9,595 48,455
7 GM 3,432 4,739 4,510 4,017 16,698
8 Suzuki 3,366 4,093 4,704 3,024 15,187
9 Ford 2,650 2,868 2,490 736 8,744
10 Hino 1,110 834 886 653 3,483
11 BMW 516 609 684 565 2,374
12 Mercedes-Benz (LCV) 155 242 453 368 1,218
13 Volvo 111 138 167 77 493
Others 232 162 258 348 1,000
Total 166,400 178,351 178,217 123,968 646,936
Th
ailan
d (*
2)
Ty
pe
Bran
d
LCV
Co
untry
Passenger Car
Country/ Type/ Brand
MHCV
Co
mm
ercial V
eh
icle
Indonesia
Bran
d
Sev
en A
sian
N
atio
ns (*
1)

���������� ��� ���� ��������
����� ����� !"����
FOURIN Asia Automotive Intelligence
Production
in Seven Asian Nations (January-April 2015)
(Unit: Vehicles)
Jan. Feb. Mar. Apr. May Jun. Jul. Aug. Sep. Oct. Nov. Dec. YTD Total
Sedan 4,231 3,849 3,931 3,254 15,265
YOY % Change 177.4% 57.5% 31.1% 84.6% 74.8%
Non-sedan 66,265 63,209 75,006 72,003 276,483
Pickup 18,790 17,487 19,051 14,182 69,510
Light Truck 8,222 6,874 7,942 6,391 29,429
Total 93,277 87,570 101,999 92,576 375,422
YOY % Change ▼8.8% ▼20.3% ▼15.3% ▼21.9% ▼16.8%
Truck 1,318 1,292 1,639 1,189 5,438
Bus 12 156 132 212 512
Total 1,330 1,448 1,771 1,401 5,950
YOY % Change ▼45.2% ▼44.8% ▼32.7% ▼44.9% ▼41.8%
98,838 92,867 107,701 97,231 396,637
YOY % Change ▼5.6% ▼17.5% ▼12.4% ▼19.7% ▼14.0%
1 Toyota 42,493 39,068 45,514 44,365 171,440
2 Daihatsu 14,342 14,139 15,913 14,496 58,890
3 Honda 12,794 10,986 11,845 9,557 45,182
4 Suzuki 9,506 9,631 12,276 13,029 44,442
5 Mitsubishi 10,838 8,817 10,208 7,479 37,342
6 Nissan 4,518 5,005 5,884 2,811 18,218
7 Isuzu 1,928 2,254 2,244 1,989 8,415
8 Hino 1,445 1,760 2,393 2,146 7,744
9 GM 559 834 971 947 3,311
Others 415 373 453 412 1,653
Total 98,838 92,867 107,701 97,231 396,637
Passenger Car 41,004 34,312 43,634 45,188 164,138
4WD / SUV 4,631 4,025 4,258 5,174 18,088
Van 398 217 546 597 1,758
MPV 6,354 5,469 6,745 5,786 24,354
Total 52,387 44,023 55,183 56,745 208,338
YOY % Change 3.0% 2.2% 17.9% 6.7% 7.4%
Light Truck (GVW�5t) 722 648 826 1,181 3,377
Md/hv Truck (5t<GVW) 171 160 294 228 853
Semi-tractor 129 108 80 75 392
Bus 47 39 50 16 152
Panel Van 269 194 240 194 897
Pickup 2,929 1,786 3,412 3,195 11,322
Total 4,267 2,935 4,902 4,889 16,993
YOY % Change ▼7.8% ▼36.0% 45.6% 25.0% 3.0%
Total 56,654 46,958 60,085 61,634 225,331
YOY % Change 2.1% ▼1.5% 19.8% 8.0% 7.1%
1 Daihatsu / Perodua 19,151 19,103 21,873 22,069 82,196
2 Proton 11,995 10,124 11,337 7,960 41,416
3 Honda 7,769 6,036 8,421 8,978 31,204
4 Toyota 6,912 3,009 7,050 6,734 23,705
5 Nissan 4,070 3,511 4,496 4,106 16,183
6 Mazda 1,841 1,039 1,311 1,542 5,733
7 Isuzu 766 744 763 913 3,186
8 BMW 341 75 93 2,275 2,784
9 VW 534 562 826 578 2,500
10 Mercedes-Benz (LV) 319 380 561 781 2,041
11 Kia 317 472 468 406 1,663
Others 2,639 1,903 2,886 5,292 12,720
Total 56,654 46,958 60,085 61,634 225,331
Passenger Car 194,061 171,266 219,221 224,682 809,230
SUV 131,672 103,419 139,938 145,096 520,125
CDV (Van) 15,801 13,565 16,494 17,144 63,004
Total 341,534 288,250 375,653 386,922 1,392,359
YOY % Change 1.6% ▼12.7% ▼3.2% ▼2.5% ▼4.1%
Truck 22,116 19,950 24,850 23,270 90,186
Bus 10,714 8,619 11,872 12,285 43,490
SPV 1,654 927 1,938 1,924 6,443
Total 34,484 29,496 38,660 37,479 140,119
YOY % Change 7.4% ▼5.1% 3.7% 1.1% 1.9%
Total 376,018 317,746 414,313 424,401 1,532,478
YOY % Change 2.1% ▼12.0% ▼2.6% ▼2.2% ▼3.5%
1 Hyundai 150,825 132,949 170,961 175,386 630,121
2 Kia 141,267 119,745 154,229 152,326 567,567
3 GM Korea 52,059 37,731 53,931 60,822 204,543
4 Renault Samsung 19,673 15,690 20,597 22,120 78,080
5 Ssangyong 11,135 10,391 13,124 12,380 47,030
6 Tata Daewoo 886 890 1,116 1,070 3,962
Others 173 350 355 297 1,175
Total 376,018 317,746 414,313 424,401 1,532,478
Bran
d
Malay
sia (*
3)
Passenger Vehicle
Ty
pe
Commercial
Vehicle
Ko
rea
Ty
pe
Passenger Vehicle
Commercial
Vehicle
Bran
d
Country/ Type/ Brand
Bran
d
LV
MHCV
Total
Typ
e
Passenger Car
In
do
nesia
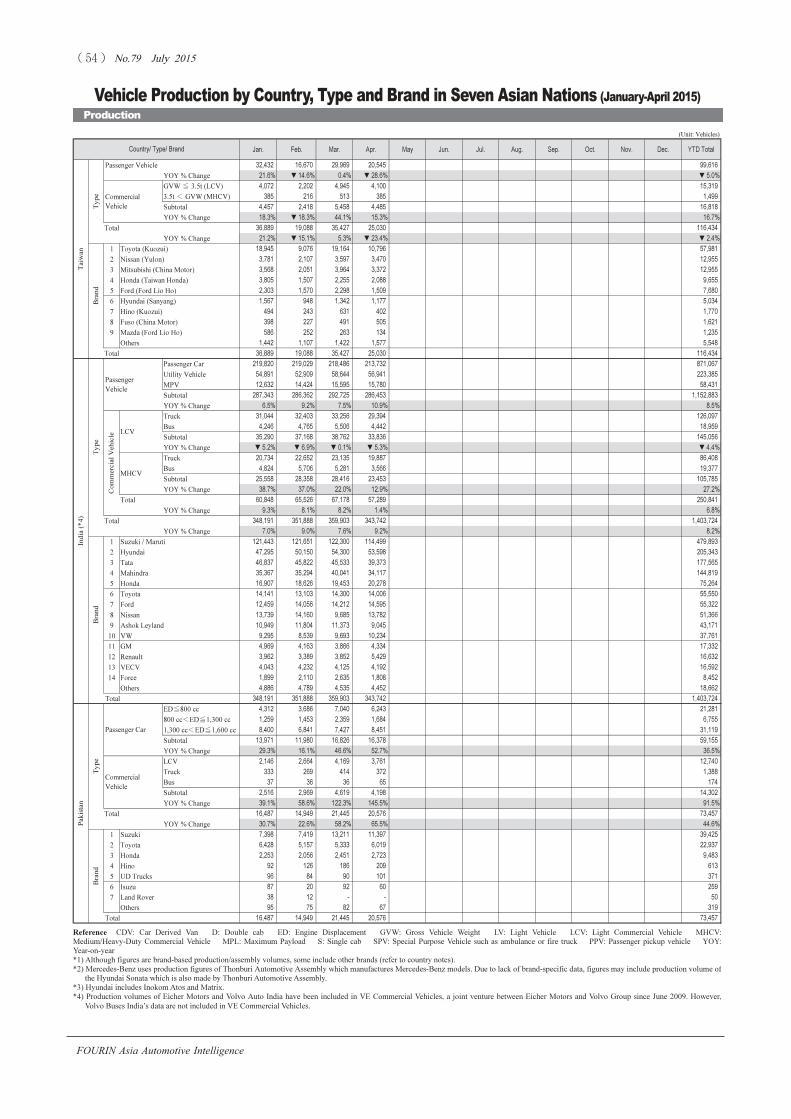
���������� ��� ���� ��������
����� ����� !"����
FOURIN Asia Automotive Intelligence
Vehicle Production by Country, Type and Brand in Seven Asian Nations (January-April 2015)
Production
Reference CDV: Car Derived Van D: Double cab ED: Engine Displacement GVW: Gross Vehicle Weight LV: Light Vehicle LCV: Light Commercial Vehicle MHCV:
Medium/Heavy-Duty Commercial Vehicle MPL: Maximum Payload S: Single cab SPV: Special Purpose Vehicle such as ambulance or fire truck PPV: Passenger pickup vehicle YOY:
Year-on-year
*1) Although figures are brand-based production/assembly volumes, some include other brands (refer to country notes).
*2) Mercedes-Benz uses production figures of Thonburi Automotive Assembly which manufactures Mercedes-Benz models. Due to lack of brand-specific data, figures may include production volume of
the Hyundai Sonata which is also made by Thonburi Automotive Assembly.
*3) Hyundai includes Inokom Atos and Matrix.
*4) Production volumes of Eicher Motors and Volvo Auto India have been included in VE Commercial Vehicles, a joint venture between Eicher Motors and Volvo Group since June 2009. However,
Volvo Buses India’s data are not included in VE Commercial Vehicles.
(Unit: Vehicles)
Jan. Feb. Mar. Apr. May Jun. Jul. Aug. Sep. Oct. Nov. Dec. YTD Total
Passenger Vehicle 32,432 16,670 29,969 20,545 99,616
YOY % Change 21.6% ▼14.6% 0.4% ▼28.6% ▼5.0%
GVW � 3.5t (LCV) 4,072 2,202 4,945 4,100 15,319
3.5t � GVW (MHCV) 385 216 513 385 1,499
Subtotal 4,457 2,418 5,458 4,485 16,818
YOY % Change 18.3% ▼18.3% 44.1% 15.3% 16.7%
Total 36,889 19,088 35,427 25,030 116,434
YOY % Change 21.2% ▼15.1% 5.3% ▼23.4% ▼2.4%
1 Toyota (Kuozui) 18,945 9,076 19,164 10,796 57,981
2 Nissan (Yulon) 3,781 2,107 3,597 3,470 12,955
3 Mitsubishi (China Motor) 3,568 2,051 3,964 3,372 12,955
4 Honda (Taiwan Honda) 3,805 1,507 2,255 2,088 9,655
5 Ford (Ford Lio Ho) 2,303 1,570 2,298 1,509 7,680
6 Hyundai (Sanyang) 1,567 948 1,342 1,177 5,034
7 Hino (Kuozui) 494 243 631 402 1,770
8 Fuso (China Motor) 398 227 491 505 1,621
9 Mazda (Ford Lio Ho) 586 252 263 134 1,235
Others 1,442 1,107 1,422 1,577 5,548
Total 36,889 19,088 35,427 25,030 116,434
Passenger Car 219,820 219,029 218,486 213,732 871,067
Utility Vehicle 54,891 52,909 58,644 56,941 223,385
MPV 12,632 14,424 15,595 15,780 58,431
Subtotal 287,343 286,362 292,725 286,453 1,152,883
YOY % Change 6.5% 9.2% 7.5% 10.9% 8.5%
Truck 31,044 32,403 33,256 29,394 126,097
Bus 4,246 4,765 5,506 4,442 18,959
Subtotal 35,290 37,168 38,762 33,836 145,056
YOY % Change ▼5.2% ▼6.9% ▼0.1% ▼5.3% ▼4.4%
Truck 20,734 22,652 23,135 19,887 86,408
Bus 4,824 5,706 5,281 3,566 19,377
Subtotal 25,558 28,358 28,416 23,453 105,785
YOY % Change 38.7% 37.0% 22.0% 12.9% 27.2%
Total 60,848 65,526 67,178 57,289 250,841
YOY % Change 9.3% 8.1% 8.2% 1.4% 6.8%
Total 348,191 351,888 359,903 343,742 1,403,724
YOY % Change 7.0% 9.0% 7.6% 9.2% 8.2%
1 Suzuki / Maruti 121,443 121,651 122,300 114,499 479,893
2 Hyundai 47,295 50,150 54,300 53,598 205,343
3 Tata 46,837 45,822 45,533 39,373 177,565
4 Mahindra 35,367 35,294 40,041 34,117 144,819
5 Honda 16,907 18,626 19,453 20,278 75,264
6 Toyota 14,141 13,103 14,300 14,006 55,550
7 Ford 12,459 14,056 14,212 14,595 55,322
8 Nissan 13,739 14,160 9,685 13,782 51,366
9 Ashok Leyland 10,949 11,804 11,373 9,045 43,171
10 VW 9,295 8,539 9,693 10,234 37,761
11 GM 4,969 4,163 3,866 4,334 17,332
12 Renault 3,962 3,389 3,852 5,429 16,632
13 VECV 4,043 4,232 4,125 4,192 16,592
14 Force 1,899 2,110 2,635 1,808 8,452
Others 4,886 4,789 4,535 4,452 18,662
Total 348,191 351,888 359,903 343,742 1,403,724
ED�800 cc 4,312 3,686 7,040 6,243 21,281
800 cc�ED�1,300 cc 1,259 1,453 2,359 1,684 6,755
1,300 cc�ED�1,600 cc 8,400 6,841 7,427 8,451 31,119
Subtotal 13,971 11,980 16,826 16,378 59,155
YOY % Change 29.3% 16.1% 46.6% 52.7% 36.5%
LCV 2,146 2,664 4,169 3,761 12,740
Truck 333 269 414 372 1,388
Bus 37 36 36 65 174
Subtotal 2,516 2,969 4,619 4,198 14,302
YOY % Change 39.1% 58.6% 122.3% 145.5% 91.5%
Total 16,487 14,949 21,445 20,576 73,457
YOY % Change 30.7% 22.6% 58.2% 65.5% 44.6%
1 Suzuki 7,398 7,419 13,211 11,397 39,425
2 Toyota 6,428 5,157 5,333 6,019 22,937
3 Honda 2,253 2,056 2,451 2,723 9,483
4 Hino 92 126 186 209 613
5 UD Trucks 96 84 90 101 371
6 Isuzu 87 20 92 60 259
7 Land Rover 38 12 - - 50
Others 95 75 82 67 319
Total 16,487 14,949 21,445 20,576 73,457
In
dia (*
4)
Pak
istan
Ty
pe
Passenger Car
Commercial
Vehicle
Bran
dT
yp
e
Passenger
Vehicle
Co
mm
ercial V
eh
icle
LCV
MHCV
Bran
d
Country/ Type/ Brand
Taiw
an
Ty
pe
Commercial
Vehicle
Bran
d
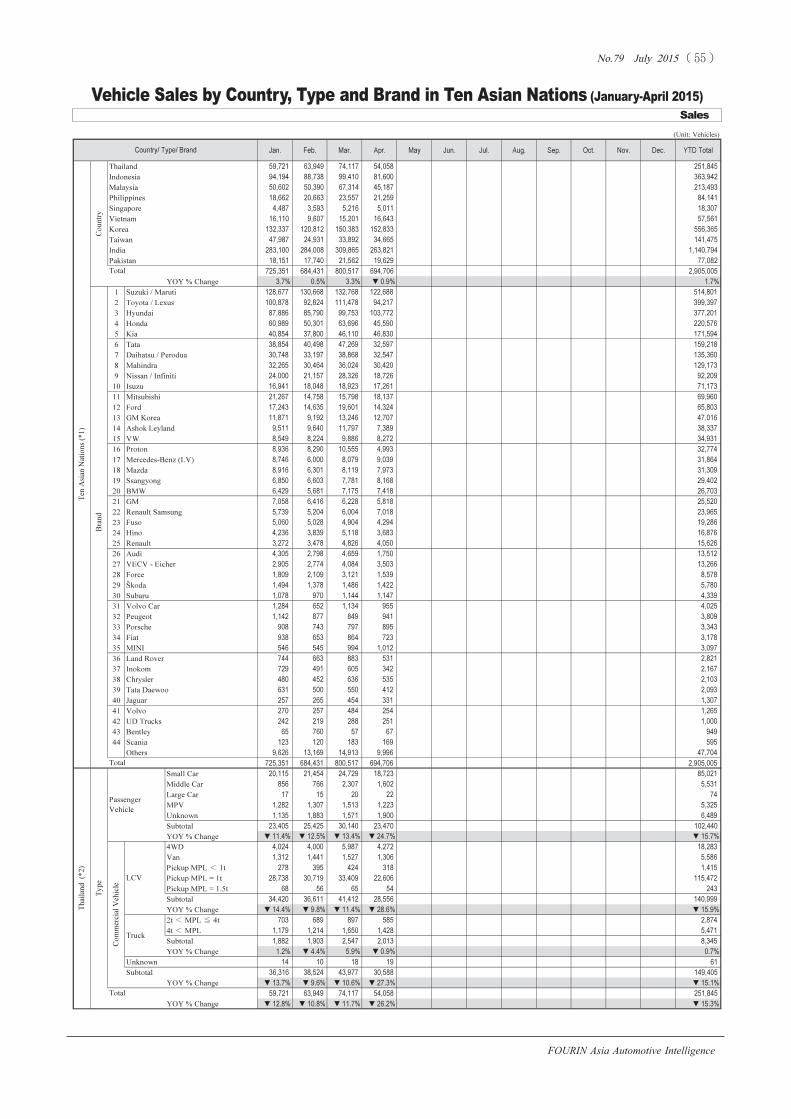
���������� ��� ���� ��������
����� ����� !"����
FOURIN Asia Automotive Intelligence
Sales
Vehicle Sales by Country, Type and Brand in Ten Asian Nations (January-April 2015)
(Unit: Vehicles)
Jan. Feb. Mar. Apr. May Jun. Jul. Aug. Sep. Oct. Nov. Dec. YTD Total
Thailand 59,721 63,949 74,117 54,058 251,845
Indonesia 94,194 88,738 99,410 81,600 363,942
Malaysia 50,602 50,390 67,314 45,187 213,493
Philippines 18,662 20,663 23,557 21,259 84,141
Singapore 4,487 3,593 5,216 5,011 18,307
Vietnam 16,110 9,607 15,201 16,643 57,561
Korea 132,337 120,812 150,383 152,833 556,365
Taiwan 47,987 24,931 33,892 34,665 141,475
India 283,100 284,008 309,865 263,821 1,140,794
Pakistan 18,151 17,740 21,562 19,629 77,082
725,351 684,431 800,517 694,706 2,905,005
YOY % Change 3.7% 0.5% 3.3% ▼0.9% 1.7%
1 Suzuki / Maruti 128,677 130,668 132,768 122,688 514,801
2 Toyota / Lexus 100,878 92,824 111,478 94,217 399,397
3 Hyundai 87,886 85,790 99,753 103,772 377,201
4 Honda 60,989 50,301 63,696 45,590 220,576
5 Kia 40,854 37,800 46,110 46,830 171,594
6 Tata 38,854 40,498 47,269 32,597 159,218
7 Daihatsu / Perodua 30,748 33,197 38,868 32,547 135,360
8 Mahindra 32,265 30,464 36,024 30,420 129,173
9 Nissan / Infiniti 24,000 21,157 28,326 18,726 92,209
10 Isuzu 16,941 18,048 18,923 17,261 71,173
11 Mitsubishi 21,267 14,758 15,798 18,137 69,960
12 Ford 17,243 14,635 19,601 14,324 65,803
13 GM Korea 11,871 9,192 13,246 12,707 47,016
14 Ashok Leyland 9,511 9,640 11,797 7,389 38,337
15 VW 8,549 8,224 9,886 8,272 34,931
16 Proton 8,936 8,290 10,555 4,993 32,774
17 Mercedes-Benz (LV) 8,746 6,000 8,079 9,039 31,864
18 Mazda 8,916 6,301 8,119 7,973 31,309
19 Ssangyong 6,850 6,603 7,781 8,168 29,402
20 BMW 6,429 5,681 7,175 7,418 26,703
21 GM 7,058 6,416 6,228 5,818 25,520
22 Renault Samsung 5,739 5,204 6,004 7,018 23,965
23 Fuso 5,060 5,028 4,904 4,294 19,286
24 Hino 4,236 3,839 5,118 3,683 16,876
25 Renault 3,272 3,478 4,826 4,050 15,626
26 Audi 4,305 2,798 4,659 1,750 13,512
27 VECV - Eicher 2,905 2,774 4,084 3,503 13,266
28 Force 1,809 2,109 3,121 1,539 8,578
29 Škoda 1,494 1,378 1,486 1,422 5,780
30 Subaru 1,078 970 1,144 1,147 4,339
31 Volvo Car 1,284 652 1,134 955 4,025
32 Peugeot 1,142 877 849 941 3,809
33 Porsche 908 743 797 895 3,343
34 Fiat 938 653 864 723 3,178
35 MINI 546 545 994 1,012 3,097
36 Land Rover 744 663 883 531 2,821
37 Inokom 729 491 605 342 2,167
38 Chrysler 480 452 636 535 2,103
39 Tata Daewoo 631 500 550 412 2,093
40 Jaguar 257 265 454 331 1,307
41 Volvo 270 257 484 254 1,265
42 UD Trucks 242 219 288 251 1,000
43 Bentley 65 760 57 67 949
44 Scania 123 120 183 169 595
Others 9,626 13,169 14,913 9,996 47,704
725,351 684,431 800,517 694,706 2,905,005
Small Car 20,115 21,454 24,729 18,723 85,021
Middle Car 856 766 2,307 1,602 5,531
Large Car 17 15 20 22 74
MPV 1,282 1,307 1,513 1,223 5,325
Unknown 1,135 1,883 1,571 1,900 6,489
Subtotal 23,405 25,425 30,140 23,470 102,440
YOY % Change ▼11.4% ▼12.5% ▼13.4% ▼24.7% ▼15.7%
4WD 4,024 4,000 5,987 4,272 18,283
Van 1,312 1,441 1,527 1,306 5,586
Pickup MPL � 1t 278 395 424 318 1,415
Pickup MPL = 1t 28,738 30,719 33,409 22,606 115,472
Pickup MPL = 1.5t 68 56 65 54 243
Subtotal 34,420 36,611 41,412 28,556 140,999
YOY % Change ▼14.4% ▼9.8% ▼11.4% ▼28.6% ▼15.9%
2t � MPL � 4t 703 689 897 585 2,874
4t � MPL 1,179 1,214 1,650 1,428 5,471
Subtotal 1,882 1,903 2,547 2,013 8,345
YOY % Change 1.2% ▼4.4% 5.9% ▼0.9% 0.7%
Unknown 14 10 18 19 61
Subtotal 36,316 38,524 43,977 30,588 149,405
YOY % Change ▼13.7% ▼9.6% ▼10.6% ▼27.3% ▼15.1%
59,721 63,949 74,117 54,058 251,845
YOY % Change ▼12.8% ▼10.8% ▼11.7% ▼26.2% ▼15.3%
Country/ Type/ Brand
Ten
A
sian
N
atio
ns (*
1)
Co
un
try
Total
Total
Bran
d
Co
mm
ercial V
eh
icle
Ty
pe
Passenger
Vehicle
Truck
LCV
Th
ailan
d (*
2)
Total

���������� ��� ���� ��������
����� ����� !"����
FOURIN Asia Automotive Intelligence
Vehicle Sales by Country, Type and Brand
Sales
(Unit: Vehicles)
Jan. Feb. Mar. Apr. May Jun. Jul. Aug. Sep. Oct. Nov. Dec. YTD Total
1 Toyota 20,094 22,516 26,401 13,246 82,257
2 Isuzu 11,202 11,758 12,945 11,672 47,577
3 Honda 10,099 8,793 11,536 8,603 39,031
4 Nissan 4,050 4,801 6,011 4,109 18,971
5 Mitsubishi 4,030 4,325 4,512 3,682 16,549
6 Mazda 2,744 2,664 2,587 3,050 11,045
7 Ford 1,979 2,249 2,486 2,389 9,103
8 Suzuki 1,109 1,802 2,201 1,808 6,920
9 GM 1,316 1,376 1,507 1,516 5,715
10 Hino 864 810 1,101 751 3,526
11 Mercedes-Benz (LV) 454 1,317 661 1,027 3,459
12 BMW 617 532 825 770 2,744
13 Hyundai 330 243 318 418 1,309
14 Subaru 163 154 209 227 753
15 Tata 133 83 113 104 433
16 Fuso 86 103 122 110 421
17 Volvo 71 77 167 75 390
18 Volvo Car 64 34 85 103 286
19 VW 41 31 40 40 152
20 Kia 18 41 55 36 150
21 Proton 22 27 18 18 85
22 Mercedes-Benz (M&HCV) 14 10 18 19 61
23 Ssangyong 10 12 15 22 59
24 Scania 9 11 21 16 57
25 Land Rover 7 8 3 10 28
26 Peugeot 7 6 3 3 19
27 Jaguar 5 - 2 3 10
28 Lamborghini 2 2 1 3 8
29 Maserati 2 3 2 - 7
30 Citroën 1 3 1 2 7
Others 178 155 151 225 709
59,721 63,949 74,117 54,058 251,845
Sedan 5,363 8,268 10,164 7,365 31,160
YOY % Change 4.7% 20.6% 42.6% 8.1% 20.2%
Non Sedan 4X2 70,171 61,760 70,460 58,183 260,574
Non Sedan 4X4 2,462 2,444 1,851 1,946 8,703
Subtotal 72,633 64,204 72,311 60,129 269,277
YOY % Change ▼9.4% ▼23.9% ▼13.7% ▼25.5% ▼18.1%
Pickup MPL � 1t 7,538 6,804 7,569 6,620 28,531
Pickup MPL = 1t 729 1,123 1,017 1,069 3,938
Subtotal 8,267 7,927 8,586 7,689 32,469
YOY % Change 7.9% 0.5% 2.4% ▼4.2% 1.6%
Light Truck 6,753 6,754 6,693 5,108 25,308
YOY % Change ▼21.6% ▼34.1% ▼37.1% ▼46.7% ▼35.2%
Subtotal 87,653 78,885 87,590 72,926 327,054
YOY % Change ▼9.1% ▼23.0% ▼14.8% ▼25.8% ▼18.2%
MHCV 1,178 1,585 1,656 1,309 5,728
YOY % Change ▼38.4% ▼34.7% ▼47.4% ▼24.7% ▼37.9%
Subtotal 88,831 80,470 89,246 74,235 332,782
YOY % Change ▼9.7% ▼23.3% ▼15.8% ▼25.8% ▼18.7%
94,194 88,738 99,410 81,600 363,942
YOY % Change ▼9.0% ▼20.6% ▼12.1% ▼23.6% ▼16.4%
1 Toyota 27,166 26,743 31,801 30,053 115,763
2 Daihatsu 14,536 14,523 16,258 14,855 60,172
3 Honda 16,855 13,682 13,951 10,583 55,071
4 Suzuki 12,683 10,017 12,387 8,019 43,106
5 Mitsubishi 7,436 6,999 6,371 6,440 27,246
6 Nissan 4,436 5,595 7,736 3,032 20,799
7 Fuso 3,929 4,221 3,841 3,222 15,213
8 Hino 1,782 1,948 2,388 1,410 7,528
9 Isuzu 2,052 2,160 1,836 1,458 7,506
10 Mazda 742 626 835 752 2,955
11 GM 662 682 232 230 1,806
12 Ford 560 380 492 364 1,796
13 Kia 425 271 251 264 1,211
14 Mercedes-Benz 227 162 291 236 916
15 BMW 180 226 225 130 761
16 Hyundai 143 138 122 160 563
17 Tata 100 101 112 134 447
18 Audi 19 18 17 17 71
19 Peugeot 7 5 3 7 22
Others 254 240 261 232 987
94,194 88,738 99,410 81,600 363,942
In
do
nesia
Total
Ty
pe
Total
Total
Bran
dB
ran
d
Country/ Type/ Brand
Co
mm
ercial V
eh
icle
LCV
Passenger Car
Th
ailan
d (*
2) (co
nt.)

���������� ��� ���� ��������
����� ����� !"����
FOURIN Asia Automotive Intelligence
Sales
in Ten Asian Nations (January-April 2015)
(Unit: Vehicles)
Jan. Feb. Mar. Apr. May Jun. Jul. Aug. Sep. Oct. Nov. Dec. YTD Total
Passenger car 36,241 34,847 45,536 32,809 149,433
4WD/SUV 2,593 3,983 6,010 3,519 16,105
Van 317 244 550 399 1,510
MPV 5,546 5,843 7,222 4,175 22,786
Subtotal 44,697 44,917 59,318 40,902 189,834
YOY % Change ▼0.0% ▼1.7% 13.8% ▼22.1% ▼2.7%
Truck 1,090 1,007 1,862 1,051 5,010
Semi-tractor 103 111 268 89 571
Bus 76 95 96 70 337
Panel Van 338 283 305 137 1,063
Pickup truck 4,298 3,977 5,465 2,938 16,678
5,905 5,473 7,996 4,285 23,659
YOY % Change 8.9% 15.3% 13.5% ▼34.2% 0.2%
50,602 50,390 67,314 45,187 213,493
YOY % Change 0.7% ▼0.6% 14.2% ▼23.1% ▼2.4%
1 Daihatsu / Perodua 16,155 18,660 22,610 17,649 75,074
2 Proton 8,900 8,254 10,528 4,972 32,654
3 Honda 6,522 6,042 9,581 6,562 28,707
4 Toyota / Lexus 4,109 5,159 7,335 6,190 22,793
5 Nissan 4,706 3,515 5,005 3,003 16,229
6 Ford 1,544 1,249 1,818 373 4,984
7 Mazda 875 994 1,503 705 4,077
8 Mitsubishi 1,488 964 1,157 311 3,920
9 Isuzu 747 695 1,467 762 3,671
10 Mercedes-Benz (LV) 430 491 969 932 2,822
11 VW 417 502 622 684 2,225
12 Inokom 729 491 605 342 2,167
13 Kia 702 519 549 251 2,021
14 BMW 500 470 389 471 1,830
Others 2,778 2,385 3,176 1,980 10,319
50,602 50,390 67,314 45,187 213,493
Passenger Vehicle 7,200 8,149 9,702 8,331 33,382
YOY % Change 35.9% 45.0% 35.2% 23.8% 34.5%
11,462 12,514 13,855 12,928 50,759
YOY % Change 10.8% 11.7% 15.5% 13.8% 13.0%
18,662 20,663 23,557 21,259 84,141
YOY % Change 19.3% 22.8% 22.9% 17.5% 20.7%
1 Toyota / Lexus 8,709 8,870 10,237 9,467 37,283
2 Mitsubishi 3,243 4,070 4,536 4,311 16,160
3 Ford 1,637 1,759 1,877 1,632 6,905
4 Isuzu 1,227 1,813 1,917 1,439 6,396
5 Honda 1,144 1,224 1,590 1,336 5,294
6 Kia N.A. N.A. N.A. N.A. N.A.
7 Nissan N.A. N.A. N.A. N.A. N.A.
8 Suzuki N.A. N.A. N.A. N.A. N.A.
9 Mazda N.A. N.A. N.A. N.A. N.A.
10 BMW N.A. N.A. N.A. N.A. N.A.
Others 2,702 2,927 3,400 3,074 12,103
18,662 20,663 23,557 21,259 84,141
Passenger Vehicle 3,536 2,903 3,925 3,857 14,221
YOY % Change 69.2% 54.8% 96.5% 115.2% 83.4%
951 690 1,291 1,154 4,086
YOY % Change 59.0% ▼2.5% 17.9% 36.6% 25.9%
4,487 3,593 5,216 5,011 18,307
YOY % Change 66.9% 39.1% 68.7% 90.0% 66.4%
1 Toyota / Lexus 841 685 1,354 1,020 3,900
2 Mercedes-Benz (LV) 724 437 266 512 1,939
3 Nissan 414 361 567 355 1,697
4 Honda 317 238 371 509 1,435
5 Mazda 303 174 409 333 1,219
6 VW 245 197 306 282 1,030
7 BMW 236 224 186 374 1,020
8 Audi 155 130 191 176 652
9 Fuso 175 93 176 200 644
10 Hyundai 119 123 107 136 485
Others 958 931 1,283 1,114 4,286
4,487 3,593 5,216 5,011 18,307
Passenger Vehicle 6,612 4,221 5,221 5,378 21,432
YOY % Change 72.3% 122.7% 50.0% 46.7% 66.4%
9,498 5,386 9,980 11,265 36,129
YOY % Change 87.6% 34.2% 71.1% 74.6% 69.2%
16,110 9,607 15,201 16,643 57,561
YOY % Change 81.0% 62.6% 63.2% 64.5% 68.1%
1 Toyota / Lexus 4,369 2,956 3,826 4,080 15,231
2 Kia 2,643 1,405 2,693 2,944 9,685
3 Ford 1,523 925 1,400 1,740 5,588
4 Mazda 1,776 905 1,441 1,405 5,527
5 Honda 862 505 494 564 2,425
6 GM 547 419 529 536 2,031
7 Isuzu 512 273 390 610 1,785
8 Suzuki 386 236 471 514 1,607
9 Hino 558 241 316 415 1,530
Others 2,934 1,742 3,641 3,835 12,152
16,110 9,607 15,201 16,643 57,561
Ty
pe
Total
Total
Ph
ilip
pin
es (*
4)
Vietn
am
(*
6)
Ty
pe
Commercial Vehicle
Total
Ty
pe
Commercial Vehicle
Bran
dB
ran
d
Sin
gap
ore (*
5)
Total
Bran
d
Commercial Vehicle
Total
Total
Subtotal
Country/ Type/ Brand
Passen
ger V
eh
icle
Total
Malay
sia (*
3)
Bran
d
Co
mm
ercial V
eh
icle
Total
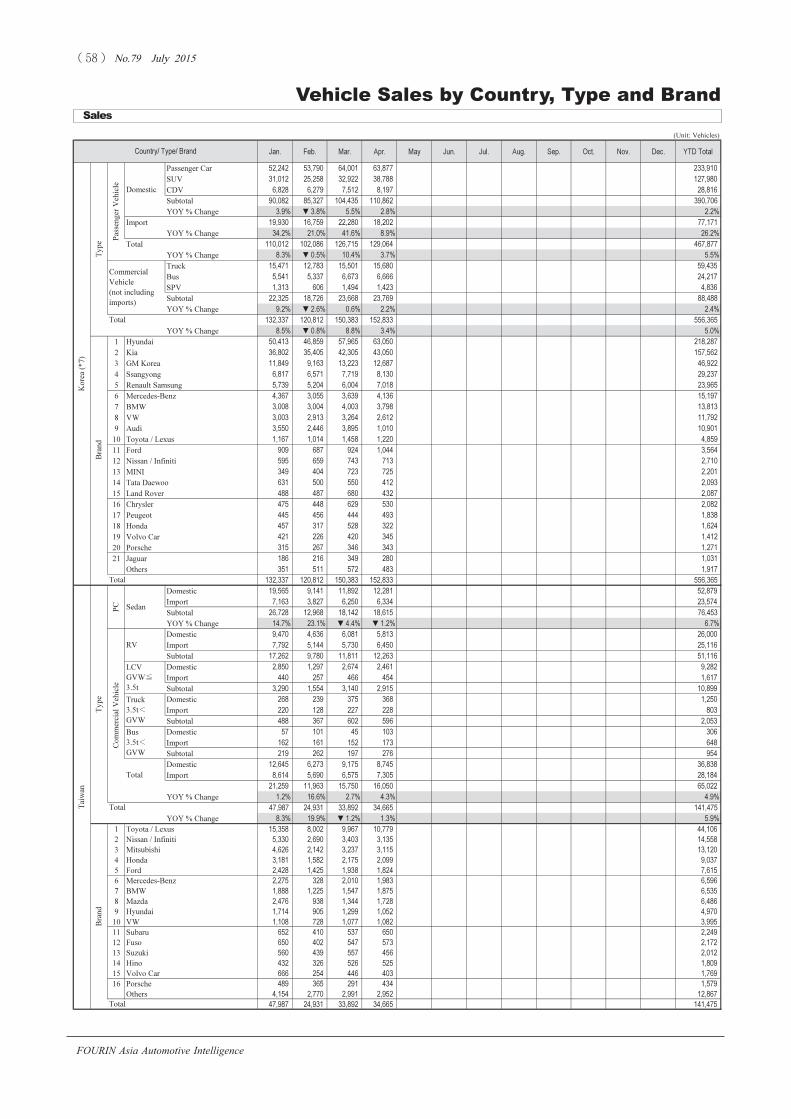
���������� ��� ���� ��������
����� ����� !"����
FOURIN Asia Automotive Intelligence
Vehicle Sales by Country, Type and Brand
Sales
(Unit: Vehicles)
Jan. Feb. Mar. Apr. May Jun. Jul. Aug. Sep. Oct. Nov. Dec. YTD Total
Passenger Car 52,242 53,790 64,001 63,877 233,910
SUV 31,012 25,258 32,922 38,788 127,980
CDV 6,828 6,279 7,512 8,197 28,816
Subtotal 90,082 85,327 104,435 110,862 390,706
YOY % Change 3.9% ▼3.8% 5.5% 2.8% 2.2%
Import 19,930 16,759 22,280 18,202 77,171
YOY % Change 34.2% 21.0% 41.6% 8.9% 26.2%
Total 110,012 102,086 126,715 129,064 467,877
YOY % Change 8.3% ▼0.5% 10.4% 3.7% 5.5%
Truck 15,471 12,783 15,501 15,680 59,435
Bus 5,541 5,337 6,673 6,666 24,217
SPV 1,313 606 1,494 1,423 4,836
Subtotal 22,325 18,726 23,668 23,769 88,488
YOY % Change 9.2% ▼2.6% 0.6% 2.2% 2.4%
132,337 120,812 150,383 152,833 556,365
YOY % Change 8.5% ▼0.8% 8.8% 3.4% 5.0%
1 Hyundai 50,413 46,859 57,965 63,050 218,287
2 Kia 36,802 35,405 42,305 43,050 157,562
3 GM Korea 11,849 9,163 13,223 12,687 46,922
4 Ssangyong 6,817 6,571 7,719 8,130 29,237
5 Renault Samsung 5,739 5,204 6,004 7,018 23,965
6 Mercedes-Benz 4,367 3,055 3,639 4,136 15,197
7 BMW 3,008 3,004 4,003 3,798 13,813
8 VW 3,003 2,913 3,264 2,612 11,792
9 Audi 3,550 2,446 3,895 1,010 10,901
10 Toyota / Lexus 1,167 1,014 1,458 1,220 4,859
11 Ford 909 687 924 1,044 3,564
12 Nissan / Infiniti 595 659 743 713 2,710
13 MINI 349 404 723 725 2,201
14 Tata Daewoo 631 500 550 412 2,093
15 Land Rover 488 487 680 432 2,087
16 Chrysler 475 448 629 530 2,082
17 Peugeot 445 456 444 493 1,838
18 Honda 457 317 528 322 1,624
19 Volvo Car 421 226 420 345 1,412
20 Porsche 315 267 346 343 1,271
21 Jaguar 186 216 349 280 1,031
Others 351 511 572 483 1,917
132,337 120,812 150,383 152,833 556,365
Domestic 19,565 9,141 11,892 12,281 52,879
Import 7,163 3,827 6,250 6,334 23,574
Subtotal 26,728 12,968 18,142 18,615 76,453
YOY % Change 14.7% 23.1% ▼4.4% ▼1.2% 6.7%
Domestic 9,470 4,636 6,081 5,813 26,000
Import 7,792 5,144 5,730 6,450 25,116
Subtotal 17,262 9,780 11,811 12,263 51,116
Domestic 2,850 1,297 2,674 2,461 9,282
Import 440 257 466 454 1,617
Subtotal 3,290 1,554 3,140 2,915 10,899
Domestic 268 239 375 368 1,250
Import 220 128 227 228 803
Subtotal 488 367 602 596 2,053
Domestic 57 101 45 103 306
Import 162 161 152 173 648
Subtotal 219 262 197 276 954
Domestic 12,645 6,273 9,175 8,745 36,838
Import 8,614 5,690 6,575 7,305 28,184
21,259 11,963 15,750 16,050 65,022
YOY % Change 1.2% 16.6% 2.7% 4.3% 4.9%
47,987 24,931 33,892 34,665 141,475
YOY % Change 8.3% 19.9% ▼1.2% 1.3% 5.9%
1 Toyota / Lexus 15,358 8,002 9,967 10,779 44,106
2 Nissan / Infiniti 5,330 2,690 3,403 3,135 14,558
3 Mitsubishi 4,626 2,142 3,237 3,115 13,120
4 Honda 3,181 1,582 2,175 2,099 9,037
5 Ford 2,428 1,425 1,938 1,824 7,615
6 Mercedes-Benz 2,275 328 2,010 1,983 6,596
7 BMW 1,888 1,225 1,547 1,875 6,535
8 Mazda 2,476 938 1,344 1,728 6,486
9 Hyundai 1,714 905 1,299 1,052 4,970
10 VW 1,108 728 1,077 1,082 3,995
11 Subaru 652 410 537 650 2,249
12 Fuso 650 402 547 573 2,172
13 Suzuki 560 439 557 456 2,012
14 Hino 432 326 526 525 1,809
15 Volvo Car 666 254 446 403 1,769
16 Porsche 489 365 291 434 1,579
Others 4,154 2,770 2,991 2,952 12,867
47,987 24,931 33,892 34,665 141,475
Bran
d
Total
Taiw
an
Country/ Type/ Brand
Commercial
Vehicle
(not including
imports)
Sedan
Total
Typ
e
Truck
3.5t�
GVW
PC
Total
Bus
3.5t�
GVW
RV
Co
mm
ercial V
eh
icle
LCV
GVW�
3.5t
Korea (*
7)
Passen
ger V
ehicle
Bran
d
Total
Domestic
Total
Typ
e
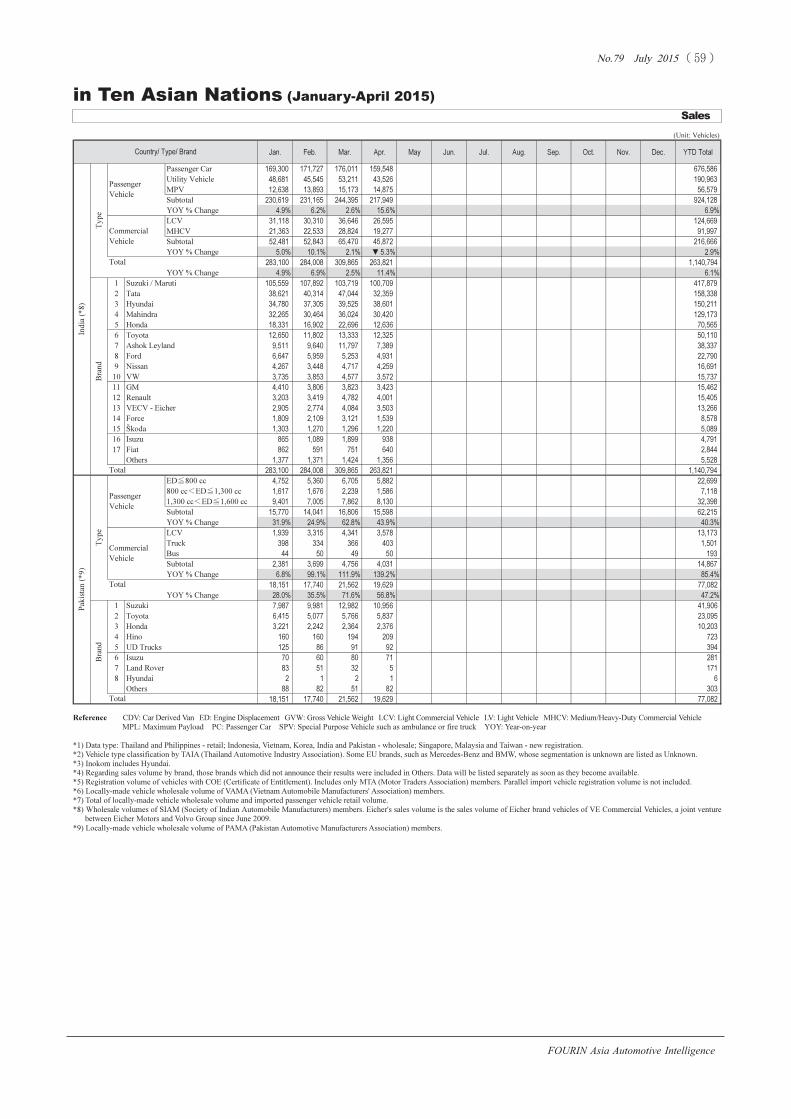
���������� ��� ���� ��������
����� ����� !"����
FOURIN Asia Automotive Intelligence
Sales
in Ten Asian Nations (January-April 2015)
Reference� � � CDV: Car Derived Van� ED: Engine Displacement� GVW: Gross Vehicle Weight� LCV: Light Commercial Vehicle� LV: Light Vehicle� MHCV: Medium/Heavy-Duty Commercial Vehicle
MPL: Maximum Payload PC: Passenger Car SPV: Special Purpose Vehicle such as ambulance or fire truck YOY: Year-on-year
*1) Data type: Thailand and Philippines - retail; Indonesia, Vietnam, Korea, India and Pakistan - wholesale; Singapore, Malaysia and Taiwan - new registration.
*2) Vehicle type classification by TAIA (Thailand Automotive Industry Association). Some EU brands, such as Mercedes-Benz and BMW, whose segmentation is unknown are listed as Unknown.
*3) Inokom includes Hyundai.
*4) Regarding sales volume by brand, those brands which did not announce their results were included in Others. Data will be listed separately as soon as they become available.
*5) Registration volume of vehicles with COE (Certificate of Entitlement). Includes only MTA (Motor Traders Association) members. Parallel import vehicle registration volume is not included.
*6) Locally-made vehicle wholesale volume of VAMA (Vietnam Automobile Manufacturers' Association) members.
*7) Total of locally-made vehicle wholesale volume and imported passenger vehicle retail volume.
*8) Wholesale volumes of SIAM (Society of Indian Automobile Manufacturers) members. Eicher's sales volume is the sales volume of Eicher brand vehicles of VE Commercial Vehicles, a joint venture
between Eicher Motors and Volvo Group since June 2009.
*9) Locally-made vehicle wholesale volume of PAMA (Pakistan Automotive Manufacturers Association) members.
(Unit: Vehicles)
Jan. Feb. Mar. Apr. May Jun. Jul. Aug. Sep. Oct. Nov. Dec. YTD Total
Passenger Car 169,300 171,727 176,011 159,548 676,586
Utility Vehicle 48,681 45,545 53,211 43,526 190,963
MPV 12,638 13,893 15,173 14,875 56,579
Subtotal 230,619 231,165 244,395 217,949 924,128
YOY % Change 4.9% 6.2% 2.6% 15.6% 6.9%
LCV 31,118 30,310 36,646 26,595 124,669
MHCV 21,363 22,533 28,824 19,277 91,997
Subtotal 52,481 52,843 65,470 45,872 216,666
YOY % Change 5.0% 10.1% 2.1% ▼5.3% 2.9%
283,100 284,008 309,865 263,821 1,140,794
YOY % Change 4.9% 6.9% 2.5% 11.4% 6.1%
1 Suzuki / Maruti 105,559 107,892 103,719 100,709 417,879
2 Tata 38,621 40,314 47,044 32,359 158,338
3 Hyundai 34,780 37,305 39,525 38,601 150,211
4 Mahindra 32,265 30,464 36,024 30,420 129,173
5 Honda 18,331 16,902 22,696 12,636 70,565
6 Toyota 12,650 11,802 13,333 12,325 50,110
7 Ashok Leyland 9,511 9,640 11,797 7,389 38,337
8 Ford 6,647 5,959 5,253 4,931 22,790
9 Nissan 4,267 3,448 4,717 4,259 16,691
10 VW 3,735 3,853 4,577 3,572 15,737
11 GM 4,410 3,806 3,823 3,423 15,462
12 Renault 3,203 3,419 4,782 4,001 15,405
13 VECV - Eicher 2,905 2,774 4,084 3,503 13,266
14 Force 1,809 2,109 3,121 1,539 8,578
15 Škoda 1,303 1,270 1,296 1,220 5,089
16 Isuzu 865 1,089 1,899 938 4,791
17 Fiat 862 591 751 640 2,844
Others 1,377 1,371 1,424 1,356 5,528
283,100 284,008 309,865 263,821 1,140,794
ED�800 cc 4,752 5,360 6,705 5,882 22,699
800 cc�ED�1,300 cc 1,617 1,676 2,239 1,586 7,118
1,300 cc�ED�1,600 cc 9,401 7,005 7,862 8,130 32,398
Subtotal 15,770 14,041 16,806 15,598 62,215
YOY % Change 31.9% 24.9% 62.8% 43.9% 40.3%
LCV 1,939 3,315 4,341 3,578 13,173
Truck 398 334 366 403 1,501
Bus 44 50 49 50 193
Subtotal 2,381 3,699 4,756 4,031 14,867
YOY % Change 6.8% 99.1% 111.9% 139.2% 85.4%
18,151 17,740 21,562 19,629 77,082
YOY % Change 28.0% 35.5% 71.6% 56.8% 47.2%
1 Suzuki 7,987 9,981 12,982 10,956 41,906
2 Toyota 6,415 5,077 5,766 5,837 23,095
3 Honda 3,221 2,242 2,364 2,376 10,203
4 Hino 160 160 194 209 723
5 UD Trucks 125 86 91 92 394
6 Isuzu 70 60 80 71 281
7 Land Rover 83 51 32 5 171
8 Hyundai 2 1 2 1 6
Others 88 82 51 82 303
18,151 17,740 21,562 19,629 77,082
Pak
istan
(*
9)
Ty
pe
Passenger
Vehicle
Commercial
Vehicle
Bran
d
Total
Total
In
dia (*
8)
Total
Ty
pe
Commercial
Vehicle
Bran
d
Passenger
Vehicle
Total
Country/ Type/ Brand