!! global forest watch report clearcutting our carbon
TRANSCRIPT
Clearcutting our Carbon Accounts1 How State and private forest practices are subverting Oregon’s climate agenda
By John Talberth,2 Dominick DellaSala,3 and Erik Fernandez4
November 2015
Key points
• The timber industry shields its global warming pollution from public scrutiny by using a greenhouse gas (GHG) accounting trick other sectors cannot make use of – taking credit for the emissions reductions achieved by others. In particular, the timber industry claims that the carbon dioxide absorbed by forests conserved by non-profits, small landowners, and government exceed what it emits and therefore net emissions from what they call the “forest sector” are zero.
• Because of this accounting trick – used worldwide – GHG emissions from the timber industry in Oregon have not been tracked and evaluated since 2002 and are ignored by Oregon’s climate agenda. But rapid clearcutting on these lands over the past 14 years has generated significant greenhouse gas emissions from industrial logging and a loss of carbon sequestration capacity.
• These emissions have averaged between 9.75 and 19.35 million metric tons carbon dioxide equivalent (MMT CO2-e) per year since 2000 on State and private forestlands in western Oregon. This represents between 16% and 32% of the 60.8 million MMT CO2-e “in-boundary” emissions estimated for the State by the latest (2012) GHG inventory.
• These emissions are four to seven times higher those associated with coal combustion by the Boardman coal-fired plant in 2012, are equivalent to 2-4 million new cars on the road, and make logging on State and private lands one of Oregon’s biggest GHG polluters and a major impediment to Oregon’s ambitious GHG reduction targets.
• Industrial forest practices are also undermining goals for climate adaptation by keeping millions of acres of forestland in a high-risk condition for wildfire, landslides, disease and pest outbreaks while contributing to thermal pollution deadly to coldwater fisheries.
• Climate policy makers in Oregon can remedy the situation by accounting for timber industry emissions just like other sectors, promoting alternatives to clearcutting, lengthening timber harvest rotations, protecting state forestlands and reforming the timber tax code to incentivize carbon storage.
1 Generous support for this work was provided by World Resources Institute, Global Forest Watch program. 2 President and Senior Economist, Center for Sustainable Economy, [email protected] (503) 657-7336. 3 Chief Scientist, Geos Institute, [email protected], (541) 482.4459 x302 4 Wilderness Program Manager, Oregon Wild, [email protected], (541) 382 2616.
Global Forest Watch Report

2
Oregon prides itself on being a leader in the fight against climate change In 2007 the Oregon Legislature codified an ambitious agenda to both fight and adapt to global warming by passing House Bill 3543. The law sets targets for reducing Oregon's greenhouse gas emissions (GHG) and directs the Oregon Global Warming Commission (OGWC) and Oregon Climate Change Research Institute (OCCRI) to recommend policies to meet those targets. The legislation also charges these entities with the task of helping communities adapt to the effects of reduced snowpack, changes in the timing of stream flows, extreme or unusual weather events, rising sea levels, increased occurrences of vector-borne diseases and impacts on forest health. An initial set of strategies for both mitigation and adaptation have been set forth in the OGWC’s Roadmap to 2020, the OCCRI’s Climate Assessment Report, and the Oregon Climate Change Adaptation Framework prepared by multiple state agencies.5 The GHG goals established by HB 3543 call for Oregon to: (1) arrest the growth of Oregon’s GHG emissions and begin to reduce them by 2010; (2) achieve GHG levels that are 10 percent below 1990 levels by 2020, and (3) achieve GHG levels that are at least 75 percent below 1990 levels by 2050. The State reports that the 2010 goal has been met, at least with respect to slowing emissions growth. Yet those same reports acknowledge that Oregon is not even close to being on a trajectory to meet its 2020 or 2050 goals without implementation of significant new initiatives.6 Serious attention to the emissions associated with forest practices must be part of the equation. Yet emissions from forest practices are simply assumed to be zero The GHG emissions from forest practices in Oregon have not been measured other than a single assessment in 2002.7 That assessment – prepared by an intern with the Department of Energy – relied on a metric called “carbon flux.” Carbon flux measures how many metric tons of carbon dioxide are emitted by the forest sector each year taking emissions from clearcutting, decay of forest products, and wildfire into account together with the amount of carbon absorbed by residual forest cover. The key conclusion of that assessment was that GHG emissions from the forest sector were, for the most part, net negative for most of the period assessed (1989-2002) and therefore the timber industry should be exempted from further scrutiny. Indeed, the Roadmap to 2020 makes this bold assertion: “Oregon’s forests are a carbon sink, capturing more carbon than they release. As such, Oregon’s forests and its forest sector have and will continue to contribute to the goal of achieving reductions in greenhouse gas emissions by remaining a robust and sustainable sector in Oregon.”8 The problem is that this assertion is not supported by the data. To understand why, it is important to quickly review how GHG emissions from the forest sector are typically addressed. Rightly so, the 2002 assessment considered most of the standard components relevant to forest
5 Each of these documents is available online via the OGWC’s site at: http://www.keeporegoncool.org/content/roadmap-2020. 6 Drumheller, Bill. 2014. Oregon Greenhouse Gas Emissions and Recent Climate Change Developments. Salem, OR: Interagency Sustainability Coordinators Network, Oregon Department of Energy. 7 Kelly, Peter. 2013. A Greenhouse Gas Inventory of Oregon’s Forests. Salem, OR: Oregon Department of Energy, Oregon Global Warming Commission. 8 Oregon Global Warming Commission (OGWC). 2010. Interim Roadmap to 2020. Salem: OGWC.

3
sector GHG emissions in best practice protocols established at the international, national, and state level.9 These are summarized in Table 1, below. There are three major entries in the balance sheet, and their total is referred to as carbon flux – which can be positive or negative depending on many factors.
Table 1: Greenhouse Gas Emissions from Forest Practices
Major component Sub components Effect on emissions
Net ecosystem productivity - • Forest cover - • Forest degradation + • Climate +/- Emissions from timber harvest - • Volume harvested + • Longevity of forest products - • Efficiency of harvest and processing - • Substitution of non-wood alternatives +/- • Application of forest chemicals + Emissions from wildfires + • Acreage burned + • Intensity of burn + • Density of stored carbon +
Net ecosystem productivity The first component influencing emissions is net ecosystem productivity (NEP). NEP is the net effect of photosynthetic carbon uptake and release of carbon to the atmosphere from respiration by autotrophs (plants) and heterotrophs (animals and fungi).10 NEP is inversely correlated with emissions because higher NEP means more carbon uptake. NEP is dependent on many factors, but the most important are the amount of forest cover, the extent of forest degradation, and climate variability. More forest cover means more carbon uptake.11 But if that forest cover is degraded – for example, by skid trails and roads left over from earlier logging or intensive
9 See, e.g. (1) Watson, Robert T., Kan R. Nobel, Bert Bolin, N.H. Ravindranath, David J. Verardo and David J. Dokken (Eds.) 2000. Intergovernmental Panel on Climate Change - 2000. Land Use, Land Use Change and Forestry. UK: Cambridge University Press; (2) H.S. Eggleston, L. Buendia, K. Miwa, T. Ngara, and K. Tanabe (Eds.) 2006. Intergovernmental Panel on Climate Change. 2006. IPCC Guidelines for National Greenhouse Gas Inventories. Hayama, Kanagawa: The National Greenhouse Gas Inventories Programme; (3) U.S. Environmental Protection Agency (EPA). 2015. Inventory of Greenhouse Gas Emissions and Sinks: 1990-2013. EPA 430-R-15-004. 10 Turner, David, Michael Guzy, Michael Lefsky, William D. Ritts, Steve Van Tuyl, and Beverly E. Law. 2004. Monitoring Forest Carbon Sequestration with Remote Sensing and Carbon Cycle Monitoring. Environmental Management 33(4): 457-466. 11 The standard definition for forest cover is trees of at least 5 meters in height (16.4 feet) covering at least 30% of the ground as seen from above.

4
thinning – NEP can be significantly less.12 And with respect to climate variability, warmer and drier years are associated with significantly lower NEP in Northwest forests. Emissions from timber harvest When a forest is logged, emissions are generated through a number of channels, the most important being (a) the release of carbon once stored in trees when slash, needles, roots and stumps decay or are burned on site; (b) carbon released when soils are disturbed and eroded; (c) carbon released when wood waste is generated and then decays during processing, and; (d) carbon released as wood products decay in landfills.13 Transportation and heavy equipment use also generates emissions, but these are counted in other sectors (transportation and industry). As harvest volumes increase – whether through additional acres harvested or harvesting of larger, older trees – emissions increase accordingly. But not all stored carbon is lost at once. A proportion of carbon once stored by forests is stored in the wood products made from them. Longer-lived wood products, such as structural wood for homes and buildings, last longest while short-lived paper products or biomass for energy releases stored carbon quickly. Longer rotations (years between timber harvest) allow trees to grow larger and generate more valuable long-lived wood products and thus have a significant effect on emissions.14 Estimates of the amount of stored carbon lost from a given acre logged vary depending on these factors. Ingerson (2009) completed one of the most comprehensive reviews on this issue, tracing the amount of the original live tree volume (and thus carbon stored) remaining after logging, primary processing, secondary processing, and construction.15 Compiling and calibrating estimates from a variety of sources, she concluded that these losses amount – on average – to 82% of the original live tree volume. In other words, when a site is logged and the wood converted into long-lived wood products, only 18% of the original carbon stores are preserved, and then only for a few decades at most before those longer lived wood products start to decay. The remaining 82% of the carbon stocks are released into the atmosphere in a relatively short period of time. This value is essentially 100% for short-lived wood and paper products. Some have argued for consideration of the product substitution effect in accounting for emissions associated with timber harvest.16 For example, if wood beams are used in place of steel, overall emissions from fossil fuel combustion may drop. However, the substitution effect is ambiguous. There are now alternatives, such as use of bamboo for flooring, that can be produced with essentially zero emissions and so the presumption that emissions increase as wood substitutes
12 Pearson, Timothy R.H., Sandra Brown and Felipe M. Casarim. 2014. Carbon emissions from tropical forest degradation caused by logging. Environmental Research Letters 9 (2014): 034017 (11pp). doi:10.1088/1748-9326/9/3/034017. 13 Harmon, M.E., W.K Ferrel and J. F. Franklin. 1990. Effects on carbon storage of conversion of old –growth forests to young forests. Science 247:699-702. 14 Lippke, Bruce, Elaine Oneil, Rob Harrison, Kenneth Skog, Leif Gustavvsson and Roger Sathre. 2011. Life cycle impacts of forest management and wood utilization on carbon mitigation: knowns and unknowns. Carbon Management 2(3): 303-333. 15 Ingerson, A. 2009 Wood Products and Carbon Storage: Can Increased Production Help Solve the Climate Crisis? Washington, D.C.: The Wilderness Society. 16 Lippke et al. (2011), Note 14.

5
increase cannot be substantiated.17 Finally, accounting protocols also acknowledge the emissions from carbon intensive pesticides, herbicides, and fertilizers applied on forestlands. As more land is harvested through even-aged clearcutting techniques, more chemicals are required and more emissions are generated relative to harvest techniques that rely on natural regeneration. Emissions from wildfires The third major component that contributes to GHG emissions from forests is the emissions associated with forest fires. Emissions from forest fires consist of carbon dioxide, methane and nitrous oxide. Forest fires can be broken into two major types: (1) low-intensity fires set intentionally for a variety of conservation goals, and (2) unintentional wildfires of mixed intensities triggered by lighting or human causes that are typical of large fires in Oregon’s dry forest provinces. Typically, it is only the latter emissions that are tracked by GHG accounting protocols, and even then only for fires that burn over 50% of crown cover. Emissions associated with unintentional fires vary considerably, and depend upon the total acreage burned, intensity, and the density of carbon stored. In any given year, emissions from wildfires can represent a significant percent of overall emissions for a given state or region.
As previously noted, decision makers in Oregon assume that the net effect of these GHG accounting entries are on average, negative – meaning that the forest sector as a whole is responsible for sequestering more carbon dioxide than it emits in a given year. The assumption is based on a single Greenhouse Gas Inventory of Oregon’s Forests published in 2009 for the years 1990 to 2002.18
As shown in Figure 1, the GHG inventory showed a negative forest carbon flux for most study years but a positive spike of 7.00 million metric tons (MMT) CO2-e in 2002 (3-year average). Emissions from timber harvest (including carbon stores in long-lived wood products) dropped
17 Van der Lugt, P., J.G. Vogtlander, J.H. van der Vegte, J.C. Brezet. 2011. Life Cycle Assessment and Carbon Sequestration: The Environmental Impact of Industrial Bamboo Products. Zwagg, the Netherlands: MOSO Research and Development Center. 18 Kelly, Peter 2013, Note 7.
Figure 1: Oregon GHG Inventory Results, 3-year rolling averages
-80.00
-60.00
-40.00
-20.00
0.00
20.00
40.00
MM
T C
O2-
e
Oregon Forest Sector GHG Emissions 1990-2002
NEP
Timber
Wildfire
Net C-Flux

6
during the early 1990s but have leveled off since that time in the 16 MMT CO2-e range. Emissions from wildfire were insignificant for most years but increased for 2001 and 2002 when they rose to 6.87 MMT CO2-e in 2002, largely attributable to the Biscuit Fire in southern Oregon. Notably, these findings are similar to related studies using alternative forest carbon datasets that showed the loss of “high-biomass” (older) forests to logging on private lands exceeded that of fire across all ownerships.19 While the 2009 GHG analysis for Oregon forests is certainly useful, it was never designed for use as policy, nor should it be. There are too many unwarranted assumptions and accounting irregularities that were never vetted. Moreover, even if the inventory were accurate for 1990 to 2002, it notes an alarming trend that continues today – that of rapidly decreasing carbon sequestration and increasing carbon flux. Due to industrial forest practices and a warming and drying climate, conditions in all likelihood have worsened since that time and imply that net emissions are consistently positive, and significant, at least on industrial forestlands. The timber industry is, in fact, a significant source of greenhouse gas emissions There are three key assumptions that render the 2009 GHG analysis for Oregon forests invalid for use by policy makers. First, the inventory assumes that the dramatic trend of steadily declining NEP and increasing carbon flux noted between 1996 and 2002 was an aberration. The report simply concludes “[t]he end of the study period indicates that Oregon’s forests became a
source rather than a sink for CO2 , due to a combination of low forest growth (due to dry weather) and high fire emissions. The 2001 and 2002 removals from the carbon pool are abnormal, however, and it is expected that future years will show that Oregon’s forests revert to being a carbon sink.”20 Almost every future year since the analysis was completed has been
dry, warm, and characterized by more frequent wildfires (Figure 2). Statewide precipitation totals were well below average in 2004, 2007, 2008, 2009, 2013 and 2015 to date.21 The year 2015 is
19 Krankina, O.N., D.A. DellaSala, J. Leonard, and M. Yatskov. 2014. High-biomass forests of the Pacific Northwest: who manages them and how much is protected? Environmental Management 54:112-121. 20 Kelly, 2013, Note 18 at 5. 21 NOAA maintains a useful web portal for monitoring statewide precipitation and temperature trends. These data are available at: http://www.ncdc.noaa.gov/cag/time-series/us.
115,180 243,740
449,749 443,496
295,095
88,225 137,938
523,065
630,849
863,821
0
200,000
400,000
600,000
800,000
1,000,000
Oregon Wildfires (3-year rolling average acreage burned)
Figure 2: Oregon Wildfire Trends

7
currently the fifth driest year since record keeping began. Temperatures through the entire period (2002-2015) have been well above historical averages. Rather than an aberration, the trend towards lower NEP and higher carbon flux as climate change continues to unfold is in all likelihood an unfortunate long-term trend. Secondly, and an assumption which had no actual basis in fact was that forest cover is static and that land use changes make no significant contribution to emissions. The inventory states: “[t]he
model fixes the total forested land in Oregon at the 2001 estimates for the purposes of scaling up from site surveys. Forested land lost due to land- use change has been constant and small relative to Oregon’s total forest land, and so is not considered a primary driver of the emissions profile of Oregon’s forests.”22 In other words, the report simply assumes that since the amount of land in Oregon zoned for
forest uses has changed little, that actual forest cover has changed little as well. This is a serious source of error that results in significant over-estimation of NEP since loss of forest cover (deforestation) irrespective of how land is zoned is a significant source (roughly 10%) of global GHG emissions. The reality is that Oregon, since 2000, has lost over 1.08 million acres of forest cover (Figure 3) according to annual satellite measurements available through the World Resources Institute’s Global Forest Watch database.23 More than half of this loss took place on state and private timberlands in western Oregon where it is almost entirely attributable to clearcutting far beyond the rate of forest regrowth.24 Other factors include fire and urbanization. The third erroneous aspect of the official inventory, is the lumping of all forestland owners into one aggregate category called the “forest sector” when in fact from a proper GHG accounting stance it is important to separate out emissions from the timber industry from the carbon
22 Kelly, 2013, Note 7 at 11. 23 The online portal for the Global Forest Watch program is accessible at: http://www.globalforestwatch.org/. 24 Talberth, John and Erik Fernandez. 2015. Deforestation, Oregon Style. Lake Oswego, OR: Center for Sustainable Economy. Available online at: http://sustainable-economy.org/deforestation-oregon-style/.
23.80
22.99
22.80
22.72
22.00
22.25
22.50
22.75
23.00
23.25
23.50
23.75
24.00
Oregon Forest Cover Trend 2000-2014 (Million acres meeting minimum forest cover definition)
Figure 3: Oregon Forest Cover Trends

8
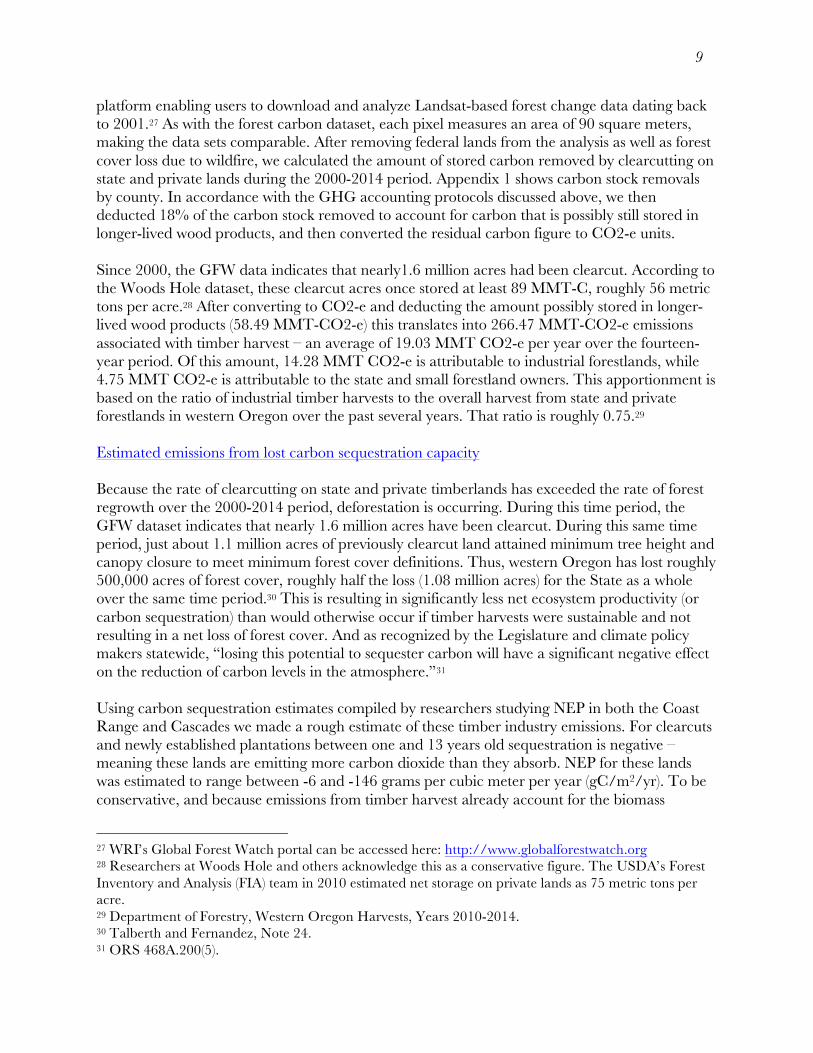
sequestered on lands protected and sustainably managed by non-profit organizations, small landowners, and government. These protected lands exist and sequester as much carbon as they do despite, and not because of the timber industry’s management decisions. The irony of the current assumption is that the segment of the forest sector that is responsible for substantial GHG emissions is able to “take credit” for the emissions reductions of actors outside the industry – actors that are in constant political struggles to protect forests from industry’s reach. This is directly analogous to a scenario whereby the fossil fuel industry could deduct from its emissions inventory the carbon sequestered by lands and waters inside the Arctic National Wildlife Refuge, marine sanctuaries, and other protected marine ecosystems. Taken together, these erroneous assumptions included in the 2009 GHG inventory underscore the necessity of accurate annual accounting of the timber industry’s GHG emissions in Oregon rather than continuing to assume these emissions are negligible. Here, we completed a preliminary analysis of such emissions over the 2000-2014 timber period for State and private forestlands in western Oregon. We estimated gross emissions from three sources: (1) timber harvest; (2) lost sequestration capacity, and (3) forest pesticides, herbicides, and fertilizers. We then adjusted these gross emissions figures to account for NEP on lands not affected by timber harvest during this time period to estimate average annual carbon flux. We completed this analysis for industrial timberlands alone and for all State and private forestlands together in western Oregon. Estimated emissions from timber harvest To estimate emissions associated with timber harvest, we overlaid two spatial data sets depicting forest carbon stocks in 2000 and another depicting forest cover loss attributable to clearcutting between 2000 and 2014. For initial forest carbon stocks, we relied on the Woods Hole Research Center’s high resolution National Biomass and Carbon Dataset for the year 2000 (published in 2012) the first ever spatially explicit inventory of its kind.25 The dataset was produced as part of a project funded under NASA’s Terrestrial Ecology Program with additional support from the Landscape Fire and Resource Management Planning Tools Project (LANDFIRE). The project has generated a high-resolution year-2000 baseline estimate of basal area-weighted canopy height, aboveground live dry biomass, and standing carbon stock for the conterminous United States. The inventory estimates carbon stocks per square meter with a 90 square meter resolution. For forest cover change, we made use of satellite-based data made available by the World Resources Institute (WRI), through its Global Forest Watch (GFW) Program.26 The GFW hosts a
25 Kellndorfer, J., Walker, W., LaPoint, E., Bishop, J., Cormier, T., Fiske, G., Hoppus, M., Kirsch, K., and Westfall, J. 2012. NACP Aboveground Biomass and Carbon Baseline Data (NBCD 2000), U.S.A., 2000. Data set. Available on-line at http://daac.ornl.gov from ORNL DAAC, Oak Ridge, Tennessee, U.S.A. http://dx.doi.org/10.3334/ORNLDAAC/1081. 26 Hansen, M. C., P. V. Potapov, R. Moore, M. Hancher, S. A. Turubanova, A. Tyukavina, D. Thau, S. V. Stehman, S. J. Goetz, T. R. Loveland, A. Kommareddy, A. Egorov, L. Chini, C. O. Justice, and J. R. G. Townshend. 2013. “High-Resolution Global Maps of 21st-Century Forest Cover Change.” Science 342 (15 November): 850–53. Data available on-line from: http://earthenginepartners.appspot.com/science-2013-global-forest.
9
platform enabling users to download and analyze Landsat-based forest change data dating back to 2001.27 As with the forest carbon dataset, each pixel measures an area of 90 square meters, making the data sets comparable. After removing federal lands from the analysis as well as forest cover loss due to wildfire, we calculated the amount of stored carbon removed by clearcutting on state and private lands during the 2000-2014 period. Appendix 1 shows carbon stock removals by county. In accordance with the GHG accounting protocols discussed above, we then deducted 18% of the carbon stock removed to account for carbon that is possibly still stored in longer-lived wood products, and then converted the residual carbon figure to CO2-e units. Since 2000, the GFW data indicates that nearly1.6 million acres had been clearcut. According to the Woods Hole dataset, these clearcut acres once stored at least 89 MMT-C, roughly 56 metric tons per acre.28 After converting to CO2-e and deducting the amount possibly stored in longer-lived wood products (58.49 MMT-CO2-e) this translates into 266.47 MMT-CO2-e emissions associated with timber harvest – an average of 19.03 MMT CO2-e per year over the fourteen-year period. Of this amount, 14.28 MMT CO2-e is attributable to industrial forestlands, while 4.75 MMT CO2-e is attributable to the state and small forestland owners. This apportionment is based on the ratio of industrial timber harvests to the overall harvest from state and private forestlands in western Oregon over the past several years. That ratio is roughly 0.75.29 Estimated emissions from lost carbon sequestration capacity Because the rate of clearcutting on state and private timberlands has exceeded the rate of forest regrowth over the 2000-2014 period, deforestation is occurring. During this time period, the GFW dataset indicates that nearly 1.6 million acres have been clearcut. During this same time period, just about 1.1 million acres of previously clearcut land attained minimum tree height and canopy closure to meet minimum forest cover definitions. Thus, western Oregon has lost roughly 500,000 acres of forest cover, roughly half the loss (1.08 million acres) for the State as a whole over the same time period.30 This is resulting in significantly less net ecosystem productivity (or carbon sequestration) than would otherwise occur if timber harvests were sustainable and not resulting in a net loss of forest cover. And as recognized by the Legislature and climate policy makers statewide, “losing this potential to sequester carbon will have a significant negative effect on the reduction of carbon levels in the atmosphere.”31 Using carbon sequestration estimates compiled by researchers studying NEP in both the Coast Range and Cascades we made a rough estimate of these timber industry emissions. For clearcuts and newly established plantations between one and 13 years old sequestration is negative – meaning these lands are emitting more carbon dioxide than they absorb. NEP for these lands was estimated to range between -6 and -146 grams per cubic meter per year (gC/m2/yr). To be conservative, and because emissions from timber harvest already account for the biomass
27 WRI’s Global Forest Watch portal can be accessed here: http://www.globalforestwatch.org 28 Researchers at Woods Hole and others acknowledge this as a conservative figure. The USDA’s Forest Inventory and Analysis (FIA) team in 2010 estimated net storage on private lands as 75 metric tons per acre. 29 Department of Forestry, Western Oregon Harvests, Years 2010-2014. 30 Talberth and Fernandez, Note 24. 31 ORS 468A.200(5).

10
decaying on-site we simply assume it is zero. For newly established plantations between 14 and 29 years the NEP estimates are 389 gC/m2/yr in the Coast Range and 254 gC/m2/yr in the western Cascades. And for stands 30-99 years old the estimates were 299 and 354 gC/m2/yr for the Coast Range and Cascades, respectively.32 We used the 30-99 age class NEP figures to represent what the level of sequestration would be on lands deforested (i.e. experiencing forest cover loss) during the 2000 and 2014 timber period or still too young (aged 1-13 years) to achieve positive NEP. We then accounted for the increase in sequestration associated with forest cover that was reestablished during this time period and old enough (14+ years) to achieve positive sequestration status to determine the net effect. We applied the mean NEP estimates for the 14-29 year age class to these lands. Both forest loss and forest gain figures were segregated between the Coast Range and Cascades to make use of the different NEP estimates, and also disaggregated to the county level. The results indicate that loss of sequestration capacity associated with clearcutting beyond the rate of forest regrowth on state and private lands in western Oregon is responsible for 3.57 MMT-CO2-e emissions per year at this time above and beyond the emissions associated with timber harvest. Of this amount, 2.68 MMT-CO2-e is attributable to practices on industrial timberlands while 0.89 MMT CO2-e is attributable to state and small forestland owners. Estimated emissions from forest pesticides, herbicides, and fertilizers Estimating emissions from forest pesticides, herbicides, and fertilizers is difficult because there is no regular reporting of annual applications. There are, however, a few periodic estimates we can make use of as well as the rates of application recommended on product labels. For forest chemicals, the three most common applied regularly include Atrazine, 2,4 D, and Glyphosate. There are at least two applications of this chemical cocktail on all lands newly clearcut. Atrazine is typically applied at a rate of 2 kilograms (kg) per acre while both 2,4 D and Glyphosate are applied at a rate of 0.91 kg per acre. The most ubiquitous fertilizer applied to forestlands is Urea, and is applied at a rate of 91 kg per acre. The carbon content of these chemicals and fertilizers has been calculated and published in the scientific literature. The relevant units are kilograms carbon per kilogram product (kg/kg). The respective values are reported to be 3.8 kg/kg for Atrazine, 1.7 kg/kg for 2,4 D, 9.1 kg/kg for Glyphosate, and 1.3 kg/kg for Urea.33 In terms of annual acres treated, we assume there have been two applications on each acre of newly clearcut and replanted land in the 2000-2014 period for chemicals and continuation of an overall application rate on state and private forestlands (95,000 acres per year) for Urea recently documented by researchers at the U.S. Geological Survey.34 Taken together, this suggests total emissions of 56,710 metric tons CO2-e annually associated with chemicals and fertilizers on state and private forestlands in western Oregon. Of
32 All these NEP estimates were taken from Turner, David P., Michael Guzy, Michael A. Lefsty, William D. Ritts, Steve Van Tutyl and Beverly E. Law. 2004. Monitoring forest carbon sequestration with remote sensing and carbon cycle modeling. Environmental Management 33 (4): 457-466. 33 Lal, R. 2004. Carbon emissions from farm operations. Environmental International 30: 981-990. 34 Anderson, Chauncey W. 2002. Ecological Effects on Streams from Forest Fertilization – Literature Review and Conceptual Framework for Future Study in the Western Cascades. Portland, OR: US Department of Interior, US Geological Survey.

11
this amount, 42,532 metric tons CO2-e is attributable to applications on industrial forestlands while 14,178 metric tons CO2-e is attributable to state and non-industrial forestland owners. Net ecosystem productivity on lands not affected by timber harvest The biggest unknown in this analysis is the amount of carbon sequestered (NEP) by lands not affected by timber harvest. Under a proper GHG accounting framework, emissions from timber harvest and chemicals for any particular owner should be offset by the amount of carbon sequestered on that owner’s residual lands. But there are no reliable NEP estimates for Oregon’s forests that distinguish between categories of private forestland ownership (i.e State, industrial vs. non-industrial) and as they stand now, GHG accounting frameworks inappropriately lump all forest sector owners together. However, the apportionment of NEP between owners can at least be estimated based on the amount of land they manage and maintain as forest cover.35 To do this, we relied on two separate sources of NEP information. The first is the data relied upon in the 2009 inventory, prepared by the Oregon-California (ORCA) carbon assessment project at the Oregon State University.36 For Oregon’s 28 million acres of forestland as a whole the three-year rolling average NEP for 2002 was calculated as -16.50 MMT-CO2-e. It is reasonable to assume that this average NEP did not increase since that time due to consistently warmer, drier conditions. We can therefore use this figure to “distribute” NEP among owners. For state and private lands in western Oregon, if we first back out acres on industrial vs. state and non-industrial that were clearcut or newly replanted during the 2000-2014 period (because these lands are net emissions sources) and then proportionally allocate NEP among these ownership categories,37 it suggests an average of -1.12 MMT-CO2-e for private industrial forestlands in western Oregon, and -2.15 MMT-CO2-e on forestlands managed by state and non-industrial owners. The second method relies on information from a somewhat more recent (2003-2007) NEP analysis for forests in northern California, Oregon and Washington within the range of the northern spotted owl.38 While the analysis distinguishes between private and public ownerships, it does so at this regional scale and so may miss significant differences in forest practices among the
35 The method of apportionment probably over-estimates NEP on industrial forestlands since these lands are managed far more intensively that lands managed by the state or other owners. But in the absence of specific data, we err on the conservative side. 36 Oregon State University, Department of Forest Ecosystems and Society. ORCA (Oregon and California) Synthesis of Remote Sensing and Field Observations to Model and Understand Disturbance and Climate Effects on the Carbon Balance of Oregon and Northern California. Beverley Law, Principal Investigator. Project summary online at: http://terraweb.forestry.oregonstate.edu/orca.htm. 37 Forestland ownership acres in western Oregon and (%) of Oregon’s total are: Federal - 7.9 million acres (28%); State and other public – 1 million acres (4%); Private industrial – 3.2 million (11%); private non-industrial – 3.2 million (11%). Source: Campbell, Sally, Dave Azuma and Dale Weyermann. 2004. Forests of Western Oregon: An Overview. PNW-GTR-525. Portland, OR: USDA Forest Service, Pacific Northwest Research Station. 38 Turner, David P., William D. Ritts , Zhiqiang Yang, Robert E. Kennedy, Warren B. Cohen, Maureen V. Duane, Peter E. Thornton and Beverly E. Law. 2011. Decadal trends in net ecosystem production and net ecosystem carbon balance for a regional socioecological system. Forest Ecology and Management 262 (2011): 1318-1325.

12
states. For private lands, the analysis reports an average NEP of -42.24 MMT-CO2-e for 18.7 million acres. Distributing this proportionally suggests an average of -4.43 MMT-CO2-e on industrial forestlands in western Oregon and -8.48 MMT-CO2-e on forestlands managed by State and non-industrial owners. Estimates of average annual carbon flux across ownerships 2000-2014 Tables 2 and 3, below, tie all this information together. For two ownership categories – industrial and State/non-industrial forestland owners – we report annual average emissions from timber harvest, deforestation, and forest chemicals and fertilizers as well as adjustments to account for carbon stored in long lived wood products and sequestered on residual lands not affected by timber harvest during the 2000 to 2014 period. We use two different NEP assumptions as previously discussed based on the ORCA analysis (Table 2) and the Turner et al. (2011) analysis (Table 3). As shown in Table 2, both industrial forestlands and those managed by state and non-industrial owners are likely a significant source of carbon dioxide emissions at 19.39 MMT-CO2-e using the ORCA NEP assumption, but industry emissions (15.88 MMT-CO2-e) outpace those of state and other private owners (3.69 MMT-CO2-e) by a factor of 4.3. As shown in Table 3, only industrial forestlands are likely a significant source of carbon dioxide emissions at 12.57 MMT-CO2-e using the Turner et al. (2011) NEP assumption, but state and non industrial owners are a net emissions sink at -2.82 MMT CO2-e. Combined, overall emissions from state and private forestlands in western Oregon are 9.75 MMT CO2-e. How do these emissions stack up against emissions of other sectors?
Table 2: Carbon Flux Annual Average 2000 – 2014 with ORCA NEP
(Western Oregon state and private forestlands MMT-CO2-e)
GHG accounting component Industry State/non-industry Total Emissions from timber harvest 17.41 5.80 23.21 Emissions from lost carbon sequestration 2.68 0.89 3.57 Emissions from chemicals and fertilizers .04 0.2 .06 Net wood product sink (3.13) (1.05) (4.18) Net ecosystem productivity (1.12) (2.15) (3.27) Net carbon flux (emissions) 15.88 3.69 19.39
Table 3: Carbon Flux Annual Average 2000 – 2014 with Turner et al. NEP (Western Oregon state and private forestlands MMT-CO2-e)
GHG accounting component Industry State/non-industry Total Emissions from timber harvest 17.41 5.80 23.21 Emissions from lost carbon sequestration 2.68 0.89 3.57 Emissions from chemicals and fertilizers .04 .02 .06 Net wood product sink (3.13) (1.05) (4.18) Net ecosystem productivity (4.43) (8.48) (12.91) Net carbon flux (emissions) 12.57 (2.82) 9.75
13
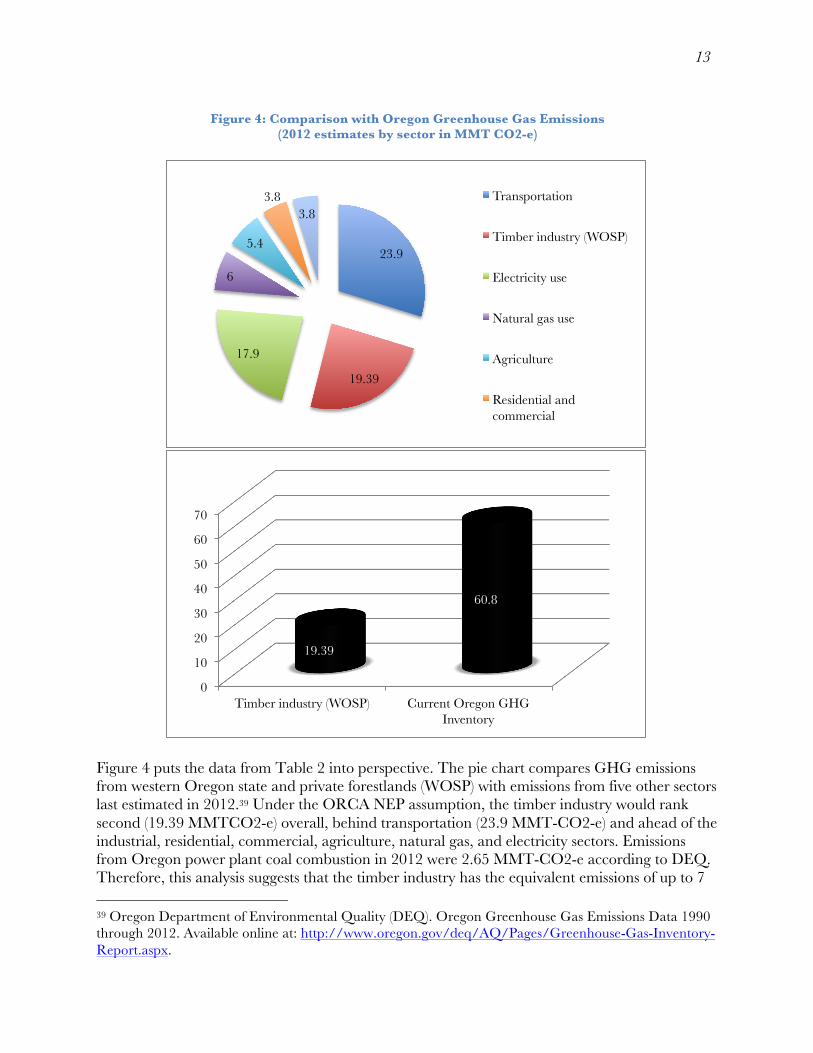
Figure 4: Comparison with Oregon Greenhouse Gas Emissions
(2012 estimates by sector in MMT CO2-e)
Figure 4 puts the data from Table 2 into perspective. The pie chart compares GHG emissions from western Oregon state and private forestlands (WOSP) with emissions from five other sectors last estimated in 2012.39 Under the ORCA NEP assumption, the timber industry would rank second (19.39 MMTCO2-e) overall, behind transportation (23.9 MMT-CO2-e) and ahead of the industrial, residential, commercial, agriculture, natural gas, and electricity sectors. Emissions from Oregon power plant coal combustion in 2012 were 2.65 MMT-CO2-e according to DEQ. Therefore, this analysis suggests that the timber industry has the equivalent emissions of up to 7 39 Oregon Department of Environmental Quality (DEQ). Oregon Greenhouse Gas Emissions Data 1990 through 2012. Available online at: http://www.oregon.gov/deq/AQ/Pages/Greenhouse-Gas-Inventory-Report.aspx.
23.9
19.39
17.9
6
5.4
3.8 3.8
Transportation
Timber industry (WOSP)
Electricity use
Natural gas use
Agriculture
Residential and commercial
0
10
20
30
40
50
60
70
Timber industry (WOSP) Current Oregon GHG Inventory
19.39
60.8

14
coal-fired power plants. These emissions are also equivalent to putting 2-4 million new vehicles on the road.40 If the timber industry’s emissions were counted, Oregon’s overall emissions would rise to 80.19 MMT-CO2-e, far surpassing the historical peak emissions of 71.9 MMT CO2-e in 1999. The column chart compares timber industry WOSP emissions with GHG emissions estimated in 2012 for the five other sectors. The timber industry’s emissions represent 32% of the current state’s inventory under the ORCA NEP analysis. This drops to 16% of state emissions under the Turner et al. (2011) NEP approach. Either way, it is likely that current emissions from logging activities on state and private lands in western Oregon is a significant source that should be addressed and mitigated in the state’s climate agenda.
State and private forest practices undermine climate adaptation goals In addition to generating significant GHG emissions, clearcutting on state and private forestlands in western Oregon is undermining climate adaptation goals that seek to protect rural communities from the risks of wildfires, floods and landslides, degradation of water supplies, and loss of critical natural resources like fisheries and forest health.41 Current forest practices that include short rotations, extensive timber plantations, clearcutting, and a rapid rate of harvest
maintain lands in a high-risk condition for all these threats due to homogenization of fuel loads and retention of logging slash on site among other factors.42 Rapid clearcutting on state and private forestlands has transformed vast areas of more fire-resistant native forests into open brush fields and dense young tree plantations that are more prone to explosive, hot crown fires that kill more trees and spread fires faster and farther.43 As noted by the US Forest Service in an evaluation of
the 2003 fire season “plantations experienced a disproportionately high amount of stand- crown 40 Calculated using the EPA’s greenhouse gas equivalences calculator at: http://www2.epa.gov/energy/greenhouse-gas-equivalencies-calculator 41 Department of Land Conservation and Development (DLCD). 2010. The Oregon Climate Change Adaptation Framework. Salem, OR: DLCD. 42 Odion, D.C., J.R. Strittholt, H. Jiang, E. Frost, D.A. DellaSala, and M. Moritz. 2004. Fire severity patterns and forest management in the Klamath National Forest, northwest California, USA. Conservation Biology 18:927-936. 43 Odion, D.C., J.R. Strittholt, H. Jiang, E. Frost, D.A. DellaSala, and M. Moritz. 2004. Fire severity patterns and forest management in the Klamath National Forest, northwest California, USA. Conservation Biology 18:927-936
Figure 5: Dense, young timber plantations exacerbate fire risk.

15
fires as compared to older, unmanaged forests… Plantations had a tendency to increase the rate of fire spread and increased the overall area of stand-replacement fire effects by spreading to neighboring stands.”44 The vast network of clearcuts and logging roads present on state and private forestlands also presents a big risk for landslides, especially during extreme precipitation events such as the 1996 floods. Under almost all climate change scenarios for Oregon, the frequency of these events will increase even if overall precipitation patterns remain unchanged. Maintenance of strong root systems is an important factor in stabilizing soils during these events. Clearcutting reduces the strength of these root systems dramatically, and thus is a major factor in increased landslide risk.45 Logging roads channel water runoff and result in debris torrents that can travel many miles downstream, pick up momentum, and cause widespread destruction.46 Studies indicate that clearcuts exhibit landslide rates up to 20 times higher than the background rate. Near logging roads, landslide rates are up to 300 times higher than forested areas.47 Increasing water temperatures are another climate change challenge worsened by current practices on state and private lands. On these lands, practices that are consistent with the Oregon Forest Practices Act (OFPA)’s no-cut buffer restrictions of 20 feet or less for most streams and rivers can be expected to increase mean water temperatures by 2.61 °F over and above ambient warming due to climate change.48 The consequences of warmer waters were apparent in the summer of 2015 when over half of the Columbia River basin’s 500,000 spawning sockeye salmon were thought to have died due to stream temperatures that passed the 70 °F threshold of concern. Similar heat related die-offs have been noted for the Klamath River. Policy reforms can transform forest practices from an emissions source to a sink Oregon’s State and private forests are faced with a significant choice in policy direction. On the one hand, the State can no longer avoid emissions from logging as these are likely 7 times greater than the annual power plant emissions from the Boardman coal fired plant and will be a significant impediment to achieving the State’s emissions goals. On the other hand, State and private forests contain significant amounts of stored and sequestered carbon that could be part of the solution to reducing GHG emissions. There are many short and long term policy reforms the State can pursue to address this urgent challenge and help expedite the transition of State and private forestlands from a significant net source to an increasingly vital sink for GHG emissions 44 USDA Forest Service, Umpqua National Forest. 2003. Wildfire Effects Evaluation Project. Roseburg, OR: USDA Forest Service, Umpqua National Forest. 45 Schmidt, K.M, J. J. Roering, J.D. Stock, W.E. Dietrich, D.R. Montgomery and T. Schaub. 2001. “The variability of root cohesion as an influence on shallow landslide susceptibility in the Oregon Coast Range.” Can. Geotech. J (38): 995-1024. 46 Swanson, F. J., J. L. Clayton, W. F. Megahan and G. Bush. 1989. “Erosional processes and long-term site productivity,” pp. 67-81 in Maintaining the Long-Term Productivity of Pacific Northwest Forest Ecosystems. D. A. Perry, R. Meurisse, B. Thomas, R. Miller, J. Boyle, J. Means, C.R. Perry, R. F. Powers, eds. Portland, Oregon: Timber Press. 47 Heiken, Doug. 2007. Landslides and Clearcuts: What Does the Science Really Say? Eugene, OR: Oregon Wild. 48 Oregon Department of Forestry. 2015. Riparian Rule Analysis: Analysis of riparian prescriptions and expected changes in restrictions. Salem, OR: Oregon Department of Forestry.

16
in the years ahead. It is beyond the scope of this report to provide an in-depth treatment, but five key areas of reform are immediately obvious. 1. Account for the timber industry’s emissions. The timber industry should be treated like any other sector in Oregon that has significant GHG emissions. Those emissions should be monitored and included in the state’s regular inventory, last published in 2012. HB3543 requires the Oregon Global Warming Commission to track and evaluate “[g]reenhouse gases emitted by various sectors of the state economy…” as well as “the carbon sequestration potential of Oregon’s forests” on a continuous basis and report the results of this monitoring to the legislature in odd numbered years.49 Including the timber industry’s emissions and the adverse impacts of unsustainable forest practices on the carbon sequestration and carbon storage potential of Oregon’s forests will be an important first step in achieving the forest sector goals outlined in the Roadmap 2020. In calculating these emissions, and as demonstrated here, it is of the utmost importance to distinguish between various forestland ownerships so that those owners who are responsible for emissions and lost sequestration and storage capacity are no longer able to mask the impacts of their management activities by, in effect, claiming credit for carbon sequestered or stored on forests the industry had nothing to do with protecting. 2. Promote alternatives to short rotations, clearcutting, and chemicals. Oregon’s climate legislation also requires the Oregon Global Warming Commission to track and evaluate “alternative methods of forest management that can increase carbon sequestration and reduce the loss of carbon sequestration to wildfire.”50 Long rotations and alternatives to clearcutting and chemical spraying should be high on the list of such strategies the OGWC pursues with the Department of Forestry and other agencies since these techniques can help transform the industrial forestlands from a source to a sink for GHG emissions and help rebuild forest structure to be more tolerant of drought and wildfire.51 For instance, if timber harvest rates were lengthened by 50 years compared to status quo logging, carbon stores would increase by 15%, thereby reducing emissions52. 3. Manage state forests to maximize their carbon storage value. State-owned forests make up just 10% of the land base in western Oregon but are the only forests managed under the Oregon Forest Practices Act that can be controlled directly by public decision makers and managed for public benefits. Ostensibly, these lands are managed to achieve the greatest permanent value to all Oregonians. As provided in the governing statutes and regulations, “greatest permanent value” means healthy, productive, and sustainable forest 49 ORS 468A.250 (f); (i). 50 ORS 468A.250 (i). 51 Von Hagen, Bettina and Michael S. Burnett. 2003. Emerging Markets for Carbon Stored by Northwest Forests. Chapter 8 in OFRI, Forests, Carbon and Climate Change: A Synthesis of Scientific Findings. Corvallis, OR: Oregon Forest Resources Institute (OFRI) 52 Hudiburg, T., et al. 2009. Carbon dynamics of Oregon and Northern California forests and potential land-based carbon storage. Ecol. Applic. 19:163-180; Law, B. et al. 2001. Carbon storage and fluxes in ponderosa pine forests at different developmental stages. Global Change Biology 7:755-777.

17
ecosystems that over time and across the landscape provide a full range of social, economic, and environmental benefits to the people of Oregon.53 But recent forest planning efforts have, instead, focused on strategies that continue the conversion of these lands into industrial tree plantations managed on short (40-60 year) rotations. As discussed here, such management strategies will increase GHG emissions, reduce sequestration capacity, and undermine climate adaptation goals. In a recent testimony and analysis provided to the Board of Forestry, CSE demonstrated how long rotations can achieve the greatest permanent value standard by maximizing the value of carbon stored, the value of the land for conservation purposes and the value of standing timber because state forests would contain more volume and command higher market value as prime veneer logs rather than logs only suitable for pulp, paper, and other low value products (Figure 6).54 These simple win-win solutions for climate and state forests should be vigorously explored and implemented.
Figure 6: Long Rotations and State Forest Asset Value
4. Close tax loopholes that increase emissions from industrial forestlands. Oregon’s forestland tax structure encourages practices that generate GHG emissions. In 1999, the Legislature, at former Governor Kitzhaber’s behest, exempted large, industrial forestland owners (> 5,000 acres) from paying the timber harvest privilege tax (a tax on volume removed)
53 ORS 530.0505; OAR 629-035-0000 et seq. 54 Talberth, John. 2015. Testimony of Dr. John Talberth Before the Board of Forestry, Subcommittee on Alternative Forest Management Plans for Northwest State Forests, October 19th.
$40 $815 $2,390 $4,299 $6,501
$8,586
$2,997 $4,495
$5,994
$7,492
$8,990
$10,489
$883 $1,052
$1,315
$1,526
$1,736
$1,988
$0
$5,000
$10,000
$15,000
$20,000
$25,000
40 80 120 160 200 240
Rotation Length (Years)
NW Planning Area Suitable Timberland Base Asset Value by Rotation Age
($ Millions)
Conservation
Carbon
Timber

18
while keeping that tax intact for small forestland owners.55 As demonstrated in this analysis, this is exactly the opposite of a tax structure to incentivize carbon storage since it is the small, non-industrial forestland owners that are managing their lands better from a GHG emissions standpoint. All forestland owners also receive major tax breaks under Oregon’s Forestland and Small Tract Forestland programs.56 Property tax breaks of 90% are provided to any land managed for timber production regardless of the condition of that land. Ending the practice of applying this tax break to open clearcuts and logging roads would generate tremendous revenues for the state, counties, and the school system, help incentivize carbon storage, and provide badly needed funds for climate adaptation. There are many other options for modernizing Oregon’s outdated Forest Practices Act, timber tax codes, and other aspects of the regulatory framework to help fulfill HB3543’s mandate to enroll Oregon’s forests in the fight against global warming. Over the next year, CSE and Geos Institute will be exploring these reforms in more detail.
55 For a brief overview of this tax break, see Keene, Roy. 2015. “Elliott State Forest sale won’t solve anything.” Guest Opinion. Eugene: Eugene Register Guard. 56 A description of the programs are accessible online at: http://www.oregon.gov/dor/TIMBER/Pages/forestland.aspx.

19
Appendix 1
Clatsop
6.9 Columbia
4.3
Tillamook
4.4Washington
3.7Multnomah
0.3
Clackamas
3.2
Yamhill
2.6
Marion
1.7Polk
3.7
Lincoln
4.2 Linn
6.1
Benton
2.8
Lane
11.4
Douglas
12.8
Coos
7.7
Jackson
3.1Curry
2.3
Josephine
1.2
Forest Carbon Loss by County in Western Oregon
2000-2013, Non-Federal Lands
County Lines
Areas of Carbon Loss
0 12.8
Million Metric Tons of Carbon Lost
µ
Map Notes:Map represents tons of forestcarbon loss per county, it thereforeskews somewhat based on overallsize of the county. Larger countiesare more likely to have more forestcarbon loss. Data Sources include:Woods Hole Research Center, BLM, Oregon Wild, ESRI, andGlobal Forest Watch.