livrepository.liverpool.ac.uklivrepository.liverpool.ac.uk/7193/4/abdul-kareemihs_may2012_7193.pdf ·...
TRANSCRIPT

I
TITLE
Investigating Structural Plasticity In Musicians’ Brains
Using Structural Magnetic Resonance And Diffusion
Tensor Imaging Techniques
Supervisors
DR VANESSA SLUMING
PROFESSOR ANDREJ STANCAK
Thesis submitted in accordance with the requirements of the University of
Liverpool for the degree of Doctor in Philosophy
IHSSAN ADEEB ABDUL-KAREEM
MAY 2012

II
DECLARATION
This thesis is the result of my own work. The material contained in this thesis has
not been presented, nor is currently being presented, either wholly or in part, for
any other degree or qualification.
(IHSSAN ADEEB ABDUL-KAREEM) (DR. VANESSA SLUMING)
STUDENT SUPERVISOR

III
DEDICATION
This work is dedicated
To the soul of my mother, GOD bless her
To my beloved wife
To my lovely sons, Ahmed and Yousif

IV
ACKNOWLEDGMENTS
I would like to thank all those who helped me throughout the preparation of my
thesis. Specifically, I would like to thank my supervisors Dr Vanessa Sluming, Dr
Andrej Stancak and Dr Laura Parkes. Special thanks to Dr Vanessa who was very
kind, considerate and knowledgeable supervisor.
I would like to thank Jamaan AlGhamdi for his technical support and advice
regarding software use and image analysis. I would like to acknowledge Mrs Val
Adams, the radiographer at MARIARC for her kind help in subject recruitment ad
scanning. I would also like to thank all subjects who volunteered to do this
research, their time was most valued.
The time I spent here in the city of Liverpool was fascinating. The knowledge I got
was splendid. It was a wonderful experience that I will remember throughout my
entire life.

V
TABLE OF CONTENTS
TITLE I
DECLARATION II
DEDICATION III
ACKNOWLEDGMENT IV
TABLE OF CONTENTS V
INDEX OF TABLES XIV
INDEX OF FIGURES XV
ABBREVIATIONS XVII
ABSTRACT XIX
CHAPTER ONE - INTRODUCTION 1
1.1 AIM 2
1.2 OVERVIEW OF THE PRESENT WORK 2
1.3 STRUCTURE OF THE THESIS 5
1.4 PEER REVIEWED JOURNAL ARTICLES PUBLISHED DURING THE PHD STUDY 5
1.5 ROLE OF CO-AUTHORS IN PUBLISHED ARTICLES 6
1.6 RELEVANT ANATOMY 7
1.6.1 GROSS ANATOMY OF THE BRAIN 7
1.6.2 MICROSCOPIC ANATOMY OF THE BRAIN 7
1.6.3 THE BROCA’S AREA 8
1.6.3.1 THE PARS OPERCULARIS 8
1.6.3.2 THE PARS TRIANGULARIS 8
1.6.3.3 MICROSCOPIC ANATOMY OF POP AND PTR 9
1.6.3.4 CONNECTIONS OF POP AND PTR 9
1.6.4 THE CORPUS CALLOSUM 9
1.6.5 THE CEREBELLUM 12
1.6.5.1 CEREBELLAR PEDUNCLES 12
1.6.5.2 CEREBELLAR AFFERENTS 12
1.6.5.3 CEREBELLAR EFFERENTS 13

VI
1.7 NEUROPLASTICITY 15
1.7.1 OVERVIEW AND BACKGROUND 15
1.7.2 PRINCIPLES OF EXPERIENCE-DEPENDENT NEUROPLASTICITY 16
1.7.2.1 ENRICHED ENVIRONMENT 16
1.7.2.2 SPECIFICITY 17
1.7.2.3 REPETITION OF STIMULATION 18
1.7.2.4 INTENSITY OF STIMULATION 18
1.7.2.5 EFFECT OF AGE 19
1.7.3 MECHANISMS OF NEUROPLASTICITY AT MICROSCOPIC LEVEL 20
1.7.4 PHYSIOLOGICAL MECHANISMS OF NEUROPLASTICITY 21
1.7.4.1 SYNAPTIC STRENGTHENING: LONG-TERM POTENTIATION 21
1.7.4.2 SYNAPTIC ELIMINATION/WEAKENING: LONG-TERM DEPRESSION 22
1.7.5 STRUCTURAL MECHANISMS OF NEUROPLASTICITY 23
1.7.5.1 SYNAPTOGENESIS AND SYNAPSE REMODELING 23
1.7.5.2 NEUROGENESIS 24
1.7.6 NEUROPLASTICITY AT MACROSCOPIC LEVEL 26
CHAPTER 2 - REVIEW OF LITERATURE 30
2.1 AIM 31
2.2 THE MUSICIAN’S BRAIN AS AN IDEAL MODEL TO STUDY PLASTICITY 31
2.3 STRUCTURAL EVIDENCE OF PLASTICITY IN THE MUSICIAN’S BRAIN 33
2.3.1 THE AUDITORY SYSTEM 35
2.3.2 THE MOTOR SYSTEM 36
2.3.3 THE CORPUS CALLOSUM 39
2.4 FUNCTIONAL EVIDENCE OF PLASTICITY IN THE MUSICIAN’S BRAIN 40
2.4.1 AUDITORY AND SOMATOSENSORY SYSTEMS 40
2.4.2 AUDITORY-SOMATOSENSORY INTEGRATION 41
2.4.3 THE MOTOR SYSTEM 42
2.4.4 AUDITORY-MOTOR INTEGRATION 42
2.4.5 VISUOSPATIAL COGNITION 43
2.5 FACTORS GOVERNING USE-DEPENDENT NEUROPLASTICITY IN MUSICIANS 51

VII
2.5.1 AGE OF STARTING MUSICAL TRAINING 51
2.5.2 DURATION OF MUSICAL TRAINING AND PRACTICE INTENSITY 51
2.5.3 MUSICAL EXPERTISE 52
2.5.4 TYPE OF INSTRUMENT 52
2.6 IS IT POSSIBLE TO TRANSFER NEUROPLASTIC EFFECT OF MUSIC TO NON-
MUSICIANS?
53
2.7 STATEMENT OF THE PROBLEM AND JUSTIFICATION OF THE WORK 54
2.8 SIGNIFICANCE OF THE PRESENT WORK 57
2.9 RESEARCH AIMS AND KEY OBJECTIVES 58
2.10 RESEARCH HYPOTHESES OF THE PRESENT WORK 59
2.10.1 STUDY 1-INVESTIGATING STRUCTURAL PLASTICITY OF POP AND PTR IN
MUSICIANS
59
2.10.2 STUDY 2-INVESTIGATING EFFECT OF MUSICAL EXPERTISE ON
REGIONAL MORPHOMETRY OF THE CC
60
2.10.3 STUDY 3- INVESTIGATING REGIONAL MACRO- AND MICROSTRUCTURAL
PLASTICITY OF THE CC IN MUSICIANS
61
2.10.4 STUDY 4-INVESTIGATING PLASTICITY OF CEREBELLAR WHITE MATTER
IN MUSICIANS
62
CHAPTER 3 - GENERAL METHODS 63
3.1 AIM 64
3.2 COHORTS EXAMINED IN THE PRESENT WORK 64
3.3 EXAMINATIONS PERFORMED IN EACH COHORT 66
3.4 MR DATA ACQUISITIONS OBTAINED IN THE PRESENT WORK 67
3.5 IMAGE ANALYSIS METHODS APPLIED IN THE PRESENT WORK 68
3.5.1 METHODS USED IN MORE THAN ONE STUDY 68
3.5.2 METHODS PRESENTED IN SPECIFIC CHAPTERS 68
3.6 PRINCIPLES OF STEREOLOGY 70
3.7 THE CAVALIERI METHOD 70
3.7.1 VOLUME ESTIMATION IN MR IMAGES 72
3.8 STEREOLOGICAL MEASUREMENTS PERFORMED IN THE PRESENT WORK 74
3.9 MEASUREMENT OF INTRACRANIAL VOLUME 74
3.9.1 IMAGE PRE-PROCESSING 74
3.9.2 DEFINITION OF INTRACRANIAL VOLUME 76
3.9.3 STEREOLOGICAL PARAMETERS FOR INTRACRANIAL VOLUME 76

VIII
MEASUREMENT
3.9.4 STEREOLOGICAL MEASUREMENTS 76
3.10 MEASUREMENT OF CROSS-SECTIONAL AREA OF CC REGIONS 80
3.10.1 IMAGE PRE-PROCESSING 80
3.10.2 CROSS-SECTIONAL AREA MEASUREMENT 81
3.11 INTRODUCTION TO PRINCIPLES OF DIFFUSION TENSOR IMAGING 84
3.11.1 OVERVIEW OF DIFFUSION TENSOR IMAGING 84
3.12 DIFFUSION OF WATER AND DIFFUSION-WEIGHTED IMAGING 84
3.12.1 DIFFUSION OF WATER 84
3.12.2 ISOTROPIC AND ANISOTROPIC DIFFUSION 85
3.12.3 DIFFUSION-WEIGHTED IMAGE ACQUISITION 87
3.12.4 QUANTITATION OF ADC BY MRI 91
3.12.5 ESTIMATION OF THE DIFFUSION TENSOR 92
3.12.6 COLOUR-CODED MAPS OF THE DIFFUSION TENSOR 93
3.13 QUANTITATIVE DTI-DERIVED METRICS 96
3.13.1 TRACE OF THE TENSOR 96
3.13.2 MEAN DIFFUSIVITY 96
3.13.3 FRACTIONAL ANISOTROPY AND RELATIVE ANISOTROPY 96
3.14 INTERPRETATION OF DTI-DERIVED METRICS 97
3.15 DTI-BASED TRACTOGRAPHY 98
3.16 FIBER TRACKING METHODOLOGIES 99
3.16.1 DETERMINISTIC FIBER TRACKING 99
3.16.1.1 TERMINATION CRITERIA 100
3.16.1.2 PLACEMENT OF THE SEED VOXELS 100
3.16.2 PROBABILISTIC FIBER TRACKING 103
3.17 VALIDATION OF DTI-BASED TRACTOGRAPHY 104
3.18 ANALYSIS OF DTI DATA IN THE PRESENT WORK 105
3.18.1 DTI DATA PRE-PROCESSING 105
3.18.2 TRACTOGRAPHY PARAMETERS 106
3.18.3 TRACTOGRAPHY OF THE CORPUS CALLOSUM, SUPERIOR
CEREBELLAR PEDUNCLE AND MIDDLE CEREBELLAR PEDUNCLE
106
CHAPTER 4 - INVESTIGATING STRUCTURAL PLASTICITY OF PARS OPERCULARIS & PARS TRIANGULARIS IN MUSICIANS
108
4.1 ABSTRACT 108
4.2 INTRODUCTION 110
4.2.1 SEGREGATION OF PARS OPERCULARIS AND PARS TRIANGULARIS 111
4.2.2 AUTOMATIC-MANUAL CROSS-VALIDATION OF BROCA’S AREA
MORPHOMETRY
112

IX
4.2.3 HYPOTHESIS 114
4.3 SUBJECTS AND METHODS 115
4.3.1 SUBJECTS 115
4.3.1.1 MUSICIANS’ PROFILES 115
4.3.2 MR DATA ACQUISITION 117
4.4 METHODS 117
4.4.1 MEASUREMENT OF INTRACRANIAL VOLUME 117
4.4.2 MEASUREMENT OF GM/WM VOLUMES OF POP AND PTR 117
4.4.2.1 IMAGE PRE-PROCESSING 117
4.4.2.2 DEFINITION OF POP AND PTR 118
4.4.2.3 STEREOLOGICAL PARAMETERS 118
4.4.2.4 STEREOLOGICAL MEASUREMENT 119
4.4.3 INTER- AND INTRA-RATER RELIABILITY 119
4.4.4 IDENTIFICATION OF THE DIAGONAL SULCUS IN PARS OPERCULARIS 130
4.4.5 MEASUREMENT OF CORTICAL SURFACE AREA 132
4.4.5.1 IMAGE PRE-PROCESSING 132
4.4.5.2 TALAIRACH TRANSFORMATION 132
4.4.5.3 CORTEX-BASED ALIGNMENT 136
4.4.5.4 QUANTITATIVE MEASUREMENT OF CORTICAL SURFACE AREAS 140
4.4.6 STATISTICAL ANALYSIS 143
4.5 RESULTS 144
4.5.1 MEASUREMENT OF INTRACRANIAL VOLUME 144
4.5.2 VOLUME MEASUREMENTS OF POP AND PTR 144
4.5.2.1 EXCLUSION OF CASES FROM VOLUME MEASUREMENT 144
4.5.2.2 COMPARISON OF GM/WM VOLUMES 144
4.5.3 INTRA- AND INTER-RATER STUDY 145
4.5.4 CORTICAL SURFACE AREA MEASUREMENTS OF BA44 AND BA45 145
4.6 DISCUSSION 152
4.6.1 TECHNICAL LIMITATIONS 158
4.6.1.1 MEASUREMENT OF PARS OPERCULARIS AND PARS
TRIANGULARIS VOLUMES
156
4.6.1.2 CORTICAL SURFACE AREA MEASUREMENT OF BA44/45
4.7 CONCLUSION
158
160
CHAPTER 5 - INVESTIGATING THE EFFECT OF MUSICAL EXPERTISE
ON REGIONAL MORPHOMETRY OF THE CORPUS CALLOSUM
161
5.1 ABSTRACT 162
5.2 INTRODUCTION 163

X
5.2.1 HYPOTHESIS 165
5.3 SUBJECTS AND METHODS 166
5.3.1 SUBJECTS 166
5.3.1.1 MUSICIANS’ PROFILES 166
5.3.2 MR DATA ACQUISITION 107
5.4 METHODS 168
5.4.1 MEASUREMENT OF INTRACRANIAL VOLUME 168
5.4.2 MEASUREMENT OF CROSS-SECTIONAL AREAS OF CC REGIONS 168
5.4.3 INTRA- AND INTER-RATER RELIABILITY 168
5.4.4 STATISTICAL ANALYSIS 168
5.5 RESULTS 170
5.5.1 MEASUREMENT OF INTRACRANIAL VOLUME 170
5.5.2 COMPARISON OF REGIONAL CROSS-SECTIONAL AREAS OF THE CC 170
5.5.3 INTER- AND INTRA-RATER STUDY 170
5.6 DISCUSSION
5.6.1 WITELSON’S VERSUS DTI-BASED PARCELLATION OF CC TOPOGRAPHY
5.6.2 INCREASED CC1 AND CC4 SIZE IN PROFESSIONAL MUSICIANS
5.6.3 METHODOLOGICAL CONSIDERATIONS AND LIMITATIONS OF THE STUDY
5.7 CONCLUSION
174
174
176
180
181
CHAPTER 6 - INVESTIGATING REGIONAL MACRO- & MICROSTRUCTURAL PLASTICITY OF THE CORPUS CALLOSUM IN MUSICIANS
182
6.1 ABSTRACT 183
6.2 INTRODUCTION
6.2.1 HYPOTHESIS
185
187
6.3 SUBJECTS AND METHODS 188
6.3.1 SUBJECTS 188
6.3.1.1 MUSICIANS’ PROFILE 188
6.3.2 MR DATA ACQUISITION 190
6.3.2.1 HIGH RESOLUTION STRUCTURAL SCANS AT 3 TESLA 190
6.3.2.2 DIFFUSION-WEIGHTED MR DATA ACQUISITION 190
6.4 METHODS 191
6.4.1 MEASUREMENT OF INTRACRANIAL VOLUME 191
6.4.2 MEASUREMENT OF CROSS-SECTIONAL AREA OF CC REGIONS 191
6.4.3 DTI DATA ANALYSIS 192
6.4.3.1 PRE-PROCESSING OF DTI DATA 192
6.4.3.2 TRACTOGRAPHY PARAMETERS 192
6.4.3.3 FIBER TRACTOGRAPHY OF CC REGIONS 192

XI
6.4.4 INTRA- AND INTER-RATER RELIABILITY 193
6.4.4.1 MEASUREMENT OF CROSS-SECTIONAL AREAS OF CC REGIONS 193
6.4.4.2 FIBER TRACTOGRAPHY OF THE CC 193
6.4.5 STATISTICAL ANALYSIS 193
6.5 RESULTS 196
6.5.1 MEASUREMENTS OF INTRACRANIAL VOLUME 196
6.5.2 FIBER TRACTOGRAPHY OF THE CC 196
6.5.3 COMPARISON OF REGIONAL MACRO- AND MICROSTRUCTURAL
MEASURES OF THE CC
196
6.5.4 INTRA- AND INTER-RATER STUDY 197
6.5.5 CORRELATION BETWEEN MACROSTRUCTURE (CROSS-SECTIONAL
AREA) AND MICROSTRUCTURE (AVERAGE FA) ACROSS SUBJECTS
197
6.6 DISCUSSION 202
6.6.1 MUSICIANS SHOWED EVIDENCE OF MACRO- AND MICROSTRUCTURAL
PLASTICITY IN CC4 REGION
202
6.6.2 LACK OF SIGNIFICANT GENDER EFFECT ON MACRO- AND
MICROSTRUCTURE OF THE CC
207
6.6.3 TECHNICAL LIMITATIONS OF THE PRESENT STUDY 208
6.6.3.1 ISSUE OF CROSSING FIBERS 208
6.6.3.2 SENSITIVITY TO SUBJECT MOTION 210
6.6.3.3 EFFECT OF NOISE AND LOW SIGNAL-TO-NOISE RATIO ON DTI 211
6.6.3.4 ISSUE OF MAGNETIC SUSCEPTIBILITY EFFECTS 212
6.6.3.5 ISSUE OF EDDY CURRENTS 213
6.6.3.6 ANALYSIS OF DTI DATA 214
6.6.3.7 INTERPRETATION OF TRACTOGRAPHY RESULTS 215
6.6.3.8 COMPARISON WITH PREVIOUS STUDIES 216
6.6.3.9 VALIDATION OF DTI-BASED TRACTOGRAPHY
6.7 CONCLUSION
216
216
CHAPTER 7 - INVESTIGATING STRUCTURAL PLASTICITY OF
CEREBELLAR WHITE MATTER IN MUSICIANS
218
7.1 ABSTRACT 219
7.2 INTRODUCTION
7.2.1 HYPOTHESIS
221
224
7.3 SUBJECTS AND METHODS 225
7.3.1 SUBJECTS 225
7.3.1.1 MUSICIANS’ PROFILE 225
7.3.2 MR DATA ACQUISITION 227

XII
7.3.2.1 HIGH RESOLUTION STRUCTURAL SCANS 227
7.3.2.2 DIFFUSION-WEIGHTED MR DATA ACQUISITION 227
7.4 METHODS 228
7.4.1 MEASUREMENT OF INTRACRANIAL VOLUME 228
7.4.2 DTI DATA ANALYSIS 228
7.4.2.1 PRE-PROCESSING OF DTI DATA 228
7.4.2.2 TRACTOGRAPHY PARAMETERS 228
7.4.2.3 FIBER TRACTOGRAPHY OF THE SCP AND MCP 228
7.4.3 INTRA- AND INTER-RATER RELIABILITY 230
7.4.4 MEASUREMENT OF GM AND WM VOLUMES OF CEREBELLUM 230
7.4.5 STATISTICAL ANALYSIS 231
7.5 RESULTS 232
7.5.1 MEASUREMENT OF INTRACRANIAL VOLUME 232
7.5.2 RECONSTRUCTION OF THE SCP AND MCP 232
7.5.2.1 EXCLUSION OF CASES FOR TRACTOGRAPHY 232
7.5.2.2 COMPARISON OF SCP AND MCP TRACTOGRAPHY MEASURES 232
7.5.3 INTRA- AND INTER-RATER RELIABILITY 233
7.5.4 COMPARISON OF GM AND WM VOLUMES OF RIGHT AND LEFT
CEREBELLAR HEMISPHERES
233
7.6 DISCUSSION 241
7.6.1 THE CEREBELLUM IS CRUCIAL FOR MUSICAL PERFORMANCE 242
7.6.2 LACK OF GM DIFFERENCES IN CEREBELLAR HEMISPHERES BETWEEN
GROUPS
245
7.6.3 CEREBELLAR ASYMMETRY 246
7.6.3.1 EFFECT OF HANDEDNESS ON CEREBELLAR ASYMMETRY 247
7.6.3.2 STRUCTURAL ASYMMETRY IN MUSICIANS’ BRAINS 248
7.6.4 TECHNICAL LIMITATIONS OF THE PRESENT STUDY
7.7 CONCLUSION
249
252
CHAPTER 8 - GENERAL DISCUSSION, CONCLUSION AND RECOMMENDATION
253
8.1 AIM 254
8.2 GENERAL DISCUSSION 254
8.2.1 STUDY 1- INVESTIGATING STRUCTURAL PLASTICITY OF POP AND PTR IN
MUSICIANS
254
8.2.2 STUDY 2- INVESTIGATING EFFECT OF MUSICAL EXPERTISE ON REGIONAL
CALLOSAL MORPHOMETRY
254
8.2.3 STUDY 3- INVESTIGATING REGIONAL MACRO- AND MICROSTRUCTURAL
PLASTICITY OF THE CC IN MUSICIANS
255

XIII
8.2.4 STUDY 4- INVESTIGATING PLASTICITY OF CEREBELLAR WM IN
MUSICIANS
255
8.3 REGIOONAL CC MORPHOMETRY IN MUSICIANS, COMPARISON OF RESULTS IN
COHORT 2 AND 3A
256
8.4 FACTORS CONTROLLING NEUROPLASTICITY IN MUSICIANS 259
8.5 ISSUE OF BRAIN DEVELOPMENT 261
8.5.1 THE CEREBELLUM 261
8.5.2 THE CORPUS CALLOSUM 261
8.6 ARE THESE STRUCTURAL CHANGES REPRESENT USE-DEPENDENT PLASTICITY
OR GENETIC PREDISPOSITION FOR MUSIC?
263
8.7 CONCLUSION 265
8.8 RECOMMENDATIONS FOR FUTURE STUDIES 266
REFERENCES 268
APPENDIX 303

XIV
INDEX OF TABLES
TABLE NO TITLE PAGE NO
Table 2.1 Summary of previous neuroimaging studies comparing
musicians and controls
45
Table 3.1 Summary of image acquisitions performed in the present work 67
Table 3.2 Summary of cohorts, measurements, and image analysis
softwares
69
Table 4.1 Demographics of subjects recruited in this study 116
Table 4.2 Orthogonal views used to localize landmark points for Talairach
transformation
133
Table 4.3 The frequency percentage of diagonal sulci in right and left POP
in both groups.
150
Table 5.1 Demographics of subjects recruited in the present study 167
Table 5.2 Instrument specialty of all musicians 167
Table 6.1 Demographics of subjects recruited in this study 189
Table 6.2 Means ± standard deviations of cross-sectional areas and
tractography derived metrics
198
Table 7.1 Demographics of subjects recruited in this study
226

XV
INDEX OF FIGURES
FIGURE NO TITLE PAGE NO
Fig.1.1 A three dimensional (3D) display of the left cerebral hemisphere 11
Fig.1.2 The superior and middle cerebellar peduncles 14
Fig.3.1 The basis of Cavalieri sections method of volume estimation 71
Fig.3.2 The grid system used for estimating slice volumes 73
Fig.3.3 Method of brain realignment according to the bicommissural
plane
75
Fig.3.4 Illustration of Intracranial volume measurement using Cavalieri
method with point counting
79
Fig.3.5 Criteria for selecting the midsagittal slice 82
Fig.3.6 Method of subdividing the CC on midsagittal T1-weighted MR
image
83
Fig.3.7 Illustration of isotropic unrestricted diffusion, isotropic restricted
diffusion, and anisotropic restricted diffusion
86
Fig.3.8 Illustration of the spin echo, single shot echo-planar imaging 89
Fig.3.9 A diagram demonstrating the relationship between diffusion of
water molecules and gradient applications
92
Fig.3.10 Classes of diffusion tensor ellipsoids 94
Fig.3.11 The Principle of DTI 95
Fig.3.12 A schematic illustration of the FACT algorithm 102
Fig.4.1 Depiction of pars opercularis and pars triangularis on the left
hemisphere of one subject
121
Fig.4.2 Demonstration of pars opercularis and pars triangularis volume
estimation using stereology
122
Fig.4.3 Demonstration of gray matter volume measurement of left POP
using stereology.
126
Fig.4.4 Demonstration of gray matter volume measurement of left PTR
using stereology
129
Fig.4.5 The diagonal sulcus 131
Fig.4.6 Talairach transformation 135
Fig.4.7 Segmentation of the cerebral cortex 138
Fig.4.8 Steps of cortex-based alignment of the left hemisphere of one
subject
142
Fig.4.9 Mean ± 95% confidence intervals of pars opercularis and pars
triangularis gray matter volume measurements
146

XVI
Fig. 4.10 Mean ± 95% confidence intervals of pars opercularis and pars
triangularis white matter volume measurements
147
Fig.4.11 A graph showing the correlation between left pars opercularis
gray matter volume and years of musical performance in
musicians
148
Fig.4.12 Depiction of pars opercularis on three dimensional displays of
left hemispheres of age-matched musicians and controls
149
Fig.4.13 Mean ± 95% confidence intervals of Right and left BA44/45
cortical surface area measurements
151
Fig.5.1 Means ± 95% confidence intervals for ICV in the three groups
examined in the present study
171
Fig.5.2 Mean ± 95% confidence intervals of cross sectional areas of
callosal regions in professional musicians, amateurs and
controls
172
Fig.5.3 Mid-sagittal MR sections showing the corpus callosum in a
professional musician, an amateur and a control subject.
173
Fig.6.1 Regional tractography of the corpus callosum 195
Fig.6.2 A graph showing correlation between age of starting musical
training and cross sectional area of splenium.
199
Fig.6.3 Illustration of regional corpus callosum tractography in 6 subjects 200
Fig.6.4 Illustration of regional corpus callosum tractography in a non-
musician and non-musician subject
201
Fig.7.1 Fibre tracking of the superior cerebellar peduncle 234
Fig 7.2 Fibre tracking of the middle cerebellar peduncle 235
Fig.7.3 Tractography of the superior and middle cerebellar peduncles 236
Fig.7.4 Demonstration of middle cerebellar peduncle and superior
cerebellar peduncles tractography in 6 subjects.
237
Fig.7.5 Means ± 95% confidence intervals of average fractional
anisotropy, tract volume and number of streamlines of superior
cerebellar peduncle
238
Fig.7.6 Means ± 95% confidence intervals of average fractional
anisotropy, tract volume and number of streamlines of middle
cerebellar peduncle
239
Fig.7.7 Means ± 95% confidence intervals of gray and white matter
volumes of right and left cerebellar hemispheres.
240

XVII
ABBREVIATIONS
AP
AC
ACPC
ADC
AMPA
CC
CST
DF
DTI
DTT
DWI
EEG
FA
fMRI
GM
ICV
ICC
IFG
LTD
LTP
MARIARC
MRI
MPRAGE
MEG
MIT
MCP
Mm
MANOVA
NMDA
PET
POP
PTR
PoCG
PC
PrCG
ROI
Absolute pitch
Anterior commissure
Anterior commissure-posterior commissure
Apparent diffusion coefficient
α-amino-3-hydroxy-5-methyl-4-isoxazolepropionic acid
Corpus callosum
Corticospinal tract
Degree of freedom
Diffusion tensor imaging
Diffusion tensor tractography
Diffusion- weighted image
Electroencephalography
Fractional anisotropy
Functional magnetic resonance imaging
Gray matter
Intracranial volume
Intraclass correlation coefficient
Inferior frontal gyrus
Long-term depression
Long-term potentiation
Magnetic Resonance And Image Analysis Research centre
Magnetic resonance imaging Magnetization-Prepared Rapid Gradient-Echo imaging Magnetoencephalography Melodic intonation therapy Middle cerebellar peduncle Millimetre Multivariate analysis of variance N-methyl-D-aspartate Positron emission tomography Pars opercularis Pars triangularis Postcentral gyrus Posterior commissure Precentral gyrus Region of interest

XVIII
RA
SNR
SPGR
SD
SCP
T
3D
VBM
WM
Relative anisotropy Signal to noise ratio Spoiled gradient echo Standard deviation Superior cerebellar peduncle Tesla Three dimensional Voxel based morphometry White matter

XIX
Investigating Structural Plasticity In Musicians’ Brains Using Structural
Magnetic Resonance And Diffusion Tensor Imaging Techniques
IHSSAN ADEEB ABDUL-KAREEM
ABSTRACT
Neuroplasticity is the ability of the brain to change its structure and/or function in response to environmental stimuli. It is implicated in many processes, such as learning, maturation, skill acquisition, and rehabilitation following brain injury. With the advent of neuroimaging techniques, the study of neuroplasticity and its mechanisms have fascinated researchers given the wide scope with which this process is involved. Musicians have long been considered an ideal model to study neuroplasticity in humans. It has been shown that musicians with their early, intensive, and multimodal skilful practice have structural plasticity in different brain regions. The objective of this work was to extend these structural studies through examining different cohorts of musicians, using a multitude of imaging and morphometric techniques, and performing novel examinations of brain regions essential for enabling high level musical performance such as Broca’s area, corpus callosum (CC), and cerebellum. Three age-, gender- and handedness-matched cohorts were examined. The first cohort included 26 orchestral musicians and 26 non-musicians. High resolution T1-weighted structural MR images were acquired to measure gray and white matter volumes and cortical surface area of Broca’s area subparts: pars opercularis/BA44 and pars triangularis/BA45. The second cohort included 12/12/12 professional musicians/amateur musicians/non-musicians. High resolution T1-weighted MR images were acquired to measure cross-sectional areas of four regions of the midsagittal CC: CC1 (rostrum/ genu/anterior body), CC2 (anterior midbody), CC3 (posterior midbody), and CC4 (isthmus and splenium). In the third cohort, 12/12 musicians and non-musicians were examined. High resolution T1-weighted structural MR images were acquired to measure cross-sectional areas of CC1-CC4 regions; and diffusion tensor imaging-based tractography was used to measure average fractional anisotropy (FA), mean diffusivity (MD), tract volume, and number of streamlines of the same regions. In a subset (10/10) of this cohort, high resolution structural scans were used to measure gray and white matter volumes of cerebellar hemispheres; and diffusion tensor imaging-based tractography was used to measure average FA, tract volume, and number of streamlines of superior (SCP) and middle (MCP) cerebellar peduncles. Outcome measures were compared between groups. Compared to controls, musicians possessed greater gray matter volume and cortical surface area of left pars opercularis/BA44 in the first cohort. The volume of left pars opercularis was positively correlated with years of musical performance. Professional musicians possessed greater cross-sectional area of CC1 and CC4 regions compared to amateurs and non-musicians in the second cohort. In the third cohort, musicians possessed greater cross-sectional area, average FA/tract volume/number of streamlines, and lower MD in CC4 region. There was a negative correlation between cross-sectional area of CC4 region and age of starting musical training. There was a positive correlation between average FA values and cross-sectional area of CC4 region in all subjects. In addition, musicians had increased white matter volume of the right cerebellar hemisphere, increased tract volume and number of streamlines of right SCP, and tract volume of right MCP. I hypothesize that these findings represent use-dependent structural plasticity imposed by musical performance. At the microscopic level, these macroanatomical changes may reflect increased synaptogenesis and dendritic growth, generation of new axon collaterals, and formation of new neurons, which would support enhanced functional demands on musicians’ brains.

1
CHAPTER 1 INTRODUCTION-
OVERVIEW, RELEVANT ANATOMY & NEUROPLASTICITY

Introduction
2
1.1 AIM
This chapter is divided into three main parts. The first part presents a general overview
of the present work, structure of the thesis, and role of co-authors in published articles.
The second part provides an overview of anatomy of brain structures examined in this
work namely, Broca’s area, corpus callosum (CC), and cerebellum. The third part
provides a detailed description of experience-dependent neuroplasticity including its
principles, microscopic mechanisms, and macroanatomical evidence of neuroplasticity
in the human brain as revealed by neuroimaging studies.
1.2 OVERVIEW OF THE PRESENT WORK
The term ‘neuroplasticity’ describes structural-functional adjustment or adaptation of the
brain to environmental stimuli, such as maturation, learning, and skill acquisition, or a
compensation of some cerebral structures for injured parts (Zilles, 1992, Rauschecker,
1995). This concept, being critically involved in health and disease, has fascinated
scientists to explore its underlying mechanisms and events. Until 1970, the common
belief was that the nervous tissue is static throughout adult life; however, experiments
performed on animals showed that adult brain has the lifelong ability for structural and
functional reorganization induced by learning and skill acquisition. Postmortem
examination of specimens obtained from actively trained animals has shown clear
evidence of microstructural plasticity in the form of dendritic growth and axonal
sprouting (Pascual-Leone et al., 1994, Hallett, 1995, Pascual-Leone et al., 2005), which
could not be demonstrated in inactive animals (Black et al., 1990, Anderson et al., 1996,
Kleim et al., 1998a, Anderson et al., 2002, Swain et al., 2003, Kleim et al., 2004,
Matsuzaka et al., 2007). Furthermore, there is convincing evidence that new neurons
could be generated in response to increased functional demands (Gould et al., 1999b,
Alvarez-Buylla and Garcia-Verdugo, 2002, Duchesne et al., 2002, Fowler et al., 2002,
Rakic, 2002). With the emergence of neuroimaging modalities notably, magnetic
resonance imaging (MRI), neuroscientists were fascinated to investigate training-
induced plastic changes in the human brain. Experiments were conducted on subjects

Introduction
3
with various professions, such as taxi drivers (Maguire et al., 2000, Maguire et al.,
2006b), basket ball players (Park et al., 2006), jugglers (Draganski, 2004), and
mathematicians (Aydin et al., 2007). However, musicians emerged as an ideal model to
study plasticity in the human brain. First, they commonly start their training at an early
age when many brain structures are still vulnerable to plastic changes. Second, their
practice involves the acquisition of multimodal skills, including sensory, motor, auditory,
and visuospatial skills, which should be synchronized and refined to produce the finest
outcome. Third, they continue to practice even outside their working hours unlike
subjects from other professions. In this contest, tens of structural (Schlaug et al., 1995a,
Schlaug et al., 1995b, Keenan et al., 2001, Schmithorst and Wilke, 2002, Sluming et al.,
2002, Gaser and Schlaug, 2003, Hutchinson et al., 2003, Bengtsson et al., 2005, Imfeld
et al., 2009) and functional (Sergent et al., 1992, Elbert et al., 1995, Koeneke et al.,
2004, Vuust et al., 2005, Bangert et al., 2006, Limb et al., 2006, Magne et al., 2006,
Baumann et al., 2007, Sluming et al., 2007, Watanabe et al., 2007) studies were
conducted during the last two decades to investigate neuroplasticity in musicians.
Results revealed structural-functional changes in musicians relative to controls in
different brain regions, including the motor cortex, auditory cortex, prefrontal cortex,
inferior frontal gyrus, superior parietal lobule, cerebellum, CC, and corticospinal tract. In
addition, professional musicians exhibited evidence of cross-modal integration essential
for enabling high level musical performance, such as auditory-somatosensory (Schulz
et al., 2003), auditory-motor (Bangert et al., 2006, Baumann et al., 2007), and visual-
motor integration (Sluming et al., 2007). The correlation of these findings with musical
expertise, age of commencing musical tuition, duration of musical performance, and
instrument specialty has led to the assumption that they represent use-dependent
adaptations imposed by enriched environment in the form of musical practice. In
addition to providing compelling evidence of neuroplasticity in the human brain, results
of these studies may enhance our understanding of the mechanisms of music-brain
interaction, which might have useful applications in health and disease. From the
structural point of view, there is much work to be done to expand our knowledge about
structural plasticity in musicians’ brains particularly in Broca’s area, cerebellum, and CC

Introduction
4
regions, which are crucial for musical performance. Thus, I set the goal to extend the
literature through using structural MR and diffusion tensor imaging (DTI) techniques to
perform novel investigations of structural plasticity in these regions. A shared
characteristic of these regions is their considerable connections with several brain parts.
Additionally, recent functional studies have assigned diverse musically-relevant
functions to these regions justifying structural examinations performed in the current
work. Four studies were conducted in the present work:
Study 1- Investigating structural plasticity of Broca’s area subparts: pars opercularis
(POP) and pars triangularis (PTR) in musicians. In this study, gray matter (GM)
volumes, white matter (WM) volumes, and cortical surface areas of POP/BA44 and
PTR/BA45 were compared between musicians and non-musicians. This study is
presented in chapter 4.
Study 2- Investigating the effect of musical expertise on regional morphometry of the
CC. In this study, cross-sectional area measurements of four callosal regions were
compared between professional musicians, amateur musicians, and non-musicians.
This study is presented in chapter 5.
Study 3- Investigating regional macro- and microstructural plasticity of the CC in
musicians. The macrostructure (cross-sectional areas) and microstructure (average
fractional anisotropy (FA), mean diffusivity (MD), tract volume, and number of
streamlines) of four callosal regions were compared between musicians and non-
musicians using structural MR and DTI-based tractography, respectively. This study is
presented in chapter 6.
Study 4- Investigating structural plasticity of cerebellar WM in musicians. In this study,
DTI-based tractography was used to compare average FA, tract volume, and number of
streamlines of SCP and MCP between musicians and non-musicians. In addition, GM
and WM volumes of cerebellar hemispheres were compared between groups. This
study is presented in chapter 7.
To perform these studies, three cohorts of age-, gender-, and handedness-matched
subjects were recruited; the first and third cohorts included musicians and non-
musicians, while the second cohort included professional musicians, amateur musicians

Introduction
5
and non-musicians. Cohorts were examined using structural MR (study 1-4) and DTI
techniques (study 3 and 4).
1.3 STRUCTURE OF THE THESIS
The thesis is divided into eight chapters. The first chapter (this chapter) provides an
introduction to the thesis, including a general overview, a brief description of relevant
anatomy, and an introduction to the principles and mechanisms of neuroplasticity. The
second chapter discusses neuroplasticity in musicians’ brains, reviews previous reports
regarding anatomical-functional plasticity in musicians, and summarizes the different
factors that govern this process in musicians. The second chapter concludes by
presenting key objectives and research hypotheses of the present work. The third
chapter presents a summary of recruited cohorts and image acquisitions, in addition
to presenting general principles of methodologies used in the current work. Methods
used in more than one study are mentioned in chapter three, and are referred to when
presenting individual studies in subsequent chapters. The fourth, fifth, sixth, and
seventh chapters present the four studies conducted in the present work, respectively.
To comply with University of Liverpool guidelines, chapters 4-7 are presented in a
‘ready to submit’ style with an abstract, introduction, subjects and methods, results,
discussion, and conclusion sections. A general discussion, conclusion, and
recommendations for future studies are presented in chapter eight. All references are
cited at the end of the thesis under the ‘references’ section using the referencing style
of the ‘Journal of Neuroscience’. The appendix section contains published peer-
reviewed journal articles, conference papers, and abstracts.
1.4 PEER REVIEWED JOURNAL ARTICLES PUBLISHED DURING THE PHD
STUDY
Four articles were published during the PhD study period. Below I present them in a
chronological order:
• Abdul-Kareem IA & Sluming V 2009: Comparison of scanning at different field
strengths and pulse sequences using voxel-based morphometry. Proceedings

Introduction
6
of Salford Postgraduate Annual Research Conference, SPARC. University of
Salford, Manchester.
• Abdul-Kareem IA, Stancak A, Parkes LM, Sluming V 2009: Regional corpus
callosum morphometry: effect of field strength and pulse sequence. J Magn
Reson Imaging, 30 (5):1184-1190.
• Abdul-Kareem IA, Stancak A, Parkes LM, Sluming V 2011: Increased gray
matter volume of left pars opercularis in male orchestral musicians correlate
positively with years of musical performance. J Magn Reson Imaging, 33 (1):24-
32.
• Abdul-Kareem IA, Stancak A, Parkes L, Al-Ameen M, AlGhamdi J, Al-Dhafeeri
F, Embleton K, Morris D & Sluming V 2011: Plasticity of the superior and middle
cerebellar peduncles in musicians revealed by quantitative analysis of volume
and number of fibers based on diffusion tensor tractography. Cerebellum, 10:
611-623.
1.5 ROLE OF CO-AUTHORS IN PUBLISHED ARTICLES
• Vanessa Sluming, Andrej Stancak and Laura Parkes - as supervisors, they
participated in reviewing the manuscripts and provided corrections and
suggestions. Vanessa Sluming recruited subjects of the first study.
• May Al-Ameen - performed inter- and intra-rater studies.
• Jamaan AlGhamdi and Faten Aldhafeeri - provided technical help regarding the
use of FreeSurfer software to measure ICV, GM and WM volumes of cerebellar
hemispheres.
• David Morris and Karl Embleton - helped in optimizing the final diffusion-
weighted pulse sequence that was used to perform DTI examination of the CC,
superior cerebellar peduncle (SCP) and middle cerebellar peduncle (MCP).

Introduction
7
1.6 RELEVANT ANATOMY
1.6.1 GROSS ANATOMY OF THE BRAIN
The human brain is conventionally divided into three major divisions: The forebrain
(diencephalon and cerebrum), the mid brain, and the hind brain (medulla oblongata,
pons, and cerebellum). The cerebrum (figure 1.1), is the largest part of the brain
consisting of two cerebral hemispheres connected by the CC. The surface of each
hemisphere (the cortex) is composed of GM, which contains neurons supported by
neuroglia. The cerebral cortex is thrown into gyri and sulci, thereby increasing its
surface area. Within the hemisphere is a central core of WM, which is composed of
myelinated nerve fibers of different diameters supported by neuroglia (Williams et al.,
1995, Snell, 2001, Kiernan, 2005).
1.6.2 MICROSCOPIC ANATOMY OF THE BRAIN
The basic functional unit of the brain is the neuron, which is specialized for the
reception of stimuli and the conduction of nerve impulses. Each possesses a cell body
and neuritis; the latter comprise dendrites and axons. Dendrites are responsible for
receiving information and conducting it toward the cell body; they often branch profusely
to increase surface area for the reception of axons from other neurons. The axon is a
single long tubular neurite that conducts impulses away from the cell body. A synapse is
the site where two neurons come in close proximity, and functional inter-neuronal
communications occur. Most neurons make synaptic connections to 1000 or more other
neurons and may receive up to 10,000 connections from other neurons. Communication
at a synapse takes place in one direction only (Snell, 2001). Apart from neurons, the
central nervous system also contains supporting cells, the neuroglia. Their number
exceeds that of neurons about 10-fold and constitutes about half the nervous tissue
mass. The neuroglial cell types in the central nervous system are astroglia,
oligodendroglia, and microglia (Williams et al., 1995, Snell, 2001, Kiernan, 2005).

Introduction
8
1.6.3 THE BROCA’S AREA
Broca’s area is located in the POP, Brodmann area (BA) 44 and PTR, BA45 of the
inferior frontal gyrus of the dominant hemisphere; it directs the motor area for the
production of speech (figure 1.1B). The homologue of Broca’s area in the right
hemisphere is believed to be involved in emotional aspect of speech (Williams et al.,
1995). Broca’s area is connected to the sensory (receptive) speech area by a bundle of
WM called the arcuate fasciculus. The name Broca was derived from the name of a
French neurologist, Pierre Paul Broca, who reported impairments of language in two
patients who lost the ability to speak after injury to the posterior inferior frontal gyrus of
the brain (Dronkers et al., 2007). Since then, the approximate region he identified has
become known as Broca’s area, and the deficit in language production as Broca’s
aphasia. Although traditionally considered the most important language region in the
brain, functions of Broca’s area are not limited to language (to be discussed in details in
chapter 4).
The POP is the posterior part of Broca’s area. It is bounded posteriorly by the inferior
precentral sulcus, which separates it from the precentral gyrus. Superiorly, it is
separated from the middle frontal gyrus by the inferior frontal sulcus, and anteriorly from
the PTR by the anterior ascending ramus of the Sylvian fissure (
1.6.3.1 THE PARS OPERCULARIS
Foundas et al., 1998,
Duvernoy, 1999, Tomaiuolo et al., 1999, Petrides and Pandya, 2004, Petrides, 2006).
The PTR is the anterior part of Broca’s area. It is demarcated posteriorly from the POP
by the anterior ascending ramus of the Sylvian fissure, superiorly from the middle frontal
gyrus by the inferior frontal sulcus, and anteroinferiorly by the anterior horizontal ramus
of the Sylvian fissure (
1.6.3.2 THE PARS TRIANGULARIS
Foundas et al., 1998, Duvernoy, 1999, Tomaiuolo et al., 1999,
Petrides and Pandya, 2004, Petrides, 2006).

Introduction
9
Cytoarchitectonically, BA 44 and 45 (
1.6.3.3 MICROSCOPIC ANATOMY OF POP AND PTR
Amunts et al., 1999) contain magnopyramidal cells
in lower layer III, medium-large pyramidal cells in upper layer V, and decreased cell
density in lower layer V. There is a size gradient in the cells of layer III, with the smallest
cells at its border with layer II, and the largest near layer IV. The main cytoarchitectonic
difference between areas 44 and 45 is the prominence of layer IV and the total
thickness of the cortex. In particular, layer IV in area 44 is dysgranular, and appears to
be invaded by cells from layers III and V. In area 45, layer IV is granular and more
prominent and creates a clear barrier between layers III and V. The cortex is notably
thinner in area 45 than in area 44 (Amunts et al., 1999).
It has been demonstrated that both BA 44 and 45 have distinct connections with other
cortical regions. Using DTI, it has been shown that the right and left POP are connected
with a large number of clusters in the frontal, parietal, temporal, and occipital lobes. The
right and left PTR were found to have overlapping connectivity in both hemispheres.
They are connected to the left POP, right POP, precentral gyrus, left posterior middle
temporal gyrus, posterior inferior temporal gyrus, left insula, right supramarginal gyrus,
and postcentral gyrus (
1.6.3.4 CONNECTIONS OF POP AND PTR
Xiang et al., 2009). The dorsal pathway (to the parietal lobe and
perisylvian regions in the temporal lobe) is more dominant in POP, whereas for PTR,
tracts into the dorsomedial prefrontal cortex are more prominent.
1.6.4 THE CORPUS CALLOSUM
The CC is the largest WM structure in the brain consisting of approximately 180 million
contralateral axonal projections (Blume, 1984) (figure 1.1C). It connects homologous
regions within the two cerebral hemispheres. It is divided into rostrum, genu, body,
isthmus, and splenium. The body is further divided into anterior and posterior parts (de
Lacoste et al., 1985). The rostrum and genu connect mainly prefrontal regions. The
body of the CC connects frontal and parietal regions with fibers originating in the
premotor cortices traverse the CC through the anterior part of the body, whereas

Introduction
10
primary motor, somatosensory, and posterior parietal fiber bundles traverse the CC
through the posterior part of the body. The isthmus and splenium connect temporal,
parietal, and occipital cortical regions (de Lacoste et al., 1985, Hofer and Frahm, 2006).
The fibers of the genu curve forward into the frontal lobes forming forceps minor, fibers
of the body extend laterally forming radiation of the CC, while fibers in the splenium
arch backward into the occipital lobe forming forceps major (Snell, 2001).The callosal
fibers interdigitate with association and projection fibers.
There have been few studies that examined the microscopic structure of the human CC.
One of the pioneer studies of the human CC is that of Aboitiz and colleagues (Aboitiz et
al., 1992) who performed postmortem examination of callosa of 20 subjects (10 males
and 10 females). They found that thin fibers are most dense in the genu and decrease
in density posteriorly towards the posterior body, where they reach a minimum. The
density of thin fibers increases again towards the splenium. Large-diameter fibers
showed a pattern complementary to that of thin fibers, having a peak of density in the
posterior body, and a local increase of density in the posterior pole of the CC. There
was no gender difference in fiber distribution within the CC.

Introduction
11
Fig.1.1. A, a three dimensional (3D) display of the left cerebral hemisphere
demonstrating frontal (red), parietal (yellow), temporal (green), and occipital (blue)
lobes. Numbers 1, 2, 3 represent superior, middle and inferior frontal gyri, respectively.
B, a 3D display of the left hemisphere showing Broca’s area and its subparts; POP (red)
and PTR (green). 1, inferior frontal sulcus; 2, Sylvian fissure; 3, precentral sulcus; 4,
anterior horizontal ramus; 5, anterior ascending ramus; PrCG, precentral gyrus; PoCG,
postcentral gyrus. C, a sagittal view showing the medial surface of the cerebral
hemisphere. SCP, superior cerebellar peduncle. Modified from (Netter, 2010).
4 3
5 6 7

Introduction
12
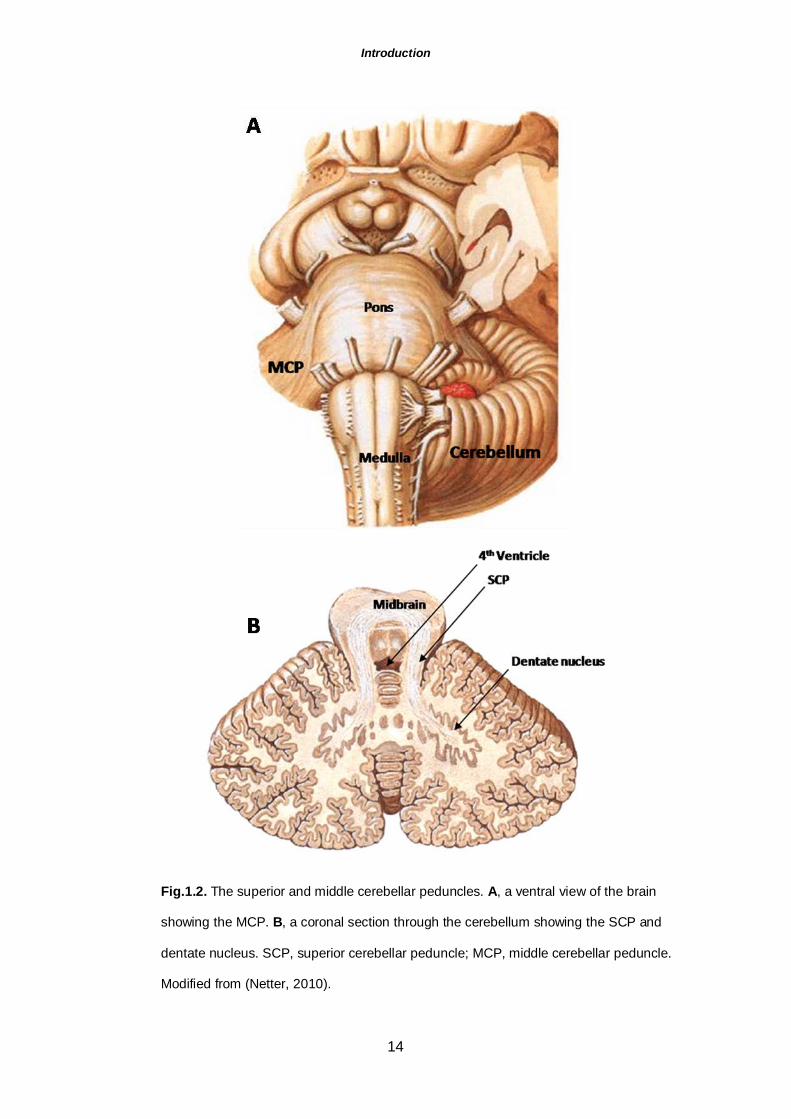
1.6.5 THE CEREBELLUM
The cerebellum (Latin for little brain), is the largest part of the hind brain. It is located in
the posterior cranial fossa. Anteriorly, the cerebellum is related to the pons and medulla
oblongata. It is connected to the midbrain, pons, and medulla oblongata by the superior
(SCP), middle (MCP), and inferior (ICP) cerebellar peduncles, respectively. The
cerebellum is surfaced with a cortex of GM underneath which lies the WM, which is
made up largely of myelinated nerve fibers running to and from the cortex. Embedded
within the WM are four deep cerebellar nuclei situated near the roof of the fourth
ventricle. The dentate nucleus is the largest of cerebellar nuclei forming a large
crenated crescent opening toward the SCP (Snell, 2001, Sinnatamby, 2006).
The SCP (figures 1.1C and 1.2B), also called the brachia conjunctiva, are two in
number emerging from the upper and medial part of the white substance of the
hemispheres, and are placed under cover of the upper part of the cerebellum. They are
joined to each other across the midline by the anterior medullary velum. As they ascend
they form the roof of the fourth ventricle. The fibers of the SCP are mainly derived from
the cells of the dentate nucleus of the cerebellum. They continue upward where the two
peduncles undergo a complete decussation ventral to the Sylvian aqueduct (
1.6.5.1 CEREBELLAR PEDUNCLES
Williams et
al., 1995, Snell, 2001). The MCP (figure 1.2A) is the largest cerebellar peduncle, which
is composed entirely of cortico-ponto-cerebellar fibers (Williams et al., 1995, Snell,
2001).
• Cerebral cortex through the cortico-ponto-cerebellar fibers. These fibers arise
from nerve cells in the frontal, parietal, temporal, and occipital lobes terminating
in pontine nuclei. The pontine nuclei give rise to transverse fibers of the pons,
which cross the midline and enter the opposite cerebellum as the MCP.
1.6.5.2 CEREBELLAR AFFERENTS
Afferent fibers to the cerebellum originate from the following regions:

Introduction
13
• Spinal cord through anterior and posterior spinocerebellar tracts, and
cuneocerebellar tract. These tracts convey unconscious muscle joint sense.
Axons of anterior spinocerebellar tract cross to the opposite side in the lateral
column of the spinal cord. They then enter the cerebellum through SCP. Axons
of the posterior spinocerebellar tract ascend in the lateral column of the spinal
cord before entering the cerebellum through the ICP.
• Vestibular nuclei
• Cerebral cortex. The most extensive cerebellar efferent connections are those
with the cerebral cortex. The cerebellum connects with the contralateral
cerebral cortex by the dentothalamic tract. Fibers arising from dentate nucleus
travel through the SCP, and cross the midline to the opposite side in the
decussation of the SCP. The fibers end by synapsing with cells in the
contralateral thalamus, and terminate in the primary motor and premotor areas
of the cerebral cortex. By this pathway, the dentate nucleus can coordinate
motor activity on the same side of the body as descending fibers from the
primary motor cortex cross to the opposite side forming the corticospinal tract,
which is the principal motor tract of the body (
1.6.5.3 CEREBELLAR EFFERENTS
Snell, 2001).
Introduction
14
Fig.1.2. The superior and middle cerebellar peduncles. A, a ventral view of the brain
showing the MCP. B, a coronal section through the cerebellum showing the SCP and
dentate nucleus. SCP, superior cerebellar peduncle; MCP, middle cerebellar peduncle.
Modified from (Netter, 2010).

Introduction
15
1.7 NEUROPLASTICITY
1.7.1 OVERVIEW AND BACKGROUND
According to Cambridge dictionary, the word plasticity is defined as the quality of being
soft enough to be changed into a new shape (Cambridge dictionaries online,
http://dictionary.cambridge.org/). A defining characteristic of the brain is its remarkable
capacity to undergo activity-dependent morphological and functional remodeling via
mechanisms of plasticity that form the basis of our capacity to encode and retain
memories. The process of neuroplasticity may occur during maturation, learning, skill
acquisition, environmental challenges, or pathology (Zilles, 1992, Lledo et al., 2006).
Through this process, neurons are able to change their function, chemical profile (such
as the amount and type of neurotransmitters), and structure (Woolf and Salter, 2000),
and can get beyond the limitations of their own genome (Pascual-Leone et al., 2005). A
comprehensive understanding of the process of neuroplasticity and its mechanisms is
therefore essential given the wide scope with which this process is implicated. The
great challenge is to manipulate neuroplasticity for optimal outcome (Pascual-Leone et
al., 2005). In rehabilitation medicine for example, the concept of neuroplasticity has
been utilized to develop novel task-oriented therapies that could help in regaining
functions following brain injury (Schneider et al., 2007, Schlaug et al., 2009, Lin et al.,
2010a).
Until around the 1970s, an accepted idea across scientific literature was that the
nervous tissue is essentially static throughout adulthood, both in terms of brain
functions, as well as the idea that it is impossible for new neurons to develop after birth.
However, over the past three decades, animal research has established two
phenomena with a profound impact for understanding neuroplasticity. The first is
significant microstructural plasticity in the adult brain, such as increased number of
synapses, increased number of glial cells, and the formation of new blood capillaries,
which account for learning and acquisition of new skills (Black et al., 1990, Anderson et
al., 1996, Kleim et al., 1998a, Anderson et al., 2002, Swain et al., 2003, Kleim et al.,
2004, Matsuzaka et al., 2007). The second is that brain re-mapping following injury

Introduction
16
could be stimulated by retraining animals to perform functions impaired by this injury
(Nudo et al., 1996). These findings supported the assumption of a permanently plastic
brain, and sparked an intense interest in studying neuroplasticity in humans.
1.7.2 PRINCIPLES OF EXPERIENCE-DEPENDENT NEUROPLASTICITY
Animal studies have indicated that the structure of the brain is, in part, a function of the
environment in which an animal has been raised. Animals raised in a complex
environment showed structural morphological changes compared to isolated rearing
(
1.7.2.1 ENRICHED ENVIRONMENT
Globus et al., 1973, Greenough and Volkmar, 1973). The concept of an enriched
environment, first described by Hebb (Hebb, 1947), is the classical and most widely
used experimental paradigm to study training-induced plasticity. Using this experimental
paradigm, scientists could compare the behavior and morphological changes of animals
living in an enriched environment with those living under the usual rather plain
conditions of laboratory housing. It has been shown that extended training, which
induces a specific brain function can lead to an enhancement of that function (Kleim
and Jones, 2008), the concept of use it and improve it. In this context, several animal
studies have reported training-induced plasticity in different brain regions (Anderson et
al., 1996, Nudo et al., 1996, Kim et al., 2002, Cuppini et al., 2007, Ferreira et al., 2010,
Real et al., 2010). For instance, monkeys trained to use a rake-shaped tool to retrieve a
piece of food placed out of reach showed stronger and denser temporo-parietal junction
connections in the intraparietal sulcus compared with naive monkeys (Hihara et al.,
2006). Furthermore, rats trained to reach outside of their cage to retrieve food rewards
were shown to have increased distal forepaw representations within the motor cortex
(Kleim et al., 1998a, Kleim et al., 2002). Behavioral developments associated with
environmental enrichment include enhanced skill learning and memory function, and
reduced age-related memory decline (Pysh and Weiss, 1979, Anderson et al., 1996,
Kleim et al., 1998b, Rampon et al., 2000, van Praag et al., 2000, Kim et al., 2002). At
the microscopic level, environmental enrichment results in a range of morphological
changes, such as cellular proliferation, angiogenesis, microglia activation (Gage, 2002),

Introduction
17
de novo synaptogenesis (Leuner et al., 2003), and conversion of silent to active
synapses (Markham and Greenough, 2004, Butz et al., 2009). Results of training-
induced plasticity in animals have sparked a considerable interest to study the effect of
environmental enrichment in the human brain using in vivo neuroimaging techniques
(Maguire et al., 1997, Maguire et al., 2000, Mechelli et al., 2004, Maguire et al., 2006a,
Lee et al., 2007, Jancke et al., 2009, Park et al., 2009). Conversely, it has been shown
that neurons not actively participating in neural activity for a long period of time start to
degenerate, the concept of use it or lose it. This concept was first described by Hubel
and Wiesel, 1965 who found that depriving a kitten’s eye of light reduced the number of
neurons in the visual cortex that responded to light (Hubel and Wiesel, 1965). Likewise,
it has been shown that auditory deprivation of cats through cochlear ablation resulted in
loss of auditory cortical sound representation (Reale et al., 1987), and reduction in
synapse number (Perier et al., 1986). The above evidence indicates the presence of
substantial environmental influence on the structure and function of the adult brain;
however, genetic effects (Thompson et al., 2001) and interactions should also be taken
into consideration to understand the true potency of neuroplasticity.
The nature of the learnt skill dictates the pattern of the plasticity (
1.7.2.2 SPECIFICITY
Kleim and Jones,
2008). The literature indicates that the production of significant anatomical-functional
changes in the brain requires learning or skill acquisition, rather than mere use. For
example, it has been shown that rats allocated to an acrobatic training task have more
parallel and climbing fiber synapses, and dendritic growth in the cerebellum than rats
allocated for voluntary exercise condition or an inactive condition (Kleim et al., 1998b,
Kim et al., 2002). Training-induced structural brain changes also show regional
specificity. For example, rats learnt a spatial navigation task had increased dendritic
length and branching in the visual cortex (Greenough et al., 1979, Kolb et al., 2008).
Rats learnt unilateral motor reaching task demonstrated increased dendritic length and
branching in the motor cortex contralateral to the trained limb (Greenough et al., 1985,
Kolb et al., 2008), while those trained bilateral motor tasks showed increased dendritic

Introduction
18
growth in motor cortices in both cerebral hemispheres (Kolb et al., 2008). Additionally,
classical conditioning in mice using whisker stimuli was shown to specifically expand
cortical representation of trained whiskers (Siucinska and Kossut, 1996).
One of the key factors that drives plasticity is the presence of sufficient repetition of
newly learned behavior (
1.7.2.3 REPETITION OF STIMULATION
Kleim and Jones, 2008). Continuous rehearsal of the acquired
skill is essential to induce lasting structural and functional brain changes resistant to
decay when training ends (Monfils et al., 2005). For example, Trepel and colleagues
(Trepel and Racine, 1998) investigated the effect of daily stimulation on cortical
activation patterns in rats using electrodes implanted into the frontal and parietal
regions of the brain. Lasting long-term potentiation (LTP) of synaptic responses could
be induced by increasing the number of stimulation trains delivered in each session and
by increasing the number of sessions; animals that received 60 trains per day
demonstrated stronger response compared to those that received 5 and 10 trains per
day. In humans, changes in cortical activation patterns induced by short- (20 minutes)
and long-term (5 weeks) piano learning were investigated in musically naive subjects
using auditory and motor tasks (Bangert and Altenmuller, 2003). Although activation
patterns occurred after only 20 minutes, the effect did not reach a peak level until after 5
weeks of training.
Apart from repetition, the intensity of training has a profound impact on driving plasticity.
For example, in the above-mentioned experiment of Trepel and colleagues (
1.7.2.4 INTENSITY OF STIMULATION
Trepel and
Racine, 1998), animals received stimulation trains with different pulse intensities of 16,
32,160, and 500 µA. Results showed that high-intensity stimulation trains of (500 µA)
were sufficient to induce LTP, while animals received 16 and 32 µA trains showed no
significant changes compared to controls. Additionally, microscopic evidence of
structural plasticity in the form of increased dendritic arborization (Kleim et al., 2002)
was demonstrated in animals trained to make 400 reaches per day to retrieve food

Introduction
19
pellets, but not in those trained to perform 60 reaches per day (Luke et al., 2004). In
accord, the total size of the cerebellum in professional musicians was shown to be
positively correlated with the intensity of musical performance (practice time per day)
(Hutchinson et al., 2003).
Early studies suggested that age-related cognitive decline arise primarily from reduction
in the number of neurons; however, several recent studies have indicated that neuronal
number is relatively preserved in the healthy aging brain (
1.7.2.5 EFFECT OF AGE
Peters et al., 1994, Peters and
Sethares, 2002), and that aging is mainly associated with alterations in neuronal
morphology in the form of regression of dendritic spines together with a reduction in the
total number of synapses. Reduced synaptic density has been demonstrated in old rats
(Chen et al., 1995, Long et al., 2009), monkeys (Peters et al., 2008, Hara et al., 2011)
and humans (Masliah et al., 1993), and was shown to be associated with physiological
degradation (Luebke et al., 2004). In accord, in vivo neuroimaging studies in humans
have reported age-related alteration of global morphometric properties, including a
decline in total brain volume (Blatter et al., 1995), GM volume (Jernigan et al., 1991),
and cortical thickness (Salat et al., 2004). These age-related changes were
hypothesized to be the inverse of development; the late maturing regions of the brain
are especially susceptible to atrophic changes (McGinnis et al., 2011). It could thus be
expected that plasticity responses are different in the aged brain (Nieto-Sampedro and
Nieto-Diaz, 2005). Nevertheless, modern neuroscience adopts the assumption of a
permanently plastic brain (Pascual-Leone et al., 2005). Activity-dependent plastic
changes have been demonstrated in the aging brain though brain changes may be less
prominent and/or slower to take place than those observed in younger brains (Green et
al., 1983). For example, it has been demonstrated that exposure to an enriched
environment is associated with enhanced neurogenesis and angiogenesis in aged
animals (Kempermann et al., 2002, Ueda et al., 2005), which was associated with
significant behavioral gain. Regarding humans, several studies have indicated that the
human brain maintains the capacity to change its structure according to learning and

Introduction
20
cognitive exercise demands (Colcombe et al., 2006, Boyke et al., 2008, Engvig et al.,
2010). For example, elderly subjects who learned to juggle showed increased GM in the
visual cortex, left hippocampus, and in the nucleus accumbens bilaterally (Boyke et al.,
2008). Furthermore, evidence of structural (Schlaug et al., 2009) and functional
neuroplasticity (Schaechter et al., 2002) were reported in elderly stroke patients
following the use of different rehabilitation regimes suggesting that age is not per se a
limiting factor for neuroplasticity.
1.7.3 MECHANISMS OF NEUROPLASTICITY AT MICROSCOPIC LEVEL
A major goal of neuroscience has been to explore the cellular and synaptic mechanisms
that underlie memory function, learning, aging, and lesions. With the advent of electron
microscopy and modern electrophysiological, immunohistochemical, and in vivo
microscopic imaging techniques, considerable progress has been made in describing
cellular mechanisms for learning and plasticity (Denk et al., 1990, Raymond et al., 2002,
Ferguson et al., 2004, Becker et al., 2008). The functional and anatomical malleability of
the nervous system is, to a large extent, the plasticity of the synapses. At the
microscopic level, cellular mechanisms underlying cortical plasticity include
physiological mechanisms (functional reorganization of neurons and synapses) and
structural mechanisms (rewiring of cortical circuits through the formation of new
synapses, removal of old synapses, and morphological changes in the synapses)
(Feldman, 2009). In general, it has been proposed that learning and skill acquisition
induce rapid physiological plasticity through activation of N-methyl-D-aspartate (NMDA)
receptor-dependent LTP and long term depression (LTD). These physiological
mechanisms are followed by slower structural changes of nervous tissue to consolidate
plasticity (Buonomano and Merzenich, 1998, Nieto-Sampedro and Nieto-Diaz, 2005).
Here, I focus on several of the best-studied forms of physiological and structural
mechanisms and their roles in neuroplasticity.

Introduction
21
1.7.4 PHYSIOLOGICAL MECHANISMS OF NEUROPLASTICITY
Long-term potentiation is an enduring enhancement of synaptic transmission following
high frequency electric stimulation. This process was originally suggested by Hebb
(
1.7.4.1 SYNAPTIC STRENGTHENING: LONG-TERM POTENTIATION
Hebb, 1947) who postulated that a synapse used repeatedly is made more efficient,
i.e. reinforced (a hebbian synapse). Once reinforced, synaptic stimulation threshold
becomes lower and the synapse can be activated by stimuli of lower intensity than
originally required; or when activated by the same stimulus, it produces a response of
greater amplitude (Nieto-Sampedro and Nieto-Diaz, 2005). Bliss and colleagues (Bliss
and Gardner-Medwin, 1973, Bliss and Lomo, 1973) were the first to demonstrate LTP
electrophysiologically in the neurons of the hippocampus. Later, LTP was shown to
occur in many cortical regions (Tsumoto, 1992, Maren, 2005, Abidin et al., 2006, Bruel-
Jungerman et al., 2007, Cui et al., 2011, Sheynikhovich et al., 2011, Meis et al., 2012).
Repeated physiological activation of a synapse is translated into a set of morphological
synaptic changes that ensure a record of long duration (from weeks to several months)
(Bruel-Jungerman et al., 2007). Results of the past four decades of research have
provided compelling support for the idea that LTP-induced synaptic changes play an
essential role in adult learning and memory function (for review, see (Martin et al.,
2000)). The primary mechanism for LTP induction is the activation of NMDA receptor
which requires two simultaneous events: the binding of glutamate released from
presynaptic boutons, and a sufficient level of postsynaptic depolarization mediated via
α-amino-3-hydroxy-5-methyl-4-isoxazolepropionic acid (AMPA) receptor activation
(Nieto-Sampedro and Nieto-Diaz, 2005). When these conditions are fulfilled, calcium
flows into the postsynaptic neuron through the NMDA channel, which is the triggering
event in LTP (Bliss and Collingridge, 1993). The rise in intracellular calcium triggers a
host of intracellular events, including activation of several kinases and transcription
factors that ultimately result in modifications of the properties of synaptic receptors and
induction of specific genomic programs (Huang et al., 1996, Kandel, 1997).
Modifications of synaptic receptors include phosphorylation of their subunits and

Introduction
22
enrolment of extra-synaptic AMPA receptors (Bruel-Jungerman et al., 2007), while
activation of genomic programs in neurons leads to de novo synthesis of proteins (Frey
and Morris, 1997), and a number of morphological changes in synapses (see below).
These changes result in lasting modifications of the synapse and long-term
consolidation of memories.
Long term depression is an electrophysiological phenomenon equivalent but opposite to
LTP (
1.7.4.2 SYNAPTIC ELIMINATION/WEAKENING: LONG-TERM DEPRESSION
Ito, 1989), which can be induced by low frequency stimulation of a synapse. This
process results in shrinkage or even disappearance of synaptic connections in neural
networks (Zhou et al., 2004). The mechanism of LTD induction is essentially similar to
that of LTP, involving NMDA receptor activation and elevation of intracellular calcium
concentration; however, the increase in calcium concentration is much lower than that
after LTP induction. Unlike LTP, which activates kinases, the mechanism of LTD
involves activating calcineurine, a synaptic phosphatase with high affinity for calcium
(Lisman, 1989). This would trigger several molecular mechanisms, including
dephosphorylation of specific residues on glutamate-containing AMPA receptors and
internalization of AMPA receptors (Collingridge et al., 2004). It was hypothesized that
LTD could serve as a tool to weaken unused connections, thereby facilitating the
emergence of reinforced connections in the network, which enhances the network’s
capacity for information storage (Bruel-Jungerman et al., 2007). Previous studies have
indicated that LTD has a role in the formation of long-term memory and plasticity. For
example, LTD mechanisms were shown to be the dominant form of plasticity process in
the cerebellum (De Zeeuw and Yeo, 2005). In the hippocampus, it was demonstrated
that LTD induction is essential for complex visuospatial learning in rats (Kemp and
Manahan-Vaughan, 2007). Furthermore, it has been shown that induction of genetic
mutations in mice, which impairs LTD in the hippocampus, could result in selective
deficit in spatial memory (Etkin et al., 2006). Since most neural networks could support
both LTP and LTD mechanisms, it was suggested that the main role of LTD in plasticity
is to maintain a constant overall synaptic drive in a network, which would prevent

Introduction
23
chronic excitation of neurons and the saturation of neural circuits thereby maintaining
the capacity for learning and memory storage (Moser et al., 1998).
1.7.5 STRUCTURAL MECHANISMS OF NEUROPLASTICITY
Physiological patterns of plasticity may not be sufficient to stabilize neuronal activities.
Structural synaptic changes may thus be required to hardwire functional changes. It has
been shown that LTP and learning could induce remodeling of neural circuits through
de novo synaptogenesis (the physiological process of increasing synapse number and
dendritic complexity)(
1.7.5.1 SYNAPTOGENESIS AND SYNAPSE REMODELING
Chang et al., 1991, Toni et al., 1999) and synapse renewal
(Markham and Greenough, 2004, Nieto-Sampedro and Nieto-Diaz, 2005). Renewal of
synapses includes four main stages triggered by the release of neurotrophins
(Trachtenberg et al., 2002, Feldman, 2009): retraction of dendritic spines and
disconnection of old synapses, growth of new axons and axon sprouting, formation of
new synaptic contacts, and maturation of the new synapses. Neural circuits with higher
capacity for synapse renewal have a greater potential for plastic changes. In addition to
synaptogenesis, environmental enrichment could also result in a host of morphological
changes at existing synapses, such as increased growth, arborization, surface-to-
volume ratio, and contact boutons of dendritic spines together with changes in the
length of post synaptic density, number of synaptic vesicles, and number of vacant
spines (Toni et al., 1999, Geinisman, 2000, Toni et al., 2001, Yuste and Bonhoeffer,
2004, De Paola et al., 2006, Holtmaat et al., 2006, Knott et al., 2006). Increased vacant
synaptic elements, which are either newly formed or arise from the breakdown of
existing synapses, can induce synaptic rewiring through stimulating the production of
neurotrophic factors capable of inducing axonal outgrowth and sprouting (Holland and
Brown, 1980), and re-routing of old axons to different postsynaptic targets (De Paola et
al., 2006). Other morphological changes associated with LTP include changes in
synapse curvature and the appearance of perforations in the synapses (Agnihotri et al.,
1998, Weeks et al., 2001, Connor et al., 2006). It has been postulated that increased
synaptic curvature brings the receptor closer to the synaptic cleft, which increases the

Introduction
24
possibility of activation of the postsynapse (Bruel-Jungerman et al., 2007). The
appearance of perforated synapses was suggested to precede synapse splitting, giving
rise to multiple morphologically distinct synapses (Luscher et al., 2000). The net effect
of these structural synaptic changes is the increase in stability and strength of
synapses, the emergence of new functional units, and the conversion of dormant to
active synapses (Bruel-Jungerman et al., 2007). In contrast to the above mentioned
morphological synaptic changes associated with LTP, it has been reported that
induction of LTD causes retraction of axonal branches (Chang et al., 1995) and
weakening of synapses and spines (Zhou et al., 2004). Weak synapses are liable to
break again (Becker et al., 2008).
It was classically thought that neurogenesis, the generation of new neurons, is generally
confined to a discrete developmental period; however, this phenomenon was clearly
demonstrated in adult animals (
1.7.5.2 NEUROGENESIS
Kornack and Rakic, 1999, Aberg et al., 2000) and
humans (Eriksson et al., 1998, Eriksson, 2003, Knoth et al., 2010). The process of
neurogenesis has been reported to take place in different brain regions, including the
hippocampus and olfactory bulb (Alvarez-Buylla and Garcia-Verdugo, 2002, Rakic,
2002), neocortex (Gould et al., 1999b), striatum (Fowler et al., 2002), substantia nigra
(Zhao et al., 2003), and amygdala (Duchesne et al., 2002). Adult neurogenesis involves
proliferation of stem cells, morphological and physiological maturation of newborn cells,
and synaptic incorporation into existing neural circuits (Bruel-Jungerman et al., 2007).
Recent studies have indicated that adult neurogenesis can be stimulated by a variety of
factors, including environmental enrichment, physical activity, and learning
(Kempermann et al., 1997, van Praag et al., 1999a, van Praag et al., 1999b, Brown et
al., 2003). For example, animals exposed to an enriched environment showed
increased neurogenesis, which was correlated with enhanced performance in spatial
memory (Nilsson et al., 1999, Dhanushkodi et al., 2007) and novel object recognition
tasks (Bruel-Jungerman et al., 2005). Also, animals enrolled in running exercise
demonstrated increased number of newborn cells compared with littermates enrolled in

Introduction
25
ordinary activities (van Praag et al., 1999b). Exercise does not only increase the
number of new neurons but also influences the morphology of individual newly born
cells, i.e., it has qualitative and quantitative effects (Zhao et al., 2006). Theories of
training-induced neurogenesis include modulation of the function of neurotransmitters,
increased expression of growth factors and neurotrophins, and enhanced angiogenesis.
Excitatory neurotransmitters, such as glutaminergic system are up-regulated, whereas
inhibitory neurotransmitters, such as gama-aminobutyric acid system are down-
regulated (Molteni et al., 2002, Kleim et al., 2003a, Kleim et al., 2003b). The crucial role
for adult neurogenesis in learning and memory was also derived from studies showing
that ablation of the process of neurogenesis through irradiation, antimitotic agents, and
genetic ablation, impairs spatial learning and performance in working memory tasks
(Madsen et al., 2003, Winocur et al., 2006).
Although millions of new neurons are generated each day, a large number will not
complete their maturation cycle and die within the first few weeks (Kempermann et al.,
2003). It has been shown that the same factors implicated in neurogenesis, namely
environmental enrichment, physical activity, and learning can rescue young neurons
from death and increase their chance to survive (Gould et al., 1999a, Leuner et al.,
2004, Wu et al., 2008, Epp et al., 2010). These young neurons have a lower threshold
for LTP induction and produce stable LTP more readily than more mature neurons
(Snyder et al., 2001, Saxe et al., 2006). It is thus expected that newly born neurons are
more vulnerable to plastic effect and can increase the overall computational capacity of
the neural circuit within which they are embedded.

Introduction
26
NEUROPLASTICITY AT MACROSCOPIC LEVEL, EXPLORING EXPERIENCE-
DEPENDENT PLASTICITY IN THE ADULT HUMAN BRAIN USING IN VIVO
IMAGING
As described earlier, animal studies have indicated that the adult brain is not as
hardwired as previously thought, and that it maintains the capacity for synaptic rewiring
(Chklovskii et al., 2004). The search for anatomical markers of extraordinary skills has
fascinated researchers for many years. Reports of experience-dependent
microstructural plasticity in brains of adult animals (Black et al., 1990, Anderson et al.,
1996, Kleim et al., 1998a, Anderson et al., 2002, Swain et al., 2003, Kleim et al., 2004,
Matsuzaka et al., 2007) had excited neuroscientists to search for equivalent changes in
humans. However, a crucial limitation of postmortem studies lies in their invasive
nature, and the fact that they can identify only very localized morphological changes
due to the nature of the techniques used. Imaging techniques offer the opportunity to
investigate human brain organization in vivo noninvasively. In particular, MRI has
become the preferred imaging technique for the detection of structural and functional
evidence of neuroplasticity due to its non-invasiveness, high spatial resolution, and the
ability to perform whole-brain examination of GM and WM regions. In this context, a
vast number of cross-sectional imaging studies revealed structural (macroanatomical)
and functional correlates of learning and experience in different cognitive domains in
healthy brains shedding light on structural (Maguire et al., 1997, Maguire et al., 2000,
Mechelli et al., 2004, Maguire et al., 2006a, Lee et al., 2007, Jancke et al., 2009, Park
et al., 2009), and functional (Elbert et al., 1995, Sacco et al., 2009, Takeuchi et al.,
2011) plasticity phenomena in adult humans. Examples of functional neuroplasticity
include increased size of somatosensory cortical maps of the digits of the left hand in
violinists (Elbert et al., 1995), increased auditory cortical representation of piano tones
in keyboard players (Pantev et al., 1998), and increased cortical activations in inferior
parietal cortex and occipito-temporal regions in healthy subjects who learned to decode
Morse code (Schmidt-Wilcke et al., 2010). At the structural level, coarse anatomical
plastic changes have been observed using in vivo MR morphometry, voxel-based
morphometry (VBM), and DTI. A common finding across these studies is the
1.7.6

Introduction
27
enlargement of the representative area that underlies the particular skill. For example,
Maguire and colleagues reported that the right hippocampus, which is crucial for spatial
memory and navigation, is preferentially enlarged in London taxi drivers compared to
control population (Maguire et al., 2000), and bus drivers (Maguire et al., 2006b). Other
examples of training-induced GM changes include increased GM density in the inferior
parietal lobe in academic mathematicians, which was significantly correlated with the
time spent as an academician (Aydin et al., 2007); and increased GM volume in
premotor and parietal regions in skilled golfers compared to less skilled golfers and
control subjects (Jancke et al., 2009). Experience-dependent structural MR changes are
not restricted to GM but were also reported in WM regions. Training of a complex
visuomotor skill was shown to increase FA of the WM underlying the intraparietal sulcus
(Scholz et al., 2009). Similarly, enhanced visual memory performance was shown to be
correlated with anisotropy measures of WM regions (Tuch et al., 2005, Begre et al.,
2007), prompting the suggestion that increased myelination plays an important role in
driving training-induced plasticity. A recent study that investigated WM plasticity in long-
term trained Baduk players, a game that requires higher order cognitive capacities,
such as learning, spatial imagination, and abstract reasoning, has demonstrated
increased FA measures in Baduk players in the frontal and cingulum regions, which
support attentional control, working memory, and problem-solving ability compared to
inexperienced control subjects (Lee et al., 2010). Other studies reported combined GM
and WM changes induced by learning, such as increased GM density (Mechelli et al.,
2004, Lee et al., 2007), and WM density (Golestani et al., 2002) in the parietal lobe of
faster phonetic learners, and those with better vocabulary knowledge. Faster learners
were also shown to have greater WM density in the left Heschl gyrus compared with
slower learners (Golestani et al., 2007). Interestingly, morphometric measures of pre-
defined brain regions were even used to predict learning capacities of novel speech
sounds (Golestani et al., 2007, Golestani and Pallier, 2007). Taken together, the above
evidence provides support for the assumption that enhanced performance is associated
with greater structural measures of related brain regions. However, a considerable
limitation of morphometric analyses using MR data acquired at a single time point is the

Introduction
28
inability to distinguish the independent effect of learning on brain structure from diverse
environmental and/or genetic influences (Schlaug, 2001). Longitudinal studies are
therefore needed to acquire imaging data at multiple time points to disclose temporal
characteristics of experience-induced plasticity changes. In this context, an interesting
longitudinal MR study has investigated plasticity in healthy adults trained to perform 3-
ball cascade juggling, a complex visuomotor task (Draganski et al., 2004). It was shown
that three months training on juggling established the ability to achieve the required
minimum of one-minute 3-ball cascade juggling. Subject were scanned at three time
points: before staring to learn how to juggle, three months later when their juggling
ability was tested, and another three months later following a period of juggling
cessation. Compared to control subjects, MR examination performed at the second time
point revealed GM increase in the extrastriate motion specific area bilaterally and in the
left inferior parietal sulcus in jugglers. At the third time point, these GM changes have
disappeared almost to base line, which was associated with reduced juggling
performance compared to the second time point.
In addition to the wealth of literature suggesting a clear correlation between skill
acquisition and structural properties in the healthy brain, our knowledge of
neuroplasticity in the adult human brain was further extended by results of clinical
studies, which demonstrated morphological brain changes induced by nervous system
injury. For example, patients with unilateral vestibulo-cochlear lesions exhibited
increased GM density in the primary somatosensory cortex and motion-sensitive areas
in the medial temporal gyrus, which was correlated with improvement in vestibular and
hearing functions (Helmchen et al., 2011). Additionally, blindness-induced alteration in
motor experience was shown to drive morphological adaptations in WM structure in the
form of increased average FA of the corticospinal tract (Yu et al., 2007). MRI can also
provide a biomarker of outcome after brain injury and following the application of
rehabilitation regimes. For example, at the structural level, a DTI study reported that
patients with chronic Broca’s aphasia who undergone intonation-based speech therapy
showed increased number of fibers and volume of the arcuate fasciculus compared to
pre-treatment assessments (Schlaug et al., 2009). At the functional level, hemiparetic

Introduction
29
stroke patients treated with constraint-induced movement therapy, a physical
rehabilitation regime that has been shown to improve motor function, showed increased
cortical activations in the contralesional hemisphere during movement of the affected
and unaffected hands, which was associated with significant motor improvement (Lin et
al., 2010b).
Unfortunately, the nature of the cellular events underlying in vivo macroscopic changes
in brain structure cannot be explored with the current resolution of MR images. Results
of animal studies (described above) could provide indirect evidence to the possible
cellular events underlying MR-derived measures in humans, such as cellular
proliferation (Gage, 2002), angiogenesis (Pereira et al., 2007), synaptogenesis (Kleim
et al., 2002), increased dendritic growth and axonal fiber densities (McAllister et al.,
1995, Markham and Greenough, 2004, Butz et al., 2009), increased synaptic
connectivity patterns (Chklovskii et al., 2004), in addition to changes in gene expression
and protein synthesis (McAllister et al., 1995, Kleim et al., 1996). Future advance in MR
technology could make it possible to achieve higher anatomical resolution (Nakada et
al., 2008, Duyn, 2010) to explore the microscopic structure of the human brain in vivo
thereby expanding our knowledge about the process of neuroplasticity.
Over the past two decades, a considerable amount of research has been devoted to
identifying evidence of training-induced plasticity in brains of musicians. Professional
musicians were considered the ideal model to investigate experience-driven
neuroplasticity in healthy adults as they have the advantage of being intensively
exposed to a complex stimulus, music. A review of structural and functional studies
conducted on musicians’ brains is provided in the next chapter (chapter 2).

30
CHAPTER 2 REVIEW OF LITERATURE
THE MUSICIAN’S BRAIN AS AN IDEAL MODEL TO STUDY
PLASTICITY IN HUMAN

Review of Literature
31
2.1 AIM
The aim of this chapter is to provide a literature review of anatomical and functional
studies that investigated evidence of plasticity in musicians’ brains. This is followed by
presenting the rationale for conducting structural examinations in the present work,
research aims, and research hypotheses.
2.2 THE MUSICIAN’S BRAIN AS AN IDEAL MODEL TO STUDY PLASTICITY IN
HUMANS
“…the work of a pianist…is inaccessible for the untrained human, as the acquisition of
new abilities requires many years of mental and physical practice. In order to fully
understand this complicated phenomenon it is necessary to admit, in addition to the
strengthening of pre-established organic pathways, the establishment of new ones,
through ramification and progressive growth of dendritic arborizations and nervous
terminals.…Such a development takes place in response to exercise, while it stops and
may be reversed in brain spheres that are not cultivated”.—Santiago Ramón y Cajal,
Textura del Sistema Nervioso del Hombre y de los Vertebrado. Cited in (Pascual-
Leone, 2001).
Music is one of the oldest and most basic sociocognitive domains of the human
species. It was assumed that human musical abilities played a key phylogenetical role
for the evolution of language, and that music making behavior covered important
evolutionary functions, such as communication, group coordination, and social
cohesion. Musical communication in early childhood (such as maternal music) was
suggested to play a key role in cognitive, emotional, and social maturation of children
(Trehub, 2003).
The musician’s brain was considered an ideal model to study neuroplasticity in humans
(for review see (Schlaug, 2001, Munte et al., 2002). Musicians differ from subjects with
other professions in two major aspects. First, they begin their training at an earlier age
when many brain regions have not approached optimum maturity, hence vulnerable to
plastic changes imposed by multimodal stimuli (Watanabe et al., 2007). Second, to
master their profession, musicians must practice for several hours per day even outside

Review of Literature
32
working hours. As playing music is an enjoying act, this would not result in physical
fatigue offering them more time to practice (Watson, 2006). Taken together, the above
evidence indicates that musicians have an early, long-term, and intensive skilful
practice sufficient to impose plastic changes in their brain. Playing an instrument is a
multisensory motor experience that requires several skills, including reading musical
notes, which contain complex symbols followed by translating these notes into
sequential motor activity. It also involves memorizing long musical passages and
improvising within given musical parameters (Bengtsson et al., 2007). One can imagine
the complexity of musical performance by the assumption that a pianist can coordinate
the production of up to 1800 musical notes per minute (Munte et al., 2002). It is
therefore not surprising that musicians have been the subject of tens of imaging studies
set to search for evidence of plasticity in their brains.
Neuroimaging studies in musicians have provided compelling evidence that training and
enhanced use of a body part cause plastic changes in brain architecture. Coarse
anatomical plastic changes have been observed using in vivo MR morphometry, voxel-
based morphometry (VBM), and DTI (Schlaug et al., 1995a, Schlaug et al., 1995b,
Schmithorst and Wilke, 2002, Gaser and Schlaug, 2003a, Hutchinson et al., 2003,
Bengtsson et al., 2005, Imfeld et al., 2009). In particular, those brain areas involved in
controlling music specific behavior, such as motor control and auditory processing
revealed anatomical differences compared to non-musicians. A common finding across
these studies is the enlargement of the representative area that underlies that particular
skill in musicians. On the other hand, evidence of functional plasticity in musicians was
elucidated using techniques, such as functional MRI (fMRI), magnetoencephalography
(MEG), electroencephalography (EEG), positron emission tomography (PET), and
behavioral studies (Sergent et al., 1992, Elbert et al., 1995, Koeneke et al., 2004, Vuust
et al., 2005, Bangert et al., 2006, Limb et al., 2006, Magne et al., 2006, Baumann et al.,
2007, Sluming et al., 2007, Watanabe et al., 2007). Evidence of functional
neuroplasticity includes cross-modal integration, increased size of cortical
representation maps, enhanced performance in sensorimotor tasks, and increased
functional activation.

Review of Literature
33
2.3 STRUCTURAL EVIDENCE OF PLASTICITY IN THE MUSICIAN’S BRAIN
Studies that investigated structural differences between musicians and non-musicians
could be divided into whole-brain studies, which used VBM and DTI techniques, and
studies that targeted specific areas of the brain through manual delineation of regions of
interest with a variety of metrics and definitions.
Two pioneer studies that performed whole-brain VBM investigation (Sluming et al.,
2002, Gaser and Schlaug, 2003a) revealed different sets of results, although both
examined male professional musicians. In the first study (Gaser and Schlaug, 2003a),
professional musicians possessed greater GM density in areas known to be involved in
auditory, motor, somatosensory, and visuospatial processing compared to both amateur
musicians and non-musicians. These areas include the left Heschl gyrus, primary motor
area, premotor area, left cerebellum, somatosensory area, inferior temporal gyrus,
superior parietal lobe, and left inferior frontal gyrus. The second study (Sluming et al.,
2002) detected greater GM density in Broca’s area in male orchestral musicians, which
was positively correlated with the duration of musical performance. Apart from variable
scanning parameters, the differences in findings may be attributed to demographics of
recruited musicians, such as age of starting musical training and instrument specialty.
The age of commencing musical training was around 7 years in the first study
compared to 10 years in the second study. This factor is important in view of several
reports, which showed that early musical training is associated with more robust
structural and functional plastic changes in different brain regions (Elbert et al., 1995,
Schlaug et al., 1995a, Amunts et al., 1997a, Watanabe et al., 2007, Li et al., 2010). In
addition, the study of (Gaser and Schlaug, 2003a) has exclusively recruited keyboard
players thereby increasing the likelihood of detecting significant group differences in
motor cortical areas, whereas the cohort of (Sluming et al., 2002) included multi-
instrumentalists and did not demonstrate differences in motor areas. However, a shared
finding of these studies was the lack of significant WM differences between musicians
and non-musicians, which might in part be related to limitations in the VBM technique
itself as it might be insensitive to WM differences caused by low-intensity contrast
differences between groups (Ashburner and Friston, 2000, Della Nave et al., 2008),

Review of Literature
34
underlying the significance of using more sensitive methods for studying WM structure
in musicians, such as DTI. This in vivo neuroimaging technique offers a complementary
way of studying the brain by directing interest towards WM integrity and axonal
connectivity (Basser and Jones, 2002). It provides a method of characterizing the
diffusivity of water molecules in the human brain, and can provide important information
about WM structure that is not available from other imaging techniques (Basser et al.,
1994, Pierpaoli et al., 1996). One of the most widely used DTI-derived metric is FA,
which has been used as a scalar indicator of the directionality and coherence of fiber
tracts (Basser and Pierpaoli, 1996). It was proposed that FA could provide information
about WM microstructure, such as intra-axonal organization (Kinoshita et al., 1999),
density of fibers, degree of myelination (Song et al., 2005), neuroglial cell packing,
individual fiber diameter, and immunohistochemical parameters (Mori and Zhang, 2006,
Sun et al., 2006, Trivedi et al., 2009). Postmortem studies suggested that axon
diameter and myelin sheath undergo conspicuous growth during the first two years of
life, but may not be fully mature before late adolescence (Benes, 1989) or even late
adulthood (Benes et al., 1994), underlying the significance of investigating WM plasticity
in musicians. Unlike GM, the WM has not been studied as extensive in musicians.
Whole brain DTI studies showed that, compared to non-musicians, professional
musicians have increased FA value in the right posterior limb of the internal capsule
(Bengtsson et al., 2005, Han et al., 2009), which contains fibers of the corticospinal
tract, the main motor tract in the brain. Increased FA value was also reported in the
central portion of the cerebellum (Schmithorst and Wilke, 2002), genu of the CC
(Schmithorst and Wilke, 2002), and the left inferior frontal gyrus (Han et al., 2009).
Studies that targeted specific brain regions revealed convincing evidence of structural
plasticity in musicians. Most of these studies reported on structural plasticity in the
auditory and motor brain regions.

Review of Literature
35
2.3.1 THE AUDITORY SYSTEM
The fact that musicians are challenged by no other profession in their expertise in the
auditory domain has fascinated neuroscientists to relate such exceptional auditory skill
to changes in brain anatomy. Prior to the era of MRI, postmortem examination of the
brains of two imminent musicians revealed that the superior temporal gyrus was larger
than the normal size (Meyer, 1977). Conventional MR imaging revealed a similar
tendency in structures that process auditory stimuli namely, the Heschl gyrus and
planum temporale. The Heschl gyrus includes the primary auditory cortex, which is
involved in initial processing of auditory stimuli (Penhune et al., 1996, Yoo et al., 2005,
Wong et al., 2007), while the planum temporale contains the secondary auditory cortex
responsible for perceptual analysis and integration of sound stimuli (Griffiths et al.,
1998, Zatorre, 1998, Ohnishi et al., 2001). It has been shown that professional
musicians posses greater GM volume of anteromedial portion of the Heschl gyrus
compared to amateurs and non-musicians (Schneider et al., 2002). A recent study that
combined VBM and cortical thickness measurement corroborated these findings
through demonstrating increased GM density and cortical thickness of the right Heschl
gyrus, although the difference was mainly localized in the posterolateral portion of the
gyrus (Bermudez et al., 2009). Moreover, it has been shown that GM volume of the
lateral portion of the Heschl gyrus is correlated with instrument specialty (Schneider et
al., 2005). Musicians who used high-pitched instruments, such as piano, trumpet, drums
, or guitar exhibited greater GM volume in the left lateral Heschl gyrus, while those who
used low-pitched instruments, such as bassoon, saxophone, or French horn exhibited
greater GM volume in the right lateral Heschl gyrus (Schneider et al., 2005).
The size of the planum temporale in musicians was shown to correlate with absolute
pitch ability, defined as the ability to identify a tone in the absence of an external
reference tone (Takeuchi and Hulse, 1993). Musicians who possess this ability
demonstrated more pronounced left -sided asymmetry compared to non-possessors
and non-musicians (Schlaug et al., 1995b, Zatorre et al., 1998, Keenan et al., 2001,
Luders et al., 2004). In agreement with these findings, fiber tractography of the superior
longitudinal fasciculus, a tract that connects the frontal and temporal regions of the

Review of Literature
36
brain (including the planum temporale), revealed left-sided asymmetry in FA values in
musicians with absolute pitch ability compared to musicians without absolute pitch
ability and non-musicians (Oechslin et al., 2009). Furthermore, an interesting study that
used MR spectroscopy reported greater concentration of N-acetylaspartate (NAA) in the
planum temporale in musicians, which was correlated with the duration of musical
performance (Aydin et al., 2005). As increased concentration of this metabolite was
known to correlate with neuronal density (Cheng et al., 2002), it was hypothesized that
long-term musical practice has stimulated the generation of new synapses and neurons,
which was reflected by increased concentration of NAA. This study was the first to
provide a direct in vivo evidence of ultra-structural neuroplasticity in musicians.
2.3.2 THE MOTOR SYSTEM
The main components of the motor system include the primary motor cortex, located in
the precentral gyrus, and responsible for initiating motor activity; and the premotor
cortex, located in the posterior parts of the superior, middle, medial, and inferior frontal
gyri, and responsible for programming of a strategy of voluntary movement that directs
the primary motor area in its execution (Williams et al., 1995, Lundy-Ekman, 2007).
Another integral component of the motor system is the cerebellum, which plays an
important role in coordinating motor activity, and producing the finest hand/finger
movements. Neuronal impulses generated in the motor cortex of the brain travel within
the corticospinal tract, the descending fibers of this tract converge in the corona radiata,
the posterior limb of the internal capsule, midbrain, and pons. In the medulla oblongata,
most of these fibers decussate to the contralateral side and descend into the spinal cord
to supply all skeletal muscles in the body. Each corticospinal tract would thus supply the
opposite side of the body (Williams et al., 1995). Professional musicians, especially
keyboard players, constitute a perfect population for studying long-term plasticity in the
motor system as their daily practice requires complex bimanual hand/fingers
movements that should be coordinated to produce the best outcome. Amunts and
colleagues (Amunts et al., 1997a) conducted manual measurement of the size of the
primary motor cortex by estimating the intrasulcal length of the precentral gyrus (ILPG),
defined as the length of the posterior bank of the precentral gyrus bordering the central

Review of Literature
37
sulcus. As expected, right-handed non-musicians had pronounced left-to-right
asymmetry in the size of the ILPG; however, musicians exhibited a relatively
symmetrical ILPG due to greater size of the ILPG in the right, non dominant
hemisphere, which was supported at the behavioral level by reduced hand skill
asymmetry in musicians. In accord, it has been reported that transcallosal inter-
hemispheric inhibition is reduced in musicians compared to non-musicians as measured
by applying transmagnetic stimulation to the hand area of the motor cortex (Ridding et
al., 2000). The relative symmetry of brain structure and function is highly important for
professional musicians, especially keyboard players in whom bilateral coordination of
motor function is invaluable for efficient outcome.
A more recent study has further investigated the relationship between central sulcus
morphology and musicianship through measuring intrasulcal length, surface area, and
mean surface variability of anterior and posterior walls of the central sulcus using a 3D
surface reconstruction (Li et al., 2010). The anterior wall of the central sulcus represents
the posterior wall of the precentral gyrus (primary motor cortex), and its posterior wall
represents the anterior wall of the postcentral gyrus (primary somatosensory cortex).
Although no significant group differences were reported in intrasulcal length and surface
area, musicians showed greater local variability in the middle section (representing the
hand area) of the central sulcus, which was negatively correlated with age of
commencement of musical training. These findings highlight the significance of studying
the regional shape difference of brain structures as a marker of structural
neuroplasticity.
In an interesting study, the shape of the cortical hand region was so distinctive that it
was possible to distinguish musicians from non-musicians, and to classify musicians
according to their instrument specialty. Bangert and Schlaug (Bangert and Schlaug,
2006) have visually inspected the omega sign or the 'precentral knob' of the central
sulcus, a gross anatomical landmark of the precentral gyrus that corresponds to the
middle section of the central sulcus and is known to be a reliable landmark of hand
movement representation (Yousry et al., 1997). Musicians had more pronounced
omega sign compared to non- musicians. Also, string players had more pronounced

Review of Literature
38
omega sign expression on the right hemisphere unlike keyboard players who had more
pronounced expression on the left hemisphere. These findings reflect different
requirements for development of hand/finger motor skills among these musicians as
string players need to develop motor skill in their left, while keyboard players require
good skills in both hands or more in the right hand (Bangert and Schlaug, 2006). In
agreement, it has been shown that somatosensory cortical representation of the digits
of the left hand (the fingering hand) was larger in string players (Elbert et al., 1995),
which tends to correlate with early age of musical training.
Conventional MR and DTI studies of the WM tracts have supported the findings of
motor cortical plasticity as musicians exhibited greater size of the anterior half of the CC
indicating enhanced interaction between the motor areas of the two hemispheres
(Schlaug et al., 1995a, Lee et al., 2003). Also, probabilistic tractography of the
corticospinal tract revealed greater mean diffusivity in musicians (Imfeld et al., 2009).
High level musical performance requires precise timing and temporal integration of
movement, which are mediated by the cerebellum. Although the total cerebellar size
constitutes only one-tenth of the total brain size, the cerebellar cortex contains four
times the number of cells in the cerebral cortex (Andersen et al., 1992). Evidence of
structural cerebellar plasticity has been shown in several experimental paradigms in
animals, which reported significant plasticity in relation to motor skill acquisition. For
example, it has been shown that motor-skill learnt rats have more parallel and climbing
fiber synapses (Anderson et al., 1996, Kim et al., 2002), and that the volume of the
molecular layer of the cerebellar cortex is larger in trained rats and mice than in the
inactive group (Pysh and Weiss, 1979, Kleim et al., 1998). In accord, professional
musicians exhibited greater cerebellar GM density (Gaser and Schlaug, 2003b, a, Han
et al., 2009), and total cerebellar size (both GM and WM) compared to non-musicians
(Hutchinson et al., 2003). Structural plasticity of the cerebellum was correlated with
musical expertise as professional musicians showed greater GM density compared to
amateur musicians and non-musicians (Gaser and Schlaug, 2003b, a). Also, there was
a positive correlation between the intensity of musical practice and total cerebellar size

Review of Literature
39
(Hutchinson et al., 2003). Unfortunately, there were no reports on plasticity of the
cerebellar WM and cerebellar peduncles in musicians.
2.3.3 THE CORPUS CALLOSUM
The CC has received considerable interest in neuroimaging studies being the largest
WM tract in the brain (Blume, 1984, Witelson, 1985), the latest maturing neural network
(Pujol et al., 1993, Hasan et al., 2008, Hasan et al., 2009), and the most easily identified
structure on midsagittal MR images. The CC connects homologues cortical regions in
each cerebral hemisphere thereby playing a crucial role in many forms of unified motor,
sensory, and cognitive performances (Witelson, 1985). Manual cross-sectional area
measurement of the midsagittal CC revealed that musicians had greater anterior
(Schlaug et al., 1995a, Lee et al., 2003), and posterior (Ozturk et al., 2002) CC size
compared to controls. These differences were related to gender as only male musicians
have increased size of the anterior CC (Lee et al., 2003), and age of commencement of
musical training as increased CC size was observed in a group of musicians who
commenced training before age of 7 years. Possible factors contributing to increased
callosal size include more fibers crossing through the CC, thicker fibers, higher
proportion of myelinated fibers, or a combination of these changes (Cowell et al., 1992,
Schlaug et al., 1995a). The increased CC size in musicians might support enhanced
inter-hemispheric communication subserving bimanual motor control (anterior CC), and
auditory processing (posterior CC). There were few DTI studies that examined the CC
in musicians. Schmithorst and Wilke (Schmithorst and Wilke, 2002) performed whole-
brain DTI examination in a cohort of five musicians and seven non-musicians and
reported that musicians have greater FA value in the genu of the CC. Two other studies
reported no significant differences between musicians and non-musicians in all CC
regions (Bengtsson et al., 2005, Imfeld et al., 2009), although there was a significant
correlation between FA value of the body and splenium of the CC and total hours of
piano practicing in children aged less than 11 years (Bengtsson et al., 2005).

Review of Literature
40
2.4 FUNCTIONAL EVIDENCE OF PLASTICITY IN THE MUSICIAN’S BRAIN
It should be noted that the objective of the present work was to investigate structural
plasticity in musicians; however, I found it prudent to present functional evidence of
neuroplasticity as it allows better understanding of the effect of music and musical
training/practice on the brain.
2.4.1 AUDITORY AND SOMATOSENSORY SYSTEMS
Extensive musical training and practice were associated with enlarged cortical
representations in somatosensory and auditory regions in professional musicians. In the
somatosensory cortex, plastic changes were shown to be specific for the frequently
used fingers. In string players for example, cortical representation of the thumb was the
smallest compared to other fingers of the left hand and, in the case of the right hand,
there were no differences between musicians and non-musicians (Elbert et al., 1995). In
the auditory domain, neuronal representations were equivalent in both musicians and
non-musicians for pure tones of equal fundamental frequency and loudness. However,
when piano tones were presented, tonotopic cortical representation was 25% larger in
professional musicians (Pantev et al., 1998, Shahin et al., 2008). Moreover, a
comparison between violinists and trumpeters revealed that auditory cortical
representations were most pronounced for timbres of the instrument of training (Pantev
et al., 2001) suggesting that long-term musical performance has resulted in timbre
specificity for auditory processing.
The ability to detect incongruent rhythm is of extreme importance in musical
performance. Compared to non-musicians, professional musicians showed a mismatch
negativity (MMN), a marker of the pre-attentive detection of changes in regular
sequences of auditory stimuli (Picton et al., 2000), for subtle deviations of the rhythm
(Koelsch et al., 1999, Russeler et al., 2001). Likewise, musician children outperformed
non-musician children in the detection of incongruent pitch in both music and language
(Magne et al., 2006). The ability to detect wrong notes in sequential stimuli acts as a
feedback mechanism enabling musicians to adjust their performance for the best
outcome.

Review of Literature
41
Functional studies have elucidated that musicians and non-musicians have distinct
strategies to lateralize musical stimuli (Evers et al., 1999, Ohnishi et al., 2001, Limb,
2006, Limb et al., 2006). When passively listening to music, both groups tend to have
increased brain activity in different brain structures, including bilateral superior temporal
areas, left inferior parietal lobule, and right POP. However, musicians exhibited greater
left hemisphere lateralization in a network of neural structures, including the superior
temporal gyrus, planum temporale, POP, and inferior parietal lobule (Ohnishi et al.,
2001, Limb, 2006, Limb et al., 2006). Most of these regions are also involved in
language processing, which has led to the assumption that musicians tend to utilize an
analytic mode of music processing, which is much like that of language (Vuust et al.,
2005, Limb et al., 2006).
2.4.2 AUDITORY-SOMATOSENSORY INTEGRATION
Musical performance is a multimodal task that requires interaction and integration of
multiple sensory modalities. Multisensory integration was defined by (Meredith and
Stein, 1983) as an increase in neural response to a stimulus consisting of a combination
of modalities in comparison to the sum of neuronal responses to each stimulus
separately. The integration of multiple sensory inputs is especially important for
professional musicians as it contributes to new qualities of perception not available in
each sensory modality. Multisensory integration was investigated in a cohort of trumpet
players and non-musicians. Somatosensory (lips and digits) and auditory stimuli were
presented alone or in combination and responses were recorded using MEG (Schulz et
al., 2003). As expected, the unimodal auditory response was larger in musicians;
however, the unimodal somatosensory responses for lips and digits did not differ
between musicians and non-musicians. Combined auditory and somatosensory
stimulation of the lips in professional trumpet players revealed a multimodal interaction
(expressed as the difference between the multimodal response and the sum of
unimodal responses) in the somatosensory cortex, which was not seen in the control
group suggesting cross modal somatosensory-auditory plasticity in trumpet players that
is essential to master their instrument.

Review of Literature
42
2.4.3 THE MOTOR SYSTEM
In the motor domain, a shared finding across functional studies was a reduction in
hemodynamic response in professional musicians relative to non-musicians when
performing complex unimanual (Hund-Georgiadis and von Cramon, 1999, Krings et al.,
2000, Meister et al., 2005), and bimanual (Jancke et al., 2000, Haslinger et al., 2004)
motor tasks. Areas involved include the primary motor cortex, premotor cortex, and the
cerebellum (Hund-Georgiadis and von Cramon, 1999, Jancke et al., 2000, Krings et al.,
2000, Haslinger et al., 2004, Koeneke et al., 2004, Meister et al., 2005). Extensive hand
skill training allowed professional musicians to perform given finger movements through
recruiting smaller number of neurons compared to non-musicians. It was shown that
learning a new motor paradigm is not only easier for professional musicians, but also
accompanied by weaker hemodynamic responses in the prefrontal cortex (Haslinger et
al., 2004), a region known to be essential for skill learning being involved in imitation of
hand actions (Vogt et al., 2007), procedural sequence learning (Jenkins et al., 1994),
attention (Lau et al., 2004), and working memory (Robertson et al., 2001). It appears
that daily practicing of skilled movement has resulted in less attention to action and less
requirements for selection of the correct movement (Deiber et al., 1991, Botvinick et al.,
1999), and error detection (Cohen et al., 2000, Rowe et al., 2000). Moreover, behavioral
studies have indicated that musicians who began their musical training at an earlier age
(around seven years) exhibited better performance in motor tasks compared to
musicians who commenced their training later (Hughes and Franz, 2007, Watanabe et
al., 2007).
2.4.4 AUDITORY-MOTOR INTEGRATION
The unique auditory-motor expertise of professional musicians makes them an ideal
model to study integration between auditory and motor modalities. Activity in motor
areas was reported during sound listening, and auditory areas were active during
movement performance in skilled musicians suggesting the existence of a strong
auditory-motor link, so that co-activation of the other modality occurs even when the
task involves only auditory or only motor processing (Haueisen and Knosche, 2001,

Review of Literature
43
Lotze et al., 2003, Bangert et al., 2006, Baumann et al., 2007). This auditory-motor
integration is essential to provide fast feedback mechanism that enables musicians to
continuously coordinate complex movement patterns according to auditory input
(Bangert and Altenmuller, 2003).
2.4.5 VISUOSPATIAL COGNITION
Apart from efficient auditory and motor skills, dexterous musical performance requires
competent visuospatial cognition. Musical sight reading is the ability to read musical
notes and translate these notations into movement patterns (Sergent et al., 1992),
which is of paramount importance for professional musicians as it influences a
musician’s ability to perform a repertoire of rehearsed music. Music reading can be
considered as a visuospatial sensorimotor task that involves the visuospatial analysis of
symbolic input and the consequent generation of coordinated motor output (Stewart et
al., 2003). Interestingly, changing the systematic relationship between the vertical
position of a musical note and its corresponding position on the keyboard adversely
affected the performance of pianists but not musically naive subjects (Stewart et al.,
2004). Regions involved in sight reading ability include the left premotor cortex, Broca’s
area (specifically the POP), and superior parietal lobule of both hemispheres (Sergent
et al., 1992, Stewart et al., 2003), which were activated when subjects read, listen, and
play piano. There is a good evidence that professional musicians perform significantly
better than non-musicians in spatial ability tasks. Musicians exhibited better
performance scores than non-musicians in a test of spatial ability, the Benton judgment
of line orientation test, which was positively correlated with musicians’ age (Sluming et
al., 2002). Sluming and colleagues (Sluming et al., 2007) investigated musicians’
performance on a 3D mental rotation task, which is a complex spatial ability test that
involves stimulus identification, mental rotation, and decision making (Shepard and
Metzler, 1971). Both musicians and non-musicians showed increased activations in
premotor and superior parietal cortices; however, only musicians demonstrated
increased activation in Broca’s area. At the behavioral level, it has been shown that
musicians, unlike non-musicians, exhibited shorter reaction times when asked to detect
the position of a flashed target along the horizontal and vertical planes (Brochard et al.,

Review of Literature
44
2004, Patston et al., 2007). In support of the aforementioned functional evidence of
enhanced visuospatial cognition in musicians, structural studies reported increased size
of structures known to support visuospatial cognition, such as increased GM density in
the superior parietal lobule (Gaser and Schlaug, 2003b, a) and Broca’s area (Sluming et
al., 2002) in professional musicians. Table 2.1 summarizes findings of previous
neuroimaging studies in musicians.

Review of Literature
45
Table 2.1. Summary of previous neuroimaging studies comparing musicians and non-
musicians.
Motor system
• Increased GM density in Broca’s area in the
dominant hemisphere in male orchestral musicians
(
Structural
Sluming et al., 2002).
• Increased GM density in the left inferior frontal gyrus
in male and female pianists (Han et al., 2009).
• Increased FA value in the right posterior limb of the
internal capsule in musicians (Bengtsson et al., 2005,
Han et al., 2009).
• Decreased FA value in the corona radiata and
internal capsule bilaterally in musicians (Schmithorst
and Wilke, 2002).
• Decreased FA value in the corticospinal tract in
musicians, increased MD in the corticospinal tract in
musicians who began training before age of 7 years
compared to those who started later and non-
musicians (Imfeld et al., 2009).
• Increased total cerebellar volume in male pianists
(Schlaug et al., 1998, Hutchinson et al., 2003).
• Increased GM density in the right cerebellum in
pianists (Han et al., 2009) .
• Musicians had more pronounced omega sign
expression than controls. Keyboard-players had left
hemisphere advantage, while string players had right
hemisphere advantage (Bangert and Schlaug, 2006).
• Musicians showed greater local variability in the
anterior wall of the middle section (somatotopic hand
area) of the right central sulcus (Li et al., 2010).

Review of Literature
46
• Increased intra-sulcal length of the precentral gyrus
in the right hemisphere in musicians (Amunts et al.,
1997b).
• Increased FA in the central aspect of the cerebellum
in musicians (Schmithorst and Wilke, 2002).
• Reduced cerebellar recruitment in musicians during
bimanual and unimanual motor tasks (
Functional
Koeneke et al.,
2004).
• Reduced recruitment of motor association areas
during bimanual (Jancke et al., 2000, Haslinger et al.,
2004), and unimanual (Hund-Georgiadis and von
Cramon, 1999, Jancke et al., 2000, Krings et al.,
2000, Meister et al., 2005) motor tasks in musicians.

Review of Literature
47
Auditory system
• Increased left-sided asymmetry of planum temporale
in musicians with absolute pitch ability compared to
those who don’t have this ability and non-musicians
(
Structural
Schlaug et al., 1995b, Zatorre et al., 1998, Keenan
et al., 2001, Luders et al., 2004).
• Increased volume of the anteromedial part of the
Heschl gyrus in musicians (Schneider et al., 2002).
• Fundamental pitch listeners had increased GM
volume of the left lateral Heschl gyrus, whereas
spectral pitch listeners had increased GM volume of
the right lateral Heschl gyrus (Schneider et al., 2005).
• Increased GM density and cortical thickness in the
posterolateral aspect of the right Heschl gyrus in
musicians (Bermudez et al., 2009).
• Increased N-acetylaspartate concentrations in the
planum temporale in musicians (Aydin et al., 2005).
• Increased GM density in the right planum temporale
in musicians (Bermudez and Zatorre, 2005).
• Increased cortical thickness of the right and left
planum temporale in musicians (Bermudez et al.,
2009).
• Musicians had left hemisphere, while controls have
right hemisphere lateralization of music perception as
detected using trans-cranial doppler sonography
(
Functional
Evers et al., 1999) and fMRI (Ohnishi et al., 2001,
Limb, 2006, Limb et al., 2006).
• Increased auditory cortical representation of piano
tones in pianists compared to control subjects
(Pantev et al., 1998).

Review of Literature
48
• Violinists and trumpeters showed evidence of timbre-
specific enhancement of auditory cortical
representation related to instrument specialty (Pantev
et al., 2001).
• GM density and cortical thickness in the right Heschl
sulcus and bilateral intra-parietal sulci predicted
relative pitch task performance in musicians (Foster
and Zatorre).
• Musicians had greater right posterior temporal and
supramarginal gyrus activation during a pitch
memory task (Gaab and Schlaug, 2003).
• Increased multimodal (auditory-somatosensory)
integration in trumpet players compared to controls
(Schulz et al., 2003).
• Evidence of shared auditory-sensorimotor activation
in professional pianists while performing motor task
or passive listening (Lotze et al., 2003, Bangert et al.,
2006, Baumann et al., 2007).
• Musicians had increased GM density in the left
primary sensorimotor cortex (
Structural
Han et al., 2009).
• Musicians showed greater local variability in the
anterior wall of the middle section (somatotopic hand
area) of the right central sulcus (Li et al., 2010).
• Increased cortical representation of the digits (second
to fifth) of the left hand in violinists (
Functional
Elbert et al.,
1995).
• Increased somatosensory cortical representation in
skilled pianists (Pantev et al., 1998).
Somatosensory
System

Review of Literature
49
• Increased GM density of the superior parietal lobule
in professional musicians compared to amateurs and
controls (
Structural
Gaser and Schlaug, 2003a).
• Increased GM density in Broca’s area of the left
inferior frontal gyrus in orchestral musicians (Sluming
et al., 2002).
• Bilateral activation of the visual cortex during verbal
memory retrieval task in musicians (
Functional
Huang et al.,
2010).
• Increased activation in Broca’s area when performing
a 3D mental rotation (visuospatial) task in musicians
(Sluming et al., 2007).
• No significant differences between musicians and
non-musicians in total volumes of prefrontal cortical
subfields (
Structural
Sluming et al., 2002).
• Increased cortical thickness of the dorsolateral frontal
cortex in musicians (Bermudez et al., 2009).
• Reduced recruitment of the prefrontal cortex during
bimanual motor task in musicians (
Functional
Haslinger et al.,
2004).
• Increased activation of the prefrontal cortex during
music improvisation in pianists (Bengtsson et al.,
2007).
• Involvement of the left dorsolateral subfield of the
prefrontal cortex in music processing and perception
(Zatorre et al., 1998, Ohnishi et al., 2001) in
musicians with absolute ability but not in musicians
Visuospatial
System
Higher cerebral functions/
Prefrontal cortex

Review of Literature
50
without this ability (Zatorre et al., 1998), and non-
musicians (Ohnishi et al., 2001).
• Increased induced gamma-band response, a
measure of attention, expectation, and memory
retrieval in adult musicians and after one year of
musical training in children musicians compared to
non-musicians (Trainor et al., 2009b).
• Increased cross-sectional area of the anterior
(Schlaug et al., 1995a, Ozturk et al., 2002, Lee et al.,
2003), and posterior (Ozturk et al., 2002) halves of
the midsagittal CC in musicians.
• Evidence of gender versus musicianship interaction
as only male musicians had increased size of the
anterior CC (Lee et al., 2003).
• Increased FA in the genu of the CC (Schmithorst and
Wilke, 2002).
• No significant differences between musicians and
non-musicians in FA values in the anterior and
posterior halves of the CC (Imfeld et al., 2009).
• Increased FA value of the superior longitudinal
fasciculus in musicians with absolute pitch ability
compared to musicians without this ability and non-
musicians (Oechslin et al., 2009).
White matter CC
Superior
Longitudinal
Fasciculus

Review of Literature
51
2.5 FACTORS GOVERNING USE-DEPENDENT NEUROPLASTICITY IN
MUSICIANS
The literature suggests the presence of four factors that govern neuroplasticity in
musicians’ brains:
2.5.1 AGE OF STARTING MUSICAL TRAINING
Several studies reported a negative association between the observed structural-
functional changes in musicians’ brains and age of starting musical training. This means
that the earlier the musicians started their training the more robust were the observed
changes relative to non-musicians (Elbert et al., 1995, Schlaug et al., 1995a, Amunts et
al., 1997b, Jancke et al., 1997, Pantev et al., 1998, Schlaug et al., 1998, Ohnishi et al.,
2001, Schlaug, 2001, Lotze et al., 2003, Koeneke et al., 2004, Bengtsson et al., 2005,
Imfeld et al., 2009, Li et al., 2010). It appears that a critical period exists in the human
development when intensive brain stimulation would result in long lasting structural-
functional changes. Considering that maturation cycle differs between GM and WM
structures, and among different brain regions (Ostby et al., 2009, Giedd et al., 2010,
Tiemeier et al., 2010), plastic changes in specific brain regions are expected to be most
robust when musical training/practice takes place at a specific age that coincides with
the peak of the maturation cycle of that region.
2.5.2 DURATION OF MUSICAL TRAINING AND PRACTICE INTENSITY
Some studies reported a positive correlation between long-term musical performance
(years) and structural plasticity (Sluming et al., 2002, Hutchinson et al., 2003, Aydin et
al., 2005, Abdul-Kareem et al., 2011). Although functional studies reported evidence of
plasticity even after short-term musical training (minutes-days-weeks) in musically naive
subjects (Pascual-Leone, 2001, Tremblay and Kraus, 2002, Bangert and Altenmuller,
2003, Lappe et al., 2008), a corresponding structural plasticity in such a short time may
be difficult to demonstrate at the current resolution of MR scanners as most structural
changes would be at the level of neuronal dendrites and synapses.

Review of Literature
52
2.5.3 MUSICAL EXPERTISE
Few studies compared professional musicians with amateur musicians and non-
musicians and revealed a significant effect of musical expertise, so that professionals
had greater GM volume and functional activations compared to other groups (Schneider
et al., 2002, Bangert and Altenmuller, 2003, Gaser and Schlaug, 2003b, Lotze et al.,
2003).
2.5.4 TYPE OF INSTRUMENT
Playing a piano, a violin, or a trumpet might induce instrument-specific plastic changes,
which means that instrument specialty should be taken into account when investigating
neuroplasticity in musicians (Elbert et al., 1995, Pantev et al., 2001, Schneider et al.,
2005, Bangert and Schlaug, 2006, Shahin et al., 2008). However, it is difficult to select a
musician who is mono-instrumental as most musicians play more than one instrument.
In addition, nearly all musicians play piano even when they specialize in different
instrument. In the present work, multi-instrumental cohorts were recruited; as the
regions examined (Broca’s area, CC, and cerebellum) were known to subserve several
musically relevant functions common to all musicians, it was predicted that structural
changes could be seen in all musicians irrespective of their instrument specialty.
To conclude, the literature suggests that studying neuroplasticity offers better
understanding of brain reorganization in health and disease, and that musicians
represent an ideal model to explore this process in the human brain. There is
convincing anatomical-functional evidence that musicians’ brains differ from non-
musicians. Possible microscopic events associated with reported macroanatomical
changes in musicians’ brains include strengthening of pre-existing synapses, generation
of new synapses, increased dendritic arborization and axonal projections, and formation
of new neurons. More work is required in the future to explore these microscopic
changes in vivo. Although the influence of genetics on brain structure cannot be
excluded (Tramo et al., 1998, Joshi et al., 2011), the observed anatomical-functional
changes in brains of musicians were considered as evidence of use-dependent
adaptation in response to environmental enrichment as they were correlated with

Review of Literature
53
factors, such as age of starting musical training, duration of musical performance,
musical expertise, and instrument specialty.
2.6 IS IT POSSIBLE TO TRANSFER NEUROPLASTIC EFFECT OF MUSIC TO
NON- MUSICIANS?
Although long-term musical practice has been linked to neuroplasticity (Sluming et al.,
2002, Hutchinson et al., 2003, Aydin et al., 2005, Abdul-Kareem et al., 2011), evidence
of brain plasticity was shown even following short-term musical training in musically
naive subjects (Pascual-Leone, 2001, Tremblay and Kraus, 2002, Lappe et al., 2008).
For instance, Bangert and Altenmuler (Bangert and Altenmuller, 2003) recorded cortical
activation patterns after only 20 minutes of performing auditory and motor tasks. This
effect was further enhanced after 5 weeks of practice. Similar effects were produced in
musically naive subjects who mentally practiced motor tasks over five days as
measured by mapping of the responses to transmagnetic stimulation (Pascual-Leone,
2001). Together, these findings indicate that music could induce instant plasticity in the
brain within a short period of time. In line with these findings, several groups
investigated the effect of music and musical training in learning and cognitive skill
development. It has been shown that learning to play a musical instrument in childhood
stimulates cognitive development, and leads to enhanced spatial, verbal, reading, and
mathematical skills (Gardiner et al., 1996, Rauscher et al., 1997, Chan et al., 1998, Ho
et al., 2003, Trainor et al., 2009a).
Apart from its pronounced effect on healthy subjects, music could have therapeutic
effect. The wealth of literature suggesting music-induced plasticity in the human brain
has sparked the emergence of a new field in rehabilitation medicine, ‘music therapy’ (for
review, see (Hassler, 2000). This type of therapy uses music and musical instruments
to restore, maintain, and improve neurological and psychological functions. For
example, Schneider and colleagues (Schneider et al., 2007) designed a music-
supported training program for motor skill rehabilitation in musically naive stroke
patients. The program was based on results of previous studies, which suggested that
playing music induce auditory-motor integration (Bangert et al., 2006, Baumann et al.,

Review of Literature
54
2007). It consisted of training the paralyzed extremity followed by training both the
paralyzed and unparalyzed extremities using either a piano or electronic drum pads.
After 3 weeks of training, patients showed significant improvement in speed, precision,
and smoothness of movements, which was attributed to training-induced auditory-motor
coupling that allowed patients to judge their execution of movements based on auditory
feedback. This study set a good example of applying data derived from musicians’
studies in the clinical field. Apart from stroke, music therapy was used for treating and
rehabilitating a variety of disorders, such as schizophrenia (Ulrich et al., 2007),
depression (Hsu and Lai, 2004), Parkinson's disease (Chuma, 2007), Alzheimer’s
disease (Irish et al., 2006, Svansdottir and Snaedal, 2006), chronic tinnitus (Argstatter
et al., 2007), and several others. However, the exact way of how hearing or practicing
music could produce therapeutic effects has not yet been resolved.
2.7 STATEMENT OF THE PROBLEM AND JUSTIFICATION OF THE WORK
After systematically reviewing structural studies conducted on musicians’ brains, I found
that more investigations are required to study structural plasticity in distinct brain
regions, which have not been previously covered. The objective of this work was to
investigate evidence of structural plasticity in three brain regions: Broca’s area, CC, and
cerebellum in musicians. A shared characteristic among these regions is their widely
distributed cortical connections and involvement in diverse musically relevant functions.
Four studies were conducted in the present work:
Study 1- Investigating structural plasticity of POP and PTR in musicians. This study is
presented in chapter 4.
Study 2- Investigating the effect of musical expertise on regional morphometry of the
CC. This study is presented in chapter 5.
Study 3- Investigating regional macro- and microstructural plasticity of the CC in
musicians. This study is presented in chapter 6.
Study 4- Investigating structural plasticity of cerebellar WM in musicians. This study is
presented in chapter 7.

Review of Literature
55
Broca’s area
Snell, 2001
is located within the inferior frontal gyrus and is composed of two subparts,
POP and PTR ( ). Although traditionally considered a language region, recent
functional studies have assigned many functions to Broca’s area, which are of particular
importance for musical performance (Sergent et al., 1992, Martinkauppi et al., 2000,
Limb et al., 2006, Sluming et al., 2007). So far, previous studies have reported on GM
density changes of Broca’s area using VBM (Sluming et al., 2002, Gaser and Schlaug,
2003b, a). No previous study has specifically examined the two parts of Broca’s area. A
previous study performed at Magnetic Resonance and Image Analysis Research Centre
(MARIARC) has used VBM to examine a cohort of 52 orchestral musicians and non-
musicians (Sluming et al., 2002). Results showed that musicians had increased GM
density in Broca’s area in the left dominant hemisphere. In the present work, I re-
examined the same cohort using manual volumetry with the rationale of providing
automatic-manual cross-validation of the VBM results and, most importantly, to perform
separate morphometric analysis of Broca’s area subparts (POP and PTR) as it has
been shown that they are anatomically (Amunts et al., 1999, Schenker et al., 2008), and
functionally (Demb et al., 1995, Papathanassiou et al., 2000, Bookheimer, 2002, Chein
et al., 2002, Heiser et al., 2003, Cone et al., 2008) segregated, and have distinct cortical
connections (Xiang et al., 2009). In particular, recent studies have assigned a
substantial role for the left POP in audiomotor integration (Lahav et al., 2007). Using
stereology, I performed manual tracing of these subparts to measure GM and WM
volumes of POP and PTR in each cerebral hemisphere. Furthermore, cortical surface
areas of POP (BA44) and PTR (BA45) were measured to provide another perspective
of plasticity in Broca’s area in musicians (study 1).
The structure of the CC
Schlaug et
al., 1995a
was examined in two separate studies (study 2 and 3). These
investigations were sought to address research questions not previously answered.
First, the current evidence suggests that age of commencing musical tuition (
) and gender (Lee et al., 2003) play a significant role in shaping structural
plasticity of the CC in musicians. However, the literature suggests another important
factor that influences plasticity in musicians’ brains namely, musical expertise.
Compared to amateurs and non-musicians, a previous VBM study demonstrated that

Review of Literature
56
professional musicians had greater GM density in different brain regions, although it
failed to find a significant effect on WM structures, including the CC, which was
attributed to weakness of the VBM technique itself (Gaser and Schlaug, 2003a).
Investigating structural differences between professionals, amateurs, and non-
musicians might provide a good evidence to support the theory of training-induced
structural plasticity. Therefore, I set the goal to examine the effect of musical expertise
on CC structure through dividing the midsagittal CC into four callosal regions: CC1
(rostrum/genu/anterior body), CC2 (anterior midbody), CC3 (posterior midbody), and
CC4 (isthmus/splenium) and comparing cross-sectional areas of these regions between
professional musicians, amateur musicians, and non-musicians (study 2).
Second, most previous studies have used conventional MR to report on increased
macrostructure (cross-sectional area) of the CC (Schlaug et al., 1995a, Ozturk et al.,
2002, Lee et al., 2003). Postmortem studies in humans and animals have indicated that
increased CC size might not actually reflect increased number of fibers crossing
through the CC, but rather increased inter-fiber distance (Tomasch, 1954, Lamantia and
Rakic, 1990, Aboitiz et al., 1992). In accord, recent DTI studies revealed great
discrepancy between macro- and microstructure of the CC (Pfefferbaum and Sullivan,
2002, Westerhausen et al., 2006). Combining macrostructural measures with
microstructural ones would thus be the best approach when studying the CC. To the
best of my knowledge, no study has examined both regional macrostructure and
microstructure of the CC in musicians. The latter may provide better evidence of
structural plasticity of the CC in musicians. I therefore combined conventional MR
morphometry and DTI-based tractography to compare regional macrostructure (cross-
sectional area) and microstructure (average FA, MD, tract volume and number of
streamlines) of four callosal regions (mentioned above) between musicians and non-
musicians (study 3).
Apart from its role in movement coordination and motor learning (Mauk et al., 1998,
Thach, 1998), the cerebellum
Kim et al., 1994
is also involved in several other functions essential for
enabling high level musical performance, such as memory retention, sensory
acquisition, auditory discrimination, and cognition ( , Flament et al.,

Review of Literature
57
1996, Gao et al., 1996, Parsons et al., 1997, Belin et al., 1998, Hund-Georgiadis and
von Cramon, 1999, Doyon et al., 2003, Parsons et al., 2009, Stoodley et al., 2010). To
date, previous studies have reported on total volume and GM density of the cerebellum
in musicians with no reports on cerebellar WM. With the exception of one study, which
reported on total cerebellar volumes (GM and WM combined), results of structural
studies that examined musicians’ cerebella were always reported roughly as additional
findings. In view of the diverse cerebellar connections and functions, investigating
cerebellar WM plasticity in musicians is essential. The main WM tracts of the
cerebellum are the SCP and MCP. The SCP is the major output pathway that links the
cerebellum to the cerebrum, while the MCP carries fibers from the cerebrum to the
cerebellum thus completing a circle that connects cerebral and cerebellar cortices. It is
through this circle that the cerebellum exerts its control on cerebral cortical output
thereby ensuring the most highly refined motor output (Snell, 2001). Another justification
for studying cerebellar WM in musicians could be derived from developmental studies,
which showed that while the cerebellar cortex (GM) reaches its maximum life time
maturation by the age of two years, the WM of the cerebellum continues to develop into
adolescence (Saksena et al., 2008, Ostby et al., 2009, Wu et al., 2011) making it more
vulnerable to plastic changes. No previous study has specifically examined the WM of
the cerebellum and, most importantly, there were no reports on SCP and MCP plasticity
in musicians. To fill this gap, I used DTI-based tractography to examine the major
cerebellar pathways, the SCP and MCP. Using this technique, quantitative
measurements of average FA, tract volume, and number of streamlines of SCP and
MCP were compared between musicians and non-musicians. In addition, high
resolution anatomical images were automatically segmented to perform group-wise
comparison of GM and WM volumes of cerebellar hemispheres (study 4).
2.8 SIGNIFICANCE OF THE PRESENT WORK
This work involved series of investigations set to explore structural plasticity in different
brain regions using multiple cohorts and a multitude of morphometric techniques.
Results of the present work were sought to extend the currently expanding literature

Review of Literature
58
suggesting the presence of use-dependent structural plasticity in musicians’ brains.
Findings would enhance our understanding of music-brain interaction, and may help to
direct future structural and functional studies in musicians. In rehabilitation medicine,
these findings may be used as baseline data when designing therapeutic models.
2.9 RESEARCH AIMS AND KEY OBJECTIVES
To summarize, the objective of the present work was to answer the following research
questions:
• Are there differences between musicians and non-musicians in the GM /WM
volumes of POP and PTR parts of Broca’s area? Are there differences
between musicians and non-musicians in cortical surface area measurements
of BA44 and BA45? These research questions are addressed in study 1,
chapter 4.
• Are there differences between professional musicians, amateur musicians, and
non-musicians in regional cross-sectional area measurements of midsagittal
CC? This research question is addressed in study 2, chapter 5.
• Are there differences between musicians and non-musicians in regional
macrostructural (cross-sectional area) and microstructural (average FA, MD,
tract volume, and number of streamlines) measures of the CC? Is there a
correlation between macrostructure (cross-sectional area) and microstructure
(average FA) of CC subregions? These research questions are addressed in
study 3, chapter 6.
• Are there differences between musicians and non-musicians in microstructural
measures (average FA, tract volume, and number of streamlines) of SCP and
MCP? Are there differences between musicians and non-musicians in GM and
WM volumes of cerebellar hemispheres? These research questions are
addressed in study 4, chapter 7.

Review of Literature
59
2.10 RESEARCH HYPOTHESES OF THE PRESENT WORK
2.10.1 STUDY 1-INVESTIGATING STRUCTURAL PLASTICITY OF POP AND PTR IN
MUSICIANS
I hypothesized that orchestral musicians would show evidence of increased GM volume
in the left POP region (BA44) of Broca’s area of the inferior frontal gyrus of the left
(dominant) cerebral hemisphere. This hypothesis was based on the following evidence:
first, several musically relevant functions, such as musical syntax processing, detection
of music-structural irregularities (Maess et al., 2001, Koelsch, 2006), audiospatial
localization (Martinkauppi et al., 2000), and sight reading (Sergent et al., 1992) were
shown to selectively activate the left POP/BA44 indicating a potential role of this region
in subserving these functions. Second, musicians tend to use an analytic mode of music
processing that is identical to that of language (Vuust et al., 2005, Limb et al., 2006) as
evidenced by activation of the left POP and left planum temporale when passively
listening to music (Ohnishi et al., 2001, Limb, 2006, Limb et al., 2006). This left
hemisphere dominance in music processing in musicians contrasts with right
hemisphere dominance in musically naive listeners (Johnson, 1977, Gordon, 1980).
Therefore, I predicted that my right-handed orchestral musicians would show evidence
of selective structural enlargement of the POP in the left (dominant) cerebral
hemisphere. Third, in particular, the left POP/BA44 has been considered a central
component of the human mirror neuron network (Iacoboni et al., 1999, Binkofski and
Buccino, 2006) that is activated by the execution of manual action and by hearing of the
same action performed by others (Tettamanti et al., 2005, Lahav et al., 2007) indicating
its essential role in audiomotor integration. In this context, functional studies have
indicated that, compared to non-musicians, professional musicians possess an
auditory-motor network that includes the left POP (Haslinger et al., 2005, Bangert et al.,
2006). This network insures co-activation of the other modality even when the task
involves only auditory or only motor processing (Haueisen and Knosche, 2001, Lotze et
al., 2003, Bangert et al., 2006, Baumann et al., 2007). In orchestral performance, the
auditory-motor network has two main advantages: it allows fast feedback mechanism
that enables musicians to continuously coordinate complex motor actions according to

Review of Literature
60
auditory input (Bangert and Altenmuller, 2003), and it maintains sequence-specific
priming of action representations together with unconscious stimulations and
predictions for the next coming action or sound (Lahav et al., 2007). The above-
mentioned functions of the left POP/BA44 are essential for all musicians irrespective of
their instrument specialty, hence of relevance to the multi-instrumental cohort examined
in the present study. Furthermore, since previous studies have indicated that neuronal
density is positively correlated with cortical surface area (Rockel et al., 1974, Henery
and Mayhew, 1989, Sisodiya et al., 1996, Sisodiya and Free, 1997), I hypothesized that
orchestral musicians would show increased cortical surface area in the left BA44.
2.10.2 STUDY 2-INVESTIGATING EFFECT OF MUSICAL EXPERTISE ON REGIONAL
MORPHOMETRY OF THE CC
I hypothesized that professional musicians would show increased size of CC1 (rostrum,
genu, and anterior body), CC3 (posterior midbody), and CC4 (isthmus and splenium)
regions compared to amateur musicians and non-musicians. According to postmortem
human studies, the size of the CC is positively correlated with the number of crossing
fibers (Aboitiz et al., 1992). Consequently, structural enlargement of CC1, CC3, and
CC4 regions is essential to support the need for stronger inter-hemispheric
communication in musicians’ brains.
The CC1 region contains fibers from the prefrontal cortex (Park et al., 2008), which is
critically involved in several functions essential for enabling high level musical
performance, such as skill acquisition (Vogt et al., 2007), attention (Lau et al., 2004),
music processing and perception (Zatorre et al., 1998, Ohnishi et al., 2001), and spatial
working memory (Robertson et al., 2001). A larger CC1 size is therefore essential to
support these functions in professional musicians. Regarding CC3 region, several DTI
reports have demonstrated that callosal motor fibers cross through this region (Hofer
and Frahm, 2006, Park et al., 2008, Chao et al., 2009). In particular, CC3 contains
fibers that connect hand areas of the primary motor cortex of the two cerebral
hemispheres (Wahl et al., 2007). I hypothesized that, since previous studies reported
reduced right-to-left asymmetry in the size of the primary motor cortex (Amunts et al.,
1997a), and reduced transcallosal inter-hemispheric inhibition between hand motor

Review of Literature
61
cortical areas (Ridding et al., 2000) in professional musicians, which are reflected by
increased hand skill symmetry and bimanual coordination skills compared to non-
musicians (Amunts et al., 1997a, Jancke et al., 2000, Haslinger et al., 2004), the size of
this region would be larger in professional musicians to maintain high-level bimanual
motor skills. Similarly, since previous MR studies revealed evidence of structural
enlargement of the parietal and temporal cortical regions in professional musicians,
including the primary somatosensory cortex (Han et al., 2009), superior parietal lobule
(Gaser and Schlaug, 2003a), Heschl gyrus (Schneider et al., 2002, Bermudez et al.,
2009), and planum temporale (Bermudez et al., 2009), which was shown to be reflected
at the functional level by enhanced somatosensory cortical representation (Elbert et al.,
1995), better visuospatial performance (Sergent et al., 1992, Sluming et al., 2002,
Stewart et al., 2003), and increased auditory cortical representation of music tones
(Pantev et al., 1998), I hypothesized that professional musicians would show evidence
of use-dependent structural adaptation in the form of increased size of CC4 region,
which connects parietal (primary somatosensory cortex and superior parietal lobule),
and auditory (Heschl gyrus and planum temporale) cortical regions.
2.10.3 STUDY 3- INVESTIGATING REGIONAL MACRO- AND MICROSTRUCTURAL
PLASTICITY OF THE CC IN MUSICIANS
I hypothesized that my findings of increased macrostructure (cross-sectional areas) of
CC1 and CC4 regions in professional musicians (reported in study 2) would be
replicated in the present study. Furthermore, I proposed that increased size of CC1 and
CC4 regions would be reflected, at the microstructural level, by increased fiber density,
axonal projections, and sprouting (indicated by increased number of streamlines),
thicker myelination and/or increased diameter of fibers (indicated by increased tract
volume), increased coherence, directionality, and integrity of fiber bundles (indicated by
increased average FA value), and more restrictions to diffusion by the surrounding
cellular components (indicated by reduced MD value). Increased FA values in
professional musicians would suggest that molecular displacement is stronger parallel
to than perpendicular to the axon orientation indicating increased directionality and
alignment of axonal fibers. Reduced MD values may suggest the presence of a larger

Review of Literature
62
number of axons (more membrane) and/or more myelin material (Beaulieu, 2002),
which result in attenuation of molecular diffusion. I hypothesized that these
microstructural changes are triggered by the need for stronger and more effective inter-
hemispheric communications in professional musicians.
2.10.4 STUDY 4-INVESTIGATING PLASTICITY OF CEREBELLAR WHITE MATTER IN
MUSICIANS
I hypothesized that professional musicians, being involved in complex sensorimotor and
cognitive skill acquisition, would show evidence of structural plasticity in WM and GM
regions of cerebellar hemispheres. In particular, I hypothesized that music performance
would induce structural plastic changes in SCP and MCP tracts in the form of increased
fiber density, axonal projections, and sprouting (indicated by increased number of
streamlines), thicker myelination and/or increased diameter of fibers (indicated by
increased tract volume), increased coherence, directionality and integrity of fiber
bundles (indicated by increased average FA value). This hypothesis was based on
findings of several studies that reported cerebellar involvement in a variety of musically
relevant functions, such as motor skill acquisition and sequence learning (Anderson et
al., 1996, Kim et al., 2002, Koeneke et al., 2004), auditory discrimination (Parsons et al.,
2009), spatial (mental orientation) and working memory (Stoodley et al., 2010),
cognition (Flament et al., 1996, Doyon et al., 2003), and early error detection and
correction phase of motor and cognitive skill learning (Flament et al., 1996, Doyon et al.,
2003). I proposed that skilful musical practice would enhance the neural activity thereby
resulting in increased fiber density, diameter, myelination, and coherence of SCP/MCP
tracts. In addition, the relatively longer maturation cycle of cerebellar WM compared to
GM (Saksena et al., 2008, Ostby et al., 2009, Wu et al., 2011) may indicate that SCP
and MCP are exposed to the effect of environmental enrichment, in the form of musical
practice, for a long period of time sufficient to impose structural plastic changes in these
tracts.

63
CHAPTER 3 GENERAL METHODS

General Methods
64
3.1 AIM
The aim of this chapter is to present a general framework for methods used in the
present work. First, a brief description of examined cohorts, measurements obtained in
each cohort, and MR data acquisitions is presented, with detailed description provided
in related chapters. Second, an introduction to general principles of methods used in the
present work is provided namely, stereology, diffusion tensor imaging, and fiber
tractography. Image analysis methods used in more than one study are presented in
this chapter to avoid repetition in subsequent chapters. Other methods are presented in
related chapters. Results and technical limitations of all methods are presented in
‘results’ and ‘discussion’ sections of related chapters, respectively.
3.2 COHORTS EXAMINED IN THE PRESENT WORK
As stated in chapter 2, four studies were conducted in the present work to answer the
proposed research questions. To perform these studies, three cohorts of age, gender,
and handedness-matched musicians and non-musicians were examined. Outcome
measures were compared between groups. In addition, correlation analyses between
outcome measures and demographic factors, such as gender, age of commencing
musical tuition, and duration of musical performance were performed. Below is a
summary of cohorts examined in the present work. A detailed description of these
cohorts is presented in related chapters.
• Cohort 1 (study 1) - Retrospective data; these were collected by Vanessa
Sluming at Magnetic Resonance and Image Analysis Research Centre
(MARIARC), University of Liverpool. The cohort included 26 right-handed male
orchestral musicians and 26 right-handed male non-musicians.
• Cohort 2 (study 2) - Retrospective data; these were collected by Peter
Schneider at University of Heidelberg. The cohort included 36 right-handed
male subjects: 12 professional musicians, 12 amateur musicians, and 12 non-
musicians.

General Methods
65
• Cohort 3 (study 3 and 4) - Data collected by the PhD student, Ihssan Adeeb
Abdul-Kareem at MARIARC, University of Liverpool. The cohort included 13
musicians and 13 non-musicians. In each group, there were 12 right-handed
subjects and 1 left-handed subject. Prior to performing DTI data analysis, fiber
reconstruction of the CC, SCP and MCP was performed to verify the reliability
of tracking method and its consistency with anatomical and DTI atlases.
Reconstruction of the CC tracts was feasible in all subjects in a manner
consistent with the description of known anatomical and DTI atlases. For
reconstruction of the SCP and MCP tracts, this was only feasible in 20/26
subjects (10 musicians and 10 non-musicians; 9 right-handed /1 left-handed in
each group). For subsequent studies, cohort 3 was divided into two subcohorts:
Cohort 3A (study 3), for investigating regional macro- and
microstructure of the CC in musicians, I examined 12 right-handed
musicians (9 males and 3 females) and 12 right-handed non-musicians
(9 males and 3 females). The two left-handed subjects (1 musician/1
non-musician) were excluded from this study (see chapter 6- subjects
section 6.3.1, page 188 for details).
Cohort 3B (study 4), for investigating SCP and MCP tractography and
cerebellar morphometry in musicians, I examined 10 musicians (7
males and 3 females) and 10 non-musicians (7 males and 3 females).
Each group has 9 right-handed subjects and 1 left-handed subject.
The 6 subjects (3 musicians and 3 non-musicians) in whom
tractography was not consistent with DTI atlases were excluded from
this study (see chapter 7- results section 7.5.2.1, page 232 for details).

General Methods
66
3.3 EXAMINATIONS PERFORMED IN EACH COHORT
Cohort one
• Comparison of GM and WM volumes of POP and PTR between orchestral
musicians and non-musicians using a manual morphometric technique.
• Comparison of cortical surface area measurements of BA44 and BA45 between
orchestral musicians and non-musicians using an automatic user- independent
technique.
Cohort two
• Comparison of cross-sectional areas of four callosal regions: CC1 (rostrum/
genu/anterior body), CC2 (anterior midbody), CC3 (posterior midbody), and
CC4 (isthmus and splenium) between professional musicians, amateur
musicians and non-musicians. These measurements were obtained using a
manual morphometric technique.
Cohort three
• A, comparison of cross-sectional areas of the CC1 (rostrum/genu/anterior
body), CC2 (anterior midbody), CC3 (posterior midbody), and CC4 (isthmus
and splenium) regions between musicians and non-musicians. These
measurements were obtained using a manual morphometric technique. Also,
comparison of average FA, MD, tract volume, and number of streamlines of
corresponding callosal regions using DTI-based tractography.
• B, comparison of average FA, tract volume, and number of streamlines of SCP
and MCP between musicians and non-musicians using DTI-based
tractography; and comparison of GM and WM volumes of cerebellar
hemispheres between musicians and non-musicians using an automatic
morphometric technique.
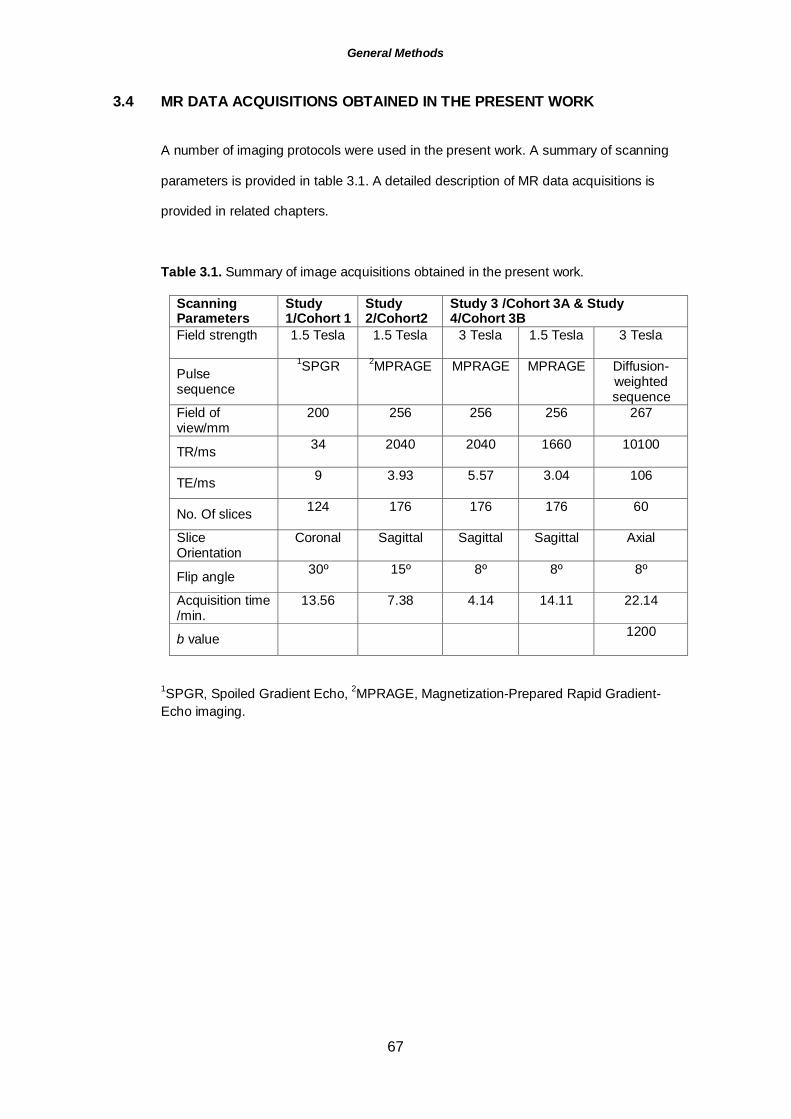
General Methods
67
3.4 MR DATA ACQUISITIONS OBTAINED IN THE PRESENT WORK
A number of imaging protocols were used in the present work. A summary of scanning
parameters is provided in table 3.1. A detailed description of MR data acquisitions is
provided in related chapters.
Table 3.1. Summary of image acquisitions obtained in the present work.
Scanning Parameters
Study 1/Cohort 1
Study 2/Cohort2
Study 3 /Cohort 3A & Study 4/Cohort 3B
Field strength
1.5 Tesla 1.5 Tesla 3 Tesla 1.5 Tesla 3 Tesla
Pulse sequence
1SPGR 2 MPRAGE MPRAGE MPRAGE Diffusion-weighted sequence
Field of view/mm
200 256 256 256 267
TR/ms 34 2040 2040 1660 10100
TE/ms 9 3.93 5.57 3.04 106
No. Of slices 124 176 176 176 60
Slice Orientation
Coronal Sagittal Sagittal Sagittal Axial
Flip angle 30º 15º 8º 8º 8º
Acquisition time /min.
13.56 7.38 4.14 14.11 22.14
b value 1200
1SPGR, Spoiled Gradient Echo, 2MPRAGE, Magnetization-Prepared Rapid Gradient-Echo imaging.

General Methods
68
3.5 IMAGE ANALYSIS METHODS APPLIED IN THE PRESENT WORK
3.5.1 METHODS USED IN MORE THAN ONE STUDY
Methods used in more than one study are presented in this chapter to avoid repetition in
subsequent chapters, these include:
• Manual measurement of intracranial volume (ICV) (study 1 and 2; chapter 4
and 5, respectively).
• Manual cross-sectional area measurement of CC regions (study 2 and 3;
chapter 5 and 6, respectively).
• Pre-processing of DTI data and selection of tractography parameters (study 3
and 4; chapter 6 and 7, respectively).
Furthermore, an introduction to basic principles of stereology technique, DTI, and
tractography is presented in this chapter.
3.5.2 METHODS PRESENTED IN SPECIFIC CHAPTERS
These methods are presented in related chapters, they include:
• Manual measurement of GM and WM volumes of POP and PTR regions (study
1, chapter 4).
• Automatic measurement of cortical surface area of BA44 and BA45 (study 1,
chapter 4).
• Fiber tractography of CC regions (study 3, chapter 6).
• Automatic measurement of ICV (study 3 and 4; chapter 6 and 7,
respectively).
• Fiber tractography of the SCP and MCP (study 4, chapter 7).
• Automatic measurement of GM and WM volumes of cerebellar hemispheres
(study 4, chapter 7).
A summary of recruited cohorts, measurements obtained in each study, and image
analysis softwares applied in the present work is presented in table 3.2. Results of all
image analysis methods and technical limitations are presented in related chapters.

General Methods
69
Table 3.2. Summary of cohorts, measurements, and image analysis softwares. M,
musicians; N, non-musicians; P, professional musicians; A, amateur musicians.
Cohorts Measurements Manual/automatic
technique
Software
Study 1
Chapter 4
Cohort 1
26/26 M/N
Males
All right-handed
• ICV
• GM and WM volumes
of POP/PTR
• Cortical surface areas
of BA44/45
Manual
Manual
Automatic
EasyMeasure
EasyMeasure
BrainVoyager
Study 2 Chapter 5
Cohort 2
12/12/12 P/A/N
Males
All right-handed
• ICV
• Cross-sectional areas
of CC1-CC4 regions
Manual
Manual
EasyMeasure
ImageJ
Study 3 Chapter 6
Cohort 3A
12/12 M/N
9 males & 3
females
All right-handed
• ICV
• Cross-sectional areas
of CC1-CC4 regions
• Tractography metrics
of CC1-CC4 tracts:
FA, MD, tract volume,
and number of
streamlines
Automatic
Manual
Manual/Automatic
FreeSurfer
ImageJ
MedINRIA
Study 4 Chapter 7
Cohort 3B
10/10 M/N
7 males & 3
females
9 right-handed &
1 left-handed
• ICV
• GM and WM volumes
of cerebellar
hemispheres
• Tractography metrics
of SCP and MCP
tracts: FA, tract
volume, and number
of streamlines
Automatic
Automatic
Manual/Automatic
FreeSurfer
FreeSurfer
MedINRIA

General Methods
70
3.6 PRINCIPLES OF STEREOLOGY
Stereology is a method used to manually estimate the volume of structures of arbitrary
size and shape (Gundersen and Jensen, 1987). It enables accurate unbiased volume
estimation to be obtained for only a reasonable workload (Roberts et al., 2000). Most
stereology techniques use the Cavalieri method for volume estimation, which was
named in honor of Bonaventura Cavalieri (1598-1647) who was the first to consider
measurement of volume via the analysis of sections through three-dimensional (3D)
solid objects.
3.7 THE CAVALIERI METHOD
The Cavalieri section method is an unbiased volume estimator technique of modern
design stereology. Modern design based techniques use sampling strategies to
maximize efficiency (Gundersen and Jenson, 1987, Roberts et al., 1994a). The
Cavalieri sections method requires that, beginning from a uniform random starting
position within the sectioning interval, a structure of interest is exhaustively sectioned
with a series of parallel planes (or sections) at a constant distance apart. An estimate of
volume 𝑉𝑉 can be obtained without bias by multiplying the total area of all sections
through the structure by the sectioning interval T (figure 3.1) as in Equation 3.1 (Roberts
et al., 2000).
𝑒𝑒𝑒𝑒𝑒𝑒1 𝑉𝑉 = T (𝐴𝐴1 + 𝐴𝐴2 +⋯ 𝐴𝐴𝑛𝑛) Equation 3.1
Where 𝐴𝐴1, 𝐴𝐴2,... 𝐴𝐴𝑛𝑛 denote the section areas, and T is the sectioning interval for the n
consecutive sections.

General Methods
71
Fig.3.1. The basis of Cavalieri sections method of volume estimation. From (Howard
and Reed, 1998).

General Methods
72
3.7.1 VOLUME ESTIMATION IN MR IMAGES
Measurement of section areas is often difficult in 3D MR images. In this case, an
unbiased estimate of volume can be obtained using an interactive point counting
technique (Roberts et al., 1994b, Roberts et al., 2000, Garcia-Finana et al., 2003). It
has been shown that this method of volume estimation is both more efficient and more
precise than manual tracing (Gundersen and Osterby, 1981, Mathieu et al., 1981).
The point counting method involves overlying each MR image with a regular grid of test
points (figure 3.2A). The test system should have new random position and orientation
on each slice. After each superimposition, the number of test points hitting the structure
of interest is counted on each section. An unbiased estimator of section area 𝐴𝐴𝑖𝑖
becomes
𝑒𝑒𝑒𝑒𝑒𝑒𝐴𝐴𝑖𝑖 = (𝑎𝑎/𝑝𝑝) 𝑃𝑃𝑖𝑖 Equation 3.2
Where 𝑃𝑃𝑖𝑖 is the number of points counted and (𝑎𝑎/𝑝𝑝) represent the area associated with
each point (figure 3.2A) corrected for any minification or magnification of the image as it
is displayed on the computer screen. The volume estimator (in mm3
𝑒𝑒𝑒𝑒𝑒𝑒2𝑉𝑉 = 𝑇𝑇 (𝑎𝑎/𝑝𝑝) (𝑃𝑃1 + 𝑃𝑃2 + ⋯𝑃𝑃𝑛𝑛) Equation 3.3
) using point count
is thus
Where 𝑃𝑃1 , 𝑃𝑃2 , ... 𝑃𝑃𝑛𝑛 denote the point counts. The notation 𝑒𝑒𝑒𝑒𝑒𝑒2𝑉𝑉 indicates that the
volume estimator is based upon two sampling processes, sectioning the structure of
interest into slices, and point counting on slices. In this work, the intersection of the
upper right quadrant of the red cross was taken as the “point” (figure 3.2B).

General Methods
73
Fig.3.2. A, the grid system used for estimating slice volumes. The square around the
cross on the bottom row indicates the area associated with that “point”. From (Howard
and Reed, 1998). B, the intersection of the upper right quadrant of the red cross was
taken as the “point”.
A
B B

General Methods
74
3.8 STEREOLOGICAL MEASUREMENTS PERFORMED IN THE PRESENT
WORK
In the present work, stereology was used to measure ICVs and GM/WM volumes of
POP and PTR regions. Method of ICV measurement is presented here, while method of
measurement of GM/WM of POP and PTR is presented in chapter 4.
3.9 MEASUREMENT OF INTRACRANIAL VOLUME
Manual measurement of ICV using stereology was performed in study 1 and 2, which
are presented in chapter 4 and 5, respectively.
3.9.1 IMAGE PRE-PROCESSING
This was performed using BrainVoyager software, version 1.9 (www.Brainvoyager.com,
Brain Innovation, Maastricht, The Netherlands). The anatomical data of each subject
were converted from (DICOM) format into BrainVoyager's internal (VMR) data format.
Original coronal images were spatially transformed to the sagittal plane, and the
acquired voxels of original size 0.781 X 0.781 X 1.6 mm were re-sampled into 1 X 1 X 1
mm isotropic voxels using cubic spline interpolation. Images were then re-aligned
according to the bicommissural plane (anterior commissure-posterior commissure
plane, ACPC plane). First, the anterior commissure (AC) was identified on a sagittal
view closest to the midline and verified on transverse and coronal views. The sagittal
image was then rotated such that the inferior part of the posterior commissure (PC) is
viewable in transverse view. This was followed by rotating the coronal and axial images
so that the brain is divided into symmetrical halves (figure 3.3). Images were then
exported to (ANALYZE) format.

General Methods
75
Fig. 3.3. A, the anterior (AC) and posterior commissures (PC) depicted on a sagittal T1-
weighted MR image. B, method of re-alignment of brain images according to the ACPC
plane. Top row, the AC was first demarcated on the sagittal view and verified on other
views. Bottom row, the sagittal image was then rotated so that the brain is re-aligned
according to ACPC plane. This was followed by rotating the coronal and axial images
so that the green cross divides the brain into symmetrical halves.
AC PC
General Methods
76
3.9.2 DEFINITION OF INTRACRANIAL VOLUME
Intracranial volume was defined as the volume of the supra-tentorial space, including all
cerebral tissue and cerebrospinal fluid spaces (figure 3.4). Posteriorly, the definition
included the superior sagittal sinus and the confluence of sinuses. In slices where the
cerebellum was not visible, the pontocrural sulcus provided the inferior boundary, as
this is approximately the level where the tentorium cerebelli is attached to the anterior
clinoid process. This level in the superior-inferior extent was maintained throughout the
brainstem from posterior to anterior. If the pontocrural sulcus was not visible, then the
narrowest part of the brainstem formed the inferior boundary.
3.9.3 STEREOLOGICAL PARAMETERS FOR INTRACRANIAL VOLUME MEASUREMENT
Parameters selected for ICV measurements were a grid size (pixels) = 15 pixels, area
associated with each test point, (𝑎𝑎/𝑝𝑝) = 225 mm2 Mackay et al., 1998 ( ), and section
interval (T) was every 15 sections. Since final voxel size after iso-voxel transformation
was 1 X 1 X 1 mm, then T = 15 X 1 mm = 15 mm.
3.9.4 STEREOLOGICAL MEASUREMENTS
Images were reoriented to the coronal plane using ImageJ software, version 1.38
available online at http://rsb.info.nih.gov/ij/, NIH, USA). Stereological measurements
were performed using EasyMeasure software (Puddephat, 1999) on series of coronal
MR sections. Images were always displayed using consistent image window and
display levels on the same monitor with fixed screen contrast settings.

General Methods
77

General Methods
78

General Methods
79
Fig 3.4. Illustration of Intracranial volume measurement using Cavalieri method with
point counting, before (left) and after (right) point counting.

General Methods
80
3.10 MEASUREMENT OF CROSS-SECTIONAL AREA OF CC REGIONS
Measurement of cross-sectional area of CC regions was performed in study 2 and 3,
which are presented in chapter 5 and 6, respectively.
The fact that there are no macroscopic anatomical landmarks that clearly delimit distinct
callosal areas in the midsagittal plane urged scientists to design partitioning schemes to
divide the CC into regions (Clarke et al., 1989, Witelson, 1989, Denenberg et al., 1991,
Weis et al., 1993, Rajapakse et al., 1996, Hampel et al., 1998) in order to facilitate
structural-functional correlation. Most of previous studies used Witelson’s scheme for
subdividing the CC into 7 regions. These callosal subdivisions were based mainly on
studies of monkeys (Pandya et al., 1971, Barbas and Pandya, 1984, Cipolloni and
Pandya, 1985), and postmortem studies in humans (de Lacoste et al., 1985). In the
present work, a modification of Witelson’s scheme (Witelson, 1989) was used to divide
the CC into 4 regions. The CC1 region corresponds to rostrum, genu, and anterior part
of the body (areas 1-3 of Witelson’s scheme), CC2 region corresponds to anterior
midbody (area 4 of Witelson’s scheme), CC3 region corresponds to posterior midbody
(area 5 of Witelson’s scheme), and CC4 region corresponds to isthmus and splenium
(areas 6-7 of Witelson’s scheme). The same division scheme was followed in previous
studies (Jones and Basser, 2004, Shimony et al., 2006).
3.10.1 IMAGE PRE-PROCESSING
BrainVoyager was used to convert the anatomical data of each subject from (DICOM)
format into BrainVoyager's internal (VMR) data format. Images were then exported to
(ANALYZE) format. Using MRIcro (www.mricro.com, Chris Rorden, University of South
Carolina, Columbia, SC, USA), images were first corrected for rotation through parallel
alignment of the inter-hemispheric plane of the brain with the sagittal plane of images
followed by extracting the midsagittal slice according to the following criteria (Ozturk et
al., 2002) (figure 3.5):
• In the sagittal view, it is the slice in which the callosal sulcus, peak of
4th ventricle, and the cerebral aqueduct are distinct.

General Methods
81
• In the transverse view, it is the slice that passes through the middle of 3rd
• In the coronal view, it is the slice that passes through the septum pellucidum.
ventricle, pineal gland, and cerebellar vermis.
The midsagittal slice was then rotated, so that the line connecting the ventral most
points of the anterior and posterior CC is horizontally oriented.
3.10.2 CROSS-SECTIONAL AREA MEASUREMENT
The maximal length of the CC was taken as the line joining the most anterior and
posterior points of the CC on the midsagittal image. Three perpendicular lines were
drawn at equal intervals along the widest antero-posterior line of the midsagittal CC,
which resulted in dividing the CC into four regions (CC1-CC4) (figure 3.6). Manual
cross-sectional area measurement of these regions was next performed using ImageJ
software, version 1.38 available online at http://rsb.info.nih.gov/ij/, NIH, USA).

General Methods
82
Fig. 3.5. Criteria for selecting the midsagittal slice. Top, coronal view; middle, sagittal
view; bottom, transverse view. 1, septum pellucidum; 2, callosal sulcus; 3, cerebellar
vermis; 4, cerebral aqueduct; 5, peak of 4th ventricle; 6, 3rd
ventricle; 7, pineal gland.

General Methods
83
Fig. 3.6. Method of subdividing the CC on midsagittal T1-weighted MR image. Right,
three perpendicular lines were drawn at equal intervals along the widest antero-
posterior line of the CC. Left, the resulted four callosal regions (CC1-CC4) depicted in
colours, red, yellow, blue and green, respectively.
General Methods
84
3.11 INTRODUCTION TO PRINCIPLES OF DIFFUSION TENSOR IMAGING
3.11.1 OVERVIEW OF DIFFUSION TENSOR IMAGING
Diffusion tensor imaging (DTI) has revolutionalized the field of WM mapping. This MRI-
based methodology, originally described by (Basser et al., 1994b, a), has emerged as
an ideal tool for noninvasive assessment of WM structure in the human brain in vivo
(Basser et al., 1994b, Pierpaoli et al., 1996). It is the method of choice for characterizing
the diffusivity of water molecules in the human brain, and can provide unique
biologically and clinically relevant information that is not available from other imaging
modalities (Basser et al., 1994b, Pierpaoli et al., 1996). DTI-derived quantitative
parameters could help to characterize tissue composition, the physical properties of
tissue constituent, tissue microstructure, and its architectural organization. The
approach also provides unique access to in vivo information about the topography of
major fiber tracts.
3.12 DIFFUSION OF WATER AND DIFFUSION-WEIGHTED IMAGING
3.12.1 DIFFUSION OF WATER
The diffusion process refers to constant random movement of molecules driven by the
ambient temperature of the substance of interest. This process is known as Brownian
motion as Robert Brown first described it in 1827 to explain the motion of pollen grains
suspended in water. In diffusion-weighted imaging, we are interested in the diffusion of
water molecules driven by body temperature. The rate of diffusion at a fixed
temperature can be described by the following Equation (Einstein, 1956):
𝐷𝐷 = < 𝛥𝛥𝛥𝛥2 >/2𝑛𝑛𝛥𝛥𝑒𝑒 Equation 3.4
According to the Equation, the diffusion coefficient 𝐷𝐷 (in mm2
Alexander et al., 2007
/s) is proportional to the
mean squared displacement < 𝛥𝛥𝛥𝛥2 > divided by the number of dimensions, 𝑛𝑛, and the
diffusion time, 𝛥𝛥𝑒𝑒 ( ).

General Methods
85
In biological tissues, millions of water molecules move inside, outside, around, and
through cellular structures. Water diffusion is largely induced by random thermal
fluctuations; however, it is also modulated by the interactions with various barriers and
hindrances that interfere with in vivo diffusion, such as cell membranes, myelin sheath,
protein filaments, and organelles (Thomsen et al., 1987, Alexander et al., 2007).
Quantitation from diffusion-weighted imaging is therefore described in terms of an
‘apparent diffusion coefficient’ (ADC), rather than a ‘diffusion coefficient’ because we do
not observe free diffusion of water (Parker, 2004, Roberts and Schwartz, 2007). For
convenience, I will from now on mostly use the term ‘apparent diffusion coefficient’ and
the symbol ADC instead of ‘diffusion coefficient’ and D. Changes in the degree of
restriction to water diffusion (for example by changes in cellular density, degree of
myelination, or average intercellular spacing) are reflected in changes in the diffusion-
weighted signals. Therefore, the water molecules that influence the diffusion-weighted
signal may be considered as probes that yield microstructural insights into the state of
the tissue (Parker, 2004).
3.12.2 ISOTROPIC AND ANISOTROPIC DIFFUSION
The term isotropic diffusion describes equal rate of molecular motion in all directions
(figure 3.7). In the human brain, isotropic diffusion may occur in the cerebrospinal fluid
spaces (Pierpaoli et al., 1996), and may closely be approximated in GM regions where
no dominant underlying structural orientation exists (Pierpaoli et al., 1996, Alexander et
al., 2007). Conversely, in anisotropic diffusion, movement of water molecules is not
equal for all directions as can be found in WM fiber tracts where axonal membranes and
myelin sheaths present barriers to the diffusion of water. Water diffusion is highly
restricted in directions perpendicular to the fiber orientation, while it is relatively
unimpeded in the direction parallel to the fibers resulting in larger ADC values parallel to
the WM tracts rather than orthogonal to them (Basser and Jones, 2002, Mukherjee et
al., 2008a).

General Methods
86
Fig. 3.7. Illustration of isotropic unrestricted diffusion, isotropic restricted diffusion, and
anisotropic restricted diffusion. Modified from (Mukherjee et al., 2008a).
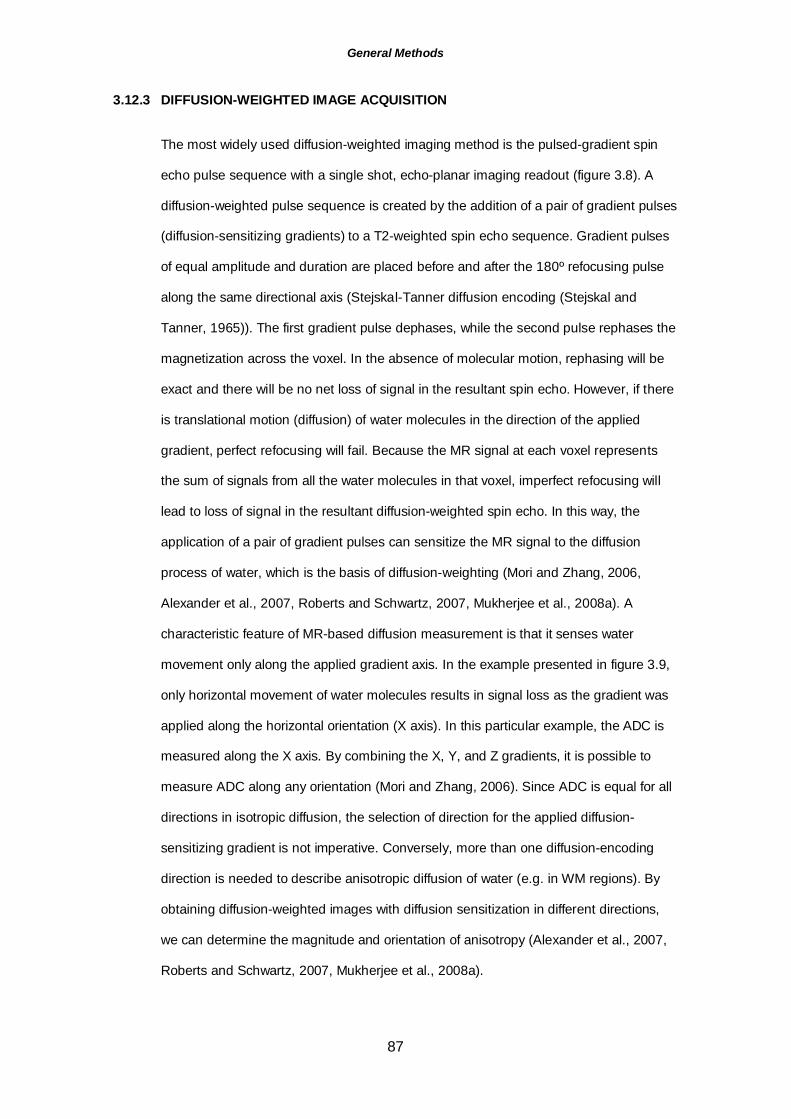
General Methods
87
3.12.3 DIFFUSION-WEIGHTED IMAGE ACQUISITION
The most widely used diffusion-weighted imaging method is the pulsed-gradient spin
echo pulse sequence with a single shot, echo-planar imaging readout (figure 3.8). A
diffusion-weighted pulse sequence is created by the addition of a pair of gradient pulses
(diffusion-sensitizing gradients) to a T2-weighted spin echo sequence. Gradient pulses
of equal amplitude and duration are placed before and after the 180º refocusing pulse
along the same directional axis (Stejskal-Tanner diffusion encoding (Stejskal and
Tanner, 1965)). The first gradient pulse dephases, while the second pulse rephases the
magnetization across the voxel. In the absence of molecular motion, rephasing will be
exact and there will be no net loss of signal in the resultant spin echo. However, if there
is translational motion (diffusion) of water molecules in the direction of the applied
gradient, perfect refocusing will fail. Because the MR signal at each voxel represents
the sum of signals from all the water molecules in that voxel, imperfect refocusing will
lead to loss of signal in the resultant diffusion-weighted spin echo. In this way, the
application of a pair of gradient pulses can sensitize the MR signal to the diffusion
process of water, which is the basis of diffusion-weighting (Mori and Zhang, 2006,
Alexander et al., 2007, Roberts and Schwartz, 2007, Mukherjee et al., 2008a). A
characteristic feature of MR-based diffusion measurement is that it senses water
movement only along the applied gradient axis. In the example presented in figure 3.9,
only horizontal movement of water molecules results in signal loss as the gradient was
applied along the horizontal orientation (X axis). In this particular example, the ADC is
measured along the X axis. By combining the X, Y, and Z gradients, it is possible to
measure ADC along any orientation (Mori and Zhang, 2006). Since ADC is equal for all
directions in isotropic diffusion, the selection of direction for the applied diffusion-
sensitizing gradient is not imperative. Conversely, more than one diffusion-encoding
direction is needed to describe anisotropic diffusion of water (e.g. in WM regions). By
obtaining diffusion-weighted images with diffusion sensitization in different directions,
we can determine the magnitude and orientation of anisotropy (Alexander et al., 2007,
Roberts and Schwartz, 2007, Mukherjee et al., 2008a).
General Methods
88
The signal detected in the diffusion-weighted MR image is determined by the ADC and
a measure of diffusion-weighting, b. The signal attenuation due to the application of the
pulse gradients can be related to the amount of diffusion using the following Equation
(Alexander et al., 2007, Mukherjee et al., 2008a):
𝑆𝑆𝑖𝑖 = 𝑆𝑆0 𝑒𝑒−𝑏𝑏𝐴𝐴𝐷𝐷𝐴𝐴𝑖𝑖 Equation 3.5
Where 𝑆𝑆𝑖𝑖 is the diffusion-weighted signal intensity observed at a given voxel with the
diffusion-sensitizing gradients applied along direction 𝑖𝑖, 𝑆𝑆0 is the signal intensity at the
same voxel measured without any diffusion-sensitizing gradients, and 𝐴𝐴𝐷𝐷𝐴𝐴𝑖𝑖 is the ADC
in the 𝑖𝑖 direction. The diffusion-weighting factor, 𝑏𝑏 is measured in s/mm2
Stejskal and Tanner, 1965
and calculated
according to the following Equation ( ):
𝑏𝑏 = 𝛾𝛾2G2𝛿𝛿2(∆− 𝛿𝛿/3) Equation 3.6
Where 𝛾𝛾 is the gyromagnetic ratio, G is the amplitude of the applied diffusion-sensitizing
gradient measured in milliteslas per meter, 𝛿𝛿 is the duration of each diffusion gradient in
milliseconds and ∆ is the time interval between these gradients, measured in
milliseconds (Alexander et al., 2007, Mukherjee et al., 2008a). According to Equation
3.5, increasing the b value increases the degree of diffusion-weighting (i.e. signal
attenuation 𝑆𝑆𝑖𝑖 along direction 𝑖𝑖). From Equation 3.6, it can be seen that increasing the
gradient amplitude and duration (G and 𝛿𝛿, respectively) are the most efficient methods
of raising the diffusion-weighting. Higher ADC values, which indicate greater amount of
water motion, result in lower signal intensity in the diffusion-weighted MR image. On the
other hand, reduced ADC values lead to higher signal intensity in the diffusion-weighted
MR image (Mukherjee et al., 2008a).

General Methods
89
Fig. 3.8. A, Illustration of the spin echo sequence formed by applying 90° and 180° RF
(radiofrequency) pulses. TE, echo time. B, adding two diffusion-sensitizing gradients
(dark gray rectangles) transforms the spin echo sequence into a diffusion-weighted spin
echo sequence (note the reduction in signal amplitude). The diffusion-weighting factor b
depends on the amplitude of the diffusion gradient (G), the duration of the diffusion
gradient (δ), and the separation between the diffusion gradients (∆). Modified from
(Roberts and Schwartz, 2007).
A
B

General Methods
90
Fig. 3.9. A diagram demonstrating the relationship between diffusion of water molecules
and gradient applications. Circles represent water molecules, with vectors (arrows) in
the circles represent phases of the signal. The pulse gradient is applied along the
horizontal orientation. Molecular motion between the two gradient applications causes
imperfect refocusing of the phases by the second gradient resulting in signal loss. In
this example, horizontal movement of water molecules (left-right yellow arrow) results in
signal attenuation, while vertical movement (up-down green arrow) does not influence
the signal intensity. Modified from (Mori and Zhang, 2006).

General Methods
91
3.12.4 QUANTITATION OF ADC BY MRI
The signal intensity generated with diffusion-weighted imaging also depends on proton
density, spin–lattice relaxation time (T1), and spin–spin relaxation time (T2), in addition
to machine parameters, TR (repetition time) and TE (echo time) (Mori and Zhang,
2006). These additional weightings could result in erroneous analysis of a diffusion-
weighted image when viewed in isolation. In particular, T2 prolongation resulting from
pathology (e.g. in the presence of edema) may lead to diffusion-weighted signal
hyperintensity, even when ADC values are not reduced, a phenomenon known as “T2
shine-through” (Rowley et al., 1999). On the other hand, reduction in T2 may mask a
real reduction in ADC values, a phenomenon known as “T2 blackout” (Maldjian et al.,
2001). This issue has received a considerable interest in clinical diagnosis.
To calculate pure ADC maps, where the ADC is the sole source of contrast, we need to
acquire two sets of images with differing b values. In general, one set of images
acquired at a low b value (≈ 0 s/mm2) (non-diffusion-weighted), and a second set of
diffusion-weighted images acquired at a high b value (e.g. 1000 s/mm2
Mori
and Zhang, 2006
), while other
imaging parameters (TR and TE) remain the same. The pair of images with differing b
values would eliminate the confounding weighting (from proton density and T2) (
, Roberts and Schwartz, 2007). It is possible to quantify the ADC on a
voxel-by-voxel basis by solving for ADC in Equation 3.5 (Stejskal and Tanner, 1965):
𝐴𝐴𝐷𝐷𝐴𝐴𝑖𝑖 = −I𝑛𝑛 �𝑆𝑆𝑖𝑖𝑆𝑆0� /𝑏𝑏 Equation 3.7
Where I𝑛𝑛 is the natural logarithm. 𝑆𝑆𝑖𝑖 is the signal intensity at a given voxel for the image
acquired with higher b value. 𝑆𝑆0 is the signal intensity at the same voxel of the image
acquired with b = 0.
To calculate the diffusion tensor, D, at least six diffusion encoded image sets need to be
acquired along noncollinear directions in addition to at least one b = 0 s/mm2
Basser et al., 1994a
(or low b)
image set ( ) (see below).

General Methods
92
3.12.5 ESTIMATION OF THE DIFFUSION TENSOR
The direction of maximum diffusivity has been shown to coincide with the WM fiber tract
orientation (Moseley et al., 1990). In order to correctly estimate the orientation of the
dominant direction of diffusion within a voxel (the orientation with the largest ADC), we
need to measure diffusion along thousands of axes, which is impractical. The model of
“diffusion tensor” was thus introduced by Basser and colleagues to accurately find the
direction and degree of anisotropy (Basser et al., 1994b, a), hence the name ‘‘diffusion
tensor imaging’’. The term DTI describes consecutive diffusion-weighted image
acquisitions which have been obtained with encoding in different directions to estimate
the diffusion tensor. The diffusion tensor, a 3 X 3 matrix representation, is a
mathematical model of the 3D pattern of diffusion anisotropy of WM tracts:
D = �𝐷𝐷𝑥𝑥𝑥𝑥 𝐷𝐷𝑥𝑥𝑥𝑥 𝐷𝐷𝑥𝑥𝑥𝑥𝐷𝐷𝑥𝑥𝑥𝑥 𝐷𝐷𝑥𝑥𝑥𝑥 𝐷𝐷𝑥𝑥𝑥𝑥𝐷𝐷𝑥𝑥𝑥𝑥 𝐷𝐷𝑥𝑥𝑥𝑥 𝐷𝐷𝑥𝑥𝑥𝑥
� Equation 3.8
The tensor, D, is basically a matrix of numbers (diffusion coefficients) derived from
diffusivity measurements in at least six noncollinear directions, which we can use to
estimate the diffusivity in any arbitrary direction or determine the direction of maximum
diffusivity. The elements of the tensor above the diagonal are always equal to those
below the diagonal; the tensor matrix is therefore diagonally symmetric (𝐷𝐷𝑖𝑖𝑖𝑖 = 𝐷𝐷𝑖𝑖𝑖𝑖 ) with
only six of the tensor’s matrix’s nine elements are independent necessitating a minimum
of six diffusion-encoded measurements to correctly estimate the diffusion tensor. If we
use more than six encoding directions, we can improve the accuracy of the tensor
measurement for any arbitrary orientation (Jones et al., 1999a).There are three
commonly used methods for estimating the tensor: nonlinear least squares, weighted
linear least squares, and the most common is ordinary least squares (Basser et al.,
1994a, Jones and Cercignani, 2010).
The tensor matrix is subjected to a linear algebraic procedure known as “matrix
diagonalization”, which extracts the three eigenvectors of the diffusion tensor (the
dominant direction of diffusion, V1, in addition to orthogonal minor directional

General Methods
93
information, V2 and V3) together with the corresponding three eigenvalues (𝜆𝜆R 1, 𝜆𝜆R 2, and
𝜆𝜆R 3
The best way to understand the information provided by the diffusion tensor is to
visualize it geometrically. The tensor efficiently fits the angular variation of the ADC
values to the shape of a 3D ellipsoid (
) representing the ADCs along these axes.
Mori and Zhang, 2006). The orientation of the
ellipsoid is defined by the three eigenvectors of the tensor, and its shape is
characterized by the three eigenvalues (Basser et al., 1994b). Three main classes of
diffusion tensors may be described (Parker, 2004) (figure 3.10): class I represents the
case where 𝜆𝜆 1 ≈ 𝜆𝜆 2 ≈ 𝜆𝜆 3. The diffusion in this case is isotropic and the diffusion
ellipsoid has the shape of a sphere as the ADC is equal for all directions. This is the
form of tensor expected in cerebrospinal fluid spaces. Class II represents the case
where 𝜆𝜆 1> (𝜆𝜆 2 ≈ 𝜆𝜆 3) indicating a greater mean diffusion distance along the longest
axis of the ellipsoid. The diffusion ellipsoid is cigar-shaped (prolate). Class III represents
the case where (𝜆𝜆 1 ≈ 𝜆𝜆 2) > 𝜆𝜆 3. The dominant direction of diffusion in this situation is
less distinct indicating an ambiguous fiber orientation and the diffusion ellipsoid is disk-
shaped (oblate). The vector of the longest axis (V1), also named the principal
eigenvector, with its associated eigenvalue 𝜆𝜆R 1
Because it is very difficult to visualize 3D vectors on 2D images, the fiber orientation
information inherent in the principal eigenvector can be visualized using a colour-coded
orientation map (
indicate the direction and magnitude of
greatest water diffusion (maximum diffusivity), respectively (Mori and Zhang, 2006). The
principal eigenvector is important for fiber tractography algorithms because it reflects
the orientation of axonal fiber bundles.
3.12.6 COLOUR-CODED MAPS OF THE DIFFUSION TENSOR
Pajevic and Pierpaoli, 1999). The most basic red–green–blue (RGB)
colour-coded scheme indicates a colour for each orientation of the fibers X, Y and Z; the
colour of the largest ADC is determined, and a colour is assigned for each pixel. Fibers
running from left to right are represented in red because the ADC is greatest along the
X-axis; likewise, fibers running antero-posteriorly are represented in green, and fibers
running infero–superiorly are represented in blue (Mori and Zhang, 2006) (figure 3.11).

General Methods
94
Fig. 3.10. Classes of diffusion tensor ellipsoids (A) and their ADC profiles (B).
Eigenvalues (X 10-6 mm2/s): 1, class I: 781, 670, 670; 2, class II: 1042, 529, 529; 3,
class II: 1773, 164, 164; and 4, class III: 931, 931, 283. Trace = 2100 X 10-6 mm2/s.
ADC profile axes are represented in 10-6 mm2 Parker, 2004/s. Modified from ( ).

General Methods
95
Fig. 3.11. The Principle of DTI. Diffusion measurements are obtained along multiple
axes (A), which allow estimation of the shape and orientation of the 3D ellipsoid (B). A
fractional anisotropy map (D) can be generated from the shape. Dark regions represent
isotropic diffusion (spherical), and bright regions represent anisotropic diffusion (cigar-
shaped). From the estimated 3D ellipsoid (B), the orientation of the longest axis can be
identified (C), which reflects the orientation of axonal fiber bundles. This orientation
information is converted to a colour (F) at each pixel. To visualize the fiber orientation
information, a colour-coded map is generated (E). Modified from (Mori and Zhang,
2006).

General Methods
96
3.13 QUANTITATIVE DTI-DERIVED METRICS
A number of diffusion metrics can be obtained from the three eigenvalues, which could
then be used to probe the microstructure in a particular voxel.
3.13.1 TRACE OF THE TENSOR
The trace of the tensor (Tr) summarizes the total diffusivity, it is the sum of the three
eigenvalues:
Trace (Tr) = 𝜆𝜆1 + 𝜆𝜆2 + 𝜆𝜆3 Equation 3.9
3.13.2 MEAN DIFFUSIVITY
The mean diffusivity (MD) describes the directionally averaged diffusivity of water within
a voxel. The MD is obtained from the following Equation:
𝑀𝑀𝐷𝐷 = 𝜆𝜆1+ 𝜆𝜆2+ 𝜆𝜆3 3
= Tr/3 Equation 3.10
Diffusivity can be divided into an axial (longitudinal) diffusivity component (𝜆𝜆 ||,
diffusion along the axons), which corresponds to the principal eigenvalue of the
diffusion tensor (𝜆𝜆 || = 𝜆𝜆 1), and a radial diffusivity component (𝜆𝜆 ⊥, diffusion
perpendicular to the axons), which is calculated by averaging the second and third
eigenvalues: 𝜆𝜆 ⊥ = (𝜆𝜆 2 + 𝜆𝜆 3) / 2 (Alexander et al., 2007).
3.13.3 FRACTIONAL ANISOTROPY AND RELATIVE ANISOTROPY
Fractional anisotropy (FA) and relative anisotropy (RA) characterize different ways in
which the diffusion tensor field deviates from being isotropic. The FA and RA indices
determine the degree of directionality of intra-voxel diffusivity (Mukherjee et al., 2008a).
FA and RA can be defined by the following Equations (Basser et al., 1994b, Pierpaoli
and Basser, 1996):
FA = �12 �(𝜆𝜆1−𝜆𝜆2)2+ (𝜆𝜆2−𝜆𝜆3)2+ (𝜆𝜆3−𝜆𝜆1)2
�𝜆𝜆12+ 𝜆𝜆2
2+ 𝜆𝜆32
Equation 3.11

General Methods
97
RA = �(𝜆𝜆1−𝜆𝜆2)2+ (𝜆𝜆2−𝜆𝜆3)2+ (𝜆𝜆3−𝜆𝜆1)2
𝜆𝜆1 + 𝜆𝜆2 + 𝜆𝜆3 Equation 3.12
When 𝜆𝜆1 is much larger than the 𝜆𝜆2 and 𝜆𝜆3, anisotropy measures (FA and RA) will be
high, representing a preferred direction of water diffusion (cigar-shaped diffusion). A
cigar-shaped diffusion within a brain voxel usually represents a single coherent WM
tract with axons coinciding with the principal eigenvector (Mukherjee et al., 2008a).
3.14 INTERPRETATION OF DTI-DERIVED METRICS
The literature indicates that DTI serves as a powerful tool for detecting microscopic
changes in tissue properties. DTI-derived measures can provide information about the
microstructural features of WM, which include intra-axonal organization, density of
fibers, degree of myelination, and individual fiber diameter (Mori and Zhang, 2006, Sun
et al., 2006). The FA has become the most widely used invariant measure of anisotropy
in the DTI literature. In healthy WM, FA can range between values of 0.1 (isotropic;
diffusivity is equal in all directions), as in cerebrospinal fluid and GM, to almost 1.0
(anisotropic, water diffusion is highly restricted in directions perpendicular to the fiber
orientation, while it is relatively unimpeded in the direction parallel to the fibers) with a
peak at 0.3 (Alexander et al., 2007). FA value has been used as a scalar indicator of the
directionality and coherence of WM tracts and was considered a highly sensitive
biomarker of WM integrity (Breier et al., 2011, Lin et al., 2012). The more coherent and
organized are the fiber tracts, the higher their FA (Basser and Pierpaoli, 1996). FA and
other DTI-derived measures, such as axial and radial diffusivity can identify age-related
changes in WM structure (Barrick et al., 2010), and are sensitive to a broad spectrum of
neuropathologic conditions (Bethune et al., 2011, Yu et al., 2011, Cirillo et al., 2012).
Many pathologic conditions may alter FA because of changes in diffusivity and
disorganization of the WM tracts leading to reduced anisotropy, such as in multiple
sclerosis (Filippi et al., 2001). FA values may become abnormal even before the lesion
is morphologically apparent on conventional MRIs and may therefore help in early
detection and in defining the extent of these lesions (Zou et al., 2008). However,
interpretation of DTI-derived measures is challenging and should be performed with

General Methods
98
great care. Many studies have focused mainly on the FA measure, which may not fully
characterize changes in the microstructure. For example, reduced FA in
neuropathologic conditions may be due to increased radial diffusivity or reduced axial
diffusivity or both. Other DTI metrics, such as MD, axial, and radial diffusivities may thus
be required to better understand changes in the diffusion tensor (Song et al., 2002,
Alexander et al., 2007, Lochner et al., 2012, Zhuang et al., 2012). For instance, it has
been shown that radial diffusivity, but not axial diffusivity, correlates with the
demyelination process in WM tracts (Song et al., 2002, Song et al., 2005). Also,
increased MD value was shown to reflect increased tissue water in edema (Kale et al.,
2006), while reduced MD value could serve as a biomarker of cellular proliferation in
tumors (Iacconi et al., 2010). Interpretation of DTI findings is also complicated by the
sensitivity of anisotropy measures to several technical factors, such as noise, eddy
current distortions, partial volume averaging, and issue of crossing fibers (Mukherjee et
al., 2008b, Jones and Cercignani, 2010). Limitations of DTI and tractography are
presented in chapter 6. These confounding factors may induce significant changes in
anisotropy measures in the absence of any change in WM structure.
3.15 DTI-BASED TRACTOGRAPHY
DTI-based tractography provides unique access to in vivo information about the
topography of major fiber tracts in the human brain. The objective of DTI-based
tractography is to determine inter-voxel connectivity based on the anisotropic diffusion
of water (Mori et al., 1999, Basser et al., 2000, Pfefferbaum et al., 2003). Since the
orientation of the principal eigenvector is assumed to be parallel to the dominant
direction of axonal tracts, tractography algorithms can use this information in each voxel
to track a fiber tract in 3D from voxel to voxel (Berman et al., 2004). Compared to focal
region of interest (ROI) analysis, quantitative fiber tracking has the advantages of
providing visual depiction of WM tracts and the ability to examine the whole extent of a
WM tract.

General Methods
99
3.16 FIBER TRACKING METHODOLOGIES
Numerous DTI-based fiber tractography algorithms have been reported to date, such as
line propagation (Mori and van Zijl, 2002), fast marching (Parker et al., 2002),
regularization (Poupon et al., 2000), subvoxel interpolation of the diffusion tensor field
(Basser et al., 2000), probabilistic (Behrens et al., 2003a), and stochastic labeling
methods (Tench et al., 2002). In general, fiber tracking methodologies fall into two main
categories (Parker, 2004, Mukherjee et al., 2008a): deterministic (Conturo et al., 1999,
Jones et al., 1999b, Mori et al., 1999, Basser et al., 2000), and probabilistic methods
(Behrens et al., 2003b, Lazar and Alexander, 2005, Behrens et al., 2007).
3.16.1 DETERMINISTIC FIBER TRACKING
Deterministic algorithms follow the major fiber directions as indicated by the diffusion
model and create sequences of points that are considered as fibers. Several
deterministic tractography algorithms were developed to date. The streamline
algorithms were initially developed (Mori et al., 1999, Basser et al., 2000), followed by
more complicated tensor deflection algorithms (Lazar et al., 2003), or more global
approaches (Mangin et al., 2002). One of the most popular deterministic algorithms for
tractography is known as fiber assignment by continuous tracking, FACT (Mori et al.,
1999). Fiber trajectories (also called “streamlines”) are initiated from user-defined
voxels (seed point). These streamlines propagate from voxel to voxel in 3D following
the principal eigenvector in each voxel (Mori et al., 1999, Basser et al., 2000, Mori and
Zhang, 2006). When the streamline approaches the edge of the voxel, its direction is
changed to correspond to that of the principal eigenvector of the next voxel (figure
3.12). A modification of this simple linear approach can be used to generate a smooth
(curved) trajectory, which can provide more accurate results when the curvature of a
reconstructed streamline is steep with respect to imaging resolution (simple
interpolation approach) (Mori and van Zijl, 2002).

General Methods
100
There are two important termination criteria for tractography; the first is the minimum FA
threshold within a voxel, and the second is the maximum streamline turning angle
between voxels. Typical minimum FA thresholds applied for tractography in adult
human brain range from 0.1 to 0.3 (
3.16.1.1 TERMINATION CRITERIA
Mukherjee et al., 2008b). Fiber tracking should stop
if the FA value of a voxel is less than a defined threshold as the voxel under
examination probably contains GM or cerebrospinal fluid (Chung et al., 2011). It is thus
expected that selecting low minimum FA thresholds will likely produce more and longer
streamlines assuming that all other parameters are equal. However, a great care should
be taken in such cases as selecting FA values, which are too low for the signal to noise
ratio of the diffusion-weighted sequence is likely to produce false positive fiber tracking
(Mukherjee et al., 2008b).
The angle change between pixels is another important criterion with typical maximum
turning angle values range from 40° to 70°. Tracking errors are expected to occur if the
angle transition is large. In certain circumstance, larger values may be used for proper
definition of pathways with hairpin turns (e.g. the uncinate fasciculus), although such
approach may considerably increase the number of spurious tracks and overall
computational loads (Mukherjee et al., 2008b).
Placement of the seed voxels could influence tractography results. To identify WM
tracts passing through certain ROIs, one can pre-assign seed voxels within a region of
interest placed within the tract of interest (
3.16.1.2 PLACEMENT OF THE SEED VOXELS
Mori and van Zijl, 2002). Another approach is
to seed voxels within the entire brain region above a certain FA threshold, so that all
possible WM streamlines within the range of computational considerations are identified
(the brute force method) (Huang et al., 2004). Subsequently, streamlines crossing the
pre-defined ROIs are then selected by filtering out those undesired ones. The brute
force method has been considered technically superior as it may identify some tracks
that are missed by ROI-based seeding and can substantially increase the validity of

General Methods
101
DTI-based tractography (Huang et al., 2004); however, it adds huge loads to the
computation process (Mukherjee et al., 2008b).
To improve localization of a specific WM tract, two or more seed regions may be placed
and only the streamlines bisecting these regions are preserved (Jones and Basser,
2004). This multiple ROIs technique for isolating anatomically specific fiber pathways by
using DTI-based tractography has been named “virtual dissection” (Catani et al., 2002).
In this way, deterministic tractography algorithms were shown to be capable of
generating anatomically plausible estimates of WM trajectories in the human brain, such
as major projection pathways (e.g., corticospinal tract, corona radiata), commissural
pathways (e.g., CC, anterior commissure), and association pathways (e.g., arcuate
fasciculus, uncinate fasciculus, etc.) (Jellison et al., 2004, Hofer and Frahm, 2006, Yu et
al., 2007, Matsumoto et al., 2008). A direct comparison of these DTI-based tract
reconstructions with histology-based illustration revealed that tractography can achieve
accurate reconstruction of core regions of major human neuroanatomical structures
(Catani et al., 2002, Chung et al., 2011). However, Deterministic fiber tracking
techniques are also sensitive to various sources of artifacts and technical limitations as
discussed in chapters 6 and 7.

General Methods
102
Fig. 3.12. A schematic illustration of the FACT algorithm. In this diagram, the principal
eigenvector for each pixel is depicted as an arrow. Streamlines (dashed lines) are then
determined by following the path of the principal eigenvector in each pixel and
proceeding until a pixel is reached where anisotropy has fallen below a pre-defined
threshold, at which point the tract terminates. Modified from (Roberts and Schwartz,
2007).

General Methods
103
3.16.2 PROBABILISTIC FIBER TRACKING
Since probabilistic tractography was not performed in the present work, a brief review of
the basic principles underlying this method is provided below; several more
comprehensive reviews are provided elsewhere (Behrens et al., 2007, Berman et al.,
2008, Jeurissen et al., 2011). Deterministic streamline fiber tracking is susceptible to
noise, partial volume, subject motion, and distortion from other imaging artifacts, which
can produce uncertainty in the orientation of the diffusion ellipsoid (Dietrich et al., 2001,
Mori and van Zijl, 2002). Considering that errors due to the above-mentioned artifacts
are random, it is predicted that they have low reproducibility if the same subject is
repeatedly scanned and the results are superimposed. Probabilistic tractography
provides information about the estimated probability distribution of the likelihood that
two or more certain regions are interconnected (i.e., confidence mapping). For
probabilistic fiber tracking, repeated image acquisitions are obtained from the same
subject with the subsequent use of one tractography algorithm on these datasets to get
several tractograms (Mori et al., 2002, Bammer et al., 2003). The probability of the
presence of specific pathways in this subject is then determined by estimating the
number of successful trackings, divided by the total number of datasets (Jones et al.,
2002). Probabilistic tractography techniques tend to scatter fiber trajectories more than
deterministic methods, and have the capacity to demarcate a larger portion of a WM
tract (Mori et al., 2002, Mukherjee et al., 2008a).

General Methods
104
3.17 VALIDATION OF DTI-BASED TRACTOGRAPHY
DTI-based tractography has been widely used in basic and clinical research being the
only currently available technique to explore the anatomy of WM tracts in the human
brain noninvasively. Unfortunately, results of DTI-based tractography in humans are
difficult to validate in vivo. It is therefore essential to develop methods to verify whether
DTI-derived tractography results match the real WM tracts. Several quality analysis
methods were proposed to address this issue. First, it is important to compare fiber
tracking results with those of published atlases (Wakana et al., 2004, Salamon et al.,
2007, Catani and Thiebaut de Schotten, 2008, Lawes et al., 2008). This could be
performed by assessing whether fiber tracking shows a tract that cannot be
demonstrated with a gold-standard technique (false-positive results) or does not reveal
a tract where the gold-standard demonstrates one (false-negative results) (Bammer et
al., 2003). Despite the existence of several published DTI atlases, there is no unified
concept about a proper gold-standard that can be used to evaluate the precision of DTI-
based tractography in defining neural fiber direction. Second, comparison with physical
or mathematic virtual fiber phantoms, such as curved 3D trajectories, merging/kissing
fiber tracts, and parallel fiber bundles, is probably the best method that could be used to
test the fidelity of tractography algorithms (Basser et al., 2000, Tournier et al., 2002,
Cheng et al., 2006, Poupon et al., 2008). These phantoms may provide valuable tools
to validate fiber tracking techniques with regard to varying SNR curvature and
discontinuities (Bammer et al., 2003). Third, some animal studies compared 3D
histological reconstruction of fiber tracts with DTI-based tractography to provide a
standard reference for evaluating fiber tracking (Dauguet et al., 2006, 2007). However,
this technique needs postmortem material and is subjected to several methodological
problems notably, destruction of tissue material during preparation, which alters fiber
orientations and causes a mismatch between specimens and DTI. Fourth, more direct
information about axonal connectivity can be derived from the use of chemical tracers to
track fibers with exact spatial registration. In this technique, chemical tracers are
injected and their destinations confirmed histologically. Examples of such chemical
tracers include divalent manganese ions (Mn+2 Lin et al., 2001) ( ) and biotinylated

General Methods
105
dextran amine (Dyrby et al., 2007). Tract-tracing techniques were considered one of the
gold standard methods for connectivity studies. However, there are several difficulties in
such a validation approach. First, although authors reported good correspondence
between DTI-based tractography and Mn+ Lin
et al., 2001
2-based enhancements in the optic tracts (
), the technique was shown to have limited ability to evaluate longer fiber
tracts due to the slow spread of Mn+2
Mori and van Zijl, 2002
ions in the neural tracts and fast decay of
enhancement. Second, a key advantage of the DTI-based tractography technique is its
capacity to characterize the macroscopic WM structures in a short time. It is practically
impossible to obtain similar datasets (there are millions of neurons inside the brain)
using the single-cell level chemical tracer technique ( ). Third, DTI
examination of the human brain usually involves limited scanning time resulting in lower
data quality compared to animal scans. It is thus expected that using the same
technique in the human brain would show inferior performance.
3.18 ANALYSIS OF DTI DATA IN THE PRESENT WORK
DTI and fiber tractography were performed in study 3 and 4, which are presented in
chapters 6 and 7, respectively.
3.18.1 DTI DATA PRE-PROCESSING
The following steps were performed to pre-process the DTI data:
• All diffusion–weighted images were visually inspected for apparent artifacts due
to subject motion, magnetic susceptibility, and instrumental malfunction.
• Output files from the Siemens scanner (in DICOM format) were converted to
(nii.gz) compressed data format using dcm2nii.exe program available with
MRIcron version 12/2009 (Chris Rorden, University of South Carolina,
Columbia, SC, USA; available online at
http://www.mccauslandcenter.sc.edu/mricro/mricron/install.html).
• In order to remove the artifacts from subject motion and eddy current-induced
distortion, I used FMRIB’s diffusion tool box (free software from Oxford Centre
for Functional MRI of the brain, UK), available online

General Methods
106
at http://www.fmrib.ox.ac.uk/fsl/ (Smith, 2002, Reese et al., 2003). Using the
diffusion tensor analysis toolkit (FDT), spatial distortions produced by eddy
currents were corrected using 12-parameter affine registration to the b = 0
image.
3.18.2 TRACTOGRAPHY PARAMETERS
After image pre-processing, tractography was applied to the DTI data to reconstruct
WM tracts by successively following the path of preferred direction of water diffusion
(Basser et al., 2000) using MedINRIA software v.1.9 for Linux (available online at
http://www-sop.inria.fr/asclepios/software/MedINRIA/). It is important to note that
differences in the algorithm and threshold used could induce biased results. I therefore
used fixed parameters and applied ROIs according to fixed anatomical landmarks
across all subjects to minimize bias. Fiber tracts were calculated by connecting adjacent
voxels with similar principal eigenvectors, using the following parameters available in
MedINRIA software:
• FA threshold = 0.2.
• Smoothing = medium.
• Smoothness factor (which corresponds to the straightness of each fiber) = 0.2.
• Minimum fiber length =10.
• Sampling =1.
Similar parameters were used by previous studies that applied continuous fiber tracking
algorithm (Kim et al., 2005, Thomas et al., 2005, Schaechter et al., 2008).
3.18.3 TRACTOGRAPHY OF THE CORPUS CALLOSUM, SUPERIOR CEREBELLAR
PEDUNCLE AND MIDDLE CEREBELLAR PEDUNCLE
A detailed description of methods used to reconstruct these tracts is provided in related
chapters: reconstruction of the CC is described in chapter 6 and reconstruction of the
SCP and MCP is described in chapter 7.

107
CHAPTER 4 INVESTIGATING STRUCTURAL PLASTICITY OF
PARS OPERCULARIS & PARS TRIANGULARIS IN MUSICIANS

Investigating Structural Plasticity of POP & PTR in Musicians
108
INCREASED GRAY MATTER VOLUME AND CORTICAL SURFACE AREA
OF THE LEFT PARS OPERCULARIS/BA44 IN MALE ORCHESTRAL
MUSICIANS
4.1 ABSTRACT
BACKGROUND AND PURPOSE To compare manual volumetry of gray matter (GM)
and white matter (WM), and cortical surface area of Broca's area subparts: pars
opercularis (POP)/BA44 and pars triangularis (PTR)/BA45 in both hemispheres
between musicians and non- musicians, as it has been shown that these regions are
crucial for musical abilities. A previous voxel-based morphometric (VBM) study
conducted in our laboratory reported increased GM density in Broca's area of the left
hemisphere in male orchestral musicians. Functional segregation of POP/PTR justified
separate volumetric and surface area measurements of these parts.
SUBJECTS AND METHODS The same cohort of the VBM study was used. Manual
morphometry (stereology) was used to compare volumes between 26/26 right-handed
orchestral musicians/non-musicians. Cortical surface areas of BA 44/45 were also
measured using an automatic method.
RESULTS Musicians showed significantly increased GM volume in the left POP
(p<0.001). No significant results were detected in the right POP, left/right PTR GM
volumes, and WM volumes for all regions. Results were positively correlated with years
of orchestral performance (r = 0.7, p =0.0001). In addition, musicians possessed
significantly increased cortical surface area of the left BA44 (p=0.01) with no significant
results in left BA45 and right BA44/45.
CONCLUSION
The present findings corroborate the VBM study and are in line with the
hypothesis of critical involvement of the POP in hearing-action integration being an
integral component of the fronto-parieto-temporal mirror neuron network. I hypothesize
that increased volume and cortical surface area of musicians' left POP/BA44 represent
use-dependent structural adaptation triggered by intensive audiomotor skill acquisition.

Investigating Structural Plasticity of POP & PTR in Musicians
109
This work (GM volume results) was published in the Journal of Magnetic Resonance
Imaging:
Abdul-Kareem IA, Stancak A, Parkes L & Sluming V (2011): Increased gray matter
volume of left pars opercularis in male orchestral musicians correlate positively with
years of musical performance. JMRI. 33(1):24-32.

Investigating Structural Plasticity of POP & PTR in Musicians
110
4.2 INTRODUCTION
The posterior part of the inferior frontal gyrus in the left hemisphere is traditionally
considered to constitute the classic Broca’s area, which is critically involved in various
aspects of expressive language processing (Petrides, 2006). This brain area includes
two distinct regions: the POP, BA44 and the PTR, BA45.
A growing body of evidence suggests that language and music are intimately related.
Like language, music involves organization of perceptually discrete elements into
ordered sequences based on syntactic principles (Patel, 2003). The wealth of literature
supports this assumption and assigns a substantial role for Broca’s area in music, just
as in language. Functional studies have reported involvement of Broca’s area/left
inferior frontal gyrus in music discrimination (Platel et al., 1997), visuospatial and
audiospatial localization (Martinkauppi et al., 2000, Limb et al., 2006, Sluming et al.,
2007), processing and organization of sequential sound stimuli (Platel et al., 1997),
musical syntax processing (Maess et al., 2001, Koelsch, 2006), retrieval success for
music memory (Watanabe et al., 2008), musical improvisation (Berkowitz and Ansari,
2008), sight reading (Sergent et al., 1992), and score reading while listening to the
accuracy of musical performance (Parsons, 2001). Adding structural evidence to
functional data, a previous VBM study reported increased GM density in Broca’s area
(left inferior frontal gyrus) in male orchestral musicians compared to non-musicians
(Sluming et al., 2002). The latter study also compared manual volume measurements of
prefrontal cortical subfields between musicians and non-musicians and reported no
significant group differences. Other VBM studies also reported structural plasticity in the
left inferior frontal gyrus in the form of increased GM density (Gaser and Schlaug,
2003b, a) and increased fractional anisotropy (Han et al., 2009).
In the present study, I re-examined Broca’s area using the same cohort of the previous
study (Sluming et al., 2002) with the rationale that this area includes two parts each
behaves as one unit with its own connections and functions. Separate structural
morphometry of these regions could thus give a clearer view about Broca’s area
plasticity in musicians. In addition, the previous study used an automatic technique

Investigating Structural Plasticity of POP & PTR in Musicians
111
(VBM), which could be cross-validated through using manual volumetry, such as that
used in the present study.
4.2.1 SEGREGATION OF PARS OPERCULARIS AND PARS TRIANGULARIS
Although both POP and PTR were collectively described as Broca’s area, there are
cytoarchitectonic, connectivity and functional data suggesting segregation of these
parts. Cytoarchitectonically, POP (BA 44) contains a thin layer IV of small granular
cells with pyramidal cells from deep layer IV (i.e. it is mostly dysgranular, motor), while
BA 45 has densely packed granular cells in layer IV (i.e. it is mostly granular, sensory)
(Amunts et al., 1999, Schenker et al., 2008). In particular, the POP/BA44 shares some
cytoarchitectonic properties with the premotor cortex (BA6).
Connectivity data, structural characterization of a distinct cortical area just by its
microstructure without taking into consideration its connections to other brain areas
remains insufficient as cognitive functions depend on widespread networks, rather than
isolated cortical areas. Both BA 44 and 45 have distinct cortical connections as
revealed by diffusion tensor imaging (Xiang et al., 2009). Separation of BA44 and BA45
according to their connections was suggested to align with their macroanatomical
boundaries (Anwander et al., 2007).
Functional, a corresponding functional division inside Broca’s complex was suggested
by functional neuroimaging studies employing language processing tasks (Demb et al.,
1995, Bookheimer, 2002, Chein et al., 2002). Within the left inferior frontal gyrus, it was
reported that BA 44 and parts of BA 6 have a role in syntactic processing and
phonologically-based working memory, while BA 45 is mainly involved in semantic
processing (Friederici et al., 2000), in addition to rhyming ability (Cone et al., 2008),
phonological awareness (Demonet et al., 1992), and lexical decision making
(Papathanassiou et al., 2000).
An important role for Broca’s area has also been described for various aspects of motor
processing, including motor sequence learning, action observation, motor imagery, and
imitation (Iacoboni et al., 1999, Binkofski and Buccino, 2006). Importantly, functional
MRI studies reported that POP is a key component of the human mirror neuron system
activated during action observation and imitation, while the PTR is activated during
Investigating Structural Plasticity of POP & PTR in Musicians
112
action observation but not imitation (Molnar-Szakacs et al., 2005). Repetitive
transmagnetic stimulation applied over the POP showed similar results through
disrupting imitation of motor tasks (Heiser et al., 2003). Data from electrophysiological
studies have pointed out that dysphasic speech arrest occurs most reliably from
stimulation of the POP (Ojemann et al., 1989, Duffau et al., 2003), which, coupled with
action observation and imitation data, suggest that the motor-related part of Broca’s
area is mainly localized within the POP.
The above evidence may suggest that morphometric analyses, such as volume and
cortical surface area measurement of Broca’s area as one entity remain incomplete
without taking into consideration a separate analysis for POP and PTR. The primary
goal of this study was therefore to measure volumes of POP and PTR separately
through manual mapping according to previously established anatomical landmarks.
4.2.2 AUTOMATIC-MANUAL CROSS-VALIDATION OF BROCA’S AREA MORPHOMETRY
The VBM technique has been widely used in research as it provides unbiased,
automatic, and objective morphometric analysis of GM and WM density. One advantage
of VBM is its capacity to examine large cohorts in a short time. However, the VBM has
been criticized (Crum et al., 2003), especially when performing morphometric analysis
of WM (Gaser and Schlaug, 2003a, Thomann et al., 2006). In the normalization step,
VBM registers all brain images with a reference template, which does not reflect the real
structural anatomy of individual brains. This is especially true when considering
morphometry of Broca’s area as it is subjected to substantial inter-individual variations
(Tomaiuolo et al., 1999, Keller et al., 2007). I therefore set the goal to cross-validate
previous VBM results (Sluming et al., 2002) using manual volumetry as it allows more
direct measurement of Broca’s area with clear face validity. A similar automatic-manual
cross-validation has been used in previous structural brain studies (Keller et al., 2002,
Gong et al., 2005).
To summarize, the primary objective of the present study was to re-examine a
previously published cohort (Sluming et al., 2002) of musicians and non-musicians to
measure GM/WM volumes of Broca’s area subparts (POP/PTR) in the left hemisphere
and their homologue in the right hemisphere. I used manual morphometry (stereology),

Investigating Structural Plasticity of POP & PTR in Musicians
113
which allowed POP/PTR parcellation according to well-defined sulcal landmarks
thereby enhancing the accuracy and validity of volume measurements. In addition to
supporting previously published data of GM density differences in Broca’s area, the
estimation of volume may provide a better evidence (Rockel et al., 1980, Fischl and
Dale, 2000) to support the theory of structural neuroplasticity acquired through skill
acquisition (Schlaug et al., 1995a), and may also help to enhance our understanding of
POP/PTR functional segregation. In addition to measuring volumes of POP and PTR,
the second objective of the present study was to measure cortical surface areas of
these regions. These measurements could provide another perspective to Broca’s area
plasticity in musicians. The present study was sought to extend previous structural
reports in musicians (Schlaug et al., 1995a, Schlaug et al., 1995b, Ozturk et al., 2002,
Schneider et al., 2002, Hutchinson et al., 2003, Lee et al., 2003, Schneider et al., 2005)
through demonstrating structural plasticity in a region crucial for musical performance.
Volume measurements of brain structures had been used extensively through applying
the Cavalieri principle, but measurements of cortical surface area were much less
frequently used possibly because it is easier to measure volume than surface area
(Barta and Dazzan, 2003). The convoluted shape of the brain makes measuring cortical
surface areas more difficult. In addition, application of stereological methods for cortical
surface area measurements requires some degree of randomization when choosing a
sectioning direction. Failure of performing this step could lead to bias (Haug, 1987,
Steinmetz et al., 1989b). In the present study, I used an entirely automatic user-
independent method for cortical surface area estimation to minimize bias.

Investigating Structural Plasticity of POP & PTR in Musicians
114
4.2.3 HYPOTHESIS
I hypothesized that orchestral musicians would show increased GM volume and cortical
surface area of the left POP/BA44. This hypothesis was based on the following
evidence: first, the POP region (BA44) was shown to be involved in several musically
relevant functions notably, musical syntax processing, detection of music-structural
irregularities (Maess et al., 2001, Koelsch, 2006), audiospatial localization (Martinkauppi
et al., 2000), sight reading (Sergent et al., 1992), and audiomotor integration
(Tettamanti et al., 2005, Lahav et al., 2007), which are essential for orchestral
performance by ensemble musicians irrespective of their instrument specialty. Second,
several studies have shown that, unlike musically naive subjects, musicians tend to use
the left hemisphere for music processing (Johnson, 1977, Gordon, 1980, Vuust et al.,
2005, Limb et al., 2006), which was hypothesized to reflect the tendency to use an
analytic mode of processing in musicians that is identical to that of language (Vuust et
al., 2005, Limb et al., 2006). Therefore, I predicted that my right-handed orchestral
musicians would show evidence of selective structural enlargement of the POP in the
left (dominant) cerebral hemisphere. Third, in particular, the left POP/BA44 has been
considered a central component of the human mirror neuron network (Iacoboni et al.,
1999, Binkofski and Buccino, 2006) that is activated by the execution of manual action
and by hearing of the same action performed by others (Tettamanti et al., 2005, Lahav
et al., 2007) indicating its essential role in audiomotor integration. In orchestral
performance, this auditory-motor network has two main advantages: it allows fast
feedback mechanism that enables musicians to continuously coordinate complex motor
actions according to auditory input (Bangert and Altenmuller, 2003), and it maintains
sequence-specific priming of action representations together with unconscious
stimulations and predictions for the next coming action or sound (Lahav et al., 2007).
Furthermore, since previous studies have indicated that neuronal density is positively
correlated with cortical surface area (Rockel et al., 1974, Henery and Mayhew, 1989,
Sisodiya et al., 1996, Sisodiya and Free, 1997), I hypothesized that orchestral
musicians would show increased cortical surface area in the left BA44.

Investigating Structural Plasticity of POP & PTR in Musicians
115
4.3 SUBJECTS AND METHODS
4.3.1 SUBJECTS
The cohort included 52 age-, gender-, and handedness-matched subjects: 26 right-
handed male musicians and 26 age-matched right-handed male non-musicians. All
volunteers gave signed, informed written consent of their willingness to participate in
this study and were screened for medical and neurological disorders. The study had
Local Research Ethics Committee approval. Table 4.1 shows descriptive statistics for
both groups. Handedness was assessed using the Edinburgh handedness inventory
(Oldfield, 1971). Since the measured volumes and cortical surface areas are related to
language, it was necessary to recruit subjects who were native English speakers to
overcome any possible structural differences imposed by different languages. In
addition, all subjects were assessed for intelligence using IQ test and selected IQ-
matched subjects.
4.3.1.1 MUSICIANS’ PROFILES
The musicians’ group included 16 string players (9 violin, 2 viola, 2 cello, 3 double
bass), 9 wind players (1 flute, 1 clarinet, 1 oboe, 1 bassoon, 4 French horn, 1
trombone), and 1 percussionist who were all members of a major British symphony
orchestra. Descriptive statistics of age of starting musical training and duration of
musical performance are provided in table 4.1. Three musicians commenced training at
an age under 7 years, while seventeen musicians commenced training after the age of
10 years. Insufficient right-handed female musicians volunteered to warrant the
inclusion of women in this study.

Investigating Structural Plasticity of POP & PTR in Musicians
116
Table 4.1. Demographics of subjects recruited in this study.
*Student t test revealed no significant group difference regarding age (p=0.5).
Groups
Musicians Non-musicians
*Age (years) Mean / SD / range 43.2 / 9.3 / 26-66 42.8 / 10.8 / 26-66
Duration of musical performance (years) Mean / SD / range
20.4 / 9.4 / 4-44 N/A
Age of starting musical training (years) Mean / SD/ range
9.6 / 2.4 / 4-13 N/A

Investigating Structural Plasticity of POP & PTR in Musicians
117
4.3.2 MR DATA ACQUISITION
All volunteers were scanned using a protocol with identical sequence and parameters.
High resolution T1-weighted images were obtained with a 1.5 Tesla Signa whole body
MR imaging system (General Electric Medical Systems, Milwaukee, WI). A spoiled
gradient echo (SPGR) pulse sequence was used with TE/TR = 9/34 ms, slice thickness
=1.6 mm, field of view = 200 mm, which contained a 256 X 256-pixel matrix, voxel size
= 1.6 X 0.781 X 0.781 mm, no. of slices =124 coronal slices, flip angle = 30°, and
acquisition time = 13 min and 56 s.
4.4 METHODS
Image analysis methods used in this study include:
• Manual measurement of intracranial volume (ICV) using design-based
stereology, which involved application of Cavalieri method combined with point
counting (Roberts et al., 2000, Garcia-Finana et al., 2003).
• Manual measurement of GM/WM volumes of POP and PTR using design-
based stereology, which involved application of Cavalieri method combined with
point counting (Roberts et al., 2000, Garcia-Finana et al., 2003).
• Measurement of cortical surface areas of BA44 and BA45 using an automatic
technique.
4.4.1 MEASUREMENT OF INTRACRANIAL VOLUME
To control for differences in head size, ICVs were measured using the method
described in chapter 3, section 3.9, pages 74-79.
4.4.2 MEASUREMENT OF GM/WM VOLUMES OF POP AND PTR
4.4.2.1 IMAGE PRE-PROCESSING
This was performed using the method described in chapter 3, section 3.9.1, page 74.

Investigating Structural Plasticity of POP & PTR in Musicians
118
The morphology of the sulcal contours defining and within the POP and PTR was
assessed using a combination of multiple orthogonal MR sections and rendered
surfaces of cerebral hemispheres using BrainVoyager software, version 1.9
(www.Brainvoyager.com, Brain Innovation, Maastricht, The Netherlands). Delineation of
the POP and PTR followed anatomical definitions described by others (
4.4.2.2 DEFINITION OF POP AND PTR
Foundas et al.,
1998, Duvernoy, 1999, Tomaiuolo et al., 1999, Petrides and Pandya, 2004, Petrides,
2006). The POP was demarcated caudally from the precentral gyrus by the inferior
precentral sulcus, dorsally from the middle frontal gyrus by the inferior frontal sulcus,
and rostrally from the PTR by the anterior ascending ramus of the Sylvian fissure. The
PTR was demarcated caudally from the POP by the anterior ascending ramus of the
Sylvian fissure, dorsally from the middle frontal gyrus by the inferior frontal sulcus, and
rostro-ventrally by the anterior horizontal ramus of the Sylvian fissure (figure 4.1).
• Grid size (pixels) = 3.
4.4.2.3 STEREOLOGICAL PARAMETERS
Stereological parameters used for POP volume estimation:
• Area associated with each test point (a/p) = 9 mm2
• The section interval (T) was every section. Since final voxel size after iso-voxel
transformation was 1 X 1 X 1 mm, then T = 1 X 1 mm = 1 mm.
.
Stereological parameters used for PTR volume estimation:
• Grid size (pixels) = 3
• Area associated with each test point (a/p) = 9 mm
• The section interval (T) was every second section, so T = 2 X 1 mm = 2 mm.
2
The difference in the slice interval between structures was due to the fact that the PTR
is usually longer (and thus larger) than the POP. Unbiased estimation of volume, V of
structure of interest could be obtained using Equation 3.3 (chapter 3):
𝑒𝑒𝑒𝑒𝑒𝑒2𝑉𝑉 = 𝑇𝑇 (𝑎𝑎/𝑝𝑝) (𝑃𝑃1 + 𝑃𝑃2 + ⋯𝑃𝑃𝑛𝑛)

Investigating Structural Plasticity of POP & PTR in Musicians
119
Where 𝑃𝑃1 , 𝑃𝑃2 , ... 𝑃𝑃𝑛𝑛 denote the point counts and (𝑎𝑎/𝑝𝑝) the area associated with each
point.
Thus, estimation of GM and WM volumes of POP could be obtained using the following
Equation:
V (POP) = 1 X 9 X (𝑃𝑃1 + 𝑃𝑃2 +⋯𝑃𝑃𝑛𝑛) Equation 4.1
And for PTR volumes:
V (PTR) = 2 X 9 X (𝑃𝑃1 + 𝑃𝑃2 +⋯𝑃𝑃𝑛𝑛) Equation 4.2
Using BrainVoyager, markers were used to define sulcal landmarks of POP and PTR
(see figure 4.1). For stereological measurements, images were reoriented to the coronal
plane using ImageJ software, version 1.38 available online at http://rsb.info.nih.gov/ij/,
NIH, USA). Estimation of GM and WM volumes of POP/PTR regions was performed
using EasyMeasure software (
4.4.2.4 STEREOLOGICAL MEASUREMENT
Puddephat, 1999) as described by (Keller et al., 2007)
(figures 4.2, 4.3, and 4.4). Images were always displayed using consistent image
window and display levels on the same monitor with fixed screen contrast settings.
4.4.3 INTER- AND INTRA-RATER RELIABILITY
It is essential that volumetric measures are both repeatable and reproducible.
Repeatability is the variability of repeated measures of a constant object by the same
observer or rater (intra-rater), whereas reproducibility refers to the ability of several
observers or raters (inter-rater) to obtain statistically similar results from measuring a
constant object using the same methodology. Blind intra- and inter-rater studies were
undertaken on all structures measured using the point counting technique namely, ICV
and POP/PTR volumes.
The inter-rater study was conducted following the training period for measuring each
structure. Ten randomly selected brain volume datasets were independently measured

Investigating Structural Plasticity of POP & PTR in Musicians
120
by two raters (MA and IA). MA was blinded to identity, grouping, and laterality of
subjects. For intra-rater reliability, the structures of interest in the volume datasets of
twenty randomly selected subjects were measured twice by IA, with a gap of three
weeks between the first and second measuring sessions.
Reliability of a measure can be determined by making replicate measurements and
using intra-class correlation coefficient (ICC) to test the null hypothesis that there is no
association between the two sets of results. A coefficient greater than 0.80 was
accepted as evidence of inter- and intra-rater reliability.

Investigating Structural Plasticity of POP & PTR in Musicians
121
Fig.4.1. Depiction of POP (red) and PTR (green) on the left hemisphere of one subject.
Top, outlines of POP and PTR on a 3D display. Middle, depiction of POP and PTR on a
sagittal section. Bottom, anatomical boundaries of POP and PTR; 1, inferior frontal
sulcus; 2, inferior precentral sulcus; 3, anterior ascending ramus of lateral fissure; 4,
anterior horizontal ramus of lateral fissure; 5, lateral fissure; PrCG, precentral gyrus and
PoCG, postcentral gyrus.

Investigating Structural Plasticity of POP & PTR in Musicians
122
Fig.4.2. Demonstration of volume estimation of POP (red) and PTR (green) using
stereology. GM volume estimation is demonstrated here. Sagittal sections used to show
levels of coronal sections A-F. Section A represents the most anterior part of the
precentral gyrus (PrCG) and the last coronal slice before the start of POP and was
therefore not considered for point counting. A small part of PrCG that overlies POP was
not considered for point counting (dotted line in section B). Sections B and C are taken
through POP. Sections D, E and F are taken through PTR.

Investigating Structural Plasticity of POP & PTR in Musicians
123
POP-Red colour
POP-Red colour
SLICE 123
SLICE 122

Investigating Structural Plasticity of POP & PTR in Musicians
124
SLICE 121
SLICE 120
SLICE 119
SLICE 118

Investigating Structural Plasticity of POP & PTR in Musicians
125
SLICE 117
SLICE 116
SLICE 115
SLICE 114

Investigating Structural Plasticity of POP & PTR in Musicians
126
Fig.4.3. Demonstration of GM volume measurement of left POP using stereology. Right
column (before) and left column (after) removal of crosses overlying region of interest.
Upper and lower white dots represent superior and inferior boundaries, respectively.
SLICE 113

Investigating Structural Plasticity of POP & PTR in Musicians
127
PTR-Green colour
SLICE 47
SLICE 48
SLICE 49
SLICE 50

Investigating Structural Plasticity of POP & PTR in Musicians
128
SLICE 51
SLICE 52
SLICE 53
SLICE 54

Investigating Structural Plasticity of POP & PTR in Musicians
129
Fig.4.4. Demonstration of GM volume measurement of left PTR using stereology. Right
column (before) and left column (after) removal of crosses overlying region of interest.
Upper and lower white dots represent superior and inferior boundaries, respectively.
SLICE 55
SLICE 56

Investigating Structural Plasticity of POP & PTR in Musicians
130
4.4.4 IDENTIFICATION OF THE DIAGONAL SULCUS IN PARS OPERCULARIS
The diagonal sulcus is a small sulcus located within the POP. It may lie within the POP
without joining any of the sulci that surround the POP, or it may join the inferior frontal
sulcus dorsally or the inferior precentral sulcus caudally (figure 4.5). The lower end of
the diagonal sulcus may flow into the Sylvian fissure, or it may stay clearly separated
from it by a bridge of cortex (Tomaiuolo et al., 1999). It has been suggested that right-
left hemisphere differences in the number of diagonal sulci could result in right-to-left
asymmetry in POP volume (Keller et al., 2007). I therefore estimated the number of
diagonal sulci in the POP with the prediction that this may cause volume differences
between groups.

Investigating Structural Plasticity of POP & PTR in Musicians
131
Fig.4.5. The diagonal sulcus. A three dimensional display of the left hemisphere
showing the diagonal sulcus (yellow dotted line) arising from the inferior frontal sulcus.
PrCG, precentral gyrus; PoCG, postcentral gyrus; 1, inferior precentral sulcus; 2,
inferior frontal sulcus; 3, anterior horizontal ramus; 4, anterior ascending ramus.
PrCG PoCG
1
2
3 4

Investigating Structural Plasticity of POP & PTR in Musicians
132
4.4.5 MEASUREMENT OF CORTICAL SURFACE AREA
All steps for measuring cortical surface area were performed using BrainVoyager
software, version 1.9 (www.Brainvoyager.com, Brain Innovation, Maastricht, The
Netherlands). For cortical surface area measurement, images were first pre-processed,
transformed into Talairach space, and subjected to cortex-based alignment.
Image pre-processing was performed using the same steps described in chapter 3,
section 3.9.1, page 74. This included spatial transformation of images to the sagittal
plane, re-sampling of acquired voxels into 1 X 1 X 1 mm isotropic voxels using cubic
spline interpolation, and re-alignment according to the ACPC plane. The resulted ACPC
aligned MR images were then transformed into the Talairach coordinate system
(
4.4.5.1 IMAGE PRE-PROCESSING
Talairach and Tournoux, 1988) as described below.
4.4.5.2 TALAIRACH TRANSFORMATION
Talairach transformation was performed by specifying eight reference points within the
ACPC transformed data set (figure 4.6): AC (anterior commissure), PC (posterior
commissure), AP (the most anterior point of the cerebrum), PP (the most posterior point
of the cerebrum), SP (the most superior point of the cerebrum), IP (the most inferior
point of the cerebrum), RP (the most right point of the cerebrum), and LP (the most left
point of the cerebrum). These points were then used to scale the 3D data set into the
dimensions of the standard brain of the Talairach and Tournaux atlas using trilinear
interpolation. The centre of the new Talairach data set is still the AC point and the brain
is still aligned to the ACPC plane. The cerebrum’s size is; however, adjusted to fit into
Talairach space. Table 4.2 shows orthogonal views used to localize landmark points.

Investigating Structural Plasticity of POP & PTR in Musicians
133
Table 4.2. Orthogonal views used to localize landmark points for Talairach
transformation.
Landmark Point View AC Sagittal confirmed with transverse PC Sagittal confirmed with transverse AP Coronal PP Coronal SP Transverse IP Transverse RP Sagittal LP Sagittal

Investigating Structural Plasticity of POP & PTR in Musicians
134
RP LP

Investigating Structural Plasticity of POP & PTR in Musicians
135
Fig.4.6. Talairach transformation. Identification of the 8 reference points: AC (anterior
commissure), PC (posterior commissure), AP (the most anterior point of the cerebrum),
PP (the most posterior point of the cerebrum), SP (the most superior point of the
cerebrum), IP (the most inferior point of the cerebrum), RP (the most right point of the
cerebrum), and LP (the most left point of the cerebrum).

Investigating Structural Plasticity of POP & PTR in Musicians
136
A good match between corresponding brain regions is important for group-level
statistical data analysis. It has been shown that a cortical matching approach
substantially improves statistical group results by reducing anatomical variability (
4.4.5.3 CORTEX-BASED ALIGNMENT
Fischl
et al., 1999a, Fischl et al., 1999b). BrainVoyager offers an advanced cortical mapping
approach to align brains using curvature information of the cortex (cortex-based
alignment) (Goebel et al., 2006). Since the curvature of the cortex reflects the
gyral/sulcal folding pattern of the brain, this brain matching approach essentially aligns
gyri and sulci across brains. To apply the cortex-based matching approach for inter-
subject alignment, the following steps were followed (Goebel et al., 2006):
1. Automatic cortical segmentation and reconstruction
2. Morphing reconstructed cortices to a sphere
3. Mapping a standard sphere to inflated sphere
4. Creating curvature maps for each re-sampled cortex mesh
5. Aligning source spheres to a moving target group average
1-Automatic cortical segmentation and reconstruction
Prior to this step, each brain was first segmented from surrounding head tissue using an
automatic “brain peeling” tool (Goebel et al., 2006). This was followed by cortical
segmentation and reconstruction of both cerebral hemispheres. The WM/GM boundary
was segmented using an automatic segmentation algorithm (Kriegeskorte and Goebel,
2001). This process involves the following steps: edge-preserving smoothing (sigma
filter), filling of ventricles, application of masks to label subcortical structures, creation
and analysis of intensity histograms to detect WM and GM peaks, a region growing
process, and several small morphological operations designed to smooth the borders of
the segmented data and to separate the left from the right hemisphere. During
segmentation, a window displaying a set of histograms was shown (figure 4.7A). The
left peak in the histograms corresponds to GM and the right peak to WM. A dialog
appeared to allow adjusting the WM/GM cut point, which was set in such a way that the
white line is between the two peaks. Each segmented hemisphere was finally submitted

Investigating Structural Plasticity of POP & PTR in Musicians
137
to a “bridge removal” algorithm, which ensures the creation of topologically correct
mesh representations (Kriegeskorte and Goebel, 2001)(figure 4.7B). The borders of the
two resulting segmented subvolumes were tessellated to produce a surface
reconstruction of the left and right hemispheres. The quality of the resulted
segmentation was next verified in transverse, coronal, and sagittal views to check
whether the mesh contour matches the WM/GM boundary (figure 4.7C).

Investigating Structural Plasticity of POP & PTR in Musicians
138
Fig.4.7. A, the smoothed intensity histogram displayed during automatic cortical
segmentation process. B, visualization of the segmented cortex of the left hemisphere
as a reconstructed mesh representation. Convex curvature (reflecting gyri) is colored in
gold and concave curvature (reflecting sulci) is colored in blue. C, result of cortical
segmentation visualized in orthographic slices of the 3D data; the yellow lines indicate
the segmented WM/GM boundary.

Investigating Structural Plasticity of POP & PTR in Musicians
139
2-Morphing reconstructed cortices to a sphere
This step involves two procedures: the first is morphing the folded cortex mesh of each
hemisphere into a spherical representation, which provides a parameterizable surface
ideal for across-subject non-rigid alignment (figure 4.8A). This step is essential since
the cortex-based alignment algorithm works on superimposed spherical representations
as a common space for all to-be-aligned cortex meshes. The morphing step is an
iterative process, which uses several forces changed gradually over time. A smoothing
force is used to remove the folding from the mesh, while a to-sphere force attempts to
push the mesh vertices outward towards points on a sphere. The to-sphere morphing
was performed separately for the cortex mesh of the left and right hemispheres of each
subject. The second morphing procedure involves distortion correction of the resulted
sphere (figure 4.8B). The default number of morphing steps was chosen for each
procedure, 800 and 3000, respectively. Each vertex on the sphere (spherical coordinate
system) corresponds to a vertex of the folded cortex (Cartesian coordinate system) and
vice versa.
3-Mapping a standard sphere to inflated sphere
It is difficult to use spherical representation of cortex mesh directly for cortex-based
alignment due to the presence of large number of vertices with different distances
between adjacent vertices. To simplify and normalize the alignment process, the
created spherical meshes are sampled from a standard sphere with 40962 vertices
(figure 4.8C), which is the same for each subject. Sampling is performed by mapping
each vertex of the standard sphere to the closest vertex of the morphed sphere. The
final result is a mapping table stored in a sphere-to-sphere mapping file.
4-Creating curvature maps for each re-sampled cortex mesh
The created files in the previous step allow transferring information from the subject’s
cortex sphere mesh to the standard sphere used during the subsequent alignment
procedure. This step involves transferring the vertex position information resulting in
folded mesh representation of the standard sphere. The curvature information is

Investigating Structural Plasticity of POP & PTR in Musicians
140
computed in the folded representation and preserved as a curvature map on the
spherical representation. The generated curvature map file for the standard sphere
provides an input for the alignment procedure (figure 4.8D). These files were created for
all meshes of the same hemisphere.
5-Aligning source spheres to a moving target group average
All brains were aligned using the moving target group averaging approach in which the
goal function is specified as a “moving target” computed repeatedly during the
alignment process as the average curvature across all hemispheres at a given
alignment stage. The procedure begins with the coarsest curvature maps then the next
finer curvature maps are used and averaged with the acquired alignment result of the
previous level (Goebel et al., 2006).
BrainVoyager offers the option of using predefined regions of interest, such as BA44/45,
in combination with cortex-based alignment for optimal group analysis. When not
including the cortex-based alignment information into the region of interest labeling, any
predefined area will not fit too well on a subject cortex. Regions of interest (in this case
BA 44, BA45, frontal, parietal, temporal and occipital lobes) were automatically
superimposed on aligned cortex mesh of hemispheres using the brain atlas available
with BrainVoyager software package (figure 4.8E). Quantitative measurement of cortical
surface area of a region of interest was calculated as follows: since the model of the
cortical surface is a mesh of tessellated triangles (
4.4.5.4 QUANTITATIVE MEASUREMENT OF CORTICAL SURFACE AREAS
Fischl et al., 1999a, Goebel et al.,
2006), the area of each triangle could be calculated using the following Equation:
Area of triangle =1/2 X triangle base X triangle height Equation 4.3
Therefore, the total surface area of a region of interest is defined by the sum of areas of
all triangles within that region (Feczko et al., 2009). The total cerebral cortical surface
area, estimated by summating cortical surface areas of frontal, parietal, temporal, and

Investigating Structural Plasticity of POP & PTR in Musicians
141
occipital lobes of each brain, was measured to correct for differences in whole brain
cortical surface area.
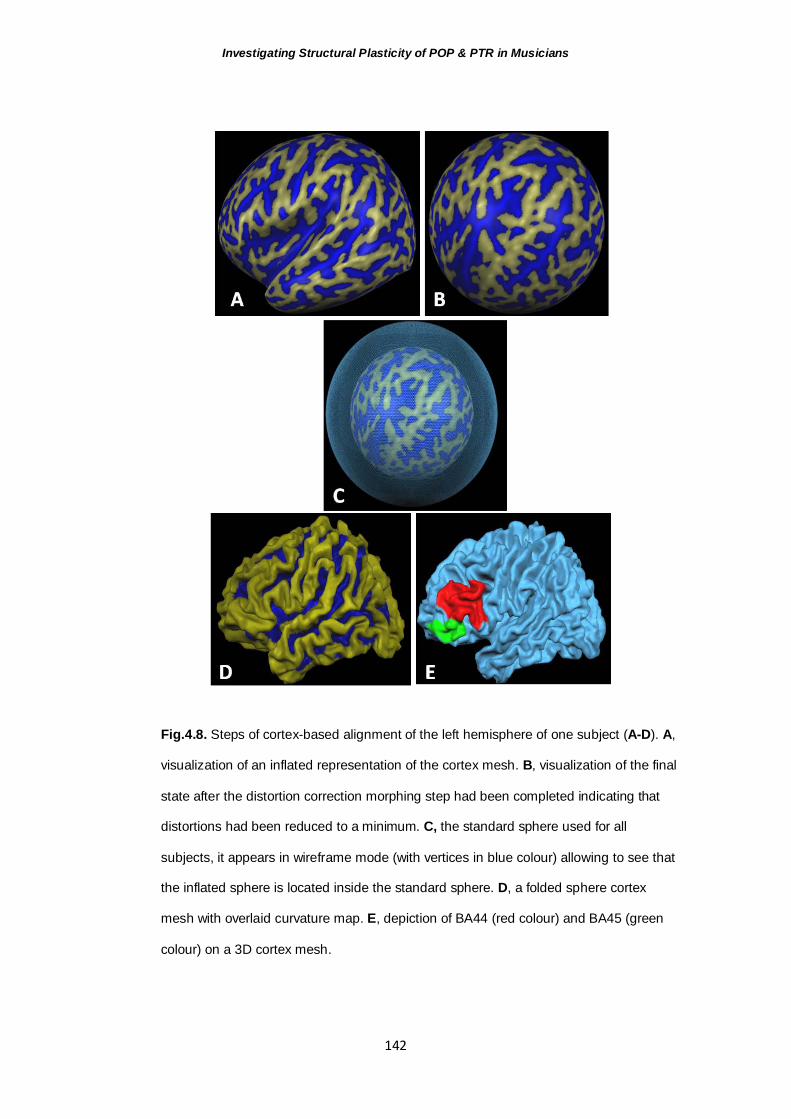
Investigating Structural Plasticity of POP & PTR in Musicians
142
Fig.4.8. Steps of cortex-based alignment of the left hemisphere of one subject (A-D). A,
visualization of an inflated representation of the cortex mesh. B, visualization of the final
state after the distortion correction morphing step had been completed indicating that
distortions had been reduced to a minimum. C, the standard sphere used for all
subjects, it appears in wireframe mode (with vertices in blue colour) allowing to see that
the inflated sphere is located inside the standard sphere. D, a folded sphere cortex
mesh with overlaid curvature map. E, depiction of BA44 (red colour) and BA45 (green
colour) on a 3D cortex mesh.
Investigating Structural Plasticity of POP & PTR in Musicians
143
4.4.6 STATISTICAL ANALYSIS
Statistical analyses were performed using SPSS v 16.0 and statistica program, v 6.0
(Statsoft Inc., USA). Shapiro-Wilk (S-W) was used to test normality of data distribution.
Using SPSS, multivariate analysis of variance (MANOVA) was performed with GM and
WM volumes of left POP/PTR and right POP/PTR corrected for ICV as dependent
variables and musicianship (musicians versus non-musicians) as the independent
variable with age as covariate; p<0.05 was considered significant after adjustment for
multiple comparisons.
For cortical surface area analysis, a second MANOVA was performed with cortical
surface area measurements of left BA 44/45 and right BA 44/45 corrected for total brain
cortical surface area as dependent variables and musicianship as the independent
variable with age as covariate; p<0.05 was considered significant after adjustment for
multiple comparisons. Pearson’s correlation was used to perform correlation analyses.
Student t test was used to compare ICV measurements between groups.
The most appropriate statistical test for assessing agreement in measurements
obtained on two independent occasions, and particularly where the measurements are
not totally objective, is the ICC. This takes into account the sum and difference of each
pair of measurements and also their variance and will only yield a coefficient = 1 when
all pairs of measurements fall on a straight line through the origin with slope unity
(Armitage and Berry 1994) and is a good measure of reliability between raters. The ICC
calculated by one-way random model was used to test intra- and inter-rater reliability. A
coefficient greater than 0.80 was accepted as evidence of inter- and intra-rater
reliability. Statistica program was used for creating figures 4.9, 4.10, and 4.13 and
Microsoft Office Excel, 2007 for creating figure 4.11.

Investigating Structural Plasticity of POP & PTR in Musicians
144
4.5 RESULTS
4.5.1 MEASUREMENT OF INTRACRANIAL VOLUME
There was no significant difference in ICV between groups (p=0.2).
4.5.2 VOLUME MEASUREMENTS OF POP AND PTR
4.5.2.1 EXCLUSION OF CASES FROM VOLUME MEASUREMENT
The morphology of the sulcal contours defining the POP and PTR described above
prevented delineation of these structures for volumetric measurements in four of the
104 hemispheres for the following reasons: absent anterior ascending ramus (two left
and one right hemispheres; no anterior/posterior boundary for the POP and PTR,
respectively), and absent horizontal ramus (one left hemispheres; no anterior boundary
for the PTR). Of these four hemispheres, one left hemisphere belongs to a musician
and the rest belong to non-musicians. Therefore, analyses of POP and PTR volumes
were performed in 26 right/25 left hemispheres in musicians and 25 right/24 left
hemispheres in non-musicians.
MANOVA revealed that orchestral musicians possessed significantly larger GM volume
of the left POP (F
4.5.2.2 COMPARISON OF GM/WM VOLUMES
= 14.7, p<0.001) compared to non-musicians. No significant
differences were detected for the left PTR, right POP/PTR GM volumes and for WM
volumes in all regions. Means ± 95% confidence intervals of POP/PTR GM and WM
volumes are presented in figures 4.9 and 4.10, respectively. A correlation analysis was
next performed using Pearson’s correlation between the significant region (left POP GM
volume) and duration of musical performance/age of the commencement of musical
training after controlling for subjects’ age. There was a significant positive correlation (r
= 0.7, p=0.0001) between GM volume of the left POP and years of musical performance
(figure 4.11A). There was no significant correlation between the left POP GM volume
and age of commencement of musical training. In musicians, there was a positive
correlation between age and left POP GM volume (r =0.6, p=0.01), while there was a
negative (but non-significant) correlation between age and left POP GM volume in non-

Investigating Structural Plasticity of POP & PTR in Musicians
145
musicians (r = -0.3, p=0.1). Figure 4.11B demonstrates a correlation between age and
left POP GM volume in non-musicians. Figure 4.12 shows POP outlined on 3D views of
left hemispheres of three musicians and three age-matched non-musicians. Table 4.3
shows the frequency distribution of diagonal sulci in the right and left POP in both
groups.
4.5.3 INTRA- AND INTER-RATER STUDY
Results of intra-rater study for POP/PTR volumes and ICVs were good ranging between
0.91 to 0.96. Results of inter-rater study were also good ranging between 0.87 to 0.94.
4.5.4 CORTICAL SURFACE AREA MEASUREMENTS OF BA44 AND BA45
Musicians possessed greater cortical surface area of the left BA 44 (F = 6.1, p=0.010).
No significant group differences were detected for the left BA45, right BA44, and right
BA45 regions. A correlation analysis was next performed using Pearson’s correlation
between the significant region (left BA44 cortical surface area) and duration of musical
performance/age of the commencement of musical training after controlling for subjects’
age. There was no significant correlation between left BA44 cortical surface area and
duration of musical performance/age of the commencement of musical training. Means
± 95% confidence intervals of BA44/BA45 cortical surface areas are presented in figure
4.13.

Investigating Structural Plasticity of POP & PTR in Musicians
146
Fig.4.9. Mean ± 95% confidence intervals of LPOP/LPTR and RPOP/RPTR GM volume
measurements (uncorrected for ICV) in musicians (blue, M) and non-musicians (red, C).

Investigating Structural Plasticity of POP & PTR in Musicians
147
Fig.4.10. Mean ± 95% confidence intervals of LPOP/LPTR and RPOP/RPTR WM
volume measurements (uncorrected for ICV) in musicians (blue colour, M) and non-
musicians (red colour, C).

Investigating Structural Plasticity of POP & PTR in Musicians
148
Fig.4.11. A, a graph showing the correlation between LPOP GM volume and years of
musical performance in musicians. B, a graph showing the correlation between LPOP
GM volume and age in non-musicians.
r = 0.7, p=0.0001

Investigating Structural Plasticity of POP & PTR in Musicians
149
Fig.4.12. Depiction of POP (red) on 3D displays of the left hemispheres of age-matched
musicians (left) and non-musicians (right).

Investigating Structural Plasticity of POP & PTR in Musicians
150
Table 4.3. The frequency percentage of diagonal sulci in the right and left POP in both
groups.
Right Left
Musicians 38.6% 40%
Non-musicians 53.8% 41%

Investigating Structural Plasticity of POP & PTR in Musicians
151
Fig.4.13. Mean ± 95% confidence intervals of Right BA44/45 and Left BA44/45 cortical
surface area measurements (uncorrected for total cortical surface area of the brain) in
musicians (blue, M) and non-musicians (red, C). Areas are mm2.

Investigating Structural Plasticity of POP & PTR in Musicians
152
4.6 DISCUSSION
The main finding of this study was increased GM volume of the left POP in orchestral
musicians, which was positively correlated with the duration of musical practice. In
addition to supporting previous finding of increased Broca’s area GM density (Sluming
et al., 2002) through automatic-manual cross validation, these findings may provide an
additional support to the assumption of functional segregation of Broca’s area as I found
significant difference only in the POP region of Broca’s area. I have also showed that
musicians had increased cortical surface area of the left BA44, which may provide a
new perspective to structural plasticity of Broca’s area in musicians and support the
volumetric findings.
Neuroplasticity refers to the brain’s ability to change its structure and function during
maturation, learning, environmental challenges, or pathology (Lledo et al., 2006). It
enables the brain to get beyond the confinements of its own genome thus adapting to
environmental pressures and experiences (Pascual-Leone et al., 2005).
Microscopically, two steps of plasticity can be identified: unmasking existing
connections, which may be followed by establishment of new ones through dendritic
growth and arborization (Pascual-Leone et al., 2005). In addition, it has been postulated
that the mammalian brain is capable of generating new neurons (Lledo et al., 2006).
Over the past two decades, animal model research had documented two phenomena
with a profound impact for understanding neuroplasticity. The first is significant plasticity
in the adult brain that accounts for new learning (Black et al., 1990, Anderson et al.,
1996, Kleim et al., 1998, Anderson et al., 2002, Swain et al., 2003, Kleim et al., 2004,
Matsuzaka et al., 2007). The second is that brain re-mapping following injury could be
stimulated by retraining animals to perform functions impaired by this injury (Nudo et al.,
1996). Such findings have sparked an intense interest in the neuroplastic processes
that underlie learning and skill acquisition, recovery of function, and rehabilitative
change after brain damage, e.g. following stroke (Forrester et al., 2008). A
comprehensive understanding of the processes and factors governing neuroplasticity is
therefore essential given the wide scope with which this process is involved.

Investigating Structural Plasticity of POP & PTR in Musicians
153
Musical practice is a multimodal task that requires the simultaneous integration of
multimodal sensorimotor information with multimodal sensory feedback mechanisms to
monitor performance. It is thus not surprising to find evidence of structural plasticity in
different brain regions in musicians. In this context, there has been growing literature
suggesting the presence of structural neuroplasticity in regions known to have particular
relevance for enabling musical performance, such as motor regions, corpus callosum,
auditory cortex, and cerebellum (Schlaug et al., 1995a, Schlaug et al., 1995b, Ozturk et
al., 2002, Schneider et al., 2002, Hutchinson et al., 2003, Lee et al., 2003, Bermudez et
al., 2009). The results of the present study extend this literature through revealing
increased volume and cortical surface area of the left POP/BA44 in musicians.
Although classically considered the most important language region in the brain,
functions of Broca’s area are not limited to language. Recent neuroimaging studies
have documented that this region is essential for grasping, motor sequence learning,
motor imagery, observation and preparation of action and imitation (Rizzolatti et al.,
1996, Krams et al., 1998, Binkofski et al., 1999, Iacoboni et al., 1999, Koski et al., 2002,
Mecklinger et al., 2002, Johnson-Frey et al., 2003), and hierarchical organization of
behavior by implementing a specialized executive system to control the selection and
nesting of action segments (Koechlin and Jubault, 2006). The proposal of a common
neural substrate for music, language, and motor functions was also supported by
evidence from clinical studies. For instance, it has been shown that children with
dyslexia exhibit specific timing difficulties in the domain of music (Overy et al., 2003),
motor control (Wolff and Lundberg, 2002), and language (Goswami et al., 2002); and
that music lessons in children with dyslexia can lead to improvement in language skills
(Overy et al., 2003). It has also been found that patients with severe non-fluent aphasia
can benefit from music therapy, such as melodic intonation therapy (Albert et al., 1973,
Sparks et al., 1974, Schlaug et al., 2009). I have reported that orchestral musicians
possessed greater GM volumes of the left POP (BA 44), a region known to be critically
important for language expression (Geschwind, 1970). The present results are in line
with the assumption of overlap between music and language. In particular, the POP has
been implicated in several musically relevant activities, such as musical syntax

Investigating Structural Plasticity of POP & PTR in Musicians
154
processing, calculating harmonic relations between a chord and a preceding harmonic
sequence, and detecting music-structural irregularities (Maess et al., 2001, Koelsch,
2006). Furthermore, recent studies have assigned a new functional role for the POP,
which is action understanding and imitation. Comparative neuroanatomy considers the
POP as the human homolog of area F5 (ventral premotor cortex) in the monkey where
multimodal mirror neurons have been located (Rizzolatti and Arbib, 1998). The POP is
considered a central component (‘hub’) of the human mirror neuron network, which also
includes the ventrolateral premotor cortex and anterior superior temporal gyrus
(Iacoboni et al., 1999, Binkofski and Buccino, 2006). These regions are activated by the
execution of manual action and by the observation of the same action performed by
others (Binkofski and Buccino, 2006). Recently, it has been shown that this network is
also involved in action-listening coupling. Functional studies have indicated that when
musically naive subjects listen to action-related sentences (Tettamanti et al., 2005), and
to previously practiced music (Lahav et al., 2007), there is differential activation of the
POP in the dominant hemisphere, which underlies the importance of this region for
audiomotor recognition. According to Baumgaertner et al, 2007 (Baumgaertner et al.,
2007), the auditory and motor networks are strongly linked in the musician’s brain, so
that even when the task involved only auditory or only motor processing, co-activation
phenomena within the receptive brain areas can be expected. The human mirror
system may have different ways of coding actions in each hemisphere with actions
coded through auditory, visual, and motor components in the left hemisphere, whereas
in the right hemisphere action coding appears to occur only via the visual and motor
channels (Aziz-Zadeh et al., 2004). This left lateralization of the human mirror neuron
system in the auditory domain has been suggested to facilitate the emergence of
language (Hauser et al., 2002). The findings of increased volume and surface area of
the POP in the left (dominant) hemisphere observed in this study could thus be
explained by its role in processing action-related sounds. This is in addition to its well-
known role in language/music processing. Previous structural neuroimaging studies
have clearly demonstrated structural plasticity in the frontal, parietal, and temporal lobes
in musicians, such as increased GM density in the premotor cortex, inferior temporal

Investigating Structural Plasticity of POP & PTR in Musicians
155
gyrus, and superior parietal lobule (Gaser and Schlaug, 2003a), increased cortical
thickness of the superior parietal lobe (Bermudez et al., 2009), increased cross-
sectional area of the left planum temporale (Schlaug et al., 1995b), and increased size
and cortical thickness of the Heschl gyrus (Schneider et al., 2002, Bermudez et al.,
2009). If these results are combined with findings of the present study, it could be
suggested that the functional fronto-parieto-temporal human mirror neuron network has
a structural basis in musicians evidenced by increased size of its individual
components.
The production of an internal duplicate of a heard action that is largely identical to an
action performed by the self places the listening subject in the perspective of the acting
one leading to the generation of a common link between them. It is therefore possible
that, during action listening conditions, the left POP is involved in sequence-specific
priming of action representations along with unconscious stimulations and predictions
for the next coming action or sound (Lahav et al., 2007). Such neural equivalence
between the sender and receiver of a message might be essential for communication
(Liberman and Whalen, 2000, Fadiga et al., 2002), learning and skill acquisition
(Haslinger et al., 2005), and therefore essential for enabling high level orchestral
performance by ensemble musicians.
It has been suggested that right-to-left hemisphere differences in the number of
diagonal sulci could result in right-left asymmetry in the volume of POP (Keller et al.,
2007). I therefore estimated the number of diagonal sulci in right and left POP with the
prediction that this may cause volume differences between musicians and non-
musicians. In the left POP, the frequency percentage of diagonal sulci in musicians and
non-musicians was nearly identical (40% and 41%, respectively), which may suggest
that this factor was not related to the volume differences between the two groups in the
present cohort.
There are topographical properties of the cerebral cortex, such as volume and surface
area, which are of great importance in quantitative morphometry and cannot be
estimated using the VBM technique (Rockel et al., 1980, Fischl and Dale, 2000). In
particular, the surface area of the cerebral cortex is of considerable theoretical interest.

Investigating Structural Plasticity of POP & PTR in Musicians
156
Recent studies suggested that increased cortical surface area is associated with
enhanced cognitive performance (Koscik et al., 2009). Several reports postulated that
the number of neurons in a particular cortical region is proportional to its surface area
(Rockel et al., 1974, Henery and Mayhew, 1989, Sisodiya et al., 1996, Sisodiya and
Free, 1997). I hypothesize that the finding of increased cortical surface area of the left
BA44 in musicians might reflect increased number of cortical neurons in this region.
More studies are required in the future to find out the exact correlation between MR-
derived morphometric measures and histological properties of the nervous tissue.
4.6.1 TECHNICAL LIMITATIONS
Volume estimation of biologic structures from the analysis of sections of structure of
interest is a problem that often arises in biomedical studies. Mathematic formulae and
techniques have thus been developed to address this problem leading to the so-called
stereological methods. These methods are well recognized for their easy
implementation (compared, for example, to manual tracing methods), reliability, and
high accuracy (
4.6.1.1 STEREOLOGICAL MEASUREMENT OF PARS OPERCULARIS AND PARS TRIANGULARIS VOLUMES
Doherty et al., 2000). Their efficiency depends on generating non-biased
encounters between randomly sampled sectional images and grids of systematically
spaced test points superimposed upon them; these test points have new random
position and orientation on each section to insure unbiasedness. In particular, the
stereological Cavalieri method applied here has been designed to estimate the volume
of any brain structure regardless of its shape, e.g. Broca’s area (Keller et al., 2007),
temporal lobe (Doherty et al., 2000), hippocampus (Keller et al., 2002), cerebellum
(Karabekir et al., 2009), and brain tumor (Roberts et al., 2000). Despite the well-
established advantages of the Cavalieri and point counting methods, they are not
capable of correcting for the technical limitations of the MRI technique, which could
compromise the precision and accuracy of the volume estimate. The use of Cavalieri
method and point counting for volume estimation may be challenging when examining
brain structures with irregular shapes and convolutions, such as the PTR, as a higher

Investigating Structural Plasticity of POP & PTR in Musicians
157
sampling attenuation is then required to estimate the volume with the same precision as
when it is smooth (Garcia-Finana et al., 2003). Another source of error may be
produced by inter-rater differences in measurement when identifying structure
boundaries on MR images. Even when investigators have sufficient experience in
neuroanatomy and image analysis methods, a consistent demarcation of features of
interest in MR images may be challenging. In particular, the finite resolution of the
images is recognized as an important problem of the MRI technique which may lead to
errors related to partial volume effect. Partial volume effect is the loss of contrast or
blurring between two adjacent tissues in an image caused by insufficient spatial
resolution of MRI compared to the size of anatomical structures, so that more than one
tissue type can occupy the same voxel. This problem is minimal with thin slice thickness
and sufficiently high resolution, so that fat and water or other different structures are
unlikely to occupy the same voxel (Acosta et al., 2008, Rueda et al., 2010). Although
the MR images analyzed in the present study were obtained with relatively high
resolution of 0.781 mm x 0.781 mm x 1.6 mm (which were re-sampled into 1 X 1 X 1
mm isotropic voxels), such resolution may unfortunately not be sufficient to solve the
tissue border ambiguity. Such ambiguity was evident at the GM/CSF boundary, thereby
influencing GM volume estimation, and at the GM/WM boundary, thereby influencing
GM and WM volume estimation. Since the intersection of the upper right quadrant of the
red cross was taken as the “point” in this study, it was sometimes difficult to indicate
whether this small part of the red cross intersects GM, WM, or CSF pixel. Images were
always displayed using consistent image window and display levels on the same
monitor with fixed screen contrast settings; however, in cases of tissue border
ambiguity, image window was enlarged to better visualize the ambiguous pixel. It
should be noted that this problem involved only few red crosses in each slice and is not
expected to change the results, especially with such high level of significance detected
in GM volume of the left POP region (p<0.001). The latest generation of MR scanners
allows the acquisition of higher resolution MR images, which can provide more accurate
volume quantification. Also, methods for accurate classification of mixed voxels and
correct estimation of the proportion of each pure tissue have been proposed (Acosta et

Investigating Structural Plasticity of POP & PTR in Musicians
158
al., 2008, Rueda et al., 2010), which may help to increase the precision of volume
estimation in future studies.
Furthermore, another technical factor that may affect volume estimates of POP/PTR in
the present study is inhomogeneities (e.g., shading) in signal intensity over the image
field of view caused by the spatial variation in the transmission and reception
sensitivities of the radiofrequency coil. Intensity inhomogeneity in MRI might alter image
intensities that would otherwise be constant for the same tissue type regardless of its
position in an image (Vovk et al., 2007). This has an impact on the demarcation of
tissue boundaries, which may subtly differ in contrast from one region to another in the
MR image. Sophisticated intensity inhomogeneity correction algorithms (for review see
(Vovk et al., 2007)) have been proposed and could be incorporated in future studies.
Other technical problems could arise from chemical shift and susceptibility artifacts as
well as field of view and slice thickness calibration inaccuracies, which can compromise
the accuracy of stereological measurements.
In order to enhance image analysis studies on the GM compartment, future data
acquisition at MARIARC is considering the use of 3D T1- weighted Modified Driven
Equilibrium Fourier Transform (MDEFT) sequence designed by (Deichmann et al.,
2004) to improve contrast between GM and WM. Also, most studies are now transferred
to a new 3 Tesla MR system, which offers increased signal to noise ratio thereby
increasing accuracy of acquired stereological measures.
In the present study, an automatic method was used to estimate cortical surface area of
BA44/45. The rationale was to avoid introducing bias when using other methods for
surface area estimation, such as stereology (
4.6.1.2 CORTICAL SURFACE AREA MEASUREMENT OF BA44/45
Haug, 1987, Steinmetz et al., 1989b).
However, automatic methods are not free of limitations. First, brains were initially
transformed to the Talairach space, which is a prerequisite step for achieving optimal
results in BrainVoyager. This atlas is one of the most prevalent brain atlases of gross
anatomy, the use of which is growing despite its well-known shortcomings (Steinmetz et
al., 1989a, Nowinski, 2001, Nowinski and Thirunavuukarasuu, 2001, Maldjian et al.,
2004, Nowinski, 2005). The coordinate system of Talairach space is based upon

Investigating Structural Plasticity of POP & PTR in Musicians
159
postmortem sections of a 60-year-old French female who had a smaller than average
brain size (Talairach and Tournoux, 1988), which criticize the wide use of this
coordinate system in MR studies. Also, previous studies have pointed out segmentation
inaccuracies (Maldjian et al., 2004, Nowinski, 2005) and low spatial consistency
(Nowinski and Thirunavuukarasuu, 2009) when using the Talairach coordinate system.
It should be noted that the cortical parcellation scheme used in the present study was
based not on cytoarchitecture, but on geometric features using outer anatomical
landmarks determined by structural MRI. One could argue that BA44 and BA45 are
strictly defined by cytoarchitecture, which cannot be directly observed in MRI scans. It
has been assumed by many brain-mapping studies that the macroanatomical gyral and
sulcal landmarks coincide with the borders of architectonic areas. That this hypothesis
is not tenable in general has been shown previously (Rademacher et al., 1993, Amunts
et al., 1999). For instance, Zilles and colleagues (Zilles et al., 1997) have noted that
sulcal landmarks are not generally precise indicators of the borders of cytoarchitectonic
areas. This concept is especially true in the case of Broca’s area. Amunts and
colleagues (Amunts et al., 1999) investigated the cytoarchitectural mapping of areas 44
and 45 in 10 human brains by means of an observer-independent technique. They
reported that the cytoarchitectonic borders of these areas did not consistently coincide
with sulcal contours and; consequently, they concluded that macroscopic features
(sulcal landmarks) are not reliable landmarks of cytoarchitectonic borders. Furthermore,
a great inter-subject variability in the microscopic (Amunts et al., 1999), and
macroscopic (sulcal morphology) (Tomaiuolo et al., 1999, Keller et al., 2007) anatomy
of BA44/45 was observed. The extremely variable extent and spatial layout of the
BA44/45 imply that the use of an atlas with a single-brain–based template, like the
Talairach and Tournoux, to locate these regions may have only an approximate
relationship to the location of individual sulci and Brodmann’s areas (Lancaster et al.,
2000).
The main advantage of automatic methods for cortical surface-based analysis, such as
that used in the present study, is the little requirement for user interaction and
neuroanatomical expertise, thereby resulting in lower inter-rater variability. It is thus

Investigating Structural Plasticity of POP & PTR in Musicians
160
reasonable to use these methods when analyzing large cohorts. However, these
methods neither guarantee accurate correspondences nor they directly make use of
expert knowledge of the location and variability of specific sulcal features as in
landmark-based methods (Pantazis et al., 2010). Even the most consistent gyri and
sulci appearing in all normal subjects exhibit pronounced variability in size and
configuration (Roland and Zilles, 1994). In accord, demarcation of sulcal landmarks of
POP and PTR, such as the anterior ascending and diagonal sulci, was not always
possible in the present study, thereby complicating the cortex-based alignment process.
In this context, Pantazis and colleagues (Pantazis et al., 2010) compared automatic
(using BrainVoyager and FreeSurfer image analysis softwares) and landmark-based
methods for cortical surface registration and concluded that, in general, the landmark-
based method is more reliable as it did not produce crude registration errors that are
often present in automatic methods.
4.7 CONCLUSION
In conclusion, the present study has shown that male orchestral musicians had greater
GM volume and cortical surface area of POP/BA44 in the left (dominant) hemisphere.
These results corroborate those of the previous VBM study. I hypothesize that long-
term skilful practice in the form of orchestral performance is an environmentally
enriching activity resulting in structural reorganization through increased volume and
cortical surface area of a brain region essential for such performance.

161
CHAPTER 5 INVESTIGATING THE EFFECT OF MUSICAL
EXPERTISE ON REGIONAL MORPHOMETRY OF THE CORPUS CALLOSUM

Investigating the Effect of Musical Expertise on Regional Morphometry of The CC
162
EFFECT OF MUSICAL EXPERTISE ON REGIONAL CALLOSAL
MORPHOMETRY
5.1 ABSTRACT
BACKGROUND AND PURPOSE The corpus callosum (CC) is the largest and latest
maturing white matter (WM) tract in the brain that connects homologues cortical regions
in both cerebral hemispheres thereby playing an integral role in relaying sensory, motor,
and cognitive information. In musicians, previous studies have reported increased
cross-sectional areas of the anterior and posterior CC. Gender and age of staring
musical training were suggested to be crucial in dictating these differences. Here, I
examined the effect of musical expertise on regional callosal morphometry.
SUBJECTS AND METHODS Thirty six right-handed subjects were categorized into
three age- and gender-matched groups based on musical expertise: 12 professional
musicians, 12 amateur musicians, and 12 non-musicians. T1-weighted 3D-MR images
were obtained. Cross-sectional areas of four CC regions corresponding to
rostrum/genu/anterior body (CC1), anterior midbody (CC2), posterior midbody (CC3),
and isthmus/splenium (CC4) were measured and compared between groups.
RESULTS There were significant group differences in CC1 and CC4 regions. No
significant differences were detected in other CC regions. Professional musicians had
significantly larger CC1 region compared to amateurs (p=0.01) and non-musicians
(p=0.01); and larger CC4 region compared to amateurs (p=0.01) and non-musicians
(p=0.006). No significant differences were detected between amateurs and non-
musicians in all CC regions.
CONCLUSION
These findings may support the assumption that training-induced
changes observed in musicians’ brains represent use-dependent structural plasticity
rather than genetic predisposition for being a musician. Results add another factor that
could influence callosal plasticity in musicians namely, musical expertise.

Investigating the Effect of Musical Expertise on Regional Morphometry of The CC
163
5.2 INTRODUCTION
The CC is the largest commissural WM tract in the brain. It is a heterogeneous structure
topographically organized into rostro-caudal sets of fibers each has distinct cortical
connections (de Lacoste et al., 1985, Denenberg et al., 1991, Huang et al., 2005, Hofer
and Frahm, 2006) and different microstructural properties, such as axon diameter and
myelination (Aboitiz et al., 1992 ).
The heterogeneous structure of CC topography and the existence of specific cortical
connections of each part underline the significance of studying regional morphometry of
the CC. Cross-sectional area of the midsagittal CC has been examined by three
previous studies in musicians. Schlaug and colleagues (Schlaug et al., 1995a) have
examined CC morphometry in 30 professional musicians and 30 non-musicians; they
reported increased cross-sectional area of the anterior CC half in musicians;
interestingly, this difference was due to larger anterior CC in a subgroup who began
their musical training before the age of 7 years. As an extension to the previous study,
Lee et al. (Lee et al., 2003) recruited a larger cohort of 56 musicians and 56 non-
musicians and replicated the finding of increased anterior CC size in musicians. In
addition to testing the effect of musicianship on CC morphometry, the latter study
investigated gender effect and reported significant gender by musicianship interaction
with only male musicians having increased size of the anterior CC. Another study
reported that musicians have increased size of both anterior and posterior halves of CC
(Ozturk et al., 2002). It is commonly believed that the midsagittal callosal area is linked
to the number of fibers crossing through (Aboitiz et al., 1992 , Highley et al., 1999,
Bengtsson et al., 2005, Westerhausen et al., 2006). It was thus hypothesized that
increased size of CC in musicians indicate structural plasticity during a maturation
period essential for increased inter-hemispheric communication (Schlaug et al., 1995a).
Such enhanced communication is crucial for subserving complex bimanual motor
control and auditory perception.
According to the literature, factors that shape neuroplasticity in musicians include age of
commencing musical tuition (Elbert et al., 1995, Schlaug et al., 1995a, Amunts et al.,
1997, Jancke et al., 1997, Pantev et al., 1998, Schlaug et al., 1998, Ohnishi et al., 2001,

Investigating the Effect of Musical Expertise on Regional Morphometry of The CC
164
Schlaug, 2001, Lotze et al., 2003, Koeneke et al., 2004, Bengtsson et al., 2005, Imfeld
et al., 2009), duration of musical performance (Sluming et al., 2002, Hutchinson et al.,
2003, Aydin et al., 2005, Abdul-Kareem et al., 2011), instrument specialty (Elbert et al.,
1995, Pantev et al., 2001, Schneider et al., 2005, Bangert and Schlaug, 2006, Shahin et
al., 2008), and musical expertise. The latter factor was examined in relatively few
studies (Schneider et al., 2002, Gaser and Schlaug, 2003b, Lotze et al., 2003, Shahin
et al., 2008). According to this factor, musicians were classified into ‘professionals’ and
‘amateurs’. Schlaug and colleagues (Gaser and Schlaug, 2003a) defined ‘professional
musicians’ as performing artists, full-time music teachers, or full-time conservatory
students having an average daily practice time of at least one hour, while the term
‘amateur musicians’ indicates those who played a musical instrument regularly but
whose profession was outside the field of music. Most previous studies reported that
professional musicians had increased size of brain regions compared to amateurs and
non-musicians. Using voxel-based morphometry (VBM), Gaser and Schlaug (Gaser and
Schlaug, 2003a) examined 20 professional musicians, 20 amateur musicians, and 40
non-musicians. Results indicated a significant effect of musician’s status on gray matter
(GM) density in several brain regions. This means that GM density was highest in
professional musicians, intermediate in amateur musicians, and lowest in non-
musicians. Increased GM density in professionals was reported in motor areas,
somatosensory areas, superior parietal gyrus, left Heschl gyrus, left cerebellum, left
inferior frontal gyrus, and inferior temporal gyrus. However, in that same study, authors
did not report significant findings in the CC, which was linked to the relative weakness
of VBM in detecting WM density differences. The study of (Schneider et al., 2002)
provided another example of the effect of musical expertise on brain morphometry
through demonstrating increased volume of the Heschl gyrus (which contains the
primary auditory cortex) in professional musicians compared to amateurs and non-
musicians. In addition to the above mentioned structural markers of musical expertise,
the literature suggests the existence of a corresponding correlation between musical
expertise and brain function. Compared to amateurs, professional violinists were shown
to generate higher electromyographic amplitudes during performance of Mozart's violin

Investigating the Effect of Musical Expertise on Regional Morphometry of The CC
165
concerto and showed focused cerebral activations in the contralateral primary
sensorimotor cortex, bilateral superior parietal lobes, and ipsilateral anterior cerebellar
hemisphere (Lotze et al., 2003). Also, a study that recorded induced oscillatory gamma
band activity (which correlates with attention, anticipation, and expectation) has
demonstrated that professionals exhibited larger activity for music tones compared to
pure tones indicating enhanced timbre specificity, while amateurs showed weak
discrimination (Shahin et al., 2008). Likewise, professional musicians were reported to
achieve more precise judgments of timbral dissimilarities of synthesized instrument
sounds compared to amateurs and non-musicians (McAdams et al., 1995). The above
evidence indicates that professional musicians, being involved in intensive highly skilled
musical performance, have developed increased size of several brain regions and
higher perceptual learning induced by auditory experience compared to amateurs and
non-musicians. The aim of the present study was to extend the literature through
exploring whether regional CC size differences (cross-sectional areas) exist between
three matched groups of subjects (professional musicians, amateur musicians, and
non-musicians) that differed in musical expertise.
5.2.1 HYPOTHESIS
I hypothesized that professional musicians, being involved in complex cognitive,
sensorimotor, auditory, and visuospatial skill acquisition, would show evidence of
increased size of CC1, CC3, and CC4 regions compared to amateur musicians and
non-musicians. Fibers crossing these callosal regions connect cortical areas that were
shown to be critically involved in enabling high level musical performance, including the
prefrontal cortex (CC1), primary motor cortex (CC3), primary somatosensory cortex,
superior parietal lobule, and auditory cortical areas (CC4). Since the size of the
midsagittal CC was shown to be positively correlated with the number of crossing fibers
(Aboitiz et al., 1992), structural enlargement of CC1, CC3, and CC4 regions is therefore
essential to support the need for enhanced inter-hemispheric communication in
professional musicians’ brains.

Investigating the Effect of Musical Expertise on Regional Morphometry of The CC
166
5.3 SUBJECTS AND METHODS
5.3.1 SUBJECTS
The cohort included 36 right-handed male volunteers recruited after obtaining Local
Research Ethics Committee approval. All subjects gave signed informed consent and
were medically screened for neurological, cardiovascular, and endocrine disorders.
Subjects were also questioned regarding their alcohol consumption. Handedness was
assessed using Edinburgh Handedness Inventory (Oldfield, 1971). The cohort was
categorized into three age-, gender-, and handedness matched groups: twelve
professional musicians, twelve amateur musicians, and twelve non-musicians. Table
5.1 shows descriptive statistics for all groups. Data regarding the duration of musical
practice were not taken so I did not include this factor in statistical analysis.
Classification of musicians into professionals and amateurs was
5.3.1.1 MUSICIANS’ PROFILES
validated by the
measurement of music audition tonal test (Schneider et al., 2002). In this test, 30 pairs
of short melodies were presented. These melodies have changes in pitch (10 pairs) or
rhythm (10 pairs), or are unchanged (10 pairs). Subjects detected the modification in a
three-way forced choice task. Only tonal raw test scores were calculated. Responses
were calculated as 20 plus the number of correct responses, minus the number of false
alarms. Control subjects scored less than 25 on a scale of 0−40 (range 17−24),
professional musicians had a score of at least 26 (range 26−39), and amateur
musicians scored in an intermediate range (18−33). Professional musicians were those
who had undergone a professional music education ending with a diploma, and were
actively performing at the time of examination, while amateur musicians were those who
received special instruction in one or more musical instruments. Table 5.2 shows
instrument specialty of professionals and amateurs.

Investigating the Effect of Musical Expertise on Regional Morphometry of The CC
167
Table 5.1. Demographics of subjects recruited in the present study.
Group *Age (years) Mean / SD / range
*Age of starting musical training (years) Mean / SD / range
Professionals 38.3 / 9.5 / 29-55 5.2 / 1.1 / 3-7
Amateurs 41.5 / 11.8 / 24-62 6.1 / 0.9 / 5-7
Non-musicians 36.3 / 4.4 / 26-43 N/A
*One-way analysis of variance revealed no significant group difference in age (p=0.37).
Independent student t test revealed no significant difference in age of starting musical
training between professionals and amateurs (p=0.7).
Table 5.2. Instrument specialty of all musicians.
5.3.2 MR DATA ACQUISITION
All volunteers were scanned using a protocol with identical sequence and parameters.
T1-weighted 3D-MRI images were obtained using Siemens symphony 1.5 T (Siemens,
Magnetom, Germany). Magnetization-Prepared Rapid Gradient-Echo imaging
(MPRAGE) sequence was used with TR/TE/TI= 2040/3.93/1100 ms, slice thickness = 1
mm, field of view = 256 mm, matrix size=256 X 224, voxel size = 1 X 1 X 1 mm, no. of
slices =176 sagittal slices, flip angle = 15º, bandwidth = 130 Hz/Px, and acquisition time
= 7 minutes and 38 seconds.
Professionals Amateurs
Instrument No. Instrument No.
Piano 8 Piano 7
Violin 3 Violin 3
Viola 1 Viola 2

Investigating the Effect of Musical Expertise on Regional Morphometry of The CC
168
5.4 METHODS
Image analysis methods used in this study include:
• Measurement of intracranial volume (ICV) using design-based stereology,
which involved application of Cavalieri method combined with point counting
(Roberts et al., 2000, Garcia-Finana et al., 2003).
• Measurement of cross-sectional areas of CC regions.
5.4.1 MEASUREMENT OF INTRACRANIAL VOLUME
To control for head size, ICVs were measured using design-based stereology, which
involved application of Cavalieri method combined with point counting as described in
chapter 3, section 3.9, pages 74-79.
5.4.2 MEASUREMENT OF CROSS-SECTIONAL AREAS OF CC REGIONS
The method of measurement of cross-sectional areas of CC regions is described in
chapter 3, section 3.10, pages 80-83.
5.4.3 INTRA- AND INTER-RATER RELIABILITY
Intra-rater reliability was analyzed by repeating ICV and CC measurements (cross-
sectional areas of CC1-CC4) of all subjects by IA with at least 3 weeks between the two
measurements. For inter-rater reliability, ICV and CC measurements were
independently performed by two raters (MA and IA) for all subjects. An intra-class
correlation coefficient greater than 0.80 was accepted as evidence of inter- and intra-
rater reliability.
5.4.4 STATISTICAL ANALYSIS
Statistical analyses were performed using SPSS v. 16.0 for Windows and statistica
program, v. 6.0 (Statsoft Inc., USA). Shapiro-Wilk (S-W) was used to test normality of
data distribution. Cross-sectional areas of CC1-CC4 regions were corrected for ICV as
recommended by previous studies (Rauch and Jinkins, 1994, Steinmetz et al., 1995,
Giedd et al., 1999, Smith, 2005, Phillips et al., 2007). To achieve this task, the square

Investigating the Effect of Musical Expertise on Regional Morphometry of The CC
169
root of the cross-sectional area of each CC region was divided by the cube root of the
ICV for each subject (Smith, 2005, Phillips et al., 2007).
Using SPSS, multivariate analysis of variance (MANOVA) was performed with ICV-
corrected measures of CC1-CC4 regions as dependent variables and musicianship
(professionals versus amateurs versus non-musicians) as the independent variable with
age as covariate; p<0.05 was considered significant after adjustment for multiple
comparisons. Pearson’s correlation was used to perform correlation analyses. One-way
analysis of variance was used to compare ICV measurements between groups. The
intra-class correlation coefficient (ICC) calculated by one-way random model was used
to test the intra- and inter-rater reliability. A coefficient greater than 0.80 was accepted
as evidence of inter- and intra-rater reliability. Statistica program was used to produce
figures 5.1 and 5.2.

Investigating the Effect of Musical Expertise on Regional Morphometry of The CC
170
5.5 RESULTS
5.5.1 MEASUREMENT OF INTRACRANIAL VOLUME
One-way analysis of variance revealed no significant group difference in ICV (p=0.32).
Figure 5.1 illustrates Means ± 95% confidence intervals for ICV.
5.5.2 COMPARISON OF REGIONAL CROSS-SECTIONAL AREAS OF THE CC
Results revealed significant CC region by musicianship interaction in CC1 and CC4
regions (F
5.5.3 INTER- AND INTRA-RATER STUDY
= 5.85; p=0.003), and (F = 5.85; p=0.002), respectively. No significant
difference was detected in other CC regions. Post hoc test (Bonferroni adjusted)
revealed that professional musicians had significantly larger CC1 region size compared
to amateurs (p=0.01) and non-musicians (p=0.01); and larger CC4 region size
compared to amateurs (p=0.01) and non-musicians (p=0.006). No significant difference
was detected between amateurs and non-musicians in all CC regions. Means ± 95%
confidence intervals of cross-sectional areas of CC regions are illustrated in figure 5.2.
Correlation analyses were next performed using Pearson’s correlation between age of
starting musical training and cross-sectional areas of CC1/CC4 regions after controlling
for subjects’ age. There was no significant correlation between cross-sectional area of
CC1/CC4 regions and age of starting musical training (p>0.05) in professional
musicians. Figure 5.3 shows midsagittal slices from professional, amateur, and control
subjects.
The result of inter-rater reliability was good ranging between 0.90-0.96. The result of
intra-rater reliability was also good ranging between 0.93 and 0.98.

Investigating the Effect of Musical Expertise on Regional Morphometry of The CC
171
Fig.5.1. Means ± 95% confidence intervals of ICV in the three groups examined in the
present study. Volumes are mm3
.

Investigating the Effect of Musical Expertise on Regional Morphometry of The CC
172
Fig.5.2. Mean ± 95% confidence intervals of cross-sectional areas of the four callosal
regions (CC1-CC4) (uncorrected for ICV) in professional musicians, amateurs and non-
musicians. Areas are mm2
.
CC1
CC2 CC3
CC4

Investigating the Effect of Musical Expertise on Regional Morphometry of The CC
173
Fig.5.3. Mid-sagittal MR sections showing the CC (yellow dashed box) in a professional
musician (top), an amateur (middle), and a control subject (bottom) aligned along the
maximum anteroposterior length of the CC.

Investigating the Effect of Musical Expertise on Regional Morphometry of The CC
174
5.6 DISCUSSION
Regional callosal morphometry based on MRI has been used extensively in previous
studies owing to the ease with which the CC is identified on midsagittal MR sections,
and the fact that the CC is extensively connected with the cerebral cortex making it an
ideal tool to probe several behavioral, psychological, and pathological conditions. In
accordance, regional morphometry of the CC has been used to investigate handedness
(Cowell et al., 1993), sexual dimorphism (Bermudez and Zatorre, 2001), natural aging
and development (Giedd et al., 1996, Keshavan et al., 2002), use-dependent structural
changes in response to skill acquisition (Schlaug et al., 1995a, Ozturk et al., 2002, Lee
et al., 2003), as well as in several neurological and psychological disorders, such as
schizophrenia (Rotarska-Jagiela et al., 2008), depression (Lacerda et al., 2005),
Alzheimer disease (Hallam et al., 2008, Li et al., 2008), dyslexia (Hynd et al., 1995,
Rumsey et al., 1996), autism (Kilian et al., 2008), and several others. Here, I test the
effect of musical expertise on CC structure. I have selected a cohort of male
professionals and amateurs who commenced their musical training at or before age of 7
years to control for gender and age of commencement of musical training as previous
studies suggested that these factors are important determinants of CC plasticity in
musicians (Schlaug et al., 1995a, Lee et al., 2003).
5.6.1 WITELSON’S VERSUS DTI-BASED PARCELLATION OF CC TOPOGRAPHY
According to Witelson’s scheme used in the present study (Witelson, 1989), the CC1
region (rostrum/genu/anterior part of the body) contains fibers from the prefrontal,
premotor, and supplementary motor cortical regions; CC2 region (anterior midbody)
contains fibers from the primary motor region; CC3 region (posterior midbody) contains
fibers from the sensory and posterior parietal regions; and CC4 region (isthmus and
splenium) contains most of the fibers from the parietal, temporal, and occipital regions.
These callosal subdivisions were based mainly on studies of monkeys (Pandya et al.,
1971, Barbas and Pandya, 1984, Cipolloni and Pandya, 1985) and postmortem studies
in humans (de Lacoste et al., 1985). However, advance in DTI technique has allowed
scientists to examine the callosal structure in vivo. Numerous studies based on diffusion

Investigating the Effect of Musical Expertise on Regional Morphometry of The CC
175
tensor tractography have extended our knowledge regarding topological partitions of the
CC through incorporating callosal parcellation with various region of interest selection
methods, such as brief definition of cortical areas (Huang et al., 2005, Hofer and Frahm,
2006), determining geometric features of outer anatomical landmarks by structural MRI
(Park et al., 2008), and clustering the CC subdivisions by parcellating neural pathways
that connect the CC and distinct Brodmann’s areas (Chao et al., 2009).These studies
reported discrepancies between the DTI-based fiber topology of the human CC and
Witelson's classification and showed that callosal fiber topology is subjected to
considerable inter-individual variability along the antero-posterior axis. First, although
DTI studies agreed with Witelson’s scheme in the fact that prefrontal fibers cross
through the CC1 region, they showed contradicting results regarding the full extent of
these fibers across the antero-posterior dimension of the CC. Hofer and colleagues
(Hofer and Frahm, 2006) demonstrated that prefrontal fibers occupy only the anterior
1/6th
Zarei et al., 2006
of the CC, while other studies showed that these fibers extend to anterior midbody
(CC2) ( , Chao et al., 2009), and may even reach the posterior midbody
(CC3) (Park et al., 2008). Second, fibers from premotor and supplementary motor
cortical regions do not only occupy CC1 region as Witelson’s scheme suggested but
also extend to anterior midbody (CC2) (Hofer and Frahm, 2006). Third, in contrast to
Witelson’s classification, DTI studies have indicated that callosal motor fiber bundles
cross the CC in a much more posterior location than previously indicated. In other
words, these fibers cross the posterior midbody (CC3) rather than the anterior midbody
(CC2) (Hofer and Frahm, 2006, Wahl et al., 2007, Park et al., 2008, Chao et al., 2009).
One possible explanation for the posterior shift of callosal motor fibers in humans
relative to monkeys is the massive increase in prefrontal cortex volume, in particular the
prefrontal WM, in humans (Schoenemann et al., 2005), which suggests connectional
expansion (Wahl et al., 2007). A part from the above-mentioned discrepancies, both
DTI and Witelson’s schemes agreed that the isthmus and splenium (CC4) contain fibers
from the primary somatosensory cortex (isthmus), and from parieto-temporo-occipital
regions (splenium). DTI studies also showed that splenial fibers are arranged in a
dorso-ventral dimension corresponding to the medio-lateral cortical axis with fibers from

Investigating the Effect of Musical Expertise on Regional Morphometry of The CC
176
the parietal lobe occupying mainly the dorsal part of the splenium, while fibers from the
temporal and occipital lobes occupying the ventral part of the splenium (Park et al.,
2008). Despite these discrepancies, Witelson’s scheme has been widely used in
callosal studies as it is simple, reliable, and has less technical limitations known to DTI
studies.
5.6.2 INCREASED CC1 AND CC4 SIZE IN PROFESSIONAL MUSICIANS
In the present study, I found increased size of CC1 and CC4 regions in professional
musicians compared to both amateurs and non-musicians. In addition, amateurs did not
show significant size differences compared to non-musicians. I have shown that
regional CC macrostructure in musicians is affected by musician’s expertise, which
could be added to other previously reported factors, such as age of starting musical
training (Schlaug et al., 1995a) and gender (Lee et al., 2003). Possible factors
contributing to increased callosal size include more fibers crossing through the CC,
thicker fibers, higher proportion of myelinated fibers, or a combination of these changes
(Cowell et al., 1992, Schlaug et al., 1995a). In a postmortem study of the human CC,
Aboitiz and colleagues (Aboitiz et al., 1992) reported that an increased callosal size
may indicate increased total number of fibers crossing through. Furthermore, increased
callosal size has been shown to correlate with increased fractional anisotropy (FA)
(Hasan et al., 2008). The FA value has been related to intra-axonal organization
(Kinoshita et al., 1999), density of fibers, and myelination (Mori and Zhang, 2006, Sun
et al., 2006, Trivedi et al., 2009). It is thus possible that the increased size of CC1 and
CC4 regions observed in professional musicians is related to increased fiber density
and myelination, although one should use this interpretation with care when dealing with
conventional MR methodologies. DTI studies are required in the future to provide
additional information about structural plasticity of the CC in musicians.
Both DTI and postmortem studies (de Lacoste et al., 1985, Chao et al., 2009) agreed
that the rostrum, genu, and anterior part of the callosal body (i.e. CC1) connect mainly
prefrontal regions, while the isthmus and splenium (i.e. CC4) connect temporo-parieto-
occipital regions. It has been shown that both the size (Narberhaus et al., 2008), and FA

Investigating the Effect of Musical Expertise on Regional Morphometry of The CC
177
value (Salo et al., 2009) of the genu are correlated with cognitive functions, such as
verbal fluency, attention, motor speed, executive functioning, and memory (Narberhaus
et al., 2008). The prefrontal cortex is involved in several functions essential for musical
performance, including skill acquisition, imitation learning of hand actions (Vogt et al.,
2007), procedural sequence learning (Jenkins et al., 1994), attention (Lau et al., 2004),
music processing and perception (Zatorre et al., 1998, Ohnishi et al., 2001), and spatial
working memory (Robertson et al., 2001). In musicians, fMRI studies revealed that the
prefrontal cortex plays a key role in the generation of musical structures during
improvisation (Bengtsson et al., 2007). Furthermore, professional musicians showed
weaker activations within the prefrontal cortex compared to non-musicians while
performing a bimanual motor task (Haslinger et al., 2004). This might imply that
professional musicians require less attention to action selection of the correct
movement (Deiber et al., 1991, Botvinick et al., 1999). It is therefore possible that
increased size of CC1 region reported here represent use-dependent structural
adaptation essential for increasing inter-hemispheric communication between prefrontal
cortices. The finding of increased CC1 size in professionals is in partial agreement with
those of (Schlaug et al., 1995a, Ozturk et al., 2002, Lee et al., 2003) who reported
increased size of the anterior half of CC. In the present study, the anterior CC half was
further divided into rostrum/genu/anterior body and anterior midbody as these regions
have distinct anatomical connections.
The isthmus part of the CC (the smallest part of CC4 region) contains fibers from the
primary somatosensory cortex. Compared to non-musicians, musicians have greater
sensory load imposed by their complex skilful performance. In accord, previous studies
have shown evidence of use-dependent structural-functional adaptation in the primary
somatosensory cortex in professional musicians, such as increased GM density in the
left primary somatosensory cortex in right-handed pianists and increased cortical
representation of the digits (second to fifth) of the left hand in string players. These
findings are compatible with increased size of the isthmus reported here.
The splenium (the largest part of CC4 region) has a massive number of fibers crossing
from parietal, temporal, and occipital regions. This part of the CC plays a key role in skill

Investigating the Effect of Musical Expertise on Regional Morphometry of The CC
178
acquisition. Previous studies had indicated that it is crucial in relaying visuospatial
cognitive information (Schmitt et al., 2001, Tomaiuolo et al., 2002, Pollmann et al.,
2004, Fryer et al., 2008) through connecting visual ad parietal cortices. Musicians are
well-known for their enhanced visuospatial performance (Sergent et al., 1992, Stewart
et al., 2003). When practicing music, they need to read musical notations and translate
them into movement patterns, a process known as sight reading (Sergent et al., 1992).
Music reading can thus be considered as a visuospatial cognitive task in which vertically
oriented musical notes are mapped onto the fingers, which strike horizontally oriented
keyboard elements as in keyboard players (Stewart et al., 2003). In this context,
professional musicians were reported to have increased GM density in the superior
partial lobule (Gaser and Schlaug, 2003a), a region known to subserve visuomotor
control (Jeannerod et al., 1994). The splenium also contains fibers from the superior
temporal gyri in which the primary and secondary auditory cortices are located. Several
studies reported structural-functional plasticity in auditory regions in musicians, such as
increased volume and GM density of the Heschl gyrus (Schneider et al., 2002,
Bermudez et al., 2009), increased size of the right and left planum temporale (Schlaug
et al., 1995b, Bermudez and Zatorre, 2005), increased auditory cortical representation
of piano tones (Pantev et al., 1998), increased multimodal auditory-somatosensory
(Schulz et al., 2003), and auditory-motor integration (Lotze et al., 2003, Bangert et al.,
2006, Baumann et al., 2007), and enhanced timbre specificity (McAdams et al., 1995,
Shahin et al., 2008). Thus, I may also propose that structural enlargement of the
splenium revealed in professional musicians represent use-dependent structural
adaptation essential for increasing inter-hemispheric communication between visual,
parietal, and auditory cortices. Results of the present study agree well with those of
(Ozturk et al., 2002), which showed increased size of the posterior CC in musicians.
The lack of significant differences in CC2 and CC3 regions contradicts with previous
studies (Schlaug et al., 1995a, Ozturk et al., 2002, Lee et al., 2003). According to
recently published DTI studies, CC2 region is mostly occupied by premotor and
supplementary motor fibers, while CC3 region contains fibers from the primary motor
cortex (Park et al., 2008, Chao et al., 2009). The lack of significant findings in these

Investigating the Effect of Musical Expertise on Regional Morphometry of The CC
179
regions may indicate their additional involvement in a multitude of non-musical tasks
that were practiced by amateurs and non-musicians. The curved shape of the CC and
the parcellation scheme used in the present study have resulted in larger CC1 and CC4
regions compared to smaller CC2 and CC3 regions. It is possible for fibers from CC2
and CC3 to overlap with neighboring regions, as shown clearly from DTI studies,
thereby averaging out subtle size differences between groups in these regions.
Studies that have shown a positive correlation between musical expertise and
neuroplasticity (Schneider et al., 2002, Gaser and Schlaug, 2003a, Lotze et al., 2003)
might provide a good support to the assumption that plastic changes observed in
musicians’ brains represent use-dependent adaptations imposed by intensive skilful
practice rather than an innate predisposition for being a musician. If the latter
assumption is true, then we would expect similar changes in brains of professional and
amateur musicians. Indeed in the present study I have not only observed increased
callosal size in professionals relative to amateurs and non-musicians, but also no
significant differences between amateurs and non-musicians. The fact that both groups
of musicians were matched for age, gender, handedness, and age of starting musical
training implies that playing musical instrument might not necessarily lead to induction
of structural plastic changes in the candidate’s brain; what is more important is the
quantity of that training. Results of the present study suggest that this assumption is at
least true when considering the callosal structure. In accord, it has been shown that
there are no neural, cognitive, and motoric differences between children enrolled in
music training program and those who are not planning to take music lessons (Norton
et al., 2005).

Investigating the Effect of Musical Expertise on Regional Morphometry of The CC
180
5.6.3 METHODOLOGICAL CONSIDERATIONS AND LIMITATIONS OF THE STUDY
The present study suffers from some technical limitations common to MR studies, which
may produce difficulties that can impact estimates of the callosal area. Partial volume
and effects related to limited image resolution made it difficult to delineate the
ambiguous boundaries of the CC (Clarke and Zaidel, 1994), such as, for example, the
boundary between the dorsal border of the CC and the cingulate gyrus. In addition, it
was challenging to disambiguate confusion due to non-callosal structures, such as that
due to fornix and septum pellucidum visual encroachment onto the CC.
Comparison of current morphometric results with previous studies in musicians may be
problematic when different criteria are used to measure the CC. First, despite the fact
that previous studies used Witelson’s method to examine callosal morphology on
midsagittal MR images, they often do not provide detailed information about the
anatomic landmarks used to define the midsagittal plane. Without explicit measures to
account for or to describe these features, all subsequent processing is prone to error in
examining for inter-subject differences. In the present study, the midsagittal plane was
carefully selected according to specific anatomical landmarks, which insured consistent
segmentation results. In effect, intra- and inter-rater reliability measures were good
ranging between 0.93-0.98 and 0.90-0.96, respectively. Second, the use of different
methods to identify the CC plane along which vertical lines are applied can greatly
impact the size of resulted CC subdivisions. For example, Schlaug and colleagues
(Schlaug et al., 1995a) have set CC subdivisions according to the bicommissural plane,
while in the present study, the CC was rotated so that the line connecting the ventral
most points of the anterior and posterior CC is horizontally oriented before setting CC
subdivisions along the maximum antero-posterior width of the CC. Third, although most
previous studies followed Witelson’s scheme to segment the CC, they often interpret
their findings based on different numbers of CC subdivisions, such as 2, 3, 5 and 9
subdivisions (Aboitiz et al., 1992 , Schlaug et al., 1995a, Highley et al., 1999,
Westerhausen et al., 2004), which makes comparison of findings across studies
extremely challenging.

Investigating the Effect of Musical Expertise on Regional Morphometry of The CC
181
Several geometric partitions have been proposed to subdivide the CC on midsagittal
MR images in addition to Witelson’s scheme used in the present study (Denenberg et
al., 1991, Weis et al., 1993, Clarke and Zaidel, 1994, Rajapakse et al., 1996). It should
be noted; however, that these partitioning methods are basically geometric and do not
take into account neuronal fiber composition or fiber connections through the CC. As
discussed previously, DTI studies have indicated that callosal fiber topology is complex
and subjected to great inter-individual variations. Consequently, the use of geometric
sectioning schemes may oversimplify callosal structure. Recently, several groups have
used DTI to generate probabilistic topographic maps of the CC, which may provide
more accurate CC segmentation scheme based on individual anatomical connectivity
(Park et al., 2008, Chao et al., 2009) rather than crude geometric segmentation
schemes.
5.7 CONCLUSION
In conclusion, it was shown that professional musicians had increased size of CC1 and
CC4 regions compared to amateurs and non-musicians. These findings extend the
currently expanding literature suggesting use-dependent structural adaptation in
musicians’ brains induced by skilful practice. I hypothesize that these structural changes
are essential to support enhanced inter-hemispheric communication between cortical
regions connected by fibers traversing the CC1 and CC4 regions. These results add
another factor that could influence structural plasticity of the CC in musicians namely,
musical expertise.

182
CHAPTER 6 INVESTIGATING REGIONAL MACRO- &
MICROSTRUCTURAL PLASTICITY OF THE CORPUS CALLOSUM IN MUSICIANS

Investigating Regional Macro- & Microstructural Plasticity of The CC in Musicians
183
MACROSTRUCTURAL AND MICROSTRUCTURAL PLASTICITY OF THE
ISTHMUS AND SPLENIUM IN MUSICIANS: EVIDENCE FROM
CONVENTIONAL MAGNETIC RESONANCE AND DIFFUSION TENSOR
TRACTOGRAPHY
6.1 ABSTRACT
BACKGROUND AND PURPOSE To investigate regional macrostructural and
microstructural plasticity of the corpus callosum (CC) in musicians. Using conventional
MR morphometry, previous studies reported increased CC macrostructure in musicians.
Here, I add to the literature through reporting on regional macrostructure and
microstructure of the CC using a combination of structural MR and diffusion tensor
imaging (DTI) techniques, respectively.
SUBJECTS AND METHODS Twelve right handed musicians (9 males/3 females) and
twelve age-, gender-, and handedness-matched controls were examined. Cross-
sectional areas (macrostructure) of 4 callosal regions corresponding to rostrum, genu,
and anterior body (CC1), anterior midbody (CC2), posterior midbody (CC3), and
isthmus and splenium (CC4) were measured on midsagittal T1-weighted MR sections.
Using DTI, fiber tractography of corresponding regions was performed to measure
average fractional anisotropy (FA), mean diffusivity (MD), tract volume, and number of
streamlines (microstructure) in each region. These measures were normalized for
intracranial volumes and compared between groups.
RESULTS Statistical analysis revealed increased normalized cross-sectional area
(p=0.001), average FA (p=0.001), normalized tract volume (p=0.003), normalized
number of streamlines (p=0.002), and decreased MD (p=0.02) in CC4 region in
musicians. No significant results were detected in other regions and no significant
gender by musicianship interaction. Cross-sectional area of CC4 was negatively
correlated with age of commencing musical tuition (r = -0.7, p=0.01). There was a
significant positive correlation between cross-sectional area and average FA value in
CC4 region in all subjects (r = 0.5, p=0.004).

Investigating Regional Macro- & Microstructural Plasticity of The CC in Musicians
184
CONCLUSION It could be hypothesized that increased macro- and microstructural
measures in CC4 region represent structural plasticity crucial for supporting enhanced
inter-hemispheric communication between parietal, temporal, and occipital cortical
regions in musicians.

Investigating Regional Macro- & Microstructural Plasticity of The CC in Musicians
185
6.2 INTRODUCTION
The CC is the largest white matter (WM) commissure in the brain consisting of
approximately 180 million contralateral axonal projections (Blume, 1984) that connect
homologous cortical regions in both cerebral hemispheres (de Lacoste et al., 1985,
Hofer and Frahm, 2006).
The technique of DTI has revolutionized the field of WM mapping. This MR-based
methodology characterizes the diffusivity of water molecules in the human brain and
can provide important information about WM microstructure that is not available from
other imaging modalities (Basser et al., 1994, Pierpaoli et al., 1996). Diffusion-weighted
imaging also offers the possibility of in vivo visualization of major fiber tracts, i.e.
diffusion tensor tractography (DTT). This technique can provide quantitative data of
reconstructed tracts, such as average FA, MD, tract volume, and number of
streamlines, which may have different discriminative power (Correia et al., 2008, Tate et
al., 2010). The FA and MD provide information about the microstructural features of
WM, which include intra-axonal organization, density of fibers, degree of myelination,
and individual fiber diameter (Mori and Zhang, 2006, Sun et al., 2006). In particular,
tract volume and number of streamlines were suggested to provide useful tools for
detecting subtle differences in WM integrity (Ciccarelli et al., 2003, Correia et al., 2008),
and may provide results comparable to postmortem data (Ciccarelli et al., 2003). These
DTI-derived metrics were used to quantify specific WM pathways, such as the
corticospinal tract (Lindenberg et al., 2010), arcuate fasciculus (Matsumoto et al., 2008,
Schlaug et al., 2009), CC, and cingulum (Thomas et al., 2005, Correia et al., 2008).
Quantitative changes of these metrics have been linked to cognitive performance (Tate
et al., 2010) and were suggested to provide structural markers of motor dysfunction
(Hosomi et al., 2009) and plasticity (Ramu et al., 2008a, Schlaug et al., 2009). For
example, Schlaug and colleagues (Schlaug et al., 2009) reported significant increase in
the number of streamlines and tract volume of the arcuate fasciculus in patients with
non-fluent aphasia who undergone intonation-based speech therapy. Another example
is increased number of streamlines of internal capsule and cerebral peduncles six
weeks following the induction of spinal cord injury in rats (Ramu et al., 2008b).

Investigating Regional Macro- & Microstructural Plasticity of The CC in Musicians
186
To date, most previous studies that examined the CC in musicians have used
conventional MR to manually measure cross-sectional area of the CC on midsagittal
images (Schlaug et al., 1995, Ozturk et al., 2002, Lee et al., 2003). Increased size of
the anterior (Schlaug et al., 1995, Lee et al., 2003), and posterior (Ozturk et al., 2002)
CC reported in these studies were hypothesized to indicate more fibers crossing
through, hence a better capacity for inter-hemispheric transfer. However, it is possible
that an increase in callosal size is associated with a decrease in fiber density resulting
from an increased inter-fiber distance (Tomasch, 1954). In human, it has been reported
that the correlation between callosal size and fiber density is partially determined by
fiber size, with good correlation in fibers with a diameter around 0.4 - 1 µm but not for
fibers larger than 3 µm in diameter (Aboitiz et al., 1992). Furthermore, a study
performed in the macaque (Lamantia and Rakic, 1990) reported a significant negative
correlation between fiber density and callosal size. This implies that increased callosal
macrostructure (cross-sectional area) may not indicate a corresponding increase in
microstructural parameters of the CC. Such macro-microstructural discrepancy has
been reported in previous DTI studies. For instance, significant microstructural CC
changes have been reported in the absence of macrostructural ones (Pfefferbaum and
Sullivan, 2002, Westerhausen et al., 2006a). A combined use of structural MR and DTI
techniques was postulated to provide better evidence when studying WM pathways
(Pfefferbaum and Sullivan, 2002, Schulte et al., 2004, Westerhausen et al., 2004,
2006a, Westerhausen et al., 2006b, Hasan et al., 2008a). Expanding these studies, the
present work represents the first report relating macro- and microstructural measures of
the CC to musicianship. To date, DTI examinations of the CC in musicians have
revealed controversial findings. Differences are more likely to be the result of the
musical and experiential histories of participants studied, different scanning parameters,
and diversity in the applied tracking algorithms. Schmithorst and Wilke (Schmithorst and
Wilke, 2002) performed voxel-wise examination in a cohort of five musicians and seven
non-musicians and reported increased FA value in the genu of the CC in musicians.
Another VBM study (Bengtsson et al., 2005) investigated effects of piano practicing in
childhood, adolescence, and adulthood on FA measures of the CC. Authors failed to

Investigating Regional Macro- & Microstructural Plasticity of The CC in Musicians
187
report significant group differences in the CC, although there was a significant
correlation between FA value of the body/splenium of the CC and total hours of piano
practicing in children aged less than 11 years. To the best of my knowledge, only one
study had used DTI-based tractography (probabilistic algorithm) to investigate the effect
of musical training on CC structure. Authors reported no significant group differences in
FA and MD of the anterior and posterior halves of the CC (Imfeld et al., 2009).
In this work, the aim was to examine regional CC macrostructure and microstructure,
the latter of which may be more sensitive to the detection of subtle fiber differences than
gross measurements of size. Accordingly, I used conventional MR to quantify regional
cross-sectional area and DTI-based tractography to quantify average FA, MD,
normalized tract volume, and normalized number of streamlines of four evenly divided
callosal regions corresponding roughly to rostrum, genu, and anterior body (CC1),
anterior midbody (CC2), posterior midbody (CC3), and isthmus and splenium (CC4).
6.2.1 HYPOTHESIS
I hypothesized that my previous findings of increased macrostructure (cross-sectional
areas) of CC1 and CC4 regions in professional musicians (study 2) would be replicated
in the present study. Furthermore, I proposed that increased size of these regions
would be reflected, at the microstructural level, by increased fiber density, axonal
projections, and sprouting (indicated by increased number of streamlines), thicker
myelination and/or larger diameter of fibers (indicated by increased tract volume),
increased coherence and integrity of fiber bundles (indicated by increased average FA
value), and more restrictions to diffusion by the surrounding cellular components, which
may suggest the presence of larger number of axons (more membrane) and/or more
myelin material (indicated by reduced MD value). I hypothesized that these findings
represent training-induced structural plastic changes triggered by the need for stronger
and more effective inter-hemispheric communications in professional musicians.

Investigating Regional Macro- & Microstructural Plasticity of The CC in Musicians
188
6.3 SUBJECTS AND METHODS
6.3.1 SUBJECTS
As described in chapter 3, cohort 3 originally included 26 volunteers recruited after
obtaining Local Research Ethics Committee approval. Two left-handed subjects (1
musician/1 control) were excluded from the present study since several reports have
indicated a significant effect of handedness on callosal macrostructure (Witelson, 1989,
Habib et al., 1991, Witelson and Goldsmith, 1991) and microstructure (Westerhausen et
al., 2003, Westerhausen et al., 2004). The final cohort (cohort 3A) used for subsequent
data analysis included 24 subjects: 12 right-handed musicians (9 males and 3 females),
and 12 right-handed non-musicians (9 males and 3 females). Subjects were matched
for age and gender. All subjects gave signed informed consent and were medically
screened for neurological, cardiovascular, and endocrine disorders. Subjects were also
questioned regarding their alcohol consumption. Handedness was assessed using the
Edinburgh handedness inventory (Oldfield, 1971). During the first test session,
musicians were questioned regarding their musical training history, in addition to
instrumental and performance hours. Controls were also questioned regarding any
musical training and also their interest in music. Descriptive statistics of volunteers’ age
and years of education are presented in table 6.1.
6.3.1.1 MUSICIANS’ PROFILE
Professional musicians were recruited from a full-time playing major British symphony
orchestra (9 subjects), and from the School of Music, University of Liverpool (3
subjects). There were 6 pianists and 6 string players (2 cello players, 3 violin players,
and 1 viola player). Descriptive statistics of age of starting musical training and duration
of musical performance are provided in table 6.1. Only two musicians started their
musical training after the age of 7 years.

Investigating Regional Macro- & Microstructural Plasticity of The CC in Musicians
189
Table 6.1. Demographics of subjects recruited in this study.
*Student t test revealed no significant group difference regarding age (p=0.5) and years
of education (p=0.2).
Groups
Musicians Non-musicians
*Age (years) Mean / SD / range 37 / 15.6 / 18-57 35.5 / 12.7 / 20-57
Duration of musical performance (years) Mean / SD / range 28.3 / 13.05 / 11-48 N/A
Age of starting musical training (years) Mean / SD / range 6.6 / 2.05 / 4-10 N/A
*Education (years) Mean / SD 13.6 / 1.2 13.4 / 2.1

Investigating Regional Macro- & Microstructural Plasticity of The CC in Musicians
190
6.3.2 MR DATA ACQUISITION
All volunteers were scanned using protocols with identical sequences and parameters.
6.3.2.1 HIGH RESOLUTION STRUCTURAL SCANS AT 3 TESLA
T1-weighted MR images were obtained using Trio 3 Tesla (Siemens, Magnetom,
Germany) whole-body imaging system using a proprietary 8-channel head coil. These
scans were used to measure cross-sectional areas of CC regions and ICVs. The
Magnetization-Prepared Rapid Gradient-Echo (MPRAGE) imaging sequence was used
with the following parameters: TR/TE = 2040/5.57 ms, flip angle = 8°, field of view = 256
mm, and acquisition time = 4 minutes, 14 seconds. A total of 176 sagittal slices with
slice thickness of 1 mm, and in-plane resolution of 1 mm were obtained.
6.3.2.2 DIFFUSION-WEIGHTED MR DATA ACQUISITION
DTI data acquisition was acquired with Trio 3 Tesla whole-body MRI system (Siemens,
Magnetom, Germany).The DTI scheme included the collection of 60 images with
noncollinear diffusion gradients (b = 1200 s/mm2), and five non-diffusion-weighted
images (b = 0 s/mm2
), employing a single shot echo-planar imaging sequence. From
each participant, 60 axial slices were collected. TR/TE = 10100/106 ms, field of view =
267 mm, the acquisition matrix was 112 X 128, and the slice thickness was 2 mm with
no gap, which resulted in voxel dimensions of 2 X 2 X 2 mm. The total acquisition time
was 22 minutes and 14 seconds. Prior to diffusion-weighted data acquisition, all
subjects were given detailed explanation about the nature of the acquisition, and were
asked to keep body motion to a minimum. Inside the scanner, motion was controlled
with the use of head cushions provided by the scanner manufacturer.

Investigating Regional Macro- & Microstructural Plasticity of The CC in Musicians
191
6.4 METHODS
Image analysis methods used in this study include:
• Measurement of intracranial volume (ICV) using an automatic technique.
• Measurement of cross-sectional areas of CC regions using a manual
morphometric technique.
• Fiber tractography of CC regions to measure average FA, MD, tract volume,
and number of streamlines of tracts crossing through these regions.
6.4.1 MEASUREMENT OF INTRACRANIAL VOLUME
To control for differences in head size, ICVs were measured. Automatic measurement
of ICV was performed using FreeSurfer software (version: stable v5.0 for Linux),
available online at http://surfer.nmr.mgh.harvard.edu/fswiki/Download. High resolution
T1 weighted MR images obtained using 1.5 Tesla MPRAGE protocol were initially
planned to be used for ICV measurement (a detailed description of this imaging protocol
is provided in chapter 7). The 1.5 Tesla MPRAGE protocol has longer acquisition time =
14 minutes compared to the 3 Tesla MPRAGE protocol and was optimized to obtain
high resolution images ideal for GM/WM segmentation. I followed the recommendation
of previous studies conducted at MARIARC, which revealed more satisfactory GM/WM
segmentation results of the 1.5 T MPRAGE protocol when using FreeSurfer software.
However, I compared ICVs from data obtained at 1.5 Tesla and 3 Tesla and found no
significant results; therefore, statistical analyses were performed using only images
obtained at the 3 Tesla scanner.
6.4.2 MEASUREMENT OF CROSS-SECTIONAL AREA OF CC REGIONS
The method of cross-sectional area measurement of CC regions is described in chapter
3, section 3.10, pages 80-83.

Investigating Regional Macro- & Microstructural Plasticity of The CC in Musicians
192
6.4.3 DTI DATA ANALYSIS
6.4.3.1 PRE-PROCESSING OF DTI DATA
Pre-processing of DTI data was performed as described in chapter 3, section 3.18.1,
page 105.
6.4.3.2 TRACTOGRAPHY PARAMETERS
Tractography parameters are described in chapter 3, section 3.18.2, page 106.
To constrain fiber tracts and to determine regional FA values, the midsagittal FA image
was used. The CC was evenly divided into 4 quadrants along the antero-posterior axis.
The same division scheme was followed in previous DTI studies (
6.4.3.3 FIBER TRACTOGRAPHY OF CC REGIONS
Shimony et al., 2006,
Yu et al., 2007). The 4 quadrants were roughly corresponding to rostrum/genu/anterior
body (CC1), anterior midbody (CC2), posterior midbody (CC3), and isthmus and
splenium (CC4). Each region of the CC was traced by placing a seed region of interest
(ROI) encompassing the corresponding quadrant (figure 6.1). After applying
tractography, the identified fiber bundles were compared for four parameters: average
FA, MD, normalized tract volume, and normalized number of streamlines. The FA
values were calculated by averaging across all voxels in the tract. It should be
emphasized that the reconstructed tracts represent streamlines based on tensor
directions and not the real WM fibers (Matsumoto et al., 2008). Since we are at present
not able to resolve fiber tracts at microscopic levels, DTI-based tractography is the only
technique that allows identification of WM pathways in the living human brain. The
calculated number of fibers represents the number of the reconstructed streamlines and
the calculated tract volume represents the number of voxels that these streamlines
traverse multiplied by the 2 mm3
Reich et al., 2006
voxel size. Streamlines originating from different brain
regions may converge along their pathway, so that twice the number of streamlines may
not essentially represent twice the volume (number of voxels)( ).

Investigating Regional Macro- & Microstructural Plasticity of The CC in Musicians
193
6.4.4 INTRA- AND INTER-RATER RELIABILITY
6.4.4.1 MEASUREMENT OF CROSS-SECTIONAL AREAS OF CC REGIONS
Intra-rater reliability was analyzed by repeating CC measurements (cross-sectional
areas of CC1-CC4) of all subjects by IA with at least 3 weeks between the two
measurements. For inter-rater reliability, CC measurements were independently
performed by two raters (IA and MA) for all subjects. An intra-class correlation
coefficient (ICC) greater than 0.80 was accepted as evidence of inter- and intra-rater
reliability.
Statistical analyses were performed using SPSS v. 16.0 and statistica program, v. 6.0
(Statsoft Inc., USA). Shapiro-Wilk (S-W) was used to test normality of data distribution.
The values of the number of streamlines and tract volumes are likely to be affected by
head size. Increased head size may result in increased number of streamlines and tract
volume. I therefore followed the recommendations of previous studies (
6.4.4.2 FIBER TRACTOGRAPHY OF THE CC
All ROIs were placed by a single rater, IA who was blind to the identity, laterality, and
grouping of subjects. Intra-rater study was performed by repeating DTI measurements
by the same rater in all subjects at least three weeks after the first measurements. For
inter-rater reliability, DTI measurements were independently performed by two raters (IA
and MA) for all subjects. An ICC coefficient greater than 0.80 was accepted as evidence
of inter- and intra-rater reliability.
6.4.5 STATISTICAL ANALYSIS
Ciccarelli et al.,
2003, Correia et al., 2008, Tate et al., 2010) for normalization of tractography-derived
metrics (tract volume and number of streamlines). I calculated the relative values of
these metrics normalized by the ICV following the formula provided by (Correia et al.,
2008). These metrics were divided by (V / V-), where V is the ICV of the subject and V-
is the average ICV for the entire group (musicians and non-musicians). Cross-sectional
area measurements of CC1-CC4 regions were also normalized by dividing the square
root of each area by the cube root of the ICV (Smith, 2005, Phillips et al., 2007).

Investigating Regional Macro- & Microstructural Plasticity of The CC in Musicians
194
Using SPSS, multivariate analysis of variance (MANOVA) was performed with
musicianship (musicians versus non-musicians) and gender (males versus females) as
between subjects factors and CC1-CC4 measures: average FA, MD, normalized tract
volume (NV), normalized number of streamlines (NS), and normalized cross-sectional
areas (NA) as within subjects factors covarying for age; p<0.05 was considered
significant after adjustment for multiple comparisons. Pearson’s correlation was used to
perform correlation analyses. Independent student t test was used to compare ICV
measurements between groups. The ICC calculated by one-way random model was
used to test the intra- and inter-rater reliability. A coefficient greater than 0.80 was
accepted as evidence of inter- and intra-rater reliability. Microsoft Office Excel, 2007
software was used for creating figure 6.2.

Investigating Regional Macro- & Microstructural Plasticity of The CC in Musicians
195
Fig.6.1. Regional tractography of the CC. Top, midsagittal FA map showing
subdivisions of CC into regions; CC1 (yellow), CC2 (green), CC3 (red), and CC4 (blue).
Middle, fiber tracking of CC1-CC4 regions depicted in colours (yellow, green, red and
blue, respectively). Bottom, superior view of the reconstructed CC streamlines.

Investigating Regional Macro- & Microstructural Plasticity of The CC in Musicians
196
6.5 RESULTS
6.5.1 MEASUREMENT OF INTRACRANIAL VOLUME
Student t test revealed no significant difference in ICV between musicians and non-
musicians (p=0.15).
6.5.2 FIBER TRACTOGRAPHY OF THE CC
Reconstruction of CC was feasible in all subjects (figures 6.3 and 6.4), in a manner
consistent with the description of published DTI atlases (Jellison et al., 2004, Wakana et
al., 2004, Salamon et al., 2007), which indicates the reliability of the applied tracking
method.
6.5.3 COMPARISON OF REGIONAL MACRO- AND MICROSTRUCTURAL MEASURES
OF THE CC
Compared to controls, professional musicians possessed greater average FA value
(F=14.08, p=0.001), normalized tract volume (F=10.7, p=0.003), normalized number of
streamlines (F= 12.5, p=0.002), and normalized cross-sectional area (F=12.7, p=0.001)
in CC4 region. In addition, musicians showed lower MD values in CC4 region compared
to controls (p=0.02). There was no significant group difference in any measure of CC1-
CC3 regions, no significant effect of gender, and no significant gender by musicianship
interaction. Means and standard deviations of macrostructural and microstructural CC
measures are presented in table 6.2.
A correlation analysis was then performed between duration of musical
performance/age of commencing musical training and CC4 metrics (cross-sectional
area, average FA, MD, tract volume, and number of streamlines) after controlling for
age. There was a significant negative correlation between age of commencing musical
training and cross-sectional area of CC4 region (r = - 0.7, p=0.011) (figure 6.2). There
was no significant correlation between age of commencing musical training and other
CC4 measures (average FA, MD, tract volume, and number of streamlines). There was
no significant correlation between duration of musical training and any of CC4
measures.

Investigating Regional Macro- & Microstructural Plasticity of The CC in Musicians
197
6.5.4 INTRA- AND INTER-RATER STUDY
A good agreement was revealed for cross-sectional area measurements with a range of
0.92-0.98 for intra-rater study and 0.90-0.96 for inter-rater study. For CC tractography,
results showed good agreement with ICC ranging between 0.84-0.90 for intra-rater
study and 0.82-0.88 for inter-rater study.
6.5.5 CORRELATION BETWEEN MACROSTRUCTURE (CROSS-SECTIONAL AREA)
AND MICROSTRUCTURE (AVERAGE FA) ACROSS SUBJECTS
Correlation analyses were next performed between absolute measurements of cross-
sectional areas of CC1-CC4 regions (uncorrected for ICV) and average FA values of
CC1-CC4 tracts. There was a significant positive correlation between average FA and
absolute cross-sectional area of CC4 region (r= 0.5, p=0.004) in all subjects (musicians
and non-musicians). There were no significant correlations in CC1-CC3 regions.

Investigating Regional Macro- & Microstructural Plasticity of The CC in Musicians
198
Table 6.2. Means ± standard deviations of cross-sectional areas and tractography-
derived metrics. Volumes are mm3, areas are mm2, and MD unit is mm2 s−1 X 10⁻³
*Significant at p<0.05
.
Measurement CC1 CC2 CC3 CC4 Cross-sectional area Musicians Controls
214±35
197±14.9
118±21
110±21
102±23
111±27
304±60
231±51
Normalized cross-sectional area Musicians Controls
0.12±0.01
0.12±0.008
0.09±0.008
0.09±0.01
0.08±0.01
0.08±0.01
*0.15±0.01
0.12±0.02
Average FA Musicians Controls
0.55±0.06
0.59±0.06
0.44±0.03
0.50±0.04
0.46±0.04
0.40±0.05
*0.60±0.06
0.52±0.07
MD Musicians Controls
0.83±0.02
0.84±0.02
0.87±0.02
0.88±0.02
0.89±0.01
0.86±0.02
*0.73±0.01
0.80±0.02
Tract volume Musicians Controls
111190±47322
94906±25526
70654±25656
65210±4906
155818±21842
54850±2166
197348±55000
141275±30350
Normalized tract volume Musicians Controls
112130.8±50193
96097±27707
72058.1±29941
65449±4869
164027±23852
55031±2062
*912643±137827
772927±82888
Number of streamlines Musicians Controls
2713.3±1336
2059±538
1006.6±339
1059±403
1073.5±249
1064±256
3760.3±873
2778±922
Normalized number of streamlines Musicians Controls
2766±501
2087±402
1021±368
1074±429
1093±305
1070±256
*3826±605
2433±506

Investigating Regional Macro- & Microstructural Plasticity of The CC in Musicians
199
Fig.6.2. A graph showing correlation between age of starting musical training and
cross-sectional area of CC4 region, areas are mm2
r = - 0.63
.
r = - 0.7, p= 0.01

Investigating Regional Macro- & Microstructural Plasticity of The CC in Musicians
200
Fig.6.3. Illustration of regional CC tractography in 6 subjects.

Investigating Regional Macro- & Microstructural Plasticity of The CC in Musicians
201
Fig.6.4. illustration of regional CC tractography in a non-musician, A and a musician, B.
A
B

Investigating Regional Macro- & Microstructural Plasticity of The CC in Musicians
202
6.6 DISCUSSION
6.6.1 MUSICIANS SHOWED EVIDENCE OF MACRO- AND MICROSTRUCTURAL
PLASTICITY IN CC4 REGION
The present study was sought to extend previous CC studies in musicians through
examining the macro- and microstructure of the CC. The combined use of structural MR
and DTI techniques could provide a complementary approach to study the CC structure.
Such approach has been used in several previous studies (Pfefferbaum and Sullivan,
2002, Schulte et al., 2004, Westerhausen et al., 2004, 2006a, Westerhausen et al.,
2006b, Hasan et al., 2008a, Hasan et al., 2008b). Musicians revealed macrostructural
changes (greater cross-sectional area) and microstructural changes (greater average
FA, tract volume, number of streamlines, and lower MD) in CC4 region. There was a
negative correlation between age of commencing musical tuition and cross-sectional
area of CC4 region. This means that the earliest the musician commenced training the
larger would be the size of CC4 region. These findings are in agreement with other
reports (Schlaug et al., 1995, Bengtsson et al., 2005), which suggested greater
malleability of CC structure in subjects who commenced musical training early in life.
The increased cross-sectional area of CC4 region corroborates my previous findings in
professional musicians in study 2 (chapter 5).
Regarding the CC microstructure, FA has become by far the most widely used measure
of anisotropy in the DTI literature. It was proposed that FA could provide information
about WM microstructure, such as intra-axonal organization (Kinoshita et al., 1999),
fiber density, degree of myelination, neuroglial cell packing, individual fiber diameter,
and immunohistochemical properties (Mori and Zhang, 2006, Sun et al., 2006, Trivedi et
al., 2009), for review of literature see (Beaulieu, 2002). The FA is often considered an
indicator of WM integrity (Alexander et al., 2007b), because of its increase during WM
maturation (Eluvathingal et al., 2007), decrease during normal aging (Barrick et al.,
2010), and in patients with neurodegenerative (Sundgren et al., 2004) and
demyelinating (Filippi et al., 2001) disorders. Furthermore, the FA value reflects the
directionality and coherence of fiber tracts (Basser and Pierpaoli, 1996). Since diffusion

Investigating Regional Macro- & Microstructural Plasticity of The CC in Musicians
203
is mainly restricted by membranes and myelin sheaths that are oriented parallel to the
long axis of the axons, the molecular displacement is stronger parallel to than
perpendicular to the axon orientation. If the axons within a voxel are highly aligned, the
diffusion in this voxel is directional (anisotropic). Thus, higher FA in CC4 region in
musicians would reflect more parallel alignment of callosal axons in this region.
However, measurement of FA may not be enough to characterize tissue changes. For
example, an increase in FA values may result from decreased radial (perpendicular)
diffusivity, increased axial (parallel) diffusivity, or both. Measurements of the MD may
thus help to better understand how the diffusion tensor is changing. Results of the
present study showed that musicians had lower MD values in CC4 region compared to
non-musicians. A lower MD value reflects stronger attenuation of diffusion by the
surrounding cellular components, particularly the axonal membranes and myelin
sheaths (Beaulieu, 2002, Iacconi et al., 2010), which may thus indicate larger number of
axons (more membrane) and/or thicker myelination (more myelin material) in musicians.
The latter assumption may be supported by my findings of increased tract volume and
number of streamlines in CC4 region. Taken together, higher FA and lower MD values
in CC4 region in musicians could reflect increased WM coherence, fiber density, and
thicker myelination in this region.
My results also showed that musicians had greater tract volume and number of
streamlines in CC4 region. These data may provide complementary evidence to FA and
MD measures. Before discussing the implications and interpretation of these findings, it
is important to note that the reconstructed tracts do not represent actual callosal fibers,
but rather streamlines based on mathematically derived tensor directions (Matsumoto et
al., 2008). I investigated CC subregions by assessing tract volume and number of the
reconstructed streamlines, which could quantify the microscopic architecture of the WM
(Mori and Zhang, 2006). A similar approach has been used in previous studies
(Nucifora et al., 2005, Thomas et al., 2005, Vernooij et al., 2007, Matsumoto et al.,
2008, Schlaug et al., 2009, Liu et al., 2010a). These parameters might provide a
different perspective for structural plasticity of CC in musicians, which was not provided
by previous neuroimaging studies. A number of factors might contribute to the observed

Investigating Regional Macro- & Microstructural Plasticity of The CC in Musicians
204
changes in tract volumes and number of streamlines in the present study, including
increased myelination, increased axonal projections and collaterals, and increased fiber
density due to new sprouting. It is possible that remodeling of trans-splenial fibers was
triggered by the need for stronger and more effective inter-hemispheric
communications. However, I could only provide hypotheses at this stage, and more
studies are needed in the future to understand the exact correlation between
tractography-derived quantitative metrics and microscopic anatomy of the nervous
tissue.
The isthmus and splenium (CC4) contain fibers from parietal, temporal, and occipital
regions (Hofer and Frahm, 2006, Park et al., 2008). Most of the fibers traversing these
regions connect somatosensory, superior parietal, auditory, and visual cortices. The
isthmus part of the CC (the smallest part of CC4 region) contains fibers from the
primary somatosensory cortex. Compared to non-musicians, musicians have greater
sensory load imposed by their complex skilful performance. In accord, previous studies
have shown evidence of use-dependent structural-functional adaptation in the primary
somatosensory cortex in professional musicians, such as increased GM density in the
left primary somatosensory cortex in right-handed pianists and increased cortical
representation of the digits (second to fifth) of the left hand in string players. These
findings are compatible with increased size of the isthmus reported here. The splenium
(the largest part of CC4 region) contains fibers from auditory and parietal cortical
regions. Musicians have well established evidence of structural-functional plasticity in
the auditory domain; examples include increased size and GM density of the Heschl
gyrus (Schneider et al., 2002, Bermudez et al., 2009), increased cortical thickness of
the right and left planum temporale (Bermudez et al., 2009), increased auditory cortical
representation of piano tones (Pantev et al., 1998), increased multimodal auditory-
somatosensory (Schulz et al., 2003) and auditory-motor integration (Bangert and
Altenmuller, 2003, Lotze et al., 2003, Bangert et al., 2006, Baumann et al., 2007), and
enhanced timbre specificity (McAdams et al., 1995, Shahin et al., 2008). Furthermore,
previous callosal studies have assigned a substantial role for the splenium in relaying
visuospatial cognitive information (Schmitt et al., 2001, Tomaiuolo et al., 2002,

Investigating Regional Macro- & Microstructural Plasticity of The CC in Musicians
205
Pollmann et al., 2004, Fryer et al., 2008). Also, microstructural measures of the
splenium, such as FA and relative anisotropy (RA) were found to be related to reading
skills and phonological awareness (Frye et al., 2008). Musicians are well-known for their
enhanced visuospatial performance (Sergent et al., 1992, Sluming et al., 2002, Sluming
et al., 2007). When practicing music, they need to read musical notations and translate
them into movement patterns, a process known as sight reading (Sergent et al., 1992).
Music reading can thus be considered as a visuospatial cognitive task in which vertically
oriented stimuli are mapped onto the fingers, which strike horizontally oriented keyboard
elements as in pianists (Stewart et al., 2003). This visuospatial ability is essential to all
musicians irrespective of instrument specialty, hence of relevance to the multi-
instrumental cohort examined in the present study. Furthermore, FA value of the
splenium was shown to be directly related to the speed of bimanual coordination
(Muetzel et al., 2008) and enhanced attention to visual stimuli (Madden et al., 2004). It
could thus be hypothesized that increased macrostructure and microstructure of the
CC4 region in musicians represent structural adaptation imposed by intensive
multimodal skill acquisition. I propose that these plastic changes would support
functions crucial for musical performance, such as auditory processing, visuospatial
cognition, and bimanual coordination. For the CC1-CC3 regions, no significant group
differences were detected, which might indicate that these regions are also implicated in
a number of non-musical tasks that were practiced by control subjects (Bengtsson et
al., 2005).
In contrast to findings of the present study, Imfled and colleagues (Imfeld et al., 2009)
investigated microstructural plasticity in the CC using probabilistic tractography and
reported no significant group differences in FA and MD values of the anterior and
posterior halves of the CC. The discrepancy in obtained results could be attributed to
differences in musical and experiential histories of participants studied, different
scanning parameters, and different tracking algorithms (deterministic versus
probabilistic). In contrast to the study of Imfeld and colleagues (Imfeld et al., 2009)
which divided the CC into 2 halves, tractography was performed in the present study

Investigating Regional Macro- & Microstructural Plasticity of The CC in Musicians
206
after dividing the CC into 4 regions, which might provide a more sensitive way for
detecting regional callosal differences between groups.
The DTI results reproduce findings from other studies (Pfefferbaum et al., 2000,
Sullivan et al., 2001, Chepuri et al., 2002, Westerhausen et al., 2004, Hasan et al.,
2008b, Barrick et al., 2010, Liu et al., 2010a), which reported that diffusion anisotropy is
higher in the posterior than anterior CC regions. Possible explanations for these
findings include higher proportion of myelin material per voxel (Lamantia and Rakic,
1990), thicker myelin sheaths (Miller et al., 1999), and greater coherence of posterior
CC fibers (Pfefferbaum et al., 2000).
The fact that gross measures of the CC may not reflect fiber density (Lamantia and
Rakic, 1990) highlights the significance of combining macro- and microstructural
measures of the CC. In the present study, the increased size of CC4 region in
musicians was associated with increased FA, tract volume, number of streamlines, and
reduced MD in the same region. This macro-/microstructural correlation in CC4 region
may add further support to the assumption that larger CC4 size reported in the present
study, and in study 2, represent structural plasticity induced by musical practice and not
the result of increased inter-fiber distance (Tomasch, 1954). Postmortem histological
studies have reported that the relation between total fiber number and CC size is
dependent on regional distribution of small axons (0.4-1 µm in diameter) (Aboitiz et al.,
1992, Highley et al., 1999). These small axons are most abundant in the splenium
(Aboitiz et al., 1992), which may support the finding of significant macro-/microstructural
correlation within this callosal region. Such correlation between CC size and anisotropy
has been shown in previous studies (Alexander et al., 2007a, Hasan et al., 2008a,
Rotarska-Jagiela et al., 2008). However, other studies reported contradicting results.
For instance, a negative correlation was reported between relative anisotropy and
posterior CC size in right-handed subjects (Westerhausen et al., 2004) and significant
microstructural findings were reported in the absence of macrostructural ones
(Pfefferbaum and Sullivan, 2002, Westerhausen et al., 2006a). It was postulated that
FA can be used to visualize and quantitatively characterize WM development even
before the onset of myelination, which was attributed to several mechanisms, such as

Investigating Regional Macro- & Microstructural Plasticity of The CC in Musicians
207
ion fluxes across the axolemma (Wimberger et al., 1995, Prayer et al., 2001) and
proliferation of immature oligodendrocytes (Drobyshevsky et al., 2005). It is thus
possible that microstructural changes may exist long before being apparent at the
macroanatomical level thereby causing macro/microstructural discrepancy.
6.6.2 LACK OF SIGNIFICANT GENDER EFFECT ON MACRO- AND MICROSTRUCTURE
OF THE CC
In the present study, there was no gender effect on CC structure and no gender by
musicianship interaction. These results contrast those of (Lee et al., 2003) who reported
significant gender by musicianship effect as only male musicians showed increased CC
size. Failure to achieve similar results might in part be related to the small number of
female subjects recruited. Gender might be one of the most extensively studied factors
in relation to callosal morphology. Postmortem examination of the cross-sectional area
of the CC in 161 brains revealed greater absolute CC size in males (Matano and
Nakano, 1998); however, when corrected for midsagittal brain area, there was no
gender difference. Other groups reported larger total CC size and larger splenium size
in females (Holloway and de Lacoste, 1986). Also, comparison of fiber composition of 9
callosal regions between 10 males and 10 females revealed no significant gender
difference (Aboitiz et al., 1992). Conventional MR studies revealed similar conflicting
results. Pozzilli and colleagues (Pozzilli et al., 1994) examined 130 subjects and
reported no gender effect on CC size, while others reported increased relative CC size
in females (Mitchell et al., 2003). With the development of DTI, many studies have
examined the effect of gender on CC microstructure. Some authors reported that males
had greater FA values (Menzler et al., 2011), while others failed to observe gender
differences (Sullivan et al., 2001). Different methods of examination (postmortem,
conventional MRI, or DTI), diverse image acquisition and processing techniques could
account for variable results across studies.
6.6.3 TECHNICAL LIMITATIONS OF THE PRESENT STUDY
DTI-based tractography offers promising perspective to examine WM tracts in vivo.
Previous studies have indicated that this technique frequently generates results that are

Investigating Regional Macro- & Microstructural Plasticity of The CC in Musicians
208
plausible and apparently accurate (Jellison et al., 2004, Wakana et al., 2004, Catani et
al., 2005). On the other hand, this technique suffers from several types of limitations.
First, DTI scans are usually acquired with lower resolution than conventional MR scans,
which may lead to substantial partial volume effects, such as errors related to
cerebrospinal fluid contamination and averaging of fibers with different orientations
within a voxel (Jones and Cercignani, 2010). Second, there are limitations related to
reduced ability to track through zones of low signal to noise ratio (SNR), low anisotropy
(especially below the stopping threshold), and crossing fibers (Pierpaoli et al., 2001,
Alexander et al., 2007b). Third, tracking limitations related to eddy current distortions,
subject motion, and magnetic susceptibility (Jones and Cercignani, 2010). Fourth, there
are errors related to inaccurate determination of the principal eigenvector orientation
(Jones, 2003) and difficulty in following tract bifurcations (Mori and van Zijl, 2002). Fifth,
histological studies that can determine the exact correlation between DTI-derived
metrics and histological parameters of the human WM are still limited (Concha et al.,
2010). Finally, techniques for validating tractography algorithms are still in their infancy
and difficult to apply (Behrens et al., 2003). Thus, DTI-based tractography may be
reasonably regarded as a technique with a finite rate of false-negative and false-positive
outcomes. Below, methodological limitations relevant to the present study are
addressed.
A primary limitation of the currently used tractography algorithm arises from partial
volume averaging of complex fiber architecture (such as crossing fibers) into single
voxels (
6.6.3.1 ISSUE OF CROSSING FIBERS
Tuch et al., 2002). Since the voxel size in the present study was 2 X 2 X 2 mm,
some WM voxels can easily contain multiple fiber populations with different orientations.
The assumption that the largest diffusion axis corresponds to the fiber orientation is not
true if there are two or more fiber populations (Mori and van Zijl, 2002). Thus,
algorithms based upon the principal eigenvector, such as that used in the current study,
are unable to resolve regions of crossing WM pathways. Such fiber crossing problem
may result in failure to detect the primary diffusion direction and lead to increased

Investigating Regional Macro- & Microstructural Plasticity of The CC in Musicians
209
uncertainty in fiber tracking. The presence of crossing fiber bundles can average out the
diffusion anisotropy to such a degree that it may seem isotropic (Mori et al., 2002,
Bammer et al., 2003, Mori and Zhang, 2006). The immediate consequence for fiber
tracking in this case is either a false-positive directional selection for a continuation of
the tracking algorithm or a complete termination of fiber tracking by reaching the lower
anisotropy threshold. When performing tractography of the CC, tracking of fibers
directed toward the lateral and inferior side of the brain has limited reliability because of
such fiber crossing problem (Hofer and Frahm, 2006, Park et al., 2008). For example, in
the lateral side of the brain, the CC is susceptible to the crossing fiber problem at the
centrum semiovale (Okada et al., 2006), where a small number of callosal fibers
intersect a large number of corona radiata and corticospinal fibers. In the present study,
this was evident in the lack of lateral projections present in the reconstruction of the CC
and in the sparseness of fibers in certain regions (e.g. the superior parietal region, see
figure 6.1). Tractography results of the present study were therefore more reliable in the
medial projections of the CC. Likewise, tracking of callosal fibers that connect temporal
lobes (running inferolaterally) had limited reliability as these fibers cross various
directional tracts, such as the internal capsule and inferior longitudinal fascicles (Park et
al., 2008, Chao et al., 2009). Barrick and colleagues (Barrick and Clark, 2004)
developed an automated procedure to detect points (singularities), such as that occur
where there is fiber crossing, in the diffusion tensor field that can adversely affect the
direction of maximum diffusion thereby leading to errors in fiber tracking. Authors
demonstrated that such fiber crossing singularities could erroneously lead to termination
of fibers running from the CC to the lateral frontal lobe. Several diffusion imaging
methods have been developed to address the problem of crossing WM regions, such as
diffusion spectrum imaging (Wedeen et al., 2005), q ball imaging (Tuch et al., 2003),
high angular diffusion imaging (Frank, 2002), and combined hindered and restricted
diffusion (Assaf and Basser, 2005). These methods call for higher diffusion-weighting
(typically 3,000–15,000 s/mm2 Alexander et al.,
2007b
) and take much more time to acquire (
). Furthermore, the use of tractography algorithms to deal with the problem of
crossing fibers is not simple due to noise propagation into the diffusion profiles and the

Investigating Regional Macro- & Microstructural Plasticity of The CC in Musicians
210
possibility of revealing false-positive crossings (Barrick et al., 2007). The relatively long
acquisition time of these algorithms, as well as the increased complexity of data
analysis may limit their extensive use in research. Despite the above-mentioned
crossing fiber problem, DTI-based tractography algorithms were shown to accurately
reconstruct the CC without using methodology to resolve fiber crossing (e.g. (Shimony
et al., 2006, Yu et al., 2007)).
Diffusion-weighted images are proposed to detect the microscopic diffusion of water,
which is about 5–10 mm during the measurement time, but they are also susceptible to
macroscopic movements, such as bulk subject motion, eye movements, cardiac
pulsation, and pulsation of the cerebrospinal fluid (
6.6.3.2 SENSITIVITY TO SUBJECT MOTION
Basser and Jones, 2002). Subject
motion during the DTI acquisition can induce additional dephasing of the magnetization
thereby increasing diffusion-weighted signal attenuation. This leads to overestimation of
the ADC and introduces bias to anisotropy measures (Mukherjee et al., 2008). The bias
produced by subject motion fluctuates according to the orientation of fibers. The effect
of subject motion will be less marked if the fiber orientation aligns with the axis of
rotation. For instance, if a subject flexes his/her head (i.e. moves his/her head towards
the chest), the axis of rotation will be along the left-right direction. In this case,
horizontally oriented midline CC fibers will be least affected, while corticospinal fibers
oriented perpendicular to the axis of rotation will be mostly biased (Jones and
Cercignani, 2010).
Although the diffusion-weighted sequence used in the present study was relatively long
(22 minutes), the datasets had qualitatively minimal motion artifacts. Prior to DTI
examination, all subjects were given detailed explanation about the nature of the DTI
scan and were asked to keep body motion to a minimum. Inside the scanner, motion
was controlled with the use of head cushions provided by the scanner manufacturer.
During the scan session, subjects received repeated reminders to remain motionless as
much as they can. I found that these methods worked well for most cases. Acquired
images were then corrected for motion artifacts using 12-parameter affine registration to

Investigating Regional Macro- & Microstructural Plasticity of The CC in Musicians
211
the b = 0 image (Smith, 2002, Reese et al., 2003). Post-corrected images were visually
inspected to verify the reliability of correction procedure and to screen for excessive
motion artifacts. In two subjects, motion artifacts were sufficiently high, so subjects were
asked to repeat the diffusion-weighted acquisition.
Unfortunately, diffusion-weighted imaging is particularly susceptible to the effect of
noise and poor SNR values, which can adversely affect quantitation of DTI parameters.
The effect of noise on DTI was originally described by (
6.6.3.3 EFFECT OF NOISE AND LOW SIGNAL-TO-NOISE RATIO ON DTI
Pierpaoli and Basser, 1996).
The presence of noise in the diffusion-weighted signals can produce significant bias in
anisotropy measurements through making isotropic media appear anisotropic. The
noisier the signals, the greater the inconsistency in eigenvalue measurements.
However, noise effect is less distinct in regions with high anisotropy (Jones and
Cercignani, 2010). It was suggested that the SNR of the non-diffusion-weighted images
of a DTI acquisition should be at least 20 to obtain reliable anisotropy measures
(Mukherjee et al., 2008). In the case of low SNR, weak diffusion-weighted signals that
approach the background noise level tend to be overestimated by noise, which in turn
results in the underestimation of diffusivity (Dietrich et al., 2001). In anisotropic
structures, this effect is orientationally dependent. Since the diffusivity is greater along
some orientations than others, the underestimation of diffusivity will appear along
certain number of axes leading to a negative bias in anisotropy (Jones and Basser,
2004). Furthermore, at low SNR, coregistration of diffusion-weighted images to the b =
0 image to correct for subject motion and eddy current distortions is challenging
(Mukherjee et al., 2008). The noise effect can be ameliorated by using techniques that
average tensor information among adjacent voxels, although such approach results in
the reduction of effective resolution (Mori et al., 2002).
In DTI-based tractography, noise can have a deleterious effect on the accuracy of fiber
tracking as the calculated vector direction may diverge from the actual fiber orientation
(Mori et al., 2002). In other words, the presence of noise can lead to uncertainty
associated with every estimate of fiber orientation (Jones, 2003). These uncertainties

Investigating Regional Macro- & Microstructural Plasticity of The CC in Musicians
212
tend to accumulate along the length of the trajectory path resulting in erroneous tracking
results: trajectories might execute false paths leading to identification of spurious tracts
with no actual anatomic existence (Yamada et al., 2008), and may even terminate
erroneously (Liu et al., 2010b). The degree of these errors was shown to depend on the
shape of the trajectory, resolution, and anisotropy (Basser et al., 2000). Several
techniques were proposed to graphically depict the uncertainty in the orientation of the
diffusion tensor field (Behrens et al., 2003, Jones, 2003, Jeong and Anderson, 2008).
Although these tools are useful in checking the reliability of fiber tracking results, their
complex nature is currently limiting their use.
A common consensus in DTI studies is that acquiring large number of diffusion-
encoding directions would reduce the orientational dependence and increase the
accuracy and precision of DTI measures (Mukherjee et al., 2008). At least 30 directions
were shown to be necessary for accurate estimation of the principal eigenvector and
MD (Jones, 2004). Since the diffusion-weighted acquisition used in this study involved
acquiring 60 diffusion-encoding directions, a robust estimation of the diffusion tensor is
expected. Taken together, the above evidence indicates that it is critical to acquire DTI
data with adequate SNR. Although computation of SNR was not performed, the present
study benefited from two factors known to improve SNR namely, long scan time and
high field strength (3 Tesla) (Murphy et al., 2007, Tijssen et al., 2009). Tractography
results were consistent with previously published DTI atlases (Jellison et al., 2004) and
were faithful to the classical anatomical description (Williams et al., 1995, Snell, 2001,
Kiernan, 2005).
The presence of multiple tissue components (e.g. tissue, air, and bone), which have
different magnetic susceptibility, can produce local alterations in the magnetic field B
6.6.3.4 ISSUE OF MAGNETIC SUSCEPTIBILITY EFFECTS
0
Basser and Jones, 2002
leading to large discontinuities in bulk magnetic susceptibility at tissue-air interfaces. In
the brain, magnetic susceptibility artifacts are particularly common in regions adjacent
to the paranasal air sinuses, such as the temporal lobes ( ). This
discontinuity in susceptibility results in two adverse effects in diffusion-weighted

Investigating Regional Macro- & Microstructural Plasticity of The CC in Musicians
213
imaging: first, the additional local gradients operate like diffusion gradients inducing
spatial variations in the b-matrix (Basser and Jones, 2002); second, it produces
geometric distortions in the acquired images (Jones and Cercignani, 2010).
Theoretically, images of the present study were vulnerable to magnetic field
inhomogeneities, which are known to be proportional to the magnetic field strength (3
Tesla). Therefore, all acquired images were visually inspected for magnetic
susceptibility effects prior to inclusion in the group analysis. Future studies could benefit
from the use of strategies proposed to correct magnetic susceptibility artifacts, such as
measuring the B0
Jezzard and Balaban, 1995
field and implementing a retrospective correction scheme to the
distorted data ( , Reber et al., 1998).
6.6.3.5 ISSUE OF EDDY CURRENTS
Diffusion-weighted image acquisitions using single shot echo-planar imaging sequence
are susceptible to distortions caused by eddy currents. Eddy currents are
electric
currents induced in the electrically conductive structures of the MRI scanner by rapid
switching of the large diffusion sensitization gradients. These eddy currents generate
unwanted, rapidly and slowly decaying local magnetic fields (Basser and Jones, 2002,
Embleton et al., 2010). Eddy current-induced distortions vary with the strength and
direction of the diffusion encoding gradients. Two adverse effects result from these
currents: first, the field gradient at the sample diverges from the prescribed field
gradient, which leads to discrepancy between the actual and prescribed b-matrix;
second, the resulted diffusion-weighted images will suffer from geometric distortions.
Uncorrected eddy current distortions can thus lead to erroneous fiber-tracking results
(Basser and Jones, 2002). In the present study, eddy currents were anticipated owing
to the long scan time and were thus corrected using 12-parameter affine registration to
the b = 0 image (Smith, 2002, Reese et al., 2003). Post-corrected images were
inspected to verify the reliability of correction procedure. In effect, tractography results
obtained in this study were faithful to the classical descriptions of neuroanatomy that
have previously been documented (e.g. (Hofer and Frahm, 2006)).

Investigating Regional Macro- & Microstructural Plasticity of The CC in Musicians
214
Several techniques were proposed to perform quantitative analysis of DTI data,
including manual ROI-based analysis, voxel-based analysis, and tract-based spatial
statistics. However, there is no consensus on the ideal way to perform DTI data
analysis. The ROI-based analysis technique applied in the present study has been
widely used in the DTI literature. However, this technique has intra-rater and inter-rater
variability and is time consuming. A further limitation of this technique is the possibility
of errors related to including other fiber tracts, or even GM and cerebrospinal fluid,
along with WM structures of interest (
6.6.3.6 ANALYSIS OF DTI DATA
Snook et al., 2007). In ROI-based analysis, the
anatomical level at which seed points are applied could significantly influence tracking
results (Hattingen et al., 2009). If the orientation of a section is slightly oblique, then
seed points would be placed at a different anatomical level even if the ROI is chosen
carefully. In this case, the seed points are probably placed in a subvoxel coordinate
leading to imprecise tracking results.
Regarding CC tractography, unreliable results could be produced when ROIs are
placed on a plane other than the midsagittal one. To avoid this bias in the present
study, ROIs were placed on midsagittal slices, which were carefully identified according
to specific anatomical landmarks (Ozturk et al., 2002), and consistently applied across
all subjects. However, there was difficulty in outlining the boundaries of the CC due to
limited resolution of the diffusion-weighted data, particularly in the body of the CC. In
addition, as there was no line of separation between the ventral border of the CC and
the fornix, it was not possible to separate these structures. In all these cases, the
resulted callosal tracts were checked for stray streamlines and those related to other
tracts. In such conditions, manual editing to trim away the portions of streamlines that
stray from the expected route was performed using the cropping box tool of MedINRIA
software. While I acknowledge that the above-mentioned limitations have affected the
results, it should be noted that they do so equally in both musicians and non-musicians
groups. Since the same fiber tracking parameters (such as placement of ROI, FA
threshold, minimum fiber length, and smoothness factor) were used for all subjects,

Investigating Regional Macro- & Microstructural Plasticity of The CC in Musicians
215
inter-group comparison was still possible and results of intra-and inter-rater reliability
were acceptable.
Some authors used VBM technique to obtain quantitative DTI metrics, which has the
advantage of being observer independent and can be applied to study the whole brain
(Han et al., 2009). However, VBM also has some inherent shortcomings because of the
requirements for spatial normalization and smoothing (Ashburner and Friston, 2000).
Inter-individual differences in brain size and shape and in WM anatomy may limit
adequate coregistration of DTI data across subjects. The tract-based spatial statistics
(TBSS) technique is another automated method that can be used to detect group-wise
changes in FA concurrently throughout the WM regions of the brain (Smith et al., 2006).
This technique has been widely used due to its availability and ease of use, however,
the TBSS method also requires accurate registration of subjects’ data.
A considerable care should be taken when interpreting quantitative DTI data. First,
since microscopic axonal information of several compartments is averaged within a
voxel, it should be emphasized that DTI cannot provide direct information on axonal
connectivity at cellular level (
6.6.3.7 INTERPRETATION OF TRACTOGRAPHY RESULTS
Bammer et al., 2003). Second, the exact significance of
DTI-derived metrics, such as FA, MD, tract volume, and number of streamlines
measures has not yet been resolved. For instance, the calculated number of the
reconstructed streamlines does not represent fiber counts (Reich et al., 2006).
Histological studies are thus required to determine the exact correlation between DTI-
derived metrics and histological parameters of the human WM. Such correlation has
mostly been addressed in the postmortem state (Schmierer et al., 2007, Saksena et al.,
2008), which has several shortcomings common to postmortem studies, including
vulnerability of tissues to shrinkage, deformation, and damage during fixation (D'Arceuil
et al., 2007). In addition, these studies were focused on specific tracts (Concha et al.,
2010) and cannot be generalized. Third, there are certain parameters that should be
taken into consideration when performing statistical data analysis in DTI studies. For
example, the body mass index has been shown to correlate with diffusion anisotropy

Investigating Regional Macro- & Microstructural Plasticity of The CC in Musicians
216
measures of the CC (Xu et al., 2011). Since calculating the body mass index requires
measuring subjects’ weight and height, which were not taken in the present study, it
was not possible to determine the potential effect of the body mass index on anisotropy
measures of the CC.
It was challenging to compare my tractography results with those derived from studies
that used different tracking algorithms, such as probabilistic tractography (
6.6.3.8 COMPARISON WITH PREVIOUS STUDIES
Imfeld et al.,
2009), or studies that used automated voxel-based analysis method (Han et al., 2009).
In addition, comparing data obtained at different field strengths is not straightforward.
For instance, it was shown that working at 3 Tesla magnetic field results in enhanced
visualization of a number of WM tracts (Okada et al., 2006) compared to 1.5 Tesla field.
Another important factor that needs to be considered when comparing DTI results
across studies is the type of image analysis software used for fiber tracking. Burgel and
colleagues (Burgel et al., 2009) applied four different software algorithms (three of them
were based on fiber assignment by continuous tracking) on a single data set to depict
the corticospinal tract. The use of different software algorithms resulted in substantial
inconsistency in 3D depiction of the CST. Interestingly, a recent study reported great
discrepancies in tracking results when using different personal computers despite
running the same tracking algorithm and selecting identical tractography parameters
(Chung et al., 2011). Comparison of reported tractography results from studies with
differences in methodology would therefore call for great attention.
In conclusion, the present study was the first to combine conventional MR and DTI to
study macro- and microstructure of the CC in musicians. Results showed evidence of
structural plasticity in the isthmus and splenium in musicians, which was negatively
correlated with age of commencing musical tuition. The combined use of structural MRI
6.6.3.9 VALIDATION OF DTI-BASED TRACTOGRAPHY
This issue is discussed in chapter 3, section 3.17, page 104.
6.7 CONCLUSION

Investigating Regional Macro- & Microstructural Plasticity of The CC in Musicians
217
and DTI techniques is the best approach when examining the CC in musicians. I
hypothesize that the observed structural changes represent training-induced plasticity
essential for enabling high level musical performance. It is possible that increased size,
average FA, tract volume, and number of streamlines in the isthmus and splenium
would support enhanced inter-hemispheric communication between parietal, temporal,
and occipital lobes in musicians.

218
CHAPTER 7 INVESTIGATING STRUCTURAL PLASTICITY OF
CEREBELLAR WHITE MATTER IN MUSICIANS

Investigating Structural Plasticity of Cerebellar White Matter in Musicians
219
PLASTICITY OF THE SUPERIOR AND MIDDLE CEREBELLAR
PEDUNCLES IN MUSICIANS REVEALED BY QUANTITATIVE ANALYSIS
OF VOLUME AND NUMBER OF STREAMLINES BASED ON DIFFUSION
TENSOR TRACTOGRAPHY
7.1 ABSTRACT
BACKGROUND AND PURPOSE To study plasticity of the superior (SCP) and middle
(MCP) cerebellar peduncles in musicians. The cerebellum is well known to support
several musically relevant motor, sensory, and cognitive functions. Previous studies
reported increased cerebellar volume and gray matter (GM) density in musicians. Here,
I report on plasticity of the white matter (WM) of the cerebellum.
SUBJECTS AND METHODS The cohort included 10/10 gender and handedness-
matched musicians and non-musicians. Using diffusion tensor imaging (DTI), fiber
tractography of the SCP and MCP was performed. The average fractional anisotropy
(FA), tract volume, and number of streamlines of SCP/MCP were compared between
groups. Automatic measurements of GM and WM volumes of right/left cerebellar
hemispheres were also compared.
RESULTS Musicians had significantly increased right SCP tract volume (p=0.02) and
number of streamlines (p=0.001), right MCP tract volume (p=0.004), and total WM
volume of the right cerebellum (p=0.003). There were no significant differences in right
MCP number of streamlines, left SCP/MCP tract volume and number of streamlines,
SCP/MCP FA values, GM volume of the right cerebellum, and GM/WM volumes of the
left cerebellum.
CONCLUSION I propose that increased tract volume and number of streamlines of the
right cerebellar peduncles represent use-dependent structural adaptation essential to
support enhanced sensorimotor and cognitive functional demands on the musician’s
cerebellum.

Investigating Structural Plasticity of Cerebellar White Matter in Musicians
220
This work was published in the Journal ‘Cerebellum’:
Abdul-Kareem IA, Stancak A, Parkes L, Al-Ameen M, AlGhamdi J, Aldhafeeri F,
Embleton K, Morris D & Sluming V (2011): Plasticity of the superior and middle
cerebellar peduncles in musicians revealed by quantitative analysis of volume and
number of streamlines based on diffusion tensor tractography. Cerebellum.

Investigating Structural Plasticity of Cerebellar White Matter in Musicians
221
7.2 INTRODUCTION
Musician’s brain has excited the scientific community as it represents an ideal model to
study neuroplasticity (for review see (Munte et al., 2002)). Musicians contrast with
subjects with other professions in two major aspects. First, they begin their training at
an earlier age when many brain regions have not gained optimum maturity, hence
vulnerable to plastic changes imposed by a variety of sensorimotor stimuli (Watanabe et
al., 2007). Second, to master their profession, they must practice for several hours per
day even outside working hours. Taken together, this means that musicians have an
intensive sensorimotor skill acquisition sufficient to impose structural plastic changes in
different brain regions. In this context, there has been growing neuroimaging literature
suggesting the presence of structural neuroplasticity in musicians’ brains in structures
known to have particular relevance for enabling musical performance (Sluming et al.,
2002, Schneider et al., 2005, Abdul-Kareem et al., 2011).
Although the cerebellum comprises only one-tenth of the whole-brain volume, the
number of cells in the human cerebellar cortex exceeds that in the cerebral cortex four-
fold (Andersen et al., 1992). The MCP is the largest cerebellar peduncle and it is the
major input pathway to the cerebellum. It is composed of afferent neural fibers that
project from sensorimotor areas of the cerebral cortex to the pontine nuclei and
subsequently cross on the pons to the contralateral cerebellum. Efferent fibers from the
cerebellum arise primarily from cells in the dentate nucleus but also from emboliform
and globose nuclei. These deeply seated cerebellar nuclei receive fibers from the
cerebellar cortical purkinje cells. The dentate nucleus sends fibers through the SCP,
which is the major output pathway from the cerebellum to the contralateral motor areas
of the cerebral cortex. Two major pathways pass through this peduncle, the dentato-
rubro-thalamo-cortical (dentate nucleus-red nucleus-thalamus-premotor cortex) and
cerebello-thalamo-cortical (cerebellum-thalamus-premotor cortex). While there are
some afferent fibers from the anterior spinocerebellar tract that are conveyed to the
anterior cerebellar lobe via SCP, most of the fibers within this peduncle are efferents
(Williams et al., 1995). Thus, it could be seen that MCP and SCP complete a circuit

Investigating Structural Plasticity of Cerebellar White Matter in Musicians
222
between the cerebral and cerebellar cortices. The main function of this circuit was
suggested to coordinate motor output of the cerebral cortex (Snell, 2001).
Retrograde tracing of substances injected into the cerebral cortex of mammals had
revealed wide connections of the cerebellum. In monkeys for example, about half of the
cerebral cortex projects into the pontine nuclei (Glickstein et al., 1985). The densest
areas of cells projecting from the cerebral cortex to the pontine nuclei are from the
primary motor and premotor areas. There are also dense projections to the pons from
other regions, such as the extrastriate visual areas essential for visuomotor integration
(Glickstein and Doron, 2008), the frontal eye field, and the prefrontal cortex. Cerebellar
efferents from the dentate nucleus were shown to project not only to motor areas but
also to the prefrontal cortex (Middleton and Strick, 2001).
The cerebellum primarily supports coordination of motor movement (Snell, 2001). This
function is obviously of extreme importance to musicians irrespective of their
instrumental specialty. Owing to its wide connections with the cerebral cortex, it has
been shown that the cerebellum also subserves other functions, which might be of
relevance to musical performance, such as cognition, sensory discrimination, and
memory retention (Kim et al., 1994, Gao et al., 1996, Paradiso et al., 1997, Parsons et
al., 1997, Doyon et al., 2002, Matsumura et al., 2004, Stoodley et al., 2010). In this
context, structural studies in musicians reported that male pianists had increased
cerebellar volumes compared to controls (Schlaug et al., 1998, Hutchinson et al., 2003),
which was positively correlated with the intensity of musical performance (practice time
per day and across lifetime)(Schlaug et al., 1998, Hutchinson et al., 2003), and
negatively correlated with age of starting instrument lessons (Schlaug et al., 1998).
However, authors neither specified whether the observed difference is due to greater
GM or WM volume nor did they examined plasticity in each cerebellar hemisphere. In a
voxel-based morphometric (VBM) study (Gaser and Schlaug, 2003) that examined 20
right-handed professional musicians, 20 amateur musicians, and 40 non-musicians, it
was reported that professional musicians had increased GM density in the left
cerebellum in addition to several other brain regions compared to both amateurs and
non-musicians. This study could not however elicit significant findings in the cerebellar

Investigating Structural Plasticity of Cerebellar White Matter in Musicians
223
WM, which might in part be related to limitations in the VBM technique itself as it might
be insensitive to WM differences caused by low-intensity contrast differences between
groups (Ashburner and Friston, 2000, Della Nave et al., 2008), hence the rationale of
using a relatively more sensitive method for examining the WM, such as DTI. A more
recent study that combined VBM and DTI to examine a cohort of 18 right-handed
pianists and 21 right-handed controls (Han et al., 2009) reported increased GM density
in the right cerebellum with no significant results detected in cerebellar WM.
With the exception of the study of Hutchison et al., 2003 (Hutchinson et al., 2003),
which specifically examined the cerebellum, structural changes in musicians’ cerebella
were always reported roughly as additional findings. While the focus of mainstream
imaging-based neuropsychological research continues to be on function and anatomy
of GM, the in vivo neuroimaging technique of DTI-based tractography offers a
complementary way of studying the brain by directing interest towards WM and axonal
connectivity. With the development of this technique, structural plasticity of WM has
received considerable interest both in basic and clinical research (Rose et al., 2000,
Roberts et al., 2005, Jones et al., 2006, Yu et al., 2007). Previous DTI studies in
musicians had mainly focused on studying the corticospinal tract (Schmithorst and
Wilke, 2002, Bengtsson et al., 2005, Imfeld et al., 2009) as it is the main motor tract in
the body with only one DTI study reporting significant findings in the cerebellum through
demonstrating increased FA in the central aspect of the cerebellum in musicians
(Schmithorst and Wilke, 2002). To the best of my knowledge, no previous DTI study has
specifically examined the WM tracts of the cerebellum, such as the SCP and MCP in
musicians. The main aim of this study was therefore to perform DTI-based tractography
to examine SCP and MCP in musicians through measuring average FA, number of
streamlines, and volume of streamlines of these tracts. A second aim was to measure
GM and WM volumes of the right and left cerebellar hemispheres.

Investigating Structural Plasticity of Cerebellar White Matter in Musicians
224
7.2.1 HYPOTHESIS
I hypothesized that professional musicians, being involved in intensive sensorimotor
and cognitive skill acquisition, would show evidence of structural plasticity in the WM of
the cerebellum. This hypothesis was based on findings of several studies that reported
cerebellar involvement in a variety of musically relevant functions, such as motor skill
acquisition and sequence learning (Anderson et al., 1996, Kim et al., 2002, Koeneke et
al., 2004), auditory discrimination (Parsons et al., 2009), spatial (mental orientation) and
working memory (Stoodley et al., 2010), cognition (Flament et al., 1996, Doyon et al.,
2003), and early error detection and correction phase of motor and cognitive skill
learning (Flament et al., 1996, Doyon et al., 2003). I proposed that enhanced neural
activity imposed by musical practice would result in increased WM volume of the
cerebellum; and increased average FA, tract volume, and number of streamlines of
SCP and MCP tracts in musicians. These microstructural changes in SCP/MCP tracts
may reflect increased coherence, directionality, and integrity of fiber bundles (indicated
by increased average FA value), thicker myelination and/or larger diameter of fibers
(indicated by increased tract volume), and increased fiber density, axonal projections,
and sprouting (indicated by increased number of streamlines). These structural changes
are essential to support enhanced functional demands on the musician’s cerebellum.

Investigating Structural Plasticity of Cerebellar White Matter in Musicians
225
7.3 SUBJECTS AND METHODS
7.3.1 SUBJECTS
Twenty six volunteers were recruited after obtaining Local Research Ethics Committee
approval. All subjects gave signed informed consent and were medically screened for
neurological, cardiovascular, and endocrine disorders. Subjects were also questioned
regarding their alcohol consumption. Handedness was assessed using Edinburgh
Handedness Inventory prior to undergoing MR examination of the brain (Oldfield, 1971).
The cohort included 13 musicians/13 controls with 12 right-handed subjects and 1 left-
handed subjects in each group. Final data analysis was applied on 20 subjects (see
result section for details) including 10 musicians (7 males and 3 females) and 10 non-
musicians (7 males and 3 females). From this point onward, I will present subjects’
demographics and musicians’ profile of only those participants who were included in the
final analysis. In each group, 9 were right-handed and 1 was left-handed. Two left-
handed subjects (1 musician/1 control) were included in the present study as previous
manual and VBM studies revealed no significant effect of handedness on cerebellar
structure, including total volume and GM/WM density (Good et al., 2001a, Szabo et al.,
2003). In particular, a VBM study that examined a large cohort (465: 67 left-handed and
398 right-handed) (Good et al., 2001b) revealed no significant effect of handedness on
cerebellar structure. Table 7.1 details descriptive statistics of participants included in the
final analysis. During the first test session, musicians were questioned regarding their
musical training history in addition to instrumental and performance hours. Controls
were also questioned regarding any musical training, and also their interest in music.
Final data analysis was applied on 10 professional musicians who were recruited from a
full-time playing major British symphony orchestra (8 subjects) and from the School of
Music, University of Liverpool (2 subjects). There were 6 pianists and 4 string players.
Descriptive statistics of age of starting musical training and duration of musical
7.3.1.1 MUSICIANS’ PROFILE

Investigating Structural Plasticity of Cerebellar White Matter in Musicians
226
performance are provided in table 7.1. Only one musician started musical training after
the age of 7 years.
Table 7.1. Demographics of subjects recruited in this study.
*Student t test revealed no significant group difference regarding age (p=0.5) and years
of education (p=0.2).
Groups
Musicians Controls
*Age (years) Mean / SD / range 38 / 14.6 / 18-57 34.5 / 11.7 / 20-57
Duration of musical performance (years) Mean / SD / range
29.9 / 14.1 / 11-48 N/A
Age of starting musical training (years) Mean / SD / range 6.6 / 1.8 / 4-10 N/A
*Education (years) Mean / SD 13.8 / 1.2 13.5 / 2.5

Investigating Structural Plasticity of Cerebellar White Matter in Musicians
227
7.3.2 MR DATA ACQUISITION
All volunteers were scanned using protocols with identical sequences and parameters.
7.3.2.1 HIGH RESOLUTION STRUCTURAL SCANS
High-resolution 3D T1-weighted MR images were acquired using a Symphony 1.5 Tesla
whole-body MRI system (Siemens, Magnetom, Germany). These scans were used for
automatic measurement of GM and WM volumes of the cerebellum and for
measurement of intracranial volumes (ICVs). Images were obtained using an 8-channel
receiver head coil and a whole-body transmit coil. The Magnetization-Prepared Rapid
Gradient-Echo (MPRAGE) imaging sequence was used with the following scanning
parameters: TR/TE/TI = 1660/3.04/1100 ms, flip angle = 8°, field of view = 256 mm, and
acquisition time = 14 minutes, 11 seconds. A total of 176 sagittal slices with slice
thickness of 1 mm, and in-plane resolution of 1 mm were obtained.
7.3.2.2 DIFFUSION-WEIGHTED MR DATA ACQUISITION
DTI data acquisition was acquired with Trio 3 Tesla whole-body MRI system (Siemens,
Magnetom, Germany).The DTI scheme included the collection of 60 images with
noncollinear diffusion gradients (b = 1200 s/mm2), and five non-diffusion-weighted
images (b = 0 s/mm2), employing a single shot echo-planar imaging sequence. From
each participant, 60 axial slices were collected. TR/TE = 10100/106 ms, field of view =
267 mm, the acquisition matrix was 112 X 128, and the slice thickness was 2 mm with
no gap, which resulted in voxel dimensions of 2 X 2 X 2 mm. The total acquisition time
was 22 minutes and 14 seconds. Prior to diffusion-weighted data acquisition, all
subjects were given detailed explanation about the nature of the acquisition, and were
asked to keep body motion to a minimum. Inside the scanner, motion was controlled
with the use of head cushions provided by the scanner manufacturer.

Investigating Structural Plasticity of Cerebellar White Matter in Musicians
228
7.4 METHODS
Image analysis methods used in this study include:
• Measurement of intracranial volume (ICV) using an automatic technique.
• Fiber tractography of SCP and MCP to measure average FA, tract volume, and
number of streamlines of these tracts.
• Measurement of GM and WM volumes of cerebellar hemispheres using an
automatic technique.
7.4.1 MEASUREMENT OF INTRACRANIAL VOLUME
To control for differences in head size, automatic measurement of ICV was performed
using FreeSurfer software (version: stable v5.0 for Linux), available online
at http://surfer.nmr.mgh.harvard.edu/fswiki/Download.
7.4.2 DTI DATA ANALYSIS
7.4.2.1 PRE-PROCESSING OF DTI DATA
Pre-processing of DTI data was performed as described in chapter 3, section 3.18.1,
page 105.
7.4.2.2 TRACTOGRAPHY PARAMETERS
Tractography parameters are mentioned in chapter 3, section 3.18.2, page 106.
Reconstruction of SCP and MCP fibers was according to anatomical delineations
provided by published DTI atlases (
7.4.2.3 FIBER TRACTOGRAPHY OF THE SCP AND MCP
Jellison et al., 2004, Wakana et al., 2004, Salamon
et al., 2007).
• RECONSTRUCTION OF THE SCP
The SCP could be easily identified on colour-coded maps with its superior-inferior
oriented fibers coded with light blue colour (figure 7.1). It is located above the level
of MCP. The SCP was demarcated through applying regions of interest (ROIs) on

Investigating Structural Plasticity of Cerebellar White Matter in Musicians
229
the coronal colour-coded map at the level of the middle portion of the splenium of
the corpus callosum (CC).
• RECONSTRUCTION OF THE MCP
For reconstructing the MCP, ROIs were placed on the coronal colour-coded map
where the MCP was greatest in volume (confirmed by viewing the orthogonal axial
image), which corresponds to the level of the middle portion of the splenium of the
CC. In the coronal colour-coded image, the MCP appears green because of its
antero-posteriorly oriented fibers; it could be easily identified lateral to the pontine
tegmentum. Two ROIs were placed at the left and right of the lateral pontine
tegmentum (figure 7.2).
Once a fiber tract was reconstructed, the entire trajectory was verified on a slice-by-
slice basis to ensure consistency with established anatomical landmarks (Williams et
al., 1995, Snell, 2001, Kiernan, 2005), as well as the tractography-based atlases of fiber
pathways of the human brain (Jellison et al., 2004, Wakana et al., 2004, Salamon et al.,
2007). In situations where a particular tract showed some unexpected connectivity or if
there was a deviation relative to the known landmarks, the tract was excluded from
further analyses. After applying tractography, the identified fiber bundles were
compared for three parameters: mean FA value, tract volume, and number of
streamlines.
The FA values were calculated by averaging across all voxels in the tract. It should be
emphasized that the reconstructed tracts represent streamlines based on tensor
directions and not the real WM fibers (Matsumoto et al., 2008). Since we are at present
not able to resolve fiber tracts at microscopic levels, DTI-based tractography is the only
technique that allows identification of WM pathways in the living human brain. The
calculated number of fibers represents the number of the reconstructed streamlines and
the calculated tract volume represents the number of voxels that these streamlines
traverse multiplied by the 2 mm voxel size. Streamlines originating from different brain
regions may converge along their pathway, so that twice the number of streamlines may
not essentially represent twice the volume (number of voxels)(Reich et al., 2006).

Investigating Structural Plasticity of Cerebellar White Matter in Musicians
230
7.4.3 INTRA- AND INTER-RATER RELIABILITY
All ROIs were placed by a single rater, IA who was blind to the identity, laterality, and
grouping of subjects. Intra-rater study was performed by repeating DTI measurements
by the same rater in all subjects at least three weeks after the first measurement. For
inter-rater reliability, DTI measurements were independently performed by two raters
(MA and IA) for all subjects. An intra-class correlation coefficient greater than 0.80 was
accepted as evidence of inter- and intra-rater reliability.
7.4.4 MEASUREMENT OF GM AND WM VOLUMES OF CEREBELLAR HEMISPHERES
Automatic measurement of GM and WM volumes of the right and left cerebellar
hemispheres was performed using FreeSurfer software (version: stable v5.0 for Linux),
available online at http://surfer.nmr.mgh.harvard.edu/fswiki/Download. The image files
in DICOM format were transferred to a Linux workstation for morphometric analysis.
The automated procedures for volumetric measurement of different brain structures
were originally described by (Fischl et al., 2002). In contrast to previous automated
techniques for brain tissue segmentation that label a small number of tissue classes,
FreeSurfer can automatically segment, parcellate, and label up to 40 unique structures,
including the cerebellum by assigning a neuroanatomical label to each voxel in an MRI
volume based on probabilistic information automatically estimated from a manually
labeled training set. An optimal linear transform is computed that maximizes the
likelihood of the input image, given an atlas constructed from manually labeled images.
A nonlinear transform is next initialized with the linear one, and the image is allowed to
further deform to better match the atlas. Finally, a Bayesian segmentation procedure is
carried out, and the maximum a posteriori estimate of the labeling is calculated (Fischl
et al., 2002). The segmentation employs three pieces of information to disambiguate
labels: the prior probability of a given tissue class occurring at a specific atlas location,
the likelihood of the image intensity given that tissue class, and the probability of the
local spatial configuration of labels given the tissue class. It has been shown that the
technique used in this study could achieve results comparable in accuracy to manual
tracings (Fischl et al., 2002, McDonald et al., 2008); however, segmentation results

Investigating Structural Plasticity of Cerebellar White Matter in Musicians
231
were visually inspected for accuracy prior to inclusion in the group analysis. No
segmentation errors were detected, so all cases were included in the final analysis.
7.4.5 STATISTICAL ANALYSIS
Statistical analyses were performed using SPSS v. 16.0 and statistica program, v. 6.0
(Statsoft Inc., USA). Shapiro-Wilk (S-W) was used to test normality of data distribution.
Using SPSS, multivariate analysis of variance (MANOVA) was performed with average
FA values, tract volumes, and number of streamlines of right/left SCP/MCP as
dependent variables and musicianship (musicians versus non-musicians) and gender
(males versus females) as independent variables covarying for age and ICV; p<0.05
was considered significant after adjustment for multiple comparisons. The values of
number of streamlines and tract volumes are likely to be affected by head size.
Increased head size may result in increased number of streamlines and tract volume. I
therefore covaried for ICV to control for head size. In addition, I followed the
recommendations of previous studies (Ciccarelli et al., 2003, Correia et al., 2008, Tate
et al., 2010) for normalizing these metrics according to ICV. I calculated the relative
values of the metrics normalized by the ICV following the formula provided by (Correia
et al., 2008). These metrics were divided by (V / V-), where V is the ICV of the subject
and V- is the average ICV for the entire group (musicians and non-musicians). I re-
performed the above MANOVA using normalized values of tract volume and number of
streamlines. A third MANOVA was performed to compare GM and WM volumes of the
right and left cerebellar hemispheres with GM/WM volumes of right/left cerebellar
hemispheres corrected for ICV as dependent variables and musicianship and gender as
independent variables covarying for age. Independent student t test was used to
compare ICV measurements between groups. Pearson’s correlation was used to
perform correlation analyses. The intra-class correlation coefficient (ICC) calculated by
one-way random model was used to test intra- and inter-rater reliability. A coefficient
greater than 0.80 was accepted as evidence of inter- and intra-rater reliability. Statistica
software was used to create figures 7.5, 7.6, and 7.7.

Investigating Structural Plasticity of Cerebellar White Matter in Musicians
232
7.5 RESULTS
7.5.1 MEASUREMENT OF INTRACRANIAL VOLUME
There was no significant difference in ICV between groups (p=0.15).
7.5.2 RECONSTRUCTION OF THE SCP AND MCP
In all remaining 20 subjects assigned for final data analysis, reconstruction of the SCP
and MCP was consistent with the description of published DTI atlases (figures 7.1, 7.2,
7.3, and 7.4) (
7.5.2.1 EXCLUSION OF CASES FOR TRACTOGRAPHY
As stated in chapter 3, reconstruction of SCP and MCP was not feasible in 6/26
subjects. In these subjects (3 musicians/ 3 non-musicians), tractography results were
deviated from known landmarks and showed inconsistency compared to published
atlases. There was inconsistent tracking of the left MCP in 3 subjects (2 musicians /1
non-musician) and of the right MCP in 3 subjects (1 musician /2 non-musicians). In
these cases, most of trajectories of the MCPs were terminated at the level of the pons
and did not pass to the cerebellar hemisphere. Consequently, these cases were
excluded from this study.
Jellison et al., 2004, Wakana et al., 2004, Salamon et al., 2007).
MANOVA revealed significantly increased right MCP tract volume (F= 10.2, p=0.004),
right SCP tract volume (F= 5.9, p=0.02), and right SCP number of streamlines (F=14.1,
p=0.001) in musicians compared to non-musicians. There were no significant
differences in left SCP tract volume, left MCP tract volume, left SCP number of
streamlines, right MCP number of streamlines, right/left SCP average FA values, and
right/left MCP average FA values. There was no significant gender by musicianship
interaction. It should be noted that normalization of tractography metrics did not affect
the final results. I next assessed the correlation between age of starting musical
training/duration of musical performance and right SCP (tract volume and number of
streamlines) and right MCP (tract volume) using Pearson’s correlation after controlling
7.5.2.2 COMPARISON OF SCP AND MCP TRACTOGRAPHY MEASURES

Investigating Structural Plasticity of Cerebellar White Matter in Musicians
233
for subjects’ age. There was no significant correlation between age of starting musical
training/duration of musical performance and tractography measures of right SCP/MCP.
Figures 7.5 and 7.6 show means ± 95% confidence intervals of SCP and MCP
measures, respectively.
7.5.3 INTRA- AND INTER-RATER RELIABILITY
Results of both inter- and intra-rater comparisons showed good reproducibility between
measurements with ICC range of 0.82-0.93 for inter-rater study and 0.87-0.96 for intra-
rater study.
7.5.4 COMPARISON OF GM AND WM VOLUMES OF RIGHT AND LEFT CEREBELLAR
HEMISPHERES
MANOVA revealed that musicians had significantly increased right cerebellar WM
volumes (F= 11.02, p=0.003). There was no significant difference in right cerebellar GM
volume and left cerebellar WM/GM volumes. There was no significant gender by
musicianship interaction. Figure 7.7 shows means ± 95% confidence intervals of GM
and WM volumes of the right and left cerebellar hemispheres.

Investigating Structural Plasticity of Cerebellar White Matter in Musicians
234
Fig.7.1. Fiber tracking of the SCP. Top row, axial and coronal colour-coded maps
showing the SCP in blue colour (yellow arrows). Two ROIs were placed at the coronal
image (outlined in white) to track SCP fibers. Middle row, depiction of left (green) and
right (yellow) SCP fibers on sagittal T2-weighted images. Bottom row, right and left SCP
fibers depicted on axial T2 weighted images.

Investigating Structural Plasticity of Cerebellar White Matter in Musicians
235
Fig. 7.2. Fiber tracking of the MCP. Top row, axial and coronal colour-coded maps
showing the MCP in green colour (yellow arrows) and the pontine tegmentum (yellow
star). Two ROIs were placed at the coronal image (outlined in white) to track MCP
fibers. Middle row, depiction of left (yellow) and right (green) MCP fibers on sagittal T2-
weighted images. Bottom row, right and left SCP fibers depicted on axial T2-weighted
images.

Investigating Structural Plasticity of Cerebellar White Matter in Musicians
236
Fig. 7.3. Tractography of the SCP and MCP. Demonstration of right (blue) and left (red)
SCP; right (green) and left (yellow) MCP. Left, posterior view and right, anterior view.

Investigating Structural Plasticity of Cerebellar White Matter in Musicians
237
Fig. 7.4. Demonstration of MCP (left column) and SCP (right column) tracts in 6
subjects.

Investigating Structural Plasticity of Cerebellar White Matter in Musicians
238
Fig. 7.5. Means ± 95% confidence intervals of average FA, tract volume, and number of
streamlines of SCP (uncorrected for ICV).

Investigating Structural Plasticity of Cerebellar White Matter in Musicians
239
Fig. 7.6. Means ± 95% confidence intervals of average FA, tract volume and number of
streamlines of MCP (uncorrected for ICV).

Investigating Structural Plasticity of Cerebellar White Matter in Musicians
240
Fig. 7.7. Means ± 95% confidence intervals of GM and WM volumes of right and left
cerebellar hemispheres (uncorrected for ICV). Volumes are mm3.

Investigating Structural Plasticity of Cerebellar White Matter in Musicians
241
7.6 DISCUSSION
Using fiber tractography, the present study revealed that musicians had significantly
increased tract volume and number of streamlines of right SCP and volume of the right
MCP. In addition, automatic measurement of cerebellar hemisphere volumes revealed
increased WM volume of the right cerebellum in musicians. These findings were
detected in a cohort of musicians and controls who showed no significant difference in
ICV. I propose that these findings represent use-dependent structural plasticity imposed
by early and intensive skilful performance. Each cerebellar hemisphere controls the
ipsilateral side of the body, so the right cerebellum controls the right and left cerebellum
controls the left side of the body (Snell, 2001). It is therefore expected to find evidence
of plasticity in the right cerebellum as 18/20 of recruited subjects were right-handed;
however, a VBM study that examined 465 right-handed normal subjects revealed no
significant main effect of handedness on GM and WM density of the cerebellum (Good
et al., 2001a). This might explain the discrepancy of findings of previous VBM studies in
musicians as one study reported increased GM density in the right cerebellum (Han et
al., 2009), yet another reported increased GM density in the left cerebellum (Gaser and
Schlaug, 2003), although both investigated a cohort of right-handed keyboard players.
Neuroplasticity refers to the brain’s ability to change its structure and function during
maturation, learning, skill acquisition, environmental challenges, or pathology (Lledo et
al., 2006). Through this process, neurons are able to change their function, chemical
profile (such as the amount and types of neurotransmitters) or structure (Woolf and
Salter, 2000). At the microscopic level, two steps of neuroplasticity can be identified:
unmasking already established connections that may be followed by generation of new
ones through dendritic growth, arborization, and axonal projections (Pascual-Leone et
al., 2005). Recent studies showed that neuroplasticity can be modified by a variety of
factors, including environmental enrichment and physical activity (van Praag et al.,
1999). Evidence of structural plasticity in the cerebellum was reported in several
experimental paradigms in animals. Many of these studies reported significant plasticity
in relation to motor skill acquisition. For example, it has been shown that motor-skill
learnt rats have more parallel and climbing fiber synapses (Anderson et al., 1996, Kim

Investigating Structural Plasticity of Cerebellar White Matter in Musicians
242
et al., 2002), and that the volume of the molecular layer of the cerebellar cortex is larger
in trained rats and mice than in the inactive groups (Pysh and Weiss, 1979, Kleim et al.,
1998). With the advent of neuroimaging techniques, it has been possible to study
cerebellar plasticity in humans. Accordingly, evidence of structural cerebellar plasticity
in animals has been paralleled by findings of structural plasticity in musicians in the
form of increased absolute and relative cerebellar volumes (Hutchinson et al., 2003)
and increased GM density of the left (Gaser and Schlaug, 2003) and right (Han et al.,
2009) cerebellum. Results of the present study extend these findings through
demonstrating evidence of WM plasticity in musicians’ cerebellum. Interestingly, there
are reports suggesting differential responses of neuroplasticity in animals according to
exercise modules performed. For example, acrobatically trained rats have greater
volume of the cerebellar molecular layer than rats that received forced or voluntary
exercises, or were raised in inactive conditions (Black et al., 1990). This might in part
explain why evidence of structural cerebellar plasticity has been reported in musicians
but not in subjects with other professions like basket ball players (Park et al., 2006) as
the two groups differ in the type of exercise they perform; musicians are involved in fine
motor practice that recruits mainly small muscles of the hands, whereas basket ball
players make coarser movements using mainly large muscles of the upper limb.
7.6.1 THE CEREBELLUM IS CRUCIAL FOR MUSICAL PERFORMANCE
Classically, it was thought that the function of the cerebellum is merely to coordinate
motor activity; however, functional neuroimaging studies have shown that its function
extends far beyond that. The cerebellum is involved in sensory acquisition and
discrimination (Gao et al., 1996, Parsons et al., 1997), spatial (mental orientation) and
working memory (Stoodley et al., 2010), language (Frings et al., 2006), and cognition
(Kim et al., 1994). In the motor domain, fMRI studies in musicians revealed cerebellar
activation while playing (Sergent et al., 1992) and during motor sequence learning
(Hund-Georgiadis and von Cramon, 1999). In particular, the cerebellum appears to be
important in the early error detection and correction phase of motor and cognitive skill
learning (Flament et al., 1996, Doyon et al., 2003). This may suggest that subjects with

Investigating Structural Plasticity of Cerebellar White Matter in Musicians
243
fewer errors when performing motor tasks would show reduced recruitment of the
cerebellum. In accordance, an fMRI study (Koeneke et al., 2004) reported reduced
activations of the cerebellum in keyboard players when performing bimanual motor task
compared to control subjects who showed increased activations. On the other hand, a
sustained increase of activity with continued skilful practice was demonstrated in
specific areas of the cerebellum, such as the dentate nucleus (Flament et al., 1996) and
the posterior superior fissure (Imamizu et al., 2000), which might suggest that these
cerebellar regions are part of the neuronal system engaged in the creation of a long-
term representation of skilled movement necessary to execute those motor adaptation
tasks proficiently.
In addition to the aforementioned functions, the cerebellum appears to have a crucial
role in sensory perception (Parsons et al., 2009). It regulates the acquisition of incoming
sensory data across all sensory modalities including those associated with motor as
well as cognitive activities. Cerebellar involvement in sensory functions was suggested
to be an indirect process through the initial acquisition of the sensory data on which
motor and cognitive functions depend (Bower and Kassel, 1990, Gao et al., 1996,
Parsons et al., 2009), and assuring that the best quality sensory data are gathered for
use by the rest of the nervous system (Bower and Parsons, 2003). Furthermore, several
neuroimaging studies have pointed out to a possible role of the cerebellum in auditory
function, such as pitch (Parsons et al., 2009), intensity (Belin et al., 1998), and duration
(Belin et al., 2002) discrimination of sound stimuli. Cerebellar activations were detected
even when subjects passively listened to pure tones (Lockwood et al., 1999) and
speech (Callan et al., 2006).
It could be hypothesized that, since spectral pitch discrimination and perception was
shown to be lateralized to the right cerebellar hemisphere (Johnsrude et al., 2000,
Zatorre and Belin, 2001, Schneider et al., 2005), the increased tract volumes and
number of streamlines of right SCP/MCP reported here would support enhanced
acquisition of auditory stimuli in musicians.
Quantitative MR studies reported decreased size of SCP and MCP in patients with
neurodegenerative disorders, such as progressive supranuclear palsy (Paviour et al.,

Investigating Structural Plasticity of Cerebellar White Matter in Musicians
244
2006), multiple system atrophy (Paviour et al., 2006), Parkinson’s disease (Gama et al.,
2010), and Friedreich’s ataxia. Atrophy of SCP and MCP on these patients was shown
to be associated with variety of motor, sensory, and cognitive dysfunctions. These
studies also suggested that measurement of volume/area/width of SCP and MCP is a
useful strategy to improve the accuracy of diagnosis and can even help in differentiating
between these disorders (Gama et al., 2010). In contrast to patients with these
disorders, I proposed that musicians with their enhanced sensorimotor skill acquisition
would show increased size of SCP and MCP, which was revealed in the present study.
It has been suggested that quantitative tractography metrics, such as the number of
streamlines and tract volume may provide a valid tool for detecting subtle group
differences in structural integrity of WM tracts (Ciccarelli et al., 2003, Correia et al.,
2008). Combined with average FA, these metrics may provide different discriminative
power when addressing WM integrity (Correia et al., 2008). They have been used to
quantify specific WM pathways, such as the corticospinal tract (Lindenberg et al., 2010),
arcuate fasciculus (Matsumoto et al., 2008), CC, and cingulum (Ciccarelli et al., 2003,
Correia et al., 2008). Quantitative changes of these metrics have been linked to
cognitive performance (Tate et al., 2010) and were used as structural markers of motor
dysfunction (Hosomi et al., 2009). Interestingly, the tract volume and number of
streamlines have been used as markers of structural plasticity. For example, Schlaug
and colleagues (Schlaug et al., 2009) reported significant increase in the number of
streamlines and tract volume of the arcuate fasciculus in patients with non-fluent
aphasia who undergone intonation-based speech therapy. Another example is
increased number of streamlines of internal capsule and cerebral peduncles six weeks
after the induction of spinal cord injury in rats (Ramu et al., 2008). Skilful musical
practice may induce neural activity, which in turn may increase the number, diameter,
myelination, and sprouting of SCP and MCP axons. These microstructural changes in
musicians’ cerebellum might be essential to support enhanced sensorimotor and
cognitive demands on their brain. More studies are required in the future; however, to
explain the exact relationship between DTI-derived measures and histological
properties of the nervous system.

Investigating Structural Plasticity of Cerebellar White Matter in Musicians
245
Results of the present study did not show significant differences in average FA between
groups. Previous DTI studies in musicians reported inconsistent FA findings with some
authors reported higher (Bengtsson et al., 2005, Han et al., 2009), while others reported
lower (Schmithorst and Wilke, 2002, Imfeld et al., 2009) FA values compared to non-
musicians; yet others revealed no significant differences in certain WM tracts, such as
the CC (Imfeld et al., 2009). Although the FA values have been widely used in DTI
literature as markers of WM integrity, the exact correlation between FA measures and
microstructural tissue properties is still lacking. It is therefore reasonable to include
other DTI parameters, such as volume and number of streamlines that could provide
additional evidence of structural plasticity (Matsumoto et al., 2008).
7.6.2 LACK OF GM DIFFERENCES IN CEREBELLAR HEMISPHERES BETWEEN
GROUPS
In the present study, I could not replicate findings of increased GM density in the
cerebellum reported in previous VBM studies (Gaser and Schlaug, 2003, Han et al.,
2009). This might be related to different sample characteristics (such as intensity of
practice and instrument specialty), different scanning parameters, and different
morphometric methods used. I have used a sequence specifically optimized to obtain
high resolution scans that allowed optimum GM/WM segmentation by the FreeSurfer
software. VBM was not originally designed for the analysis of subcortical structures and
the complicated anatomy of the cerebellum and the surrounding cerebral tissue may
impede automatic processing of VBM. The FreeSurfer (Fischl et al., 2002) software
package used in the present study provides a completely automated parcellation of the
cerebral and cerebellar cortices and subcortical structures. Several studies have
validated the use of this method to quantify subcortical volume in aging (Walhovd et al.,
2005), dementia (Pengas et al., 2009), and depression (Tae et al., 2008). Using
FreeSurfer, I could still demonstrate significant WM differences in the right cerebellum
in musicians, which support my findings of increased right SCP/MCP tractography
measures. Results of the present study indicated that WM plasticity could still exist in
the absence of significant GM plasticity. One possible explanation is that skilful musical

Investigating Structural Plasticity of Cerebellar White Matter in Musicians
246
practice has mainly induced WM changes in the form of increased axonal projections
and collaterals with little effect on the cerebellar cortex. These findings underscore the
importance of examining WM plasticity in musicians through using sensitive techniques
like DTI.
7.6.3 CEREBELLAR ASYMMETRY
It is well known that the cerebellum does not have a symmetrical morphology. MR-
based studies have demonstrated different patterns of asymmetry in the normal
cerebellum. For instance, right-to-left asymmetry in total hemisphere volume (Rae et al.,
2002, Szabo et al., 2003), and GM density (Barrick et al., 2005) of the cerebellum were
reported using manual volumetry and VBM techniques, respectively. Several reports
addressed cerebellar asymmetry after dividing each cerebellar hemisphere into anterior
and posterior divisions. For instance, Snyder and colleagues (Snyder et al., 1995)
reported right-to-left volume asymmetry in the anterior cerebellum and left-to-right
volume asymmetry in the posterior cerebellum. This form of cerebellar asymmetry
followed a pattern commonly found in the neocortex named as cerebral developmental
torque wherein "the left occipital pole is often wider and usually protrudes more
posteriorly than the right", and "if one frontal pole extends beyond the other it is usually
the right" (LeMay, 1976). In contrast, a more recent VBM study detected left-to-right GM
asymmetry in the anterior and superior parts of the cerebellum, while no asymmetry
reported in the posterior cerebellum (Barrick et al., 2005). Other studies failed to reveal
significant asymmetry in cerebellar volume (Luft et al., 1998).
The VBM technique has been widely used in research as it provides unbiased,
automatic, and objective morphometric analysis of GM and WM density. One advantage
of VBM is its capacity to examine large cohorts in a short time (Ashburner and Friston,
2000). Several studies have investigated cerebellar asymmetry using VBM (Good et al.,
2001a, Good et al., 2001b, Luders et al., 2004, Park et al., 2004, Herve et al., 2006,
Takao et al., 2011). A right-to-left asymmetry was observed in cerebellar GM density
(Good et al., 2001b, Barrick et al., 2005, Herve et al., 2006, Takao et al., 2011), while
the reverse (left-to-right asymmetry) was found in cerebellar WM density (Herve et al.,

Investigating Structural Plasticity of Cerebellar White Matter in Musicians
247
2006) and FA of cerebellar hemispheres (Takao et al., 2011) and SCP (Park et al.,
2004).
Cerebellar asymmetry has been linked to handedness patterns in adults (
7.6.3.1 EFFECT OF HANDEDNESS ON CEREBELLAR ASYMMETRY
Snyder et al.,
1995). In right-handed subjects, right-to-left cerebellar asymmetry was considered a
reflection of left cerebral hemisphere dominance (Rae et al., 2002) as cerebellar
dominance is contralateral to that of the cerebral cortex, i.e. ipsilateral to the hand
(Leiner et al., 1991). Some reports have attributed right-to left cerebellar asymmetry in
right-handed subjects to the role of the cerebellum in linguistic functions as evidenced
by crossed cerebral and cerebellar language dominance, i.e. left cerebral and right
cerebellar language dominance (Jansen et al., 2005). Studies that examined the effect
of handedness on cohorts of right and left handers revealed contradicting results. As
stated previously, Snyder and colleagues (Snyder et al., 1995) reported that dextral
humans had greater cerebellar torque (a right anterior, left posterior bias of the
cerebellum) than did nondextrals (left-handed and ambidextrous). A recent study
(Powell et al., 2012) investigated the effect of handedness on WM anisotropy in a
cohort of 42 right- and 40 left-handers. Authors reported greater leftward FA asymmetry
in the posterior lobe of the cerebellum in left handers. In general, the effect of
handedness seems to be inconsistent across studies. For example, a VBM study that
examined a large cohort (465: 67 left-handed and 398 right-handed) (Good et al.,
2001b) revealed no significant effect of handedness on cerebellar structure. These
findings were replicated in another study that compared manual volumetric
measurements of cerebellar hemispheres between 20 right-handed and 14 left-handed
subjects (Szabo et al., 2003).
The discrepancies between the above mentioned MR studies could probably reflect
multiple factors, such as differences in subjects' characteristics, sample size, image
analysis methods (manual tracing on relatively few sections versus voxel-based
analysis), and various anatomical definitions for cerebellar compartments.

Investigating Structural Plasticity of Cerebellar White Matter in Musicians
248
Studies of structural brain asymmetry in professional musicians have primarily focused
on the planum temporale and primary motor cortex. While most studies showed leftward
structural asymmetry of the planum temporale in musicians with absolute pitch abilities
(
7.6.3.2 STRUCTURAL ASYMMETRY IN MUSICIANS’ BRAINS
Schlaug et al., 1995, Zatorre et al., 1998, Keenan et al., 2001, Luders et al., 2004),
there was a tendency for structural symmetry or reduced structural asymmetry in the
primary motor cortex. For example, the size of the primary motor cortex was shown to
be more symmetrical in the brains of right-handed keyboard players compared with that
in right-handed non-musicians (Amunts et al., 1997), which was reflected at the
behavioral level by reduced difference in the tapping rate between right and left hands
in musicians (Jancke et al., 1997, Fujii and Oda, 2006). These findings of enhanced
bimanual coordination skills in musicians may suggest that structural or hand skill
asymmetry represent an obstacle for coordinated bimanual performance (Verheul and
Geuze, 2004). It is thus expected that such structural-behavioral reduction in
asymmetry in the motor domain in musicians would be reflected on the cerebellum
being a key structure for motor coordination. However, a VBM study that examined 60
professional musicians demonstrated right-to-left GM asymmetry in most of the
cerebellum (Luders et al., 2004), which was consistent with the general asymmetry
pattern observed in non-musicians. Asymmetry of cerebellar WM and cerebellar
peduncles has not yet been investigated in musicians. The cohort examined in the
present study included a small number of musicians who were of mixed gender (7
males and 3 females) and specialized in different musical instruments (keyboard and
string players). In particular, the type of musical instrument could have significant
differential effect on the morphology of motor regions in musicians (Bangert and
Schlaug, 2006). A larger cohort of uni-instrumental musicians is therefore required in
the future to investigate asymmetry of cerebellar WM.

Investigating Structural Plasticity of Cerebellar White Matter in Musicians
249
7.6.4 TECHNICAL LIMITATIONS OF THE PRESENT STUDY
In addition to general DTI limitations discussed in chapter 6 notably, effects of eddy
currents, subject motion and SNR, there are other technical shortcomings specific to
fiber reconstruction of the SCP and MCP that should be highlighted. First, the resolution
of tractography images is several orders of magnitude lower than the nerve bundles
under examination. For instance, the data in this study were acquired with a resolution
of 2 x 2 x 2 mm, while the diameter of axons is typically 10 µm (Williams et al., 1995,
Snell, 2001, Kiernan, 2005), which means that a voxel could contain a large number of
axons. Estimation of tensor orientation in conventional tracking methods, such as that
used in the present study, would thus represent an average of the orientations of all
axons contained within a voxel. When axons are coherently organized in a parallel
fashion, the orientation of the tensor will truly reflect the orientation of the underlying
fibers. However, when axons are not oriented in a highly coherent fashion (e.g. when
fibers cross within a voxel), then the voxel-averaged estimate of orientation cannot
accurately summarize the orientation of the underlying fibers leading to tracking errors
(Virta et al., 1999). In the present study, crossing fibers phenomenon was observed in
the pons where afferent cerebellar fiber bundles carried by the MCP cross with bundles
of the corticospinal tract thereby reducing reliability of the tracking algorithm.
Recognition of this potential limitation in fiber tracking has led to the development of
techniques that permit more than one orientation to be determined in those voxels
containing multi-orientational fiber populations (Frank, 2002, Tuch et al., 2003, Assaf
and Basser, 2005, Wedeen et al., 2005). These techniques were proposed to provide
more accurate tractography results and are the subject of considerable ongoing
research. Ultimately, higher resolution diffusion-weighted imaging techniques are
needed in the future to precisely delineate fiber pathways.
A further technical limitation that can affect the results unpredictably is the inability of
the fiber tracking algorithm to distinguish “crossing” from “kissing” fiber bundles within a
voxel (Basser et al., 2000). In the present study, the bulk of the reconstructed SCPs do
not appear to decussate at the decussation of the SCP, as they are known anatomically
to do, but the reconstructed trajectory remained in the same hemisphere (see figures

Investigating Structural Plasticity of Cerebellar White Matter in Musicians
250
7.1, 7.3, and 7.4). This is due to the limitation of the fiber tracking algorithm that offers a
“kissing” (><) solution when two fiber populations have a crossing (X) trajectory (Basser
et al., 2000). Despite these sources of technical limitations, I expect that my approach
identified voxels that make up the core of the SCP and MCP tracts. This was confirmed
by visual inspection of the identified tracts, both within individual sections and in 3D
reconstructions, which was performed for every individual studied. Reconstructed tracts
were comparable to published DTI atlases (Wakana et al., 2004, Salamon et al., 2007,
Lawes et al., 2008).
Another limitation is that DTI-based tractography cannot differentiate between afferent
and efferent fibers (Mori and van Zijl, 2002, Nucifora et al., 2007). In DTI, we are
observing the motion of water molecules, from which we cannot differentiate the
directionality of axons. For example, at the level of the dentate nucleus, both afferent
and efferent fibers intersect thereby reducing the likelihood of distinguishing afferent
from efferent fibers within the MCP. The same problem was noticed when tracking the
SCP; although the main bulk of the SCP is composed of efferent fibers of the
dentothalamic tract, it also contains afferent axons of the anterior spinocerebellar tract.
Therefore, one cannot be absolutely confident in naming these tracts as “afferent”, in
the case of MCP and “efferent”, in the case of SCP since DTI does not allow separate
visualization of the upward and downward orientation of fibers.
In the present study, ROI-based method was used for fiber tracking, which is known to
be limited in reproducibility and susceptible to operator variability in the placement of
ROIs. Also, no specific size was set for ROIs which might affect inter-rater reliability.
However, to reduce bias, ROIs were placed on commonly identifiable anatomical
landmarks based on previously proposed methods. The location of ROIs was further
confirmed in each case by referring to sagittal and axial slices. As a result,
reproducibility studies were generally good ranging between 0.87-0.96 for intra-rater
study and 0.82-0.93 for inter-rater study.
The choice of cutoff thresholds for tract reconstruction can have a significant impact on
the identification of fibers within a bundle (Stieltjes et al., 2001). The FA threshold (0.2)
and minimum length criteria (10 mm) used in the present study were chosen to limit the

Investigating Structural Plasticity of Cerebellar White Matter in Musicians
251
number of spurious, anatomically implausible fibers while retaining a maximal number
of anatomically plausible fibers. Lower FA threshold values are known to cause
streamlines to intrude on regions that are obviously GM (Mori and van Zijl, 2002);
however, it is also possible that adjusting these parameters could impact the magnitude
of the obtained metrics. It was therefore prudent to repeat fiber tracking using different
settings to test possible confounding effects on tractography measures (Correia et al.,
2008), which was not performed in the present study.
In this study, cerebellar GM/WM volumes were obtained using an automated
segmentation method provided by FreeSurfer software, which has some limitations
inherent to fully automated segmentation softwares. Several technical factors could
influence labeling of neuroanatomical structures by FreeSurfer software, such as
section thickness, field strength, SNR, and anatomic boundary criteria. However,
previous studies have indicated that volumetric data obtained with automated
segmentation of the cerebellum approximate those obtained with manual tracings
underscoring the utility of this method (Quattrone et al., 2008).
Manual-based volumetric measurements may be less susceptible to limitations
associated with MR imaging such as image quality, tissue intensity that shift structure
boundaries nonuniformly, or with motion artifacts, as the rater can apply
neuroanatomical knowledge to overcome computational-based segmentation compared
with completely automated segmentation (Oscar-Berman and Song, 2011). However,
manual definition of ROI requires labor-intensive efforts, depends on rater experience,
and prone to inter- and intra-rater variability. Automated volume measurement methods
with high reproducibility and accuracy may thus be more efficient than manual
volumetric methods.
Another methodological consideration is the small number of participants examined in
the present work, which limited the power of the study and the inferences that could be
made regarding the findings, especially when making so many statistical comparisons.
It will be important to replicate these findings in larger future studies.

Investigating Structural Plasticity of Cerebellar White Matter in Musicians
252
7.7 CONCLUSION
In conclusion, it was shown that musicians have WM plasticity in the cerebellum in the
form of increased tract volume and number of streamlines of SCP and volume of MCP.
These results extend the currently expanding musicians’ literature suggesting structural
plasticity in different brain regions. I hypothesize that these findings represent use-
dependent structural adaptation resulting from enriched environmental stimuli in the
form of skilful musical practice. These structural adaptations may be essential to
support enhanced functional demands on the cerebellum in musicians. These results
complement previously published GM findings in musicians’ cerebella and highlight the
importance of studying WM plasticity in musicians using DTI-based tractography.

253
CHAPTER 8 GENERAL DISCUSSION, CONCLUSION AND
RECOMMENDATION

General Discussion, Conclusion & Recommendation
254
8.1 AIM
The aim of this chapter is to present a general discussion of results obtained in the
present work. This include discussing differences/similarities in results of regional
macrostructural measurements of the CC obtained in cohort 2 and 3A, and discussing
possible roots of structural changes observed in musicians’ brains notably, effect of age
of starting musical training and developmental asynchronies. Furthermore, a discussion
of whether the observed structural changes are training- or genetically-induced is
provided. The chapter ends by providing general conclusion and recommendation for
future studies.
8.2 GENERAL DISCUSSION
Findings of the present work showed that, compared to non-musicians, musicians had
macroanatomical structural changes in Broca’s area, CC, and cerebellum. Below is a
summary of these findings:
8.2.1 STUDY 1- INVESTIGATING STRUCTURAL PLASTICITY OF POP AND PTR IN
MUSICIANS
• Musicians possessed greater GM volume of the left POP, which was positively
correlated with years of musical performance. There were no significant group
differences in WM volumes.
• Musicians possessed greater cortical surface area of the left BA44.
8.2.2 STUDY 2- INVESTIGATING EFFECT OF MUSICAL EXPERTISE ON REGIONAL
CALLOSAL MORPHOMETRY
• Professional musicians possessed greater cross-sectional area of CC1 and
CC4 regions compared to amateur musicians and non-musicians. There were
no significant group differences in CC2 and CC3 regions.
• There were no significant differences between amateur musicians and non-
musicians.

General Discussion, Conclusion & Recommendation
255
8.2.3 STUDY 3- INVESTIGATING REGIONAL MACRO- AND MICROSTRUCTURAL
PLASTICITY OF THE CC IN MUSICIANS
• Musicians possessed greater cross-sectional area, average FA, tract volume,
number of streamlines, and reduced MD in CC4 region.
• There were no significant group differences in macrostructural and
microstructural measures in CC1-CC3 regions.
• There was a negative correlation between age of starting musical training and
cross-sectional area of CC4 region.
• There was a positive correlation between cross-sectional area and average FA
of CC4 region in all subjects.
8.2.4 STUDY 4- INVESTIGATING STRUCTURAL PLASTICITY OF CEREBELLAR WM IN
MUSICIANS
• Musicians possessed greater number of streamlines of the right SCP, tract
volume of the right SCP, and tract volume of the right MCP.
• There were no significant group differences in FA values of SCP and MCP.
• Musicians possessed greater WM volume of the right cerebellum.
• There was no significant group difference in GM volume of cerebellar
hemispheres.
I hypothesize that these findings represent use-dependent structural adaptations
induced by enriched environment in the form of skilful musical performance. These
structural adaptations were extensive enough to be observed at the macroanatomical
level as revealed in MR images. They represent structural re-organization that is
essential to support enhanced functional demands on musicians’ brains. Although not
yet resolved, possible microscopic changes underlying the observed findings include
increased dendritic arborization, changes in synaptic bulk, formation of new axon
collaterals, and generation of new neurons (Gould et al., 1999). More studies are
required in the future to correlate MR-derived structural measures with histological data.

General Discussion, Conclusion & Recommendation
256
8.3 REGIOONAL CC MORPHOMETRY IN MUSICIANS, COMPARISON OF
RESULTS OBTAINED IN COHORT 2 AND 3A
I have examined regional CC morphometry in two cohorts of musicians (cohort 2, study
2 and cohort 3A, study 3) using two methods: conventional morphometry to measure
regional callosal macrostructure (cross-sectional areas) and DTI-based tractography to
examine regional callosal microstructure (FA, MD, tract volume, and number of
streamlines). Since an identical scheme was used to divide the CC, it is sensible to
compare findings in both studies. Results obtained in both studies revealed that
professional musicians had a greater cross-sectional area of CC4 region relative to non-
musicians, which was corroborated and supported by microstructural findings
(increased average FA, tract volume, number of streamlines, and reduced MD) in
musicians in the same region in cohort 3A. In addition, there was a significant positive
correlation between size and average FA value in CC4 region. Taken together, the
above DTI-derived evidence may suggest that the increased CC4 size detected in both
cohorts is associated with microscopic plasticity in the form of increased fiber density,
fiber diameter, and thicker myelination (Mori and Zhang, 2006, Sun et al., 2006, Trivedi
et al., 2009). Recent studies have suggested a novel technique that could measure
axonal diameter and density in the CC (Alexander et al., 2010, Zhang and Alexander,
2010, Zhang et al., 2011), which could be used in future studies to further expand our
knowledge about regional microstructural plasticity of the CC in musicians. In contrast
to cohort 2, there was a significant negative correlation between CC4 size and age of
starting musical tuition in cohort 3A. This discrepancy might be attributed to inter-
individual variation in human anatomy. Furthermore, the effect of age of starting musical
tuition is complex and the possibility of genetic/environmental interaction can not be
excluded (to be discussed later).
The two cohorts showed contradicting results in measures of CC1 region. While
professional musicians showed larger CC1 size in the second cohort, there was no
significant group difference in CC1 size in the third cohort. Musicians of both cohorts
were right-handed and had approximately equivalent demographics (age, age of
starting musical training, and instrument specialty). Cohorts’ differences in CC1 size

General Discussion, Conclusion & Recommendation
257
could thus be attributed to differences in scanning parameters, influence of gender, and
variability in cognitive abilities. Although subjects of both cohorts were examined using
MPRAGE protocol, there were differences in magnetic field strength (cohort two, 1.5
Tesla; cohort three, 3 Tesla), and acquisition time (cohort two, 7.38 min.; cohort three,
4.14 min.), which might have different effects on regional cross-sectional area
measurements. Variations in imaging parameters, such as through the use of different
field strengths may result in image changes that are independent of the biological
characteristics of the tissue, but rather reflect the physics of the imaging process (Fischl
et al., 2004). It is important to rule out whether these changes could impact contrast
properties of images thereby introducing differences and variability in morphometric
brain measures that do not reflect biological effects, but rather technological ones and
should thus be minimized. In a previous study performed at MARIARC, I specifically
investigated the effect of scanning at different magnetic fields (1.5 Tesla versus 3 Tesla)
on regional callosal morphometry in 10 healthy subjects (Abdul-Kareem et al., 2009)
and found no significant effect of field strength on CC structure, hence this factor may
be disregarded as a potential confounder in my results.
The second cohort included only male professional musicians, while the third included
mixed gender. The morphology of the frontal lobe, which contains prefrontal and
premotor regions, was shown to exhibit striking sex differences (Schlaepfer et al., 1995,
Sowell et al., 2007, Taki et al., 2011). These gender-related structural differences in the
frontal lobe were shown to be reflected on regional microstructural parameters of the
CC. For example, a recent study revealed that males had significantly higher FA and
lower MD compared to females in the genu and anterior body of the CC (Westerhausen
et al., 2011), while no significant results detected in the isthmus and splenium. These
findings may reflect higher axon density or stronger myelination in males. It is thus
expected that males and females vary in the strength of inter-hemispheric callosal
frontal connections. While these differences in inter-hemispheric connectivity might be
related to gender differences in frontal lobe structure, it might also be linked to
differences in frontal lobe functional asymmetry, such as memory function (Putnam et
al., 2008), language lateralization (Josse et al., 2008) or executive functions (Huster et

General Discussion, Conclusion & Recommendation
258
al., 2011). Cohorts’ differences in CC1 size might thus be related to gender.
Additionally, there are several subject’s characteristics known to influence the size of
the prefrontal cortex with consequent effect on CC1 size. For example, it has been
shown that both the volume and GM density of the prefrontal cortex are correlated with
scores of fluid intelligence tests (Gong et al., 2005); and a significant association was
reported between total GM volume of the frontal cortex and a measure of general
intelligence (Thompson et al., 2001). Likewise, the size (Narberhaus et al., 2008) and
FA value (Salo et al., 2009) of the genu were shown to correlate with cognitive
functions, such as attention and memory (Narberhaus et al., 2008), and intelligence
quotient (IQ) level (Hutchinson et al., 2009). These parameters should have been taken
into consideration when performing data analysis to verify any possible impact on CC1
size in both cohorts.

General Discussion, Conclusion & Recommendation
259
8.4 FACTORS CONTROLLING NEUROPLASTICITY IN MUSICIANS
Results of the present work revealed three factors that have potentially impacted
structural plasticity in musicians’ brains namely, duration of musical performance (which
was positively correlated with left POP GM volume), musical expertise (professional
musicians demonstrated larger cross-sectional areas of CC1 and CC4 regions
compared to amateurs and non-musicians), and age of commencing musical tuition
(which was negatively correlated with cross-sectional area of CC4 region).
Considering the different factors that could impact plasticity in musicians, the age of
commencing musical tuition appears to be the most frequently implicated in previous
studies. Mozart began piano training at the age of 3 and Beethoven before the age of 8.
Many music programs for children emphasize that training should begin as early as
possible for optimum musical skill development. The literature suggests the presence of
a sensitive period during childhood when the network of the central nervous system is
very plastic, and an intensive stimulation during this period would result in long-term
structural-functional benefits. For example, increased cross-sectional area of the
anterior CC (Schlaug et al., 1995), and increased MD in the corticospinal tract (Imfeld et
al., 2009) were reported only in musicians who commenced training before age of
seven years. Furthermore, stronger correlations between mean FA of the internal
capsule and number of piano practicing hours were reported in children than in adults,
although the number of hours practiced during childhood was much lower than in
adulthood (Bengtsson et al., 2005). Behavioral studies verified the significance of early
practicing through examining two groups of musicians (one group started musical
training before age of seven years and the other started after that age) using a motor
learning task. It was shown that musicians who commenced training before age of 7
performed better than the other group, although both groups were matched for years of
musical training and experience (Hughes and Franz, 2007, Watanabe et al., 2007). In
the auditory domain, behavioral studies comparing early- and late-trained musicians
have shown that early training (around age of seven years) is essential for the
development of absolute pitch ability (Baharloo et al., 1998, Costa-Giomi et al., 2001,
Schlaug, 2001). Taken together, the above evidence emphasizes the significance of

General Discussion, Conclusion & Recommendation
260
early practicing for inducing neuroplasticity and the existence of a critical period
(possibly around the age of seven years) in the development of motor and auditory
components of musical practice. The term ‘critical period’ was suggested after finding
that certain behavior developed only if an appropriate stimulus is perceived during a
specific period in development (Brainard and Knudsen, 1998, Knudsen, 2004).
Therefore, one could propose that selecting a cohort of musicians who began their
training early in life would probably result in more robust structural-functional differences
compared to non-musicians. This assumption justified selecting cohorts of musicians
(cohort 2 and 3) who commenced their training around age of seven years. The
negative correlation between age of starting musical training and cross-sectional area of
the isthmus and splenium reported in study 3 is in agreement with the ‘critical period’
assumption as 10/12 of recruited musicians had commenced their training before age of
7 years. It is important to note that despite the relatively older age of starting musical
training in the first cohort, I could still detect significant results when comparing volume
and cortical surface area of POP/BA44 (study 1). It appears that the effect of this factor
is complex depending on the brain region examined. Consistent with my findings in
study 1, several studies reported training-induced morphological brain changes even
when the age of commencing skill acquisition was relatively old, such as in musicians
(Bangert and Schlaug, 2006, Baumann et al., 2007), adult jugglers (Draganski, 2004),
London taxi drivers (Maguire et al., 2000, Maguire et al., 2006), and musically naive
stroke patients who undergone intonation-based rehabilitation therapy (Schlaug et al.,
2009). The above evidence suggests that the assumption of the presence of a critical
period around age of seven years should not be generalized, and that structural
plasticity could still be seen even when subjects began their training at a relatively older
age.

General Discussion, Conclusion & Recommendation
261
8.5 ISSUE OF BRAIN DEVELOPMENT
The GM and WM structures of the brain have distinct maturation patterns. The
development of GM regions usually follows an inverted U-shaped curve with distinct
rates in different regions. For example, in the frontal lobe (including Broca’s area)
cortical GM volume peaks at 9.5 years in girls and 10.5 years in boys. The development
of WM, on the other hand, continues throughout childhood and adolescence (Ostby et
al., 2009, Giedd et al., 2010). These developmental asynchronies among different brain
regions and between GM and WM structures may indicate that in a single cohort, the
effect of musical training is asynchronized among different brain regions.
8.5.1 THE CEREBELLUM
The cerebellum approaches its peak volume later than the cerebrum (Tiemeier et al.,
2010). The total cerebellar volume follows an inverted U-shaped pattern of development
compatible with the general growth pattern of GM peaking at age 11.8 years in females
and 15.6 years in males (Tiemeier et al., 2010). The volume of the cerebellar cortex
increases dramatically during the first two years of life reaching a lifetime maximum at
that age, while the myelinated part of the cerebellum continues to increase in size into
childhood and adolescence (Saksena et al., 2008, Ostby et al., 2009, Wu et al., 2011).
It could thus be seen that the cerebellum has a longer development period relative to
the cerebral hemisphere, which is mainly due to longer development of its WM possibly
through the formation of new synapses, dendritic branching, axonal sprouting, and
myelination. This would also mean that cerebellar WM is exposed to the effect of
plasticity for a relatively longer period of time highlighting the significance of
investigating plasticity in cerebellar WM and the major input/output cerebellar pathways
(MCP and SCP) as that performed in the present work (study 4).
8.5.2 THE CORPUS CALLOSUM
The CC is one of the latest maturing neural networks of the brain as reported by MR
and postmortem studies (Rakic and Yakovlev, 1968, Pujol et al., 1993). The CC size
has been shown to increase up to the 4th Hasan et al., 2008b decade ( ) with maximal

General Discussion, Conclusion & Recommendation
262
growth during childhood (Keshavan et al., 2002). A comparable development pattern in
microstructural parameters was also shown (McLaughlin et al., 2007, Hasan et al.,
2008a, Hasan et al., 2008b). Interestingly, structural maturation cycle within the CC
shows a region-specific pattern with size increase slowing in an anterior to posterior
direction meaning that the splenium would reach its maximum maturation later than the
other parts (Giedd et al., 1999). In accordance, it has been shown that aging is
associated with reduced FA in the genu but not in the splenium (Abe et al., 2002, Snook
et al., 2007, Muetzel et al., 2008). This might imply that the splenium is exposed to
environmental stimuli for a relatively longer duration compared to anterior CC regions,
hence it may be more vulnerable to plastic effects. In two of the cohorts examined in the
present work, musicians showed evidence of structural plasticity in the isthmus and
splenium in the form of increased cross-sectional area (cohort 2 and 3A, study 2 and 3),
increased average FA, tract volume, and number of streamlines (cohort 3A, study 3).
The above findings could partly be explained by the theory of CC development.

General Discussion, Conclusion & Recommendation
263
8.6 ARE THESE STRUCTURAL CHANGES REPRESENT USE-DEPENDENT
PLASTICITY OR GENETIC PREDISPOSITION FOR MUSIC?
It has been shown that hereditary factors can influence structural measures of brain
regions, such as cortical surface area (Tramo et al., 1998), cortical volume (Joshi et al.,
2011), and total brain volumes (Brun et al., 2009). Genetic influence appears to be
region specific and vary between GM and WM structures. However, environmental
factors do play a major role as can be reflected from the wealth of literature (Maguire et
al., 2000, Draganski et al., 2004, Maguire et al., 2006, Aydin et al., 2007). The effect of
environmental factors appears to be individual-specific and is not shared even between
twins (Kremen et al., 2010).
It is still debatable whether the observed structural-functional changes in musician's
brain result from intensive musical practice or merely represent an innate predisposition
for music. After reviewing the wealth of literature and performing the current work, I
would suggest the former explanation for the following reasons. First, structural and
functional changes related to musical expertise were correlated both with the age of
onset of musical training (Elbert et al., 1995, Schlaug et al., 1995, Amunts et al., 1997,
Jancke et al., 1997, Pantev et al., 1998, Schlaug et al., 1998, Ohnishi et al., 2001,
Schlaug, 2001, Lotze et al., 2003, Koeneke et al., 2004, Bengtsson et al., 2005, Imfeld
et al., 2009) and duration of musical performance and practice intensity (Sluming et al.,
2002, Hutchinson et al., 2003, Aydin et al., 2005, Abdul-Kareem et al., 2011). Second,
structural and functional changes were correlated with the level of musical expertise
(McAdams et al., 1995, Schneider et al., 2002, Gaser and Schlaug, 2003, Lotze et al.,
2003, Shahin et al., 2008). Third, studies that compared two groups of instrumentalists
have pointed out that differences were directly related to instrument type (Elbert et al.,
1995, Pantev et al., 2001, Schneider et al., 2005, Bangert and Schlaug, 2006, Shahin et
al., 2008). Fourth, evidence of structural-functional plasticity was shown even after
short-term musical training in non-musicians yielding effects comparable to those found
with long-term musical training (Pascual-Leone, 2001, Tremblay and Kraus, 2002,
Lappe et al., 2008). Finally, Norton and colleagues (Norton et al., 2005) performed
structural and functional MR study and applied a battery of tests (verbal, motor, musical,

General Discussion, Conclusion & Recommendation
264
and visuospatial) to answer the question of whether pre-existing neural and cognitive
markers exist in children who choose to participate in music training compared to
children who were not planning to take music lessons. Authors reported no significant
differences suggesting the lack of pre-existing markers between groups. Playing
musical instrument, being a multimodal task that requires a host of skills, including
motor, sensory, auditory, and visuospatial skills could thus be envisaged as a strong
environmental factor that plays a major role in inducing structural plasticity in musicians’
brains. Results of the present work are in line with this assumption as there was a
correlation between structural measures and the duration of musical performance
(study 1), musical expertise (study 2), and age of commencing musical training (study
3). It is important to realize that considerable inter-individual variations do exist in
human anatomy, and that the interaction of environmental/genetic factors varies both
among individuals and in different brain regions in the same individual. This might
explain why the effect of factors, such as the duration of musical performance and age
of commencing musical tuition was variable across studies conducted in the present
work.

General Discussion, Conclusion & Recommendation
265
8.7 CONCLUSION
In conclusion, this work has extended the currently expanding literature through
demonstrating novel evidence of structural plasticity in musician’s brain in regions
known to subserve several musically relevant functions, including POP, CC, and
cerebellum. The correlation of these findings with the duration of musical performance,
musical expertise, and age of starting musical training may support the assumption that
the observed structural changes in the brains of musicians represent use-dependent
plasticity induced by musical performance rather than innate predisposition for being a
musician. These structural changes would support enhanced functional demands on
musicians’ brains. At the microscopic level, these macroanatomical findings may reflect
increased dendritic arborization, thicker myelination, generation of new axonal
projections and collaterals, and the formation of new neurons. However, more studies
are required in the future to correlate MR-derived structural measures with histological
data. Results of the present work can direct future structural-functional studies in
musicians, and may be used as baseline data when designing rehabilitation programs
for patients with neurological deficits.

General Discussion, Conclusion & Recommendation
266
8.8 RECOMMENDATIONS FOR FUTURE STUDIES
• More studies are required in the future to perform longitudinal investigations
that may confirm results observed in cross-sectional studies. These studies
may provide more valid results as they are more sensitive to individual
differences in development. However, it is important to take into account
standardization of scanning parameters, such as magnetic field strength, pulse
sequence, and scanner manufacturer in addition to the use of unified
measurement methods to allow unbiased data comparison.
• In line with my findings of structural enlargement of POP in musicians, future
studies can examine cortical connections of this region in musicians. As the
POP is considered the functional ‘hub’ of the mirror neuron system, it is
reasonable to use DTI-based tractography to examine fiber connections
between POP and other components of the mirror neuron system.
• It is interesting to investigate plasticity of POP and cerebellar peduncles in
female subjects; insufficient number of females volunteered in the present work
prohibited such investigation.
• Recent studies have proposed a technique to measure axonal diameter and
fiber density in the CC (Alexander et al., 2010, Zhang and Alexander, 2010,
Zhang et al., 2011). It is interesting to compare these measures between
musicians and non-musicians, which could provide an additional support to the
hypothesis of training-induced structural plasticity in musicians’ brains.
• More studies are required in the future to examine functional plasticity of the
cerebellum in line with results of the present work suggesting greater tract
volume and number of streamlines of SCP and MCP, hence the possibility of
widely distributed cerebellar networks through increased axonal projections and
collaterals.
• Future studies should also explore the precise correlation between DTI-derived
measures and histological properties of the nervous tissue. Although there were
some studies that combined DTI with histological examination (Concha et al.,
2010, Raya et al., 2011), the precise significance of DTI-derived quantitative

General Discussion, Conclusion & Recommendation
267
parameters, such as FA, MD, tract volume, and number of streamlines has not
yet been resolved. Such exploration is essential for allowing valid
interpretations of DTI results.
• It is important to apply our knowledge of training-induced structural-functional
neuroplasticity in clinical fields, such as in rehabilitation medicine. A
rehabilitation program based on musicians’ studies would potentially promise
an improvement of the functioning capabilities in subjects with neurological
deficits. Few reports suggested that such approach is doable (Schneider et al.,
2007, Schlaug et al., 2009) even following short-term musical training of
musically naive patients. For instance, based on previously published functional
data and the findings of increased GM volume and cortical surface area of the
left POP reported here, researchers may selectively apply repetitive
transcranial magnetic stimulation (a non-invasive procedure that utilizes
magnetic fields to create electric currents in discrete brain areas) on the POP to
help to restore function in patients with non-fluent aphasia.
There are many neurodegenerative disorders, such as progressive
supranuclear palsy, multiple system atrophy (Paviour et al., 2006), and
Parkinson’s disease that affect SCP and MCP, thereby producing a variety of
motor, sensory, and cognitive deficits. In line with my findings of increased tract
volume and fiber count of SCP and MCP, and the fact that the cerebellum
subserves motor coordination and auditory discrimination functions, it might be
feasible to design specific motor and/or auditory paradigms to provide means of
inducing structural plasticity in these tracts. More studies would be needed;
however, to determine whether rehabilitative changes induced by musical
training are correlated with the duration of treatment and other factors that
control this process, such as age and gender of patients, size and site of
lesions.

268
REFERENCES

References
269
Abdul-Kareem IA, Stancak A, Parkes LM, Sluming V (2009) Regional corpus callosum morphometry: effect of field strength and pulse sequence. Journal of magnetic resonance imaging : JMRI 30:1184-1190.
Abdul-Kareem IA, Stancak A, Parkes LM, Sluming V (2011) Increased gray matter volume of left pars opercularis in male orchestral musicians correlate positively with years of musical performance. J Magn Reson Imaging 33:24-32.
Abe O, Aoki S, Hayashi N, Yamada H, Kunimatsu A, Mori H, Yoshikawa T, Okubo T, Ohtomo K (2002) Normal aging in the central nervous system: quantitative MR diffusion-tensor analysis. Neurobiol Aging 23:433-441.
Aberg MA, Aberg ND, Hedbacker H, Oscarsson J, Eriksson PS (2000) Peripheral infusion of IGF-I selectively induces neurogenesis in the adult rat hippocampus. The Journal of neuroscience : the official journal of the Society for Neuroscience 20:2896-2903.
Abidin I, Kohler T, Weiler E, Zoidl G, Eysel UT, Lessmann V, Mittmann T (2006) Reduced presynaptic efficiency of excitatory synaptic transmission impairs LTP in the visual cortex of BDNF-heterozygous mice. The European journal of neuroscience 24:3519-3531.
Aboitiz F, Scheibel AB, Fisher RS, Zaidel E (1992) Fiber composition of the human corpus callosum. Brain Res 598:143-153.
Aboitiz F, Scheibel AB, Fisher RS, Zaidel E (1992 ) Fiber composition of the human corpus callosum. Brain Res 598:143-153.
Acosta O, Bourgeat P, Fripp J, Bonner E, Ourselin S, Salvado O (2008) Automatic delineation of sulci and improved partial volume classification for accurate 3D voxel-based cortical thickness estimation from MR. Medical image computing and computer-assisted intervention : MICCAI International Conference on Medical Image Computing and Computer-Assisted Intervention 11:253-261.
Agnihotri N, Lopez-Garcia JC, Hawkins RD, Arancio O (1998) Morphological changes associated with long-term potentiation. Histology and histopathology 13:1155-1162.
Albert ML, Sparks RW, Helm NA (1973) Melodic intonation therapy for aphasia. Arch Neurol 29:130-131.
Alexander AL, Lee JE, Lazar M, Boudos R, DuBray MB, Oakes TR, Miller JN, Lu J, Jeong EK, McMahon WM, Bigler ED, Lainhart JE (2007a) Diffusion tensor imaging of the corpus callosum in Autism. Neuroimage 34:61-73.
Alexander AL, Lee JE, Lazar M, Field AS (2007b) Diffusion tensor imaging of the brain. Neurotherapeutics : the journal of the American Society for Experimental NeuroTherapeutics 4:316-329.
Alexander DC, Hubbard PL, Hall MG, Moore EA, Ptito M, Parker GJ, Dyrby TB (2010) Orientationally invariant indices of axon diameter and density from diffusion MRI. NeuroImage 52:1374-1389.
Alvarez-Buylla A, Garcia-Verdugo JM (2002) Neurogenesis in adult subventricular zone. J Neurosci 22:629-634.
Amunts K, Schlaug G, Jancke L, Steinmetz H, Schleicher A, Dabringhaus A, Zilles K (1997a) Motor Cortex and Hand motor Skills: Structural Compliance in the Human Brain. Human brain mapping 5:206-215.
Amunts K, Schlaug G, Jancke L, Steinmetz H, Schleicher A, Dabringhaus A, Zilles K (1997b) Motor cortex and hand motor skills: structural compliance in the human brain. Human brain mapping 5:206-215.
Amunts K, Schleicher A, Burgel U, Mohlberg H, Uylings HB, Zilles K (1999) Broca's region revisited: cytoarchitecture and intersubject variability. J Comp Neurol 412:319-341.
Andersen BB, Korbo L, Pakkenberg B (1992) A quantitative study of the human cerebellum with unbiased stereological techniques. The Journal of comparative neurology 326:549-560.
Anderson BJ, Alcantara AA, Greenough WT (1996) Motor-skill learning: changes in synaptic organization of the rat cerebellar cortex. Neurobiol Learn Mem 66:221-229.
Anderson BJ, Eckburg PB, Relucio KI (2002) Alterations in the thickness of motor cortical subregions after motor-skill learning and exercise. Learn Mem 9:1-9.

References
270
Anwander A, Tittgemeyer M, von Cramon DY, Friederici AD, Knosche TR (2007) Connectivity-Based Parcellation of Broca's Area. Cereb Cortex 17:816-825.
Argstatter H, Plinkert P, Bolay HV (2007) [Music therapy for tinnitus patients: an interdisciplinary pilot study of the Heidelberg Model]. HNO 55:375-383.
Armitage P, Berry G (1994) Statistical Methods in Medical Research. Oxford: Blackwell Scientific Publications.
Ashburner J, Friston KJ (2000) Voxel-based morphometry--the methods. NeuroImage 11:805-821.
Assaf Y, Basser PJ (2005) Composite hindered and restricted model of diffusion (CHARMED) MR imaging of the human brain. NeuroImage 27:48-58.
Aydin K, Ciftci K, Terzibasioglu E, Ozkan M, Demirtas A, Sencer S, Minareci O (2005) Quantitative proton MR spectroscopic findings of cortical reorganization in the auditory cortex of musicians. AJNR American journal of neuroradiology 26:128-136.
Aydin K, Ucar A, Oguz KK, Okur OO, Agayev A, Unal Z, Yilmaz S, Ozturk C (2007) Increased gray matter density in the parietal cortex of mathematicians: a voxel-based morphometry study. AJNR Am J Neuroradiol 28:1859-1864.
Aziz-Zadeh L, Iacoboni M, Zaidel E, Wilson S, Mazziotta J (2004) Left hemisphere motor facilitation in response to manual action sounds. Eur J Neurosci 19:2609-2612.
Baharloo S, Johnston PA, Service SK, Gitschier J, Freimer NB (1998) Absolute pitch: an approach for identification of genetic and nongenetic components. Am J Hum Genet 62:224-231.
Bammer R, Acar B, Moseley ME (2003) In vivo MR tractography using diffusion imaging. European journal of radiology 45:223-234.
Bangert M, Altenmuller EO (2003) Mapping perception to action in piano practice: a longitudinal DC-EEG study. BMC neuroscience 4:26.
Bangert M, Peschel T, Schlaug G, Rotte M, Drescher D, Hinrichs H, Heinze HJ, Altenmuller E (2006) Shared networks for auditory and motor processing in professional pianists: evidence from fMRI conjunction. NeuroImage 30:917-926.
Bangert M, Schlaug G (2006) Specialization of the specialized in features of external human brain morphology. The European journal of neuroscience 24:1832-1834.
Barbas H, Pandya DN (1984) Topography of commissural fibers of the prefrontal cortex in the rhesus monkey. Experimental brain research Experimentelle Hirnforschung 55:187-191.
Barrick TR, Charlton RA, Clark CA, Markus HS (2010) White matter structural decline in normal ageing: a prospective longitudinal study using tract-based spatial statistics. NeuroImage 51:565-577.
Barrick TR, Clark CA (2004) Singularities in diffusion tensor fields and their relevance in white matter fiber tractography. NeuroImage 22:481-491.
Barrick TR, Lawes IN, Mackay CE, Clark CA (2007) White matter pathway asymmetry underlies functional lateralization. Cereb Cortex 17:591-598.
Barrick TR, Mackay CE, Prima S, Maes F, Vandermeulen D, Crow TJ, Roberts N (2005) Automatic analysis of cerebral asymmetry: an exploratory study of the relationship between brain torque and planum temporale asymmetry. NeuroImage 24:678-691.
Barta P, Dazzan P (2003) Hemispheric surface area: sex, laterality and age effects. Cereb Cortex 13:364-370.
Basser PJ, Jones DK (2002) Diffusion-tensor MRI: theory, experimental design and data analysis - a technical review. NMR in biomedicine 15:456-467.
Basser PJ, Mattiello J, LeBihan D (1994a) Estimation of the effective self-diffusion tensor from the NMR spin echo. Journal of magnetic resonance Series B 103:247-254.
Basser PJ, Mattiello J, LeBihan D (1994b) MR diffusion tensor spectroscopy and imaging. Biophysical journal 66:259-267.
Basser PJ, Pajevic S, Pierpaoli C, Duda J, Aldroubi A (2000) In vivo fiber tractography using DT-MRI data. Magnetic resonance in medicine : official journal of the Society of Magnetic Resonance in Medicine / Society of Magnetic Resonance in Medicine 44:625-632.

References
271
Basser PJ, Pierpaoli C (1996) Microstructural and physiological features of tissues elucidated by quantitative-diffusion-tensor MRI. J Magn Reson B 111:209-219.
Baumann S, Koeneke S, Schmidt CF, Meyer M, Lutz K, Jancke L (2007) A network for audio-motor coordination in skilled pianists and non-musicians. Brain research 1161:65-78.
Baumgaertner A, Buccino G, Lange R, McNamara A, Binkofski F (2007) Polymodal conceptual processing of human biological actions in the left inferior frontal lobe. The European journal of neuroscience 25:881-889.
Beaulieu C (2002) The basis of anisotropic water diffusion in the nervous system - a technical review. NMR in biomedicine 15:435-455.
Becker N, Wierenga CJ, Fonseca R, Bonhoeffer T, Nagerl UV (2008) LTD induction causes morphological changes of presynaptic boutons and reduces their contacts with spines. Neuron 60:590-597.
Begre S, Frommer A, von Kanel R, Kiefer C, Federspiel A (2007) Relation of white matter anisotropy to visual memory in 17 healthy subjects. Brain research 1168:60-66.
Behrens TE, Berg HJ, Jbabdi S, Rushworth MF, Woolrich MW (2007) Probabilistic diffusion tractography with multiple fibre orientations: What can we gain? NeuroImage 34:144-155.
Behrens TE, Johansen-Berg H, Woolrich MW, Smith SM, Wheeler-Kingshott CA, Boulby PA, Barker GJ, Sillery EL, Sheehan K, Ciccarelli O, Thompson AJ, Brady JM, Matthews PM (2003a) Non-invasive mapping of connections between human thalamus and cortex using diffusion imaging. Nature neuroscience 6:750-757.
Behrens TE, Woolrich MW, Jenkinson M, Johansen-Berg H, Nunes RG, Clare S, Matthews PM, Brady JM, Smith SM (2003b) Characterization and propagation of uncertainty in diffusion-weighted MR imaging. Magnetic resonance in medicine : official journal of the Society of Magnetic Resonance in Medicine / Society of Magnetic Resonance in Medicine 50:1077-1088.
Belin P, McAdams S, Smith B, Savel S, Thivard L, Samson S, Samson Y (1998) The functional anatomy of sound intensity discrimination. J Neurosci 18:6388-6394.
Belin P, McAdams S, Thivard L, Smith B, Savel S, Zilbovicius M, Samson S, Samson Y (2002) The neuroanatomical substrate of sound duration discrimination. Neuropsychologia 40:1956-1964.
Benes FM (1989) Myelination of cortical-hippocampal relays during late adolescence. Schizophrenia bulletin 15:585-593.
Benes FM, Turtle M, Khan Y, Farol P (1994) Myelination of a key relay zone in the hippocampal formation occurs in the human brain during childhood, adolescence, and adulthood. Archives of general psychiatry 51:477-484.
Bengtsson SL, Csikszentmihalyi M, Ullen F (2007) Cortical regions involved in the generation of musical structures during improvisation in pianists. J Cogn Neurosci 19:830-842.
Bengtsson SL, Nagy Z, Skare S, Forsman L, Forssberg H, Ullen F (2005) Extensive piano practicing has regionally specific effects on white matter development. Nature neuroscience 8:1148-1150.
Berkowitz AL, Ansari D (2008) Generation of novel motor sequences: the neural correlates of musical improvisation. Neuroimage 41:535-543.
Berman JI, Berger MS, Mukherjee P, Henry RG (2004) Diffusion-tensor imaging-guided tracking of fibers of the pyramidal tract combined with intraoperative cortical stimulation mapping in patients with gliomas. J Neurosurg 101:66-72.
Berman JI, Chung S, Mukherjee P, Hess CP, Han ET, Henry RG (2008) Probabilistic streamline q-ball tractography using the residual bootstrap. NeuroImage 39:215-222.
Bermudez P, Lerch JP, Evans AC, Zatorre RJ (2009) Neuroanatomical correlates of musicianship as revealed by cortical thickness and voxel-based morphometry. Cereb Cortex 19:1583-1596.
Bermudez P, Zatorre RJ (2001) Sexual dimorphism in the corpus callosum: methodological considerations in MRI morphometry. Neuroimage 13:1121-1130.

References
272
Bermudez P, Zatorre RJ (2005) Differences in gray matter between musicians and nonmusicians. Annals of the New York Academy of Sciences 1060:395-399.
Bethune A, Tipu V, Sled JG, Narayanan S, Arnold DL, Mabbott D, Rockel C, Ghassemi R, Till C, Banwell B (2011) Diffusion tensor imaging and cognitive speed in children with multiple sclerosis. Journal of the neurological sciences 309:68-74.
Binkofski F, Buccino G (2006) The role of ventral premotor cortex in action execution and action understanding. J Physiol Paris 99:396-405.
Binkofski F, Buccino G, Stephan KM, Rizzolatti G, Seitz RJ, Freund HJ (1999) A parieto-premotor network for object manipulation: evidence from neuroimaging. Exp Brain Res 128:210-213.
Black JE, Isaacs KR, Anderson BJ, Alcantara AA, Greenough WT (1990) Learning causes synaptogenesis, whereas motor activity causes angiogenesis, in cerebellar cortex of adult rats. Proceedings of the National Academy of Sciences of the United States of America 87:5568-5572.
Blatter DD, Bigler ED, Gale SD, Johnson SC, Anderson CV, Burnett BM, Parker N, Kurth S, Horn SD (1995) Quantitative volumetric analysis of brain MR: normative database spanning 5 decades of life. AJNR American journal of neuroradiology 16:241-251.
Bliss TV, Collingridge GL (1993) A synaptic model of memory: long-term potentiation in the hippocampus. Nature 361:31-39.
Bliss TV, Gardner-Medwin AR (1973) Long-lasting potentiation of synaptic transmission in the dentate area of the unanaestetized rabbit following stimulation of the perforant path. The Journal of physiology 232:357-374.
Bliss TV, Lomo T (1973) Long-lasting potentiation of synaptic transmission in the dentate area of the anaesthetized rabbit following stimulation of the perforant path. The Journal of physiology 232:331-356.
Blume WT (1984) Corpus callosum section for seizure control: rationale and review of experimental and clinical data. Cleve Clin Q 51:319-332.
Bookheimer S (2002) Functional MRI of language: new approaches to understanding the cortical organization of semantic processing. Annu Rev Neurosci 25:151-188.
Botvinick M, Nystrom LE, Fissell K, Carter CS, Cohen JD (1999) Conflict monitoring versus selection-for-action in anterior cingulate cortex. Nature 402:179-181.
Bower JM, Kassel J (1990) Variability in tactile projection patterns to cerebellar folia crus IIA of the Norway rat. J Comp Neurol 302:768-778.
Bower JM, Parsons LM (2003) Rethinking the "lesser brain". Sci Am 289:50-57. Boyke J, Driemeyer J, Gaser C, Buchel C, May A (2008) Training-induced brain
structure changes in the elderly. The Journal of neuroscience : the official journal of the Society for Neuroscience 28:7031-7035.
Brainard MS, Knudsen EI (1998) Sensitive periods for visual calibration of the auditory space map in the barn owl optic tectum. J Neurosci 18:3929-3942.
Breier JI, Juranek J, Papanicolaou AC (2011) Changes in maps of language function and the integrity of the arcuate fasciculus after therapy for chronic aphasia. Neurocase 17:506-517.
Brochard R, Dufour A, Despres O (2004) Effect of musical expertise on visuospatial abilities: evidence from reaction times and mental imagery. Brain Cogn 54:103-109.
Brown J, Cooper-Kuhn CM, Kempermann G, Van Praag H, Winkler J, Gage FH, Kuhn HG (2003) Enriched environment and physical activity stimulate hippocampal but not olfactory bulb neurogenesis. The European journal of neuroscience 17:2042-2046.
Bruel-Jungerman E, Davis S, Laroche S (2007) Brain plasticity mechanisms and memory: a party of four. The Neuroscientist : a review journal bringing neurobiology, neurology and psychiatry 13:492-505.
Bruel-Jungerman E, Laroche S, Rampon C (2005) New neurons in the dentate gyrus are involved in the expression of enhanced long-term memory following environmental enrichment. The European journal of neuroscience 21:513-521.
Brun CC, Lepore N, Pennec X, Lee AD, Barysheva M, Madsen SK, Avedissian C, Chou YY, de Zubicaray GI, McMahon KL, Wright MJ, Toga AW, Thompson PM

References
273
(2009) Mapping the regional influence of genetics on brain structure variability--a tensor-based morphometry study. Neuroimage 48:37-49.
Buonomano DV, Merzenich MM (1998) Cortical plasticity: from synapses to maps. Annual review of neuroscience 21:149-186.
Burgel U, Madler B, Honey CR, Thron A, Gilsbach J, Coenen VA (2009) Fiber tracking with distinct software tools results in a clear diversity in anatomical fiber tract portrayal. Central European neurosurgery 70:27-35.
Butz M, Worgotter F, van Ooyen A (2009) Activity-dependent structural plasticity. Brain research reviews 60:287-305.
Callan DE, Tsytsarev V, Hanakawa T, Callan AM, Katsuhara M, Fukuyama H, Turner R (2006) Song and speech: brain regions involved with perception and covert production. Neuroimage 31:1327-1342.
Catani M, Howard RJ, Pajevic S, Jones DK (2002) Virtual in vivo interactive dissection of white matter fasciculi in the human brain. NeuroImage 17:77-94.
Catani M, Jones DK, ffytche DH (2005) Perisylvian language networks of the human brain. Annals of neurology 57:8-16.
Catani M, Thiebaut de Schotten M (2008) A diffusion tensor imaging tractography atlas for virtual in vivo dissections. Cortex 44:1105-1132.
Chan AS, Ho YC, Cheung MC (1998) Music training improves verbal memory. Nature 396:128.
Chang HY, Takei K, Sydor AM, Born T, Rusnak F, Jay DG (1995) Asymmetric retraction of growth cone filopodia following focal inactivation of calcineurin. Nature 376:686-690.
Chang PL, Isaacs KR, Greenough WT (1991) Synapse formation occurs in association with the induction of long-term potentiation in two-year-old rat hippocampus in vitro. Neurobiology of aging 12:517-522.
Chao YP, Cho KH, Yeh CH, Chou KH, Chen JH, Lin CP (2009) Probabilistic topography of human corpus callosum using cytoarchitectural parcellation and high angular resolution diffusion imaging tractography. Human brain mapping 30:3172-3187.
Chein JM, Fissell K, Jacobs S, Fiez JA (2002) Functional heterogeneity within Broca's area during verbal working memory. Physiol Behav 77:635-639.
Chen KS, Masliah E, Mallory M, Gage FH (1995) Synaptic loss in cognitively impaired aged rats is ameliorated by chronic human nerve growth factor infusion. Neuroscience 68:19-27.
Cheng LL, Newell K, Mallory AE, Hyman BT, Gonzalez RG (2002) Quantification of neurons in Alzheimer and control brains with ex vivo high resolution magic angle spinning proton magnetic resonance spectroscopy and stereology. Magnetic resonance imaging 20:527-533.
Cheng P, Magnotta VA, Wu D, Nopoulos P, Moser DJ, Paulsen J, Jorge R, Andreasen NC (2006) Evaluation of the GTRACT diffusion tensor tractography algorithm: a validation and reliability study. NeuroImage 31:1075-1085.
Chepuri NB, Yen YF, Burdette JH, Li H, Moody DM, Maldjian JA (2002) Diffusion anisotropy in the corpus callosum. AJNR Am J Neuroradiol 23:803-808.
Chklovskii DB, Mel BW, Svoboda K (2004) Cortical rewiring and information storage. Nature 431:782-788.
Chuma T (2007) Rehabilitation for patients with Parkinson's disease. Journal of neurology 254 Suppl 4:IV58-IV61.
Chung HW, Chou MC, Chen CY (2011) Principles and limitations of computational algorithms in clinical diffusion tensor MR tractography. AJNR American journal of neuroradiology 32:3-13.
Chung SC, Lee BY, Tack GR, Lee SY, Eom JS, Sohn JH (2005) Effects of age, gender, and weight on the cerebellar volume of Korean people. Brain research 1042:233-235.
Ciccarelli O, Parker GJ, Toosy AT, Wheeler-Kingshott CA, Barker GJ, Boulby PA, Miller DH, Thompson AJ (2003) From diffusion tractography to quantitative white matter tract measures: a reproducibility study. NeuroImage 18:348-359.
Cipolloni PB, Pandya DN (1985) Topography and trajectories of commissural fibers of the superior temporal region in the rhesus monkey. Experimental brain research Experimentelle Hirnforschung 57:381-389.

References
274
Cirillo M, Esposito F, Tedeschi G, Caiazzo G, Sagnelli A, Piccirillo G, Conforti R, Tortora F, Monsurro MR, Cirillo S, Trojsi F (2012) Widespread Microstructural White Matter Involvement in Amyotrophic Lateral Sclerosis: A Whole-Brain DTI Study. AJNR American journal of neuroradiology.
Clarke JM, Zaidel E (1994) Anatomical-behavioral relationships: corpus callosum morphometry and hemispheric specialization. Behavioural brain research 64:185-202.
Clarke S, Kraftsik R, Van der Loos H, Innocenti GM (1989) Forms and measures of adult and developing human corpus callosum: is there sexual dimorphism? J Comp Neurol 280:213-230.
Cohen JD, Botvinick M, Carter CS (2000) Anterior cingulate and prefrontal cortex: who's in control? Nature neuroscience 3:421-423.
Colcombe SJ, Erickson KI, Scalf PE, Kim JS, Prakash R, McAuley E, Elavsky S, Marquez DX, Hu L, Kramer AF (2006) Aerobic exercise training increases brain volume in aging humans. The journals of gerontology Series A, Biological sciences and medical sciences 61:1166-1170.
Collingridge GL, Isaac JT, Wang YT (2004) Receptor trafficking and synaptic plasticity. Nature reviews Neuroscience 5:952-962.
Concha L, Livy DJ, Beaulieu C, Wheatley BM, Gross DW (2010) In vivo diffusion tensor imaging and histopathology of the fimbria-fornix in temporal lobe epilepsy. The Journal of neuroscience : the official journal of the Society for Neuroscience 30:996-1002.
Cone NE, Burman DD, Bitan T, Bolger DJ, Booth JR (2008) Developmental changes in brain regions involved in phonological and orthographic processing during spoken language processing. Neuroimage 41:623-635.
Connor S, Williams PT, Armstrong B, Petit TL, Ivanco TL, Weeks AC (2006) Long-term potentiation is associated with changes in synaptic ultrastructure in the rat neocortex. Synapse 59:378-382.
Conturo TE, Lori NF, Cull TS, Akbudak E, Snyder AZ, Shimony JS, McKinstry RC, Burton H, Raichle ME (1999) Tracking neuronal fiber pathways in the living human brain. Proceedings of the National Academy of Sciences of the United States of America 96:10422-10427.
Correia S, Lee SY, Voorn T, Tate DF, Paul RH, Zhang S, Salloway SP, Malloy PF, Laidlaw DH (2008) Quantitative tractography metrics of white matter integrity in diffusion-tensor MRI. Neuroimage 42:568-581.
Costa-Giomi E, Gilmour R, Siddell J, Lefebvre E (2001) Absolute pitch, early musical instruction, and spatial abilities. Ann N Y Acad Sci 930:394-396.
Cowell PE, Allen LS, Zalatimo NS, Denenberg VH (1992) A developmental study of sex and age interactions in the human corpus callosum. Brain research Developmental brain research 66:187-192.
Cowell PE, Kertesz A, Denenberg VH (1993) Multiple dimensions of handedness and the human corpus callosum. Neurology 43:2353-2357.
Crum WR, Griffin LD, Hill DL, Hawkes DJ (2003) Zen and the art of medical image registration: correspondence, homology, and quality. NeuroImage 20:1425-1437.
Cui Y, Jin J, Zhang X, Xu H, Yang L, Du D, Zeng Q, Tsien JZ, Yu H, Cao X (2011) Forebrain NR2B overexpression facilitating the prefrontal cortex long-term potentiation and enhancing working memory function in mice. PloS one 6:e20312.
Cuppini R, Sartini S, Agostini D, Guescini M, Ambrogini P, Betti M, Bertini L, Vallasciani M, Stocchi V (2007) Bdnf expression in rat skeletal muscle after acute or repeated exercise. Archives italiennes de biologie 145:99-110.
D'Arceuil HE, Westmoreland S, de Crespigny AJ (2007) An approach to high resolution diffusion tensor imaging in fixed primate brain. NeuroImage 35:553-565.
Dauguet J, Peled S, Berezovskii V, Delzescaux T, Warfield SK, Born R, Westin CF (2006) 3D histological reconstruction of fiber tracts and direct comparison with diffusion tensor MRI tractography. Medical image computing and computer-assisted intervention : MICCAI International Conference on Medical Image Computing and Computer-Assisted Intervention 9:109-116.

References
275
Dauguet J, Peled S, Berezovskii V, Delzescaux T, Warfield SK, Born R, Westin CF (2007) Comparison of fiber tracts derived from in-vivo DTI tractography with 3D histological neural tract tracer reconstruction on a macaque brain. NeuroImage 37:530-538.
de Lacoste MC, Kirkpatrick JB, Ross ED (1985) Topography of the human corpus callosum. J Neuropathol Exp Neurol 44:578-591.
De Paola V, Holtmaat A, Knott G, Song S, Wilbrecht L, Caroni P, Svoboda K (2006) Cell type-specific structural plasticity of axonal branches and boutons in the adult neocortex. Neuron 49:861-875.
De Zeeuw CI, Yeo CH (2005) Time and tide in cerebellar memory formation. Current opinion in neurobiology 15:667-674.
Deiber MP, Passingham RE, Colebatch JG, Friston KJ, Nixon PD, Frackowiak RS (1991) Cortical areas and the selection of movement: a study with positron emission tomography. Experimental brain research Experimentelle Hirnforschung 84:393-402.
Deichmann R, Schwarzbauer C, Turner R (2004) Optimisation of the 3D MDEFT sequence for anatomical brain imaging: technical implications at 1.5 and 3 T. NeuroImage 21:757-767.
Della Nave R, Ginestroni A, Tessa C, Salvatore E, Bartolomei I, Salvi F, Dotti MT, De Michele G, Piacentini S, Mascalchi M (2008) Brain white matter tracts degeneration in Friedreich ataxia. An in vivo MRI study using tract-based spatial statistics and voxel-based morphometry. Neuroimage 40:19-25.
Demb JB, Desmond JE, Wagner AD, Vaidya CJ, Glover GH, Gabrieli JD (1995) Semantic encoding and retrieval in the left inferior prefrontal cortex: a functional MRI study of task difficulty and process specificity. J Neurosci 15:5870-5878.
Demonet JF, Chollet F, Ramsay S, Cardebat D, Nespoulous JL, Wise R, Rascol A, Frackowiak R (1992) The anatomy of phonological and semantic processing in normal subjects. Brain 115 ( Pt 6):1753-1768.
Denenberg VH, Cowell PE, Fitch RH, Kertesz A, Kenner GH (1991a) Corpus callosum: multiple parameter measurements in rodents and humans. Physiol Behav 49:433-437.
Denenberg VH, Kertesz A, Cowell PE (1991b) A factor analysis of the human's corpus callosum. Brain research 548:126-132.
Denk W, Strickler JH, Webb WW (1990) Two-photon laser scanning fluorescence microscopy. Science 248:73-76.
Dhanushkodi A, Bindu B, Raju TR, Kutty BM (2007) Exposure to enriched environment improves spatial learning performances and enhances cell density but not choline acetyltransferase activity in the hippocampus of ventral subicular-lesioned rats. Behavioral neuroscience 121:491-500.
Dietrich O, Heiland S, Sartor K (2001) Noise correction for the exact determination of apparent diffusion coefficients at low SNR. Magnetic resonance in medicine : official journal of the Society of Magnetic Resonance in Medicine / Society of Magnetic Resonance in Medicine 45:448-453.
Doherty CP, Fitzsimons M, Holohan T, Mohamed HB, Farrell M, Meredith GE, Staunton H (2000) Accuracy and validity of stereology as a quantitative method for assessment of human temporal lobe volumes acquired by magnetic resonance imaging. Magnetic resonance imaging 18:1017-1025.
Doyon J, Penhune V, Ungerleider LG (2003) Distinct contribution of the cortico-striatal and cortico-cerebellar systems to motor skill learning. Neuropsychologia 41:252-262.
Doyon J, Song AW, Karni A, Lalonde F, Adams MM, Ungerleider LG (2002) Experience-dependent changes in cerebellar contributions to motor sequence learning. Proceedings of the National Academy of Sciences of the United States of America 99:1017-1022.
Draganski B, Gaser C, Busch V, Schuierer G, Bogdahn U, May A (2004) Neuroplasticity: changes in grey matter induced by training. Nature 427:311-312.
Drobyshevsky A, Song SK, Gamkrelidze G, Wyrwicz AM, Derrick M, Meng F, Li L, Ji X, Trommer B, Beardsley DJ, Luo NL, Back SA, Tan S (2005) Developmental changes in diffusion anisotropy coincide with immature oligodendrocyte

References
276
progression and maturation of compound action potential. J Neurosci 25:5988-5997.
Dronkers NF, Plaisant O, Iba-Zizen MT, Cabanis EA (2007) Paul Broca's historic cases: high resolution MR imaging of the brains of Leborgne and Lelong. Brain : a journal of neurology 130:1432-1441.
Duchesne N, Soucy JP, Masson H, Chouinard S, Bedard MA (2002) Cognitive deficits and striatal dopaminergic denervation in Parkinson's disease: a single photon emission computed tomography study using 123iodine-beta-CIT in patients on and off levodopa. Clin Neuropharmacol 25:216-224.
Duffau H, Capelle L, Denvil D, Gatignol P, Sichez N, Lopes M, Sichez JP, Van Effenterre R (2003) The role of dominant premotor cortex in language: a study using intraoperative functional mapping in awake patients. Neuroimage 20:1903-1914.
Duvernoy H (1999) The human brain. Surface, blood supply and three-dimensional sectional anatomy. New York: Springer.
Duyn JH (2010) Study of brain anatomy with high-field MRI: recent progress. Magnetic resonance imaging 28:1210-1215.
Dyrby TB, Sogaard LV, Parker GJ, Alexander DC, Lind NM, Baare WF, Hay-Schmidt A, Eriksen N, Pakkenberg B, Paulson OB, Jelsing J (2007) Validation of in vitro probabilistic tractography. NeuroImage 37:1267-1277.
Einstein A (1956) Investigations on the theory of the Brownian movement. New York: Dover Publications.
Elbert T, Pantev C, Wienbruch C, Rockstroh B, Taub E (1995) Increased cortical representation of the fingers of the left hand in string players. Science 270:305-307.
Eluvathingal TJ, Hasan KM, Kramer L, Fletcher JM, Ewing-Cobbs L (2007) Quantitative diffusion tensor tractography of association and projection fibers in normally developing children and adolescents. Cereb Cortex 17:2760-2768.
Embleton KV, Haroon HA, Morris DM, Ralph MA, Parker GJ (2010) Distortion correction for diffusion-weighted MRI tractography and fMRI in the temporal lobes. Human brain mapping 31:1570-1587.
Engvig A, Fjell AM, Westlye LT, Moberget T, Sundseth O, Larsen VA, Walhovd KB (2010) Effects of memory training on cortical thickness in the elderly. NeuroImage 52:1667-1676.
Epp JR, Haack AK, Galea LA (2010) Task difficulty in the Morris water task influences the survival of new neurons in the dentate gyrus. Hippocampus 20:866-876.
Eriksson PS (2003) Neurogenesis and its implications for regeneration in the adult brain. Journal of rehabilitation medicine : official journal of the UEMS European Board of Physical and Rehabilitation Medicine 17-19.
Eriksson PS, Perfilieva E, Bjork-Eriksson T, Alborn AM, Nordborg C, Peterson DA, Gage FH (1998) Neurogenesis in the adult human hippocampus. Nature medicine 4:1313-1317.
Escalona PR, McDonald WM, Doraiswamy PM, Boyko OB, Husain MM, Figiel GS, Laskowitz D, Ellinwood EH, Jr., Krishnan KR (1991) In vivo stereological assessment of human cerebellar volume: effects of gender and age. AJNR American journal of neuroradiology 12:927-929.
Etkin A, Alarcon JM, Weisberg SP, Touzani K, Huang YY, Nordheim A, Kandel ER (2006) A role in learning for SRF: deletion in the adult forebrain disrupts LTD and the formation of an immediate memory of a novel context. Neuron 50:127-143.
Evers S, Dannert J, Rodding D, Rotter G, Ringelstein EB (1999) The cerebral haemodynamics of music perception. A transcranial Doppler sonography study. Brain : a journal of neurology 122 ( Pt 1):75-85.
Fadiga L, Craighero L, Buccino G, Rizzolatti G (2002) Speech listening specifically modulates the excitability of tongue muscles: a TMS study. Eur J Neurosci 15:399-402.
Feczko E, Augustinack JC, Fischl B, Dickerson BC (2009) An MRI-based method for measuring volume, thickness and surface area of entorhinal, perirhinal, and posterior parahippocampal cortex. Neurobiology of aging 30:420-431.

References
277
Feldman DE (2009) Synaptic mechanisms for plasticity in neocortex. Annual review of neuroscience 32:33-55.
Ferguson GD, Wang H, Herschman HR, Storm DR (2004) Altered hippocampal short-term plasticity and associative memory in synaptotagmin IV (-/-) mice. Hippocampus 14:964-974.
Ferreira AF, Real CC, Rodrigues AC, Alves AS, Britto LR (2010) Moderate exercise changes synaptic and cytoskeletal proteins in motor regions of the rat brain. Brain research 1361:31-42.
Filipek PA, Richelme C, Kennedy DN, Caviness VS, Jr. (1994) The young adult human brain: an MRI-based morphometric analysis. Cereb Cortex 4:344-360.
Filippi M, Cercignani M, Inglese M, Horsfield MA, Comi G (2001) Diffusion tensor magnetic resonance imaging in multiple sclerosis. Neurology 56:304-311.
Fischl B, Dale AM (2000) Measuring the thickness of the human cerebral cortex from magnetic resonance images. Proceedings of the National Academy of Sciences of the United States of America 97:11050-11055.
Fischl B, Salat DH, Busa E, Albert M, Dieterich M, Haselgrove C, van der Kouwe A, Killiany R, Kennedy D, Klaveness S, Montillo A, Makris N, Rosen B, Dale AM (2002) Whole brain segmentation: automated labeling of neuroanatomical structures in the human brain. Neuron 33:341-355.
Fischl B, Salat DH, van der Kouwe AJ, Makris N, Segonne F, Quinn BT, Dale AM (2004) Sequence-independent segmentation of magnetic resonance images. NeuroImage 23 Suppl 1:S69-84.
Fischl B, Sereno MI, Dale AM (1999a) Cortical surface-based analysis. II: Inflation, flattening, and a surface-based coordinate system. NeuroImage 9:195-207.
Fischl B, Sereno MI, Tootell RB, Dale AM (1999b) High-resolution intersubject averaging and a coordinate system for the cortical surface. Human brain mapping 8:272-284.
Flament D, Ellermann JM, Kim SG, Ugurbil K, Ebner TJ (1996) Functional magnetic resonance imaging of cerebellar activation during the learning of a visuomotor dissociation task. Hum Brain Mapp 4:210-226.
Forrester LW, Wheaton LA, Luft AR (2008) Exercise-mediated locomotor recovery and lower-limb neuroplasticity after stroke. Journal of rehabilitation research and development 45:205-220.
Foster NE, Zatorre RJ Cortical structure predicts success in performing musical transformation judgments. Neuroimage 53:26-36.
Foundas AL, Eure KF, Luevano LF, Weinberger DR (1998) MRI asymmetries of Broca's area: the pars triangularis and pars opercularis. Brain and language 64:282-296.
Fowler CD, Liu Y, Ouimet C, Wang Z (2002) The effects of social environment on adult neurogenesis in the female prairie vole. J Neurobiol 51:115-128.
Frank LR (2002) Characterization of anisotropy in high angular resolution diffusion-weighted MRI. Magnetic resonance in medicine : official journal of the Society of Magnetic Resonance in Medicine / Society of Magnetic Resonance in Medicine 47:1083-1099.
Frey U, Morris RG (1997) Synaptic tagging and long-term potentiation. Nature 385:533-536.
Friederici AD, Opitz B, von Cramon DY (2000) Segregating semantic and syntactic aspects of processing in the human brain: an fMRI investigation of different word types. Cereb Cortex 10:698-705.
Frings M, Maschke M, Gerwig M, Diener HC, Timmann D (2006) Acquisition of simple auditory and visual sequences in cerebellar patients. Cerebellum 5:206-211.
Frye RE, Hasan K, Xue L, Strickland D, Malmberg B, Liederman J, Papanicolaou A (2008) Splenium microstructure is related to two dimensions of reading skill. Neuroreport 19:1627-1631.
Fryer SL, Frank LR, Spadoni AD, Theilmann RJ, Nagel BJ, Schweinsburg AD, Tapert SF (2008) Microstructural integrity of the corpus callosum linked with neuropsychological performance in adolescents. Brain Cogn 67:225-233.
Fujii S, Oda S (2006) Tapping speed asymmetry in drummers for single-hand tapping with a stick. Perceptual and motor skills 103:265-272.

References
278
Gaab N, Schlaug G (2003) Musicians differ from nonmusicians in brain activation despite performance matching. Ann N Y Acad Sci 999:385-388.
Gage FH (2002) Neurogenesis in the adult brain. The Journal of neuroscience : the official journal of the Society for Neuroscience 22:612-613.
Gama RL, Tavora DF, Bomfim RC, Silva CE, Bruin VM, Bruin PF (2010) Morphometry MRI in the differential diagnosis of parkinsonian syndromes. Arq Neuropsiquiatr 68:333-338.
Gao JH, Parsons LM, Bower JM, Xiong J, Li J, Fox PT (1996) Cerebellum implicated in sensory acquisition and discrimination rather than motor control. Science 272:545-547.
Garcia-Finana M, Cruz-Orive LM, Mackay CE, Pakkenberg B, Roberts N (2003) Comparison of MR imaging against physical sectioning to estimate the volume of human cerebral compartments. NeuroImage 18:505-516.
Gardiner MF, Fox A, Knowles F, Jeffrey D (1996) Learning improved by arts training. Nature 381:284.
Gaser C, Schlaug G (2003a) Brain structures differ between musicians and non-musicians. The Journal of neuroscience : the official journal of the Society for Neuroscience 23:9240-9245.
Gaser C, Schlaug G (2003b) Gray matter differences between musicians and nonmusicians. Annals of the New York Academy of Sciences 999:514-517.
Geinisman Y (2000) Structural synaptic modifications associated with hippocampal LTP and behavioral learning. Cereb Cortex 10:952-962.
Geschwind N (1970) The organization of language and the brain. Science 170:940-944. Giedd JN, Blumenthal J, Jeffries NO, Rajapakse JC, Vaituzis AC, Liu H, Berry YC,
Tobin M, Nelson J, Castellanos FX (1999) Development of the human corpus callosum during childhood and adolescence: a longitudinal MRI study. Prog Neuropsychopharmacol Biol Psychiatry 23:571-588.
Giedd JN, Rumsey JM, Castellanos FX, Rajapakse JC, Kaysen D, Vaituzis AC, Vauss YC, Hamburger SD, Rapoport JL (1996) A quantitative MRI study of the corpus callosum in children and adolescents. Brain Res Dev Brain Res 91:274-280.
Giedd JN, Stockman M, Weddle C, Liverpool M, Alexander-Bloch A, Wallace GL, Lee NR, Lalonde F, Lenroot RK (2010) Anatomic magnetic resonance imaging of the developing child and adolescent brain and effects of genetic variation. Neuropsychol Rev 20:349-361.
Glickstein M, Doron K (2008) Cerebellum: connections and functions. Cerebellum 7:589-594.
Glickstein M, May JG, 3rd, Mercier BE (1985) Corticopontine projection in the macaque: the distribution of labelled cortical cells after large injections of horseradish peroxidase in the pontine nuclei. J Comp Neurol 235:343-359.
Globus A, Rosenzweig MR, Bennett EL, Diamond MC (1973) Effects of differential experience on dendritic spine counts in rat cerebral cortex. Journal of comparative and physiological psychology 82:175-181.
Goebel R, Esposito F, Formisano E (2006) Analysis of functional image analysis contest (FIAC) data with brainvoyager QX: From single-subject to cortically aligned group general linear model analysis and self-organizing group independent component analysis. Human brain mapping 27:392-401.
Golestani N, Molko N, Dehaene S, LeBihan D, Pallier C (2007) Brain structure predicts the learning of foreign speech sounds. Cereb Cortex 17:575-582.
Golestani N, Pallier C (2007) Anatomical correlates of foreign speech sound production. Cereb Cortex 17:929-934.
Golestani N, Paus T, Zatorre RJ (2002) Anatomical correlates of learning novel speech sounds. Neuron 35:997-1010.
Gong QY, Sluming V, Mayes A, Keller S, Barrick T, Cezayirli E, Roberts N (2005) Voxel-based morphometry and stereology provide convergent evidence of the importance of medial prefrontal cortex for fluid intelligence in healthy adults. NeuroImage 25:1175-1186.
Good CD, Johnsrude I, Ashburner J, Henson RN, Friston KJ, Frackowiak RS (2001a) Cerebral asymmetry and the effects of sex and handedness on brain structure: a voxel-based morphometric analysis of 465 normal adult human brains. NeuroImage 14:685-700.

References
279
Good CD, Johnsrude IS, Ashburner J, Henson RN, Friston KJ, Frackowiak RS (2001b) A voxel-based morphometric study of ageing in 465 normal adult human brains. NeuroImage 14:21-36.
Gordon HW (1980) Degree of ear asymmetries for perception of dichotic chords and for illusory chord localization in musicians of different levels of competence. Journal of experimental psychology Human perception and performance 6:516-527.
Goswami U, Thomson J, Richardson U, Stainthorp R, Hughes D, Rosen S, Scott SK (2002) Amplitude envelope onsets and developmental dyslexia: A new hypothesis. Proceedings of the National Academy of Sciences of the United States of America 99:10911-10916.
Gould E, Beylin A, Tanapat P, Reeves A, Shors TJ (1999a) Learning enhances adult neurogenesis in the hippocampal formation. Nature neuroscience 2:260-265.
Gould E, Reeves AJ, Graziano MS, Gross CG (1999b) Neurogenesis in the neocortex of adult primates. Science 286:548-552.
Green EJ, Greenough WT, Schlumpf BE (1983) Effects of complex or isolated environments on cortical dendrites of middle-aged rats. Brain research 264:233-240.
Greenough WT, Juraska JM, Volkmar FR (1979) Maze training effects on dendritic branching in occipital cortex of adult rats. Behavioral and neural biology 26:287-297.
Greenough WT, Larson JR, Withers GS (1985) Effects of unilateral and bilateral training in a reaching task on dendritic branching of neurons in the rat motor-sensory forelimb cortex. Behavioral and neural biology 44:301-314.
Greenough WT, Volkmar FR (1973) Pattern of dendritic branching in occipital cortex of rats reared in complex environments. Experimental neurology 40:491-504.
Griffiths TD, Buchel C, Frackowiak RS, Patterson RD (1998) Analysis of temporal structure in sound by the human brain. Nature neuroscience 1:422-427.
Gundersen H, Jenson E (1987) The efficiency in systematic sampling in stereology and its prediction. Journal of Microscopy 147:229-263.
Gundersen H, Osterby R (1981) Optimising sampling efficiency of stereological studies in biology: or "Do mor less well". Journal of Microscopy 121:65-73.
Gundersen HJ, Jensen EB (1987) The efficiency of systematic sampling in stereology and its prediction. J Microsc 147:229-263.
Habib M, Gayraud D, Oliva A, Regis J, Salamon G, Khalil R (1991) Effects of handedness and sex on the morphology of the corpus callosum: a study with brain magnetic resonance imaging. Brain and cognition 16:41-61.
Hallam BJ, Brown WS, Ross C, Buckwalter JG, Bigler ED, Tschanz JT, Norton MC, Welsh-Bohmer KA, Breitner JC (2008) Regional atrophy of the corpus callosum in dementia. J Int Neuropsychol Soc 14:414-423.
Hampel H, Teipel SJ, Alexander GE, Horwitz B, Teichberg D, Schapiro MB, Rapoport SI (1998) Corpus callosum atrophy is a possible indicator of region- and cell type-specific neuronal degeneration in Alzheimer disease: a magnetic resonance imaging analysis. Arch Neurol 55:193-198.
Han Y, Yang H, Lv YT, Zhu CZ, He Y, Tang HH, Gong QY, Luo YJ, Zang YF, Dong Q (2009) Gray matter density and white matter integrity in pianists' brain: a combined structural and diffusion tensor MRI study. Neurosci Lett 459:3-6.
Hara Y, Rapp PR, Morrison JH (2011) Neuronal and morphological bases of cognitive decline in aged rhesus monkeys. Age (Dordr).
Hasan KM, Ewing-Cobbs L, Kramer LA, Fletcher JM, Narayana PA (2008a) Diffusion tensor quantification of the macrostructure and microstructure of human midsagittal corpus callosum across the lifespan. NMR Biomed 21:1094-1101.
Hasan KM, Kamali A, Iftikhar A, Kramer LA, Papanicolaou AC, Fletcher JM, Ewing-Cobbs L (2009) Diffusion tensor tractography quantification of the human corpus callosum fiber pathways across the lifespan. Brain Res 1249:91-100.
Hasan KM, Kamali A, Kramer LA, Papnicolaou AC, Fletcher JM, Ewing-Cobbs L (2008b) Diffusion tensor quantification of the human midsagittal corpus callosum subdivisions across the lifespan. Brain Res 1227:52-67.
Haslinger B, Erhard P, Altenmuller E, Hennenlotter A, Schwaiger M, Grafin von Einsiedel H, Rummeny E, Conrad B, Ceballos-Baumann AO (2004) Reduced
References
280
recruitment of motor association areas during bimanual coordination in concert pianists. Human brain mapping 22:206-215.
Haslinger B, Erhard P, Altenmuller E, Schroeder U, Boecker H, Ceballos-Baumann AO (2005) Transmodal sensorimotor networks during action observation in professional pianists. Journal of cognitive neuroscience 17:282-293.
Hassler M (2000) Music medicine. A neurobiological approach. Neuro Endocrinol Lett 21:101-106.
Hattingen E, Rathert J, Jurcoane A, Weidauer S, Szelenyi A, Ogrezeanu G, Seifert V, Zanella FE, Gasser T (2009) A standardised evaluation of pre-surgical imaging of the corticospinal tract: where to place the seed ROI. Neurosurgical review 32:445-456.
Haueisen J, Knosche TR (2001) Involuntary motor activity in pianists evoked by music perception. J Cogn Neurosci 13:786-792.
Haug H (1987) Brain sizes, surfaces, and neuronal sizes of the cortex cerebri: a stereological investigation of man and his variability and a comparison with some mammals (primates, whales, marsupials, insectivores, and one elephant). Am J Anat 180:126-142.
Hauser MD, Chomsky N, Fitch WT (2002) The faculty of language: what is it, who has it, and how did it evolve? Science 298:1569-1579.
Hebb D (1947) The effects of early experience on problem-solving at maturity. Am Psychol 2:306-307.
Heiser M, Iacoboni M, Maeda F, Marcus J, Mazziotta JC (2003) The essential role of Broca's area in imitation. The European journal of neuroscience 17:1123-1128.
Helmchen C, Klinkenstein JC, Kruger A, Gliemroth J, Mohr C, Sander T (2011) Structural brain changes following peripheral vestibulo-cochlear lesion may indicate multisensory compensation. Journal of neurology, neurosurgery, and psychiatry 82:309-316.
Henery CC, Mayhew TM (1989) The cerebrum and cerebellum of the fixed human brain: efficient and unbiased estimates of volumes and cortical surface areas. J Anat 167:167-180.
Herve PY, Crivello F, Perchey G, Mazoyer B, Tzourio-Mazoyer N (2006) Handedness and cerebral anatomical asymmetries in young adult males. NeuroImage 29:1066-1079.
Highley JR, Esiri MM, McDonald B, Cortina-Borja M, Herron BM, Crow TJ (1999) The size and fibre composition of the corpus callosum with respect to gender and schizophrenia: a post-mortem study. Brain : a journal of neurology 122 ( Pt 1):99-110.
Hihara S, Notoya T, Tanaka M, Ichinose S, Ojima H, Obayashi S, Fujii N, Iriki A (2006) Extension of corticocortical afferents into the anterior bank of the intraparietal sulcus by tool-use training in adult monkeys. Neuropsychologia 44:2636-2646.
Ho YC, Cheung MC, Chan AS (2003) Music training improves verbal but not visual memory: cross-sectional and longitudinal explorations in children. Neuropsychology 17:439-450.
Hofer S, Frahm J (2006) Topography of the human corpus callosum revisited--comprehensive fiber tractography using diffusion tensor magnetic resonance imaging. NeuroImage 32:989-994.
Holland RL, Brown MC (1980) Postsynaptic transmission block can cause terminal sprouting of a motor nerve. Science 207:649-651.
Holloway RL, de Lacoste MC (1986) Sexual dimorphism in the human corpus callosum: an extension and replication study. Hum Neurobiol 5:87-91.
Holtmaat A, Wilbrecht L, Knott GW, Welker E, Svoboda K (2006) Experience-dependent and cell-type-specific spine growth in the neocortex. Nature 441:979-983.
Hosomi A, Nagakane Y, Yamada K, Kuriyama N, Mizuno T, Nishimura T, Nakagawa M (2009) Assessment of arcuate fasciculus with diffusion-tensor tractography may predict the prognosis of aphasia in patients with left middle cerebral artery infarcts. Neuroradiology 51:549-555.
Howard C, Reed M (1998) Unbiased Stereology: Three-Dimensional Measurement in Microscopy. Oxford: BIOS Scientific Publishers.

References
281
Hsu WC, Lai HL (2004) Effects of music on major depression in psychiatric inpatients. Arch Psychiatr Nurs 18:193-199.
Huang H, Zhang J, Jiang H, Wakana S, Poetscher L, Miller MI, van Zijl PC, Hillis AE, Wytik R, Mori S (2005) DTI tractography based parcellation of white matter: application to the mid-sagittal morphology of corpus callosum. NeuroImage 26:195-205.
Huang H, Zhang J, van Zijl PC, Mori S (2004) Analysis of noise effects on DTI-based tractography using the brute-force and multi-ROI approach. Magnetic resonance in medicine : official journal of the Society of Magnetic Resonance in Medicine / Society of Magnetic Resonance in Medicine 52:559-565.
Huang YY, Nguyen PV, Abel T, Kandel ER (1996) Long-lasting forms of synaptic potentiation in the mammalian hippocampus. Learn Mem 3:74-85.
Huang Z, Zhang JX, Yang Z, Dong G, Wu J, Chan AS, Weng X (2010) Verbal memory retrieval engages visual cortex in musicians. Neuroscience 168:179-189.
Hubel DH, Wiesel TN (1965) Binocular interaction in striate cortex of kittens reared with artificial squint. Journal of neurophysiology 28:1041-1059.
Hughes CM, Franz EA (2007) Experience-dependent effects in unimanual and bimanual reaction time tasks in musicians. J Mot Behav 39:3-8.
Hund-Georgiadis M, von Cramon DY (1999) Motor-learning-related changes in piano players and non-musicians revealed by functional magnetic-resonance signals. Exp Brain Res 125:417-425.
Huster RJ, Westerhausen R, Herrmann CS (2011) Sex differences in cognitive control are associated with midcingulate and callosal morphology. Brain structure & function 215:225-235.
Hutchinson AD, Mathias JL, Jacobson BL, Ruzic L, Bond AN, Banich MT (2009) Relationship between intelligence and the size and composition of the corpus callosum. Experimental brain research Experimentelle Hirnforschung Experimentation cerebrale 192:455-464.
Hutchinson S, Lee LH, Gaab N, Schlaug G (2003) Cerebellar volume of musicians. Cereb Cortex 13:943-949.
Hynd GW, Hall J, Novey ES, Eliopulos D, Black K, Gonzalez JJ, Edmonds JE, Riccio C, Cohen M (1995) Dyslexia and corpus callosum morphology. Arch Neurol 52:32-38.
Iacconi C, Giannelli M, Marini C, Cilotti A, Moretti M, Viacava P, Picano E, Michelotti A, Caramella D (2010) The role of mean diffusivity (MD) as a predictive index of the response to chemotherapy in locally advanced breast cancer: a preliminary study. European radiology 20:303-308.
Iacoboni M, Woods RP, Brass M, Bekkering H, Mazziotta JC, Rizzolatti G (1999) Cortical mechanisms of human imitation. Science 286:2526-2528.
Imamizu H, Miyauchi S, Tamada T, Sasaki Y, Takino R, Putz B, Yoshioka T, Kawato M (2000) Human cerebellar activity reflecting an acquired internal model of a new tool. Nature 403:192-195.
Imfeld A, Oechslin MS, Meyer M, Loenneker T, Jancke L (2009) White matter plasticity in the corticospinal tract of musicians: a diffusion tensor imaging study. NeuroImage 46:600-607.
Irish M, Cunningham CJ, Walsh JB, Coakley D, Lawlor BA, Robertson IH, Coen RF (2006) Investigating the enhancing effect of music on autobiographical memory in mild Alzheimer's disease. Dement Geriatr Cogn Disord 22:108-120.
Ito M (1989) Long-term depression. Annual review of neuroscience 12:85-102. Jancke L, Koeneke S, Hoppe A, Rominger C, Hanggi J (2009) The architecture of the
golfer's brain. PloS one 4:e4785. Jancke L, Schlaug G, Steinmetz H (1997) Hand skill asymmetry in professional
musicians. Brain and cognition 34:424-432. Jancke L, Shah NJ, Peters M (2000) Cortical activations in primary and secondary
motor areas for complex bimanual movements in professional pianists. Brain Res Cogn Brain Res 10:177-183.
Jansen A, Floel A, Van Randenborgh J, Konrad C, Rotte M, Forster AF, Deppe M, Knecht S (2005) Crossed cerebro-cerebellar language dominance. Human brain mapping 24:165-172.

References
282
Jeannerod M, Decety J, Michel F (1994) Impairment of grasping movements following a bilateral posterior parietal lesion. Neuropsychologia 32:369-380.
Jellison BJ, Field AS, Medow J, Lazar M, Salamat MS, Alexander AL (2004) Diffusion tensor imaging of cerebral white matter: a pictorial review of physics, fiber tract anatomy, and tumor imaging patterns. AJNR American journal of neuroradiology 25:356-369.
Jenkins IH, Brooks DJ, Nixon PD, Frackowiak RS, Passingham RE (1994) Motor sequence learning: a study with positron emission tomography. The Journal of neuroscience : the official journal of the Society for Neuroscience 14:3775-3790.
Jeong HK, Anderson AW (2008) Characterizing fiber directional uncertainty in diffusion tensor MRI. Magnetic resonance in medicine : official journal of the Society of Magnetic Resonance in Medicine / Society of Magnetic Resonance in Medicine 60:1408-1421.
Jernigan TL, Archibald SL, Berhow MT, Sowell ER, Foster DS, Hesselink JR (1991) Cerebral structure on MRI, Part I: Localization of age-related changes. Biological psychiatry 29:55-67.
Jeurissen B, Leemans A, Jones DK, Tournier JD, Sijbers J (2011) Probabilistic fiber tracking using the residual bootstrap with constrained spherical deconvolution. Human brain mapping 32:461-479.
Jezzard P, Balaban RS (1995) Correction for geometric distortion in echo planar images from B0 field variations. Magnetic resonance in medicine : official journal of the Society of Magnetic Resonance in Medicine / Society of Magnetic Resonance in Medicine 34:65-73.
Johnson-Frey SH, Maloof FR, Newman-Norlund R, Farrer C, Inati S, Grafton ST (2003) Actions or hand-object interactions? Human inferior frontal cortex and action observation. Neuron 39:1053-1058.
Johnson PR (1977) Dichotically-stimulated ear differences in musicians and nonmusicians. Cortex; a journal devoted to the study of the nervous system and behavior 13:385-389.
Johnsrude IS, Penhune VB, Zatorre RJ (2000) Functional specificity in the right human auditory cortex for perceiving pitch direction. Brain 123 ( Pt 1):155-163.
Jones DK (2003) Determining and visualizing uncertainty in estimates of fiber orientation from diffusion tensor MRI. Magnetic resonance in medicine : official journal of the Society of Magnetic Resonance in Medicine / Society of Magnetic Resonance in Medicine 49:7-12.
Jones DK (2004) The effect of gradient sampling schemes on measures derived from diffusion tensor MRI: a Monte Carlo study. Magnetic resonance in medicine : official journal of the Society of Magnetic Resonance in Medicine / Society of Magnetic Resonance in Medicine 51:807-815.
Jones DK, Basser PJ (2004) "Squashing peanuts and smashing pumpkins": how noise distorts diffusion-weighted MR data. Magnetic resonance in medicine : official journal of the Society of Magnetic Resonance in Medicine / Society of Magnetic Resonance in Medicine 52:979-993.
Jones DK, Catani M, Pierpaoli C, Reeves SJ, Shergill SS, O'Sullivan M, Golesworthy P, McGuire P, Horsfield MA, Simmons A, Williams SC, Howard RJ (2006) Age effects on diffusion tensor magnetic resonance imaging tractography measures of frontal cortex connections in schizophrenia. Hum Brain Mapp 27:230-238.
Jones DK, Cercignani M (2010) Twenty-five pitfalls in the analysis of diffusion MRI data. NMR in biomedicine 23:803-820.
Jones DK, Horsfield MA, Simmons A (1999a) Optimal strategies for measuring diffusion in anisotropic systems by magnetic resonance imaging. Magnetic resonance in medicine : official journal of the Society of Magnetic Resonance in Medicine / Society of Magnetic Resonance in Medicine 42:515-525.
Jones DK, Simmons A, Williams SC, Horsfield MA (1999b) Non-invasive assessment of axonal fiber connectivity in the human brain via diffusion tensor MRI. Magnetic resonance in medicine : official journal of the Society of Magnetic Resonance in Medicine / Society of Magnetic Resonance in Medicine 42:37-41.

References
283
Jones DK, Williams SC, Gasston D, Horsfield MA, Simmons A, Howard R (2002) Isotropic resolution diffusion tensor imaging with whole brain acquisition in a clinically acceptable time. Human brain mapping 15:216-230.
Joshi AA, Lepore N, Joshi SH, Lee AD, Barysheva M, Stein JL, McMahon KL, Johnson K, de Zubicaray GI, Martin NG, Wright MJ, Toga AW, Thompson PM (2011) The contribution of genes to cortical thickness and volume. Neuroreport 22:101-105.
Josse G, Seghier ML, Kherif F, Price CJ (2008) Explaining function with anatomy: language lateralization and corpus callosum size. The Journal of neuroscience : the official journal of the Society for Neuroscience 28:14132-14139.
Kale RA, Gupta RK, Saraswat VA, Hasan KM, Trivedi R, Mishra AM, Ranjan P, Pandey CM, Narayana PA (2006) Demonstration of interstitial cerebral edema with diffusion tensor MR imaging in type C hepatic encephalopathy. Hepatology 43:698-706.
Kandel ER (1997) Genes, synapses, and long-term memory. Journal of cellular physiology 173:124-125.
Karabekir HS, Mas NG, Yilmaz OK, Bas O, Ertekin T, Yazici AC, Senan S (2009) Evaluation of cerebellar asymmetry with vertigo cases: a stereological study. Turk Neurosurg 19:15-20.
Keenan JP, Thangaraj V, Halpern AR, Schlaug G (2001) Absolute pitch and planum temporale. NeuroImage 14:1402-1408.
Keller SS, Highley JR, Garcia-Finana M, Sluming V, Rezaie R, Roberts N (2007) Sulcal variability, stereological measurement and asymmetry of Broca's area on MR images. J Anat 211:534-555.
Keller SS, Mackay CE, Barrick TR, Wieshmann UC, Howard MA, Roberts N (2002) Voxel-based morphometric comparison of hippocampal and extrahippocampal abnormalities in patients with left and right hippocampal atrophy. NeuroImage 16:23-31.
Kemp A, Manahan-Vaughan D (2007) Hippocampal long-term depression: master or minion in declarative memory processes? Trends in neurosciences 30:111-118.
Kempermann G, Gast D, Gage FH (2002) Neuroplasticity in old age: sustained fivefold induction of hippocampal neurogenesis by long-term environmental enrichment. Annals of neurology 52:135-143.
Kempermann G, Gast D, Kronenberg G, Yamaguchi M, Gage FH (2003) Early determination and long-term persistence of adult-generated new neurons in the hippocampus of mice. Development 130:391-399.
Kempermann G, Kuhn HG, Gage FH (1997) More hippocampal neurons in adult mice living in an enriched environment. Nature 386:493-495.
Keshavan MS, Diwadkar VA, DeBellis M, Dick E, Kotwal R, Rosenberg DR, Sweeney JA, Minshew N, Pettegrew JW (2002) Development of the corpus callosum in childhood, adolescence and early adulthood. Life Sci 70:1909-1922.
Kiernan J (2005) Barr's The human nervous system: An anatomical viewpoint. Philadelphia: Lippincott Williams & Wilkins.
Kilian S, Brown WS, Hallam BJ, McMahon W, Lu J, Johnson M, Bigler ED, Lainhart J (2008) Regional callosal morphology in autism and macrocephaly. Dev Neuropsychol 33:74-99.
Kim HT, Kim IH, Lee KJ, Lee JR, Park SK, Chun YH, Kim H, Rhyu IJ (2002) Specific plasticity of parallel fiber/Purkinje cell spine synapses by motor skill learning. Neuroreport 13:1607-1610.
Kim J, Lee SK, Lee JD, Kim YW, Kim DI (2005) Decreased fractional anisotropy of middle cerebellar peduncle in crossed cerebellar diaschisis: diffusion-tensor imaging-positron-emission tomography correlation study. AJNR Am J Neuroradiol 26:2224-2228.
Kim SG, Ugurbil K, Strick PL (1994) Activation of a cerebellar output nucleus during cognitive processing. Science 265:949-951.
Kinoshita Y, Ohnishi A, Kohshi K, Yokota A (1999) Apparent diffusion coefficient on rat brain and nerves intoxicated with methylmercury. Environ Res 80:348-354.
Kleim JA, Barbay S, Cooper NR, Hogg TM, Reidel CN, Remple MS, Nudo RJ (2002) Motor learning-dependent synaptogenesis is localized to functionally reorganized motor cortex. Neurobiology of learning and memory 77:63-77.

References
284
Kleim JA, Barbay S, Nudo RJ (1998a) Functional reorganization of the rat motor cortex following motor skill learning. Journal of neurophysiology 80:3321-3325.
Kleim JA, Bruneau R, Calder K, Pocock D, VandenBerg PM, MacDonald E, Monfils MH, Sutherland RJ, Nader K (2003a) Functional organization of adult motor cortex is dependent upon continued protein synthesis. Neuron 40:167-176.
Kleim JA, Bruneau R, VandenBerg P, MacDonald E, Mulrooney R, Pocock D (2003b) Motor cortex stimulation enhances motor recovery and reduces peri-infarct dysfunction following ischemic insult. Neurological research 25:789-793.
Kleim JA, Hogg TM, VandenBerg PM, Cooper NR, Bruneau R, Remple M (2004) Cortical synaptogenesis and motor map reorganization occur during late, but not early, phase of motor skill learning. The Journal of neuroscience : the official journal of the Society for Neuroscience 24:628-633.
Kleim JA, Jones TA (2008) Principles of experience-dependent neural plasticity: implications for rehabilitation after brain damage. Journal of speech, language, and hearing research : JSLHR 51:S225-239.
Kleim JA, Lussnig E, Schwarz ER, Comery TA, Greenough WT (1996) Synaptogenesis and Fos expression in the motor cortex of the adult rat after motor skill learning. The Journal of neuroscience : the official journal of the Society for Neuroscience 16:4529-4535.
Kleim JA, Swain RA, Armstrong KA, Napper RM, Jones TA, Greenough WT (1998b) Selective synaptic plasticity within the cerebellar cortex following complex motor skill learning. Neurobiology of learning and memory 69:274-289.
Knoth R, Singec I, Ditter M, Pantazis G, Capetian P, Meyer RP, Horvat V, Volk B, Kempermann G (2010) Murine features of neurogenesis in the human hippocampus across the lifespan from 0 to 100 years. PloS one 5:e8809.
Knott GW, Holtmaat A, Wilbrecht L, Welker E, Svoboda K (2006) Spine growth precedes synapse formation in the adult neocortex in vivo. Nature neuroscience 9:1117-1124.
Knudsen EI (2004) Sensitive periods in the development of the brain and behavior. J Cogn Neurosci 16:1412-1425.
Koechlin E, Jubault T (2006) Broca's area and the hierarchical organization of human behavior. Neuron 50:963-974.
Koelsch S (2006) Significance of Broca's area and ventral premotor cortex for music-syntactic processing. Cortex 42:518-520.
Koelsch S, Schroger E, Tervaniemi M (1999) Superior pre-attentive auditory processing in musicians. Neuroreport 10:1309-1313.
Koeneke S, Lutz K, Wustenberg T, Jancke L (2004) Long-term training affects cerebellar processing in skilled keyboard players. Neuroreport 15:1279-1282.
Kolb B, Cioe J, Comeau W (2008) Contrasting effects of motor and visual spatial learning tasks on dendritic arborization and spine density in rats. Neurobiology of learning and memory 90:295-300.
Kornack DR, Rakic P (1999) Continuation of neurogenesis in the hippocampus of the adult macaque monkey. Proceedings of the National Academy of Sciences of the United States of America 96:5768-5773.
Koscik T, O'Leary D, Moser DJ, Andreasen NC, Nopoulos P (2009) Sex differences in parietal lobe morphology: relationship to mental rotation performance. Brain Cogn 69:451-459.
Koski L, Wohlschlager A, Bekkering H, Woods RP, Dubeau MC, Mazziotta JC, Iacoboni M (2002) Modulation of motor and premotor activity during imitation of target-directed actions. Cereb Cortex 12:847-855.
Krams M, Rushworth MF, Deiber MP, Frackowiak RS, Passingham RE (1998) The preparation, execution and suppression of copied movements in the human brain. Exp Brain Res 120:386-398.
Kremen WS, Prom-Wormley E, Panizzon MS, Eyler LT, Fischl B, Neale MC, Franz CE, Lyons MJ, Pacheco J, Perry ME, Stevens A, Schmitt JE, Grant MD, Seidman LJ, Thermenos HW, Tsuang MT, Eisen SA, Dale AM, Fennema-Notestine C (2010) Genetic and environmental influences on the size of specific brain regions in midlife: the VETSA MRI study. Neuroimage 49:1213-1223.

References
285
Kriegeskorte N, Goebel R (2001) An efficient algorithm for topologically correct segmentation of the cortical sheet in anatomical mr volumes. NeuroImage 14:329-346.
Krings T, Topper R, Foltys H, Erberich S, Sparing R, Willmes K, Thron A (2000) Cortical activation patterns during complex motor tasks in piano players and control subjects. A functional magnetic resonance imaging study. Neuroscience letters 278:189-193.
Lacerda AL, Brambilla P, Sassi RB, Nicoletti MA, Mallinger AG, Frank E, Kupfer DJ, Keshavan MS, Soares JC (2005) Anatomical MRI study of corpus callosum in unipolar depression. J Psychiatr Res 39:347-354.
Lahav A, Saltzman E, Schlaug G (2007) Action representation of sound: audiomotor recognition network while listening to newly acquired actions. The Journal of neuroscience : the official journal of the Society for Neuroscience 27:308-314.
Lamantia AS, Rakic P (1990) Cytological and quantitative characteristics of four cerebral commissures in the rhesus monkey. J Comp Neurol 291:520-537.
Lancaster JL, Woldorff MG, Parsons LM, Liotti M, Freitas CS, Rainey L, Kochunov PV, Nickerson D, Mikiten SA, Fox PT (2000) Automated Talairach atlas labels for functional brain mapping. Human brain mapping 10:120-131.
Lappe C, Herholz SC, Trainor LJ, Pantev C (2008) Cortical plasticity induced by short-term unimodal and multimodal musical training. J Neurosci 28:9632-9639.
Lau HC, Rogers RD, Ramnani N, Passingham RE (2004) Willed action and attention to the selection of action. NeuroImage 21:1407-1415.
Lawes IN, Barrick TR, Murugam V, Spierings N, Evans DR, Song M, Clark CA (2008) Atlas-based segmentation of white matter tracts of the human brain using diffusion tensor tractography and comparison with classical dissection. NeuroImage 39:62-79.
Lazar M, Alexander AL (2005) Bootstrap white matter tractography (BOOT-TRAC). NeuroImage 24:524-532.
Lazar M, Weinstein DM, Tsuruda JS, Hasan KM, Arfanakis K, Meyerand ME, Badie B, Rowley HA, Haughton V, Field A, Alexander AL (2003) White matter tractography using diffusion tensor deflection. Human brain mapping 18:306-321.
Lee B, Park JY, Jung WH, Kim HS, Oh JS, Choi CH, Jang JH, Kang DH, Kwon JS (2010) White matter neuroplastic changes in long-term trained players of the game of "Baduk" (GO): a voxel-based diffusion-tensor imaging study. NeuroImage 52:9-19.
Lee DJ, Chen Y, Schlaug G (2003) Corpus callosum: musician and gender effects. Neuroreport 14:205-209.
Lee H, Devlin JT, Shakeshaft C, Stewart LH, Brennan A, Glensman J, Pitcher K, Crinion J, Mechelli A, Frackowiak RS, Green DW, Price CJ (2007) Anatomical traces of vocabulary acquisition in the adolescent brain. The Journal of neuroscience : the official journal of the Society for Neuroscience 27:1184-1189.
Leiner HC, Leiner AL, Dow RS (1991) The human cerebro-cerebellar system: its computing, cognitive, and language skills. Behavioural brain research 44:113-128.
LeMay M (1976) Morphological cerebral asymmetries of modern man, fossil man, and nonhuman primate. Annals of the New York Academy of Sciences 280:349-366.
Leuner B, Falduto J, Shors TJ (2003) Associative memory formation increases the observation of dendritic spines in the hippocampus. The Journal of neuroscience : the official journal of the Society for Neuroscience 23:659-665.
Leuner B, Mendolia-Loffredo S, Kozorovitskiy Y, Samburg D, Gould E, Shors TJ (2004) Learning enhances the survival of new neurons beyond the time when the hippocampus is required for memory. The Journal of neuroscience : the official journal of the Society for Neuroscience 24:7477-7481.
Li S, Han Y, Wang D, Yang H, Fan Y, Lv Y, Tang H, Gong Q, Zang Y, He Y (2010) Mapping surface variability of the central sulcus in musicians. Cereb Cortex 20:25-33.

References
286
Li S, Pu F, Shi F, Xie S, Wang Y, Jiang T (2008) Regional white matter decreases in Alzheimer's disease using optimized voxel-based morphometry. Acta Radiol 49:84-90.
Liberman AM, Whalen DH (2000) On the relation of speech to language. Trends Cogn Sci 4:187-196.
Limb CJ (2006) Structural and functional neural correlates of music perception. Anat Rec A Discov Mol Cell Evol Biol 288:435-446.
Limb CJ, Kemeny S, Ortigoza EB, Rouhani S, Braun AR (2006) Left hemispheric lateralization of brain activity during passive rhythm perception in musicians. Anat Rec A Discov Mol Cell Evol Biol 288:382-389.
Lin CP, Tseng WY, Cheng HC, Chen JH (2001) Validation of diffusion tensor magnetic resonance axonal fiber imaging with registered manganese-enhanced optic tracts. NeuroImage 14:1035-1047.
Lin F, Zhou Y, Du Y, Qin L, Zhao Z, Xu J, Lei H (2012) Abnormal white matter integrity in adolescents with internet addiction disorder: a tract-based spatial statistics study. PloS one 7:e30253.
Lin KC, Chung HY, Wu CY, Liu HL, Hsieh YW, Chen IH, Chen CL, Chuang LL, Liu JS, Wai YY (2010a) Constraint-induced therapy versus control intervention in patients with stroke: a functional magnetic resonance imaging study. Am J Phys Med Rehabil 89:177-185.
Lin KC, Chung HY, Wu CY, Liu HL, Hsieh YW, Chen IH, Chen CL, Chuang LL, Liu JS, Wai YY (2010b) Constraint-induced therapy versus control intervention in patients with stroke: a functional magnetic resonance imaging study. American journal of physical medicine & rehabilitation / Association of Academic Physiatrists 89:177-185.
Lindenberg R, Renga V, Zhu LL, Betzler F, Alsop D, Schlaug G (2010) Structural integrity of corticospinal motor fibers predicts motor impairment in chronic stroke. Neurology 74:280-287.
Lisman J (1989) A mechanism for the Hebb and the anti-Hebb processes underlying learning and memory. Proceedings of the National Academy of Sciences of the United States of America 86:9574-9578.
Liu F, Vidarsson L, Winter JD, Tran H, Kassner A (2010a) Sex differences in the human corpus callosum microstructure: a combined T2 myelin-water and diffusion tensor magnetic resonance imaging study. Brain Res 1343:37-45.
Liu X, Zhu T, Gu T, Zhong J (2010b) Optimization of in vivo high-resolution DTI of non-human primates on a 3T human scanner. Methods 50:205-213.
Lledo PM, Alonso M, Grubb MS (2006) Adult neurogenesis and functional plasticity in neuronal circuits. Nat Rev Neurosci 7:179-193.
Lochner C, Fouche JP, du Plessis S, Spottiswoode B, Seedat S, Fineberg N, Chamberlain SR, Stein DJ (2012) Evidence for fractional anisotropy and mean diffusivity white matter abnormalities in the internal capsule and cingulum in patients with obsessive-compulsive disorder. Journal of psychiatry & neuroscience : JPN 37:110059.
Lockwood AH, Salvi RJ, Coad ML, Arnold SA, Wack DS, Murphy BW, Burkard RF (1999) The functional anatomy of the normal human auditory system: responses to 0.5 and 4.0 kHz tones at varied intensities. Cereb Cortex 9:65-76.
Long LH, Liu RL, Wang F, Liu J, Hu ZL, Xie N, Jin Y, Fu H, Chen JG (2009) Age-related synaptic changes in the CA1 stratum radiatum and spatial learning impairment in rats. Clinical and experimental pharmacology & physiology 36:675-681.
Lotze M, Scheler G, Tan HR, Braun C, Birbaumer N (2003) The musician's brain: functional imaging of amateurs and professionals during performance and imagery. Neuroimage 20:1817-1829.
Luders E, Gaser C, Jancke L, Schlaug G (2004) A voxel-based approach to gray matter asymmetries. NeuroImage 22:656-664.
Luebke JI, Chang YM, Moore TL, Rosene DL (2004) Normal aging results in decreased synaptic excitation and increased synaptic inhibition of layer 2/3 pyramidal cells in the monkey prefrontal cortex. Neuroscience 125:277-288.
Luft AR, Skalej M, Welte D, Kolb R, Burk K, Schulz JB, Klockgether T, Voigt K (1998) A new semiautomated, three-dimensional technique allowing precise quantification of total and regional cerebellar volume using MRI. Magnetic

References
287
resonance in medicine : official journal of the Society of Magnetic Resonance in Medicine / Society of Magnetic Resonance in Medicine 40:143-151.
Luke LM, Allred RP, Jones TA (2004) Unilateral ischemic sensorimotor cortical damage induces contralesional synaptogenesis and enhances skilled reaching with the ipsilateral forelimb in adult male rats. Synapse 54:187-199.
Lundy-Ekman L (2007) Neuroscience Fundamentals for Rehabilitation. China: Saunders Elsevier.
Luscher C, Nicoll RA, Malenka RC, Muller D (2000) Synaptic plasticity and dynamic modulation of the postsynaptic membrane. Nature neuroscience 3:545-550.
Mackay CE, Roberts N, Mayes AR, Downes JJ, Foster JK, Mann D (1998) An exploratory study of the relationship between face recognition memory and the volume of medial temporal lobe structures in healthy young males. Behavioural neurology 11:3-20.
Madden DJ, Whiting WL, Huettel SA, White LE, MacFall JR, Provenzale JM (2004) Diffusion tensor imaging of adult age differences in cerebral white matter: relation to response time. Neuroimage 21:1174-1181.
Madsen TM, Kristjansen PE, Bolwig TG, Wortwein G (2003) Arrested neuronal proliferation and impaired hippocampal function following fractionated brain irradiation in the adult rat. Neuroscience 119:635-642.
Maess B, Koelsch S, Gunter TC, Friederici AD (2001) Musical syntax is processed in Broca's area: an MEG study. Nature neuroscience 4:540-545.
Magne C, Schon D, Besson M (2006) Musician children detect pitch violations in both music and language better than nonmusician children: behavioral and electrophysiological approaches. J Cogn Neurosci 18:199-211.
Maguire EA, Frackowiak RS, Frith CD (1997) Recalling routes around london: activation of the right hippocampus in taxi drivers. The Journal of neuroscience : the official journal of the Society for Neuroscience 17:7103-7110.
Maguire EA, Gadian DG, Johnsrude IS, Good CD, Ashburner J, Frackowiak RS, Frith CD (2000) Navigation-related structural change in the hippocampi of taxi drivers. Proceedings of the National Academy of Sciences of the United States of America 97:4398-4403.
Maguire EA, Nannery R, Spiers HJ (2006a) Navigation around London by a taxi driver with bilateral hippocampal lesions. Brain : a journal of neurology 129:2894-2907.
Maguire EA, Woollett K, Spiers HJ (2006b) London taxi drivers and bus drivers: a structural MRI and neuropsychological analysis. Hippocampus 16:1091-1101.
Maldjian JA, Laurienti PJ, Burdette JH (2004) Precentral gyrus discrepancy in electronic versions of the Talairach atlas. NeuroImage 21:450-455.
Maldjian JA, Listerud J, Moonis G, Siddiqi F (2001) Computing diffusion rates in T2-dark hematomas and areas of low T2 signal. AJNR American journal of neuroradiology 22:112-118.
Mangin JF, Poupon C, Cointepas Y, Riviere D, Papadopoulos-Orfanos D, Clark CA, Regis J, Le Bihan D (2002) A framework based on spin glass models for the inference of anatomical connectivity from diffusion-weighted MR data - a technical review. NMR in biomedicine 15:481-492.
Maren S (2005) Synaptic mechanisms of associative memory in the amygdala. Neuron 47:783-786.
Markham JA, Greenough WT (2004) Experience-driven brain plasticity: beyond the synapse. Neuron glia biology 1:351-363.
Martin SJ, Grimwood PD, Morris RG (2000) Synaptic plasticity and memory: an evaluation of the hypothesis. Annual review of neuroscience 23:649-711.
Martinkauppi S, Rama P, Aronen HJ, Korvenoja A, Carlson S (2000) Working memory of auditory localization. Cereb Cortex 10:889-898.
Masliah E, Mallory M, Hansen L, DeTeresa R, Terry RD (1993) Quantitative synaptic alterations in the human neocortex during normal aging. Neurology 43:192-197.
Matano S, Nakano Y (1998) Size comparison of the male and female human corpus callosum from autopsy samples. Z Morphol Anthropol 82:67-73.
Mathieu O, Cruz-Orive L, Hoppeller H, Weibel E (1981) Measuring error and sampling variation in stereology. Journal of Microscopy 121:75-88.

References
288
Matsumoto R, Okada T, Mikuni N, Mitsueda-Ono T, Taki J, Sawamoto N, Hanakawa T, Miki Y, Hashimoto N, Fukuyama H, Takahashi R, Ikeda A (2008) Hemispheric asymmetry of the arcuate fasciculus: a preliminary diffusion tensor tractography study in patients with unilateral language dominance defined by Wada test. Journal of neurology 255:1703-1711.
Matsumura M, Sadato N, Kochiyama T, Nakamura S, Naito E, Matsunami K, Kawashima R, Fukuda H, Yonekura Y (2004) Role of the cerebellum in implicit motor skill learning: a PET study. Brain Res Bull 63:471-483.
Matsuzaka Y, Picard N, Strick PL (2007) Skill representation in the primary motor cortex after long-term practice. Journal of neurophysiology 97:1819-1832.
Mauk MD, Garcia KS, Medina JF, Steele PM (1998) Does cerebellar LTD mediate motor learning? Toward a resolution without a smoking gun. Neuron 20:359-362.
McAdams S, Winsberg S, Donnadieu S, De Soete G, Krimphoff J (1995) Perceptual scaling of synthesized musical timbres: common dimensions, specificities, and latent subject classes. Psychol Res 58:177-192.
McAllister AK, Lo DC, Katz LC (1995) Neurotrophins regulate dendritic growth in developing visual cortex. Neuron 15:791-803.
McDonald CR, Hagler DJ, Jr., Ahmadi ME, Tecoma E, Iragui V, Dale AM, Halgren E (2008) Subcortical and cerebellar atrophy in mesial temporal lobe epilepsy revealed by automatic segmentation. Epilepsy research 79:130-138.
McGinnis SM, Brickhouse M, Pascual B, Dickerson BC (2011) Age-related changes in the thickness of cortical zones in humans. Brain topography 24:279-291.
McLaughlin NC, Paul RH, Grieve SM, Williams LM, Laidlaw D, DiCarlo M, Clark CR, Whelihan W, Cohen RA, Whitford TJ, Gordon E (2007) Diffusion tensor imaging of the corpus callosum: a cross-sectional study across the lifespan. Int J Dev Neurosci 25:215-221.
Mechelli A, Crinion JT, Noppeney U, O'Doherty J, Ashburner J, Frackowiak RS, Price CJ (2004) Neurolinguistics: structural plasticity in the bilingual brain. Nature 431:757.
Mecklinger A, Gruenewald C, Besson M, Magnie MN, Von Cramon DY (2002) Separable neuronal circuitries for manipulable and non-manipulable objects in working memory. Cereb Cortex 12:1115-1123.
Meis S, Endres T, Lessmann V (2012) Postsynaptic BDNF signalling regulates long-term potentiation at thalamo-amygdala afferents. The Journal of physiology 590:193-208.
Meister I, Krings T, Foltys H, Boroojerdi B, Muller M, Topper R, Thron A (2005) Effects of long-term practice and task complexity in musicians and nonmusicians performing simple and complex motor tasks: implications for cortical motor organization. Human brain mapping 25:345-352.
Menzler K, Belke M, Wehrmann E, Krakow K, Lengler U, Jansen A, Hamer HM, Oertel WH, Rosenow F, Knake S (2011) Men and women are different: diffusion tensor imaging reveals sexual dimorphism in the microstructure of the thalamus, corpus callosum and cingulum. Neuroimage 54:2557-2562.
Meredith MA, Stein BE (1983) Interactions among converging sensory inputs in the superior colliculus. Science 221:389-391.
Meyer A (1977) In: Music and the Brain
(Macdonald, C. and Henson, R. A., eds), pp 255–281 London: Heinemann Medical Books.
Middleton FA, Strick PL (2001) Cerebellar projections to the prefrontal cortex of the primate. J Neurosci 21:700-712.
Miller MW, Astley SJ, Clarren SK (1999) Number of axons in the corpus callosum of the Mature macaca nemestrina: increases caused by prenatal exposure to ethanol. J Comp Neurol 412:123-131.
Mitchell TN, Free SL, Merschhemke M, Lemieux L, Sisodiya SM, Shorvon SD (2003) Reliable callosal measurement: population normative data confirm sex-related differences. AJNR Am J Neuroradiol 24:410-418.
Molnar-Szakacs I, Iacoboni M, Koski L, Mazziotta JC (2005) Functional segregation within pars opercularis of the inferior frontal gyrus: evidence from fMRI studies of imitation and action observation. Cereb Cortex 15:986-994.

References
289
Molteni R, Ying Z, Gomez-Pinilla F (2002) Differential effects of acute and chronic exercise on plasticity-related genes in the rat hippocampus revealed by microarray. Eur J Neurosci 16:1107-1116.
Monfils MH, Plautz EJ, Kleim JA (2005) In search of the motor engram: motor map plasticity as a mechanism for encoding motor experience. The Neuroscientist : a review journal bringing neurobiology, neurology and psychiatry 11:471-483.
Mori S, Crain BJ, Chacko VP, van Zijl PC (1999) Three-dimensional tracking of axonal projections in the brain by magnetic resonance imaging. Annals of neurology 45:265-269.
Mori S, Kaufmann WE, Davatzikos C, Stieltjes B, Amodei L, Fredericksen K, Pearlson GD, Melhem ER, Solaiyappan M, Raymond GV, Moser HW, van Zijl PC (2002) Imaging cortical association tracts in the human brain using diffusion-tensor-based axonal tracking. Magnetic resonance in medicine : official journal of the Society of Magnetic Resonance in Medicine / Society of Magnetic Resonance in Medicine 47:215-223.
Mori S, van Zijl PC (2002) Fiber tracking: principles and strategies - a technical review. NMR in biomedicine 15:468-480.
Mori S, Zhang J (2006) Principles of diffusion tensor imaging and its applications to basic neuroscience research. Neuron 51:527-539.
Moseley ME, Cohen Y, Kucharczyk J, Mintorovitch J, Asgari HS, Wendland MF, Tsuruda J, Norman D (1990) Diffusion-weighted MR imaging of anisotropic water diffusion in cat central nervous system. Radiology 176:439-445.
Moser EI, Krobert KA, Moser MB, Morris RG (1998) Impaired spatial learning after saturation of long-term potentiation. Science 281:2038-2042.
Muetzel RL, Collins PF, Mueller BA, A MS, Lim KO, Luciana M (2008) The development of corpus callosum microstructure and associations with bimanual task performance in healthy adolescents. Neuroimage 39:1918-1925.
Mukherjee P, Berman JI, Chung SW, Hess CP, Henry RG (2008a) Diffusion tensor MR imaging and fiber tractography: theoretic underpinnings. AJNR American journal of neuroradiology 29:632-641.
Mukherjee P, Chung SW, Berman JI, Hess CP, Henry RG (2008b) Diffusion tensor MR imaging and fiber tractography: technical considerations. AJNR American journal of neuroradiology 29:843-852.
Munte TF, Altenmuller E, Jancke L (2002) The musician's brain as a model of neuroplasticity. Nature reviews Neuroscience 3:473-478.
Murphy K, Bodurka J, Bandettini PA (2007) How long to scan? The relationship between fMRI temporal signal to noise ratio and necessary scan duration. NeuroImage 34:565-574.
Nakada T, Matsuzawa H, Kwee IL (2008) High-resolution imaging with high and ultra high-field magnetic resonance imaging systems. Neuroreport 19:7-13.
Narberhaus A, Segarra D, Caldu X, Gimenez M, Pueyo R, Botet F, Junque C (2008) Corpus callosum and prefrontal functions in adolescents with history of very preterm birth. Neuropsychologia 46:111-116.
Netter FH (2010) Atlas of Human Anatomy. Philadelphia: Saunders Elsevier. Nieto-Sampedro M, Nieto-Diaz M (2005) Neural plasticity: changes with age. J Neural
Transm 112:3-27. Nilsson M, Perfilieva E, Johansson U, Orwar O, Eriksson PS (1999) Enriched
environment increases neurogenesis in the adult rat dentate gyrus and improves spatial memory. Journal of neurobiology 39:569-578.
Nopoulos P, Flaum M, O'Leary D, Andreasen NC (2000) Sexual dimorphism in the human brain: evaluation of tissue volume, tissue composition and surface anatomy using magnetic resonance imaging. Psychiatry research 98:1-13.
Norton A, Winner E, Cronin K, Overy K, Lee DJ, Schlaug G (2005) Are there pre-existing neural, cognitive, or motoric markers for musical ability? Brain Cogn 59:124-134.
Nowinski WL (2001) Modified Talairach landmarks. Acta neurochirurgica 143:1045-1057.
Nowinski WL (2005) The cerefy brain atlases: continuous enhancement of the electronic talairach-tournoux brain atlas. Neuroinformatics 3:293-300.

References
290
Nowinski WL, Thirunavuukarasuu A (2001) Atlas-assisted localization analysis of functional images. Medical image analysis 5:207-220.
Nowinski WL, Thirunavuukarasuu A (2009) Quantification of spatial consistency in the Talairach and Tournoux stereotactic atlas. Acta neurochirurgica 151:1207-1213.
Nucifora PG, Verma R, Lee SK, Melhem ER (2007) Diffusion-tensor MR imaging and tractography: exploring brain microstructure and connectivity. Radiology 245:367-384.
Nucifora PG, Verma R, Melhem ER, Gur RE, Gur RC (2005) Leftward asymmetry in relative fiber density of the arcuate fasciculus. Neuroreport 16:791-794.
Nudo RJ, Milliken GW, Jenkins WM, Merzenich MM (1996) Use-dependent alterations of movement representations in primary motor cortex of adult squirrel monkeys. The Journal of neuroscience : the official journal of the Society for Neuroscience 16:785-807.
Oechslin MS, Imfeld A, Loenneker T, Meyer M, Jancke L (2009) The plasticity of the superior longitudinal fasciculus as a function of musical expertise: a diffusion tensor imaging study. Front Hum Neurosci 3:76.
Ohnishi T, Matsuda H, Asada T, Aruga M, Hirakata M, Nishikawa M, Katoh A, Imabayashi E (2001) Functional anatomy of musical perception in musicians. Cereb Cortex 11:754-760.
Ojemann G, Ojemann J, Lettich E, Berger M (1989) Cortical language localization in left, dominant hemisphere. An electrical stimulation mapping investigation in 117 patients. J Neurosurg 71:316-326.
Okada T, Miki Y, Fushimi Y, Hanakawa T, Kanagaki M, Yamamoto A, Urayama S, Fukuyama H, Hiraoka M, Togashi K (2006) Diffusion-tensor fiber tractography: intraindividual comparison of 3.0-T and 1.5-T MR imaging. Radiology 238:668-678.
Oldfield RC (1971) The assessment and analysis of handedness: the Edinburgh inventory. Neuropsychologia 9:97-113.
Oscar-Berman M, Song J (2011) Brain volumetric measures in alcoholics: a comparison of two segmentation methods. Neuropsychiatric disease and treatment 7:65-75.
Ostby Y, Tamnes CK, Fjell AM, Westlye LT, Due-Tonnessen P, Walhovd KB (2009) Heterogeneity in subcortical brain development: A structural magnetic resonance imaging study of brain maturation from 8 to 30 years. J Neurosci 29:11772-11782.
Overy K, Nicolson RI, Fawcett AJ, Clarke EF (2003) Dyslexia and music: measuring musical timing skills. Dyslexia 9:18-36.
Ozturk AH, Tascioglu B, Aktekin M, Kurtoglu Z, Erden I (2002) Morphometric comparison of the human corpus callosum in professional musicians and non-musicians by using in vivo magnetic resonance imaging. J Neuroradiol 29:29-34.
Pajevic S, Pierpaoli C (1999) Color schemes to represent the orientation of anisotropic tissues from diffusion tensor data: application to white matter fiber tract mapping in the human brain. Magnetic resonance in medicine : official journal of the Society of Magnetic Resonance in Medicine / Society of Magnetic Resonance in Medicine 42:526-540.
Pandya DN, Karol EA, Heilbronn D (1971) The topographical distribution of interhemispheric projections in the corpus callosum of the rhesus monkey. Brain research 32:31-43.
Pantazis D, Joshi A, Jiang J, Shattuck DW, Bernstein LE, Damasio H, Leahy RM (2010) Comparison of landmark-based and automatic methods for cortical surface registration. NeuroImage 49:2479-2493.
Pantev C, Oostenveld R, Engelien A, Ross B, Roberts LE, Hoke M (1998) Increased auditory cortical representation in musicians. Nature 392:811-814.
Pantev C, Roberts LE, Schulz M, Engelien A, Ross B (2001) Timbre-specific enhancement of auditory cortical representations in musicians. Neuroreport 12:169-174.
Papathanassiou D, Etard O, Mellet E, Zago L, Mazoyer B, Tzourio-Mazoyer N (2000) A common language network for comprehension and production: a contribution to the definition of language epicenters with PET. Neuroimage 11:347-357.

References
291
Paradiso S, Andreasen NC, O'Leary DS, Arndt S, Robinson RG (1997) Cerebellar size and cognition: correlations with IQ, verbal memory and motor dexterity. Neuropsychiatry Neuropsychol Behav Neurol 10:1-8.
Park HJ, Kim JJ, Lee SK, Seok JH, Chun J, Kim DI, Lee JD (2008) Corpus callosal connection mapping using cortical gray matter parcellation and DT-MRI. Human brain mapping 29:503-516.
Park HJ, Westin CF, Kubicki M, Maier SE, Niznikiewicz M, Baer A, Frumin M, Kikinis R, Jolesz FA, McCarley RW, Shenton ME (2004) White matter hemisphere asymmetries in healthy subjects and in schizophrenia: a diffusion tensor MRI study. NeuroImage 23:213-223.
Park IS, Han JW, Lee KJ, Lee NJ, Lee WT, Park KA, Rhyu IJ (2006) Evaluation of morphological plasticity in the cerebella of basketball players with MRI. J Korean Med Sci 21:342-346.
Park IS, Lee KJ, Han JW, Lee NJ, Lee WT, Park KA, Rhyu IJ (2009) Experience-dependent plasticity of cerebellar vermis in basketball players. Cerebellum 8:334-339.
Parker GJ (2004) Analysis of MR diffusion weighted images. The British journal of radiology 77 Spec No 2:S176-185.
Parker GJ, Wheeler-Kingshott CA, Barker GJ (2002) Estimating distributed anatomical connectivity using fast marching methods and diffusion tensor imaging. IEEE transactions on medical imaging 21:505-512.
Parsons LM (2001) Exploring the functional neuroanatomy of music performance, perception, and comprehension. Annals of the New York Academy of Sciences 930:211-231.
Parsons LM, Bower JM, Gao JH, Xiong J, Li J, Fox PT (1997) Lateral cerebellar hemispheres actively support sensory acquisition and discrimination rather than motor control. Learn Mem 4:49-62.
Parsons LM, Petacchi A, Schmahmann JD, Bower JM (2009) Pitch discrimination in cerebellar patients: evidence for a sensory deficit. Brain Res 1303:84-96.
Pascual-Leone A (2001) The brain that plays music and is changed by it. Ann N Y Acad Sci 930:315-329.
Pascual-Leone A, Amedi A, Fregni F, Merabet LB (2005) The plastic human brain cortex. Annual review of neuroscience 28:377-401.
Patel AD (2003) Language, music, syntax and the brain. Nat Neurosci 6:674-681. Patston LL, Hogg SL, Tippett LJ (2007) Attention in musicians is more bilateral than in
non-musicians. Laterality 12:262-272. Paviour DC, Price SL, Jahanshahi M, Lees AJ, Fox NC (2006) Regional brain volumes
distinguish PSP, MSA-P, and PD: MRI-based clinico-radiological correlations. Mov Disord 21:989-996.
Pengas G, Pereira JM, Williams GB, Nestor PJ (2009) Comparative reliability of total intracranial volume estimation methods and the influence of atrophy in a longitudinal semantic dementia cohort. J Neuroimaging 19:37-46.
Penhune VB, Zatorre RJ, MacDonald JD, Evans AC (1996) Interhemispheric anatomical differences in human primary auditory cortex: probabilistic mapping and volume measurement from magnetic resonance scans. Cereb Cortex 6:661-672.
Pereira AC, Huddleston DE, Brickman AM, Sosunov AA, Hen R, McKhann GM, Sloan R, Gage FH, Brown TR, Small SA (2007) An in vivo correlate of exercise-induced neurogenesis in the adult dentate gyrus. Proceedings of the National Academy of Sciences of the United States of America 104:5638-5643.
Perier OJ, Buyse M, Lechat J, Stenuit A (1986) Deprivation and morphological changes in the central nervous system. Acta oto-laryngologica Supplementum 429:45-50.
Peters A, Leahu D, Moss MB, McNally KJ (1994) The effects of aging on area 46 of the frontal cortex of the rhesus monkey. Cereb Cortex 4:621-635.
Peters A, Sethares C (2002) The effects of age on the cells in layer 1 of primate cerebral cortex. Cereb Cortex 12:27-36.
Peters A, Sethares C, Luebke JI (2008) Synapses are lost during aging in the primate prefrontal cortex. Neuroscience 152:970-981.

References
292
Petrides M (2006) Broca's area in the human and nonhuman primate brain. In: Broca's region(Grodzinsky, Y. and Amunts, K., eds), pp 31-46 New York: Oxford University Press.
Petrides M, Pandya D (2004) The frontal cortex. In: The human nervous system(Paxinos, G. and Mai, J., eds), pp 950-972 San Diego: Elsevier Acadenic Press.
Pfefferbaum A, Adalsteinsson E, Sullivan EV (2003) Replicability of diffusion tensor imaging measurements of fractional anisotropy and trace in brain. Journal of magnetic resonance imaging : JMRI 18:427-433.
Pfefferbaum A, Sullivan EV (2002) Microstructural but not macrostructural disruption of white matter in women with chronic alcoholism. Neuroimage 15:708-718.
Pfefferbaum A, Sullivan EV, Hedehus M, Lim KO, Adalsteinsson E, Moseley M (2000) Age-related decline in brain white matter anisotropy measured with spatially corrected echo-planar diffusion tensor imaging. Magn Reson Med 44:259-268.
Phillips KA, Sherwood CC, Lilak AL (2007) Corpus callosum morphology in capuchin monkeys is influenced by sex and handedness. PLoS One 2:e792.
Picton TW, Alain C, Otten L, Ritter W, Achim A (2000) Mismatch negativity: different water in the same river. Audiol Neurootol 5:111-139.
Pierpaoli C, Barnett A, Pajevic S, Chen R, Penix LR, Virta A, Basser P (2001) Water diffusion changes in Wallerian degeneration and their dependence on white matter architecture. NeuroImage 13:1174-1185.
Pierpaoli C, Basser PJ (1996) Toward a quantitative assessment of diffusion anisotropy. Magnetic resonance in medicine : official journal of the Society of Magnetic Resonance in Medicine / Society of Magnetic Resonance in Medicine 36:893-906.
Pierpaoli C, Jezzard P, Basser PJ, Barnett A, Di Chiro G (1996) Diffusion tensor MR imaging of the human brain. Radiology 201:637-648.
Platel H, Price C, Baron JC, Wise R, Lambert J, Frackowiak RS, Lechevalier B, Eustache F (1997) The structural components of music perception. A functional anatomical study. Brain 120 ( Pt 2):229-243.
Pollmann S, Maertens M, von Cramon DY (2004) Splenial lesions lead to supramodal target detection deficits. Neuropsychology 18:710-718.
Poupon C, Clark CA, Frouin V, Regis J, Bloch I, Le Bihan D, Mangin J (2000) Regularization of diffusion-based direction maps for the tracking of brain white matter fascicles. NeuroImage 12:184-195.
Poupon C, Rieul B, Kezele I, Perrin M, Poupon F, Mangin JF (2008) New diffusion phantoms dedicated to the study and validation of high-angular-resolution diffusion imaging (HARDI) models. Magnetic resonance in medicine : official journal of the Society of Magnetic Resonance in Medicine / Society of Magnetic Resonance in Medicine 60:1276-1283.
Powell JL, Parkes L, Kemp GJ, Sluming V, Barrick TR, Garcia-Finana M (2012) The effect of sex and handedness on white matter anisotropy: a diffusion-tensor magnetic resonance imaging study. Neuroscience.
Pozzilli C, Bastianello S, Bozzao A, Pierallini A, Giubilei F, Argentino C, Bozzao L (1994) No differences in corpus callosum size by sex and aging. A quantitative study using magnetic resonance imaging. J Neuroimaging 4:218-221.
Prayer D, Barkovich AJ, Kirschner DA, Prayer LM, Roberts TP, Kucharczyk J, Moseley ME (2001) Visualization of nonstructural changes in early white matter development on diffusion-weighted MR images: evidence supporting premyelination anisotropy. AJNR Am J Neuroradiol 22:1572-1576.
Puddephat M (1999) Computer interface for convenient application of stereological methods for unbiased estimation of volume and surface area: studies using MRI with particular reference to the human brain. Liverpool: University of Liverpool.
Pujol J, Vendrell P, Junque C, Marti-Vilalta JL, Capdevila A (1993) When does human brain development end? Evidence of corpus callosum growth up to adulthood. Annals of neurology 34:71-75.
Putnam MC, Wig GS, Grafton ST, Kelley WM, Gazzaniga MS (2008) Structural organization of the corpus callosum predicts the extent and impact of cortical

References
293
activity in the nondominant hemisphere. The Journal of neuroscience : the official journal of the Society for Neuroscience 28:2912-2918.
Pysh JJ, Weiss GM (1979) Exercise during development induces an increase in Purkinje cell dendritic tree size. Science 206:230-232.
Quattrone A, Cerasa A, Messina D, Nicoletti G, Hagberg GE, Lemieux L, Novellino F, Lanza P, Arabia G, Salsone M (2008) Essential head tremor is associated with cerebellar vermis atrophy: a volumetric and voxel-based morphometry MR imaging study. AJNR American journal of neuroradiology 29:1692-1697.
Rademacher J, Caviness VS, Jr., Steinmetz H, Galaburda AM (1993) Topographical variation of the human primary cortices: implications for neuroimaging, brain mapping, and neurobiology. Cereb Cortex 3:313-329.
Rae C, Harasty JA, Dzendrowskyj TE, Talcott JB, Simpson JM, Blamire AM, Dixon RM, Lee MA, Thompson CH, Styles P, Richardson AJ, Stein JF (2002) Cerebellar morphology in developmental dyslexia. Neuropsychologia 40:1285-1292.
Rajapakse JC, Giedd JN, Rumsey JM, Vaituzis AC, Hamburger SD, Rapoport JL (1996) Regional MRI measurements of the corpus callosum: a methodological and developmental study. Brain Dev 18:379-388.
Rakic P (2002) Adult neurogenesis in mammals: an identity crisis. J Neurosci 22:614-618.
Rakic P, Yakovlev PI (1968) Development of the corpus callosum and cavum septi in man. The Journal of comparative neurology 132:45-72.
Rampon C, Jiang CH, Dong H, Tang YP, Lockhart DJ, Schultz PG, Tsien JZ, Hu Y (2000) Effects of environmental enrichment on gene expression in the brain. Proceedings of the National Academy of Sciences of the United States of America 97:12880-12884.
Ramu J, Herrera J, Grill R, Bockhorst T, Narayana P (2008a) Brain fiber tract plasticity in experimental spinal cord injury: diffusion tensor imaging. Exp Neurol 212:100-107.
Ramu J, Herrera J, Grill R, Bockhorst T, Narayana P (2008b) Brain fiber tract plasticity in experimental spinal cord injury: diffusion tensor imaging. Exp Neurol 212:100-107.
Rauch RA, Jinkins JR (1994) Analysis of cross-sectional area measurements of the corpus callosum adjusted for brain size in male and female subjects from childhood to adulthood. Behav Brain Res 64:65-78.
Rauscher FH, Shaw GL, Levine LJ, Wright EL, Dennis WR, Newcomb RL (1997) Music training causes long-term enhancement of preschool children's spatial-temporal reasoning. Neurol Res 19:2-8.
Raya JG, Arnoldi AP, Weber DL, Filidoro L, Dietrich O, Adam-Neumair S, Mutzel E, Melkus G, Putz R, Reiser MF, Jakob PM, Glaser C (2011) Ultra-high field diffusion tensor imaging of articular cartilage correlated with histology and scanning electron microscopy. MAGMA 24:247-258.
Raymond CR, Redman SJ, Crouch MF (2002) The phosphoinositide 3-kinase and p70 S6 kinase regulate long-term potentiation in hippocampal neurons. Neuroscience 109:531-536.
Raz N, Dupuis JH, Briggs SD, McGavran C, Acker JD (1998) Differential effects of age and sex on the cerebellar hemispheres and the vermis: a prospective MR study. AJNR American journal of neuroradiology 19:65-71.
Raz N, Gunning-Dixon F, Head D, Williamson A, Acker JD (2001) Age and sex differences in the cerebellum and the ventral pons: a prospective MR study of healthy adults. AJNR American journal of neuroradiology 22:1161-1167.
Real CC, Ferreira AF, Hernandes MS, Britto LR, Pires RS (2010) Exercise-induced plasticity of AMPA-type glutamate receptor subunits in the rat brain. Brain research 1363:63-71.
Reale RA, Brugge JF, Chan JC (1987) Maps of auditory cortex in cats reared after unilateral cochlear ablation in the neonatal period. Brain research 431:281-290.
Reber PJ, Wong EC, Buxton RB, Frank LR (1998) Correction of off resonance-related distortion in echo-planar imaging using EPI-based field maps. Magnetic resonance in medicine : official journal of the Society of Magnetic Resonance in Medicine / Society of Magnetic Resonance in Medicine 39:328-330.

References
294
Reese TG, Heid O, Weisskoff RM, Wedeen VJ (2003) Reduction of eddy-current-induced distortion in diffusion MRI using a twice-refocused spin echo. Magn Reson Med 49:177-182.
Reich DS, Smith SA, Jones CK, Zackowski KM, van Zijl PC, Calabresi PA, Mori S (2006) Quantitative characterization of the corticospinal tract at 3T. AJNR Am J Neuroradiol 27:2168-2178.
Rhyu IJ, Cho TH, Lee NJ, Uhm CS, Kim H, Suh YS (1999) Magnetic resonance image-based cerebellar volumetry in healthy Korean adults. Neuroscience letters 270:149-152.
Ridding MC, Brouwer B, Nordstrom MA (2000) Reduced interhemispheric inhibition in musicians. Experimental brain research Experimentelle Hirnforschung Experimentation cerebrale 133:249-253.
Rizzolatti G, Arbib MA (1998) Language within our grasp. Trends Neurosci 21:188-194. Rizzolatti G, Fadiga L, Matelli M, Bettinardi V, Paulesu E, Perani D, Fazio F (1996)
Localization of grasp representations in humans by PET: 1. Observation versus execution. Exp Brain Res 111:246-252.
Roberts N, Garden A, Cruz-Orive L, Whitehouse G, Edwards R (1994a) Estimation of fetal volume by magnetic resonance inaging and stereology. British Journal of Radiology 67:1067-1077.
Roberts N, Garden AS, Cruz-Orive LM, Whitehouse GH, Edwards RH (1994b) Estimation of fetal volume by magnetic resonance imaging and stereology. The British journal of radiology 67:1067-1077.
Roberts N, Puddephat MJ, McNulty V (2000) The benefit of stereology for quantitative radiology. The British journal of radiology 73:679-697.
Roberts TP, Liu F, Kassner A, Mori S, Guha A (2005) Fiber density index correlates with reduced fractional anisotropy in white matter of patients with glioblastoma. AJNR Am J Neuroradiol 26:2183-2186.
Roberts TP, Schwartz ES (2007) Principles and implementation of diffusion-weighted and diffusion tensor imaging. Pediatric radiology 37:739-748.
Robertson EM, Tormos JM, Maeda F, Pascual-Leone A (2001) The role of the dorsolateral prefrontal cortex during sequence learning is specific for spatial information. Cereb Cortex 11:628-635.
Rockel AJ, Hiorns RW, Powell TP (1974) Proceedings: Numbers of neurons through full depth of neocortex. J Anat 118:371.
Rockel AJ, Hiorns RW, Powell TP (1980) The basic uniformity in structure of the neocortex. Brain : a journal of neurology 103:221-244.
Roland PE, Zilles K (1994) Brain atlases--a new research tool. Trends in neurosciences 17:458-467.
Rose SE, Chen F, Chalk JB, Zelaya FO, Strugnell WE, Benson M, Semple J, Doddrell DM (2000) Loss of connectivity in Alzheimer's disease: an evaluation of white matter tract integrity with colour coded MR diffusion tensor imaging. J Neurol Neurosurg Psychiatry 69:528-530.
Rotarska-Jagiela A, Schonmeyer R, Oertel V, Haenschel C, Vogeley K, Linden DE (2008) The corpus callosum in schizophrenia-volume and connectivity changes affect specific regions. Neuroimage 39:1522-1532.
Rowe JB, Toni I, Josephs O, Frackowiak RS, Passingham RE (2000) The prefrontal cortex: response selection or maintenance within working memory? Science (New York, NY 288:1656-1660.
Rowley HA, Grant PE, Roberts TP (1999) Diffusion MR imaging. Theory and applications. Neuroimaging clinics of North America 9:343-361.
Rueda A, Acosta O, Couprie M, Bourgeat P, Fripp J, Dowson N, Romero E, Salvado O (2010) Topology-corrected segmentation and local intensity estimates for improved partial volume classification of brain cortex in MRI. J Neurosci Methods 188:305-315.
Rumsey JM, Casanova M, Mannheim GB, Patronas N, De Vaughn N, Hamburger SD, Aquino T (1996) Corpus callosum morphology, as measured with MRI, in dyslexic men. Biol Psychiatry 39:769-775.
Russeler J, Altenmuller E, Nager W, Kohlmetz C, Munte TF (2001) Event-related brain potentials to sound omissions differ in musicians and non-musicians. Neurosci Lett 308:33-36.

References
295
Sacco K, Cauda F, D'Agata F, Mate D, Duca S, Geminiani G (2009) Reorganization and enhanced functional connectivity of motor areas in repetitive ankle movements after training in locomotor attention. Brain research 1297:124-134.
Saksena S, Husain N, Das V, Pradhan M, Trivedi R, Srivastava S, Malik GK, Rathore RK, Sarma M, Pandey CM, Gupta RK (2008a) Diffusion tensor imaging in the developing human cerebellum with histologic correlation. Int J Dev Neurosci 26:705-711.
Saksena S, Husain N, Malik GK, Trivedi R, Sarma M, Rathore RS, Pandey CM, Gupta RK (2008b) Comparative evaluation of the cerebral and cerebellar white matter development in pediatric age group using quantitative diffusion tensor imaging. Cerebellum 7:392-400.
Salamon N, Sicotte N, Drain A, Frew A, Alger JR, Jen J, Perlman S, Salamon G (2007) White matter fiber tractography and color mapping of the normal human cerebellum with diffusion tensor imaging. J Neuroradiol 34:115-128.
Salat DH, Buckner RL, Snyder AZ, Greve DN, Desikan RS, Busa E, Morris JC, Dale AM, Fischl B (2004) Thinning of the cerebral cortex in aging. Cereb Cortex 14:721-730.
Salo R, Nordahl TE, Buonocore MH, Natsuaki Y, Waters C, Moore CD, Galloway GP, Leamon MH (2009) Cognitive control and white matter callosal microstructure in methamphetamine-dependent subjects: a diffusion tensor imaging study. Biol Psychiatry 65:122-128.
Saxe MD, Battaglia F, Wang JW, Malleret G, David DJ, Monckton JE, Garcia AD, Sofroniew MV, Kandel ER, Santarelli L, Hen R, Drew MR (2006) Ablation of hippocampal neurogenesis impairs contextual fear conditioning and synaptic plasticity in the dentate gyrus. Proceedings of the National Academy of Sciences of the United States of America 103:17501-17506.
Schaechter JD, Kraft E, Hilliard TS, Dijkhuizen RM, Benner T, Finklestein SP, Rosen BR, Cramer SC (2002) Motor recovery and cortical reorganization after constraint-induced movement therapy in stroke patients: a preliminary study. Neurorehabilitation and neural repair 16:326-338.
Schaechter JD, Perdue KL, Wang R (2008) Structural damage to the corticospinal tract correlates with bilateral sensorimotor cortex reorganization in stroke patients. Neuroimage 39:1370-1382.
Schenker NM, Buxhoeveden DP, Blackmon WL, Amunts K, Zilles K, Semendeferi K (2008) A comparative quantitative analysis of cytoarchitecture and minicolumnar organization in Broca's area in humans and great apes. J Comp Neurol 510:117-128.
Schlaepfer TE, Harris GJ, Tien AY, Peng L, Lee S, Pearlson GD (1995) Structural differences in the cerebral cortex of healthy female and male subjects: a magnetic resonance imaging study. Psychiatry research 61:129-135.
Schlaug G (2001) The brain of musicians. A model for functional and structural adaptation. Ann N Y Acad Sci 930:281-299.
Schlaug G, Jancke L, Huang Y, Staiger JF, Steinmetz H (1995a) Increased corpus callosum size in musicians. Neuropsychologia 33:1047-1055.
Schlaug G, Jancke L, Huang Y, Steinmetz H (1995b) In vivo evidence of structural brain asymmetry in musicians. Science 267:699-701.
Schlaug G, Lee LHL, Thangaraj V (1998) Macrostructural adaptation of the cerebellum in musicians. Soc Neurosci 24:842-847.
Schlaug G, Marchina S, Norton A (2009) Evidence for plasticity in white-matter tracts of patients with chronic Broca's aphasia undergoing intense intonation-based speech therapy. Annals of the New York Academy of Sciences 1169:385-394.
Schmidt-Wilcke T, Rosengarth K, Luerding R, Bogdahn U, Greenlee MW (2010) Distinct patterns of functional and structural neuroplasticity associated with learning Morse code. NeuroImage 51:1234-1241.
Schmierer K, Wheeler-Kingshott CA, Boulby PA, Scaravilli F, Altmann DR, Barker GJ, Tofts PS, Miller DH (2007) Diffusion tensor imaging of post mortem multiple sclerosis brain. NeuroImage 35:467-477.
Schmithorst VJ, Wilke M (2002) Differences in white matter architecture between musicians and non-musicians: a diffusion tensor imaging study. Neuroscience letters 321:57-60.

References
296
Schmitt JE, Eliez S, Warsofsky IS, Bellugi U, Reiss AL (2001) Corpus callosum morphology of Williams syndrome: relation to genetics and behavior. Dev Med Child Neurol 43:155-159.
Schneider P, Scherg M, Dosch HG, Specht HJ, Gutschalk A, Rupp A (2002) Morphology of Heschl's gyrus reflects enhanced activation in the auditory cortex of musicians. Nature neuroscience 5:688-694.
Schneider P, Sluming V, Roberts N, Bleeck S, Rupp A (2005) Structural, functional, and perceptual differences in Heschl's gyrus and musical instrument preference. Annals of the New York Academy of Sciences 1060:387-394.
Schneider S, Schonle PW, Altenmuller E, Munte TF (2007) Using musical instruments to improve motor skill recovery following a stroke. J Neurol 254:1339-1346.
Schoenemann PT, Sheehan MJ, Glotzer LD (2005) Prefrontal white matter volume is disproportionately larger in humans than in other primates. Nature neuroscience 8:242-252.
Scholz J, Klein MC, Behrens TE, Johansen-Berg H (2009) Training induces changes in white-matter architecture. Nature neuroscience 12:1370-1371.
Schulte T, Pfefferbaum A, Sullivan EV (2004) Parallel interhemispheric processing in aging and alcoholism: relation to corpus callosum size. Neuropsychologia 42:257-271.
Schulz M, Ross B, Pantev C (2003) Evidence for training-induced crossmodal reorganization of cortical functions in trumpet players. Neuroreport 14:157-161.
Sergent J, Zuck E, Terriah S, MacDonald B (1992) Distributed neural network underlying musical sight-reading and keyboard performance. Science 257:106-109.
Shahin AJ, Roberts LE, Chau W, Trainor LJ, Miller LM (2008) Music training leads to the development of timbre-specific gamma band activity. Neuroimage 41:113-122.
Shepard RN, Metzler J (1971) Mental rotation of three-dimensional objects. Science 171:701-703.
Sheynikhovich D, Otani S, Arleo A (2011) The role of tonic and phasic dopamine for long-term synaptic plasticity in the prefrontal cortex: A computational model. Journal of physiology, Paris 105:45-52.
Shimony JS, Burton H, Epstein AA, McLaren DG, Sun SW, Snyder AZ (2006) Diffusion tensor imaging reveals white matter reorganization in early blind humans. Cereb Cortex 16:1653-1661.
Sinnatamby CS (2006) LAST'S ANATOMY: REGIONAL AND APPLIED. Philadelphia: Churchill Livingstone.
Sisodiya S, Free S, Fish D, Shorvon S (1996) MRI-based surface area estimates in the normal adult human brain: evidence for structural organisation. J Anat 188 ( Pt 2):425-438.
Sisodiya SM, Free SL (1997) Disproportion of cerebral surface areas and volumes in cerebral dysgenesis. MRI-based evidence for connectional abnormalities. Brain : a journal of neurology 120 ( Pt 2):271-281.
Siucinska E, Kossut M (1996) Short-lasting classical conditioning induces reversible changes of representational maps of vibrissae in mouse SI cortex--a 2DG study. Cereb Cortex 6:506-513.
Sluming V, Barrick T, Howard M, Cezayirli E, Mayes A, Roberts N (2002) Voxel-based morphometry reveals increased gray matter density in Broca's area in male symphony orchestra musicians. NeuroImage 17:1613-1622.
Sluming V, Brooks J, Howard M, Downes JJ, Roberts N (2007) Broca's area supports enhanced visuospatial cognition in orchestral musicians. The Journal of neuroscience : the official journal of the Society for Neuroscience 27:3799-3806.
Smith R (2005) Relative size versus controlling for size. Current Anthropol 46:249-273. Smith SM (2002) Fast robust automated brain extraction. Hum Brain Mapp 17:143-155. Smith SM, Jenkinson M, Johansen-Berg H, Rueckert D, Nichols TE, Mackay CE,
Watkins KE, Ciccarelli O, Cader MZ, Matthews PM, Behrens TE (2006) Tract-based spatial statistics: voxelwise analysis of multi-subject diffusion data. NeuroImage 31:1487-1505.

References
297
Snell RS (2001) Clinical Neuroanatomy for Medical Students. Philadelphia: Lippincott Williams & Wilkins.
Snook L, Plewes C, Beaulieu C (2007) Voxel based versus region of interest analysis in diffusion tensor imaging of neurodevelopment. Neuroimage 34:243-252.
Snyder JS, Kee N, Wojtowicz JM (2001) Effects of adult neurogenesis on synaptic plasticity in the rat dentate gyrus. Journal of neurophysiology 85:2423-2431.
Snyder PJ, Bilder RM, Wu H, Bogerts B, Lieberman JA (1995) Cerebellar volume asymmetries are related to handedness: a quantitative MRI study. Neuropsychologia 33:407-419.
Song SK, Sun SW, Ramsbottom MJ, Chang C, Russell J, Cross AH (2002) Dysmyelination revealed through MRI as increased radial (but unchanged axial) diffusion of water. NeuroImage 17:1429-1436.
Song SK, Yoshino J, Le TQ, Lin SJ, Sun SW, Cross AH, Armstrong RC (2005) Demyelination increases radial diffusivity in corpus callosum of mouse brain. NeuroImage 26:132-140.
Sowell ER, Peterson BS, Kan E, Woods RP, Yoshii J, Bansal R, Xu D, Zhu H, Thompson PM, Toga AW (2007) Sex differences in cortical thickness mapped in 176 healthy individuals between 7 and 87 years of age. Cereb Cortex 17:1550-1560.
Sparks R, Helm N, Albert M (1974) Aphasia rehabilitation resulting from melodic intonation therapy. Cortex 10:303-316.
Steinmetz H, Furst G, Freund HJ (1989a) Cerebral cortical localization: application and validation of the proportional grid system in MR imaging. Journal of computer assisted tomography 13:10-19.
Steinmetz H, Rademacher J, Huang YX, Hefter H, Zilles K, Thron A, Freund HJ (1989b) Cerebral asymmetry: MR planimetry of the human planum temporale. J Comput Assist Tomogr 13:996-1005.
Steinmetz H, Staiger JF, Schlaug G, Huang Y, Jancke L (1995) Corpus callosum and brain volume in women and men. Neuroreport 6:1002-1004.
Stejskal EO, Tanner JE (1965) Spin Diffusion Measurements: Spin Echoes in the Presence of a Time-Dependent Field Gradient. The Journal of Chemical Physics 42:288-292.
Stewart L, Henson R, Kampe K, Walsh V, Turner R, Frith U (2003) Brain changes after learning to read and play music. NeuroImage 20:71-83.
Stewart L, Walsh V, Frith U (2004) Reading music modifies spatial mapping in pianists. Percept Psychophys 66:183-195.
Stieltjes B, Kaufmann WE, van Zijl PC, Fredericksen K, Pearlson GD, Solaiyappan M, Mori S (2001) Diffusion tensor imaging and axonal tracking in the human brainstem. NeuroImage 14:723-735.
Stoodley CJ, Valera EM, Schmahmann JD (2010) An fMRI study of intra-individual functional topography in the human cerebellum. Behav Neurol 23:65-79.
Sullivan EV, Adalsteinsson E, Hedehus M, Ju C, Moseley M, Lim KO, Pfefferbaum A (2001) Equivalent disruption of regional white matter microstructure in ageing healthy men and women. Neuroreport 12:99-104.
Sun SW, Liang HF, Trinkaus K, Cross AH, Armstrong RC, Song SK (2006) Noninvasive detection of cuprizone induced axonal damage and demyelination in the mouse corpus callosum. Magn Reson Med 55:302-308.
Sundgren PC, Dong Q, Gomez-Hassan D, Mukherji SK, Maly P, Welsh R (2004) Diffusion tensor imaging of the brain: review of clinical applications. Neuroradiology 46:339-350.
Svansdottir HB, Snaedal J (2006) Music therapy in moderate and severe dementia of Alzheimer's type: a case-control study. Int Psychogeriatr 18:613-621.
Swain RA, Harris AB, Wiener EC, Dutka MV, Morris HD, Theien BE, Konda S, Engberg K, Lauterbur PC, Greenough WT (2003) Prolonged exercise induces angiogenesis and increases cerebral blood volume in primary motor cortex of the rat. Neuroscience 117:1037-1046.
Szabo CA, Lancaster JL, Xiong J, Cook C, Fox P (2003) MR imaging volumetry of subcortical structures and cerebellar hemispheres in normal persons. AJNR American journal of neuroradiology 24:644-647.

References
298
Tae WS, Kim SS, Lee KU, Nam EC, Kim KW (2008) Validation of hippocampal volumes measured using a manual method and two automated methods (FreeSurfer and IBASPM) in chronic major depressive disorder. Neuroradiology 50:569-581.
Takao H, Abe O, Yamasue H, Aoki S, Sasaki H, Kasai K, Yoshioka N, Ohtomo K (2011) Gray and white matter asymmetries in healthy individuals aged 21-29 years: a voxel-based morphometry and diffusion tensor imaging study. Human brain mapping 32:1762-1773.
Takeuchi AH, Hulse SH (1993) Absolute pitch. Psychol Bull 113:345-361. Takeuchi H, Taki Y, Hashizume H, Sassa Y, Nagase T, Nouchi R, Kawashima R (2011)
Effects of training of processing speed on neural systems. The Journal of neuroscience : the official journal of the Society for Neuroscience 31:12139-12148.
Taki Y, Thyreau B, Kinomura S, Sato K, Goto R, Kawashima R, Fukuda H (2011) Correlations among brain gray matter volumes, age, gender, and hemisphere in healthy individuals. PloS one 6:e22734.
Talairach J, Tournoux P (1988) Co-planar stereotaxic atlas of the human brain. Stuttgart: G. Thieme.
Tate DF, Conley J, Paul RH, Coop K, Zhang S, Zhou W, Laidlaw DH, Taylor LE, Flanigan T, Navia B, Cohen R, Tashima K (2010) Quantitative diffusion tensor imaging tractography metrics are associated with cognitive performance among HIV-infected patients. Brain Imaging Behav 4:68-79.
Tench CR, Morgan PS, Blumhardt LD, Constantinescu C (2002) Improved white matter fiber tracking using stochastic labeling. Magnetic resonance in medicine : official journal of the Society of Magnetic Resonance in Medicine / Society of Magnetic Resonance in Medicine 48:677-683.
Tettamanti M, Buccino G, Saccuman MC, Gallese V, Danna M, Scifo P, Fazio F, Rizzolatti G, Cappa SF, Perani D (2005) Listening to action-related sentences activates fronto-parietal motor circuits. J Cogn Neurosci 17:273-281.
Thach WT (1998) A role for the cerebellum in learning movement coordination. Neurobiol Learn Mem 70:177-188.
Thomann PA, Wustenberg T, Pantel J, Essig M, Schroder J (2006) Structural changes of the corpus callosum in mild cognitive impairment and Alzheimer's disease. Dement Geriatr Cogn Disord 21:215-220.
Thomas B, Eyssen M, Peeters R, Molenaers G, Van Hecke P, De Cock P, Sunaert S (2005) Quantitative diffusion tensor imaging in cerebral palsy due to periventricular white matter injury. Brain 128:2562-2577.
Thompson PM, Cannon TD, Narr KL, van Erp T, Poutanen VP, Huttunen M, Lonnqvist J, Standertskjold-Nordenstam CG, Kaprio J, Khaledy M, Dail R, Zoumalan CI, Toga AW (2001) Genetic influences on brain structure. Nature neuroscience 4:1253-1258.
Thomsen C, Henriksen O, Ring P (1987) In vivo measurement of water self diffusion in the human brain by magnetic resonance imaging. Acta Radiol 28:353-361.
Tiemeier H, Lenroot RK, Greenstein DK, Tran L, Pierson R, Giedd JN (2010) Cerebellum development during childhood and adolescence: a longitudinal morphometric MRI study. Neuroimage 49:63-70.
Tijssen RH, Jansen JF, Backes WH (2009) Assessing and minimizing the effects of noise and motion in clinical DTI at 3 T. Human brain mapping 30:2641-2655.
Tomaiuolo F, Di Paola M, Caravale B, Vicari S, Petrides M, Caltagirone C (2002) Morphology and morphometry of the corpus callosum in Williams syndrome: a T1-weighted MRI study. Neuroreport 13:2281-2284.
Tomaiuolo F, MacDonald JD, Caramanos Z, Posner G, Chiavaras M, Evans AC, Petrides M (1999) Morphology, morphometry and probability mapping of the pars opercularis of the inferior frontal gyrus: an in vivo MRI analysis. Eur J Neurosci 11:3033-3046.
Tomasch J (1954) Size distribution and number of fibers in the human corpus callosum. Anat Rec 119:119-135.
Toni N, Buchs PA, Nikonenko I, Bron CR, Muller D (1999) LTP promotes formation of multiple spine synapses between a single axon terminal and a dendrite. Nature 402:421-425.

References
299
Toni N, Buchs PA, Nikonenko I, Povilaitite P, Parisi L, Muller D (2001) Remodeling of synaptic membranes after induction of long-term potentiation. The Journal of neuroscience : the official journal of the Society for Neuroscience 21:6245-6251.
Tournier JD, Calamante F, King MD, Gadian DG, Connelly A (2002) Limitations and requirements of diffusion tensor fiber tracking: an assessment using simulations. Magnetic resonance in medicine : official journal of the Society of Magnetic Resonance in Medicine / Society of Magnetic Resonance in Medicine 47:701-708.
Trachtenberg JT, Chen BE, Knott GW, Feng G, Sanes JR, Welker E, Svoboda K (2002) Long-term in vivo imaging of experience-dependent synaptic plasticity in adult cortex. Nature 420:788-794.
Trainor LJ, Shahin AJ, Roberts LE (2009a) Understanding the benefits of musical training: effects on oscillatory brain activity. Ann N Y Acad Sci 1169:133-142.
Trainor LJ, Shahin AJ, Roberts LE (2009b) Understanding the benefits of musical training: effects on oscillatory brain activity. Ann N Y Acad Sci 1169:133-142.
Tramo MJ, Loftus WC, Stukel TA, Green RL, Weaver JB, Gazzaniga MS (1998) Brain size, head size, and intelligence quotient in monozygotic twins. Neurology 50:1246-1252.
Trehub SE (2003) The developmental origins of musicality. Nat Neurosci 6:669-673. Tremblay KL, Kraus N (2002) Auditory training induces asymmetrical changes in
cortical neural activity. J Speech Lang Hear Res 45:564-572. Trepel C, Racine RJ (1998) Long-term potentiation in the neocortex of the adult, freely
moving rat. Cereb Cortex 8:719-729. Trivedi R, Husain N, Rathore RK, Saksena S, Srivastava S, Malik GK, Das V, Pradhan
M, Pandey CM, Gupta RK (2009) Correlation of diffusion tensor imaging with histology in the developing human frontal cerebrum. Dev Neurosci 31:487-496.
Tsumoto T (1992) Long-term potentiation and long-term depression in the neocortex. Progress in neurobiology 39:209-228.
Tuch DS, Reese TG, Wiegell MR, Makris N, Belliveau JW, Wedeen VJ (2002) High angular resolution diffusion imaging reveals intravoxel white matter fiber heterogeneity. Magnetic resonance in medicine : official journal of the Society of Magnetic Resonance in Medicine / Society of Magnetic Resonance in Medicine 48:577-582.
Tuch DS, Reese TG, Wiegell MR, Wedeen VJ (2003) Diffusion MRI of complex neural architecture. Neuron 40:885-895.
Tuch DS, Salat DH, Wisco JJ, Zaleta AK, Hevelone ND, Rosas HD (2005) Choice reaction time performance correlates with diffusion anisotropy in white matter pathways supporting visuospatial attention. Proceedings of the National Academy of Sciences of the United States of America 102:12212-12217.
Ueda S, Sakakibara S, Yoshimoto K (2005) Effect of long-lasting serotonin depletion on environmental enrichment-induced neurogenesis in adult rat hippocampus and spatial learning. Neuroscience 135:395-402.
Ulrich G, Houtmans T, Gold C (2007) The additional therapeutic effect of group music therapy for schizophrenic patients: a randomized study. Acta psychiatrica Scandinavica 116:362-370.
van Praag H, Christie BR, Sejnowski TJ, Gage FH (1999a) Running enhances neurogenesis, learning, and long-term potentiation in mice. Proceedings of the National Academy of Sciences of the United States of America 96:13427-13431.
van Praag H, Kempermann G, Gage FH (1999b) Running increases cell proliferation and neurogenesis in the adult mouse dentate gyrus. Nature neuroscience 2:266-270.
van Praag H, Kempermann G, Gage FH (2000) Neural consequences of environmental enrichment. Nature reviews Neuroscience 1:191-198.
Verheul MH, Geuze RH (2004) Bimanual coordination and musical experience: the role of intrinsic dynamics and behavioral information. Motor control 8:270-291.
Vernooij MW, Smits M, Wielopolski PA, Houston GC, Krestin GP, van der Lugt A (2007) Fiber density asymmetry of the arcuate fasciculus in relation to functional

References
300
hemispheric language lateralization in both right- and left-handed healthy subjects: a combined fMRI and DTI study. Neuroimage 35:1064-1076.
Virta A, Barnett A, Pierpaoli C (1999) Visualizing and characterizing white matter fiber structure and architecture in the human pyramidal tract using diffusion tensor MRI. Magnetic resonance imaging 17:1121-1133.
Vogt S, Buccino G, Wohlschlager AM, Canessa N, Shah NJ, Zilles K, Eickhoff SB, Freund HJ, Rizzolatti G, Fink GR (2007) Prefrontal involvement in imitation learning of hand actions: effects of practice and expertise. NeuroImage 37:1371-1383.
Vovk U, Pernus F, Likar B (2007) A review of methods for correction of intensity inhomogeneity in MRI. IEEE transactions on medical imaging 26:405-421.
Vuust P, Pallesen KJ, Bailey C, van Zuijen TL, Gjedde A, Roepstorff A, Ostergaard L (2005) To musicians, the message is in the meter pre-attentive neuronal responses to incongruent rhythm are left-lateralized in musicians. NeuroImage 24:560-564.
Wahl M, Lauterbach-Soon B, Hattingen E, Jung P, Singer O, Volz S, Klein JC, Steinmetz H, Ziemann U (2007) Human motor corpus callosum: topography, somatotopy, and link between microstructure and function. The Journal of neuroscience : the official journal of the Society for Neuroscience 27:12132-12138.
Wakana S, Jiang H, Nagae-Poetscher LM, van Zijl PC, Mori S (2004) Fiber tract-based atlas of human white matter anatomy. Radiology 230:77-87.
Walhovd KB, Fjell AM, Reinvang I, Lundervold A, Dale AM, Eilertsen DE, Quinn BT, Salat D, Makris N, Fischl B (2005) Effects of age on volumes of cortex, white matter and subcortical structures. Neurobiol Aging 26:1261-1270; discussion 1275-1268.
Watanabe D, Savion-Lemieux T, Penhune VB (2007) The effect of early musical training on adult motor performance: evidence for a sensitive period in motor learning. Experimental brain research Experimentelle Hirnforschung Experimentation cerebrale 176:332-340.
Watanabe T, Iwasaki K, Ishikane S, Naitou T, Yoshimitsu Y, Yamagata N, Ozdemir MB, Takasaki K, Egashira N, Mishima K, Fujiwara M (2008) Spatial memory impairment without apoptosis induced by the combination of beta-amyloid oligomers and cerebral ischemia is related to decreased acetylcholine release in rats. J Pharmacol Sci 106:84-91.
Watson AH (2006) What can studying musicians tell us about motor control of the hand? J Anat 208:527-542.
Wedeen VJ, Hagmann P, Tseng WY, Reese TG, Weisskoff RM (2005) Mapping complex tissue architecture with diffusion spectrum magnetic resonance imaging. Magnetic resonance in medicine : official journal of the Society of Magnetic Resonance in Medicine / Society of Magnetic Resonance in Medicine 54:1377-1386.
Weeks AC, Ivanco TL, Leboutillier JC, Racine RJ, Petit TL (2001) Sequential changes in the synaptic structural profile following long-term potentiation in the rat dentate gyrus: III. Long-term maintenance phase. Synapse 40:74-84.
Weis S, Kimbacher M, Wenger E, Neuhold A (1993) Morphometric analysis of the corpus callosum using MR: correlation of measurements with aging in healthy individuals. AJNR American journal of neuroradiology 14:637-645.
Westerhausen R, Kompus K, Dramsdahl M, Falkenberg LE, Gruner R, Hjelmervik H, Specht K, Plessen K, Hugdahl K (2011) A critical re-examination of sexual dimorphism in the corpus callosum microstructure. NeuroImage 56:874-880.
Westerhausen R, Kreuder F, Dos Santos Sequeira S, Walter C, Woerner W, Wittling RA, Schweiger E, Wittling W (2004) Effects of handedness and gender on macro- and microstructure of the corpus callosum and its subregions: a combined high-resolution and diffusion-tensor MRI study. Brain research Cognitive brain research 21:418-426.
Westerhausen R, Kreuder F, Dos Santos Sequeira S, Walter C, Woerner W, Wittling RA, Schweiger E, Wittling W (2006a) The association of macro- and microstructure of the corpus callosum and language lateralisation. Brain Lang 97:80-90.

References
301
Westerhausen R, Walter C, Kreuder F, Wittling RA, Schweiger E, Wittling W (2003) The influence of handedness and gender on the microstructure of the human corpus callosum: a diffusion-tensor magnetic resonance imaging study. Neuroscience letters 351:99-102.
Westerhausen R, Woerner W, Kreuder F, Schweiger E, Hugdahl K, Wittling W (2006b) The role of the corpus callosum in dichotic listening: a combined morphological and diffusion tensor imaging study. Neuropsychology 20:272-279.
Williams PL, Berry MM, Collins P, Dyson M, Dussek JE, Ferguson MWJ (eds.) (1995) Gray's Anatomy. London: Churchill Livingstone.
Wimberger DM, Roberts TP, Barkovich AJ, Prayer LM, Moseley ME, Kucharczyk J (1995) Identification of "premyelination" by diffusion-weighted MRI. J Comput Assist Tomogr 19:28-33.
Winocur G, Wojtowicz JM, Sekeres M, Snyder JS, Wang S (2006) Inhibition of neurogenesis interferes with hippocampus-dependent memory function. Hippocampus 16:296-304.
Witelson SF (1985) The brain connection: the corpus callosum is larger in left-handers. Science (New York, NY 229:665-668.
Witelson SF (1989) Hand and sex differences in the isthmus and genu of the human corpus callosum. A postmortem morphological study. Brain : a journal of neurology 112 ( Pt 3):799-835.
Witelson SF, Goldsmith CH (1991) The relationship of hand preference to anatomy of the corpus callosum in men. Brain research 545:175-182.
Wolff U, Lundberg I (2002) The prevalence of dyslexia among art students. Dyslexia 8:34-42.
Wong PC, Warrier CM, Penhune VB, Roy AK, Sadehh A, Parrish TB, Zatorre RJ (2007) Volume of Left Heschl's Gyrus and Linguistic Pitch Learning. Cereb Cortex.
Woolf CJ, Salter MW (2000) Neuronal plasticity: increasing the gain in pain. Science 288:1765-1769.
Wu CW, Chang YT, Yu L, Chen HI, Jen CJ, Wu SY, Lo CP, Kuo YM (2008) Exercise enhances the proliferation of neural stem cells and neurite growth and survival of neuronal progenitor cells in dentate gyrus of middle-aged mice. J Appl Physiol 105:1585-1594.
Wu KH, Chen CY, Shen EY (2011) The cerebellar development in chinese children-a study by voxel-based volume measurement of reconstructed 3D MRI scan. Pediatr Res 69:80-83.
Xiang HD, Fonteijn HM, Norris DG, Hagoort P (2009) Topographical Functional Connectivity Pattern in the Perisylvian Language Networks. Cereb Cortex.
Xu J, Li Y, Lin H, Sinha R, Potenza MN (2011) Body mass index correlates negatively with white matter integrity in the fornix and corpus callosum: A diffusion tensor imaging study. Human brain mapping.
Yamada M, Momoshima S, Masutani Y, Fujiyoshi K, Abe O, Nakamura M, Aoki S, Tamaoki N, Okano H (2008) Diffusion-tensor neuronal fiber tractography and manganese-enhanced MR imaging of primate visual pathway in the common marmoset: preliminary results. Radiology 249:855-864.
Yoo SS, O'Leary H M, Dickey CC, Wei XC, Guttmann CR, Park HW, Panych LP (2005) Functional asymmetry in human primary auditory cortex: identified from longitudinal fMRI study. Neuroscience letters 383:1-6.
Yousry TA, Schmid UD, Alkadhi H, Schmidt D, Peraud A, Buettner A, Winkler P (1997) Localization of the motor hand area to a knob on the precentral gyrus. A new landmark. Brain : a journal of neurology 120 ( Pt 1):141-157.
Yu C, Shu N, Li J, Qin W, Jiang T, Li K (2007) Plasticity of the corticospinal tract in early blindness revealed by quantitative analysis of fractional anisotropy based on diffusion tensor tractography. NeuroImage 36:411-417.
Yu HJ, Christodoulou C, Bhise V, Greenblatt D, Patel Y, Serafin D, Maletic-Savatic M, Krupp LB, Wagshul M (2011) Multiple white matter tract abnormalities underlie cognitive impairment in RRMS. NeuroImage.
Yuste R, Bonhoeffer T (2004) Genesis of dendritic spines: insights from ultrastructural and imaging studies. Nature reviews Neuroscience 5:24-34.

References
302
Zarei M, Johansen-Berg H, Smith S, Ciccarelli O, Thompson AJ, Matthews PM (2006) Functional anatomy of interhemispheric cortical connections in the human brain. J Anat 209:311-320.
Zatorre RJ (1998) Functional specialization of human auditory cortex for musical processing. Brain 121 ( Pt 10):1817-1818.
Zatorre RJ, Belin P (2001) Spectral and temporal processing in human auditory cortex. Cereb Cortex 11:946-953.
Zatorre RJ, Perry DW, Beckett CA, Westbury CF, Evans AC (1998) Functional anatomy of musical processing in listeners with absolute pitch and relative pitch. Proceedings of the National Academy of Sciences of the United States of America 95:3172-3177.
Zhang H, Alexander DC (2010) Axon diameter mapping in the presence of orientation dispersion with diffusion MRI. Medical image computing and computer-assisted intervention : MICCAI International Conference on Medical Image Computing and Computer-Assisted Intervention 13:640-647.
Zhang H, Hubbard PL, Parker GJ, Alexander DC (2011) Axon diameter mapping in the presence of orientation dispersion with diffusion MRI. NeuroImage 56:1301-1315.
Zhao C, Teng EM, Summers RG, Jr., Ming GL, Gage FH (2006) Distinct morphological stages of dentate granule neuron maturation in the adult mouse hippocampus. J Neurosci 26:3-11.
Zhao M, Momma S, Delfani K, Carlen M, Cassidy RM, Johansson CB, Brismar H, Shupliakov O, Frisen J, Janson AM (2003) Evidence for neurogenesis in the adult mammalian substantia nigra. Proceedings of the National Academy of Sciences of the United States of America 100:7925-7930.
Zhou Q, Homma KJ, Poo MM (2004) Shrinkage of dendritic spines associated with long-term depression of hippocampal synapses. Neuron 44:749-757.
Zhuang L, Wen W, Trollor JN, Kochan NA, Reppermund S, Brodaty H, Sachdev P (2012) Abnormalities of the Fornix in Mild Cognitive Impairment are Related to Episodic Memory Loss. Journal of Alzheimer's disease : JAD.
Zilles K (1992) Neuronal plasticity as an adaptive property of the central nervous system. Ann Anat 174:383-391.
Zilles K, Schleicher A, Langemann C, Amunts K, Morosan P, Palomero-Gallagher N, Schormann T, Mohlberg H, Burgel U, Steinmetz H, Schlaug G, Roland PE (1997) Quantitative analysis of sulci in the human cerebral cortex: development, regional heterogeneity, gender difference, asymmetry, intersubject variability and cortical architecture. Human brain mapping 5:218-221.
Zou K, Huang X, Li T, Gong Q, Li Z, Ou-yang L, Deng W, Chen Q, Li C, Ding Y, Sun X (2008) Alterations of white matter integrity in adults with major depressive disorder: a magnetic resonance imaging study. J Psychiatry Neurosci 33:525-530.

303
APPENDIX- PUBLICATIONS AND AWARDS

Appendix-Publications & Awards
304
1. Abdul-Kareem IA & Sluming V (2008): Heschl Gyrus and Its Included Primary
Auditory Cortex: Structural MRI Studies in Healthy and Diseased Subjects.
JMRI.
Journal publications
28(2):287-99
2. Abdul-Kareem IA, Stancak A, Parkes L & Sluming V (2009): Regional
corpus callosum morphometry: Effect of field strength and pulse sequence.
JMRI. 30(5):1184-90.
.
3. Abdul-Kareem IA, Stancak A, Parkes L & Sluming V (2011): Increased gray
matter volume of left pars opercularis in male orchestral musicians correlate
positively with years of musical performance. JMRI. 33(1):24-32.
4. Abdul-Kareem IA, Stancak A, Parkes L, Al-Ameen M, AlGhamdi J, Aldhafeeri F, Embleton K, Morris D & Sluming V (2011): Plasticity of the
superior and middle cerebellar peduncles in musicians revealed by quantitative
analysis of volume and number of streamlines based on diffusion tensor
tractography. Cerebellum. 10: 611-623.
1. Abdul-Kareem IA & Sluming V (2009): Comparison of scanning at different
field strengths and pulse sequences using voxel-based morphometry.
Proceedings of Salford Postgraduate Annual Research Conference, SPARC.
University of Salford, Manchester.
Conference papers
1. Abdul-Kareem IA, Stancak A, Parkes L & Sluming V (2009): Increased gray
matter volume of left pars opercularis correlated positively with years of musical
performance in male orchestral musicians. British Neuroscience Association,
20th National Meeting, Liverpool. Poster no. 4.14.
Abstracts presented at conferences and symposia (poster presentation)
2. Abdul-Kareem IA, Stancak A, Parkes L & Sluming V (2009): Regional
corpus callosum morphometry: Effect of field strength and pulse sequence. 18th
3. Sluming V, Abdul-Kareem IA, Garcia-Finana M & Cowell PE (2009):
Morphometry of the corpus callosum: comparing male orchestral musicians and
non-musicians. International Society of Magnetic Resonance Imaging in
Medicine, ISMRM conference. Honolulu, USA. Poster no. 4956.
British Chapter ISMRM annual symposium for PhD students and Post-docs.
Imperial College, Hammersmith Hospital, London. Poster no. 1.
4. Abdul-Kareem IA, Stancak A, Parkes L & Sluming V (2011): Increased cross
sectional area of genu and splenium of corpus callosum in professional
musicians compared to amateur musicians and controls. International Society

Appendix-Publications & Awards
305
of Magnetic Resonance Imaging in Medicine, ISMRM conference. Montreal,
Canada. Electronic poster no. 7024. 5. Abdul-Kareem IA, AlGhamdi J, Stancak A, Parkes L & Sluming V (2011):
Plasticity of the superior and middle cerebellar peduncles in musicians revealed
by DTI. Organization of Brain Mapping Conference, OHBM, Quebec, Canada,
Poster no. 2234.
1. Abdul-Kareem IA & Sluming V (2009): Comparison of scanning at different
field strengths and pulse sequences using voxel-based morphometry. Salford
Postgraduate Annual Research Conference, SPARC. University of Salford,
Manchester.
Abstracts presented at conferences and symposia (oral presentation)
2. Abdul-Kareem IA & Sluming V (2009): Increased cortical surface area of left
Brodmann area 44 in orchestral musicians Postgraduate Researchers in
Science Medicine, PRISM conference. University of Manchester, Manchester.
1. Poster prize winner (2
Prizes and awards
nd
2. ISMRM award, Stockholm-Sweden, 2010.
prize), University of Liverpool poster day, 2010. Poster
title: Increased gray matter volume of left pars opercularis in male orchestral
musicians correlated positively with years of musical performance.
3. ISMRM award, Montreal-Canada, 2011.