# name date period study guide: unit 5 - psd202.org
TRANSCRIPT
#_______ Name ___________________________________________________________ Date _______________________________ Period ________
Study Guide: Unit 5
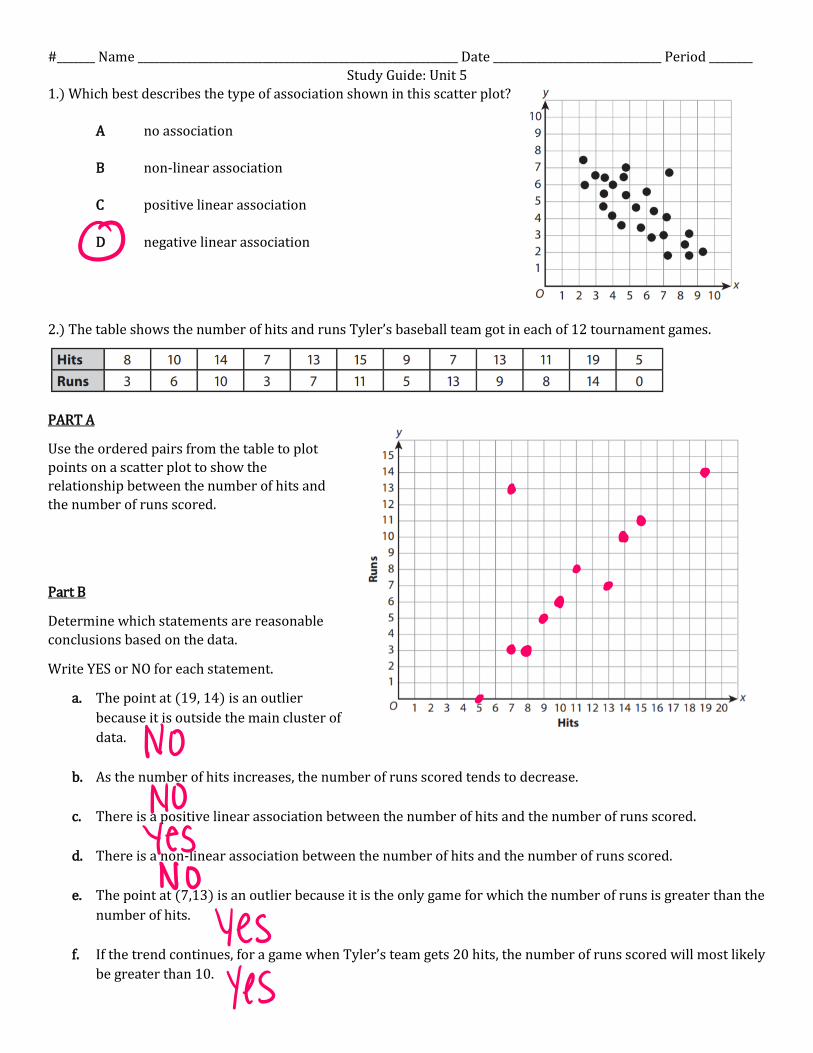
1.) Which best describes the type of association shown in this scatter plot?
A no association
B non-linear association
C positive linear association
D negative linear association
2.) The table shows the number of hits and runs Tyler’s baseball team got in each of 12 tournament games.
PART A
Use the ordered pairs from the table to plot
points on a scatter plot to show the
relationship between the number of hits and
the number of runs scored.
Part B
Determine which statements are reasonable
conclusions based on the data.
Write YES or NO for each statement.
a. The point at (19, 14) is an outlier
because it is outside the main cluster of
data.
b. As the number of hits increases, the number of runs scored tends to decrease.
c. There is a positive linear association between the number of hits and the number of runs scored.
d. There is a non-linear association between the number of hits and the number of runs scored.
e. The point at (7,13) is an outlier because it is the only game for which the number of runs is greater than the
number of hits.
f. If the trend continues, for a game when Tyler’s team gets 20 hits, the number of runs scored will most likely
be greater than 10.

3.) A survey of 160 students is taken to determine whether they play sports and whether they have a job. Of the 71
students who play sports, 38 do not have a job. There are 87 students who have a job.
Fill in the table to show the data.
Play Sports Do Not Play
Sports Total
Have Job
Do Not Have Job
Total
4.) Amy and Jermaine randomly survey 250 people at a mall. They ask each person if they have ever traveled by
plane and if they have ever visited another country. The table shows the number of all respondent who fell into
each category.
Using the row totals, make a marginal relative frequency table to display the results of the survey. Round answers
to the nearest tenth.
Visited Another
Country Never Visited another
country
Been on an Airplane
Not Been on an Airplane
Based on the data, is there a clear association between having been on an airplane and having visited another
country? Explain your reasoning.

5.) Madison is monitoring the temperature over several hours. Her data are shown in the table. She draws a line of
best fit with the equation, 𝑦 = −6.2𝑥 + 64, where x represents the hour and y
represents the temperature.
Describe the meaning of the slope and y-intercept in this context.
6.) Jessenia surverys eighth graders at her school about their favorite subjects. She creates a table to summarize
their responses.
PART A
Write a number in each blank to form true statements.
Round your answers to the nearest whole number.
_____ % of the eighth graders chose science as their favorite subject.
_____ % of the girls chose math as their favorite subject.
_____ % of the boys chose English as their favorite subject.
_____ % of the eighth graders surveyed are boys.
PART B
Which of these statements are true? Choose all that apply.
A More than 20% of girls and more than 20% of boys chose math as their favorite subject.
B Fewer than 30% of girls and fewer than 20% of boys chose English as their favorite subject.
C Fewer than 20% of girls and fewer than 20% of boys chose history as their favorite subject.
D More than 20% of girls and more than 30% of boys chose science as their favorite subject.
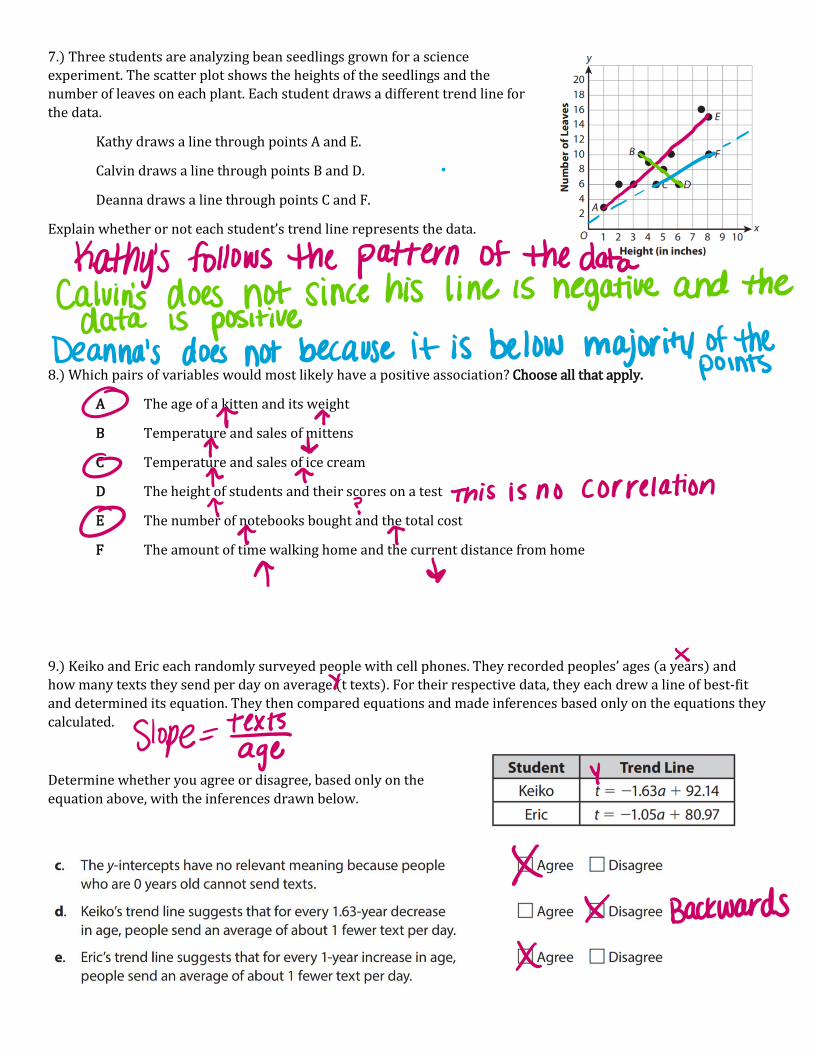
7.) Three students are analyzing bean seedlings grown for a science
experiment. The scatter plot shows the heights of the seedlings and the
number of leaves on each plant. Each student draws a different trend line for
the data.
Kathy draws a line through points A and E.
Calvin draws a line through points B and D.
Deanna draws a line through points C and F.
Explain whether or not each student’s trend line represents the data.
8.) Which pairs of variables would most likely have a positive association? Choose all that apply.
A The age of a kitten and its weight
B Temperature and sales of mittens
C Temperature and sales of ice cream
D The height of students and their scores on a test
E The number of notebooks bought and the total cost
F The amount of time walking home and the current distance from home
9.) Keiko and Eric each randomly surveyed people with cell phones. They recorded peoples’ ages (a years) and
how many texts they send per day on average (t texts). For their respective data, they each drew a line of best-fit
and determined its equation. They then compared equations and made inferences based only on the equations they
calculated.
Determine whether you agree or disagree, based only on the
equation above, with the inferences drawn below.