jmejme.shahroodut.ac.ir/article_930_405d6648b59fe923b53dbc717a45e4d… · to road-cut assessment or...
TRANSCRIPT

JME Journal of Mining & Environment, Vol.8, No.3, 2017, 455-465.
DOI: 10.22044/jme.2017.930
A field investigation of application of digital terrestrial photogrammetry to
characterize geometric properties of discontinuities in open-pit slopes
M.M. Samieinejad
1, N. Hosseini
2* and K. Ahangari
1
1. Department of Mining Engineering, Science and Research Branch, Islamic Azad University, Tehran, Iran
2. Department of Mining Engineering, South Tehran Branch, Islamic Azad University, Tehran, Iran
Received 27 December 2016; received in revised form 29 April 2017; accepted 16 May 2017
*Corresponding author: [email protected] (N. Hosseini).
Abstract
In order to analyze the slope stability in open-pit mines, the structural parameters of rock mass such as
persistence and spatial orientation of discontinuities are characterized through field surveys, which involve
spending high costs and times as well as posing high risks of rock toppling and rock fall. In the present work,
a new application of terrestrial digital photogrammetry is introduced for characterizing the rock mass
structural parameters through preparing photogrammetry images from open-pit walls and building
stereomodels. The data extracted from processing the stereo-model generations using photogrammetry
images with different focal distances are highly consistent with the data collected through field surveys.
However, it must be noted that the weather conditions, natural lighting angle, and applied observation scale
may considerably affect the results obtained from stereomodel processing. Nevertheless, by taking into
account the parameters such as time, cost, and full access to the required data, this new method can
effectively be used in the estimation of rock mass structural parameters for analysis of steep slopes in open
pits.
Keywords: Open Pitting, Rock Mass Structure, Slope Stability, Stereomodel, Digital Photogrammetry.
1. Introduction
As a technique with high application in surveying,
terrestrial digital photogrammetry is a technique
with high potentials for the characterization of
rock mass structures. Through recording the
discontinuities in photogrammetry stereomodels
and their interpretation, this technique allows
measuring the geometrical characteristics of the
discontinuities such as their location, orientation,
persistence, roughness, frequency, and block
dimensions.
Within the last two decades, many researchers
have proved the accuracy and precision of the
photogrammetry techniques in extracting
characteristics of discontinuity (Krosley et al. [1];
Martin et al. [2]; Sturzenegger et al. [3, 4];
Coggan et al. [5]; Haneberg [6, 7]; Sturzenegger
and Stead [8-10]; Firpo et al. [11]; Francioni et al.
[12]). Moreover, some programs and softwares
have been designed by the researchers such as
Gaich [13], Birch [14], and Propat [15] for
discontinuity characterization and making
different types of stereomodels using
photogrammetry images.
Despite the images with high resolution, the
biggest problems are caused by the image
interpretation. The terrain of open-pit mines
usually does not show a variety of colors or
shades of grey. Therefore, shadows can not only
be advantageous but also disadvantageous.
Nevertheless, there are many specific aspects in
the use of digital photogrammetry in the field of
open-pit mining, which have to be taken into
account for getting proper results [16].
Scaioni [17] has presented modern technologies
for landslide monitoring and prediction, which
have been focused in the first chapter on
Ground-Based Monitoring Techniques. Scaioni et
al. [18] have discussed the application of

Samieinejad et al./ Journal of Mining & Environment, Vol.8, No.3, 2017
456
close-range photogrammetry for deformation
measurements in the field of landslide
investigation and monitoring. They have
mentioned that the main advantages of this
approach are the non-contact operational
capability, large covered area on the slope to
analyze, high degree of automation, high
acquisition rate, chance to derive information on
the whole surface, not limited to a few control
points (area-based deformation measurement),
and, generally, a lower cost with respect to 3D
scanning technology. Roncella and Forlani [19]
have presented a fixed terrestrial
stereo-photogrammetric system to monitor
landslides, and, in general, changes in the digital
surface model (DSM) of the scene framed by
cameras. Mazzanti et al. [20] have developed a
new approach for investigation of rock cliff and
the prioritization of rock fall hazard based on the
data collected by the remote-sensing techniques.
They applied the approach to a real coastal cliff
located in the southern part of Italy.
Wajs [21] has presented the technological process
and the results of the research of using digital
photogrammetry for opencast mining purposes in
the scope of numerical volume computation and
monitoring the mines by comparison of different
sources. The results obtained showed that the
presented workflow allowed to build DTM
manually and remote sensed, and the accuracy
assessment was presented by the volume
computation pathway. The major advantages of
the techniques presented illustrating how a
terrestrial photogrammetry technique provides
rapid spatial measurements of break-line 3D data
utilized for volume calculation.
Despite the recent developments, application of
terrestrial digital photogrammetry in rock
engineering has been in close-range and is limited
to road-cut assessment or single benches in open
pits, while the main importance of slope stability
in steep wall pit mines is large scales. In other
words, analysis of the overall slope of an open pit
(which consists of several benches or the entire
pit) is sought by the slope stability assessments
rather than the single-bench analysis. Although
having access to the entire pit wall in the field for
recording characteristics of the entire
discontinuities is a time-consuming and risky
issue, the photogrammetry method used for rock
mass structures may provide a low-cost,
reasonable, and suitable method for rock mass
characterization.
In the traditional and field surveying methods, the
structural properties of rock masses are typically
measured and recorded case-by-case, and
covering a vast area in a short time is not possible.
However, in the photogrammetry procedure,
depending on the sight range of the camera and its
lens specifications, this method allows recording a
large rock mass surface and, as a result, provides
the structural characterization of a large share of
the rock.
In the present work, the challenges existing in the
use of terrestrial digital photogrammetry for long-
range slope stability assessment of rock walls are
investigated. Next, through the preliminary results
obtained by the analysis of photogrammetry
images from pit walls of the Angouran Lead and
Zinc Complex in Iran, the structural
characteristics of the rock mass are extracted and
used as the input data for slope stability analysis.
Finally, the effect of scale on the accuracy of
structural characteristics of rock mass is studied.
The results of the present work have a clear
emphasis on the importance of selecting a correct
scale as such by changing the observation scale in
each phase, the quality and quantity of the rock
mass structures indicate high variations.
2. Angouran Lead and Zinc complex
The Angouran Lead and Zinc Complex is located
135 km from Zanjan within 36° 37′ N and 47° 24°
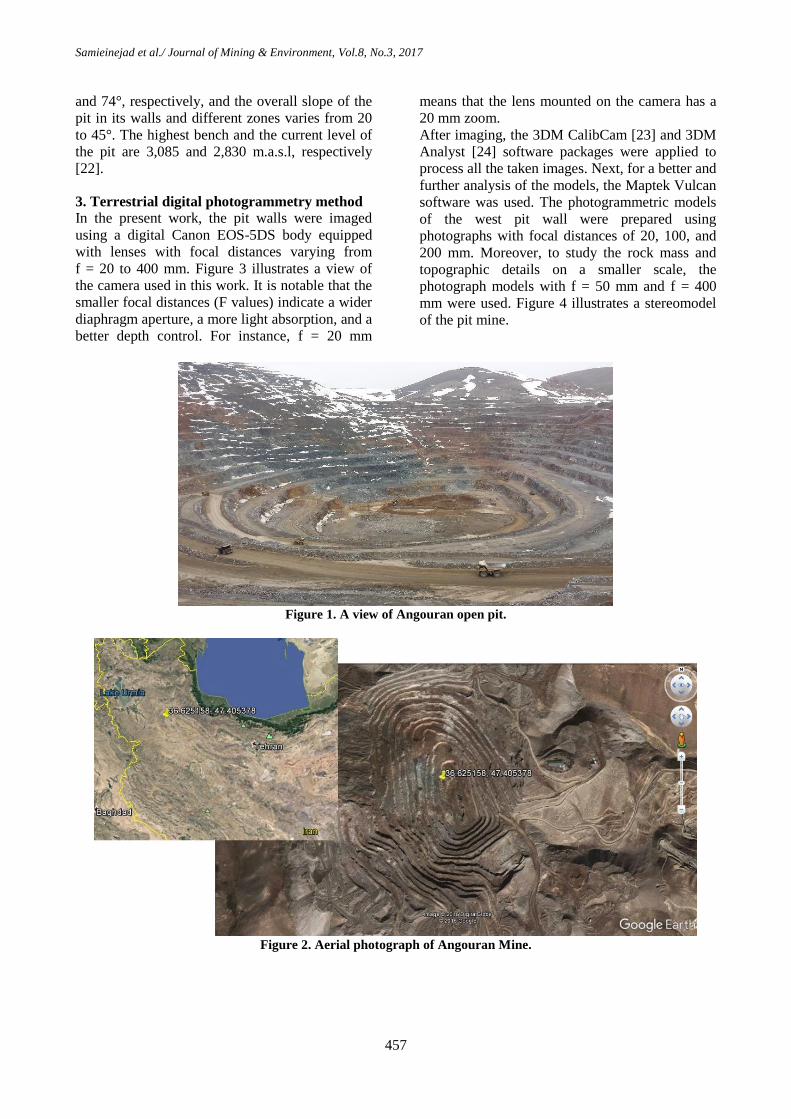
E coordinates in a mountainous area. Figure 1
illustrates a view of the Angouran open pit, and its
aerial photograph is shown in Figure 2. From
stratigraphy aspects, the Angouran Pit area is
located in the zone between the Alborz Mountains
and the Urumia-Dokhtar zone, while based on the
lithological aspects, the ore body lies between the
crystalline carbonates (hanging wall) and
greenschists (footwall). In the structural view, the
Angouran ore body is located in the center of an
anticline between two schist and carbonate
metamorphic parts. In the hanging wall of the ore
body, the carbonate layers lie with a general slope
of 20 to 25° toward SE, while in its footwall, there
are metamorphic Schists with a general slope of
10 to 25° toward SE. The geometry of the ore
body drawn using the exploration boreholes was
found as a lens with a general slope of 20 to 30°
toward SE. In the plan view, the largest length and
width of the ore body lie along the NE-SW and
NW-SE directions, respectively. The ore body is
2,980 m high from the ground surface, and is
located at an elevation of 2700 m.a.s.l. At 2,890
m.a.s.l, the maximum length and width of the ore
body are 340 and 160 m, respectively. The mining
excavation is carried out through the open pit
method. The bench height and wall slope are 10 m
Samieinejad et al./ Journal of Mining & Environment, Vol.8, No.3, 2017
457
and 74°, respectively, and the overall slope of the
pit in its walls and different zones varies from 20
to 45°. The highest bench and the current level of
the pit are 3,085 and 2,830 m.a.s.l, respectively
[22].
3. Terrestrial digital photogrammetry method
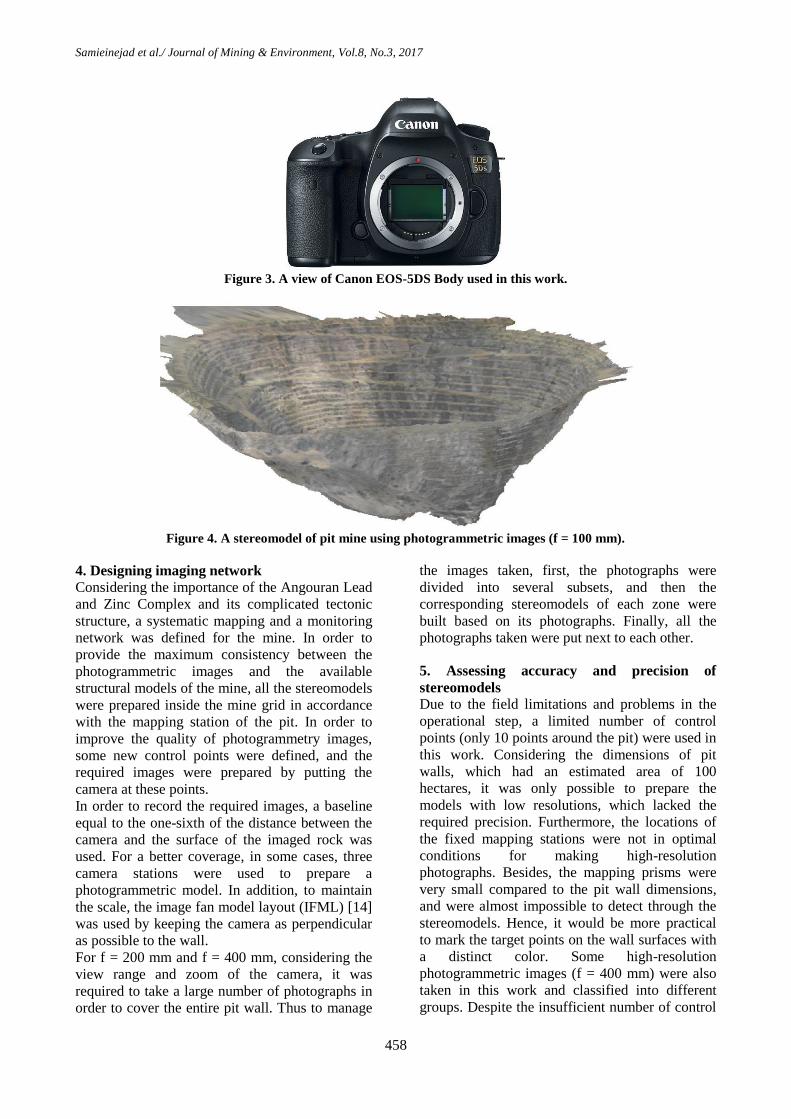
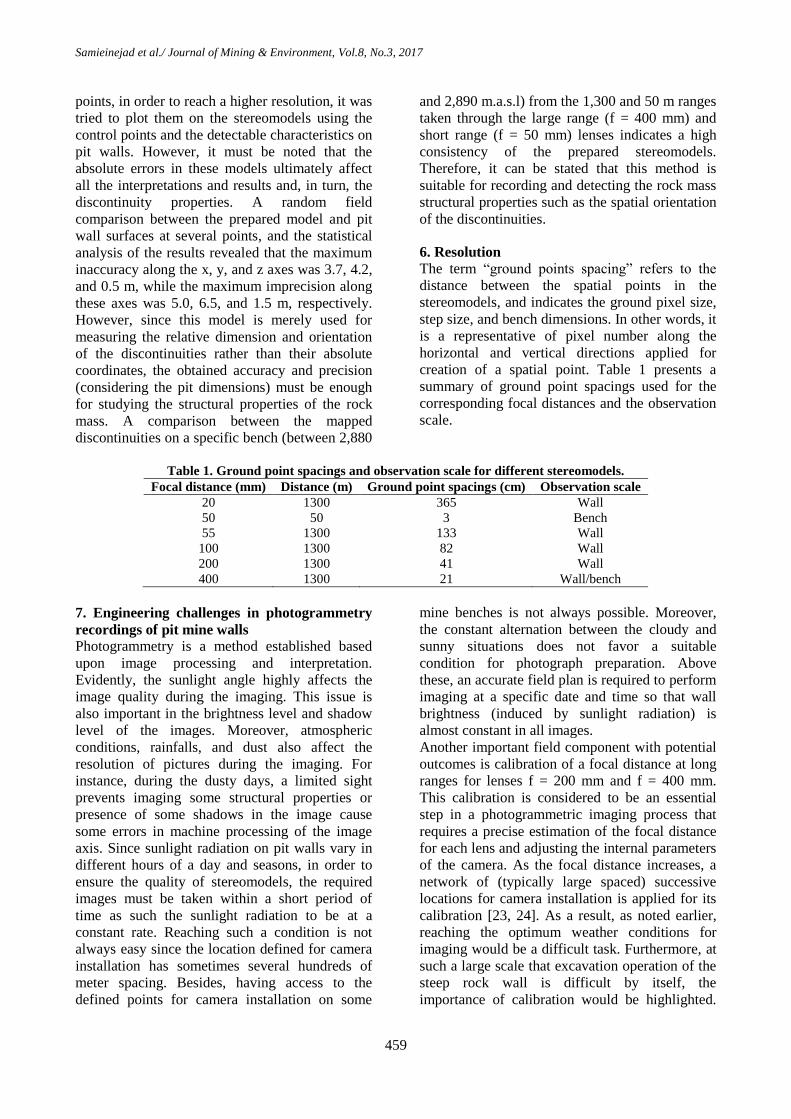
In the present work, the pit walls were imaged
using a digital Canon EOS-5DS body equipped
with lenses with focal distances varying from
f = 20 to 400 mm. Figure 3 illustrates a view of
the camera used in this work. It is notable that the
smaller focal distances (F values) indicate a wider
diaphragm aperture, a more light absorption, and a
better depth control. For instance, f = 20 mm
means that the lens mounted on the camera has a
20 mm zoom.
After imaging, the 3DM CalibCam [23] and 3DM
Analyst [24] software packages were applied to
process all the taken images. Next, for a better and
further analysis of the models, the Maptek Vulcan
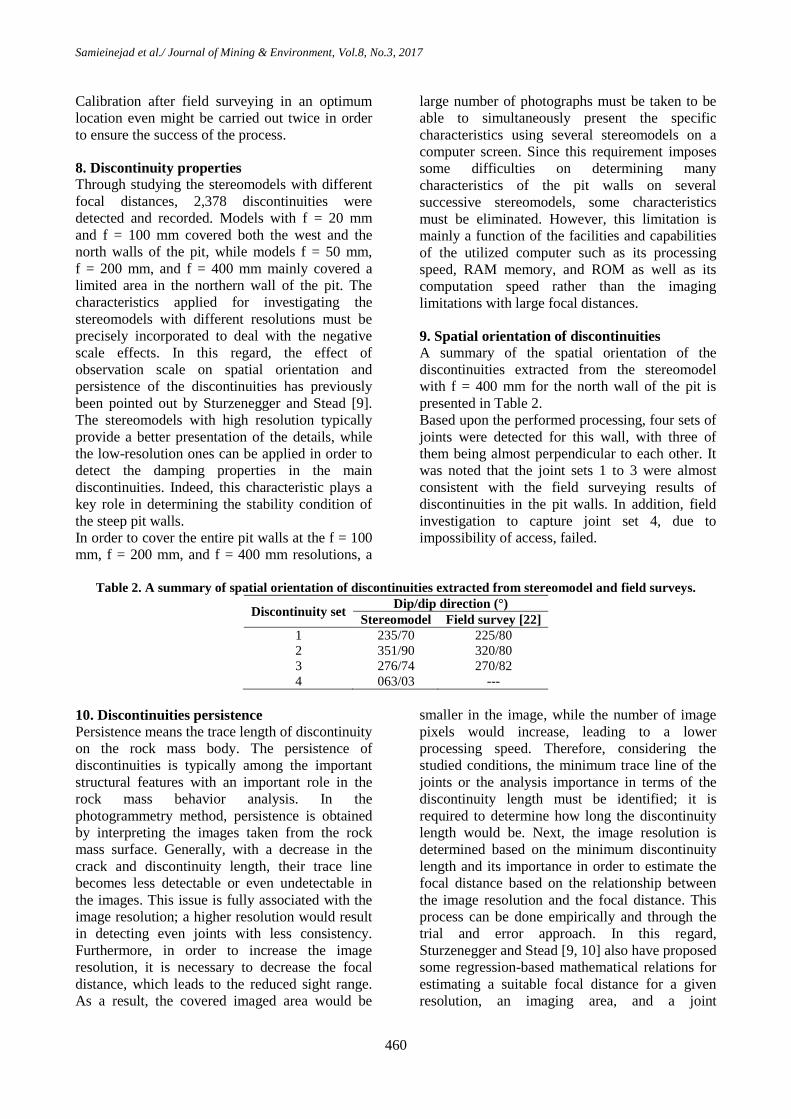
software was used. The photogrammetric models
of the west pit wall were prepared using
photographs with focal distances of 20, 100, and
200 mm. Moreover, to study the rock mass and
topographic details on a smaller scale, the
photograph models with f = 50 mm and f = 400
mm were used. Figure 4 illustrates a stereomodel
of the pit mine.
Figure 1. A view of Angouran open pit.
Figure 2. Aerial photograph of Angouran Mine.
Samieinejad et al./ Journal of Mining & Environment, Vol.8, No.3, 2017
458
Figure 3. A view of Canon EOS-5DS Body used in this work.
Figure 4. A stereomodel of pit mine using photogrammetric images (f = 100 mm).
4. Designing imaging network
Considering the importance of the Angouran Lead
and Zinc Complex and its complicated tectonic
structure, a systematic mapping and a monitoring
network was defined for the mine. In order to
provide the maximum consistency between the
photogrammetric images and the available
structural models of the mine, all the stereomodels
were prepared inside the mine grid in accordance
with the mapping station of the pit. In order to
improve the quality of photogrammetry images,
some new control points were defined, and the
required images were prepared by putting the
camera at these points.
In order to record the required images, a baseline
equal to the one-sixth of the distance between the
camera and the surface of the imaged rock was
used. For a better coverage, in some cases, three
camera stations were used to prepare a
photogrammetric model. In addition, to maintain
the scale, the image fan model layout (IFML) [14]
was used by keeping the camera as perpendicular
as possible to the wall.
For f = 200 mm and f = 400 mm, considering the
view range and zoom of the camera, it was
required to take a large number of photographs in
order to cover the entire pit wall. Thus to manage
the images taken, first, the photographs were
divided into several subsets, and then the
corresponding stereomodels of each zone were
built based on its photographs. Finally, all the
photographs taken were put next to each other.
5. Assessing accuracy and precision of
stereomodels
Due to the field limitations and problems in the
operational step, a limited number of control
points (only 10 points around the pit) were used in
this work. Considering the dimensions of pit
walls, which had an estimated area of 100
hectares, it was only possible to prepare the
models with low resolutions, which lacked the
required precision. Furthermore, the locations of
the fixed mapping stations were not in optimal
conditions for making high-resolution
photographs. Besides, the mapping prisms were
very small compared to the pit wall dimensions,
and were almost impossible to detect through the
stereomodels. Hence, it would be more practical
to mark the target points on the wall surfaces with
a distinct color. Some high-resolution
photogrammetric images (f = 400 mm) were also
taken in this work and classified into different
groups. Despite the insufficient number of control
Samieinejad et al./ Journal of Mining & Environment, Vol.8, No.3, 2017
459
points, in order to reach a higher resolution, it was
tried to plot them on the stereomodels using the
control points and the detectable characteristics on
pit walls. However, it must be noted that the
absolute errors in these models ultimately affect
all the interpretations and results and, in turn, the
discontinuity properties. A random field
comparison between the prepared model and pit
wall surfaces at several points, and the statistical
analysis of the results revealed that the maximum
inaccuracy along the x, y, and z axes was 3.7, 4.2,
and 0.5 m, while the maximum imprecision along
these axes was 5.0, 6.5, and 1.5 m, respectively.
However, since this model is merely used for
measuring the relative dimension and orientation
of the discontinuities rather than their absolute
coordinates, the obtained accuracy and precision
(considering the pit dimensions) must be enough
for studying the structural properties of the rock
mass. A comparison between the mapped
discontinuities on a specific bench (between 2,880
and 2,890 m.a.s.l) from the 1,300 and 50 m ranges
taken through the large range (f = 400 mm) and
short range (f = 50 mm) lenses indicates a high
consistency of the prepared stereomodels.
Therefore, it can be stated that this method is
suitable for recording and detecting the rock mass
structural properties such as the spatial orientation
of the discontinuities.
6. Resolution
The term “ground points spacing” refers to the
distance between the spatial points in the
stereomodels, and indicates the ground pixel size,
step size, and bench dimensions. In other words, it
is a representative of pixel number along the
horizontal and vertical directions applied for
creation of a spatial point. Table 1 presents a
summary of ground point spacings used for the
corresponding focal distances and the observation
scale.
Table 1. Ground point spacings and observation scale for different stereomodels.
Focal distance (mm) Distance (m) Ground point spacings (cm) Observation scale
20 1300 365 Wall
50 50 3 Bench
55 1300 133 Wall
100 1300 82 Wall
200 1300 41 Wall
400 1300 21 Wall/bench
7. Engineering challenges in photogrammetry
recordings of pit mine walls
Photogrammetry is a method established based
upon image processing and interpretation.
Evidently, the sunlight angle highly affects the
image quality during the imaging. This issue is
also important in the brightness level and shadow
level of the images. Moreover, atmospheric
conditions, rainfalls, and dust also affect the
resolution of pictures during the imaging. For
instance, during the dusty days, a limited sight
prevents imaging some structural properties or
presence of some shadows in the image cause
some errors in machine processing of the image
axis. Since sunlight radiation on pit walls vary in
different hours of a day and seasons, in order to
ensure the quality of stereomodels, the required
images must be taken within a short period of
time as such the sunlight radiation to be at a
constant rate. Reaching such a condition is not
always easy since the location defined for camera
installation has sometimes several hundreds of
meter spacing. Besides, having access to the
defined points for camera installation on some
mine benches is not always possible. Moreover,
the constant alternation between the cloudy and
sunny situations does not favor a suitable
condition for photograph preparation. Above
these, an accurate field plan is required to perform
imaging at a specific date and time so that wall
brightness (induced by sunlight radiation) is
almost constant in all images.
Another important field component with potential
outcomes is calibration of a focal distance at long
ranges for lenses f = 200 mm and f = 400 mm.
This calibration is considered to be an essential
step in a photogrammetric imaging process that
requires a precise estimation of the focal distance
for each lens and adjusting the internal parameters
of the camera. As the focal distance increases, a
network of (typically large spaced) successive
locations for camera installation is applied for its
calibration [23, 24]. As a result, as noted earlier,
reaching the optimum weather conditions for
imaging would be a difficult task. Furthermore, at
such a large scale that excavation operation of the
steep rock wall is difficult by itself, the
importance of calibration would be highlighted.
Samieinejad et al./ Journal of Mining & Environment, Vol.8, No.3, 2017
460
Calibration after field surveying in an optimum
location even might be carried out twice in order
to ensure the success of the process.
8. Discontinuity properties
Through studying the stereomodels with different
focal distances, 2,378 discontinuities were
detected and recorded. Models with f = 20 mm
and f = 100 mm covered both the west and the
north walls of the pit, while models f = 50 mm,
f = 200 mm, and f = 400 mm mainly covered a
limited area in the northern wall of the pit. The
characteristics applied for investigating the
stereomodels with different resolutions must be
precisely incorporated to deal with the negative
scale effects. In this regard, the effect of
observation scale on spatial orientation and
persistence of the discontinuities has previously
been pointed out by Sturzenegger and Stead [9].
The stereomodels with high resolution typically
provide a better presentation of the details, while
the low-resolution ones can be applied in order to
detect the damping properties in the main
discontinuities. Indeed, this characteristic plays a
key role in determining the stability condition of
the steep pit walls.
In order to cover the entire pit walls at the f = 100
mm, f = 200 mm, and f = 400 mm resolutions, a
large number of photographs must be taken to be
able to simultaneously present the specific
characteristics using several stereomodels on a
computer screen. Since this requirement imposes
some difficulties on determining many
characteristics of the pit walls on several
successive stereomodels, some characteristics
must be eliminated. However, this limitation is
mainly a function of the facilities and capabilities
of the utilized computer such as its processing
speed, RAM memory, and ROM as well as its
computation speed rather than the imaging
limitations with large focal distances.
9. Spatial orientation of discontinuities
A summary of the spatial orientation of the
discontinuities extracted from the stereomodel
with f = 400 mm for the north wall of the pit is
presented in Table 2.
Based upon the performed processing, four sets of
joints were detected for this wall, with three of
them being almost perpendicular to each other. It
was noted that the joint sets 1 to 3 were almost
consistent with the field surveying results of
discontinuities in the pit walls. In addition, field
investigation to capture joint set 4, due to
impossibility of access, failed.
Table 2. A summary of spatial orientation of discontinuities extracted from stereomodel and field surveys.
Discontinuity set Dip/dip direction (°)
Stereomodel Field survey [22]
1 235/70 225/80
2 351/90 320/80
3 276/74 270/82
4 063/03 ---
10. Discontinuities persistence
Persistence means the trace length of discontinuity
on the rock mass body. The persistence of
discontinuities is typically among the important
structural features with an important role in the
rock mass behavior analysis. In the
photogrammetry method, persistence is obtained
by interpreting the images taken from the rock
mass surface. Generally, with a decrease in the
crack and discontinuity length, their trace line
becomes less detectable or even undetectable in
the images. This issue is fully associated with the
image resolution; a higher resolution would result
in detecting even joints with less consistency.
Furthermore, in order to increase the image
resolution, it is necessary to decrease the focal
distance, which leads to the reduced sight range.
As a result, the covered imaged area would be
smaller in the image, while the number of image
pixels would increase, leading to a lower
processing speed. Therefore, considering the
studied conditions, the minimum trace line of the
joints or the analysis importance in terms of the
discontinuity length must be identified; it is
required to determine how long the discontinuity
length would be. Next, the image resolution is
determined based on the minimum discontinuity
length and its importance in order to estimate the
focal distance based on the relationship between
the image resolution and the focal distance. This
process can be done empirically and through the
trial and error approach. In this regard,
Sturzenegger and Stead [9, 10] also have proposed
some regression-based mathematical relations for
estimating a suitable focal distance for a given
resolution, an imaging area, and a joint

Samieinejad et al./ Journal of Mining & Environment, Vol.8, No.3, 2017
461
persistence length. Figure 5 illustrates the
persistence distribution of the discontinuities
extracted from the stereomodels f = 100 mm and f
= 400 mm. Figure 5 clearly shows that the
persistence distribution is shifted toward the left,
meaning that shorter persistencies are more
distinct at greater resolutions. In comparison, in
low-resolution images, the joints with a small
trace line are not clearly recorded in the image,
and thus not visible in the processing step.
Figure 5. Diagram of persistence distribution of discontinuities.
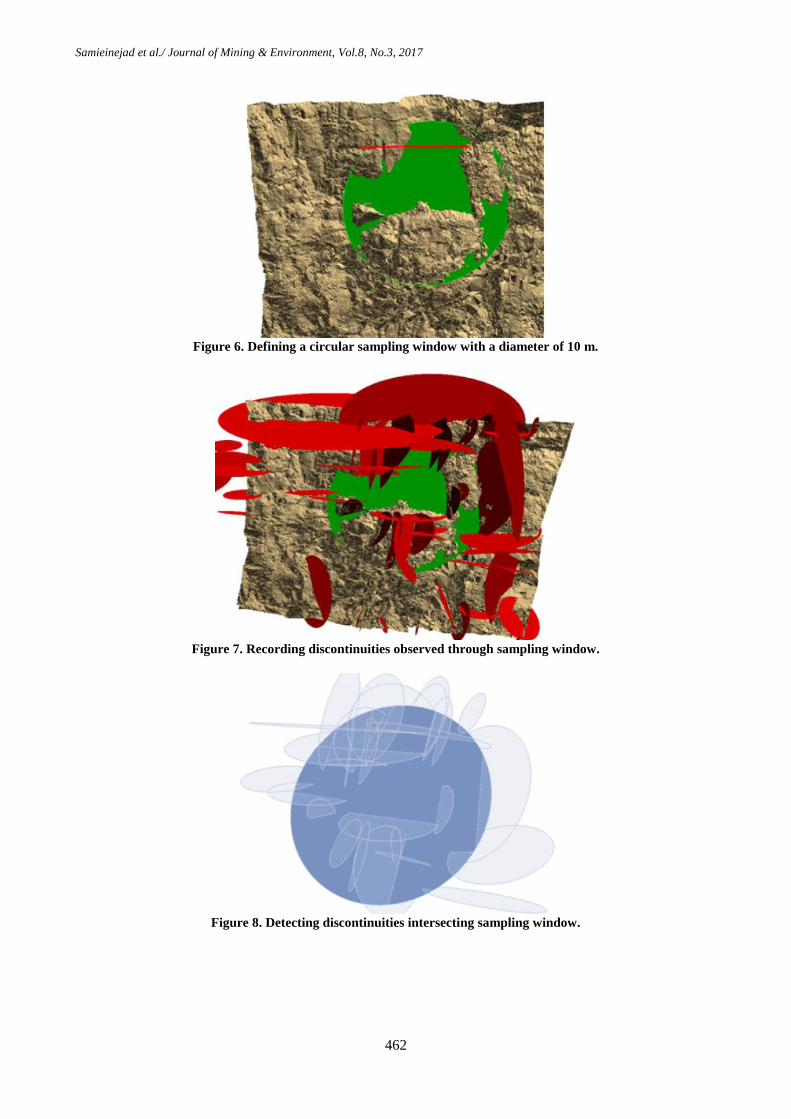
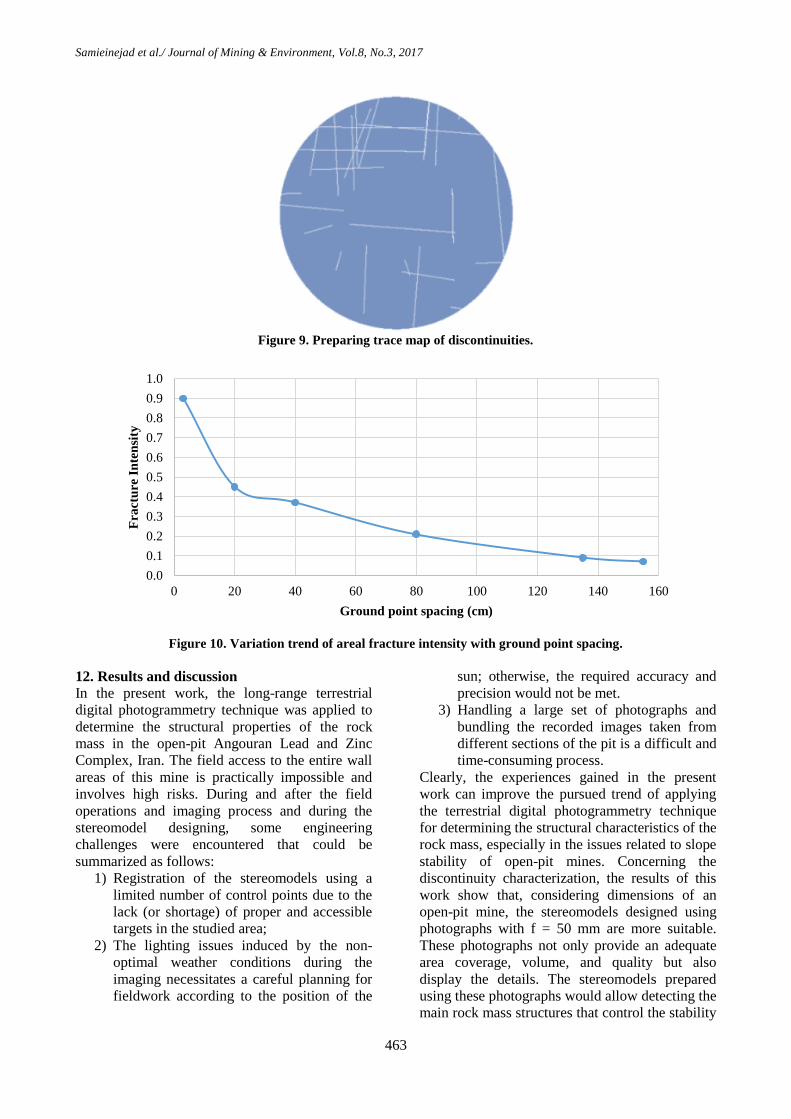
11. Intensity of fracture
Numerous studies have been conducted so far on
the early estimation of the fracture intensity in
rock masses. Areal fracturing indicates the overall
length of all fractures that intersect the sampling
window. In order to determine this parameter, the
FracMan software is used [26]. For this purpose,
first, a virtual circular window with a diameter of
10 m and an orientation equal to the general dip of
the pit is prepared using the stereomodel on
specific benches on the north wall of the pit. Next,
the tracing maps are prepared and used for a direct
estimation of areal fracturing intensity. This
process was also repeated on the other
stereomodels designed using different focal
distances. Figures 6-9 present the steps involved
in this process including defining a 10 m diameter
sampling window, recording discontinuities in the
sample window, detecting discontinuities
intersecting the sampling window, and
discontinuity map preparation, respectively.
It must be noted that defining the sampling
window based on the average orientation slope
might result in a biased estimation of the areal
fracturing intensity. Furthermore, the minor
discontinuities that have smaller dimensions
compared to the studied scale are indeed
eliminated during the processing. The results
obtained from this work show that the dimensions
of the defined sampling window in the
stereomodel considerably affect the estimations of
areal fracturing intensity. In other words, this
estimation is directly controlled by the
observation scale. Thus it is required to consider
the effects of defining appropriate dimensions of
the sampling window on photogrammetric
stereomodels through the future studies. Figure 10
presents the trend of areal fracture intensity based
on ground point spacing.
0
5
10
15
20
25
30
0 2 4 6 8 10 12 14 16 18 20 22 24 26 28 30 32 34 36 38 40
Fre
qu
ency
Equivalent trace length (m)
400 mm 100 mm
Samieinejad et al./ Journal of Mining & Environment, Vol.8, No.3, 2017
462
Figure 6. Defining a circular sampling window with a diameter of 10 m.
Figure 7. Recording discontinuities observed through sampling window.
Figure 8. Detecting discontinuities intersecting sampling window.
Samieinejad et al./ Journal of Mining & Environment, Vol.8, No.3, 2017
463
Figure 9. Preparing trace map of discontinuities.
Figure 10. Variation trend of areal fracture intensity with ground point spacing.
12. Results and discussion
In the present work, the long-range terrestrial
digital photogrammetry technique was applied to
determine the structural properties of the rock
mass in the open-pit Angouran Lead and Zinc
Complex, Iran. The field access to the entire wall
areas of this mine is practically impossible and
involves high risks. During and after the field
operations and imaging process and during the
stereomodel designing, some engineering
challenges were encountered that could be
summarized as follows:
1) Registration of the stereomodels using a
limited number of control points due to the
lack (or shortage) of proper and accessible
targets in the studied area;
2) The lighting issues induced by the non-
optimal weather conditions during the
imaging necessitates a careful planning for
fieldwork according to the position of the
sun; otherwise, the required accuracy and
precision would not be met.
3) Handling a large set of photographs and
bundling the recorded images taken from
different sections of the pit is a difficult and
time-consuming process.
Clearly, the experiences gained in the present
work can improve the pursued trend of applying
the terrestrial digital photogrammetry technique
for determining the structural characteristics of the
rock mass, especially in the issues related to slope
stability of open-pit mines. Concerning the
discontinuity characterization, the results of this
work show that, considering dimensions of an
open-pit mine, the stereomodels designed using
photographs with f = 50 mm are more suitable.
These photographs not only provide an adequate
area coverage, volume, and quality but also
display the details. The stereomodels prepared
using these photographs would allow detecting the
main rock mass structures that control the stability
0.0
0.1
0.2
0.3
0.4
0.5
0.6
0.7
0.8
0.9
1.0
0 20 40 60 80 100 120 140 160
Fra
ctu
re I
nte
nsi
ty
Ground point spacing (cm)

Samieinejad et al./ Journal of Mining & Environment, Vol.8, No.3, 2017
464
or instability condition of the pit. Moreover, the
main discontinuity characteristics such as
persistence are highly consistent with field
surveys. However, a more detailed
characterization of the rock mass structures
including the areal analyses requires applying the
stereomodels prepared using the photographs with
f = 400 mm.
One of the main limitations in the analysis of
high-resolution stereomodels is their simultaneous
display on a computer screen, which might be due
to the hardware and software issues. With an
increase in the resolution of the stereomodels, this
problem becomes even worse and may lead to
adjust the persistence plains. Accordingly,
detecting the trace line length of the
discontinuities would be more difficult. However,
the capabilities of the Maptek Vulcan software
[25] are being enhanced, and the problem
involved might be dwindled by further (software
and hardware) technological advancements.
The results of this research work generally show
that the long-range terrestrial digital
photogrammetry can detect the intensity,
persistence, and spatial orientation of
discontinuities with an acceptable precision.
These three parameters, as the main components
of the discrete fracturing network (DFN) method,
are widely applied in slope stability analyses.
Through applying this technique in the Angouran
Lead and Zinc Complex, it was revealed that
fracture intensity and persistence of
discontinuities was considerably dependent on the
observation scale of the stereomodels. Thus
further investigations are required for finding a
better observation scale based on an estimation of
rock block size. Moreover, although
low-resolution stereomodels are enough for an
overall large-scale characterization, the
stereomodels with higher resolution are required
for a more detailed and small-scale study of the
discontinuities.
13. Conclusions
In this work, many stereomodels were prepared
for pit walls of the Angouran Lead and Zinc
Complex using the terrestrial digital
photogrammetry images. By processing and
interpreting these stereomodels, the structural
characteristics of the rock mass, particularly in
highly sensitive areas, were determined. These
characteristics can be applied as an input variable
in analytical models and numerical software for
slope stability analysis.
A comparison between the data obtained through
the analysis of stereomodels and field surveys of
discontinuities indicates a considerable
consistency between them, particularly in the
main discontinuities with similar fracture intensity
and consistency. However, it must be noted that
the observation scale can considerably affect the
discontinuity parameters such as spatial
orientation, persistence, and fracture intensity.
Furthermore, weather and natural lighting
conditions may have considerable effects on the
recorded images as they result in errors during the
determination of discontinuity traces.
Nevertheless, the results are generally reasonable.
Hence, through a continuous photogrammetry
scanning of the pit walls and the relative
comparison of the images, it is possible to
determine the structural properties of rock masses,
monitor variation trend of discontinuity
parameters such as persistence or aperture, and
provide valuable information for safety issues and
slope stability analysis of the pit walls.
References [1]. Krosley, L.K., Shaffner, P.T., Oerter, E. and Ortiz,
T. (2006). Digital ground-based photogrammetry for
measuring discontinuity orientations in steep rock
exposures. In Proc. 41st U.S. Symp. on Rock
Mechanics (USRNS). Golden. Colorado.
[2]. Martin, C.D., Tannant, D.D. and Lan, H. (2007).
Comparison of terrestrial-based, high resolution,
LiDAR and digital photogrammetry surveys of a rock
slope. In E. Eberhardt, D. Stead & T. Morrison (Eds).
Proc. 1st Canada-U.S. Rock Mechanics Symp.
Vancouver. pp. 37-44.
[3]. Sturzenegger, M., Stead, D., Beveridge, A., Lee, S.
and Van-As, A. (2009). Long-range terrestrial digital
photogrammetry for discontinuity characterization at
Palabora open-pit mine. In Proc. 3rd
CANUS Rock
Mechanics Symp. Toronto.
[4]. Sturzenegger. M., Stead, D. and Elmo, D. (2011).
Terrestrial remote sensing-based estimation of mean
trace length, trace intensity and block size/shape. Eng
Geol. 119: 96-111.
[5]. Coggan, J.S., Wetherelt, A., Gwynn, X.P. and
Flynn, Z.N. (2007). Comparison of hand-mapping with
remote data capture systems for effective rock mass
characterization. In Proc. 11th
Congress of ISRM.
Lisbon. Portugal.
[6]. Haneberg, W.C., Norrish, N.I. and Findley, D.P.
(2006). Digital outcrop characterization for 3-D
structural mapping and rock slope design along
interstate 90 near Snoqualmie Pass. Washington. In
Proc. 57th
annual Highway Geology Symp.
Breckenridge. Colorado.

Samieinejad et al./ Journal of Mining & Environment, Vol.8, No.3, 2017
465
[7]. Haneberg, W.C. (2007). Directional roughness
profiles from three-dimensional photogrammetric or
laser scanner point clouds. In E. Eberhardt, D. Stead &
T. Morrison (Eds.). Proc. 1st Canada-U.S. Rock
Mechanics Symp. Vancouver.
[8]. Sturzenegger, M. and Stead, D. (2009). Close-
range terrestrial digital photogrammetry and terrestrial
laser scanning for discontinuity characterization on
rock cuts. Engineering Geology. 106 (3): 163-182.
[9]. Sturzenegger, M. and Stead, D. (2009).
Quantifying discontinuity orientation and persistence
on high mountain rock slopes and large landslides
using terrestrial remote sensing techniques. Natural
Hazard and Earth System Sciences. 9 (2): 267-287.
[10]. Sturzenegger, M. and Stead, D. (2012). The
palliser rockslide, Canadian Rocky Mountains:
characterization and modelling of a stepped failure
surface. Geomorphology. 138: 145-161
[11]. Firpo, G., Salvini, R., Francioni, M. and Ranjith,
P.G. (2011). Use of Digital Terrestrial Photogrammetry
in rocky slope stability analysis by Distinct Elements
Numerical Methods. Int J Rock Mech Min Sci. 48 (7):
1045-1054
[12]. Francioni, M., Salvini, R., Stead, D. and Litrico,
S. (2014). A case study integrating remote sensing and
distinct element analysis to quarry slope stability
assessment in the Monte Altissimo area, Italy.
Engineering Geology. 183: 290-302.
[13]. Gaich, A., Poetsch, M. and Schubert, W. (2006).
Acquisition and assessment of geometric rock mass
features by true 3D images. In Golden Rocks 2006.
The 41st US Symposium on Rock Mechanics
(USRMS). American Rock Mechanics Association.
[14]. Birch, J.S. (2006). Using 3DM Analyst mine
mapping suite for rock face characterization. In Tonon,
F. & Kottenstette, J. (Eds.). Laser and
Photogrammetric Methods for Rock Face
Characterization, ARMA, pp. 13-32.
[15]. Poropat, G.V. (2006). Remote 3D mapping of
rock mass structure. In Tonon, F. & Kottenstette, J.
(Eds.), Laser and Photogrammetric Methods for Rock
Face Characterization. ARMA. Pp. 63-75.
[16]. Patikova, A. (2004). Digital photogrammetry in
the practice of open pit mining. In: 20th
, International
congress for photogrammetry and remote sensing.
ISPRS XXth congress. Istanbul.
[17]. Scaioni, M. (2015). Modern Technologies for
Landslide Monitoring and Prediction. Springer Natural
Hazards.
[18]. Scaioni, M., Feng, T., Lu, P., Qiao, G., Tong, X.,
Li, R., Barazzetti, L., Previtali, M. and Roncella, R.
(2015). Close-Range Photogrammetric Techniques for
Deformation Measurement: Applications to Landslides.
Modern Technologies for Landslide Monitoring and
Prediction. Part of the series Springer Natural
Hazards. pp. 13-41.
[19]. Roncella, R. and Forlani, G. (2015). A Fixed
Terrestrial Photogrammetric System for Landslide
Monitoring. Modern Technologies for Landslide
Monitoring and Prediction. Part of the series Springer
Natural Hazards. pp. 43-67.
[20]. Mazzanti, P., Brunetti, A. and Bretschneider, A.
(2015). A New Approach Based on Terrestrial Remote-
sensing Techniques for Rock Fall Hazard Assessment.
Modern Technologies for Landslide Monitoring and
Prediction. Part of the series Springer Natural Hazards.
pp. 69-87.
[21]. Wajs, J. (2015). Research on surveying
technology applied for DTM modelling and volume
computation in open pit mines. Mining Science. 22:
75-83.
[22]. Technical report. (2016). General report of
geotechnical analysis in Angouran mine. Hampa
Danesh Shidvash Company. Internal report.
[23]. 3DM CalibCam- ADAM Technology. Accessed:
2 December 2016. Address:
https://www.adamtech.com.au/
brochures/3DM%20CalibCam%20Flyer.pdf.
[24]. 3DM Analyst- ADAM Technology. Accessed: 2
December 2016. Address:
https://www.adamtech.com.au/ 3dm/Analyst.html.
[25]. Vulcan- Maptek. Accessed: 2 December 2016.
Address: http://www.maptek.com/products/vulcan.
[26]. FracMan Technology Group. Accessed: 2
December 2016. Address: http://www.fracman.com.
6931م، سال وسم، شماره شتهدوره زیست، پژوهشی معدن و محیط -و همکاران/ نشریه علمی سمیعی نژاد
ها در یوستگیناپ یهندس اتیخصوص نییتع یبرا ینیزم تالیجید یفتوگرامتر یریبه کارگ یدانیم یابیارز
معدن روباز یها بیش
1یکاوه آهنگرو *2ینیحس دینو، 1نژاد یعیمحمد مسعود سم
تهران، ایران قاتیواحد علوم و تحق یدانشگاه آزاد اسالم ،معدن یگروه مهندس -1
تهران جنوب، ایرانواحد یدانشگاه آزاد اسالم ،معدن یگروه مهندس -2
61/5/7162، پذیرش 72/67/7161ارسال
[email protected]* نویسنده مسئول مکاتبات:
چکیده:
بدا هدا یوسدتگ یناپ ییفضدا یافتگید و جهدت یدی رایتوده سنگ از جمله شددت، م یساختار یپارامترها دیبا معموالًدر معادن روباز، بیش یداریپا لیبه منظور تحل
نید . در اباشدند یسنگ همراه مد زشیاز جمله سقوط و ر یبر بوده و با خطرات گوناگون و زمان نهیپرهز معموالًها برداشت نیمشخص شود که ا یدانیم یها برداشت
معددن و تید پ یهدا وارهید از د کیفتوگرامتر ریتصاو هیارائه شده است که با ته ینیزم تالیجید یفتوگرامتر کیتکن یها تیبر قابل هیبا تک یدیجد افتی، رهپژوهش
یهدا ومدلیحاصدل از پدردازش اسدتر یهدا سازد. داده یممکن م یادیتوده سنگ را تا حدود ز یساختار یپارامترها صیمتعدد، امکان تشخ یها ومدلیساخت استر
توجده دید . البتده با دهند ینشان م یدانیم یها حاصل از برداشت یها با داده یمختلف، تطابق مناسب یکانون یها با فاصله کیفتوگرامتر ریساخته شده بر اساس تصاو
حدال، بدا نید داشته باشد. با ا ها ومدلیپردازش استر جیبر نتا یتوجه قابل ریتأثتواند یمشاهده، م اسیمق نیو همچن دیتابش خورش هیزاو ،ییآب و هوا طیداشت شرا
یتوده سنگ، بدرا یساختار یپارامترها یینتعدر یمؤثربه طور تواند یم دیروش جد نیا ره،یکامل و غ یدسترس نه،یهمچون زمان، هز ییدر نظر گرفتن پارامترها
در معادن روباز به کار گرفته شود. دار بیش یها وارهید یداریپا لیتحل
.پایداری شیب، استیرومدل، فتوگرامتری دیجیتالمعدنکاری روباز، ساختار توده سنگ، کلمات کلیدی: