gender.care2share.wikispaces.netgender.care2share.wikispaces.net/file/view/9. universal... · web...
TRANSCRIPT

This kit is designed to provide LINKAGES project teams with all of the tools and analytic frameworks that they need to measure gender equality changes at the ultimate outcome level. The manual includes sample data collection sheets, guides on how to collect and process the data and gender analysis questions to ask each year after the data has been collected. Some of the tools and questions may need modification to suit the individual projects, but the skeleton of the tools and analytic questions should be relevant to all LINKAGES work. Each tool is designed to be incorporated into other data collection processes or tools that the project will be using to collect intermediate and immediate outcome data. The idea is not to carry out a separate monitoring exercise just for the universal indicators, but to collect data relevant to each indicator as part of ongoing monitoring work. Similarly, if the country office is already using a tool that is similar to the ones presented here (such as another way of collecting access and control information), the project team is free to modify existing tools to collect the types of data discussed in this kit.
It is expected that each of the tools outlined in this kit will be used to collect data on gender change once a year to provide content for the LINKAGES annual reports. It is also expected that each of the tools will be supplemented and the data triangulated with information from short answer surveys, focus group discussions, outcome mapping, participant observation or other processes already outlined in project PMFs.
LINKAGES Guide to Measuring Ultimate Outcome Indicators
Gathering Evidence for Gender Equality Change in Access, Control and Organizational Capacity

Table of Contents
GLOBAL INDICATOR 1 Tool and Its Goal Tool 1: Enumerator’s Field Sheet Women’s Access and ControlTool 1: Enumerator’s Field Sheet Men’s Access and ControlTool 1: Administration and Analysis
GLOBAL INDICATOR 2 Tools and Their Goals Tool 2: Enumerator’s Field Sheet Women’s Business Profit ControlTool 2: Enumerator’s Field Sheet Men’s Business Profit ControlTool 2: Administration and AnalysisTool 3: Enumerator’s Focus Group Discussion Guide Women’s Value Chain PositionsTool 3: Enumerator’s Focus Group Discussion Guide Men’s Value Chain PositionsTool 3 Administration and Analysis
GLOBAL INDICATOR 3 Tool and Its Goal Tool 4: Enumerator’s ChecklistTool 4: Administration and Analysis
APPENDIX OF GENDER EQUALITY DEFINITIONS?
LINKAGES Universal Indicators Monitoring, Evaluation and Analysis Guide 2
GLOBAL INDICATOR 1: Proportion of women to men with access to those assets (physical, social, economic) that are key to resiliency.
This indicator is measured using one tool.
Tool 1: Women’s and Men’s Access and Control Comparison ChartWhat does this tool measure? What is the goal of using this tool?This tool measures women’s and men’s access to and control over the key livelihood assets that are directly related to the project separately.
The goal of using this tool is to determine if the gap between women’s and men’s control over the most economically and socially valued resources decreased during the life of the project.
Studies show that where this gap decreases, women and men are more likely to be equal and households are more likely to be resilient.
LINKAGES Universal Indicators Monitoring, Evaluation and Analysis Guide 3

Tool 1: Enumerator’s Field Sheet Women’s Access and Control(instructions in italics)
1. Household #: _______________________________
2. Name of Respondent: ________________________
3. Respondent Sex: M F
4. Household Type: MHH FHH
5. Name of person of the opposite sex also interviewed from the same household: __________________
Female enumerator works with women, male enumerator works with men.
Introduce yourself and the purpose of the interview. Remind the respondent about their right to privacy, to not answer questions if they don’t want to. Let them know what will be done with the information. Make sure they understand what they are consenting to do. Manage expectations around what the project will or will not be doing for the person based on the information they give in the interview. At the end of the introduction, note that...
6. I am going to ask you whether you have access to and control over some of the resources that you typically use in order to make a living for yourself and your family.
Access is_____________
Control is____________
Then I am going to ask you to compare your level of access and control to that of your spouse.
Begin with the first asset on the list. Ask the person if they have access to the item/service, then ask if their spouse has access to the item. Tick the box for a “yes” answer. Leave the box blank for a “no” answer. If the person gives an answer that is neither a firm “yes” or a firm “no,” ask them to choose and record any interesting comments or qualifications in the box or under the chart. Proceed down the list until all items have been named, and then switch to asking about control. You may have to remind the respondent of the difference between access and control at this point.
If the respondent wants to answer that “both” they and their partner access or control the asset, ask who has more access more of the time or more control more of the time (final say). Write interesting comments or notes on the side of the page or next to the tick in the box.
While there is no need to specifically probe for interesting comments for each asset, leave some time in the interview to allow the respondent to flesh out their answers or to provide commentary. Probe interesting points. Why does the respondent want to claim that “both” access or control? Why is it hard to choose? Are there certain circumstances under which men have more control and others under which women have more control over the asset?
LINKAGES Universal Indicators Monitoring, Evaluation and Analysis Guide 4

Item/Benefice Access/Acces Control/ControleWomen/Femmes Men/Hommes Women/Femmes Men/Hommes
OxenFertilizerSeedsLandExtensionLabour
Once all the items on the list have been covered, ask the respondent if there are any important assets that you have forgotten, or if any assets on the list really weren’t that important to them. Ask them about access and control over any items that were not on the original list, but that they considered to be important.
Thank the respondent very much for their time and let them know how the overall results of this data collection will be used in their village.
LINKAGES Universal Indicators Monitoring, Evaluation and Analysis Guide 5

Tool 1: Enumerator’s Field Sheet Men’s Access and Control(instructions in italics)
7. Household #: _______________________________
8. Name of Respondent: ________________________
9. Respondent Sex: M F
10. Household Type: MHH FHH
11. Name of person of the opposite sex also interviewed from the same household: __________________
Female enumerator works with women, male enumerator works with men.
Introduce yourself and the purpose of the interview. Remind the respondent about their right to privacy, to not answer questions if they don’t want to. Let them know what will be done with the information. Make sure they understand what they are consenting to do. Manage expectations around what the project will or will not be doing for the person based on the information they give in the interview. At the end of the introduction, note that...
12. I am going to ask you whether you have access to and control over some of the resources that you typically use in order to make a living for yourself and your family.
Access is_____________
Control is____________
Then I am going to ask you to compare your level of access and control to that of your spouse.
Begin with the first asset on the list. Ask the person if they have access to the item/service, then ask if their spouse has access to the item. Tick the box for a “yes” answer. Leave the box blank for a “no” answer. If the person gives an answer that is neither a firm “yes” or a firm “no,” ask them to choose and record any interesting comments or qualifications in the box or under the chart. Proceed down the list until all items have been named, and then switch to asking about control. You may have to remind the respondent of the difference between access and control at this point.
If the respondent wants to answer that “both” they and their partner access or control the asset, ask who has more access more of the time or more control more of the time (final say). Write interesting comments or notes on the side of the page or next to the tick in the box.
While there is no need to specifically probe for interesting comments for each asset, leave some time in the interview to allow the respondent to flesh out their answers or to provide commentary. Probe interesting points. Why does the respondent want to claim that “both” access or control? Why is it hard to choose? Are there certain circumstances under which men have more control and others under which women have more control over the asset?
LINKAGES Universal Indicators Monitoring, Evaluation and Analysis Guide 6

Item Access ControlWomen Men Women Men
OxenFertilizerSeedsLandExtensionLabour
Once all the items on the list have been covered, ask the respondent if there are any important assets that you have forgotten, or if any assets on the list really weren’t that important to them. Ask them about access and control over any items that were not on the original list, but that they considered to be important.
Thank the respondent very much for their time and let them know how the overall results of this data collection will be used in their village.
LINKAGES Universal Indicators Monitoring, Evaluation and Analysis Guide 7

Tool 1: Administration and Analysis
Before You Administer the Tool
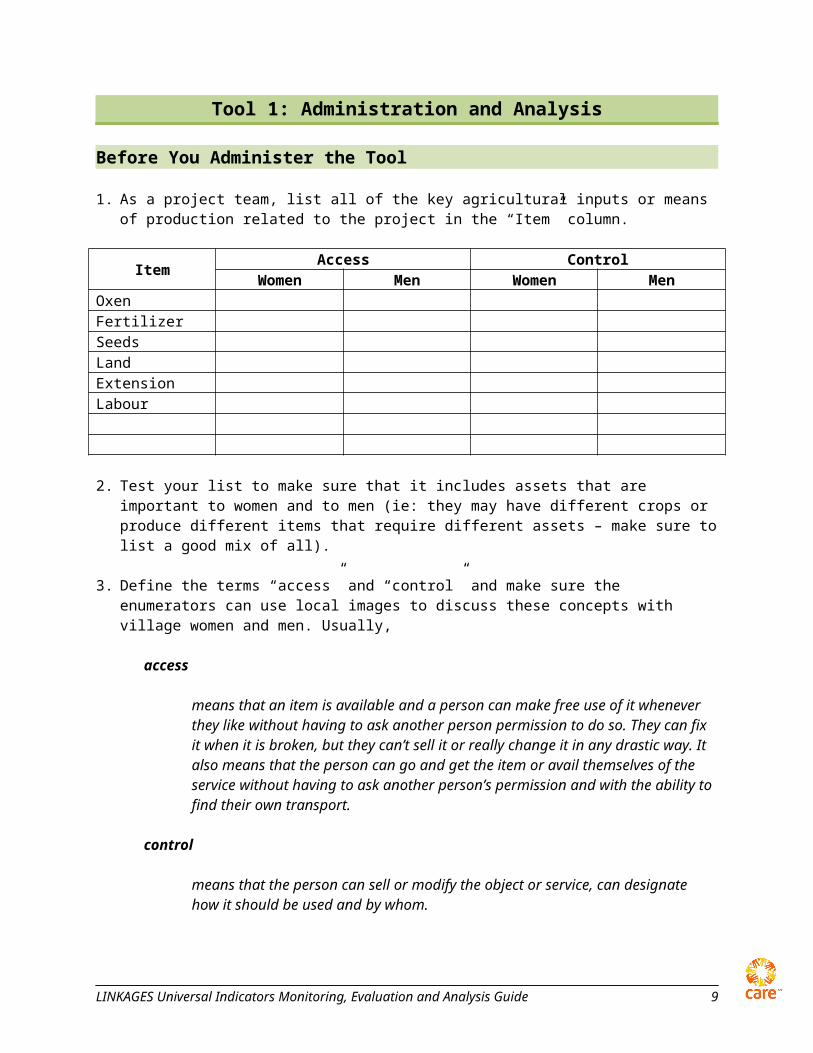
1. As a project team, list all of the key agricultural inputs or means of production related to the project in the “Item” column.
Item Access ControlWomen Men Women Men
OxenFertilizerSeedsLandExtensionLabour
2. Test your list to make sure that it includes assets that are important to women and to men (ie: they may have different crops or produce different items that require different assets – make sure to list a good mix of all).
3. Define the terms “access” and “control” and make sure the enumerators can use local images to discuss these concepts with village women and men. Usually,
access means that an item is available and a person can make free use of it whenever they like without having to ask another person permission to do so. They can fix it when it is broken, but they can’t sell it or really change it in any drastic way. It also means that the person can go and get the item or avail themselves of the service without having to ask another person’s permission and with the ability to find their own transport.
control means that the person can sell or modify the object or service, can designate how it should be used and by whom.
4. Set up your database to ensure that you will be able to aggregate answers from all women in FHH all men in MHH all women in MHH
Once Baseline Data Has Been Collected
5. Prepare the findings for analysis. Make a series of tables with percentages representing the aggregated responses. For each time you do the survey, you should have three tables of aggregated data, one from each of the above groups. The table will look like the sample below.
LINKAGES Universal Indicators Monitoring, Evaluation and Analysis Guide 8
Tool 1 Sample Baseline Data: Women in MHH
ItemAccess Control
Women Men Women MenOxen 30% 90% 10% 75%Fertilizer 50% 90% 30% 90%
6. Process the raw numbers into useful comparisons as in the sample below. These do not need to go in the text of a report, but the comparisons do need to be done. There is a 60% gap in women’s and men’s access to oxen. There is a 65% gap in women’s and men’s control over oxen. There is a 40% gap in women’s and men’s access to fertilizer. There is a 60% gap in women’s and men’s control over
fertilizer.
7. Analyse the findings using questions such as the following. The answers need to be part of a progress report. They also inform course correction and future programming. ? What are the gender gaps in women’s and men’s access to
and control over key assets? ? Who has greater access to and/or control over the most
valued assets, women or men? ? Are there any situations where access levels are relatively
equal, but control levels are different? What does this mean for how women and men may benefit from project activities? What does it mean for project sustainability? Is a “do no harm” strategy necessary to ensure that women have access to and control over key assets at the end of the project?
? Do women control a sufficient variety of valued assets as needed for farm management, income generation, and disaster risk reduction/mitigation? To the same degree as men? If they do not, what does this mean for women’s and men’s equal ability to earn a living? To cope with shocks and trends? To be resilient?
After Year 1 Results Data have Been Taken
8. Prepare the findings for analysis by preparing a second set of aggregated data. You should now have six charts in total so that you can compare the three from the baseline against the three from Year 1 data collection, as shown in the sample below.
Tool 1 Sample Baseline Data: Women in MHH
ItemAccess Control
Women Men Women MenOxen 30% 90% 10% 75%Fertilizer 50% 90% 30% 90%
LINKAGES Universal Indicators Monitoring, Evaluation and Analysis Guide 9
Helpful Hint 1: Why are we taking data from men in
MHH as well as women in MHH? What can information from men tell us about gender equality in access and control?
As men traditionally control key assets, it is important to take data from them and to compare it against women’s data to see if men are sharing control, and to compare their perceptions about their levels of access and control against women’s. Both men in MHH and women in FHH are heads of household. We need to be able to compare the progress of women in FHH against a “control group,” or, in this case, men who head households.

Helpful Hint 2:How do these comparisons measure an Intermediate Outcome such as “Women and men have increased and more equal
access to livelihood assets?”
Comparison 5.1 measures the conditions of women compared to themselves over time. It measures asset increase. Comparison 5.2 measures the conditions of women compared to men over time. It measures whether women and men access or control an asset equally. Measuring the conditions of women compared to themselves over time does not tell us much about gender change or gender equality outcomes. The comparison between women and men is essential to prove that the project was successful in meeting the intermediate outcome.
Tool 1 Sample Year 1 Data: Women in MHH
Item Access ControlWomen Men Women Men
Oxen 35% 90% 15% 80%Fertilizer 80% 90% 50% 90%
9. Use the data sets to make two types of comparisons. 9.1. Compare any increase or decrease in each sex’s access to
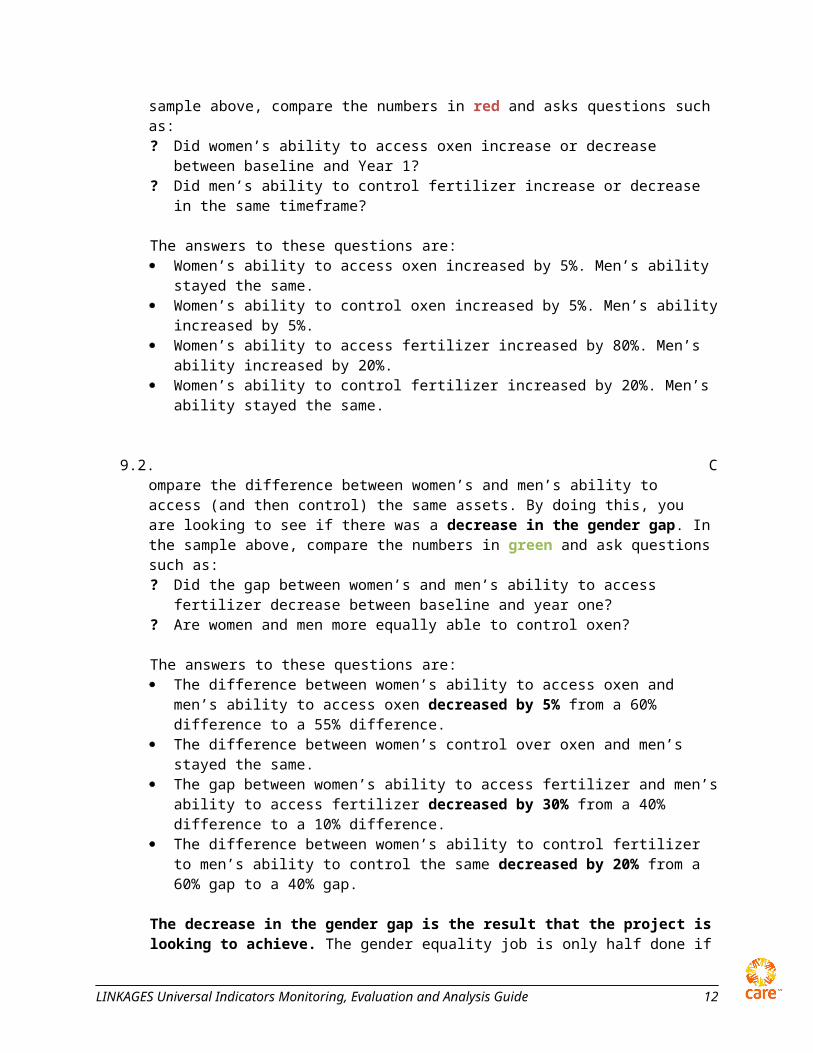
(and then control over) each resource. In the sample above, compare the numbers in red and asks questions such as: ? Did women’s ability to access oxen increase or
decrease between baseline and Year 1? ? Did men’s ability to control fertilizer increase or
decrease in the same timeframe?
The answers to these questions are: Women’s ability to access oxen increased by 5%. Men’s
ability stayed the same. Women’s ability to control oxen increased by 5%.
Men’s ability increased by 5%. Women’s ability to access fertilizer increased by 80%.
Men’s ability increased by 20%. Women’s ability to control fertilizer increased by 20%.
Men’s ability stayed the same.
9.2. Compare the difference between women’s and men’s ability to access (and then control) the same assets. By doing this, you are looking to see if there was a decrease in the gender gap. In the sample above, compare the numbers in green and ask questions such as: ? Did the gap between women’s and men’s ability to access fertilizer decrease between
baseline and year one? ? Are women and men more equally able to control oxen?
The answers to these questions are: The difference between women’s ability to access oxen and men’s ability to access oxen
decreased by 5% from a 60% difference to a 55% difference. The difference between women’s control over oxen and men’s stayed the same. The gap between women’s ability to access fertilizer and men’s ability to access fertilizer
decreased by 30% from a 40% difference to a 10% difference. The difference between women’s ability to control fertilizer to men’s ability to control the
same decreased by 20% from a 60% gap to a 40% gap.
The decrease in the gender gap is the result that the project is looking to achieve. The gender equality job is only half done if there is an increase in access to or control over a resource but if
LINKAGES Universal Indicators Monitoring, Evaluation and Analysis Guide 10

there is no decrease in the gender gap associated with that resource. Take a look at the data on control over oxen again. It’s true that women’s control over oxen increased, but we can not call this a positive gender equality result because the gap between women’s and men’s control did not decrease.
10. Answer gender analysis questions such as the following. Use the raw data and supplemental qualitative information to answer these questions. ? Where there was an increase in access or control, why did that increase occur? Is it the same
reason for both women and men? What project interventions or activities have contributed to this increase?
? Did the gap between women’s access/control and men’s access/control decrease? Was the rate of this decrease reasonable for the time period in question? If there was no decrease, what will the project do to work on gender issues in access and control over the next year?
? Did the changes in the data happen because of CARE’s gender equality work; b) because of CARE’s work in other areas (farmer field school participation, health and hygiene training, VSLA formation); or c) a combination of A and B? The project can not claim that it was attending to gender issues or doing gender work unless the answer is A or C and it can clearly draw a link between gender equality programming and gender results.
? Were there any places where men’s access and control decreased? Why did this occur? Was this due to a change in gender dynamics (husband sharing more with wife) or because of external factors?
? Were there any places where women’s access and control decreased? Why did this occur? Was this due to women becoming more conscious of their real levels of access and control? Due to male backlash? Due to other reasons?
? Is there any difference between women’s access and control in MHH and FHH? If so, what and why?
? Is there any difference between women’s access and control in FHH and men’s access and control in MHH? If so, what and why?
11. Repeat steps four through six at the end of each subsequent year of the project. The answers to these questions go into the project’s annual reports.
LINKAGES Universal Indicators Monitoring, Evaluation and Analysis Guide 11
At the End of the Project
12. Prepare another set of aggregated data. By now the project should have a good set of access and control trends in tables for women in MHH, men in MHH and women in FHH. The key for final analysis is to look at overall change between the beginning and end of the project against the ultimate outcome and how CARE’s interventions helped (or hindered!) this change to happen.
13. Answer gender analysis questions that focus on impact and outcomes such as the following. ? Did social rules and norms around access to and control over key resources change in the
households and communities that the project was working in? ? Are women and men associated with the project more resilient as a result of these changes?? Were CARE’s interventions and programming the cause of those changes?
LINKAGES Universal Indicators Monitoring, Evaluation and Analysis Guide 12
Helpful Hint 3: Gender Equality Trend Analysis FAQs
Do you have questions about the trends that you are seeing in your data? The answers may be below.
Our data doesn’t show very much progress between the years. There was only an increase of 5% in women’s oxen access. Won’t the donor want to see more progress? We all know that gender change happens slowly and in small steps. The key is to ask if the pace of change is reasonable given the asset in question. Changing oxen control patterns in Ethiopia is hard, so a 5% gain in one year is reasonable. Changing access to fertilizer in an area where fertilizer is available and women’s mobility can be discussed using Social Analysis and Action group discussions is much easier to do. Donors have a good understanding of field realities, and expect progress relative to the toughness of the gender issue.
Our data shows that women’s access to key resources stayed the same or decreased. Is our data of poor quality? Did we fail to implement our programming properly? There are many reasons why gender equality data could show no progress or even negative progress between two reporting periods. It does not necessarily indicate that something has gone wrong with the data or with the programming, but it does indicate that some sort of gender dynamic is at work. The team will need to ask qualitative questions to identify why there was no change or a negative change. This said, repeated lack of change between reporting periods usually indicates that the project is not implementing its gender strategy, so the team may want to undertake some critical reflection if they are consistently not seeing gender change.
The increase in women’s access and control was much, much higher than the men’s. In fact, men’s access decreased between the two reporting periods. Does this mean we have reverse gender discrimination? Are the men getting poorer? A larger increase in women’s access to or control over an asset shows that the project is working. While projects will want to see some increase in men’s access to key assets, the only way for a traditional gender gap to close is if women’s increase is larger than men’s. Similarly, in cases where men have traditionally had much more access or control, some decrease on their side may be required to level the playing field. This doesn’t mean that we are discriminating against men or asking them to become poorer. We are asking them to share access or control in areas where they haven’t had to before because we know that when they do so, the whole household is more resilient.

The procedure for answering these questions depends on how project implementation has proceeded, the project learning agenda and operational parameters, so this will be addressed closer to the end of the project.
LINKAGES Universal Indicators Monitoring, Evaluation and Analysis Guide 13

GLOBAL INDICATOR 2: Increased and more equal control over livelihood assets by direct beneficiary women and men.
This indicator is measured using two tools.
Tool 2: Women’s and Men’s Business Profit Control ScalesWhat does this tool measure? What is the goal of using this tool?Question 2 measures the varieties of businesses that women and men are involved in, compared by value and type.
The goal of measuring this is to determine whether both women and men are equally involved in the most remunerative and demand-driven businesses and to determine whether women and men are involved in a wide enough variety of businesses to indicate that the local economy is equally resilient. Question 2 also functions as a check that the project has done its due diligence by ensuring that CARE beneficiaries are involved in business ventures that have a clear market and demand.
Question 4 measures the ways in which profits from businesses are reinvested, by sex and type of reinvestment. This tool triangulates Question 5 to some extent.
The goal is to track the extent to which women and men are equally reinvesting the profits of their businesses in productive activities (back into the business, into cash crops or farming) and reproductive activities (into health or education expenses, clothes or childcare).
Question 5 measures the extent to which women and men reinvest business profit back into the business.
The goal is to measure whether women and men are reinvesting equal amounts and sufficient amounts of profit back in the business to ensure business sustainability. Question 5 also functions as a check that the project has addressed profit control issues so as to guarantee business sustainability. Note that for Question 5 we are asking how much money is reinvested back in the business where as Question 4 asks if money is reinvested back in the business.
Question 6 is the key question in Tool 2. It measures the extent to which women and men equally control profits from businesses that they own (or significantly manage).
The goal of measuring this is to determine the extent to which women and men have equal autonomy over business decisions and whether women and men experience equality in household decision making over key livelihoods assets.
Tool 3: Participation In and Control Over Value Chain Processes MappingWhat does this tool measure? What is the goal of using this tool?the location of female and male beneficiary in the value chain and their participation rates at different stages of the value chain
The goal of using this tool is to see if gender gaps in participation and control at the most remunerative stages of the value chain have been closed.
LINKAGES Universal Indicators Monitoring, Evaluation and Analysis Guide 14

Tool 2: Enumerator’s Field Sheet Women’s Business Profit Control(instructions in italics)
Use focus group discussions or one-on-one interviews to administer this tool. Make sure that you are interviewing the same participants each year. For Question Six, hold an open-ended discussion using the general and probing questions given on this schedule. Do not under any circumstances read out the eight answers provided as a tick list in Question Six as this will only help informants to memorise “the right” answer without telling you anything about changes in the gender power and dynamics in their lives.
Household #: _______________________________
Name of Respondent: ________________________
Respondent Sex: M F
Household Type: MHH FHH
Name of person of the opposite sex also interviewed from the same household: __________________
Female enumerator works with women.
Introduce yourself and the purpose of the interview. Remind the respondent about their right to privacy, to not answer questions if they don’t want to. Let them know what will be done with the information. Make sure they understand what they are consenting to do. Manage expectations around what the project will or will not be doing for the person based on the information they give in the interview.
1. Are you involved in an income generating activity or business? Tick one. Only proceed with the interview if the person answers “yes.”
1.1 Yes1.2 No
2. What type of business activity are you involved in? Either write the type of business down or tick from a list that is determined ahead of time by the project team.
3. What is your position in this business? As we are mostly dealing with informal businesses, and as female beneficiaries are more likely than male to consider their work “for the family” and not solely owned by themselves, you will have to use some judgment when deciding which option to tick. If the woman clearly owns the business or would clearly inherit it if her spouse passes, consider it ownership. If she is clearly just working under her husband’s direction, consider her an employee. If there seems to be some shades of grey where she is claiming it is her business or is de facto running it herself, but control or ownership issues are tricky and embedded in family politics, tick the second option.
LINKAGES Universal Indicators Monitoring, Evaluation and Analysis Guide 15

3.1. I own the business (sole proprietor/own account)3.2. I manage the business, make most of the key decisions, and take out credit for the
business, but someone else owns it.3.3. I am an employee.
4. What do you use the profit of your business for? Tick any of the appropriate responses.
Reinvest back into the business Health care (for self) Health care (for children) School fees Clothes Agricultural inputs Other (as per country context) __________________________________________________
5. What percentage of your profit is reinvested back in the business?Enumerator, if they don’t know the exact percent or can’t tell you this from their business books, use any method to get an approximate percentage.
6. In your household, how are decisions made about how the profit from your business is used?Ask this question to a small focus group or to individuals. Use it to start a discussion about how profit from income generating activities (including farming, business ventures, etc.) is controlled and managed in the household. Ask an open ended question and listen to the answers. Ask probing questions to generate discussions and dig for gender dynamics. Tick the closest one of the following eight options and write notes in the space provided. Do not at any time read out the options given below. It is important to keep this as an open conversation.
Listen for: Who has what role? How much say does the woman really have in the final decision? Does it sound like she is able to actively contribute ideas and have her wishes met or heard? If she says she and the other person do "joint" decision making, does it really sound like she has equal status to the other person in the discussion?
6.1. Of course I have a say in what I do with my income, it is only me in this house!Enumerator, for widows or divorced women, it may be necessary to probe. Even if they are saying they do most of the decision making themselves, there may be someone else in the background.
6.2. I decide on how to spend the money myself, completely independently of my husband (or brother, uncle, mother-in-law, etc.).
6.3. I will sometimes bounce an idea off of another family member, but for the most part, my profit is in my control and I decide what to do with it.
6.4. I discuss with my husband. He may have suggestions. If they are good, I take them. If his suggestions are not the best, I use some means to avoid taking them.
LINKAGES Universal Indicators Monitoring, Evaluation and Analysis Guide 16

6.5. For small needs I can decide by myself, but for others my husband and I discuss together. Even if he has different opinions from me, we express our views freely and he respects my knowledge and judgement. In the end, we find a solutions that meets my needs and his.
6.6. With my business profits, my husband (or other) and I discuss. Even if I have some different ideas about how to spend the money, his say is greater than mine so I must take his advice.
6.7. I don’t consider these to be my business profits. I’m doing this business for the good of the family. I put my money in a family pot, and my husband puts his in the pot, and then we decide together.Enumerator, if you receive this answer, probe: Who puts more of their profits into the family pot, you or your husband (other)? When you decide together, whose say carries more weight? Why? It could be you get a final answer from options 6.2 to 6.6!
6.8. It is not me who decides and it is not my husband/other who decides, it is society. Society says that a woman should spend money on her children and her house, so that is what I do. Then, with the money I have left over, I invest it in my business.
6.9 Other comments coming from this conversation _________________________________________________________________________________________________________________________________________________________________________________________________________________________________________________________________________________________________________________________________________________________________________________________________________________________________________
LINKAGES Universal Indicators Monitoring, Evaluation and Analysis Guide 17

Tool 2: Enumerator’s Field Sheet Men’s Business Profit Control (instructions in italics)
Household #: _______________________________
Name of Respondent: ________________________
Respondent Sex: M F
Household Type: MHH FHH
Name of person of the opposite sex also interviewed from the same household: __________________
Male enumerator works with men.
Introduce yourself and the purpose of the interview. Remind the respondent about their right to privacy, to not answer questions if they don’t want to. Let them know what will be done with the information. Make sure they understand what they are consenting to do. Manage expectations around what the project will or will not be doing for the person based on the information they give in the interview.
1. Are you involved in an income generating activity or business? Tick one. Only proceed with the interview if the person answers “yes.”
1.3 Yes1.4 No
2. What type of business activity are you involved in? Either write the type of business down or tick from a list that is determined ahead of time by the project team.
3. What is your position in this business? Business ownership is often not a clear cut issue, especially with the types of informal businesses we are dealing with. Men may consider that they control the business but that it is a family business and may not clearly distinguish between formal ownership and control. Because of this, you will have to use some judgment when deciding which option to tick.
3.1. I own the business (sole proprietor/own account)3.2. I manage the business, make most of the key decisions, and take out credit for the
business, but someone else owns it.3.3. I am an employee.
4. What do you use the profit of your business for? Tick any of the appropriate responses.
LINKAGES Universal Indicators Monitoring, Evaluation and Analysis Guide 18

Reinvest back into the business Health care (for self) Health care (for children) School fees Clothes Agricultural inputs Other (as per country context) __________________________________________________
5. What percentage of your profit is reinvested back in the business?If they don’t know the exact percent or can’t tell you this from their business books, use any method to get an approximate percentage.
6. In your household, how are decisions made about how the profit from your business is used?Ask this question to a small focus group or to individuals. Use it to start a discussion about how profit from income generating activities (including farming, business ventures, etc.) is controlled and managed in the household. Ask an open ended question and listen to the answers. Ask probing questions to generate discussions and dig for gender dynamics. Tick the closest one of the following eight options and write notes in the space provided. Do not at any time read out the options given below. It is important to keep this as an open conversation.
Listen for: Who has what role? What assumptions does the man make about what kind of decisions it is his entitlement or right to make? What role does his wife (sister/mother/aunt) have in decision making? Is the woman’s role granted by the man or does the woman claim it for herself? If the man says he engages in “joint” decision making with his wife (or other), probe to see if this is “consultation” or if he really values his wife’s opinion as equal to his own.
6.1. I have complete say in how the profit from my business is invested and managed. 6.2. I will sometimes bounce an idea off of a family member or friend, but for the most part, I
make the decision about what to do with my business profitsProbe: is the support person a man or a woman?
6.3. With my business profits, my wife (or other) and I discuss. Even if my wife has a different idea I will usually persuade her to my point of view.Probe. Is there ever a time when you have found your wife’s suggestions to be good and taken them even though it was originally against your better judgement?
6.4. I may consult my wife (sister/aunt/mother) and make some adjustments based on their suggestions, but overall the say over what to do with business profits is mine.
6.5. I discuss with my wife. It is important that the two of us make these decisions together. I value my wife’s opinion, even if it isn’t the same as mine. Eventually we will work out a solution that meets both our needs.
6.6. Once I have made a profit, I turn most of it over to my wife. I only keep a little for personal daily needs.
LINKAGES Universal Indicators Monitoring, Evaluation and Analysis Guide 19

Probe: Who has the final say over daily expenses? Over major purchases? Who has the final say over the general direction of the household (housing upgrades, decisions to purchase livestock, travel, etc.)?
6.7. These aren’t really my business profits, this is for the good of the family. I put my money in a family pot, and my wife puts hers in the pot, and then we decide togetherProbe: Who puts more of their profits into the family pot, you or your wife (other)? When you decide together, whose say carries more weight? Why? It could be you get a final answer from among the options above!
6.8. Really, the decision about what to spend this profit on is made for me by my role in society. I must reinvest in my business and I must make sure my family’s needs are met. There really isn’t any room to move from these obligations, is there?
6.9 Other comments coming from this conversation _________________________________________________________________________________________________________________________________________________________________________________________________________________________________________________________________________________________________________________________________________________________________________________________________________________________________________
LINKAGES Universal Indicators Monitoring, Evaluation and Analysis Guide 20

Tool 2: Administration and Analysis
Before You Administer the Tool
1. Refine the field tool. 1.1. For Question 2, the team may wish to leave the response box blank or make a pre-determined
tick list of businesses or income generation activities from which to choose.1.2. For Question 4, modify the tick list of uses of profit to include ones that are relevant for the
project and to include a good balance of activities that generate income or are considered important and do not generate income or are not considered important. The ideal list will have a balance of items that women and men typically spend their profits on.
1.3. For Question 6, use the CARE Canada guide and team experience to refine the behavioural descriptions in both women’s and men’s scales. Keep to eight response options. In the women’s scale, include a response option or two that are most likely to be given by women heading households. In women’s scale, include options that signal women’s autonomy, that signal women and men working equally together all the way down to options where women have no power. In men’s scale, include options that signal men’s more exclusive control over resources all the way to options that signal very equal decision making with women. Include behaviour descriptions that show that men’s behaviour towards women has really changed. Review the interpretation guide on page XX in order to understand the types of gender power dynamics the question is testing for. Double check to make sure that your scale choices will allow for this test. Anticipate respondents’ answers and develop your list of probing questions before administering the tool. Ensure that the final tool format has plenty of room for recording respondents’ different answers. You will need these answers to triangulate your data.
Note that the tool for women and the tool for men is not quite the same with not quite the same questions. This is because women and men are starting their empowerment journey from different places and they need to make different types of changes in order to become more equal.
2. Set up a database to hold the information gleaned from the tool. Include an option to indicate whether the business that is being tracked was started before the project or because of the project. The database will need to be able to run three levels of analysis on the scales and to hold scales for multiple years.
Question 2:
After Baseline Data Has Been Collected
3. Prepare the data for analysis by aggregating the number of women (and men) involved in different types of businesses and produce percentages of women involved in each type of business, as shown in the chart below. Set up charts to compare the percentages of women and men involved in each type of business. Note that in all of the examples below it may be possible to have a total percentage of more than 100% if one person is involved in more than one type of business. This doesn’t matter so much, the object here is to compare the frequency with which women and men are involved in various types of activities. The sample has kept to an assumption that each beneficiary is involved in only one business.
LINKAGES Universal Indicators Monitoring, Evaluation and Analysis Guide 21

Tool 2 Question 2 Sample Baseline Business Value Comparison Chart and Analysis
Type of Business % of Women With This Type of Business Type of Business % of Men With This
Type of BusinessPetty trading 32% Petty trading 8%Livestock fattening 19% Livestock fattening 25%Sewing 45% Sewing 0%Selling sorghum 1% Selling sorghum 55%Carpentry 3% Carpentry 12%
4. Analyse the outcome of the data and use it to inform project programming using questions such as the following.
? What types of businesses are women more likely to be involved in? Men?? Are the types of businesses that women are involved in supply driven or demand driven? Is
there a solid market for the products they are selling or is the market slow? How does this compare with the types of businesses men are involved in?
? Which sex is more involved in more remunerative businesses? ? What will the project do to diversify the types of businesses that women run? that men run?? If women are involved in less remunerative businesses than men, what will the project do to
promote women’s involvement in more remunerative businesses?? If women are involved in supply side or slow businesses and markets, what will the project
do to involve them in businesses that are demand driven or in faster markets?
After Year 1
5. Prepare the data for analysis by aggregating the data from year one data collection as done with baseline data. This should produce two charts with two sets of information showing changes over the year, as shown in the sample.
Sample Baseline Business Value Comparison Chart and Analysis
Type of Business % of Women With This Type of Business Type of Business % of Men With This
Type of BusinessPetty trading 32% Petty trading 8%Livestock fattening 19% Livestock fattening 25%Sewing 45% Sewing 0%Selling sorghum 1% Selling sorghum 55%Carpentry 3% Carpentry 12%
Sample Year 1 Business Value Comparison Chart and Analysis
Type of Business % of Women With This Type of Business Type of Business % of Men With This
Type of BusinessPetty trading 35% Petty trading 5%
LINKAGES Universal Indicators Monitoring, Evaluation and Analysis Guide 22

Helpful Hint 4: Does every decrease or increase in a gender gap mean real gender change?
Sometimes gender gaps increases or decreases show real change in agency or structure,... but not always! You will need to refer to your supplemental data and ask the gender analytic questions to determine if there is a real gender equality meaning to the data. For example, the 6% gap reduction in women’s and men’s involvement in petty trading is a positive development only if it resulted from equality in mobility or women’s ability to trade in goods of high demand equally with men. The gap could also have decreased but because women are increasingly selling items that are already in good supply in the village or because men have turned to more lucrative. Both of these reasons are negative gender results. Similarly, the gap in women and men taking up sewing decreased but this is not significant if the whole objective of the project is to introduce women and men to commercial tomato farming because sewing is a low value business with a saturated market.
Livestock fattening 25% Livestock fattening 15%Sewing 22% Sewing 0%Selling sorghum 3% Selling sorghum 55%Carpentry 5% Carpentry 15%Commercial tomato sales
10% Commercial tomato sales
10%
6. Identify the extent to which women’s (and men’s) involvement in different types of businesses has increased or decreased over the year. If using the samples above, Women’s involvement in petty trading went up by 3%, men’s decreased by 3%. Women’s involvement in livestock fattening increased by 6%, men’s decreased by 10%. Women’s involvement in sewing decreased by 23%, no men took up sewing. Women’s involvement in carpentry increased by 4%, men’s by 3%. Ten percent of women and men became involved in commercial tomato farming.
7. Calculate the extent to which the gap in between women’s and men’s ownership of certain type of businesses decreased.
8. Analyse the findings using gender analytic questions such as the following. ? What types of businesses are women (and
men) more likely to be involved in? Any changes between the years?
? Any trend towards women being involved in more remunerative businesses?
? any indication that men’s involvement in stable and skilled businesses has increased disproportionately to women’s involvement?
? Any new business ventures by women? by men? Which is more remunerative/of greater value?
? what will the project do to continue a variety of remunerative businesses for women?
9. Note that the analysis between baseline and year one and between year one and subsequent years will be slightly different because the base beneficiary profile will be different. The baseline pool of beneficiaries will include only those who already have businesses, whereas this pool will expand in year one to include beneficiaries who started businesses through the project. This difference will need to be factored in to each year of analysis.
At End Line
LINKAGES Universal Indicators Monitoring, Evaluation and Analysis Guide 23

10. Prepare data for analysis using a similar method as for Year 1.
11. Analyse project outcomes and impacts using questions such as those below. ? Was there any increase in the variety of types of businesses that women are involved in as
compared to men?? Was there any increase in women’s involvement in remunerative businesses as compared to
men? ? What was easy and what was difficult about getting women into non-traditional activities or into
remunerative activities where men have traditionally dominated? ? What kinds of business risks was the project asking women to take on and did any of these
materialize?? did men migrate to the most remunerative activities, leaving women with non-traditional
activities but ones that were non-traditional?? any change in community thinking about women’s and men’s roles and what it is acceptable for
women and men to do as business work? Any “men’s businesses” get reassigned as women’s or vice versa?
? Were women (and men) able to leave activities that are supply driven with low demand?
Question 3:
12. Data preparation and analysis for Question 3 is fairly straightforward. Prepare a chart such as the one below and clearly articulate each year the amount of profit that men and women (separately) reinvest back into their businesses.
Sample End of Project Profit Reinvestment Comparison Chart
Project Phase % of Profits Women Reinvest % of Profits Men ReinvestBaseline 30% 70%Year 1 35% 75%Year 2 50% 70%End Line 55% 65%
13. Use the following analytic questions to ensure that both women and men are reinvesting a maximum amount of profit back in their business, or enough profit to ensure business viability and growth. Report on the amount of profit that women and men are reinvesting into their businesses in each annual report. ? Did the level of women’s profit reinvestment back into the business increase? sufficiently to
ensure business is sustainable and can grow and beat competition? ? What challenges did women face in reinvesting more into their business? How did they
negotiate with husbands and others about profit reinvestment? ? Did the gap between the amount that women and that men invest in their businesses decrease?
By how much? Who is investing more back into their businesses at the end of the project and how might this affect onward sustainability and business growth?
? What were women and men spending the money not invested back in the business on? Men on household obligations? Women on what?
LINKAGES Universal Indicators Monitoring, Evaluation and Analysis Guide 24

Question 4:
After Baseline Data Has Been Collected
14. Prepare the data for analysis by aggregating the ways in which women and men reinvest and use the profit from their businesses by sex and carry out an initial analysis. Again, the sample for this question at baseline is only beneficiaries who currently have businesses.
Tool 2 Question 4 Sample Baseline Business Profit Use Chart
% of Women % of MenReinvest back into the business 17% 30%Health care (for self) 4% 5%Health care (for children) 15% 10%School fees 55% 14%Clothes 1% 1%Agricultural inputs 8% 40%Other (as per country context)
15. Analyse the findings by asking questions such as the ones below.? Which sex reinvests more money back into the business?? Which sex invests more in items that do not generate a profit? ? Based on these responses, which sex is in a more vulnerable (or stronger) business position
(hint, the more one invests back into one’s business, the more likely it is to flourish)?
After Year 1
16. As with previous questions, prepare and compare the baseline chart to the Year 1 chart.
Sample Baseline Business Profit Use Chart
% of Women % of MenReinvest back into the business 17% 30%Health care (for self) 4% 5%Health care (for children) 15% 10%School fees 55% 14%Clothes 1% 1%Agricultural inputs 8% 40%Other (as per country context)
Sample Year 1 Business Profit Use Chart
% of Women % of Men
LINKAGES Universal Indicators Monitoring, Evaluation and Analysis Guide 25

Reinvest back into the business 20% 30%Health care (for self) 9% 6%Health care (for children) 15% 13%School fees 55% 15%Clothes 1% 1%Agricultural inputs 10% 35%Other (as per country context)
17. Compare the increases and decreases in investments within the same sex and between the two sexes as follows. Women’s profit reinvestment increased by 3%. Men’s stayed the same. This means a reduction
in the gender gap in business reinvestment from 13% to 10% after Year 1. Women’s investment in health care for self increased by 5%, men’s increased by 1%. The gap in
health care for self widened from 1% in favour of men to 3% in favour of women. Women’s investment in health care for children did not increase, but men’s increased by 3%. Women’s investment in school fees stayed the same. Men’s decreased by 1%. Women’s and men’s investment in clothing stayed at 1% respectively. Women’s investment in agricultural inputs increased by 2% and men’s decreased by 5%. The gap
in agricultural input investment decreased from 32% to 25%.
18. As with other questions, your supplemental information will tell you how significant each of the increases, decreases and reductions in gaps really are. The changes in the gap between investment in health care for self could be favourable if an increase in women spending on health care means increased ability to attend pre- and post-natal clinic sessions. The gap in reduced investment in agricultural inputs is positive if it is accompanied by more equal decision making around farm management, but it is negative if men retain control over farm management decisions.
19. Analyse these findings using questions such as the following and write the analysis as part of your annual report. ? How do profit investment/reinvestment patterns affect household gender relations and division
of labour and vice versa? How do they perpetuate negative gender stereotypes?? Who is investing more in productive activities? reproductive activities? Are men investing more
in reproductive activities as time goes on? ? any burdens around investing more in productive activities to the expense of reproductive? or
investing in items that the person has no control over? ? Which sex invests more in items that do not generate a profit? ? Based on these responses, which sex is in a more vulnerable (or stronger) business position
(hint, the more one invests back into one’s business, the more likely it is to flourish)?? Is the amount that men are reinvesting back into reproductive goods (clothes, health care, etc.)
increasing and evening out with the amount that women spend in this area?
At End Line
20. Prepare data for analysis using the same method as outlined above.
21. Analyse your findings using the gender analytic questions above, as well as the following.
LINKAGES Universal Indicators Monitoring, Evaluation and Analysis Guide 26

? How do profit investment/reinvestment patterns affect household gender relations and division of labour and vice versa? How do they perpetuate negative gender stereotypes?
? Was the project successful in changing reinvestment patterns to ensure that more money/enough money goes back into the business and to see if women and men are investing more equally in productive and reproductive goods?
Question 6:
After Baseline Data Has Been Collected
22. Prepare the data for analysis by calculating the frequency with which women (and men) chose each answer and creating a scale such as the one below for each sex.
Sample Baseline Profit Control Scale: Women
Choice Numbe
rStatement Describing Type of Control
% of Women Giving This Response
W6.1 Of course I have a say in what I do with my income, it is only me in this house!
12%
W6.2 I decide on how to spend the money myself, completely independently of my husband (or brother, uncle, mother-in-law, etc.).
5%
W 6.3 I will sometimes bounce an idea off of another family member, but for the most part, my profit is in my control and I decide what to do with it.
10%
W6.4 I discuss with my husband. He may have suggestions. If they are good, I take them. If his suggestions are not the best, I use some means to avoid taking them.
21%
W6.5 For small needs I can decide by myself, but for others my husband and I discuss together. Even if he has different opinions from me, we express our views freely and he respects my knowledge and judgement. In the end, we find a solution that meets my needs and his.
10%
W6.6 With my business profits, my husband (or other) and I discuss. Even if I have some different ideas from my husband about how to spend the money, his say is greater than mine so I must take his advice.
22%
W6.7 I don’t consider these to be my business profits. I’m doing this business for the good of the family. I put my money in a family pot, and my husband puts his in the pot, and then we decide together.
15%
W6.8 It is not me who decides and it is not my husband/other who decides, it is society. Society says that a woman should spend money on her children and her house, so that is what I do. Then, with the money I have left over, I invest it in my business.
5%
Sample Baseline Profit Control Scale: Men
LINKAGES Universal Indicators Monitoring, Evaluation and Analysis Guide 27

Choice Number Statement Describing Type of Control % of Men Giving
This ResponseM6.1 I have complete say in how the profit from my business is invested and
managed.20%
M6.2 I will sometimes bounce an idea off of a family member or friend, but for the most part, I make the decision about what to do with my business profits.
30%
M6.3 With my business profits, my wife (or other) and I discuss. Even if my wife has a different idea I will usually persuade her to my point of view.
19%
M6.4 I may consult my wife (sister/aunt/mother) and make some adjustments based on their suggestions, but overall the say over what to do with business profits is mine.
15%
M6.5 I discuss with my wife. It is important that the two of us make these decisions together. I value my wife’s opinion, even if it isn’t the same as mine. Eventually we will work out a solution that meets both our needs.
2%
M6.6 Once I have made a profit, I turn most of it over to my wife. I only keep a little for personal daily needs.
2%
M6.7 These aren’t really my business profits, this is for the good of the family. I put my money in a family pot, and my wife puts hers in the pot, and then we decide together.
5%
M6.8 Really, the decision about what to spend this profit on is made for me by my role in society. I must reinvest in my business and I must make sure my family’s needs are met. There really isn’t any room to move from these obligations, is there?
7%
23. The same information can be presented in a compact form on a horizontal scale, as below.
Sample Baseline Women’s Profit and Control Scale
6.1 6.2 6.3 6.4 6.5 6.6 6.7 6.8Baseline% of Women Giving This Response
12% 5% 10% 21% 10% 22% 15% 5%
Sample Baseline Men’s Profit and Control Scale
6.1 6.2 6.3 6.4 6.5 6.6 6.7 6.8Baseline% of Men Giving This Response
20% 30% 19% 15% 2% 2% 5% 7%
24. Interpreting this data does not follow the same process as used for prior questions in Tool 1 and Tool 2 because the answer choices that were given to women and to men are different. The Scales Interpretation Guide on PAGE XX and Helpful Hint 5 describe how to read the numbers and the trends that they illustrate.
LINKAGES Universal Indicators Monitoring, Evaluation and Analysis Guide 28

Helpful Hint 5: Men’s and women’s answer options on these scales are different. How are we supposed to compare the
data to calculate a gender gap?
For the profit control scales, the gender gap will be calculated by determining if there was an increase in the percentage of women giving responses of greater autonomy and if there is an increase in the percentage of men giving responses of greater equality. We are looking for increases in the number of women choosing answers W6.2 and W6.3 at the top end of the scale, and an increase in the number of men choosing M6.5 and M6.8 at the bottom end of the scale. The interpretation guide found on page 34 describes how to interpret the trends and results of the findings from the scales in Question 6 in order to see if gender gaps in control over business profits are closing. Please read this guide before proceeding.
25. Once the initial scales have been created, use the interpretation guide and the questions below to analyse your findings. ? Do women have enough control over
their profit to a) sustain their businesses and b) ensure that the business will stay in their hands if it gets more profitable?
? To what extent are men open and transparent about their business transactions with their spouses?
? What proportion of female and male beneficiaries are providing gender blind answers? How will you adjust your awareness raising work to meet the needs of this group?
? To what extent do women in FHH have real control over their own profits (as opposed to surrendering larger decisions to male relatives)?
? What kinds of cultural inconsistencies did the interviews and data bring up and how can you use these to leverage cultural change?
? How is it that women have autonomy over their businesses – how did they achieve this and are there any techniques that the project can use with the women it is about to work with? What about how men get their autonomy? Ways that this differs who had to change social rules? who gets autonomy if status quo is kept?
After Year 1
26. Prepare information for analysis using the smaller horizontal charts, one chart for women and one for men, as in the sample below.
Sample Baseline and Year 1 Women’s Profit and Control Scale
6.1 6.2 6.3 6.4 6.5 6.6 6.7 6.8Baseline% of Women Giving This Response
12% 5% 10% 21% 10% 22% 15% 5%
Year 1% of Women Giving this Response
14% 8% 14% 23% 11% 19% 8% 4%
Increase in response frequency
2% 3% 4% 2%
Decrease in response frequency
1% 3% 7% 1%
LINKAGES Universal Indicators Monitoring, Evaluation and Analysis Guide 29

Helpful Hint 6:How can we tell whether the change in frequency of
women or men choosing an answer is due to negative gender change or positive gender change?
It will not be possible to directly correlate a one-to-one ratio of percentage increase from one position on the scale to another. For example, just because there was a 1% decrease in men choosing M6.6 doesn’t mean that there will be a 1% increase in men choosing M6.5. The total percentage increase or decrease is a bit deceptive because it hides negative or positive movement within the answer. In other words, we don’t know if there was a 3% increase in men choosing M6.5 because men who chose this answer at baseline chose a different answer at Year 1 or if men who chose M6.5 at Year 1 chose a different answer at baseline. It is ok if this dynamic remains hidden (calculating it would take too much time and effort, and we want to focus on broad trends), but it is also why the field notes are so important. Only field notes will tell you whether the increases and decreases are related to people leaving their original position on the scale or coming into a new position.
Sample Baseline and Year 1 Men’s Profit and Control Scale
6.1 6.2 6.3 6.4 6.5 6.6 6.7 6.8Baseline% of Men Giving This Response
20% 30% 19% 15% 2% 2% 5% 7%
% of Men Giving this Response
19% 29% 17% 20% 5% 1% 6% 3%
Increase in response frequency
5% 3% 1%
Decrease in response frequency
1% 1% 2% 1% 4%
27. These findings show the following changes in gender dynamics. 27.1. Changes to women’s position on the profit control scale
W6.1 - increase because some women in FHH gained a greater understanding of their right to make decisions for themselves through CARE awareness raising discussions.
W6.2 – increase because the project did a considerable amount of awareness raising with family members and the community, so that by the time female beneficiaries set up their new businesses, both they and their families recognised those businesses as managed and controlled by women. Enumerators noted that there are a great many more women in the beneficiary pool who could chose this answer.
W6.3 – same reason for increase as W6.2.
W6.4 – Enumerator interview notes indicate that there are two possible reasons for the result here. First, some women moved from W6.4 to W6.3 because they gained confidence, but more women moved into this category because they decided to see if there was a soft way to keep control over their own business profits without directly confronting their spouses. These women moved from W6.6 to W6.4.
Decrease in W6.5 as women move to W6.4. or W6.3.
Decrease in W6.6 as women move to W6.4. or W6.3.
Decrease in W6.7 after CARE awareness raising sessions. During SAA discussions, women
LINKAGES Universal Indicators Monitoring, Evaluation and Analysis Guide 30

critiqued the idea of “good of the family.” Some said that often women do something “for the good of the family” but it means a real sacrifice for themselves or their daughters. They began to realise that this idea of “good of the family” has a negative as well as positive side if your original power in the family is low.
Decrease in W6.8 as women begin to question the influence of society’s rules in their own lives.
27.2. Changes to men’s positions on the profit control scales Decrease in M6.1 as a few men begin to realise that it’s ok to involve others in decision
making over household/business income. Decrease in M6.2 but there wasn’t any real gender reason for this in the interviews. Decrease in M6.3 as men begin to think more consultatively and a couple of men who
were running businesses with much control began to realise that their wives perform a healthy check and balance function and have good business knowledge, so they started to take wife’s point of view as legitimate.
Increase in M6.4 but we are not concerned by this at this stage in the project (it’s only Year 1, after all). This increase signals that a lot of men have begun more consultation with their wives and are now beginning to see consultation as important. They are still retaining the right to make the final decision, however. If we see that men are still retaining this right at the same rate after Year 2 and 3, then we will get concerned and make some interventions.
Increase in M6.5 as some men gained confidence that their wife’s decision and suggestions are ok and worth taking. Next year looking for a decrease in 6.4 in favour of 6.5.
Decrease in 6.6 but we think this is just because of general awareness that men are now thinking about who really has power and control in a household.
Increase in 6.7 because some men chose this answer to indicate that they were doing more joint decision making. We probed carefully and asked if the joint decision making was really joint, if wife had equal say, etc. and this is what we found.
Decrease in 6.8 because we did a lot of SAA with men to get them to realise that this is beyond a society thing and that they have some personal responsibility here.
27.3.Changes to gender gaps. As the percentage of women choosing answers W6.1 and W6.2 increased and the
percentage of men choosing M6.1 decreased, the project is able to demonstrate a narrowing of the gap between women’s and men’s autonomy over their businesses.
There was an increased in the percentage of women choosing W6.3 and a decrease in the percentage of men choosing M6.3 (but it was not significant). Enumerators asked women and men who their main sounding boards were. Women responded that it was their husbands, father-in-law or another experienced male family. Men responded that they looked to their uncles, brothers or another male family member. When enumerators probed, women reassured them that getting advice from a male family member did not decrease their own control over their businesses, but that they asked as a sign of respect. When men were asked if they would ever use women as sounding boards some laughed, but others asserted that women have a good business sense and are more thrifty. Still others noted that both women and men had received the same business management training from CARE, and they would feel comfortable asking for advice from women who had this type of training.
LINKAGES Universal Indicators Monitoring, Evaluation and Analysis Guide 31

The percentage of women answering W6.6 decreased and the percentage of men answering M6.2 decreased slightly. This shows some narrowing of a gender gap in which men have greater control over business profits, regardless of who generated them.
28. Analyse the changes illustrated above using the interpretation guide and the questions below. The field notes from the focus group discussions or one-on-one discussions will be essential to explaining the changes that you see. ? Are key gender gaps in profit control closing? ? What were the small but significant ways in which women and men changed their use of power
for themselves? In relations with one another? ? What were the key attitude changes among men? among women? Did women or men discuss
any “Ah hah” moments where they realised they had to make a gender change? ? Are women using women or men as sounding boards and how does this influence their level of
autonomy over their businesses? Are men using women or men and what does this say about women in non-traditional roles?
? How have changes to women’s and men’s use of power or to gender dynamics and relations in profit control affected women’s autonomy? Household resiliency? Women’s and men’s ability to transparently plan and forecast for shocks and stresses? Women’s ability to use a variety of more sustainable livelihood options?
? Are men’s attitudes about women and their roles in the household changing? ? What kinds of resistance to change did women or men show? ? Are men encouraging other men to change? Are women working with one another to raise
consciousness?
29. When setting up the charts and preparing findings for analysis in Years 2 and 3 of the project, list the percentages of women and men choosing the different answers, but only compare increases and decreases of the current year against baseline. The sample below illustrates the point.
Sample Baseline, Year 1 and Year 2 Women’s Profit and Control Scale
6.1 6.2 6.3 6.4 6.5 6.6 6.7 6.8Baseline% of Women Giving This Response
12% 5% 10% 21% 10% 22% 15% 5%
Year 1% of Women Giving this Response
14% 8% 14% 23% 11% 19% 8% 4%
Year 2% of Women Giving this Response
15% 15% 21% 18% 12% 12% 5% 2%
Increase in response frequency between baseline and Year 2
3% 10% 11% 3%
Decrease in response frequency between baseline and Year 2
3% 10% 10% 3%
30. Once again, use information from interviews to explain the findings. Small but steady gains towards autonomy are expected, but unexpected and negative results are also possible. Use analytical questions such as the ones above to report on this Global Indicator in each annual report.
LINKAGES Universal Indicators Monitoring, Evaluation and Analysis Guide 32

At End Line
31. Prepare charts as for previous years and write a final narrative of the trends based on the interpretation guide and example above. Final analytical and learning questions, as well as a method for doing a final project evaluation, may result in the scales and their analysis being used differently than in past years. The final evaluation may ask the following questions. ? Did women experience increasing autonomy and control over their business profits? ? Did men significantly change their behaviour and attitudes to cede profit control to women
and/or share it more jointly with women? ? How did women’s and men’s personal attitudes and beliefs around profit control change?? How did the relationships between and/or among women and men change? ? How do women and men describe the quality of their household relations given current profit
control patterns?? How do women and men describe their ability to use sustainable livelihood strategies given
current profit and control patterns? ? What social rules or community beliefs changed? ? Do men and women feel that they are more able to weather shocks or trends given gender
changes to profit and control patterns? ? Are there any links to be made between women’s control over their own profits and the level of
poverty in FHH?? What role did the project play in making these changes? ? Will change to gendered power relations in profit control last after the project? How do you
know?
LINKAGES Universal Indicators Monitoring, Evaluation and Analysis Guide 33

Gender Dynamics in the Profit Control ScalesInterpretation Guide
W6.1 is an option for women in FHH who have no male who is involved in consultation or decision making in her household. There is no equivalent choice for men. Women in FHH may choose another answer if they do refer decisions to men outside of their household. Increases among both women in FHH and MHH choosing this response indicate increased autonomy and equality.
W6.2 shows a maximum level of autonomy and agency for women in MHH. It indicates that women have gained the same kind of autonomy over their businesses that men currently have. LINKAGES is aiming to see a significant increase in the number of women choosing this answer. Compare the number of women choosing this answer to the number of men choosing M6.1, as both questions test whether women and men are able to independently manage their businesses using forms of power that are currently associated with men.
W6.3 shows relatively strong autonomy and control over the business. The key indicator of this is that business profit is in the woman’s control, and that while she may consult others, she is not obliged to take their advice. LINKAGES is aiming to see a significant increase in the number of women choosing this answer. Compare the number of women who chose this answer with the number of men who choose M6.3.
W6.4 shows limited autonomy. The woman has enough power to manage most business affairs but does not have enough power to visibly and transparently manage the business as she sees fit. She must use the tactics of the subaltern to work around her husband’s greater formal power. This question tests the extent to which women are using this type of weak power. LINKAGES is looking to decrease the number of women choosing this answer in favour of W6.3 and W6.2.
W6.5 shows equality. Both spouses are able to express their views freely. The woman notes that she feels respected and understood. She can give an example of the way in which her husband treats her as an equal and says that her needs are met (as well as the needs of others). LINKAGES is looking for an increase in the number of women answering with this response.
W6.6 shows little to no autonomy or agency. The woman runs the business but does not have sufficient control over its strategic management or profits. She has little power to manoeuvre in the face of her spouse’s “final say.” LINKAGES is looking for a decrease in the percentage of women choosing this answer in favour of W6.4 – W6.2.
W6.7 shows no autonomy over business profits and no recognition that at least some autonomy is desirable. Don’t be fooled by this type of answer! This is not an indication that the woman and man are undertaking “joint” decision making! To understand the gender dynamic here, think about the baseline situation in the community. Men may put their money into a family pot or into expenses for the good of the family and are likely under some pressure to do so as breadwinners, but they also have more power and autonomy to decide how this money is used towards an overall household livelihood strategies and outcomes. Women put their money into the pot also out of a social obligation to be a good woman and contribute to the family, but without equal power to determine the overall household livelihood outcomes and without equal awareness that this power is rightfully theirs. For these reasons, this answer hides key gender inequalities. It looks like both are contributing, but who has more power over these
LINKAGES Universal Indicators Monitoring, Evaluation and Analysis Guide 34

contributions? It looks like business profits are going towards development objectives, but in reality they are being used in a way that is the main cause of gender unequal economic growth outcomes. LINKAGES is looking to see greater awareness among women of their power as autonomous business owners and for decisions that are made where both women and men have the same status and value in each other’s and society’s eyes. The project may be able to compare W6.7 to M6.7 when men are answering this question in a gender blind fashion.
W6.8 refers to structure rather than relations or agency. It shows no autonomy and the root cause of the inequalities discussed in other answers. As the project progresses, LINKAGES is looking to hear that society’s rules around profit reinvestment have changed and that women and men are taking advantage of these changes, so should see a decrease in this answer, but towards an answer that may not be on the scale. W6.8 is comparable to M6.8 although the power relations behind women and men answering this way could be different. The rules of society are often much more bounding and contradictory for women where as they may be bounding for men but it is easier for men to break them. Testing that gender awareness among women of this harm and of men of the double standard.
M6.1 shows complete autonomy by men over their businesses. Compare the frequency with which men choose this response to the frequency with which women choose the responses W6.1 and W6.2. The aim of LINKAGES is to close the gender gap between the number of men choosing M6.1 and W6.2. The project is also looking for men to take on more consultative business management practices, so it is looking for a decrease in M6.1 in favour of M6.5.
M6.2 shows complete autonomy by men over their businesses, with a willingness to take advice and learn from others. Probing is needed to determine if men are willing to take women’s advice. If they do, it can be interpreted as some change towards a more gender equal attitude because men are seeing women as their business equals. On the whole, however, LINKAGES is looking for a decrease in the number of men answering this way.
M6.3 shows men having autonomy over their business decisions and power over their spouse’s knowledge and attitudes. LINKAGES is looking for a decrease in the number of men choosing this response.
M6.4 is the classic “I have the final say” response. Men cede some power by consulting with women and adjusting based on women’s advice, but they retain primary control over business profits and decision making. LINKAGES is looking for a decrease in the number of men choosing this answer.
M6.5 shows that men have changed their attitude and practice and are acknowledging women as business equals. The question tests to see if men are recognising their spouse’ point of view as legitimate or not (compare with M6.3, and the project should see a decrease in M6.3 towards M6.5). The program is looking for an increase in the number of men making this response.
M6.6 hides gender inequalities in household relations. Don’t be fooled! It is not an indication that women have more control! With this answer, it looks like men are handing power over with the money, but in reality they are either retreating from equal involvement in household management or they are handing money over without handing over power. Just because men give portions of their pay packets to women doesn’t mean that they also cede decision making
LINKAGES Universal Indicators Monitoring, Evaluation and Analysis Guide 35
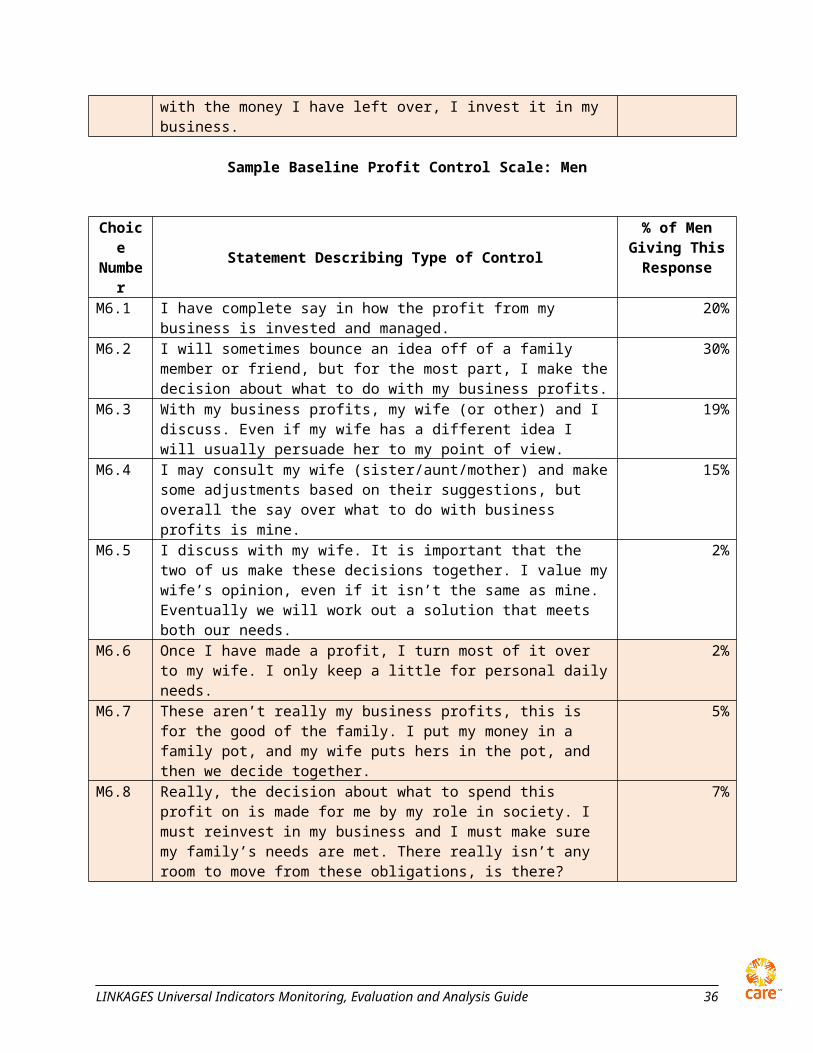
to women. This answer needs probing to determine who has the final say over large purchases or over strategic livelihoods decisions in the household. The question tests men’s awareness of gender dynamics and it tests for certain types of resistance. LINKAGES is looking for a decrease in the number of men giving this response.
M6.7 could have two interpretations, so it will need to be probed. 1. As with W6.7, it could be that men are not aware of gender dynamics and power in
household relations and truly believe that both spouses are working towards the good of the family in a gender blind way. In this case, tick M6.7 and compare with the number of women choosing answer W6.7.
2. In cultural contexts where men frequently retreat from responsibility for household decision making and do not consider the good of the family or consulting women, this response could signal that men have made a change and recognise the importance of contributing to household expenses, have an increasing commitment to household wellbeing and have made changes in their lives to begin discussing spending with women as equals. If this is the case, tick M6.5.
M6.8 refers to structure rather than relations or agency. It shows no autonomy and the root cause of the inequalities discussed in other answers. As the project progresses, LINKAGES is looking to hear that society’s rules around profit reinvestment have changed and that women and men are taking advantage of these changes. Compare to the number of women answering W6.8 but probe to see if men are critical of these rules and aware of their gender consequences or if they are satisfied with this rule the way it is.
LINKAGES Universal Indicators Monitoring, Evaluation and Analysis Guide 36

Tool 3: Women’s Focus Group Discussion Guide(instructions in italics)
The goal of this exercise is to map where women are present in the key value chains that the project is working on and whether they are present as participants (processors, value adders) or as controllers (sellers, managers). This exercise is ideally completed through a focus group discussion with women who are all part of the same value chain, but it can also be done with a group of women involved in different value chains, provided that there are two or three women involved in one chain so that they can work on the assignment together. Lead the focus group through the exercise below and hold a discussion to analyse results. As well as a female enumerator, it may be handy to have a marketing specialist involved.
1. Number of focus group (FG) members: _______________________________
2. Number of FG members in each age category: aged 15 – 24 aged 25 – 49 aged 50 and over
3. Number of FG Members: Living in FHH Living in MHH
4. Types of businesses that FG Members are involved in:If all the women in the FG are involved in one type of business, mark that. If they are involved in a variety of activities, list the types of activities and how many members of the FG are involved in each.
5. Explain why you are here and what you are here for. Explain the process for the day.
6. Ask the group to diagram their value chain using paper and markers or materials collected from around the village. They may also want to photograph different steps in the value chain. Whatever method is being used, make sure that they are diagramming the entire value chain and not just the processing or production stages in which CARE’s beneficiaries are involved in their local village. If they don’t have much information about downstream stages (such as international exports), they can take a best guess. The diagram needs to include all key steps, stages or processes, but does not have to be overly detailed.
7. Using a separate colour or symbol, ask the group to mark the processes or stages in the value chain that are most valuable or that make the most profit.
8. Using a separate colour or symbol, ask the group to mark the processes in the value chain where they participate. 8.1. Repeat with another colour and ask the group to mark processes that they control.
9. Using a separate colour or symbol, ask the group to mark the processes in which the opposite sex (men in this case) are involved. 9.1. Repeat with another colour and ask the group to mark processes that they control.
LINKAGES Universal Indicators Monitoring, Evaluation and Analysis Guide 37

10. Analyse the chart with beneficiaries to identify gender inequalities in control and access in the value chain. The analysis guide is found in the Tool 3 Administration and Analysis section of the LINKAGES monitoring and evaluation field guide.
LINKAGES Universal Indicators Monitoring, Evaluation and Analysis Guide 38

Tool 3: Men’s Focus Group Discussion Guide(instructions in italics)
The goal of this exercise is to map where men are present in the key value chains that the project is working on and whether they are present as participants (processors, value adders) or as controllers (sellers, managers). This exercise is ideally completed through a focus group discussion with men who are all part of the same value chain, but it can also be done with a group of men involved in different value chains, provided that there are two or three men involved in one chain so that they can work on the assignment together. Lead the focus group through the exercise below and hold a discussion to analyse results. As well as a male enumerator, it may be handy to have a marketing specialist involved.
1. Number of focus group (FG) members: _______________________________
2. Number of FG members in each age category: aged 15 – 24 aged 25 – 49 aged 50 and over
3. Types of businesses that FG Members are involved in:If all the women in the FG are involved in one type of business, mark that. If they are involved in a variety of activities, list the types of activities and how many members of the FG are involved in each.
4. Explain why you are here and what you are here for. Explain the process for the day.
5. Ask the group to diagram their value chain using paper and markers or materials collected from around the village. They may also want to photograph different steps in the value chain. Whatever method is being used, make sure that they are diagramming the entire value chain and not just the processing or production stages in which CARE’s beneficiaries are involved in their local village. If they don’t have much information about downstream stages (such as international exports), they can take a best guess. The diagram needs to include all key steps, stages or processes, but does not have to be overly detailed.
6. Using a separate colour or symbol, ask the group to mark the processes or stages in the value chain that are most valuable or that make the most profit.
7. Using a separate colour or symbol, ask the group to mark the processes in the value chain where they participate. 7.1. Repeat with another colour and ask the group to mark processes that they control.
8. Using a separate colour or symbol, ask the group to mark the processes in which the opposite sex (women in this case) are involved. 8.1. Repeat with another colour and ask the group to mark processes that they control.
9. Analyse the chart with beneficiaries to identify gender inequalities in control and access in the value chain.
LINKAGES Universal Indicators Monitoring, Evaluation and Analysis Guide 39

The analysis guide is found in the Tool 3 Administration and Analysis section of the LINKAGES monitoring and evaluation field guide.
LINKAGES Universal Indicators Monitoring, Evaluation and Analysis Guide 40

Grow and/or buy peanuts
Trader bottles bulk peanut butter and sells to retail outlets.
Roast and mash peanuts into peanut butter. Package in buckets or bottles.
Sell bottled peanut butter in local market.
Sell bulk peanut butter to trader for sale in city. Retail outlets sell to city customers.
Tool 3 Administration and Analysis
Before You Administer the Tool
1. Review the stages in the value chains that the project is involved in and, together with the project’s marketing specialist, ensure that the enumerator team has a clear grasp of the general dynamics of the chain.
2. Ensure that the team has adequate supplies of flip chart paper, markers, cameras to take pictures of diagrams, sheets on which to record material, analysis question sheets, etc.
3. Ensure that the project results database has a place to store the findings from this exercise. 4. Determine the size and composition of the focus groups. Will they be women and men involved in
only one chain or will they be involved in a number of chains?
After Baseline Data Has Been Collected
1. Analyse the baseline data as part of the focus group discussion. Use the analysis guide and examples below.
Sample Step 6 Diagram
Sample Step 7 Diagram
LINKAGES Universal Indicators Monitoring, Evaluation and Analysis Guide 41

Grow and/or buy peanuts
Trader bottles bulk peanut butter and sells to retail outlets.
Roast and mash peanuts into peanut butter. Package in buckets or bottles.
Sell bottled peanut butter in local market.
Sell bulk peanut butter to trader for sale in city.Retail outlets sell to city customers.
this costs us money!
In this diagram, the larger the dollar sign, the greater the profit.
Sample Step 8 Diagram
In the sample above, “participation” is marked by the black sign for woman and “control” is marked for the pink sign for woman. The larger the symbol, the more participation or control the woman has.
LINKAGES Universal Indicators Monitoring, Evaluation and Analysis Guide 42

Grow and/or buy peanuts
Trader bottles bulk peanut butter and sells to retail outlets.
Roast and mash peanuts into peanut butter. Package in buckets or bottles.
Sell bottled peanut butter in local market.
Sell bulk peanut butter to trader for sale in city.Retail outlets sell to city customers.
this costs us money!
Sample Step 8 Diagram
In the sample above, the black symbols for man represent participation and the blue symbols represent control. The larger the symbol, the greater control or participation.
2. Summary of the charts and discussion Respondents noted that women have some role in growing peanuts, but the bulk of peanuts need to be bought, and this is men’s job. Women are primarily responsible for making and bottling peanut butter. Women and men equally sell peanut butter in local markets and their control over the profits from this venture is about equal. It is primarily men who sell outside the village. There is a little more money to be made here, and men tend to hold this as part of household profits. Men are also primarily involved in and control interactions related to trading. This is where the most money is to be made. There are some women involved in retail sales and, if they own their own shops, they will control the profits, but mostly it is men who run these shops or own them and they control related profits.
3. Once this basic discussion has been recorded, dig deeper with focus group members. ? Are women primarily concentrated in one or two processes in the value chain? Are these the most
valued? the most skilled? the best remunerated? ? Who are key actors in the processes that are the most valuable, women or men?? What can women do in this project to get into processes that are more valuable or that have more
value add and control?
LINKAGES Universal Indicators Monitoring, Evaluation and Analysis Guide 43

After Year 1
4. Either by using the baseline diagrams and revising them or by drawing new diagrams, hold another discussion with the same focus groups as at baseline. Ask the following analysis questions and use the answers to report against Immediate Outcome 2.2 in the LINKAGES annual report.
? Has there been any change to where women are placed in the value chain? Where men are placed?
? Are women controlling more valued processes?? Are there more women involved in the more valued areas in the value chain? ? Where have men moved to? Have they taken on less skilled, less well-paid tasks? ? Are men entering any areas where it used to be mostly women working, but where men
are now seeing greater profit and opportunity because this area’s value has increased?? Are the activities to increase women’s access to and control over the more valued areas in
the value chain working? What can the project do better?
At End Line5. Prepare Data for Analysis
6. Analyse Findings 9.1. Analysis at the end of the project
? Has there been any change to where women are placed in the value chain? Where men are placed?
? Are women controlling more valued processes?
LINKAGES Universal Indicators Monitoring, Evaluation and Analysis Guide 44

GLOBAL INDICATOR 3: Enabling organizations exhibit at least two characteristics of a gender sensitive organization (from a standard international best practice list).
This indicator is measured using one tool.
Tool 1: Gender Equality Organisational Capacity ChecklistWhat does this tool measure? What is the goal of using this tool?This tool measures the extent to which organizations have key gender equality tools, systems and processes in place.
The goal of using this tool is to determine if the organization has the systems and structures necessary to ensure sustainable gender equality results in its work. It can be used as the backbone of a gender audit or gender equality partnership assessment.
LINKAGES Universal Indicators Monitoring, Evaluation and Analysis Guide 45

Tool 4: Enumerator’s Checklist(instructions in italics)
Name of Interviewee:______________________
Position in Organization: ___________________
Ask the interviewee each question below. Tick the appropriate box. Probe and make notes underneath the chart based on the conversation.
Organizational Gender Equality Assets Yes NoOrganizational Culture
Does the organization have a gender strategy or gender equality goals in its strategic planning document?Do annual reports, general publications and promotional material discuss gender issues and the organization’s gender equality programming?Is the physical space in the organization friendly for both female and male employees? (Separate washrooms for men and women in good order; female staff has the same calibre of technology as male staff; female and male staff have equal access to cars and drivers; etc.)Does the organization have a reputation of addressing gender equality as part of its work (check with local women’s organizations to answer this question)?Political WillHas a budget been designated to implement the gender strategy or gender equality strategic goal?Are gender issues routinely addressed in training on other topics (ie: as part of agriculture extension training given to government extension agents)?Are the policies on pay equity, maternity leave, promotion equity and similar enforced?What is the ratio of women to men
a) in executive leadership?b) In staff/general membership?
For this question, rather than answering “yes” or “no,” write the ratios in the space provided.
a)b)
AccountabilityDoes the organization have a quota and/or program to encourage women in leadership positions?Are gender equality tasks integrated into job descriptions?Does the organization use sex-disaggregated data to plan and manage its work and budgets?Do the organization’s policies on pay equity, maternity benefits, health benefits, parental leave, transport, and other issues meet or exceed national government legislation?Do the organization’s orientation and professional development programs include opportunities for training in gender equality?
Technical Capacity
LINKAGES Universal Indicators Monitoring, Evaluation and Analysis Guide 46

Organizational Gender Equality Assets Yes NoDoes the staff demonstrate gender equality technical expertise sufficient to fulfil the GE tasks related to their job descriptions?Does the organization have gender-specific programming?Does the organization produce tip sheets, tools or guidance notes on gender equality as it relates to its work?Does the organization partner with women’s organizations?
LINKAGES Universal Indicators Monitoring, Evaluation and Analysis Guide 47

Tool 4: Administration and Analysis
Before You Administer the Tool
1. This checklist is designed to provide a rapid assessment of the gender equality fitness of a CARE partner organization. It includes some but not all of the internationally recognised standard criteria for a gender fit organization under InterAction’s four categories of gender equality organizational development: organizational culture, political will, accountability and technical capacity. It is closely aligned to the criteria that the Canadian International Development Agency (CIDA) uses to rank its partners. The checklist is not meant to replace the type of comprehensive, participatory exercise that would typically take place as part of an initial assessment of partner fit. Instead, it is meant to rapidly assess whether a partner has the organizational building blocks necessary to achieve sustainable gender equality programming results. Ask the same person(s) the same questions on the checklist each year and record the results in LINKAGES annual reports.
2. The tool is general and meant to be used with many types of partners. It will need some modification before it is used, but almost all of these questions are relevant to any type of organization, from a grassroots community grain bank to a regional NGO to a government department.
3. There are two ways to use this tool, and the team will need to decide on which way they are going to use. 3.1. Rapid assessment method: Using participant observation, a one-on-one meeting with key
partner staff, or a focus group discussion to answer the questions in the checklist with the partner using a closed answer style.
3.2. Action research method: Use the questions below as a skeleton checklist and build a more participatory action research process with the partner, in which partner staff are assigned various questions below, answer them through research interactions with colleagues. Answers are more open ended and the group debriefs to answer the question:
“What have we learned about the gender equality fitness of our organization?”
4. Set up a space in your project database to compare the answers from the baseline, Year 1 and subsequent years. Use the examples below.
After Baseline Data Has Been Collected
5. Identify the number of “yes” answers and the number of “no” answers under each of the four categories. Identify the percentage of women and men in leadership positions and in regular positions. Identify where the organization’s strengths and weaknesses are and use this to start a discussion or formulate a plan for organizational strengthening.
6. Analyse findings using the following questions. Does the organization have at least one “yes” in all four areas of organizational development? If the organization currently does not have a gender equality strategy or goal, how will it work
towards one during the lifetime of the project?
LINKAGES Universal Indicators Monitoring, Evaluation and Analysis Guide 48

If the organization currently does not designate funding towards implementing this goal, how does this affect the effectiveness of the organization?
Are the number of women in leadership positions proportionately equal to the number of women in membership positions (ie: if there are 40 female and 60 male members, are there at least 4 women on the executive?)?
Are there relatively equal numbers of women and men in the organization? How does the organization currently hold itself accountable for gender equality results? To what degree is each and every staff member aware that they have a gender equality job to
do as part of their membership in the organization? How might weaknesses in one of the four areas affect the ability of the organization to perform
in other areas?
7. Use the answers to these questions to assist the organization in creating a gender equality capacity building plan (if it doesn’t already have one).
After Year 1
8. Prepare charts to compare the responses from baseline with those of Year 1.
Sample Baseline Checklist Responses
Organizational Gender Equality Assets Yes NoOrganizational Culture
Does the organization have a gender strategy or gender equality goals in its strategic planning document? Do annual reports, general publications and promotional material discuss gender issues and the organization’s gender equality programming? Is the physical space in the organization friendly for both female and male employees? (Separate washrooms for men and women in good order; female staff has the same calibre of technology as male staff; female and male staff have equal access to cars and drivers; etc.)
Does the organization have a reputation of addressing gender equality as part of its work (check with local women’s organizations to answer this question)?
Sample Year 1 Checklist Responses
Sample Baseline Checklist Responses
Organizational Gender Equality Assets Yes NoOrganizational Culture
Does the organization have a gender strategy or gender equality goals in its strategic planning document?
Do annual reports, general publications and promotional material discuss gender issues and the organization’s gender equality programming?
Is the physical space in the organization friendly for both female and male employees? (Separate washrooms for men and women in good order; female staff has the same
LINKAGES Universal Indicators Monitoring, Evaluation and Analysis Guide 49

Organizational Gender Equality Assets Yes Nocalibre of technology as male staff; female and male staff have equal access to cars and drivers; etc.)Does the organization have a reputation of addressing gender equality as part of its work (check with local women’s organizations to answer this question)?
9. Compare the results of each year using analytic questions such as the following.? What progress did the organization make towards gender equality fitness over the year? ? What changes were hard to make and why? Easy to make and why? ? What changes required a real shift in how organization members think about gender equality or
treat one another? ? What were the most effective methods of making change? ? How do organization members anticipate sustaining changes in subsequent years? ? Were the changes made because
o one individual championed them? o members were generally motivated to work for the change?o there as a gender technical expert present? o of another reason?
At End Line
10. There are a number of possible ways in which LINKAGES can look further at the gender equality capacity and fitness of its partners. These will be discussed over the lifetime of the project and further support provided as needed.
LINKAGES Universal Indicators Monitoring, Evaluation and Analysis Guide 50