_indicespring.bologna.enea.it/towefo/results_public_area/d8-9-14... · web viewpolyester yarn...
TRANSCRIPT

TOWEFO(Toward Effluent Zero)
EVALUATION OF THE EFFECT OF THE IPPC APPLICATION ON THE
SUSTAINABLE WASTE MANAGEMENT IN TEXTILE
INDUSTRIES
I D E N T I F I C A T I O N C O D E : D I S . : P A G . : O F P A G . :
TH-404-002TH-404-001TM-405-001
PU 1 41P A R T N E R : W O R K P A C K A G E :
VITO WP4
E X T E R N A L I D E N T I F I C A T I O N C O D E :
C O N T R A C T N U M B E R :
EVK1-CT-2000-00063T I T L E :
D 8: DATA SOURCE ON RELAXATION POSSIBILITIES OF PROCESS WATER QUALITY
D 9: OPTIMAL WATER RE-USE PROCEDURES APPLICABLE IN THE SYNTHETIC/SILK/COTTON INDUSTRY
D 14: INTEGRATED METHODOLOGY FOR WATERPINCH AND WASTE WATER DESIGN
K E Y W O R D S
A N N O T A T I O N S :
3
2 10/04/04 F i n a lW. Schiettecatte
I. Genné
1 31/03/04 F i n a l f o r r e v i s i o nW. Schiettecatte
I. Genné
0 25/02/04D r a f t c o n t e n t s
W. SchiettecatteJ. HelsenE. BraunsI. Genné
R E V . D A T E D E S C R I P T I O N E D I T I N G V A L I D A T I O N A P P R O V A L
P E R I O D C O V E R E D B Y R E P O R T S E C T I O N S I N C L U D E D : C O - O R D I N A T O R N A M E : P R O J E C T H O M E P A G E :N U M E R O :
ENEAhttp://
spring.bologna.enea.it/towefo/

TOWEFOToward Effluent Zero
P A R T N E R : I D E N T I F I C A T I O N C O D E : R E V . : D I S . : P A G . :
Vito 0 CO 2Content of Deliverables:
1 INTRODUCTION...........................................................................................................4
2 DESCRIPTION OF THE ACTIVITIES...........................................................................5
3 METHODOLOGY OF WATERPINCH..........................................................................6
3.1 From PIDACS towards data sheets............................................................................................................. 6
3.2 Selection of reusable process effluents & Calculations...............................................................................7
3.3 Information used from test results.............................................................................................................. 8
3.4 Visualisation and optimization.................................................................................................................... 9
4 ALTERNATIVE WATER SCHEMES FOR SCREENED COMPANIES......................11
4.1 Company B01............................................................................................................................................. 114.1.1 Production............................................................................................................................................... 114.1.2 Water balance......................................................................................................................................... 114.1.3 Selection of reusable process effluents & used test results.......................................................................114.1.4 Obtained water savings........................................................................................................................... 124.1.5 Changed contamination of process water & discharges...........................................................................124.1.6 Economical evaluation............................................................................................................................ 13
4.2 Company B02............................................................................................................................................. 144.2.1 Production............................................................................................................................................... 144.2.2 Water balance......................................................................................................................................... 144.2.3 Selection of reusable process effluents & used test results.......................................................................144.2.4 Obtained water savings........................................................................................................................... 144.2.5 Changed contamination of process water & discharges...........................................................................144.2.6 Economical evaluation............................................................................................................................ 14
4.3 Company B04............................................................................................................................................. 154.3.1 Production............................................................................................................................................... 154.3.2 Water balance......................................................................................................................................... 154.3.3 Selection of reusable process effluents & used test results.......................................................................154.3.4 Obtained water savings........................................................................................................................... 164.3.5 Changed contamination of process water & discharges...........................................................................164.3.6 Economical evaluation............................................................................................................................ 17
4.4 Company B05............................................................................................................................................. 184.4.1 Production............................................................................................................................................... 184.4.2 Water balance......................................................................................................................................... 184.4.3 Selection of reusable process effluents & used test results.......................................................................184.4.4 Obtained water savings........................................................................................................................... 194.4.5 Changed contamination of process water & discharges...........................................................................194.4.6 Economical evaluation............................................................................................................................ 20

TOWEFOToward Effluent Zero
P A R T N E R : I D E N T I F I C A T I O N C O D E : R E V . : D I S . : P A G . :
Vito 0 CO 3
4.5 Company I04.............................................................................................................................................. 214.5.1 Production............................................................................................................................................... 214.5.2 Water balance......................................................................................................................................... 214.5.3 Selection of reusable process effluents & used test results.......................................................................214.5.4 Obtained water savings........................................................................................................................... 224.5.5 Changed contamination of process water & discharges...........................................................................234.5.6 Economical evaluation............................................................................................................................ 24
4.6 Company I06.............................................................................................................................................. 254.6.1 Production............................................................................................................................................... 254.6.2 Water balance......................................................................................................................................... 254.6.3 Selection of reusable process effluents & used test results.......................................................................254.6.4 Obtained water savings........................................................................................................................... 274.6.5 Changed contamination of process water & discharges...........................................................................274.6.6 Economical evaluation............................................................................................................................ 28
4.7 Company I09.............................................................................................................................................. 294.7.1 Production............................................................................................................................................... 294.7.2 Water balance......................................................................................................................................... 294.7.3 Selection of reusable process effluents & used test results.......................................................................294.7.4 Obtained water savings........................................................................................................................... 304.7.5 Changed contamination of process water & discharges...........................................................................314.7.6 Economical evaluation............................................................................................................................ 31
4.8 Company I15.............................................................................................................................................. 334.8.1 Production............................................................................................................................................... 334.8.2 Water balance......................................................................................................................................... 334.8.3 Selection of reusable process effluents & used test results.......................................................................334.8.4 Obtained water savings........................................................................................................................... 354.8.5 Changed contamination of process water & discharges...........................................................................354.8.6 Economical evaluation............................................................................................................................ 37
5 General conclusions...................................................................................................38

TOWEFOToward Effluent Zero
P A R T N E R : I D E N T I F I C A T I O N C O D E : R E V . : D I S . : P A G . :
Vito 0 CO 41 INTRODUCTION
The work documented in this report is part of the project “Evaluation of the effluent of the IPPC application on the sustainable waste water management in the textile industries (Towef0)” funded by the European Commission as a shared cost RTD project in the 5 th Framework Research program, Energy, Environment and Sustainable Development, Key action 1 Sustainable management and Quality of Water, Treatment and purification technologies, Waste water treatment and reuse.
The project objective is to establish a multicriteria integrated and coherent implementation of Good Environmental Practices (GEP) and to promote the efficiënt use of resources within textile finishing industries characterised by large use of water, taking into account the treatment of industrial waste water effluent (Urban Waste Water Treatment Directive 91/271 EEC) and the impact of the final discharge to the water recipient bodies (Water Framework Directive COM (98)).
Partners of the project were: ENEA, the Italian National Agency for New Technologies, Energy and the Environment, Vito, a Belgian Research centre for the industry, Centexbel, a research centre for the Belgian textile federation, the Joint Research Centres of Siviglia and Ispra, Lariana Depur S.p.A., a private Italian company, Ecobilan, a private French company and Environmental Protection & Resource Conservation Foundation (EP&RC).
Within this project several Italian and Belgian companies were screened. Useful information for further evaluation was put into Process Identification & Data Collections Sheets (PIDACS) by Lariana and Centexbel.These data were furthermore used by Vito to design alternative water schemes for different textile finishing companies, in order to minimise water consumption in a cost effective way.
This document gives a detailed overview of the results obtained within Work-Package 4: WaterPinch technology in textile finishing industries (silk, synthetic fibres and cotton).

TOWEFOToward Effluent Zero
P A R T N E R : I D E N T I F I C A T I O N C O D E : R E V . : D I S . : P A G . :
Vito 0 CO 52 DESCRIPTION OF THE ACTIVITIES
The main objective of this part of the project was to design alternative water schemes for different textile finishing companies, in order to minimise water consumption in a cost effective way.
WP 4 was split into seven job cards:WP04.01.4 Methodology for waterpinch technology application on textile industryWP04.02.4 Definition of the criteria for the textile processes identification WP04.03.4 Definition of the criteria for identification of water reuse options.WP04.04.4 Definition for the collection and elaboration of process data.WP04.05.4 Design of water reuse scheme and definition of necessary water quality.WP04.06.4 Design of database of allowable inlet concentrations of the textile processes. WP04.07.4 Guidelines for an optimal reduction of water usage and discharge
In addition one job-card from WP5 is linked to this issue:WP05.07.4 Integrated methodology for waterpinch and waste water design
The results of these job-cards are summarised in this document, covering following three deliverables:Deliverable 8 Data source on relaxation possibilities of process inlet water quality. Deliverable 9 Optimal water re-use procedures applicable in the synthetic/silk/cotton industry.Deliverable 14 Integrated methodology for waterpinch and waste water design.
The three deliverables are merged into one document as their content is clearly linked.
This document starts with the methodology used to optimise the water schemes of the different evaluated companies. It explains how the information from the other work packages was used. Test results from membrane filtration trials, as well as economical evaluations done by ENEA were integrated into the schemes. Furthermore, indicative values are given on relaxation possibilities for different process steps. Attached in annex all detailed information about the optimised water schemes of the different industries can be found.

TOWEFOToward Effluent Zero
P A R T N E R : I D E N T I F I C A T I O N C O D E : R E V . : D I S . : P A G . :
Vito 0 CO 63 METHODOLOGY OF WATERPINCH
This part describes the different steps of the methodology1 that was used starting from the company-specific PIDACS till the design of an alternative water scheme in the dedicated software WaterTracker®.
3.1 From PIDACS towards data sheets
Starting from the PIDACS, the elaborated amount of data needed to be compiled into a surveyable format. All the useful information with regard to water minimization was extracted and summarized into Excel data sheets. The way the information was presented is illustrated in Figure1.
Different process stepsContamination values
Water consumption & Discharge
Fabric Equipment W2 W3 W4 D1 T pH Cond COD TSSnumber name number name tn/yr tn/yr tn/yr °C mS/cm ppm ppm
F1.1 Scouring (50 or 90°C) FLAX Jigger 1 bath 299 299 68 9,75 0,45 7050 250PL 2 Cont. washing 395 395 35 8,30 0,23 1420 80
CO/PL 3 washing 299 299 32 7,99 0,19 110 25FLAX/PL 4 filling 149 149 18 7,80 0,21 50 5
Water use 1142
F1.3 Scouring (80-90°C) FLAX Torpedo 1 bath 333 333 48 9,54 0,23 1060 70PL 2 washing 333 333 19 8,80 0,19 160 12
CO/PLFLAX/PLSILK/PL
Water use 666
Process Sub-sequence
Figure 1 : Data sheets containing all relevant information for water minimization
The following information is found in these tables: Process number and name as used in the PIDACS. Fabric on which this process is done. Machine on which this process is done. Number and name of the sub-sequence as used in the PIDACS. Water consumption & discharge for the different types of water. Contamination of the discharge.
These tables were used for preliminary, summarizing calculations: Waste waters from similar processes were grouped and their mixed flow rate and contamination was calculated. By grouping these similar flows, the amount of information to be entered into the visualisation software is reduced significantly.
1 Content of Deliverable 14: Integrated methodology for waterpinch and waste water design.

TOWEFOToward Effluent Zero
P A R T N E R : I D E N T I F I C A T I O N C O D E : R E V . : D I S . : P A G . :
Vito 0 CO 73.2 Selection of reusable process effluents & Calculations
The selection of the streams was based on the experimental results from the membrane filtration trials and the reuse tests.
The main criteria to select streams for reuse can be generalized as follows: No pretreatment or dye baths taken into consideration. These streams are often too concentrated
for treatment by membrane filtration. The upper limit for the COD value is set at 1000 mg /l in order to reach, after filtration,
sufficient low values for reuse of permeate. However, for some specific cases another limit was used. This is discussed further in the detailed descriptions of the different cases.
The conductivity is preferable lower than 1000 µS /cm. This is important in case of reactive and sometimes acid and direct dyeing, where salt content plays a crucial role on the dyeing recipe. For other dyeing processes it can be expected that conductivity will anyway be below this value.
As a result, the different process effluents are grouped into non reusable - high contaminated discharges and reusable - low contaminated flows. Pretreatment, dyeing and finishing departments were evaluated separately as they are often situated at different locations.
Figure 2 illustrates how calculations were done in the data sheets. Contamination of the grouped process effluents is determined. As explained in paragraph 3.1 these calculations were done in order to group similar process-effluents to reduce the amount of information to be entered into the visualisation software.
Feed Discharges: Scouring: High concentratedFabric W3 W4 Flow T Cond COD TSS
number name tn/yr tn/yr kg/yr kg/yr
F2.1 Scouring PL 392 392 16856 118 399840 37240for disperse dyeing CO/PL 363 363 28314 218 573540 29040
FLAX/PLSILK/PL
Water use 755
F2.2 Souring PLfor disperse dyeing CO/PL 85 85 4250 136 223550 6800
FLAX/PLSILK/PL
Water use 389 448 840 840 49420 471 1196930 7308059 0,56 1425 87
Process
Calculated contamination for similar group of process effluents
Figure 2 : Summarizing calculations in data sheets

TOWEFOToward Effluent Zero
P A R T N E R : I D E N T I F I C A T I O N C O D E : R E V . : D I S . : P A G . :
Vito 0 CO 83.3 Information used from test results
The identification of reuse/recycle options of process effluents implies a knowledge of the maximum tolerated relaxation of the inlet water quality 2. Specific data for textile processes was gathered from literature data and from partners know-how. Table 1 gives a non-exhaustive, qualitative list of possible relaxation -of the inlet water qualities- and reuse for different steps in a textile finishing company. Some quantitative ranges are given as well.
Table 1 : Possible reuse and relaxation for different process streams
Process Effluent RelaxationDesizing Possible product recovery.
Permeate recyclable.Low quality water accepted.
Prewashing Possible regeneration. Low quality water acceptedBleaching Possible reuse of rinsing waters.
Regeneration could be required.High quality required (COD<60mg/l and S.S.<5mg/l)
Mercerising Recovery of NaOHDyeing Possible reuse of rinsing waters.
Regeneration could be required.High quality required (COD<60mg/l and S.S.<5mg/l)
Printing Possible reuse of rinsing waters.Regeneration could be required.
High quality required (COD<60mg/l and S.S.<5mg/l)
Due to the vast variation in textile processes and related effluents it is very hard to generalize the required inlet concentrations of the different steps. The values of Table 2 are used as reference general requirements for process water in the Belgian textile industry and have also been agreed with Italian industrial representatives.Since the required quality is subjected to multiple parameters like the product colour (light or dark), the type of rinsing (first or final), the kind of dyestuff that is being used… extensive testing is still required for every specific case.
Table 2 :Generalized process water requirements
Parameter ValuepH 6.5 – 9Hardness (°F) < 5Conductivity (µS/cm) < 1 000COD (mg/l) < 60Fe (µg/l) < 100Mn (µg/l) < 100Colour No visible colour or suspended solids
Secondly, results from the membrane filtration trials and the anaerobic lab test were used as a basis for the removal efficiency values of the introduced technologies in the software package WaterTracker®.
Only 17 different process effluents from the screened companies were tested. As a result, assumptions had to be made based on interpolations of these values for all other optimizations.
2 Content of Deliverable 8: Data source on relaxation possibilities of process inlet water quality

TOWEFOToward Effluent Zero
P A R T N E R : I D E N T I F I C A T I O N C O D E : R E V . : D I S . : P A G . :
Vito 0 CO 9Finally, the economic evaluation of the effluent treatment was used as an additional guideline for the optimization. It was illustrated that the higher the flow rate through the membrane filtration unit, the lower the cost per m³ treated water. However, above 50 000 m³ /year the cost decrease becomes minor. This is clearly illustrated in the figure below.
Costs related to plant size
0
0,2
0,4
0,6
0,8
1
1,2
1,4
1,6
0 50000 100000 150000 200000 250000 300000
Treated flow rate (m³ /year)
Cost
(€ /m
³)
Figure 3 :Example of a cost curve for membrane treatment (combination UF-NF)
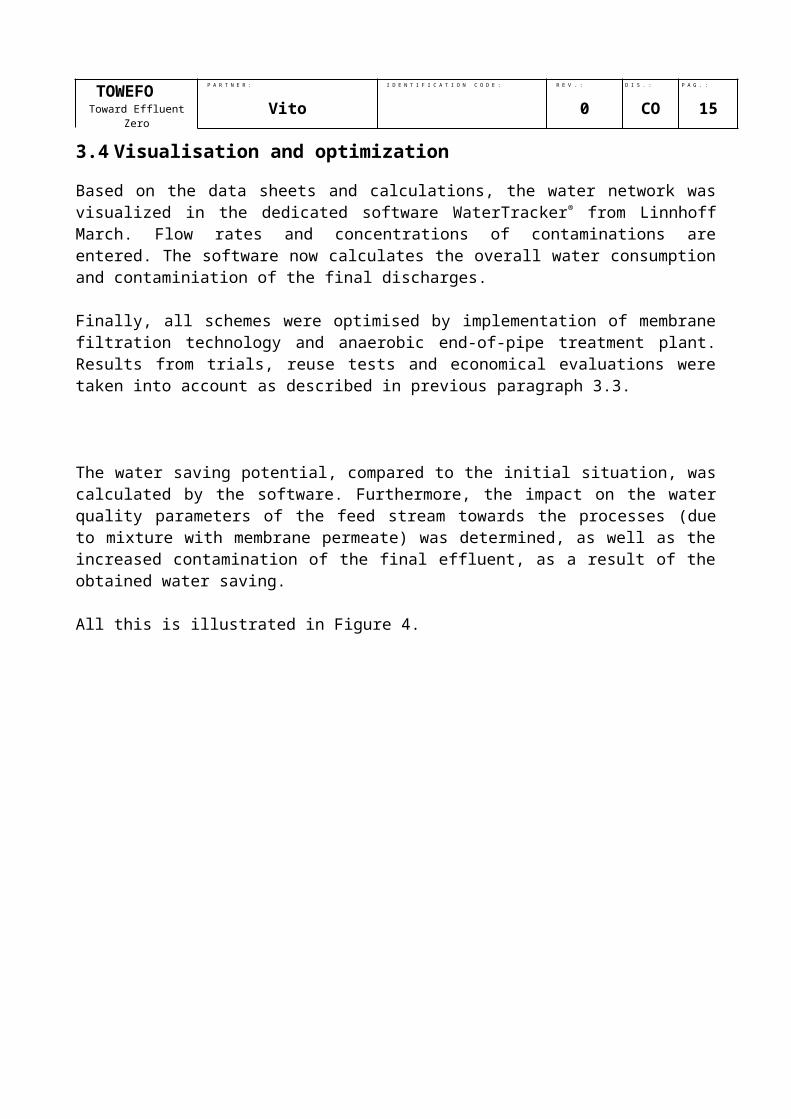
3.4 Visualisation and optimization
Based on the data sheets and calculations, the water network was visualized in the dedicated software WaterTracker® from Linnhoff March. Flow rates and concentrations of contaminations are entered. The software now calculates the overall water consumption and contaminiation of the final discharges.
Finally, all schemes were optimised by implementation of membrane filtration technology and anaerobic end-of-pipe treatment plant. Results from trials, reuse tests and economical evaluations were taken into account as described in previous paragraph 3.3.
The water saving potential, compared to the initial situation, was calculated by the software. Furthermore, the impact on the water quality parameters of the feed stream towards the processes (due to mixture with membrane permeate) was determined, as well as the increased contamination of the final effluent, as a result of the obtained water saving.
All this is illustrated in Figure 4.

TOWEFOToward Effluent Zero
P A R T N E R : I D E N T I F I C A T I O N C O D E : R E V . : D I S . : P A G . :
Vito 0 CO 10
Figure 4 : Extract of water circuit optimization using WaterTracker®

TOWEFOToward Effluent Zero
P A R T N E R : I D E N T I F I C A T I O N C O D E : R E V . : D I S . : P A G . :
Vito 0 CO 114 ALTERNATIVE WATER SCHEMES FOR SCREENED COMPANIES
The methodology, as explained above, was applied to eight of the screened Italian and Belgian companies. The specific approach for each company, as well as the obtained results are reported in this chapter 3. All detailed data sheets and WaterTracker® schemes can be found in Annex 1 and 2.
4.1 Company B01
4.1.1 Production
Table 3 illustrates some production values as can be found in the PIDACS.
Table 3 : Production values B01
Fiber Type ProductionPolyester yarn dyeing 465 000 kg /yr
piece dyeing 855 000 kg /yrTotal 12 408 000 kg /yr
The optimization was focused on the commission finishing of polyester.
4.1.2 Water balance
In production ground water is used. The overall water consumption is 857 839 m³ /yr, according to the PIDACS.The water consumption of the evaluated polyester processes is 48 150 m³ /yr.
The detailed water balance can be found in Annex 1 and 2.
4.1.3 Selection of reusable process effluents & used test results
In reference to the membrane filtration trial PDD/UF/NF the removal efficiency of a combined UF/NF on disperse dyeing effluents is as indicated in Table 4.
Table 4 : Removal efficiencies on disperse dyeing effluents
UF/NF RemovalOrganic fraction 53 %Conductivity 49 %TSS 99 %
3 Content of Deliverable 9: Optimal water re-use procedures applicable in the synthetic/silk/cotton industry.

TOWEFOToward Effluent Zero
P A R T N E R : I D E N T I F I C A T I O N C O D E : R E V . : D I S . : P A G . :
Vito 0 CO 12In addition, it is assumed that for a combined ultra- and nano-filtration plant a recovery up to 80% should be achievable.
All rinsing phases were selected for reuse. Parameters of those streams are as indicated in Table 5.
Table 5 : Selection of reusable streams B01
CriterionCOD < 2 000 mg /lConductivity < 2 500 µS /cm
These criteria are slightly different than those given in the methodology. However, tests have proven that permeate from a combined UF/NF filtration on rinsing effluents from disperse dyeing processes can be reused in a similar process.
4.1.4 Obtained water savings
The water consumption in the initial situation for the screened processes was 48 150 m³ /yr.
Using the above selection criteria and removal efficiencies of the implemented membrane filtration technology, the water consumption for the specific polyester dyeing processes is reduced to 30 750 m³ /yr. This reduction equals 36%.The flow rate towards the UF/NF installation will be 21 750 m³ /yr.
Details are given in Annex 2.
4.1.5 Changed contamination of process water & discharges
Table 6 summarizes the contamination of the process water for the initial and alternative scenario’s.
Table 6 : Process water quality B01
Stream Temperature Conductivity COD TSS°C µS /cm mg /l mg /l
Ground water 16 910 10 0
Permeate UF/NF 39 870 438 0Mix permeate & ground water
24 890 164 0
It can be concluded that the obtained COD concentration, after mixing the permeate with ground water is significantly higher than the general process water quality as indicated in chapter 3.3. However, tests have proven that permeate from a combined UF/NF filtration on rinsing effluents from disperse dyeing processes can be reused in a similar process.

TOWEFOToward Effluent Zero
P A R T N E R : I D E N T I F I C A T I O N C O D E : R E V . : D I S . : P A G . :
Vito 0 CO 13As the water consumption decreases, the contamination of the final effluent increases proportionally.
These changes are illustrated in Table 7.
Table 7 : Changed effluent concentration B01
Stream Temperature Conductivity COD TSS°C µs /cm mg /l mg /l
Initial effluent 61 3 350 2 513 144
Effluent after optimization 74 4 800 3 740 228
4.1.6 Economical evaluation
Using the economical evaluation done by ENEA for a combined UF/NF treatment on a disperse dyeing effluent it can be concluded that the costs for this specific regeneration technology on a process effluent of 21 750 m³ /yr is around € 1.2 /m³. Compared to the actual cost of ground water of € 0.12 /m³ this is still very high.
Increasing costs for groundwater, as well as more stringent limits on the use of it, however will stimulate the search for alternative process water.Besides the mentioned reduced cost of € 0.12 /m³ groundwater, the decrease of energy consumption for pumping water to and from the process should be evaluated as well.

TOWEFOToward Effluent Zero
P A R T N E R : I D E N T I F I C A T I O N C O D E : R E V . : D I S . : P A G . :
Vito 0 CO 144.2 Company B02
4.2.1 Production
Table 8 illustrates some production values as can be found in the PIDACS.
Table 8 : Production values B02
Fiber Type ProductionCotton yarn or fabricPolyester yarnTotal 16 777 000 kg /yr
The evaluation was focused on the piece and yarn pretreatment and dyeing of cotton.
4.2.2 Water balance
In production ground water is used. The overall water consumption is 396 510 m³ /yr, according to the PIDACS.The water consumption of the evaluated cotton processes is 288 211 m³ /yr.
The detailed water balance can be found in Annex 1.
4.2.3 Selection of reusable process effluents & used test results
All measured rinsing effluents are highly contaminated. In addition, no membrane filtration test results are available for vat, sulphure and indigo dyeing. As a result, no alternative water circuits were suggested.
4.2.4 Obtained water savings
Not relevant
4.2.5 Changed contamination of process water & discharges
Not relevant.
4.2.6 Economical evaluation
Not relevant.
TOWEFOToward Effluent Zero
P A R T N E R : I D E N T I F I C A T I O N C O D E : R E V . : D I S . : P A G . :
Vito 0 CO 154.3 Company B04
4.3.1 Production
Table 9 illustrates some production values as can be found in the PIDACS.
Table 9 : Production values B04
Fiber Type ProductionCotton yarn dyeing 1 463 200 kg /yr
fabric dyeing 5 852 800 kg /yrTotal 7 316 000 kg /yr
The optimization was focused on the reactive dyeing, both of cotton yarn and pieces.
4.3.2 Water balance
In production mainly ground water is used. However, for steam production rain water is captured. The overall ground water consumption is around 553 073 m³ /yr, according to the PIDACS.
The ground water consumption as obtained in the WaterTracker® scheme is 478 439 m³ /yr. This is slightly different from the total water consumption as mentioned in the PIDACS. The reason for this difference is that the overall value is based on flow meters and the water scheme value on the summation of all the different processes taken into account. As a result the small water losses due to manual operations and cleaning processes are not counted.
The detailed water balance can be found in Annex 1 and 2.
4.3.3 Selection of reusable process effluents & used test results
In reference to the membrane filtration trial CRD/UF/NF the removal efficiency of a combined UF/NF on cotton reactive dyeing process effluents is as indicated in Table 10.
Table 10 : Removal efficiencies on reactive dyeing effluents
UF/NF RemovalOrganic fraction 84 %Conductivity 15 %TSS 99 %
In addition, it is assumed that for a combined ultra- and nano-filtration plant recoveries up to 80% should be achievable.

TOWEFOToward Effluent Zero
P A R T N E R : I D E N T I F I C A T I O N C O D E : R E V . : D I S . : P A G . :
Vito 0 CO 16Water seals, rinsing, soaping, fixation and softening phases were selected for reuse. Parameters of those streams are as indicated in Table 11.
Table 11 : Selection of reusable streams B04
CriterionCOD 1 500 mg /lConductivity < 5 000 µS /cm
These criteria are different from those given in the methodology. It was shown during membrane filtration trials (on total process effluent, including dye bath) and reuse tests that the regeneration and reuse of reactive dyeing effluents is difficult. The pH and salt concentration are too high. Adjustment of pH is easily achievable. However, as the conductivity appeared to be too high during the tests, no dye baths were included during this optimization.
4.3.4 Obtained water savings
Compared to the initial value of 478 439 m³ /yr, the obtained water consumption after optimization is 364 169 m³ /yr. This reduction equals 24%.The flow rate towards the UF/NF installation will be 122 126 m³ /yr.
Details are given in Annex 2.
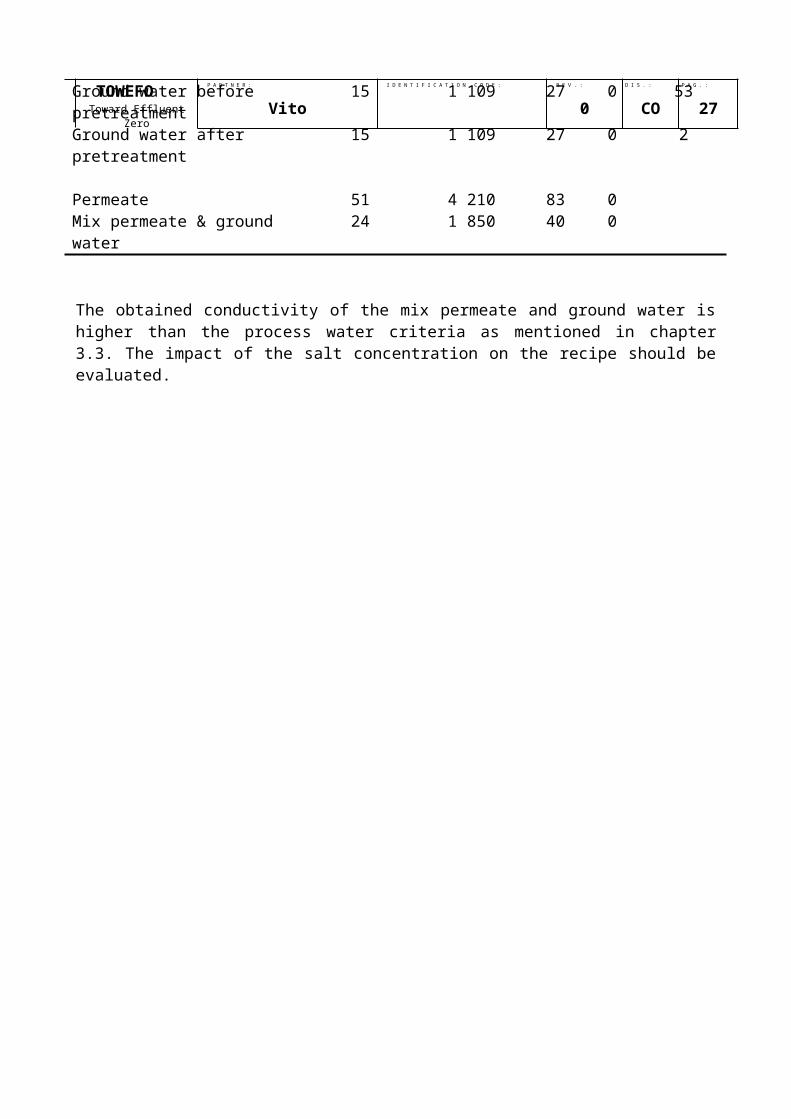
4.3.5 Changed contamination of process water & discharges
Table 12 summarizes the contamination of the process water for the initial and alternative scenario’s.
Table 12 : Process water quality B04
Stream Temperature Conductivity COD TSS Hardness°C µS /cm mg /l mg /l °F
Ground water before pretreatment 15 1 109 27 0 53Ground water after pretreatment 15 1 109 27 0 2
Permeate 51 4 210 83 0Mix permeate & ground water 24 1 850 40 0
The obtained conductivity of the mix permeate and ground water is higher than the process water criteria as mentioned in chapter 3.3. The impact of the salt concentration on the recipe should be evaluated.

TOWEFOToward Effluent Zero
P A R T N E R : I D E N T I F I C A T I O N C O D E : R E V . : D I S . : P A G . :
Vito 0 CO 17As the water consumption decreases, the contamination of the final effluent increases proportionally. These changes are illustrated in Table 13.
Table 13 : Changed effluent concentrations B04
Stream Conductivity COD TSSµs /cm mg /l mg /l
Effluent before treatment - initial 5 220 2 590Effluent after treatment - initial 5 220 699 30
Effluent before treatment - optimized 5 500 3 800Effluent after treatment - optimized 5 500 1 000 30
The concentration of TSS after an aerobic biological treatment will be around 30 ppm if no problems occur. Temperature will be within the range of 15 to 25°C.
It can be assumed that the COD concentration after the biological treatment will be lower than calculated at the same initial removal rate of the activated sludge. As the hydraulic load of the system will increase, the efficiency will probably increase. Tests however are required.
4.3.6 Economical evaluation
Using the economical evaluation done by ENEA for a combined UF/NF treatment on a reactive dyeing effluent it can be concluded that the costs for a regeneration technology on a process effluent of 97 700 m³ /yr is around € 0.69 /m³. This should be compared to the actual cost of groundwater plus the costs for the treatment of the ground water. In case of company B04 this equals € 0.05 /m³ ground water & € 0.32 for the combined de-ironing and softening or € 0.37 /m³ in total.

TOWEFOToward Effluent Zero
P A R T N E R : I D E N T I F I C A T I O N C O D E : R E V . : D I S . : P A G . :
Vito 0 CO 184.4 Company B05
4.4.1 Production
Table 14 illustrates some production values as can be found in the PIDACS.
Table 14 : Production values B05
Fiber Production
Natural fibers cotton and flax 50 %Mixed fibers cotton in combination with
polyester, polyamide, flax,wool or viscose
50 %
Total 6 300 000 kg/yr
All processes were screened for possible optimization.
4.4.2 Water balance
In production mainly ground water is used. The water consumption is 500 000 m³ /yr according to the PIDACS.
The ground water consumption as obtained in the WaterTracker® scheme is 242 353 m³ /yr. This value is based on what can be expected from the summation of the different process steps, but is significantly lower than the measured consumption. As a result, more than 50% of the water consumption cannot be determined correctly. Equipment washing explains often an important part of this consumption.
The detailed water balance can be found in Annex 1 and 2.
4.4.3 Selection of reusable process effluents & used test results
Refering to the membrane filtration trial PDD/UF/NF the removal efficiency of a combined UF/NF on Polyester disperse dyeing process effluents are as indicated in Table 15.
It was assumed that for a combined vat/disperse dyeing waste water similar removal efficiencies can be obtained as for a polyester disperse dyeing effluent.
Table 15 : Removal efficiency for disperse dyeing effluents
UF/NF RemovalOrganic fraction 53 %Conductivity 50 %TSS 99 %
In addition, it is assumed that for a combined ultra- and nano-filtration plant a recovery up to 80% should be achievable.

TOWEFOToward Effluent Zero
P A R T N E R : I D E N T I F I C A T I O N C O D E : R E V . : D I S . : P A G . :
Vito 0 CO 19Table 16 : Selection of reusable streams B05
CriterionCOD < 1 000 mg /lConductivity < 5 000 µS /cm
The limit for conductivity is different from the one given in the methodology. However, tests have proven that permeate from a combined UF/NF filtration on rinsing effluents from disperse dyeing processes can be reused in a similar process.
In addition, an anaerobic treatment is suggested as a decolourization step for the waste water coming from the reactive dyeing processes (in case of AZO-dyes). The possible removal efficiency of an anaerobic reactor on reactive dyeing waste water was tested by LeAF. Lab trials showed that a good decolourization and a COD removal of 30% is achievable. The conductivity is assumed to be unchanged. Temperature of the anaerobic effluent will be around 35°C and the TSS of a good working reactor should be around 200 mg /l.In order to add sufficient organic carbon to the process, those effluents with a high BOD/COD value from the bleaching line should be mixed with the reactive dyeing waste water before adding to the treatment.
4.4.4 Obtained water savings
Compared to the initial value of 242 353 m³ /yr, the obtained water consumption after optimization is 187 214 m³ /yr. This reduction equals 23%.
Details are given in Annex 2.
4.4.5 Changed contamination of process water & discharges
Table 17 summarizes the contamination of the process water for the initial and alternative scenario’s.
Table 17 : Process water quality B05
Stream Temperature Conductivity COD TSS°C µs /cm mg /l mg /l
Treated ground water 15 1 000 0 0
Permeate UF/NF 42 1 470 196 0Mix permeate and ground water 26 1 200 82 0

TOWEFOToward Effluent Zero
P A R T N E R : I D E N T I F I C A T I O N C O D E : R E V . : D I S . : P A G . :
Vito 0 CO 20It can be concluded that the obtained COD and conductivity concentration, after mixing the permeate with ground water are slightly higher than the general process water quality as indicated in chapter 3.3. However, tests have proven that permeate from a combined UF/NF filtration on rinsing effluents from disperse dyeing processes can be reused in a similar process.
As the water consumption in the dyeing department decreases, the contamination of its effluent increases. On the other hand, when an anaerobic reactor is implemented in the scheme on some specifice process effluents, the COD of the final effluent will be reduced again partly.
These changes are summarized in Table 18.
Table 18 : Changed effluent concentraion B05
Stream Temperature Conductivity COD TSS°C µs /cm mg /l mg /l
Initial effluent 63 4 530 2 029 27
Effluent after optimization 60 5 630 2 445 72
4.4.6 Economical evaluation
Using the economical evaluation done by ENEA for a combined UF/NF treatment on a disperse dyeing effluent it can be concluded that the costs for this specific regeneration technology on a process effluent of 65 478 m³ /yr is around € 0.7 /m³.This is comparable to the actual cost of ground water of € 0.75 /m³ (including treatment costs).
As a result, it is proven that in cases of high costs of ground water treatment the implementation of a membrane filtration technology can offer an achievable solution.

TOWEFOToward Effluent Zero
P A R T N E R : I D E N T I F I C A T I O N C O D E : R E V . : D I S . : P A G . :
Vito 0 CO 214.5 Company I04
4.5.1 Production
Table 19 illustrates some production values as can be found in the PIDACS.
Table 19 : Production values I04
Fiber Type Production
% on total
Bemberg Fabric 789 880 kg /yr 15.59 %Mix acetate Fabric 1 476 300 kg /yr 29.13 %Viscose Fabric 1 776 320 kg /yr 35.06 %
Total 5 067 160 kg /yr
The total company was screened for optimization.
4.5.2 Water balance
In production well water, as well as industrial water is used. The industrial water consumption equals 229 112 m³ /yr and the well water use equals 335 025 m³ /yr according to the PIDACS.
The well water consumption as obtained in the WaterTracker® scheme is 318 484 m³ /yr. This is slightly different from the water consumption as mentioned in the PIDACS. The reason for this difference is that the overall values are based on flow meters and the water scheme values on the summation of all the different processes taken into account. As a result the small water losses due to cleaning processes etc… are not counted.
The detailed water balance can be found in Annex 1 and 2.
4.5.3 Selection of reusable process effluents & used test results
The removal efficiency of a combined UF/NF on waste water coming from scouring processes is based on the membrane filtration trials PDS/UF/NF and PS/UF/NF. The used values are illustrated in Table 20.
Table 20 : Removal efficiencies on scouring effluents (weighted average)
UF/NF RemovalOrganic fraction 80 %Conductivity 80 %TSS 99 %
In addition, it is assumed that for a combined ultra- and nano-filtration plant a recovery up to 80% should be achievable.
Furthermore, the removal efficiency of a combined UF/NF on the mix of several dyeing process effluents was based on following list of membrane filtration tests:

TOWEFOToward Effluent Zero
P A R T N E R : I D E N T I F I C A T I O N C O D E : R E V . : D I S . : P A G . :
Vito 0 CO 22 Direct dyeing rinsing phase: VDDR/NF (viscose) Disperse dyeing: PDD/UF/NF (polyester) Reactive printed washing phase: VRPW/UF/NF
The obtained averages, based on these data are illustrated in Table 21.
Table 21 : Removal efficiencies on dyeing effluents (weighted average)
UF/NF RemovalOrganic fraction 44 %Conductivity 42 %TSS 99 %
For the pretreatment section the selection criteria are as indicated in Table 22.
Table 22 : Selection of reusable streams preparation I04
CriterionCOD < 1 000 mg /lConductivity < 1 000 µS /cmOther no doping phases
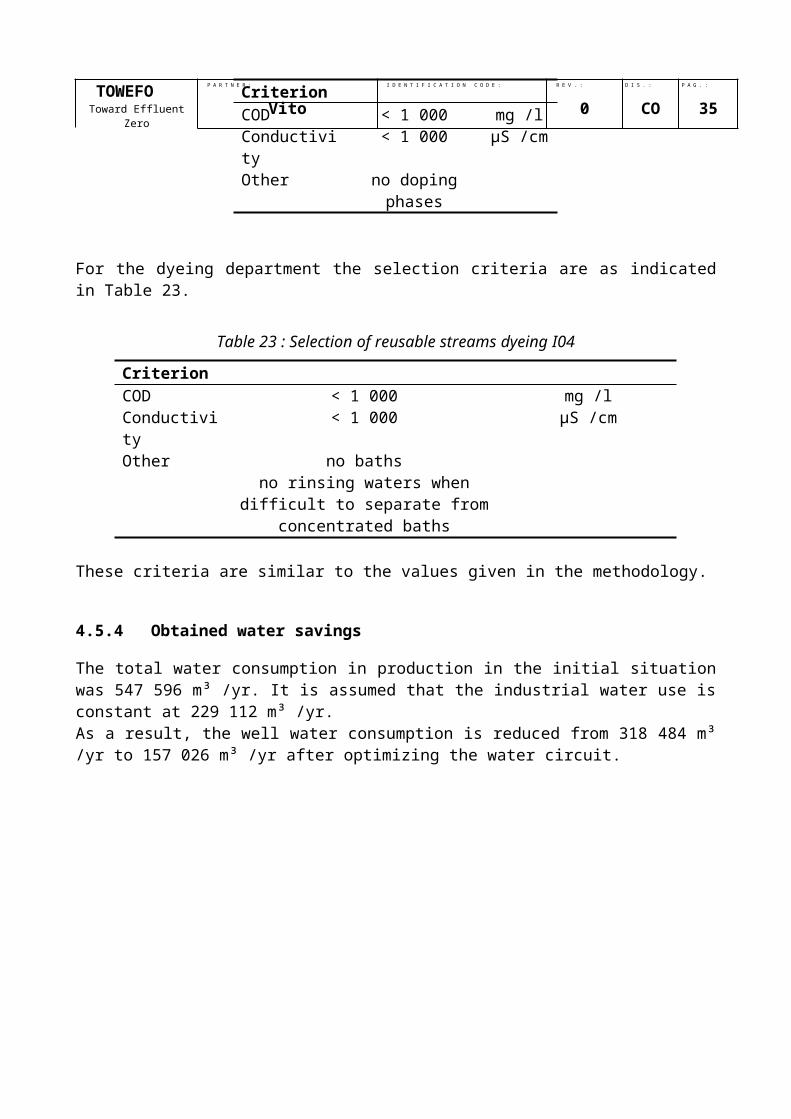
For the dyeing department the selection criteria are as indicated in Table 23.
Table 23 : Selection of reusable streams dyeing I04
CriterionCOD < 1 000 mg /lConductivity < 1 000 µS /cmOther no baths
no rinsing waters when difficult to separate from concentrated baths
These criteria are similar to the values given in the methodology.
4.5.4 Obtained water savings
The total water consumption in production in the initial situation was 547 596 m³ /yr. It is assumed that the industrial water use is constant at 229 112 m³ /yr. As a result, the well water consumption is reduced from 318 484 m³ /yr to 157 026 m³ /yr after optimizing the water circuit.

TOWEFOToward Effluent Zero
P A R T N E R : I D E N T I F I C A T I O N C O D E : R E V . : D I S . : P A G . :
Vito 0 CO 23These values correspond to a reduction of 50.7% for the well water and 29.4% for the total water consumption in production.
The flow towards the UF/NF unit in the preparation section equals 88 810 m³ /yr. In the dyeing department, the treated flow rate is slightly higher and equals 113 012 m³ /yr.
Details are given in Annex 2.
4.5.5 Changed contamination of process water & discharges
Table 24 summarizes the contamination of the process water for the initial and alternative scenario’s in the pretreatment department.
Table 24 : Process water quality in preparation section I04
Stream Temperature Conductivity COD TSS°C µs /cm mg /l mg /l
Process water (mix of well water industrial water and permeate of existing NF)
17 360 10 0
Permeate UF/NF 24 50 80 0Mix permeate & process water 20 230 40 0
In addition, Table 25 summarizes the contamination of the process water for the initial and alternative scenario’s in the dyeing department.
Table 25 : Process water quality in dyeing department I04
Stream Temperature Conductivity COD TSS°C µs /cm mg /l mg /l
Process water (mix of well water industrial water and permeate of existing NF)
17 360 10 0
Permeate UF/NF 24 160 155 0Mix permeate & process water 20 270 73 0
It can be concluded that COD of the mix of permeate & process water is slightly higher than the value of 60 mg /l as mentioned in the methodology. This could imply problems for reuse. As a result, specific reuse tests would be required.
As the water consumption decreases, the contamination of the final effluent increases proportionally.
These changes are illustrated in Table 26.

TOWEFOToward Effluent Zero
P A R T N E R : I D E N T I F I C A T I O N C O D E : R E V . : D I S . : P A G . :
Vito 0 CO 24Table 26 : Changed effluent concentration I04
Stream Temperature Conductivity COD TSS°C µs /cm mg /l mg /l
Initial effluent 24 410 855 34
Effluent after optimization 24 540 1 177 48
4.5.6 Economical evaluation
Using the economical evaluation done by ENEA for a combined UF/NF treatment on scouring waste water it can be concluded that the costs for this specific regeneration technology on a process effluent of 88 810 m³ /yr is € 0.70 /m³. This value is again a weighted average of the concerned trials as mentioned in chapter 4.5.3.
The economical data for a combined UF/NF treatment on the several dyeing process effluents as mentioned in chapter 4.5.3 lead to a weighted average of € 0.60 /m³.
Compared to the actual cost of well water of € 0.38 /m³ the UF/NF treatment cost is higher. However, as water prices will increase in the future and costs for membrane filtration units will drop, it can be expected that at a certain point the implementation of this technology will become more feasible.

TOWEFOToward Effluent Zero
P A R T N E R : I D E N T I F I C A T I O N C O D E : R E V . : D I S . : P A G . :
Vito 0 CO 254.6 Company I06
4.6.1 Production
Table 27 illustrates some production values as can be found in the PIDACS.
Table 27 : Production values I06
Fiber Type Production
% on total
Flax Fabric 25 800 kg /yr 5 %Polyester Fabric 154 800 kg /yr 30 %Cotton/Polyester Fabric 167 700 kg /yr 32.5 %Flax/Polyester Fabric 83 850 kg /yr 16.25 %Silk/Polyester Fabric 83 850 kg /yr 16.25 %
Total 516 000 kg /yr
The total company was screened for optimization.
4.6.2 Water balance
Industrial water is used for production. The water consumption equals 93 264 m³ /yr according to the PIDACS.
The industrial water consumption as obtained in the WaterTracker® scheme is 94 032 m³ /yr. This is just slightly different from the water consumption as mentioned in the PIDACS.
The detailed water balance can be found in Annex 1 and 2.
4.6.3 Selection of reusable process effluents & used test results
The removal efficiency of a combined UF/NF on a mixed waste water coming from scouring, double scouring, special scouring, desizing and bleaching processes is based on the membrane filtration trials PDS/UF/NF and PS/UF/NF. The used values are illustrated in Table 28.
Table 28 : Removal efficiencies on pretreatment effluents (weighted average)
UF/NF RemovalOrganic fraction 80 %Conductivity 80 %TSS 99 %
In addition, it is assumed that for a combined ultra- and nano-filtration plant a recovery up to 80% should be achievable.
Furthermore, the removal efficiency of a combined UF/NF on the mix of several dyeing process effluents was based on following list of membrane filtration tests:

TOWEFOToward Effluent Zero
P A R T N E R : I D E N T I F I C A T I O N C O D E : R E V . : D I S . : P A G . :
Vito 0 CO 26 Direct dyeing rinsing phase: VDDR/NF (viscose) Disperse dyeing: PDD/UF/NF (polyester) Reactive dyeing: CRD/UF/NF (cotton)
The obtained weighted averages, based on these data are illustrated in Table 29.
Table 29 : Removal efficiencies for dyeing effluents (weighted average)
UF/NF RemovalOrganic fraction 60 %Conductivity 40 %TSS 99 %
For the pretreatment section the selection criteria are as indicated in Table 30.
Table 30 : Selection of reusable streams preparation I06
CriterionCOD < 1 000 mg /lConductivity < 1 000 µS /cmOther no baths
For the dyeing department the selection criteria are as indicated in Table 31.
Table 31 : Selection of reusable streams dyeing I06
CriterionCOD < 1 000 mg /lConductivity < 1 000 µS /cmOther no baths
These criteria are similar to the values given in the methodology.
Furthermore, an anaerobic treatment is suggested as a decolourization step for the waste water coming from the reactive dyeing processes (in case of AZO-dyes). The possible removal efficiency of an anaerobic reactor on reactive dyeing waste water was tested by LeAF. Lab trials showed that a good decolourization and a COD removal of 30% is achievable. The conductivity is assumed to be unchanged. Temperature of the anaerobic effluent will be around 35°C and the TSS of a good working reactor should be around 200 mg /l.In order to add sufficient organic carbon to the process, high concentrated effluent from the desizing process can be mixed with the reactive dyeing waste water before adding to the anaerobic treatment.
TOWEFOToward Effluent Zero
P A R T N E R : I D E N T I F I C A T I O N C O D E : R E V . : D I S . : P A G . :
Vito 0 CO 274.6.4 Obtained water savings
The industrial water consumption of the initial configuration was 94 032 m³ /yr.
Using the above selection criteria and removal efficiencies of the implemented membrane filtration technologies, the water consumption of the overall company could be reduced to 80 456 m³ /yr. This reduction equals 14.4% in total.
The water reductions for the pretreatment and dyeing department separately are respectively 27.4% and 14.3%.
Details are given in Annex 2.
4.6.5 Changed contamination of process water & discharges
Table 32 summarizes the contamination of the process water for the initial and alternative scenario’s in the pretreatment department.
Table 32 : Process water quality in preparation section I06
Stream Temperature Conductivity COD TSS°C µs /cm mg /l mg /l
Process water (industrial water) 18 190 4 0
Permeate UF/NF 26 40 81 0Mix permeate & process water 25 70 68 0
It can be concluded that the COD of the obtained water quality, after mixing the industrial water with permeate, is slightly higher than the values mentioned in the methodology. However, tests have proven that the reuse of permeate of a combined UF/NF on scouring and bleaching process effluents in similar processes is achievable.
In addition, Table 33 summarizes the contamination of the process water for the initial and alternative scenario’s in the dyeing department.
Table 33 : Process water quality in dyeing department I06
Stream Temperature Conductivity COD TSS°C µs /cm mg /l mg /l
Process water (industrial water) 18 190 4 0
Permeate UF/NF 31 210 125 0Mix permeate & process water 23 200 52 0

TOWEFOToward Effluent Zero
P A R T N E R : I D E N T I F I C A T I O N C O D E : R E V . : D I S . : P A G . :
Vito 0 CO 28As the water consumption decreases, the contamination of the final effluent increases. On the other hand, when an anaerobic reactor is implemented in the scheme on some specifice process effluents, the COD of the final effluent will be reduced.
These changes are illustrated in Table 34.
Table 34 : Changed effluent concentration I06
Stream Temperature Conductivity COD TSS°C µs /cm mg /l mg /l
Initial effluent 34 1 170 1 116 25
Effluent after optimization 35 1 370 1 192 44
4.6.6 Economical evaluation
Using the economical evaluation done by ENEA for a combined UF/NF treatment on the mixed waste water coming from scouring, double scouring, special scouring, desizing and bleaching processes, it can be concluded that the costs for this specific regeneration technology on a small flow rate of 12 345 m³ /yr is larger than € 1 /m³.
The economical data for a combined UF/NF treatment on the several dyeing process effluents as mentioned in chapter 4.6.3 lead as well to a cost higher than € 1 /m³. This is as well due to the very small flow rate towards the filtration plant (4 624 m³ /yr).
Compared to the actual cost of industrial water of more or less € 0.3 /m³ (water + treatment cost) the UF/NF treatment cost is high. Refering to the economical data it can be concluded from the curves that membrane filtration plants on waste water flows below 50 000 m³ /yr are at this point not achievable.

TOWEFOToward Effluent Zero
P A R T N E R : I D E N T I F I C A T I O N C O D E : R E V . : D I S . : P A G . :
Vito 0 CO 294.7 Company I09
4.7.1 Production
Table 35 illustrates some production values as can be found in the PIDACS.
Table 35 : Production values I09
Fiber Type Production
% on total
Silk yarn 750 792 kg /yr 69.5 %fabric 260 519 kg /yr 24 %
Total 1 079 773 kg /yr
The pretreatment department, as well as the dyeing section were screened for optimization.
4.7.2 Water balance
Industrial water is used for production. The water consumption equals 291 568 m³ /yr according to the PIDACS.
This industrial water is first filtered. Water quality W6 is obtained. Part of the filtered water is softened and disinfected (quality W4). Another fraction of the filtered water is send over a heat exchanger in order to increase temperature from 11 to 25°C (quality W5).
The yearly consumption of water in the production for W4, W5 and W6 are respectively 47 939 m³ /yr, 101 741 m³ /yr and 51 664 m³ /yr.
The detailed water balance can be found in Annex 1 and 2.
4.7.3 Selection of reusable process effluents & used test results
The removal efficiency of a combined UF/NF on a mixed waste water coming from scouring processes is based on the membrane filtration trials PDS/UF/NF and PS/UF/NF. The used values are illustrated in Table 36.
Table 36 : Removal efficiencies on pretreatment effluents (weighted average)
UF/NF RemovalOrganic fraction 80 %Conductivity 80 %TSS 99 %
In addition, it is assumed that for a combined ultra- and nano-filtration plant a recovery up to 80% should be achievable.
Furthermore, the removal efficiency of a nano-filtration on a mixed dyeing waste water, consisting mainly out of acid dyeing process effluent is based on the membrane filtration trial SADR/NF.

TOWEFOToward Effluent Zero
P A R T N E R : I D E N T I F I C A T I O N C O D E : R E V . : D I S . : P A G . :
Vito 0 CO 30The removal ratios are illustrated in Table 37.
Table 37 : Removal efficiencies on viscose acid dyeing effluents
UF/NF RemovalOrganic fraction 34 %Conductivity 45 %TSS 99 %
For the pretreatment section the selection criteria are as indicated in Table 38.
Table 38 : Selection of reusable streams preparation I09
CriterionCOD < 1 000 mg /lConductivity < 1 000 µS /cmOther no baths
For the dyeing department the selection criteria are as indicated in Table 39.
Table 39 : Selection of reusable streams dyeing I09
CriterionCOD < 1 000 mg /lConductivity < 1 000 µS /cmOther no baths
These criteria are similar to the values given in the methodology.
4.7.4 Obtained water savings
Using the above selection criteria and removal efficiencies of the implemented membrane filtration technologies, the consumption of W5 water can be reduced from 101 741 m³ /yr to 52 365 m³ /yr.
The W5 water reductions for the pretreatment and dyeing department separately are respectively 36% and 87%. The total water reductions for the pretreatment and dyeing department separately are respectively 24% and 32%.
Details are given in Annex 2.

TOWEFOToward Effluent Zero
P A R T N E R : I D E N T I F I C A T I O N C O D E : R E V . : D I S . : P A G . :
Vito 0 CO 314.7.5 Changed contamination of process water & discharges
Table 40 summarizes the contamination of the process water for the initial and alternative scenario’s in the pretreatment department.
Table 40 : Process water quality in preparation section I09
Stream Temperature Conductivity COD TSS°C µs /cm mg /l mg /l
Process water (quality W5) 25 190 4 0
Permeate UF/NF 22.5 40 34 0Mix permeate & process water 24 140 15 0
The obtained water quality after mixing is good. Temperature of the permeate is comparable to the temperature of the ‘warm’ process water.
In addition, Table 41 summarizes the contamination of the process water for the initial and alternative scenario’s in the dyeing department.
Table 41 : Process water quality in dyeing department I09
Stream Temperature Conductivity COD TSS°C µs /cm mg /l mg /l
Process water (industrial water) 25 190 4 0
Permeate UF/NF 21 150 81 0Mix permeate & process water 21.5 160 71 0
The temperature of the permeate and the process water is comparable.The COD of the mixed stream is slightly higher than the limit as mentioned in the methodology.
As the water consumption decreases, the contamination of the final effluent increases. Due to the fact that the pretreatment and dyeing department have been evaluated separately, the changed concentration of the overall final effluent was not calculated.
4.7.6 Economical evaluation
The costs of the combined UF/NF installation on the scouring waste water in the pretreatment department were calculated. Due to the fact that only a small flow of 26 588 m³ /yr is recycled the costs will be around € 1 /m³.
The economical data for a NF treatment on the acid dyeing process effluent on the other hand lead to a cost of € 0.9 /m³. This is as well due to the very small flow rate towards the filtration plant (35 132 m³ /yr).

TOWEFOToward Effluent Zero
P A R T N E R : I D E N T I F I C A T I O N C O D E : R E V . : D I S . : P A G . :
Vito 0 CO 32Compared to the actual cost of process water quality W5 of € 0.39 /m³ (€ 0.29 water + € 0.1 treatment cost) the filtration treatment cost is still high. In reference to the economical data it can be concluded from the curves that membrane filtration plants on waste water flows below 50 000 m³ /yr are at this point not achievable.
Increasing costs for water and decreasing costs for implementation of filtration technology should stimulate the market in the near future.

TOWEFOToward Effluent Zero
P A R T N E R : I D E N T I F I C A T I O N C O D E : R E V . : D I S . : P A G . :
Vito 0 CO 334.8 Company I15
4.8.1 Production
Table 42 illustrates some production values as can be found in the PIDACS.
Table 42 : Production values I15
Fiber Type Production
% on total
Silk Fabric 1 645 132 kg /yr 58.73 %Polyester Fabric 404 466 kg /yr 14.44 %Synthetic Fabric 482 764 kg /yr 17.24 %Natural Fabric 268 680 kg /yr 9.59 %
Total 2 801 041 kg /yr
The following departments were screened for optimization: Preparation, Dyeing, Printing and Washing section.
4.8.2 Water balance
The water used in production is a mixture of industrial and well water (water quality W3). The total water consumption for industrial and well water is respectively 351 380 m³ /yr and 224 004 m³ /yr according to the PIDACS. Part of this water is softened before using it in production (quality W4).
According to the WaterTracker® schemes the consumption of W3 and W4 in production is respectively 398 620 m³ /yr and 275 964 m³ /yr. These values are higher than the summation of industrial and well water, due to the fact that process effluents are already recycled over an existing nano-filtration unit.
The detailed water balance can be found in Annex 1 and 2.
4.8.3 Selection of reusable process effluents & used test results
The removal efficiency of a combined UF/NF on a mixed waste water coming from scouring processes is based on the membrane filtration trials PDS/UF/NF and PS/UF/NF. The used values are illustrated in Table 43.
Table 43 : Removal efficiencies on scouring effluents (weighted average)
UF/NF RemovalOrganic fraction 80 %Conductivity 80 %TSS 99 %
It was assumed that for a combined ultra- and nano-filtration plant a recovery up to 80% should be achievable.

TOWEFOToward Effluent Zero
P A R T N E R : I D E N T I F I C A T I O N C O D E : R E V . : D I S . : P A G . :
Vito 0 CO 34Furthermore, the removal efficiency of a combined UF/NF on the mix of several dyeing process effluents was based on following list of membrane filtration tests: Acid dyeing silk: SADR/NF (silk) Disperse dyeing: PDD/UF/NF (polyester) Reactive dyeing: SYRD (silk)
The removal ratios are illustrated in Table 44.
Table 44 : Removal efficiencies on mix of dyeing effluents (weighted average)
UF/NF RemovalOrganic fraction 45 %Conductivity 42 %TSS 99 %
In addition, it was assumed that for the selected waste waters from the printing department a removal efficiency as illustrated in Table 45 can be achieved by implementing a membrane filtration plant.
Table 45 : Removal efficiencies printing effluents (assumption)
UF/NF RemovalOrganic fraction 45 %Conductivity 42 %TSS 99 %
For the washing department the data from the membrane filtration trial PDP/UF/NF was used, as only the disperse printed washing was taken into account.Table 46 illustrates the removal ratios.
Table 46 : Removal efficiencies disperse printed washing
UF/NF RemovalOrganic fraction 95 %Conductivity 58 %TSS 99 %
TOWEFOToward Effluent Zero
P A R T N E R : I D E N T I F I C A T I O N C O D E : R E V . : D I S . : P A G . :
Vito 0 CO 35For all the different sections the selection criteria for reusable streams are as indicated in Table 47.
Table 47 : Selection of reusable streams preparation I09
CriterionCOD < 1 000 mg /lConductivity < 1 000 µS /cmOther no baths
These criteria are similar to the values given in the methodology.
4.8.4 Obtained water savings
Using the above selection criteria and removal efficiencies of the implemented membrane filtration technologies, the consumption of W3 water can be reduced from 398 620 m³ /yr to 275 964 m³ /yr. For the softened water, the consumption is reduced from 113 410 to 43 815 m³ /yr.
As a result, the overall reduction equals 192 251 m³ /yr or 37.8% of water consumption in production.
The water saving for the different screened units (pretreatment, dyeing, printing and washing) are respectively 69%, 36%, 30% and 42%.
Details are given in Annex 2.
4.8.5 Changed contamination of process water & discharges
Table 48 summarizes the contamination of the process water for the initial and alternative scenario’s in the pretreatment department.
Table 48 : Process water quality in preparation section I15
Stream Temperature Conductivity COD TSS°C µs /cm mg /l mg /l
Process water (quality W4) 18 40 10 0
Permeate UF/NF 33 50 56 0Mix permeate & process water 28 50 42 0
The mixing of permeate with process water implies a slight increase of temperature.

TOWEFOToward Effluent Zero
P A R T N E R : I D E N T I F I C A T I O N C O D E : R E V . : D I S . : P A G . :
Vito 0 CO 36Table 49 summarizes the contamination of the process water for the initial and alternative scenario’s in the dyeing department.
Table 49 : Process water quality in dyeing unit I15
Stream Temperature Conductivity COD TSS°C µs /cm mg /l mg /l
Process water (quality W4) 18 40 10 0
Permeate UF/NF 21 210 76 0Mix permeate & process water 19.5 130 44 0
The obtained water quality is good when compared to the criteria given in the methodology.
Table 50 summarizes the contamination of the process water for the initial and alternative scenario’s in the printing department.
Table 50 : Process water quality in printing section I15
Stream Temperature Conductivity COD TSS°C µs /cm mg /l mg /l
Process water (quality W3) 16 400 10 0
Permeate UF/NF 20 470 75 0Mix permeate & process water 17 420 30 0
The obtained water quality is good when compared to the criteria given in the methodology.
Table 51 summarizes the contamination of the process water for the initial and alternative scenario’s in the washing department.
Table 51 : Process water quality in washing department I15
Stream Temperature Conductivity COD TSS°C µs /cm mg /l mg /l
Process water (quality W3) 16 400 10 0
Permeate UF/NF 43 140 11 0Mix permeate & process water 38 190 11 0
The obtained water quality is good when compared to the criteria given in the methodology.

TOWEFOToward Effluent Zero
P A R T N E R : I D E N T I F I C A T I O N C O D E : R E V . : D I S . : P A G . :
Vito 0 CO 37As the water consumption decreases, the contamination of the final effluent increases.
These changes are illustrated in Table 52.
Table 52 : Changed effluent concentration I15
Stream Temperature Conductivity COD TSS°C µs /cm mg /l mg /l
Initial effluent production 24 1 410 727 84
Effluent after optimization 23 2 070 1 136 134
4.8.6 Economical evaluation
Table 53 gives an overview of the economical evaluation of I15.
Table 53 : Economical evaluation I15
Department Process water TreatmentQuality Saving Cost
m³ /yr € /m³ € /m³Pretreatment W4 61 583 ± 0.4 0.7Dyeing W4 8 011 ± 0.4 > 1Printing W3 115 729 ± 0.3 -Washing W3 6 926 ± 0.3 > 1
Based on this overview it can be concluded that the treatment costs are still higher than the costs of actual used process water. The higher the flow rate the lower the cost will be per m³ of treated water.

TOWEFOToward Effluent Zero
P A R T N E R : I D E N T I F I C A T I O N C O D E : R E V . : D I S . : P A G . :
Vito 0 CO 385 GENERAL CONCLUSIONS
Some important results obtained during this study are summarized again in Table 54.
Table 54 : Overview obtained results
Company Department Water saving CostsFresh water (+ treatment) UF/NF treatment
% € /m³ € /m³B01 polyester 36 0.12 1.2
B04 dyeing 24 0.37 0.69
B05 pretreatment 0dyeing 42 0.75 0.70total 23
I04 pretreatment 33 0.38 0.70dyeing 29 0.38 0.60total 29
I06 pretreatment 27 0.30 > 1.00dyeing 14 0.30 > 1.00total 14
I09 pretreatment 24 0.39 > 1.00dyeing 32 0.39 0.90
I15 pretreatment 69 0.40 0.70dyeing 36 0.40 > 1.00printing 30 0.30 -washing 42 0.30 > 1.00
It can be concluded that within a pretreatment department water savings from 30 to 70% can be obtained by implementation of a regeneration technology. In dyeing sections, the savings will be within the range of 15 to 40%. For the overall companies this would mean a reduction in water consumption between 15 and 30%. And as a result, the contamination of the final effluent will increase proportionally.
The costs for implementation of membrane filtration units are still high (> € 0.60 /m³) when compared to the actual low costs of industrial or ground water (€ 0.10 – 0.20 /m³). Only when the use of this water requires an extensive, and therefore expensive pretreatment, implementation of a regeneration technology will be economically feasible.

TOWEFOToward Effluent Zero
P A R T N E R : I D E N T I F I C A T I O N C O D E : R E V . : D I S . : P A G . :
Vito 0 CO 39The difference between the costs for the regeneration plant and the actual used fresh water however is further reduced as there is an additional cost saving, due to the fact that less waste water will have to be treated in the end-of-pipe treatment.
In addition, it can be expected that in the near future costs of the actual used industrial or ground water will increase, permits on pumping ground water will become more stringent and prices for membrane filtration will drop, due to the increasing production of this technology.

TOWEFOToward Effluent Zero
P A R T N E R : I D E N T I F I C A T I O N C O D E : R E V . : D I S . : P A G . :
Vito 0 CO 40Annex 1: Excell data sheets of all companies

TOWEFOToward Effluent Zero
P A R T N E R : I D E N T I F I C A T I O N C O D E : R E V . : D I S . : P A G . :
Vito 0 CO 41Annex 2: WaterTracker® schemes of all companies