€¦ · web viewhomework booklet. life on earth. 1. ... to describe the effect on greenfly and...
TRANSCRIPT

National 5 Biology
Homework Booklet
Life on Earth
1. The table below shows some of the feeding relationships in the marine ecosystem.

a. Using this information, copy and complete the food web below. (2)
b. What two terms can be used to describe the blenny in this food web?
(2)c. Dinoflagellates are producers. What is meant by the term producer?
(1)d. Using all the available information, describe the niche of Euphausids.
(3)e. A pod of dolphins arrived in this ecosystem. Dolphins feed on snappers. Explain the effect that the dolphins will have on the euphasid population.
(2)f. What is the definition of an ecosystem?
(1)

2. A student set up 5 petri dishes to investigate competition in cress seed germination. Each dish contained a thin layer of cotton wool soaked in water and a different number of cress seeds spread evenly across the cotton wool. The results were;
a. Use graph paper to construct a line graph of number of seeds sown against percentage of seedlings surviving after 5 days. (3)b. Name the variable altered in this investigation.
(1)c. What conclusion can be made based on the results.
(1)d. What type of competition occurred?
(1)e. Other than water, name one thing the seedlings would compete for.
(1)f. Name two factors that would need to be kept constant in this investigation.
(2)g. Calculate the simplest whole number ratio of the percentage of seedlings surviving in dish A compared to dish E.
(1)h. In another dish, 160 seeds were sown and 88 seedlings survived after 5 days. Calculate the percentage survival.
(1)

3. The diagram below shows part of a woodland food web from Scotland.
a. Use the terms increase, decrease, or stay the same to describe the effect on greenfly and stoat populations if all the mice were killed by a disease. Give reasons for your answers.
(2)b. What organisms in the food web are the primary consumers?
(1)c. What organisms in the food web are in direct competition?
(1)d. Three foxes were observed fighting over a dead weasel. What is this an example of?
(1)

4. In an investigation into the distribution of heather plants, 6 quadrats were placed in a line from the top to the bottom of a hill. Soil moisture, pH, surface light intensity, and heather abundance score were recorded for each quadrat.
a. Describe how the heather abundance scores would have been obtained using the quadrat.
(2)b. Describe the distribution of the heather on the hill slope.
(1)c. On graph paper plot a line graph of percentage soil moisture versus heather abundance score.
(3)d. What aspect of the investigation makes the data unreliable?
(1)e. Choose one of the abiotic factors from the table and fully describe how it is measured.
(2)

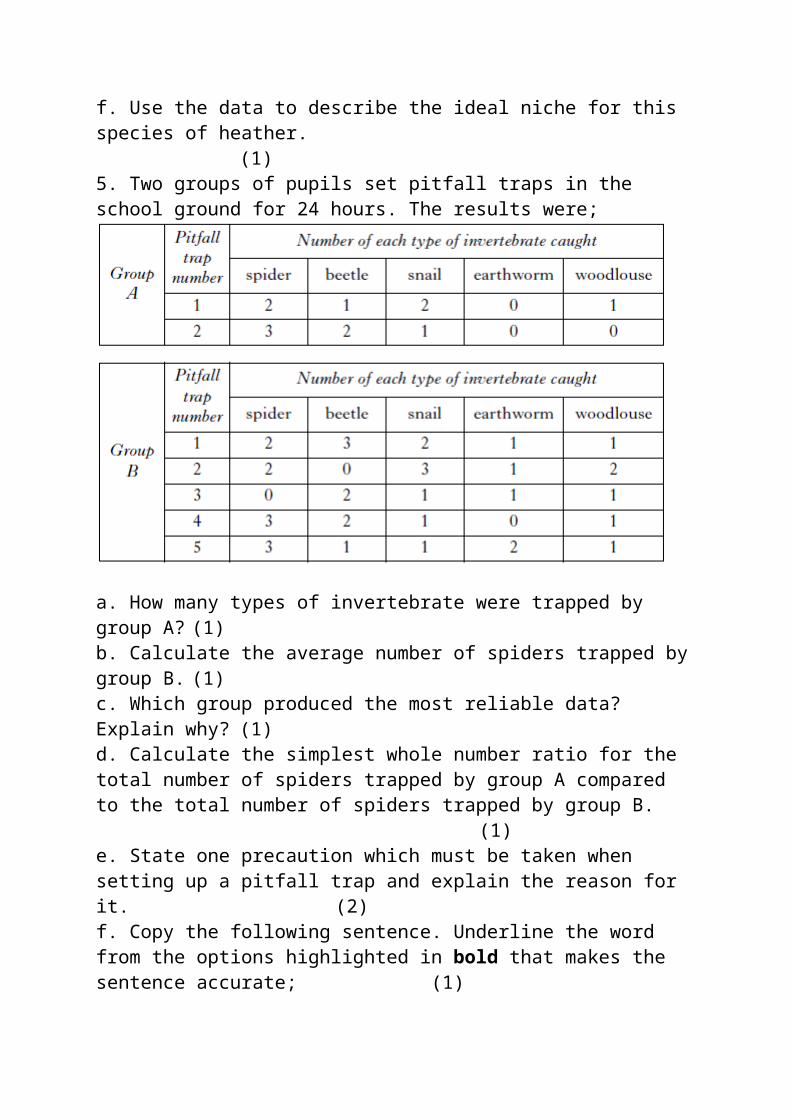
f. Use the data to describe the ideal niche for this species of heather.
(1)5. Two groups of pupils set pitfall traps in the school ground for 24 hours. The results were;
a. How many types of invertebrate were trapped by group A?(1)
b. Calculate the average number of spiders trapped by group B.(1)
c. Which group produced the most reliable data? Explain why?(1)
d. Calculate the simplest whole number ratio for the total number of spiders trapped by group A compared to the total number of spiders trapped by group B.
(1)e. State one precaution which must be taken when setting up a pitfall trap and explain the reason for it.
(2)f. Copy the following sentence. Underline the word from the options highlighted in bold that makes the sentence accurate;
(1)
All of the invertebrates found in the pitfall traps form a community/population. The place where the community/population of snails live is called the ecosystem/habitat.
6. The key gives information about water plants growing in a pond.
a. What plant grows submerged in deep water?(1)
b. Water hyacinth and lotus both have round leaves. What feature would allow you to tell them apart?
(1)c. Give three features the water lily and lotus have in common.
(2)

7. The graph below shows the changes in the rabbit population of Australia since they were introduced by European settlers.
a. Fully describe the population changes between times A and E. (2)b. Give a reason for the population changes observed between times;(i) B and C; (ii) D and E.
(2)c. At which stage(s) on the graph would grazing by the rabbits result in; (i) an increase; (ii) a decrease in the overall number of plant species?
(2)
To prevent overgrazing by rabbits, the deadly disease myxomatosis (which only affects rabbits) was introduced.
d. What sort of ‘factor’ is disease?(1)
e. Eastern wallabies (herbivores) and dingoes (carnivorous dogs) share their habitat with rabbits. Explain the effect of myxomatosis on the wallaby and dingo populations.
(2)

8. A sample of polluted water from a river was collected. Bacteria from the sample responded to laboratory tests as follows;
a. Use the key to identify the bacteria P, Q, R, and S.(1)
b. Use all the information available to describe Escherichia.(1)
c. In a further test, a sample of this polluted river water was mixed with methylene blue dye. After 2 days the dye changed from blue to colourless indicating a lack of oxygen. Name one indicator species that would be absent from this part of the river and one indicator species that would be present.
(2)

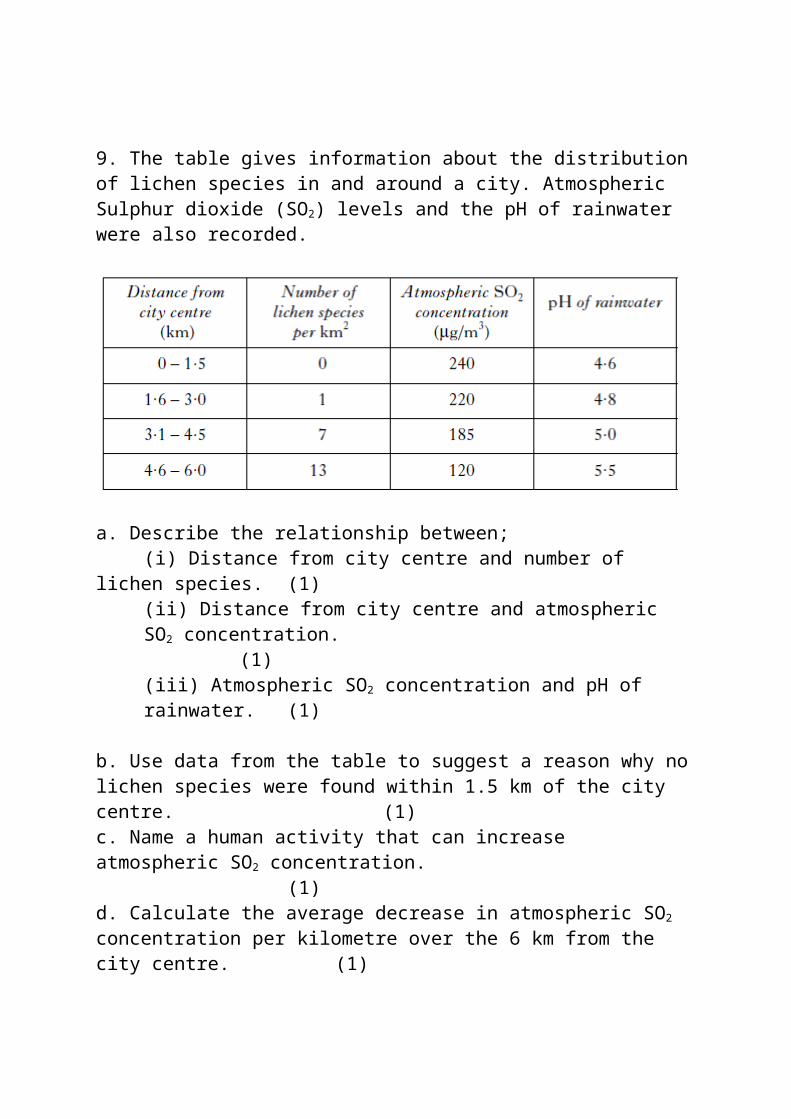
9. The table gives information about the distribution of lichen species in and around a city. Atmospheric Sulphur dioxide (SO2) levels and the pH of rainwater were also recorded.
a. Describe the relationship between;(i) Distance from city centre and number of lichen species.(1)(ii) Distance from city centre and atmospheric SO2 concentration.
(1)(iii) Atmospheric SO2 concentration and pH of rainwater.
(1)
b. Use data from the table to suggest a reason why no lichen species were found within 1.5 km of the city centre.
(1)c. Name a human activity that can increase atmospheric SO2 concentration.
(1)d. Calculate the average decrease in atmospheric SO2 concentration per kilometre over the 6 km from the city centre.
(1)e. Could lichen species be used to monitor air quality? Justify your answer.
(1)

10. The rate of photosynthesis can be affected by several factors. a. Copy the sentence below with the correct words to explain the term limiting factor.
(1)
b. The following graph shows the effect of increasing carbon dioxide concentration on the rate of photosynthesis at two different temperatures. All other factors were kept constant.
From the evidence in the graph, what are the limiting factors at points X and Y?
(1)
10 c) Some carbon compounds found in plants are listed below.
carbon dioxidecelluloseglucosestarch
Copy and complete the table with the correct carbon compound for each of the functions.
(2)
11. a) Describe two changes to the environmental conditions in a greenhouse which could increase the rate of photosynthesis.
(2)
b) Copy and complete the diagram below to show how the carbohydrate product of photosynthesis is used in a plant.

(2)12. A crop of tomatoes was grown in a polytunnel.
Which of the following changes would not produce an earlier crop of tomatoes?
A Increasing the heating during the day.B Increasing the CO2 concentration at night.C Increasing the light intensity at night.D Increasing the CO2 concentration during the day.(1)
13.The diagram below shows the green water plant Elodea used in an experiment to investigate photosynthesis.
Describe how the requirements for photosynthesis shown in the diagram are used in the LIGHT REACTIONS and CARBON FIXATION to produce oxygen and glucose.
(5)14.

a. The sentences below give some information about photosynthesis. Copy them out with a word to make each sentence correct.
(2)
(2)
b. Copy the table below.Decide if each of the following statements about photosynthesis is True Or False, and tick the appropriate box.If the statement is False, write the correct word(s) in the Correction box to replace the word(s) underlined in the statement.
(3)
15. The food web below is from the Antarctic ecosystem.

a. Explain why a reduction in Sperm whale numbers could lead to an increase in the number of seals.
(2)b. Name three ways in which energy can be lost as it passes from the fish to the Penguins.
(2)c. Only 10% of the energy available passes from one organism to the organism eating it, e.g., krill are eaten by squid. If plant plankton has 5000 units of energy what is;(i) the maximum units of energy that could be gained by seals;(ii) the minimum units of energy that could be gained by seals? (2)d. Copy and complete the table below by ticking true or false for each statement. If you opt for false you must correct the underlined part of the statement.
(3)
Statement True False CorrectionIn this food web, krill are herbivores.
The population of sperm whales has the greatest energy.The range of species in a population is called biodiversity
16. The diagram below shows part of a woodland food web from Scotland.

e. In May of one year, Scotland experienced hurricane force winds for 2 days. Fully describe the impact of this event on the food web above.
(3)
The food chain below is taken from the web above. Only 10% of available energy is passed from one organism to the next.
Leaf litter Woodlice Weasels
f. Woodlice contain 273 units of energy. How many units of energy will (i) leaf litter; and (ii) weasels contain?
(2)
Weasels were found to have hundreds of fleas in their fur.
g. Using this new information and the food chain, draw the likely appearance of the pyramid of numbers and the pyramid of energy.
(2)
17. Farming of single crop species occurs on a massive scale in the USA. The impacts of insect pests and disease on the yields of three different crop species for one year are presented below.

a. Why does this type of farming require large quantities of artificial fertiliser?
(1)b. Explain why this type of farming is required.
(1)c. Calculate the simplest whole number ration of total losses for corn versus total losses for Rye.
(1)d. If no pests or disease are present the total yield of wheat would be 2 million tonnes. Calculate the actual yield for this year. (1)e. Suggest why the use of pesticides to kill insects needs to be monitored very closely.
(1)f. Name, and give an example of, an alternative way to reduce the effect of pest species.
(2)

18. The table below gives details of the effects of adding nitrogen on the yield of two crop species grown in the English county of Norfolk.
Crop & Treatment Crop yield (tonnes)Barley with nothing added to
soil40
Barley with nitrogen added to soil
56
Peas with nothing added to soil 50Peas with nitrogen added to
soil54
a. Calculate the percentage increase in yield for each crop when nitrogen is added to soil.
(2)b. What process that occurs in cells could not take place if nitrogen was not available?
(1)c. Where and how do plants obtain nitrogen?
(2)d. How do animals obtain the nitrogen they need?
(1)e. Fertilisers are a source of added nitrogen. State one advantage and one disadvantage of; (i) a natural fertiliser; and (ii) an artificial fertiliser.
(2)
The Norfolk broads are waterways that attract much wildlife and many tourists to the area. Boat users must observe a strict 5 miles per hour speed limit
f. Describe the problems that could occur in the Norfolk broads if;(i) Farmers applied too much fertiliser to their fields and any excess was able to leach into the waterways.
(3)(ii) Boat users kept breaking the speed limit.
(2)

19. Swans and cygnets (young swans) live on the River Ayr. Foxes in the area kill and eat swans.
a. Copy and complete the following statement by deleting one of the options highlighted in bold.
Cygnets are the predators/prey of foxes. The foxes are primary/secondary consumers.
(1)
b. Of 50 cygnets born in the year 2009, 22 survived to adulthood in the year 2010. Calculate the percentage survival rate. (1)
Lead from weights used by anglers was found to be poisoning plants and animals in the River Ayr. Some swans and cygnets died as a result of this.
c. What is the likely effect of lead on the fox population? Explain your answer.
(2)d. State another type of human activity that could affect biodiversity in this river ecosystem.
(1)

20. In African grasslands, Impala, Giraffe, and Zebra are all species that graze on Acacia trees. Impala and Zebra also graze on grasses.
a. What is the definition of a species?(1)
b. The diversity of plant species on the grassland is normally higher when the grazers are present. Explain why?
(1)c. How is competition for food reduced between Giraffe and the other two grazers?
(1)d. What word is used to describe this type of competition?
(1)e. Acacia trees have adapted to grazing by growing sharp thorns on their branches. Suggest an adaptation of Giraffes that allows them to eat acacia leaves.
(1)f. The acacia trees can also tolerate long periods of drought. Describe one possible adaptation that allows this.
(1)g. Describe the impact that a two year period without rainfall (drought) would have on all the organisms above?
(2)
Giraffe are thought to have evolved from a ‘short necked’ ancestor as a result of random changes in their DNA and the process of natural selection.
h. What are these changes in DNA known as?(1)
i. Describe how natural selection led to ‘long necked’ Giraffes.(2)

21. It is thought that Darwin’s finches found on the Galapagos Islands (see below) evolved from one type of ancestral finch.
a. What two pieces of evidence from the diagram indicate that speciation has occurred?
(2)b. What biotic factor is likely to have been the biggest influence in the evolution of these finches?
(1)c. What term describes the role that each finch plays within its community?
(1)d. The diversity of Darwin’s finches is under threat from human activity. Name two such activities.
(1)
