Година xvii, Брой КОМПЮТЪРНИ НАУКИ...
TRANSCRIPT

Компютърни науки и технологии 1 2019 Computer Science and Technologies 1
ТЕХНИЧЕСКИ УНИВЕРСИТЕТ - ВАРНА TECHNICAL UNIVERSITY OF VARNA
Година XVII, Брой 1/2019
КОМПЮТЪРНИ НАУКИ
И ТЕХНОЛОГИИ
Bulgaria Communications Chapter
Faculty of Computing & Automation
COMPUTER SCIENCE AND
TECHNOLOGIES
Year XVII, Number 1/2019
International Conference „Applied Computer Technologies”
ACT 2019
19 - 21 September, 2019, Varna, Bulgaria

Компютърни науки и технологии 1 2019 Computer Science and Technologies 2
Компютърни науки и
технологии
Издание
на Факултета по изчислителна техника и
автоматизация
Технически университет - Варна
Редактор: доц. д-р Ю. Петкова
Гл. редактор: доц. д-р Н. Николов
Редакционна колегия:
проф. д.н. Л. Личев (Острава)
проф. д.н. М. Илиев (Русе)
проф. д-р М. Лазарова (София)
проф. д-р Г. Спасов (Пловдив)
доц. д-р П. Антонов (Варна)
доц. д-р Р. Вробел (Вроцлав)
доц. д-р Т. Ганчев (Варна)
доц. д-р Н. Атанасов (Варна)
доц. д-р М. Маринов, (Русе)
Печат: ТУ-Варна
За контакти:
Технически университет - Варна
ФИТА
ул. „Студентска‖ 1, 9010 Варна,
България
тел./факс: (052) 383 320
e-mail: [email protected]
ISSN 1312-3335
Computer Science and
Technologies
Publication
of Computing and Automation Faculty
Technical University of Varna
Editor: Assoc. Prof. Y. Petkova, PhD
Chief Editor: Assoc. Prof. N. Nikolov, PhD
Editorial Board:
Prof. L. Lichev, DSc (Ostrava)
Prof. M. Iliev, DSc (Ruse)
Prof. M. Lazarova, PhD (Sofia)
Prof. G. Spasov, PhD (Plovdiv)
Assoc. Prof. P. Antonov, PhD (Varna)
Assoc. Prof. R. Wrobel (Wroclaw)
Assoc. Prof. T. Ganchev, PhD (Varna)
Assoc. Prof. N. Atanasov, PhD (Varna)
Assoc. Prof. M. Marinov, PhD (Ruse)
Printing: TU-Varna
For contacts:
Technical University of Varna
Faculty of Computing and Automation
1, Studentska Str., 9010 Varna,
Bulgaria
Tel/Fax: (+359) 52 383 320
e-mail: [email protected]
ISSN 1312-3335

Компютърни науки и технологии 1 2019 Computer Science and Technologies 3

Компютърни науки и технологии 1 2019 Computer Science and Technologies 4
СБОРНИК ДОКЛАДИ
Международна конференция
"Приложни компютърни технологии"
19 – 21 септември 2019 г.
Варна, България
International Conference
„Applied Computer Technologies”
19 – 21 September, 2019
Varna, Bulgaria
PROCEEDINGS

Компютърни науки и технологии 1 2019 Computer Science and Technologies 5
The International Conference Applied Computer Technologies (ACT) 2019 is an
international event organized by the Technical University of Varna, Republic of
Bulgaria and the University of Information Science and Technology ―St. Paul the
Apostle‖ – Ohrid, Republic of North Macedonia.
The conference aims to provide a global forum for experts and participants from
academia to exchange ideas and present results of research in the area of computer
engineering and technology.
Chairmеn:
Ninoslav Marina, Professor, Ph.D., Rector of UIST ―St. Paul the Apostol‖ –
Ohrid
Vencislav Valchev, Professor, Ph.D., Rector of TU Varna

Компютърни науки и технологии 1 2019 Computer Science and Technologies 6
Organizing committee
Assoc. Prof. Eng. Mariana Todorova, PhD
Assoc. Prof. Eng. Vencislav Nikolov, PhD
Asst. Eng. Dimitrichka Nikolaeva
Asst. Eng. Reneta Parvanova
Prof. Atanas Hristov PhD
Ass. Ile Dimitrievski PhD
Ass. Rasim Salkoski PhD
Prof. Subash Chandra Bose PhD
Prof. Rui Dang PhD
Ass. Ljubinka Sandzakoska
Ass. Jovan Karamachoski
Ass. Naum Tuntev
Mr. Pavel Taskov

Компютърни науки и технологии 1 2019 Computer Science and Technologies 7
Program committee
Akhtar Kalam – Victoria University, Australia
Amita Nandal- University of Information Science and Technology ―St. Paul the Apostle‖
Ohrid, Republic of North Macedonia
Aneta Velkoska- University of Information Science and Technology ―St. Paul the Apostle‖
Ohrid, Republic of North Macedonia
Brijesh Yadav – University of Information Science and Technology ―St. Paul the Apostle‖
Ohrid, Republic of North Macedonia
Carlo Ciulla – University of Information Science and Technology ―St. Paul the Apostle‖ Ohrid,
Republic of North Macedonia
Cesar Collazos – University of Cauca-Colombia
Darina Pavlova – Technical University of Varna, Bulgaria
Dijana Capeska Bogatinoska – University of Information Science and Technology ―St. Paul the
Apostle‖ Ohrid, Republic of North Macedonia
Dmytro Zubov – University of Information Science and Technology ―St. Paul the Apostle‖
Ohrid, Republic of North Macedonia
Elena Brunova – Tyumen State University, Tyumen, Russia
Elena Hadzieva – University of Information Science and Technology ―St. Paul the Apostle‖
Ohrid, Republic of North Macedonia
Farrah Wong Hock Tze- SKTM University of Malaysia Sabah, Malaysia
Geo Kunev- Technical University of Varna, Bulgaria
Hamurabi Gamboa-Rosales- Autonomous University of Zacatecas, Mexico
Harun Yücel, Assistant Professor, Bayburt University, Turkey
Huizilopoztli Luna-Garcia- Autonomous University of Zacatecas, Mexico
Ivan Buliev – Technical University of Varna, Bulgaria
Jane Bakreski- University of KwaZulu-Natal, South Africa
Joncho Kamenov – Technical University of Varna, Bulgaria
Jovanka Damoska Sekuloska- University of Information Science and Technology ―St. Paul the
Apostle‖
Ohrid, Republic of North Macedonia
Yulka Petkova – Technical University of Varna, Bulgaria
Krasimira Dimitrova- Technical University of Varna, Bulgaria
Mandritsa Igor -North-Caucasus Federal University, Russia
Mariana Stoeva- Technical University of Varna, Bulgaria
Nikica Gilić – Faculty of Humanities and Social Sciences, University of Zagreb, Croatia
Ninoslav Marina – University of Information Science and Technology ―St. Paul the Apostle‖
Ohrid, Republic of North Macedonia
Oliver Jokisch – Leipzig University of Telecommunications, Germany
Petar Jandrić – Zagreb University of Applied Sciences, Croatia
Sabareesh K P Velu – University of Information Science and Technology ―St. Paul the
Apostle‖ Ohrid, Republic of North Macedonia
Tai-Hoon Kim – Computer Science and Engineering, Hannam University, Daejeon, Korea
Todorka Georgieva- Technical University of Varna, Bulgaria
Todor Ganchev- Technical University of Varna, Bulgaria
Vencislav Valchev- Technical University of Varna, Bulgaria
Vsevolod Ivanov – Technical University of Varna, Bulgaria
Weiler Finnamore – Universidade Federal de Juiz de Fora, Telecommunications, Brazil
Zhivko Zhekov – Technical University of Varna, Bulgaria

Компютърни науки и технологии 1 2019 Computer Science and Technologies 8

Компютърни науки и технологии 1 2019 Computer Science and Technologies 9
Година XVII No. 1 /2019 YEAR XVII No. 1 /2019
CONTENT
1 IMPLEMENTATION OF DATA CLASSIFICATION IN BREAST CANCER
PREDICTION
Ustijana Rechkoska-Shikoska
10
2 DESIGN OPTIMIZATION OF 200 AMPS BOOSTER TRANSFORMER
BASED ON DIFFERENTIAL EVOLUTION ALGORITHM
Rasim Salkoski, Ile Dimitrievski
28
3 PERFORMANCE COMPARISON OF C++ AND JAVASCRIPT (NODE.JS –
V8 ENGINE)
Kristijan Stefanoski, Aleksandar Karadimche, Ile Dimitrievski
36
4 INCREASING THE EFFICIENCY THROUGH THE DIGITALIZATION OF
GOVERNMENT SERVICES
Jovanka Damoska Sekuloska
45
5 THE END OF THE BLOCKCHAIN AS WE KNOW IT
Jovan Karamachoski
52
6 DESIGN AND IMPLEMENTATION OF OPTICAL SENSOR
Zhejno Ivanov
57
7 ANALYSIS OF SOME ISSUES IN RISK ASSESSMENT FOR INFORMATION
SECURITY
Petko Genchev, Milena Karova
62
8 TECHNOLOGY, QUALITY AND INNOVATION - KEY ASPECTS OF
COMPETITIVENESS OF INDUSTRIAL ENTERPRISES
Krasimira Dimitrova
71
9 OPPORTUNITIES FOR RESEARCH THE IMPACT OF INTELLECTUAL
CAPITAL ON CREATING VALUE IN INDUSTRIAL ENTERPRISES
Tanya Panayotova
81
10 MODEL OF ADAPTIVE CONTROL OF DISTRIBUTED PARAMETERS
THERMAL SYSTEMS
Dian B. Dzhibarov
90
11 IDENTIFICATION OF NONLINEAR SYSTEMS USING HAAR WAVELET
FUNCTIONS
Mariyana Todorova, Reneta Parvanova
93
12 POSSIBLE PROBLEMS AND FACTORS AFFECTING QoS IN
TRANSMISSION OF VOICE OVER IP NETWORK
Plamena Edreva, Todorka Georgieva
99
13 SOFTWARE DEFINED NETWORKS – A BRIEF STUDY
Rosen Radkov
103

Компютърни науки и технологии 1 2019 Computer Science and Technologies 10
IMPLEMENTATION OF DATA CLASSIFICATION IN BREAST
CANCER PREDICTION
Ustijana Rechkoska-Shikoska
Abstract: The world is a big data problem. It contains information within that is ready to be used and
implemented in solving world‘s every day battles. All we have to do is collect, sort out, extract the patterns
in a large data set and make use of these data in order to make the right decision. This work involves the use
of data mining and data classification in medicine where machines discover patterns which enable us to find
the anomalies and transformations in our body cells that indicate the possibility of the most known killer -
cancer. We will be targeted especially on the breast cancer since is one of the most common cancer affecting
people from all over the world. The usage of the data mining techniques to find the useful data in the form of
a decision tree to find the early stage of a cancer and whether it is benign or malignant is presented in this
work as one of the main contributions.
Keywords: Data Mining, ID3, Data Classification, Breast cancer, Decision Tree, Pattern Recognition
1. Introduction
There are many definitions that picture the meaning and the work of data mining. Let us start
with this one: ―Data warehousing is a collection of decision support technologies, aimed at enabling
the knowledge worker (executive, manager, analyst) to make better and faster decisions‖.
Nowadays, with these steps taken forward in developing and innovating in every aspect of our
everyday lives, especially meaning in technological point of view, we have access in an
unimaginable amount of data. But, how do we make usage of these data? Most of the time the data
we access to is presented in an unorganized kind of way, having many errors, anomalies, deviations
most of the time. What we need to do first is ―fix‖ this data in order to make a place for finding a
pattern and find a way to make a use of this data by processing it. The term Data Mining is also
generalized to any kind of computer decision support system including artificial intelligence,
machine learning and business intelligence. There are multiple tasks of Data Mining that we will
mention furthermore. They include: prediction methods (use some variables to predict unknown or
future values of other variables); description methods (find human-interpretable patterns that
describe the data); classification (predictive), clustering (descriptive), association rule discovery
(descriptive), deviation detection (predictive).
The fields that data mining takes the major place in order to solve the problems that rise on
everyday basis are: In creating games, business - to identify potential prospect/customers and
channel/offers or market basket analysis – a data mining system could identify those customers who
favor one product over another one (purchase patterns), science and engineering - data mining has
been used widely in the areas of science and engineering, such as bioinformatics, genetics,
medicine, education and electrical power, in the study of human genetics, data mining aims to find
out how the changes in an individual's DNA sequence affects the risks of developing common
diseases, visual data mining - In the process of turning from analogical into digital, large data sets
have been generated, collected, and stored discovering statistical patterns, trends and information
which is hidden in data, in order to build predictive patterns, pattern mining - "Pattern mining" is a
data mining method that involves finding existing patterns in data. In this context patterns often
means association rules. Within the analysis context, ―Data mining is the process of applying
artificial intelligence systems with the intention of uncovering hidden patterns‖. Therefore,
evolution in computer science applications such as artificial neural networks, cluster analysis,
genetic algorithms, support vector machines has provided additional power to data mining because

Компютърни науки и технологии 1 2019 Computer Science and Technologies 11
of the immediate use of the patterns discovered into the aforementioned computer science
applications.
This work is done in order to help with data mining has to offer in the science of medical
researches, especially those based for early discover of breast cancer and the further curing
therapies that follow. What we will use is so called data mining techniques that use some of the
before given tasks of data mining in order to discover the useful information needed to solve the
problem.
2. Related work
Breast cancer is a type of cancer originating from the breast tissue, commonly from the inner
lining of the milk ducts or lobules supplying the ducts with milk. Breast cancer occurs in both men
and women, although the former type is rare. It remains the number one form of cancer that women
are diagnosed with around the world. Even with enhanced treatment, the lack of early detection has
put women at even higher risk of dying from this disease. [1]
By using classification of data we can accurately predict the target class for each instance in
the data. This is why this task [2] is one of the most widely used in decision-making processes such
in machine-based learning algorithms. In training phase of classification, each instance of the data
has predefined target class. Whereas in testing phase unknown test instances are predicted using the
model builds with the training set. These algorithms process a huge volume of data values and
classify them based on the training set. Data preprocessing precede classification to improve the
quality of the data. There are several methods of pre-processing, but whereas we consider data
cleaning and data reduction techniques.
At this point, hospitals use manual cancer diagnosis system. Patients are being registered and
go through radiology test process such as MRI, CT, X rays. Radiologist gives his opinion on the test
report. After this process, an expert doctor reviews the X-rays/CT/MRI and gives his remarks. In
some types of cancer, the diagnosis is based on the final decision by the doctors e.g. breast and lung
cancer, but in other types of cancer like carcinoma some other tests are also required like biopsy. In
a manual system the radiologist and the doctor diagnose cancer. This process is slow as after the
radiologist‘s review the doctor has to review also and give remarks and finally tell if the cancer is
present or not. The need is to automate this process to make the cancer diagnosis efficient and fast
with the use of state of the art technology. [3]
By all of the different ways to classify data and approaches to data mining, the best prediction
―tool‖ used is the Decision tree ( with 93.62% accuracy). Accuracy on benchmark dataset (UCI
machine learning dataset) and also on SEER dataset. This kind of data classifier can be used in the
future to design various web based applications to accept the predictor variables and be
implemented in remote areas such as rural regions or country sides, to imitate like human diagnostic
expertise for prediction of ailment. [4]
We use this study to test in which areas we can use the classification based data mining
techniques [5] such as Decision tree, Naïve Bayes or Rule based techniques in the healthcare.
Cancer research is generally clinical and biological in nature, data driven statistical research has
become a common complement. The use of these researches may lead to prediction of the outcome
of a disease and this is what it makes one of the most interesting and challenging tasks where to
develop data mining applications.
3. Data Mining
Data Mining is one of the most attractive ―tools‖ of today whose implementation has the
widest range and helps many branches in the information industry in recent years such as science,
business management, market analysis, production control, engineering and so on.

Компютърни науки и технологии 1 2019 Computer Science and Technologies 12
What we do with Data Mining is simple turning any information in useful knowledge. It can
be seen as a result of the natural evolution of information technology.
Data mining is a field with multiple disciplines, implementing its work in wide areas
including artificial intelligence, high-performance computing, data visualization database
technology, machine learning, statistics, pattern recognition, information retrieval, neural networks,
knowledge-based systems and so on. In this paper, we will see data mining as a technique for the
discovery of patterns hidden in large data sets, focusing on issues relating to their feasibility,
usefulness, effectiveness, and scalability with respect to science, medicine and how we can
implememt this in the classification of breast cancer, today‘s most common death cause for women
from all over the world. Data mining emerged during the late 1980s, made great strides during the
1990s, and continues to flourish into the new millennium. In this work we will present firstly an
overall picture of the field, introducing interesting data mining techniques and systems and
discussing applications and research directions. Furthermore, we will give an explanation of how do
we mine our data, what does data contain and what are the possible techniques to be used in
classification of data.
Fig. 1. The evolution of database technology; Data Mining: Concepts and Techniques Jiawei Han and
Micheline Kamber Simon Fraser University 2000 (c) Morgan Kaufmann Publishers
3.1. Preprocessing of data
Before we take a step into mining of data, we need to make sure that we have preprocessed
the data first. We need to get the data ready for analyze by having a closer look at attributes and
data values. Real-world data are typically noisy, enormous in volume (often several gigabytes or
more), and may originate from a hodgepodge of heterogeneous sources. We need to have
knowledge about our data which is useful for data preprocessing, the first major task of the data
mining process. We need to know what kind of attributes make up our data, which values do our
attributes have, how do the data look, how is the value distributed, need to know our outliers, which
data is similar to another. This is a starter pack which is must have on order to get the best
knowledge of the data that we process.
An attribute is a data field, representing a characteristic or feature of a data object. We can
always see the terms such as dimension (used in data warehousing), variable (statistical analysis), or
feature (machine learning) also. Observed values for a given attribute are known as observations. A

Компютърни науки и технологии 1 2019 Computer Science and Technologies 13
set of attributes used to describe a given object is called an attribute vector. The distribution of data
involving one attribute is called univariate. A bivariate distribution involves two attributes, and so
on. We can determine the type of an attribute by the set of possible values—nominal, binary,
ordinal, or numeric—the attribute can have. I will give some brief explanation for each of these.
The values of the nominal attribute are represented by symbols or names of things. They
represent category, code, or state, and so on, but not have any meaningful order. Nominal attributes
are also referred to as categorical. An ordinal attribute is an attribute with possible values that have
a meaningful order or some ranking among them, but the magnitude between successive values is
not known. Ordinal attributes are useful for registering subjective assessments of qualities that
cannot be measured objectively; thus ordinal attributes are often used in surveys for ratings. A
binary attribute is a nominal attribute with only two categories or states: 0 or 1, where 0 typically
means that the attribute is absent, and 1 means that it is present. Binary attributes are referred to as
Boolean if the two states correspond to true and false. When we have a numeric attribute, we have a
quantitative attribute which means it is measurable, represented in real values or integers. These
attributes can be interval-scaled, measured on a scale of equal-size units. They can be positive,
negative or equal to 0. This provides a ranking and comparing of values. In case of ratio-scaled
attributes, a true zero-point exists. That is, if a measurement is ratio-scaled, we can speak of a value
as being a multiple (or ratio) of another value. In addition, the values are ordered, and we can also
compute the difference between values, as well as the mean, median, and mode.
There are some other different ways to organize attribute types. These further types that we
will mention are developed from the field of machine learning. Each type may be processed
differently. A discrete attribute has a finite or countable infinite set of values, which may or may not
be represented as integers. If an attribute is not discrete, it is continuous. Continuous attributes are
typically represented as floating-point variables.
For our preprocessing of data to be successful, it is very important to have an overall picture
of our data. The following statistical descriptions can be used to identify properties of the data and
highlight which data values should be treated as noise or outliers.
So, we discuss the mean, median, mode, and midrange. Also, in order to find out how the data
is spread out, we would like to have an idea of the dispersion of the data. The most common data
dispersion measures are the range, quartiles, and interquartile range; the five-number summary and
boxplots; and the variance and standard deviation of the data which are useful for identifying
outliers. Finally, we can use many graphical displays of basic statistical descriptions to get a visual
look in our data. These include bar charts, pie charts, line graphs, histograms, and scatter plots.
When we want to ―cleanse‖ the large amount of data to extract the valuable part of it, to get to
the knowledge, we use some ―tools‖ in data mining in order to preprocess:
3.1.1. Aggregation
When we combine two or more attributes into a single attribute in order to make a data
reduction to reduce the numbers of attributes, get more ―stable‖ data with less variability. Data is
gathered and summarized for further use, such as statistical analysis. For example, raw data can be
aggregated over a given time period to provide statistics such as average, minimum, maximum,
sum, and count. After the data is aggregated and written to a view or report, you can analyze the
aggregated data to gain insights about particular resources or resource groups.
3.1.2. Sampling
Sampling is the main technique employed for data selection. It is often used for both the
preliminary investigation of the data and the final data analysis. Sampling is used in data mining
because processing the entire set of data of interest is too expensive or time consuming. The key

Компютърни науки и технологии 1 2019 Computer Science and Technologies 14
principle for effective sampling is the following: using a sample will work almost as well as using
the entire data sets, if the sample is representative, if it has approximately the same property (of
interest) as the original set of data. Sampling of data is very important since it determines the
accuracy of the research and the survey result. If sample is wrong, that might result in false final
results.
3.1.3. Dimensionality Reduction
In order to reduce the amount of time and memory required by data mining algorithms and
allow data to be more easily visualized and reduced of noise and irrelevant features.
3.1.4. Feature subset selection
Another way to reduce dimensionality of data by duplicate much or all of the information
contained in one or more other attributes.
3.1.5. Feature creation
Create new attributes that can capture the important information in a data set much more
efficiently than the original attributes.
3.1.6. Attribute Transformation
A function that maps the entire set of values of a given attribute to a new set of replacement
values such that each old value can be identified with one of the new values. Attribute
transformation is often viewed as a simple operation that, once applied to the available dataset, can
be completely ignored thereafter. The most commonly used modeling and nonmodeling attribute
transformations perform simple arithmetic or logical operations, needed to adjust the data to the
requirements or capabilities of some classification, regression, or clustering algorithms.
3.2. Classification of Data
We can divide the process of data classification in two steps: learning step (where we make a
classification model) and a classification step (where the model is used to predict class labels for
given data). Find a model for class attribute as a function of the values of other attributes. A test set
is used to determine the accuracy of the model. Usually, the given data set is divided into training
and test sets, with training set used to build the model and test set used to validate it. How do we
start? We build a classifier describing a predetermined set of data classes with the use of an
algorithm by analyzing a training set made up of database tuples and their associated class labels. In
the first step, a classifier is built describing a predetermined set of data classes or concepts. This is
the learning step (or training phase), where a classification algorithm builds the classifier by
analyzing or ―learning from‖ a training set made up of database tuples (samples, examples,
instances, data points, or objects) and their associated class labels.
The class label attribute is discrete-valued and unordered. It is categorical (or nominal) in that
each value serves as a category or class. The individual tuples making up the training set are
referred to as training tuples and are randomly sampled from the database under analysis. Because
the class label of each training tuple is provided, this step is also known as supervised learning (i.e.,
the learning of the classifier is ―supervised‖ in that it is told to which class each training tuple
belongs). It contrasts with unsupervised learning (or clustering), in which the class label of each

Компютърни науки и технологии 1 2019 Computer Science and Technologies 15
training tuple is not known, and the number or set of classes to be learned may not be known in
advance.
This first step of the classification process can also be viewed as the learning of a mapping or
function, y = f (X), that can predict the associated class label y of a given tuple X.
In this view, we wish to learn a mapping or function that separates the data classes. Typically,
this mapping is represented in the form of classification rules, decision trees, or mathematical
formulae. The rules can be used to categorize future data tuples, as well as provide deeper insight
into the data contents. They also provide a compressed data representation.
The accuracy of a classifier on a given test set is the percentage of test set tuples that are
correctly classified by the classifier. The associated class label of each test tuple is compared with
the learned classifier‘s class prediction for that tuple. [7] [8]
4. Research of abnormal and uncontrolled cell division in breast tissue (Pathology of breast
with methods in diagnostic radiology and ultrasonography)
We are living in a fast world where people rush their everyday life to keep with the pace. In
this try to keep up with it, we are struggled from the stress and pressure that is built in us. This is
the most common start of every process that occurs and fights our body despite all its efforts to
protect us. It is well known that today‘s biggest ―killer‖ is called cancer. We are trying so hard not
to name this painful word, but we hear it more and more every day. It has become number one
threat to people from all over the world. What I want to raise awareness for in this work is the
breast cancer. This is the third deadliest cancer in the world after lung and colon cancer. Breast
cancer is the most common cancer in women both in the developed and less developed world. The
problem is that, in the developing countries, the most of the cases of this silent killer are diagnosed
in late stages which is very crucial in order to save one‘s life. The prediction and diagnosing cancer
in the early stages (first or second) plays the most significant role in doctor‘s plan to cure this fast
growing murder. From our research, we found out that the most breast cancer cases are located in
Europe. Countries with the highest incidence are Belgium, Denmark and France. Avoidable risk
factors have been attributed to this number. Many experts claim that the westernized lifestyle has
increased cancer risk. These nations have also practiced significant levels of hormonal replacement
therapy in the past, the results of which are recently showing up as increased breast cancer
diagnoses. These countries also have thorough mammographic screening programs that result in
early detection, increased diagnoses, and higher survival rates.
The breasts of a woman are made up of fat, supportive (connective) tissue and tissues with
glands called lobes. These lobes are milk glands where breast milk is produced. These are
connected to the nipple by a network of milk ducts.
Both breasts may be slightly different from each other. They change throughout a woman‘s
life and often feel different at different times in the month because of hormonal changes. Just before
periods they may feel lumpy and they may feel softer, smaller and laxer as the woman ages.
Under the skin, an area of breast tissue extends into the armpit (axilla). This is called the tail
of the breast. The armpits also contain a collection of lymph nodes which are part of the lymphatic
system. There are also lymph nodes just beside the breastbone and behind the collarbones. These
drain the breast tissues and are affected in breast diseases and inflammatory conditions. The lymph
nodes are connected by a network of tiny lymphatic tubes. Lymph flows through the lymphatic
system.

Компютърни науки и технологии 1 2019 Computer Science and Technologies 16
Fig. 2. Parts of a woman breast
There are trillions of cells in the body which have a regulated cell cycle that controls their
growth, maturity, division and death. During childhood normal cells divide faster to allow the
person to grow. Once adulthood is reached the cells divide to replace worn-out cells and to repair
injuries. This cell division and growth is controlled by the cellular blue print or DNA and genes that
lie within the cell‘s nucleus. When these cells become to ―act‖ abnormally, start to grow out of
control and create more abnormal cells, invade other tissues (metastasis) is when the cancer begins.
Breast cancer is a malignant tumor that starts in the cells of the breast. Like other cancers, there are
several factors that can raise the risk of getting breast cancer. Damage to the DNA and genetic
mutations can lead to breast cancer have been experimentally linked to estrogen exposure. Some
individuals inherit defects in the DNA and genes like the BRCA1, BRCA2 among others. Those
with a family history of ovarian or breast cancer thus are at an increased risk of breast cancer.
The immune system normally seeks out cancer cells and cells with damaged DNA and
destroys them. Breast cancer may be a result of failure of such an effective immune defense and
surveillance.
For our discussion furthermore, taking into account medical doctors‘ comments explained
some of the risk factors, signs of changes in the breast, how to diagnose and further possibilities to
cure. The most important thing he stressed is that early detection is the most essential part in order
to increase one‘s chances to fight off breast cancer. From the risk factors, firstly he mentioned the
genetic ones (the genes brca1 brca2) stating that the risks increases from 1.7-2.5% if we have a first
knee relative who fought this disease. Also, taking in account women that had their first period
younger, who gave birth after their thirties or who never had children. Other factors are those that
are environmental such as ways of living, as I stated at beginning stress is the silent killer, our
nutrition. Those factors we cannot modify is the gender, age, breast density or family history with
this illness.
Now, what are the signs that we can identify locally by self-examination: If we see that a
lump has appeared within the breast. This may be a lump that is fixed to the skin above it or the
chest wall and structures underlying it. The first one is more often than not a sign of cancerous
tumor. Change of the skin colors, change of the size or shape of the breast or nipples, rash or sores
around the nipple, discharges from the nipple. These are the local symptoms that occur most of the
time and it is a sign that we must go and see a doctor.
Not every abnormal behave of the breast tissue is cancer or malign. These changes in the
breast can be also benign. This means that the changes that appeared in the breast can be cists, fibro
adenoma or lipoma which can occur in the young population mostly.
Speaking of the methods of diagnosis of breast cancer, we will mention Mammography as a
specialized medical imaging that uses a low-dose x-ray system to see inside the breasts. A

Компютърни науки и технологии 1 2019 Computer Science and Technologies 17
mammography exam, called a mammogram, aids in the early detection and diagnosis of breast
diseases in women.
An x-ray (radiograph) is a noninvasive medical test that helps physicians diagnose and treat
medical conditions. Imaging with x-rays involves exposing a part of the body to a small dose of
ionizing radiation to produce pictures of the inside of the body. X-rays are the oldest and most
frequently used form of medical imaging.
Fig. 3. Using mammography to examine abnormal cell. Here are shown scans of a normal breast, a
benign mass, and cancer
Three recent advances in mammography include digital mammography, computer-aided
detection and breast tomosynpaper.
Digital mammography, also called full-field digital mammography (FFDM), is a
mammography system in which the x-ray film is replaced by electronics that convert x-rays into
mammographic pictures of the breast. These systems are similar to those found in digital cameras
and their efficiency enables better pictures with a lower radiation dose. These images of the breast
are transferred to a computer for review by the radiologist and for long term storage. The patient‘s
experience during a digital mammogram is similar to having a conventional film mammogram.
Computer-aided detection (CAD) systems search digitized mammographic images for
abnormal areas of density, mass, or calcification that may indicate the presence of cancer. The CAD
system highlights these areas on the images, alerting the radiologist to carefully assess this area.
Breast tomosynpaper, also called three-dimensional (3-D) mammography and digital breast
tomosynpaper (DBT), is an advanced form of breast imaging where multiple images of the breast
from different angles are captured and reconstructed ("synthesized") into a three-dimensional image
set. In this way, 3-D breast imaging is similar to computed tomography (CT) imaging in which a
series of thin "slices" are assembled together to create a 3-D reconstruction of the body.
Although the radiation dose for some breast tomosynpaper systems is slightly higher than the
dosage used in standard mammography, it remains within the FDA-approved safe levels for
radiation from mammograms. Some systems have doses very similar to conventional
mammography.
Large population studies have shown that screening with breast tomosynpaper results in
improved breast cancer detection rates and fewer "call-backs," instances where women are called
back from screening for additional testing because of a potentially abnormal finding.
Breast tomosynpaper may also result in:
• earlier detection of small breast cancers that may be hidden on a conventional mammogram
• greater accuracy in pinpointing the size, shape and location of breast abnormalities
• fewer unnecessary biopsies or additional tests
• greater likelihood of detecting multiple breast tumors
• clearer images of abnormalities within dense breast tissue

Компютърни науки и технологии 1 2019 Computer Science and Technologies 18
Fig. 4. Presentation of normal and abnormal cells
5. Decision Tree Algorithm
A decision tree is a technique which uses algorithms to build a decision tree, so that each node
represents an attribute, each link(branch) represents a decision(rule) and each leaf represents an
outcome (categorical or continues value). The topmost node in a tree is the root node. The reason is
that we create a decision tree like this for the entire data and process a single outcome at every leaf
(or minimize the error in every leaf). We use the decision tree for both classification and regression
problems, in this work we talk about classification and how the use of decision tree may help the
medicine in classification of breast cancer.
During tree construction, attribute selection measures are used to select the attribute that best
partitions the tuples into distinct classes. When decision trees are built, many of the branches may
reflect noise or outliers in the training data. Tree pruning attempts to identify and remove such
branches, with the goal of improving classification accuracy on unseen data.
We mentioned that we use certain algorithms in order to build this. Some of the algorithms
that we will briefly explain further include:
1.CART → uses Gini Index (Classification) as metric. CART stands for Classification and
Regression Trees. It is characterized by the fact that it constructs binary trees, namely each internal
node has exactly two outgoing edges. The splits are selected using the twoing criteria and the
obtained tree is pruned by cost–complexity Pruning.
When provided, CART can consider misclassification costs in the tree induction.
It also enables users to provide prior probability distribution. An important feature of CART
is its ability to generate regression trees. Regression trees are trees where their leaves predict a real
number and not a class. In case of regression, CART looks for splits that minimize the prediction
squared error (the least–squared deviation). The prediction in each leaf is based on the weighted
mean for node.
2.ID3 (Iterative Dichotomiser 3) → uses Entropy function and Information gain as metrics.
During the late 1970s and early 1980s, J. Ross Quinlan, a researcher in machine learning,
developed a decision tree algorithm known as ID3 (Iterative Dichotomiser). This work expanded on
earlier work on concept learning systems, described by E. B. Hunt, J. Marin, and P. T. Stone.
Quinlan later presented C4.5 (a successor of ID3), which became a benchmark to which newer
supervised learning algorithms are often compared. In 1984, a group of statisticians (L. Breiman, J.
Friedman, R. Olshen, and C. Stone) published the book Classification and Regression Trees
(CART), which described the generation of binary decision trees. ID3 and CART were invented
independently of one another at around the same time, yet follow a similar approach for learning
decision trees from training tuples. These two cornerstone algorithms spawned a flurry of work on
decision tree induction. ID3, C4.5, and CART adopt a greedy (i.e., non-backtracking) approach in
which decision trees are constructed in a top-down recursive divide-and-conquer manner. Most
algorithms for decision tree induction also follow a top-down approach, which starts with a training

Компютърни науки и технологии 1 2019 Computer Science and Technologies 19
set of tuples and their associated class labels. The training set is recursively partitioned into smaller
subsets as the tree is being built. [9]
3.Naive Bayesian Classifiers → are statistical classifiers which can predict class membership
probabilities such as the probability that a given sample will belong to a particular case. Naive
Classifiers assumes that the effect of an attribute value on the given class is independent of the
values of other attributes. An advantage of the naive Bayes classifier is that it requires a small
amount of training data to estimate the parameters (means and variances of the variables) necessary
for classification. It performs better in many complex real world situations like Spam Classification,
Medical Diagnosis, and Weather forecasting. It is suited when dimensionality of input is high.
Fig. 5. Methodology, Performance Analysis of Decision Tree Algorithms for Breast Cancer Classification
5.1. An Implementation of Tree-Decision Technique in diagnosis of Breast Cancer
As we mentioned before, there are few technological ways that medicine uses to find out if a
mass is benign or malignant, most commonly the mammography. Afterwards a piece of the mass is
taken and examined to prove whether the mass is cancerous or not. Mammography is a process of
breast examination in humans by using low-dose X-rays. With proper use, mammography can
reduce mortality caused by breast cancer. Certainly, the case requires knowledge and paramedical
skills in handling it. Hence, several studies have been conducted to develop computer aided breast
cancer diagnosis based on digital image processing to reduce the error possibility. Naïve Bayes has
several advantages, such as fast training process, unaffected by irrelevant features, and is also
capable of handling real and discrete data. By combining their respective advantages, it can improve
the accuracy of the classification process. To complete the identification study of breast cancer, we
propose a scheme to classify breast cancer types. The classification is categorized into two types,
i.e. benign and malignant. There are few medical features that we examine in order to differentiate
whether a mass is malignant or benign. These include: The uniformity of cell size, which means that
the growth of the cell above 2cm might aware of malignant mass, the uniformity of cell shape, in
means of whether the mass is circumscribed or has irregular shape, the rate of growth, whether the
mass grows slow or rapidly and if metastasis are present. These are few of the features that we use
to distinct what kind of mass we work with.

Компютърни науки и технологии 1 2019 Computer Science and Technologies 20
5.2. ID3 Algorithm
This algorithm depicts the very basic principle of decision tree for constructing tree. It uses
the divide-and-conquer strategy in the construction of decision tree, which uses the information gain
of characteristic as a function of attribute selection of a branch in each node of the tree, selecting the
information gain as the characteristic of the branch. ID3 algorithm is described as follows [12]:
Let E = D1 × D2 × ... × Dn be finite-dimensional vector n, where Dj is a finite set of discrete
symbols, E elements e = is the sample, vj Dj, j = 1, 2, ..., n. Let PE be the positive sample set, NE
be the anti-sample set, and the number of samples which are p and n. According to the principle of
information theory, ID3 algorithm is based on two assumptions:
(1) In the vector space E, a decision tree classification probability for any sample and the
probability for positive sample and anti-sample in E are the same.
(2) The expected bits of information needed for making the correct identification by a
decision tree are:
(1)
If attribute A is the root of the decision tree, A has n values {u1, u2, ..., un}, which will divide
the sample set E into n subsets {E1, E2, ..., En}. Supposing that Ei contains pi positive samples and
ni negative samples, then a subset of the information needed for the Ei is I (pi + ni), and the
expected information needed for the attribute A as the root node is:
(2)
Therefore, the information gain of classification attribute of A as the root node is Gain (A) = I
(p, n)-E (A). ID3 algorithm selection contributes the greatest attribute of Gain (A) to a branch of the
node attributes, and each node of the decision tree is using this principle until the decision tree is
completed (each node of the samples belong to the same class or all Category attributes are used
up). One advantage of ID3 is its time of tree construction and difficulty of the task (such as the
number of sample set samples, the number of attributes for each sample to study the complexity of
the concept of the decision tree nodes) are steadily increasing in linear and the computation is
relatively small.
Steps of creating the decision tree:
Step 1: Initially calculate classification entropy.
Step 2: Select the attributes and for each attribute, calculate information gain
Step 3: Highest information gain attributes are figured out.
Step 4: Remove node attribute, for future calculation.
Repeat steps 2-4 until all attribute have been used.
Across all the domains, the performance of ID3 has resulted in good performance.
Particularly, we examine its great use in medicine, especially in testing and prediction of breast
cancer. This model is simple to understand and interpret, requires little data preparation, it enables
to handle both numerical and categorical data, possible to validate a model using statistical tests,
and most of all, it performs well with large datasets.
5.3. Advantages of decision tree
Interpretable at a glance

Компютърни науки и технологии 1 2019 Computer Science and Technologies 21
Suitable for handling both categorical and quantitative values
Universal for solving both classification and regression problems
Capable of handling missing values in attributes and filling them in with the most
probable value
High-performing with regard to searching down a built tree, because the tree traversal
algorithm is efficient even for massive data sets
5.4. Disadvantages of decision tree
Decision trees can be unstable. Even minor perturbations in a data set can produce a
drastically different tree due to the hierarchical structure of the tree, where any modification at the
top levels result in changes further down the tree.
It can be difficult to control the size of the tree. The size of a decision tree is critical for
ensuring the quality of the problem-solving process. It should be noted that decision trees may often
grow to become too short or too big when you rely on simple stopping criteria.
In some complex cases, splitting data into classes might not be helpful. Simple trees
split data at nodes on a single attribute value parallel to the coordinate axes, so to say, which means
that each attribute is a coordinate axis that has its own values. This leads to rectangular
classification boxes that group data points corresponding to this or that class. Such partitioning may
not correspond well with the actual distribution of class-specific data points in the decision space of
some intricate cases.
Information gain is prone to prefer attributes with a large number of different values.
Each record may have its attribute value in extreme cases. This means that the second addend in
Gain(X,A) is equal to 0, resulting in the maximum information gain.
Decision tree algorithm helps to automatically building a prediction model based on source
data. We use values of source data attributes build a function that decides, evaluates, trains some
model parameters by itself.
5.5. Methods and Procedures
We will do a simple discussion of how decision tree works in medical decisions and present
in which way helps to decide about the possible outcome whether a mass is malignant or benign.
The dataset in this discussion was taken from the hospital JZU ―Dr. Svetozar Cocoroski‖ in
Vevchani which was provided by Dr. Zharko Daskaloski, a specialist in radiology who contributes
in women health and does examination on about 2000 patients yearly. His domain of work is in the
west of Macedonia, Vevchani, Struga, Ohrid, Kichevo, Debar, Resen and sometimes even patients
from Albania come to make a mammography or echo.
The number of breast cancer dataset provided from Dr. Daskaloski for 2018 is 1800 instances,
we will create a data set consisting of 4 attributes: 1) Uniformity of cell size, 2) Uniformity of cell
shape, 3) The rate of growth and 4) Presence of metastasis. We will discuss how the decision tree
ID3 Algorithm works and how we make decision based on it.
We will take 50 instances, and based on the criteria we mentioned we will construct a
decision tree that helps decide whether a mass is malignant or benign. We will start by doing a table
and presenting the outcomes. I have created a formula that brings TRUE if there is not mistake
found in the mass or FALSE if the mass shows results of cancer.

Компютърни науки и технологии 1 2019 Computer Science and Technologies 22
Table 1. Dataset of attributes‘ values, predicting benign or malignant mass in breast
First, we number each patient. We create column for each four attributes and at the end we
make a column that returns outcome TRUE or FALSE, bu using AND formula on excel (=AND
(B2=0,C2<2,D2=0,E2=0)). We enter values in each column, 0 or 1 except for the second where we
input the actual measure of the mass. For the first column, uniformity of cell shape, 0 means that
there is not mistake found in mass and that is regular or 1 means that the shape of the mass is
irregular. We continue on the second. We input the values of the mass size. Benign tumors have
mass below 2cm. Each value above this size aware that a malignant cell is present and we make
further examination on that mass. On the column rate of growth, 0 means that the mass is growing
slow or 1 meaning that cells are growing rapid which suggests on further examination. And as last,
metastasis column shows whether a metastasis is present or not. Presence of metastasis indicates of

Компютърни науки и технологии 1 2019 Computer Science and Technologies 23
a malignant tumor, and this is usually typical for deeper stages of cancer. This means that each case
of value 1 in metastasis indicates on cancer.
The core algorithm for building decision trees called ID3 by J. R. Quinlan which employs a
top-down, greedy search through the space of possible branches with no backtracking. ID3 uses
Entropy and Information Gain to construct a decision tree.
5.5.1. Entropy
A decision tree is built top-down from a root node and involves partitioning the data into
subsets that contain instances with similar values (homogenous). ID3 algorithm uses entropy to
calculate the homogeneity of a sample. If the sample is completely homogeneous the entropy is zero
and if the sample is an equally divided it has entropy of one.
Since we are working with ID3 algorithm in order to construct the decision tree, we need to figure
out which attribute to choose, the algorithm has to calculate the entropy. The entropy indicates how
ordered the elements are where an entropy of 1 means totally randomly and 0 means perfectly
classified. With this entropy, the algorithm can calculate the information gain of the attribute, where
the higher the better. After the information gain is calculated for every attribute, the attribute with
the highest information gain will be placed as the root node of the decision tree. Here we have
calculated the entropy first. The formula for calculating is Entropy (Decision) = – p (True) . log2p
(True) – p (False) . log2p (False)
In our example we got 50 instances, out of which 31 are True and 19 are False. Here is the Entropy
calculated:
(3)
Further, we need to find the most dominant factor for decisioning. We have started with the
Metastasis attribute.
Gain(Decision,Metastasis)= Entropy(Decision)–∑[p(Decision|Metastasis).
Entropy(Decision|Metastasis) ] (4)
Metastasis attribute has two labels: 0 indicating absence of metastasis and 1 indicating the presence
of metastasis. We would reflect it to the formula:
Gain(Decision,Metastasis)= Entropy(Decision)–
[p(Decision|Metastasis=Absent).Entropy(Decision|Metastasis=Absent)] –
[p(Decision|Metastasis=Present) .Entropy(Decision|Metasis=Present) ] (5)
Now, we need to calculate (Decision|Metastasis=Absent) and (Decision|Metastasis=Present)
respectively. Here are the results:
Entropy(Decision|Metastasis=Absent)
Entropy Dec=-(11/42)*LOG2(11/42)-(31/42)*LOG2(31/42)= 0.82962
(6)
Entropy(Decision|Metastasis=Present)
Entropy Dec=-(8/8)*LOG2(8/8)-
(0/8)*LOG2(0/8)=0

Компютърни науки и технологии 1 2019 Computer Science and Technologies 24
We apply this similar calculation on the other columns:
Gain(Decision,Rate-of-Growth)= Entropy(Decision)–∑[p(Decision|Rate-of-Growth).
Entropy(Decision|Rate-of-Growth) ] (7)
This attribute has also two labels: 0 indicating slow rate of growth and 1 indicating rapid rate of
growth. We would reflect it to the formula:
Gain(Decision,Rate-of-Growth)= Entropy(Decision)–[p(Decision|Rate-of-
Growth=Slow).Entropy(Decision|Rate-of-Growth=Slow)] –[p(Decision|Rate-of-Growth=Rapid)
Entropy(Decision|Rate-of-Growth=Rapid) ] (8)
Entropy(Decision|Rate of Growth=Slow)
Entropy Dec=-(7/38)*log2(7/38)-(31/38)*log2(31/38)= 0.20994
Entropy Dec=-(12/12)*log2(12/12)-(0/12)*log2(0/12)=0
Gain(Uniformity-of-CellSize)= Entropy(Decision)–∑[p(Decision|
Uniformity-of-Cell-Size). Entropy(Decision| Uniformity-of-Cell-Size) ] (9)
Two labels: 0 indicating size of a mass less than 2cm, and 1 indicating a size of a mass equal or
larger than 2cm. We reflect it to the formula:
Gain(Decision,Uniformity-of-Cell-Size)= Entropy(Decision)–[p(Decision| Uniformity-of-Cell-
Size<2cm).Entropy(Decision|Uniformity-of-Cell-Size<2cm)] –[p(Decision|Uniformity-of-Cell-
Size=>2cm).Entropy(Decision|Uniformity-of-Cell-Size=>2cm)] (10)
Entropy (Decision|Cell Size<2cm)
Entropy Dec=-(8/40)*log2(8/40)-(31/40)*log2(31/40)=0.17939
Entropy (Decision|Cell Size=>2cm)
Entropy Dec=-(10/10)*log2(10/10)-(0/10)*log2(0/10)=0
Gain(Uniformity-of-Cell-Shape)= Entropy(Decision)–∑[p(Decision|Uniformity-of-Cell-Shape).
Entropy(Decision| Uniformity-of-Cell-Shape) ] (11)
Two labels: 0 indicating regular shape of cells and 1 indicating irregular shale of cells. We
would reflect it to the formula:
Gain(Decision,Uniformity-of-Cell-Shape)= Entropy(Decision)–[p(Decision| Uniformity-of-Cell-
Shape=Regular).Entropy(Decision|Uniformity-of-Cell-Shape=Regular)] –
[p(Decision|UniformityofCellShape=Irregular).Entropy(Decision|Uniformity-of-Cell-
Shape=Irregular)] (12)
Entropy (Decision|Cell Shape=Irregular)
Entropy Dec=-(13/13)*log2(13/13)-(0/13)*log2(0/13)=0
Entropy (Decision|Cell Shape=Regular)
Entropy Dec=-(6/37)*log2(6/37)-(31/37)*log2(31/37)=0.085757 (13)
Entropy(Decision|Rate of Growth=Rapid)

Компютърни науки и технологии 1 2019 Computer Science and Technologies 25
Table 2. Metastasis, Cell shape, Cell size, Rate of growth
Now we compare results and as seen, metastasis factor on decision produces the highest
score. That‘s why, metastasis decision will appear in the root node of the tree. We implement the
similar steps for the sub nodes. We get to the following decision tree:
Fig. 7. Decision tree using ID3, implementing our testing, formula and calculations to build this Decision
Tree and depict our research. As attribute with the greatest dominant factor for decisioning- Metastasis, we
create the root node. Dividing the sub nodes procedure is similar to the previous and result is as presented
above
6. Conclusion
We make different kind of decisions every day. Our brain takes in account each possible
outcome before we do something. Decision tree algorithms work in this similar way. Calculating
every possibility, entropies, gains. In our discussion we have shown a very simple example how
would data classification and organization of data can help medicine improve people‘s health and
life using simple data tree. Breast cancer becomes top one ―killer‖ nowadays. What is even more
terrifying the age target that is concerned with this merciless sickness each year decreases and the
population that fights with it is even younger and younger. From the statistics that we have looked
at, every year the number of patients with breast cancer diagnosis is rising. This is my chance to

Компютърни науки и технологии 1 2019 Computer Science and Technologies 26
aware all the women out there to take control of their health and do mammography and echo
examinations regularly because in cases with cancer the stage we discover the malignant mass is
very important to continue one‘s life. The earliest we find this silent killer the bigger are the rates to
survive.
7. Future Work
We are very determined to keep up doing this work and find different ways of implementing
data classification and decision tree algorithms further and contribute into saving women‘s lives.
Our future work would include implementing this work into algorithms and make additional
software solutions that would be using more attributes and get more precise results that prevents
growth of malignant cells. This work included pretty much simple data and calculations. We would
expand data in the future work and implement attributes such as hormone receptors (ER, PR) и
HER2 статусот (HER2 - Human Epidermal growth factor Receptor 2), and brca1 and brca2, breast
cancer gene examination.
Furthermore, we plan to implement deep learning knowledge and to use security methods, do
an implementation of the deep learning results and do evaluation referring to the gained feedback.
Acknowledgement
The acknowledgement for the medical research issues of this work goes to the hospital JZU
―Dr. Svetozar Cocoroski‖ in Vevchani, to Medical Doctor Zharko Daskaloski, a specialist in
Radiology who contributes in women health and does examination on about 2000 patients yearly.
Dr. Daskaloski domain of work is mostly in the west of Macedonia, Vevchani, Struga, Ohrid,
Kichevo, Debar, Resen and also with patients from Albania, referring a mammography or echo. It
also goes to Miss Jana Radinoska, who has great interest in imlementing Data Classification
methods and helped out in this research.
References
[1]. International Journal of Computer Applications (0975 – 8887) Volume 98– No.10, July 2014.
[2]. International Journal of Current Pharmaceutical Research ISSN- 0975-7066 Vol 9, Issue 2,
2017.
[3]. Published at: https://www.researchgate.net/publication/267636320 Cancer diagnosis using data
mining technology Article in Life Science Journal · September 2012 author: Dr Syed Athar
Masoo
[4]. International Journal of Computer Science, Engineering and Information Technology
(IJCSEIT), Vol.2, No.2, April 2012.
[5]. Jaimini Majali et al, / (IJCSIT) International Journal of Computer Science and Information
Technologies, Vol. 5 (5), 2014, 6487-6490: Data Mining Techniques For Diagnosis And
Prognosis Of Breast Cancer.
[6]. Data Mining:Concepts and Techniques Second Edition Jiawei Han and Micheline Kamber
University of Illinois at Urbana-Champaign, 2006.
[7]. Data Mining Concepts and Techniques Third Edition Jiawei Han University of Illinois at
Urbana–Champaign Micheline Kamber Jian Pei Simon Fraser University, 2012.
[8]. http://dataaspirant.com/2017/01/30/how-decision-tree-algorithm-works/
[9]. Abbas Rizvi,CS157 B, Spring 2010.
[10]. L.Surya Prasanthi et al, / (IJCSIT) International Journal of Computer Science and Information
Technologies, Vol. 6 (6), 2015, 5353-5357.
[11]. Ruijuan Hu,(2011),‘ Medical Data Mining Based on Decision Tree Algorithm‘, Computer and
Information Science,Vol. 4, No. 5; September 2011, www.ccsenet.org/cis.

Компютърни науки и технологии 1 2019 Computer Science and Technologies 27
[12]. Kantardzic M. (2002). Data Mining Concept, Models, Methods and Algorithms. IEEE Press.

Компютърни науки и технологии 1 2019 Computer Science and Technologies 28
DESIGN OPTIMIZATION OF 200 AMPS BOOSTER
TRANSFORMER BASED ON DIFFERENTIAL EVOLUTION
ALGORITHM
Rasim Salkoski, Ile Dimitrievski
Abstract: The optimization techniques used in the design of the booster transformer result in saving of
supply electric energy for the railway power supply systems. The feed arrangement is single-phase and only
has one feed (reference bus). The loads are electric locomotives, can move along the rail tracks and
locomotives can be added into the system or be removed from the system at any instance. Special interest is
given to the minimization of production and exploitation costs of the booster transformer. The booster
transformer is connected to the catenary and rail, and consist of a transformer with equal number of turns on
each winding. The optimization algorithm based on Differential Evolution is applied to the problem of
minimizing the cost of the active parts of the booster transformer. All constraints are normalized and
modeled as inequalities.
Keywords: Booster Transformer, Evolutionary algorithms, Optimization techniques, Railway, Differential
Evolution Algorithm
1. Introduction
Since high performance computers have been developed, within a matter of minutes or even
seconds, computers can generate a number of different booster transformer designs (by changing
current density, flux density, core dimensions, type of magnetic material and so on) and eventually
come up with an optimal design. The difficulty in resolving the optimum balance between the cost
of booster transformer and its performance is becoming even more complicated nowadays, as the
main materials to produce (copper or aluminum for transformer windings and steel for magnetic
circuit) are stock exchange commodities and their prices vary daily. Techniques that include
mathematical models containing analytical formulas, based on design constants and approximations
for the calculation of the booster transformer parameters are often the base of the design process
used by manufacturers. Evolutionary algorithms and all their variants have been extensively used
for solving combinatorial optimization problems. One area of great importance that can benefit
from the effectiveness of such algorithms is AC railway power supply systems. The work in this
paper introduces the use of an evolutionary algorithm, titled Differential Evolution (DE) in
conjunction with the penalty function approach to minimize the booster transformer cost while
meeting international standards and customer needs. A simple additive penalty function approach is
used in order to convert the constrained problem into an unconstrained problem. Due to this
conversion, the solution falling outside the feasible region is penalized and the solving process is
guided to fall into the feasible solution space after a few generations. The method of penalty
function approach is very sensitive when the penalty parameters are large. Penalty functions tend to
be very sensitive near the boundary of the feasible domain and that result in a local optimal solution
or an infeasible solution. It is always necessary to have careful selection of the penalty parameters
for the proper convergence to a feasible optimal solution.
The method is applied to the design of a booster transformer and the results are compared
with a heuristic transformer design optimization methodology, resulting in significant cost savings.

Компютърни науки и технологии 1 2019 Computer Science and Technologies 29
2. Related work
In this paper the Penalty Function method is implemented to handle the constraint using the
Differential Evolution (DE) algorithm. Other authors have proposed different approaches to solve
constrained optimization with DE-based algorithms.
B. V. Babu and M. Mathew Leenus Jehan in [7] have applied Differential Evolution with a
Penalty Function Method and Weighting Factor Method for finding a Pareto optimum set for the
different problems. DE is found to be robust and faster in optimization. DE managed to give the
exact optimum value within less generations compared to a simple Genetic Algorithm. Mezura-
Montes and Coello Coello in [11] present a Differential-Evolution based approach to solve
constrained optimization problems. Three selection criteria based on feasibility are used to deal with
the constraints of the problem and also a diversity mechanism is added to maintain infeasible
solutions located in promising areas of the search space. The conventional DE algorithm highly
depends on the chosen trial vector generation strategy and associated parameter values used. DE
researchers have suggested many empirical guides for choosing trial vector generation.
Storn and Price [10] suggested that a reasonable value for NP should be between 5D and 10D,
and a good initial choice of F was 0.5. The effective range of F values was suggested between 0.4
and 1. The first reasonable attempt of choosing CR value can be 0.1. However, because the large
CR value can speed up convergence, the value of 0.9 for CR may also be a good initial choice if the
problem is near unimodal or fast convergence is desired. Moreover, if the population converges
prematurely, either F or NP can be increased.
Recently, Rönkkönen in [13] suggested using F values between [0.4,0.95] with 0.9 being a
good initial choice. The CR values should lie in [0,0.2] when the function is separable while in
[0.9,1] when the function‘s parameters are dependent. However, when solving a real engineering
problem, the characteristics of the problem are usually unknown. Hence, it is difficult to choose the
appropriate CR value in advance.
The researchers have developed some techniques to avoid manual tuning of the control
parameters. For example, linearly reduced the scaling factor F with increasing generation count
from a maximum to a minimum value, or randomly varied F in the range (0.5,1). They also have
employed a uniform distribution between 0.5 and 1.5 (with a mean value of 1) to obtain a new
hybrid DE variant.
3. The Differential Evolution (DE) Algorithm
Differential Evolution (DE) algorithm is a population-based stochastic method for global
optimization developed by Rainer Storn and Kenneth Price [10] for optimization problems over
continuous domains. The original version of DE with constituents can be defined as follows : This
template was designed for two affiliations.
1) The population
,g i ,g max
i,g j ,i ,g
P , i 0,1,.....,NP, g 0,1,.....,g
x , j 0,1,.....,D 1.
x x
x (1)
where NP is the number of population vectors, g defines the generation counter, and D the number of
parameters.
2) The initialization of the population through
j j ,U j ,L j ,Lj ,i ,0x rand 0,1 b b b . (2)

Компютърни науки и технологии 1 2019 Computer Science and Technologies 30
The D-dimensional initialization vectors, bL and bU indicate the lower and upper bounds of the
parameter vectors xi,j. The random number generator, randj[0,1), re-turns a uniformly distributed
random number from within the range [0,1), i.e., 0 ≤ randj[0,1) < 1. Indication that a new random
value is generated for each parameter is denoted by the subscript j. This template was designed for
two affiliations.
3) The pertubation of a base vector yi,g by using a difference vector mutation
i ,g i,g r1,g r2,gF . v y x x (3)
to generate mutation vector vi,g . The difference vector indices, r1 and r2, are randomly selected once
per base vector. Setting yi,g = xr0,g defines what is often called classic DE where the base vector is
also a randomly chosen population vector. The random indexes r0, r1, and r2 should be mutually
exclusive. This template was designed for two affiliations.
4) Diversity enhancement The classic variant of diversity enhancement is crossover which mixes parameters of the
mutation vector vi,g and the so-called target vector xi,g in order to generate the trial vector ui,g. The
most common form of crossover is uniform and is defined as
(4)
In order to prevent the case ui,g = xi,g at least one component is taken from the mutation vector
vi,g, a detail that is not expressed in (4). This template was designed for two affiliations.
5) Selection DE uses simple one-to-one survivor selection where the trial vector ui,g competes against the
target vector xi,g. The vector with the lowest objective function value survives into the next
generation g + 1.
(5)
Along with the DE algorithm came a notation (5) to classify the various DE-variants. The
notation is defined by DE/x/y/z where x denotes the base vector, y denotes the number of difference
vectors used, and z representing the crossover method. For ex-ample, DE/rand/1/bin is the
shorthand notation for (1) through (5) with yi,g = xr0,g. DE/best/1/bin is the same except for yi,g =
xbest,g. In this case xbest,g represents the vector with the lowest objective function value evaluated so
far.
With today‘s extensions of DE the shorthand notation DE/x/y/z is not sufficient any more, but
a more appropriate notation has not been defined yet.
Price and Storn [10] gave the working principle of DE with single strategy. They suggested
ten different strategies for DE. Different strategies can be adopted in the DE algorithm depending
upon the type of problem to which DE is applied. The strategies can vary based on the vector to be
perturbed, number of difference vectors considered for perturbation, and finally the type of
crossover used. The following are the ten different working strategies: 1. DE/best/1/exp, 2.
DE/rand/1/exp, 3. DE/rand-to-best/1/exp, 4. DE/best/2/exp, 5. DE/rand/2/exp, 6. DE/best/1/bin, 7.
DE/rand/1/bin, 8. DE/rand-to-best/1/bin, 9. DE/best/2/bin, 10. DE/rand/2/bin.
As it is explained the general convention used above is DE/x/y/z. DE stands for Differential
Evolution, x represents a string denoting the vector to be perturbed, y is the number of difference
vectors considered for perturbation of x, and z stands for the type of crossover being used (exp:
exponential; bin: binomial). Hence the perturbation can be either in the best vector of the previous
j ,i ,g j
i ,g j ,i ,g
j ,i ,g
v if rand 0,1 CRu
x otherwise
u
i ,g i ,g i ,g
i ,g 1
i ,g
if f f
otherwise .
u u xx
x

Компютърни науки и технологии 1 2019 Computer Science and Technologies 31
generation or in any randomly chosen vector. Similarly for perturbation either single or two vector
differences can be used. For perturbation with a single vector difference, out of the three distinct
randomly chosen vectors, the weighted vector differential of any two vectors is added to the third
one. In exponential crossover, the crossover is performed on the D variables in one loop until it is
within the CR bound. The first time a randomly picked number between 0 and 1 goes beyond the
CR value, no crossover is performed and the remaining D variables are left intact. In binomial
crossover, the crossover is performed on each of the D variables whenever a randomly picked
number between 0 and 1 is within the CR value. So for high values of CR, the exponential and
binomial crossover methods yield similar results.
A strategy that works out to be the best for a given problem may not work well when applied
to a different problem. Also, the strategy and the key parameters to be adopted for a problem are to
be determined by trial and error. However, strategy-7 (DE/rand/1/bin) appears to be the most
successful and the most widely used strategy. In all, three factors control evolution under DE, the
population size NP, the weight applied to the random differential F and the crossover constant CR.
4. Booster Transformer
The booster transformer is connected to the catenary and rail as in Fig.1. It consist of a
transformer with equal number of turns on each winding, forcing the current through the catenary
and the return circuit to be equal. The main purpose of the Booster Transformer-system is to
minimize the leakage current through the ground.
In countries or areas where earth resistivity is high, booster transformers are used to make
sure that the same current level that passes through the contact line also goes back through the
return conductor. This is done in order to reduce the rail potential and disturbances to
telecommunication systems and other electrical equipment. In some parts of the world, booster
transformers are not needed.
Fig. 1. Overhead catenary booster transformer feeding configuration
4. Mathematical Modelling and Optimization of Booster Transformer for Single-Phase AC
Railway Feeding Systems
A mathematical description of a global constrained minimization problem requires us to apply
an appropriate model which has limited number of parameters (design variables). Any kind of

Компютърни науки и технологии 1 2019 Computer Science and Technologies 32
optimization problem can be formalized to find the appropriate set of design variables in the
multidimensional parameter space, which can optimize the main objective function. In the
mathematical notation the optimization problem can generally be represented as a pair (S, f ), where
S ⊆ Rn is a bounded set on R
n and f : S → R is an n-dimensional real-valued function. The problem
is to find a point xmin ∈ S such that f (xmin) is a global minimum on S. More specifically, it is
required to find an xmin ∈ S such that
∀ x ∈ S : f (xmin ) ≤ f (x) (6)
gi(x) ≤ 0, i = 1, 2, • • • , q (7)
hj(x) = 0, j = q + 1, • • • , m (8)
where x = [x1, x2, • • • , xn]T is the vector of unknown quantities, gi(x) and hj(x) are the restriction
constraints, which can be represented mathematically as equations and/or inequations, m and q are
integer numbers. Generally, for each variable xi it satisfies a constrained boundary
li ≤ xi ≤ ui, i = 1, 2, • • • , n (9)
In order to find the global optimum design of an arc suppression coil, DE in conjunction with
the penalty function approach technique is used. The goal of the proposed optimization method is to
find a set of integer variables linked to a set of continuous variables that minimize the objective
function (active part cost) and meet the restrictions imposed on the booster transformer. Under these
definitions, a DE algorithm in conjunction with the penalty function approach is focused on the
minimization of the cost of the booster transformer:
2
j j
j 1
min c f
x
x (10)
where c1 is the winding unit cost (€/kg), f1 is the winding weight (kg), c2 is the magnetic material
unit cost (€/kg), f2 is the magnetic material weight (kg), and x is the vector of the five design
variables, namely the width winding (a), the diameter of core leg (D), the winding height (b), the
current density of winding (g) and the magnetic flux density (B).
The minimization of the cost of the booster transformer is subject to the constraints:
S – SN 0; PCU - PCUN 0; PFE - PFEN 0; ZTOT -ZTOTN 0
where: S is designed booster transformer rating (kVA), SN is booster transformer nominal rating
(kVA), PFE is designed no-load losses (W), PCU is designed load losses (W), ZTOT is designed
impedance of booster transformer secondary side (Ohms), PFEN is guaranteed no-load losses (W),
PCUN is guaranteed load losses (W) and ZTOTN is guaranteed impedance of booster transformer
secondary side (Ohms).
It should be noted that functions f1, f2, appearing in the objective function (10) are composite
functions of the design variables x, e.g., f1 = f1(g1(h1(x))) the booster transformer design
optimization problem is a hard problem in terms of both modeling and solving.
The single objective Differential Evolution optimization algorithm with penalty function
approach has been applied. Accordingly, the objective function for the model is:
4 5 3 25 52 3 3 2
3 5 6 452 2 3 3
f x ,x ,x 2.10 10 x 1.60 10 x 2.04 10 x
1.38 x 5.10 10 x 1.20 10 x 1.22 10 x x
(11)

Компютърни науки и технологии 1 2019 Computer Science and Technologies 33
Fig. 2. Active part of a booster transformer – main dimensions
The inequality constraints should be modified to the less or equal format, g(x) ≤ 0. The
constraints of the analyzed mathematical model are entered as follows: Constraint 12 match to
booster transformer nominal rating, Constraint 13 match to guaranteed load losses, Constraint 14
match to guaranteed no-load losses and Constraint 15 guaranteed impedance of booster transformer
secondary side. Constants in front of decision variables have been taken from the Fig.2 and
reference [3].
2 34 51 2 3
208.6 x x x x x 10 253 0 (12)
7 7 9 24 52 3 3
2.12 10 x 4.06 10 x 4.53 10 x x x 2150 0
(13)
21 1
4 5 3 2 35 3 2 2
0.30 x 0.85 x 0.04
2.57 10 x 1.6 10 x 2.04 10 x 1.33 x 0.25 95 0
(14)
2 42 2 3 3 3
243 1 2
0.02 x 0.01 x x 0.04 x 1.13 x 1.4 10 208.6
0.012 x x x x 0.09 0/
(15)
These values are multiplied by a penalty co-efficient, which is then added to the objective
function to continue the process of optimization. This process is often termed as penalty function
approach.

Компютърни науки и технологии 1 2019 Computer Science and Technologies 34
Table 1 The optimal value of decision variables.
Parameter Value
X1
X2
X3
X4
X5
0.210110
0.246452
0.017270
2.560860
0.620250
Table 2 Comparative results of two methodologies
B g D a b
Cost of
Active part
DE Algorithm 0.21 2.56 246 17 620 3685
Lagrange with
New.Rap.[10] 0.23 2.78 248 18 610 3982
The parameters X1, X2, X3, X4, X5 match respectively to the magnetic flux density (B), the
diameter of core leg (D), the width of secondary winding (a), the current density of secondary
winding (g) and the core window height (b).
5. Conclusion
This paper presents an efficient implementation of the Differential Evolution algorithm with a
penalty function approach, applied to designing 200 Amps Booster Transformer. The booster
transformers essentially operate as a 1:1 ratio current transformers and are installed at
approximately 2.5-3.5 km intervals along overhead electrified lines. These transformers are used in
catenary systems in England, Sweden, Korea, India and others. The booster transformers are also
used in many other countries such as Norway and Denmark. Our penalty function approach
integrates established techniques in existing EA‘s in a single unique algorithm. Moreover, this
approach is easy to implement and its computational cost is relatively low. The use of the DE
computer program is applied to the analyzed mathematical model. In the first methodology, the
single objective DE optimization showed that single optimum could be obtained quickly, even when
constraints in the penalty function method are complex. Compared with the second methodology in
the same table, the cost of materials for the active part of the reviewed object are lower by
approximately 8 %.
Fig. 3. As built 200 Amps Booster Transformer

Компютърни науки и технологии 1 2019 Computer Science and Technologies 35
References
[1]. R. Salkoski, ―Heuristic algorithm for multicriterial optimization of power objects‖, PhD Thesis,
University‖ SS. Cyril and Methodius‖ FEIT, Skopje, R. Macedonia (2018)
[2]. R. Salkoski, I. Chorbev.: Design optimization of distribution transformers based on Differential
Evolution Algorithms, ICT Innovations2012 Web Proceedings ISSN 1857-7288, page 35-
44.September 2012, Ohrid
[3]. R. Salkoski.: Selection of an optimal variant of 3-phase transformers with round and rectangular
section of the magnetic core from aspect of minimum production costs. Master Thesis,
Electrotechnical University in Skopje (2000).
[4]. A.Vasan,―Optimization Using Differential Evolution.‖ Water Resources Re-search Report.
Book 22. Department of Civil and Environmental Engineering, The University of Western
Ontario, Publication Date 7-2008.
[5]. A.Zamuda, J.Brest, B.Bošković, V.Žumer,―Differential Evolution with Self-adaptation and
Local Search for Constrained Multi-objective Optimization,‖ IEEE Congress on Evolutionary
Computation (CEC), pp. 195-202 (2009)
[6]. DE Homepage, http://www.icsi.berkeley.edu/~storn/code.html
[7]. B.V. Babu, M. Mathew, L. Jehan .: Differential Evolution for MultiObjective Optimization.
Chemical Enginering Department B.I.T.S. Pilani, India (2005).
[8]. Onwubolu, G. C., and Babu, B. V.: New Optimization Techniques in Engineering, Springer-
Verlag, Germany (2004).
[9]. P.V. Kenneth., S.M. Rainer.: Differential evolution - A simple evolution strategy for fast
optimization. Dr. Dobb's Journal, 22, 18-24 and 78. (1997).
[10]. P.V. Kenneth., S.M. Rainer., L.A. Jouni: Differential evolution: A practical approach to
global optimization. Springer-Verlag, Berlin, Heidelberg (2005).
[11]. Mezura and Montes: E. Laboratorio NI Avanzada, Rébsamen 80, Centro, Xalapa, Veracruz
91090, Mexico, Velazquez-Reyes, J., Coello Coello, C.A.: Modified Differential Evolution for
Constrained Optimization, pp 25 – 32, Conference Publications, Evolutionary Computation,
CEC 2006 (2006).
[12]. U.K. Chakraborty (Ed.).: Advances in Differential Evolution, Mathematics & Computer
Science Department, University of Missouri, St.Louis, USA, Springer-Verlag Berlin
Heidelberg (2008).
[13]. J. Rönkkönen, S., Kukkonen, K. V. Price.: Real-parameter optimization with differential
evolution. Proc. IEEE Congr. Evolut. Comput. Sep. 2005, pp. 506–513, Edinburgh, Scotland
(2005).
For contacts:
Teaching Assistant, PhD, Raism Salkoski
Faculty of Applied Machine Intelegence and Robotics
University of Information Science and Technology St. Paul the Apostle
E-mail: [email protected]

Компютърни науки и технологии 1 2019 Computer Science and Technologies 36
PERFORMANCE COMPARISON OF C++ AND JAVASCRIPT
(NODE.JS – V8 ENGINE)
Kristijan Stefanoski, Aleksandar Karadimche, Ile Dimitrievski
Abstract: The computational performance of programming languages has been a developer‘s challenge for a
long time. In this research paper, we propose a performance comparison of C++ and JavaScript. On one side
we have the well-known and proven procedural programming language C++ that is still used today. On the
other side is the interactive JavaScript, typical for browser engines that offer just-in-time compilation for
improved performance. The main objective of the comparison was to use common searching and sorting
algorithms for data arrays. Both programming languages have their own advantages and disadvantages since
C++ and JavaScript are mostly used for different kinds of programming, and rarely overlapping.
Keywords: computational performance, JavaScript, C++, searching and sorting algorithms
1. Introduction
The C++ presents one of the most widespread programming languages since its creation back
in the 20th century and even today. It serves not just for a single purpose but various purposes in the
programming world.
On the other hand, the Web Technologies and web programming languages that mainly run in
the browser, like JavaScript are often treated as slower in regards to languages that interact much
easier with the machine. In order JavaScript to run in the browser various engines are used that
firstly were interpreters, but today nearly all of the engines offer just-in-time compilation for
improved performance. JavaScript engines are developed by web browser vendors and nearly every
major browser has one. Chrome V8 is an open-source JavaScript engine developed by The
Chromium Project for Google Chrome and Chromium browsers. It is treated as a high-
performance JavaScript engine and is written in C++.
Another breaking point for the JavaScript world was the creation of the Node.js run-time
environment that allowed programmers to run JavaScript code on the server, outside of the browser.
Node.js also uses V8 engine that parses and runs the written JavaScript code, thus all code
comparisons bellow will be between JavaScript (Node.js) and C++.
Since C++ is categorized as one of the most powerful programming languages of our time, the
major focus of this research is to provide in-depth comparison while executing various similar tasks
on similar data-types in both C++ and JavaScript. All data presented in this research, the time
needed for various tasks, the time difference is presented in seconds/milliseconds.
―High level abstraction has acted as a catalyst for Javascript‘s wide adoption but at the cost of
a severe performance penalty. Re-cent studies show that Javascript implementations can be up to
50x slower than corresponding C/C++ implementations [2]. This per-formance gap is mainly due to
bytecode interpretation of dynam-ically typed Javascript code as opposed to native code generation
for statically typed languages C/C++. As Javascript applications become more complex in the
future, this performance gap is expected to further increase [2].‖
So the above paragraph is also a reference to the performance gap that we can expect when
using JavaScript, against a language like C++, which is correct as the complexity of the program
increases although on a task that is not that processing power demanding the performance of
JavaScript would be sufficient to handle most of the tasks in time.
Because Node is mostly used for web applications, the following paragraph is comparison of
Node to Java, and similarly it leads to a conclusion that Node is suitable for IO Heavy web
applications.

Компютърни науки и технологии 1 2019 Computer Science and Technologies 37
―Web Applications do a lot of IO. First, a request is received from the browser; that‘s IO.
Second, the application typically fetches the requested data from a database; that‘s IO. Once it has
all the response data computed, it then sends it back to the browser; that‘s IO. All the while, the
application is probably maintaining an application log, and that‘s IO too. Web applications, in fact,
spend most of their time doing IO, not computation.
If servicing each request were a race between the two technologies, every time more IO is
performed, Node would win a little bit more. What this amounts to is that Node is incredibly well
suited for web applications.‖[1]
As we know Node.js has a non blocking IO, which is the reason why it will can out-perform
some of the blocking IO languages, unless the logic is handled differently in that language or
Node.js code is written in such a way to loose the power of non-blocking IO and make it a blocking
one.
This research is structured in this sections, inserting data in dynamic arrays, applying
common searching algorithms on small and large data, applying common sorting algorithms on
small and large data, Radix Sort and conclusion and discussion
2. Inserting data in dynamic arrays
As other scripting languages JavaScript also has dynamic arrays, their size is not predefined,
and the type of data too.
Also in JavaScript, the Array type is defined as an object meaning it is not a true contiguous-
memory array, which ultimately might lead to some lack in performance while inserting or deleting
data.
On the other hand in C++ Vector would be the JavaScript equivalent, since they are same as
dynamic arrays with the ability to resize itself automatically.
Bellow follows the comparison while inserting different amount of data in Array and Vector
and the time needed for the operations to complete in both situations.
1. Inserting 1.000.000 integer elements in Array and Vector
In Node.js inserting 1.000.000 integers with the following code:
let array = []; for(let i = 0; i<1000000; i++){
array.push(i); }
And logging the time before the begging of the insertion and after it leading to the following
result:
14:21:5:254 - Before
14:21:5:276 – After
Ultimately leading to a difference of 22ms.
In C++ performing the same operation on Vector with the following code:
vector<int> v1;
for(int i=0;i<1000000;i++){
v1.push_back(i);
}
Logging the time before and after:
14:28:47:448 - Before
14:28:47:463 - After

Компютърни науки и технологии 1 2019 Computer Science and Technologies 38
Which leaves us with a difference of 15ms, or 7ms faster computation time than JavaScript.
Boosting the amount of integers to 3 million resulted in a 54ms difference in Node compared
to the 49ms in C++.
Bellow follows a Figure 1, which shows the comparison of required time to run the certain
operations and the number of entries to be inserted with C++ and JavaScript.
Fig. 1. Comparison required time C++ and JavaScript
After running several more test while an increasing number of elements to be inserted the
conclusion is presented in the above graph. C++ resulted in a slightly faster insertion time, in terms
of milliseconds.
Although not always as can be seen while inserting 20 million entries JavaScript has shown to
be faster even after running the same code several times the results were always the same.
3. Applying common searching algorithms on small and large data
In computer science, a search algorithm is an algorithm which solves the search problem,
namely, to retrieve information stored within some data structure, or calculated in the search space
of a problem domain, either with discrete or continuous values.
3.1. Linear Search
Searching for the value located on index position n/2 in an array of 1 million entries.
C++ code used for linear search
int search(int arr[], int n, int x)
{
int i;
for (i = 0; i < n; i++)
if (arr[i] == x)
return i;
return -1;
}

Компютърни науки и технологии 1 2019 Computer Science and Technologies 39
And logging the time before the begining of the search and after it leading to the following
result:
21:31:46:196 - Before
21:31:46:197 – After
Leaving a 1ms difference in this case.
The function used with Node.js :
function linearSearch(array, toFind){
for(let i = 0; i < array.length; i++){
if(array[i] === toFind) return i;
}
return -1;
}
Results from the execution:
Before : 21:34:36:605
After : 21:34:36:608
Which means a 3ms difference or 2ms more running time than the same C++ code.
Bellow the Figure 2, presens the results when increasing the number of elements higher than 1
million integer entries and always looking for the mid-placed value.
Fig. 2. Performance comparison of searching algortims C++ and javaScript
4. Applying common sorting algorithms on small and large data
A Sorting Algorithm is used to rearrange a given array or list elements according to a
comparison operator on the elements. The comparison operator is used to decide the new order of
the element in the respective data structure.

Компютърни науки и технологии 1 2019 Computer Science and Technologies 40
4.1. Selection sort
In computer science, selection sort is a sorting algorithm, specifically an in-place comparison
sort. It has O(n^2) time complexity, making it inefficient on large lists, and generally performs
worse than the similar insertion sort.
All numbers inserted into the arrays for sorting are generated using a randomizing function
for both C++ and Node.js.
A) Testing selection sort on 10.000 entries in C++ with the following code:
void selectionSort(int arr[], int n)
{
int i, j, min_idx;
for (i = 0; i < n-1; i++)
{
min_idx = i;
for (j = i+1; j < n; j++)
if (arr[j] < arr[min_idx])
min_idx = j;
swap(&arr[min_idx], &arr[i]);
}
}
Time results from running the above example:
Before : 21:53:09:861
After : 21:53:09:984
Which leaves us with a 123ms time difference even on 10.000 entries.
B) Testing the same example in Node.js with the code bellow
function selection_sort(A) {
var len = A.length;
for (var i = 0; i < len - 1; i = i + 1) {
var j_min = i;
for (var j = i + 1; j < len; j = j + 1) {
if (A[j] < A[j_min]) {
j_min = j;
} else {}
}
if (j_min !== i) {
swap(A, i, j_min);
} else {}
}
}
The result from testing the Node.js code:
Before: 21:56:40:79
After: 21:56:40:144
Or 65ms difference which is nearly half the time required in C++, leaving to a conclusion that
dynamic JavaScript arrays perform faster when it comes to sorting, compared to standard C++
arrays.

Компютърни науки и технологии 1 2019 Computer Science and Technologies 41
The performance comparison of sorting algortims C++ and JavaScript with different input
sizes can be found bellow.
Fig. 3. Performance comparison of sorting algortims C++ and JavaScript
The performance comparison of sorting algortims C++ and JavaScript ois given in Fugure 3.
Both C++ and Node.js have increasing the number of entries increases the processing time, and that
increase is highly noticed as well, it can go well over 1 minute to process over 1.000.000 random
array entries.
4.2. Radix Sort
In computer science, radix sort is a non-comparative integer sorting algorithm that sorts data
with integer keys by grouping keys by the individual digits which share the same significant
position and value.
Since sorting algorithms running time increases with entries in the array, the starting point for
Radix sort will be placed around 1000 entries at the beginning.
Running a test on 1000 entries in C++ with the following code:
void countSort(int arr[], int n, int exp)
{
int output[n], i, count[10] = {0};
for (i = 0; i < n; i++)
count[(arr[i] / exp) % 10]++;
for (i = 1; i < 10; i++)
count[i] += count[i-1];
for (i = n - 1; i >= 0; i--)
{
output[count[(arr[i] / exp) % 10] - 1] = arr[i];

Компютърни науки и технологии 1 2019 Computer Science and Technologies 42
count[(arr[i] / exp) % 10]--;
}
for (i = 0; i < n; i++)
arr[i] = output[i];
}
void radixsort(int arr[], int n)
{
int exp, m;
m = getMax(arr, n);
// Calling countSort() for digit at (exp)th place in every input.
for (exp = 1; m/exp > 0; exp *= 10)
countSort(arr, n, exp);
}
Because of the small number of entries running the above code required just 1ms in order to
return the results.
While in Node.js the following code has been used to run a test on 1000 entries again which
are randomly generated in both cases.
And the first run with 1000 entries gives worse performance compared to C++, or exactly
11ms runtime.
The above test cases are expanded to more entries as in previous topics, detailed comparison
can be seen in the Figure 4 bellow:
function getMax(arr) {
let max = 0;
for (let num of arr) {
if (max < num.toString().length) {
max = num.toString().length
}
}
return max
}
function getPosition(num, place) {
return Math.floor(Math.abs(num) / Math.pow(10, place)) % 10
}
function radixSort(arr) {
const max = getMax(arr); // length of the max digit in the array
for (let i = 0; i < max; i++) {
let buckets = Array.from({ length: 10 }, () => [])
for (let j = 0; j < arr.length; j++) {
buckets[getPosition(arr[j], i)].push(arr[j]); // pushing into buckets
}
arr = [].concat(...buckets);
}
return arr
}

Компютърни науки и технологии 1 2019 Computer Science and Technologies 43
Fig.4. Detailed comparison of Radix sorting algortim with C++ and JavaScript
5. Conclusion and discussion
In the beginning, the part where we were looking only to insert data in arrays, the difference
was not that noticeable, but as more processing power demanding algorithms are run C++ gives the
expected better result. Also we should take in account that on first place in each of the tests what is
happening is that we need to create the arrays and insert data at the first place before running any
algorithm over that data, so there is slight difference at the first place in the data structure (arrays) in
C++ and Node.js, how the memory is allocated and how fast the insertion if happening (first topic
of this research).
The time is logged by displaying a log when the program first is executed and before it exists,
the time difference is the result of the subtraction between the two logs of the time. In most cases,
the time difference is in milliseconds.
The main reasons why C++ gives better performance are outlined below:
C++ is a compiled language, meaning there is no run-time parsing of source code and
no just in time compilation too.
C++ uses fixed types if a variable is defined to be an integer data type and assigned a
certain value, to achieve that, all that happens is one instruction where to store that
variable in memory.
In JavaScript, on the other hand, a variable is not declared with a fixed data type, it
could be afloat or an integer or a string, and additionally we are not limited to change
the data type and store any other kind later as the program continues with the
workflow. Every assignment has to go through overheads of type checking and
conversion."
“Scripting languages such as JavaScript [3] and Python [4]rely on dynamic typing. A single
operation can handle multiple data types since the variables do not have types when the
programmers write the code and might point to objects of any type. When the code is executed, the
type of the target data is dynamically resolved and an appropriate operation is selected for the type.
For example, if a program accesses a property x of the data, then how to retrieve x from the data
depends on the type of the data and can only be determined at runtime. In contrast, with static
typing (as in C), the type is fixed for each variable when the code is written. The specialized code is
written for different types of data. Dynamic typing simplifies the programming while adding
runtime overhead for resolving the types, which is not required with static typing. Suppose that the
Компютърни науки и технологии 1 2019 Computer Science and Technologies 44
code accesses a property x of some data in a scripting language. The language system resolves the
type of the data, resolves an access method that can locates x for the resolved type, and executes it.
The runtime overhead of resolving the types is the cost of the resolution processes.” [3]
C++ does not make use of ―garbage collection‖, on the other hand, JavaScript at times
stops and must take a look at every reference to allocated memory and check if it is no
longer needed. In C++ the programmer has to do so.
Of course, both languages have advantages and disadvantages, since C++ and JavaScript are
mostly used for different kinds of programming, and rarely overlap. But having JavaScript run in
the browser and on the server gives a lot of space for developers that now can develop a full-stack
application using the same language front and back end.
References:
[1]. Jenson, J. ―Performance Comparison: Java vs Node‖,
available online https://www.tandemseven.com/blog/performance-java-vs-node/ [accessed
26.08.2019]
[2]. Mehrara, M., Hsu, P.C., Samadi, M., Mahlke, S.: Dynamic Parallelization of JavaScript
Applications Using an Ultra-lightweight Speculation Mechanism. In: Proceedings of the 17th
IEEE International Symposium on High Performance Computer Architecture, HPCA 2011, pp.
87–98 (2011).
[3]. Ogasawara, T. "Workload characterization of server-side JavaScript," 2014 IEEE International
Symposium on Workload Characterization (IISWC), Raleigh, NC, 2014, pp. 13-21. doi:
10.1109/IISWC.2014.6983035.
[4]. Tiwari D. and Solihin, Y. "Architectural characterization and similarity analysis of sunspider
and Google's V8 Javascript benchmarks," 2012 IEEE International Symposium on Performance
Analysis of Systems & Software, New Brunswick, NJ, 2012, pp. 221-232. doi:
10.1109/ISPASS.2012.6189228.
For contacts:
Student, Kristijan, Stefanoski
Faculty of Computer Science and Engineering
University of Information Science and Technology "St. Paul the Apostle" - Ohrid
E-mail: [email protected]
Research Associate, Aleksandar, Karadimche, PhD
Faculty of Computer Science and Engineering
University of Information Science and Technology "St. Paul the Apostle" - Ohrid
E-mail:[email protected]
Asistant, Ilie Dimitrievski, PhD
University of Information Science and Technology "St. Paul the Apostle" - Ohrid
E-mail: [email protected]

Компютърни науки и технологии 1 2019 Computer Science and Technologies 45
INCREASING THE EFFICIENCY THROUGH THE
DIGITALIZATION OF GOVERNMENT SERVICES
Jovanka Damoska Sekuloska
Abstract: Application of Information and communication technologies (ICT) is a permanent process
happening in any area of society. E-government as a new approach in the process of delivering the public
services should simplify communication and increase availability to the users on the one hand, and on the
other reduces the time and costs for provision and consumption of the services. The digitalization of public
services is essential process aimed to follow the trends of information society growth, but also to offer better
and more efficient services to citizens and companies. Digitalization of the public services as an investment
is associated with high costs for implementation and maintenance of the digital systems, so the paper's
purpose is to analyze the cost and benefits to the citizens and government. Using cost-benefit analysis the
paper examines the cost-efficiency and justification of introducing e-services.
Keywords: e-government, public services, digitalization, cost-benefit analysis
1. Introduction
Digitalization of the public services is a continuous process resulted from the development of
Information and Communication Technologies (ICTs) on the one hand and the existence of citizen-
oriented government policies aimed at enabling and distributing transparent, inexpensive, accessible
and inclusive e-services. In such circumstances, digital technologies play a vital role in delivering
services, previously unavailable or inaccessible to a huge portion of citizens. According to the UN,
the digital government has steered to significant and enduring changes in the way people live and
interact with each other, their environment and public services. The UN Survey 2018 highlights a
persistent positive global trend towards higher levels of e-government development. The Survey
found out countries score ―Very- High‖ with EGDI1 values in the range of 0.75 to 1.00, as compared
to only 10 countries in 2003 and 29 countries in 2016. [11]
E-government operating as a platform for sustainable development can generate public value
and a range of people-centered benefits. According to Turban et al. [10] e-government refers to the
use of information technology in general, and e-commerce, in particular, to improve the delivery of
government services and activities in the public sector, such as: providing citizens with more
convenient access to information and services, and providing effective delivery of government
services to citizens and businesses as well as improving the performance of government employees.
It is also an efficient and effective way for governments to interact with citizens, businesses, and
other entities and to improve governmental business transactions (such as buying and selling goods),
and to operate effectively within the governments themselves.
Digital technologies transform citizens‘ lives, communities, civil society groups and
businesses from passive consumers of data and knowledge to active producers. The increasing use of
digital technologies by institutions has dramatically impacted public services and their delivery,
through Internet websites and portals, mobile and smartphones, social media, and kiosks located in
places accessible to the public [11].
Digital delivery of public services is having a significant impact, as it is much more affordable
for an increasing number of users and more cost-effective for governments than traditional supply
1EGDI refers to E-Government Development Index is a weighted average of normalized scores on the three most
important dimensions of e-government: the scope and quality of online services, the status of the development of
telecommunication infrastructure and the inherent human capital scored through the Human Capital Index (HCI)

Компютърни науки и технологии 1 2019 Computer Science and Technologies 46
channels. Digital technologies enable more targeted, personalized and up-to-date service design and
delivery. It provides the service user greater benefits than the sole reliance on traditional service
channels, in terms of access, convenience through 24/7 availability, savings in time and the cost of
travel to physical premises such as offices [11].
Digitalization of the public services is emerging as a catalyst for a sustainable, adaptable and
transparent society. It enhances the effectiveness of the public policies, enhances transparency by
providing access to information, increases the responsibility and provides the ability to check what
the government and public institutions are doing and how well they are doing their job.
The digitalization process is not simple, it implies on implementation of the principles as
effectiveness, inclusiveness, openness, trust, and responsibility. It should not be ignored that the
process of digitalization consists of cost and benefits at the same time. Due to this, it is very
important for any digitalization project to be supported by financial evaluation. Therefore, the
following section of the paper will be presented some theoretical aspects referring to the models and
tools for evaluation. The central point in the paper presents the application of the cost-benefit model
in assessing justification and efficiency of the digitalization through the case of the public service -
Calculation and payment of the fee for a temporary stay of tourists by the local self-government. The
final section contains the conclusions of the analysis and suggestions for further research.
2. Literature review
The use of ICT and e-Government as a new approach aims to increase the efficiency and
effectiveness of public sector service delivery, or modernizing or even transforming public
administration and society [8]. The process of launching and implementation of e-government is
followed by the necessity of evaluation and measurement models as tools in examining the
efficiency and economic justification of the digitalization of the public services. Different methods
have been proposed in the evaluation of the e-government projects. Referring to the measurement
used in the process of evaluation [7] have made classification on hard measurement and soft
measurement.
Hard measurements are quantifiable and many authors used them constructing financial
models in the process of e-government evaluation. Soft measurements could be used only as an
additional measurement in the evaluation of an e-government project because they cannot be
quantified. The soft measurements are usually ex-post because they are conducted after the
implementation process. For example, the citizen-centric approach relies heavily on citizen
feedback when evaluating the impacts of e-government projects [12]. Other models of evaluation
[1] include multiple indicators approach like: compatibility, relative advantage, complexity,
perceived ease of use, perceived usefulness and trust of the Internet and government.
Financial measures and models are identified as relevant for the evaluation of the e-
government projects. As most useful techniques within the financial models are cost-benefit ratio,
net present value, return on investment and payback period. Kertesz [5] has used a cost-benefit
model in which he identified three basic elements. He suggested that when adopting a new
electronic government project, one had to consider pre-implementation cost, implementation cost,
and operational cost, while balancing them against benefits for governmental agencies, citizens and
customers. Sakowicz [9] paid more attention to the ―return on investment‖ tool. Cost-benefit
analysis is identified as fundamental and crucial in any e-government project [6][2].
Although the financial models are very useful tools in the process of quantification the
tangible benefits of the e-government projects, at the same time these approaches are criticized and
argued exactly for their focus only to direct tangible costs and benefits. Liu and Yuan [4] have
identified three limitations of financial measures. First limitation sources by the basement of the
process of evaluation on the expected costs and benefits. It means that data on benefits, costs, and
discount rates are assumed. Also, the multitude and diversity of benefits and costs for any e-

Компютърни науки и технологии 1 2019 Computer Science and Technologies 47
government project are very hard to be assumed and contribute to the entire complexity of the
process [3]. As a limitation of the financial models is also suggested the issue that not all e-
government projects are aiming at profit maximization [4].
One of the main drawbacks to these financial models is the absence of the so-called multiplier
effect of digital public services to other social, political and economic parties. It means that the side
additional effects in the short or long run period caused by the process of digitalization could not be
measured in the moment of evaluation, because it is very hard to assume and to anticipate them.
According to the World Bank [13], the evaluation of e-government projects estimates the direct
benefits only, although it could arise many indirect benefits, called multiplier impacts.
Against the limitations of the financial models, they are considered as an efficient preliminary
tool in making a decision to launch or not to launch an ICT project. Basically, the cost-benefit
analysis is heavily used by governments to evaluate the desirability of some projects. It is an
analysis of the cost-effectiveness of different alternatives in order to see whether the benefits
outweigh the costs. Thus, it is a useful tool to assess the efficiency of the investment against the
status quo condition.
3. Financial model and analysis
The online distribution of public services is aimed at increasing citizens' satisfaction measured
by transparency, accessibility, and efficiency in their use, by achieving greater effectiveness
measured by reducing the distribution costs to the citizens. Therefore, the implementation of the
process of digitalization of public services should provide a balance between the benefits arising
from the online distribution of public services and the costs incurred in their implementation.
Digitalization projects are associated with high costs for the implementation and maintenance
of digital systems. The introduction of digital public services also highlights the necessity for
effective change management of public service providers. The focus of the e-services is to meet the
needs of the users resulting in a number of benefits. Cost-Benefit Analysis (CBA) is an approach
and tool for an initial assessment of the cost-effectiveness of the public service digitalization
process. The CBA considers the costs and benefits of the public services digitalization projects.
Since the main purpose of the paper is to analyze the efficiency and the economic justification of
the digitalization process, the research examines the profitability through the case of digitalization
of the local self-government service - Calculation and payment of the fee for a temporary stay of
tourists in the Municipality of Ohrid. It is a public fee charging the landlords to pay to the local
government for every night accommodation of the domestic and foreign tourists.
The analysis passes through several phases. Firstly, the analysis identifies the benefits and
costs. The proposed model involves two groups of benefits referring to the landlords (private
individuals) and local self-government, and accordingly two groups of costs bearing from the
digitalization of the service. They are presented in the matrix of the cost and benefits in table 1. In
general, the financial costs of an activity are relatively easy to determine. More difficult is the
estimation of benefits and intangible costs. This is because some benefits and costs of many
activities, especially before the investment takes place, may not be clear.
According to the available official data, within the analysis are suggested and determined the
benefits and costs to the private landlord resulting from the digitalization of the public service -
Calculation and payment of the fee for a temporary stay of tourists. They are recognized as:
Time-saving - for performing the administrative procedures to settle the obligation about
the fee the landlord needs around 1 hour per month. According to the State Statistical
Office, the average gross monthly wage is 600 EUR, meaning the hourly rate of 3.7 EUR
or 44.4 EUR per year.
Costs for transport to the local administration is assumed to be 2 EUR per month or 24
EUR per year.
Costs for paper form are 0.90 EUR monthly.

Компютърни науки и технологии 1 2019 Computer Science and Technologies 48
Costs for a digital certificate - the price of the cheapest digital certificate in the market is
around 14 EUR per year.
Table1. Matrix of the costs and benefits of the digitalization of the public service – Calculation and
payment of the fee for a temporary stay of tourists
Benefits to the landlords Benefits to the local government
BL1: Time-saving BLG1: Labor-saving
BL2: Transport cost saving BLG2: Office supplies saving
BL3: Paper cost saving
Cost to the landlords Costs to the local government
CLL: Costs for procurement of digital certificate CLG1: Procurement of the digital system
(hardware and software)
CLG2: Maintenance and system upgrading
CLG3: Training of the employees
CLG4: System Depreciation
The analysis takes into consideration the benefits and costs of the digitalization process to the
local self-government. They involve:
Cost savings resulting from the employees‘ rationalization. The annual salary savings
would be 21.527 EUR for the reduction of three employees.
Office supplies saving is 500 EUR per year.
Procurement and installation of a digital system (hardware and software). It is an initial
cost. According to the data from the Public Procurement Bureau, the price for such a
system is 50.000 EUR.
Costs for maintaining and upgrading the software. According to the data from the Public
Procurement Bureau, it costs around 5700 EUR per year.
Depreciation costs - calculated according to the accounting standards for 5 years.
Staff training and consultation costs - would be 1500 EUR per year.,
According to the official data of the Ohrid Municipality, the number of the registered
landlords noticed continual growth, reaching 3000 in 2019.
To determine whether the introduction of public service digitalization is a viable option or
not, the difference between benefits and costs within the cost-benefit analysis is discounted at a rate
of 7.25%. This rate is calculated as the sum between the rate of 2.25% of the government securities
since the last auction of the National Bank of the Republic of Macedonia (04.2019) and the
premium risk of 5% for the Macedonian economy in 2019 calculated and issued by the Stern
Business School. Using the net present value (NPV) technique the analysis determines the net worth
of the investment. It means discounting the future annuities (benefits) of the investment by the rate
of 7.25%.
The available data for the costs and benefits enables preliminary determination of the
economic justification and efficiency of the employment of the digitalization of the public service.
Table 2 presents the results of the cost-benefit analysis and net present value for a period of 5 years.
The cost-benefit analysis considers and summarises the benefits and the costs of the ICT
investment to both groups of stakeholders (citizens and local self-government).
Table 2. Cost-benefit analysis and NPV (EUR)
Y0 Y1 Y2 Y3 Y4 Y5 NPV
Costs -50,000 59,200 59,200 59,200 59,200 59,200
765,781
Benefits 0 259,495 259,495 259,495 259,495 259,495
NPV -50,000 200,295 200,295 200,295 200,295 200,295
Total
savings -50,000 150,295 350,590 550,885 751,180 951,475

Компютърни науки и технологии 1 2019 Computer Science and Technologies 49
From table 2, it could be seen that the total benefits outweigh the total costs immediately after
the first year of the implementation. The discounting of the cash flows (differences between costs
and benefits) at the rate of 7.25% indicates on a positive present value of 765.781 EUR, suggesting
that the investment in the digitalization of the public service – Calculation and payment of the fee
for a temporary stay of tourists is a worthwhile project.
Fig. 1. Chart of the total savings
The chart of the total savings presented in Figure 1, shows that the investment, according to
the projected and assumed costs and benefits level, is worthwhile already in the first year of
implementation. The analysis is based only on the costs and benefits easily quantified. It doesn‘t
involve the benefits that could appear in the qualitative or intangible form. Based on the tangible
benefits and costs the analysis suggests a valuable benefits and advantages after the digitalization of
the public service to both parties, citizens and local self-government.
Concerning the citizens as users, the benefits could be higher for 5.34 times, against the
period before digitalization. On the other hand, the costs for the citizens could reach only 19% of
the costs before the implementation of the digital service. Referring to the local self-government,
the benefits will be higher for 1.25 times in the period for 5 years. At the same time, due to the
digitalization, the costs are going to be reduced for 22.5% against the period before the
digitalization.
4. Conclusion
Digitalization of the public services as a process is being extensively implemented by all the
governments globally. Since the process of implementation of e-government projects is very
complex, influencing many users and stakeholders, it is needed to understand, determine and
quantify the impact of e-services in order for the process to be more available, accessible,
transparent and economic justified. Due to, the evaluation of efficiency and effectiveness is
necessary before the launching of the public services digitalization process. Through the case of
digitalization of the public service – Calculation and payment of the fee for a temporary stay of
tourists, the paper analysis the efficiency and the economic justification of the potential
digitalization project. Using cost-benefit analysis (CBA) it determines and assesses the costs and
benefits relevant and quantifiable to the project. Cost-benefit analysis is a compelling input to the

Компютърни науки и технологии 1 2019 Computer Science and Technologies 50
decision making the process. By determining the economic impact of the digitalization project, the
local self- government has valuable insight into the contribution and influence to all stakeholders
and users of the services.
On the base of the CBA upgraded by the NPV analysis, it could be concluded that it is likely
that the benefits of launching and implementation of public e-services are greater than the costs.
The potential benefits are determined for both sides, to the citizens and to the local self-
governments Generally, as the most relevant benefits to the local self-government are: savings,
efficiency gains and employment of innovative tools for establishing and maintaining cooperation
with the citizens. As the most important benefits to the citizens could be recognized the time and
money-saving, as well a better service delivery.
The purpose of this paper was to provide a foundation for empowering the local self-
governments to launch digital projects and to start a higher transition to e-service delivery in most
areas of the local government. The analysis does not involve the intangible or the so-called soft
benefits which reflect the emotional and qualitative nature of the user‘s benefits. So the
development and employment of a comprehensive model that will analyze both aspects, tangible
and intangible benefits of the digitalization process of the public services, will be the next challenge
for further research.
References
[1]. Carter L. and Belanger F. The utilization of e-government services: citizen trust, innovation and
acceptance factors, Information Systems Journal 15, Blackwell Publishing Ltd. 2005, 5-25,
[2]. Glazer A., Kanniainen V. and Niskanen E. Bequests, control rights and cost-benefit analysis,
European Journal of Political Economy, 19, 2002, pp. 71-82.
[3]. Irani, Z., Love, P. E. D., Elliman, T., Jones, S., & Themistocleous, M. Evaluating e-
government: learning from the experiences of two UK local authorities. Information Systems
Journal, 2005,15, 61–82.
[4]. Kachwamba M. and Makombe I. Evaluating the Cost-Benefits of E-Government Projects:
Rationale for Going Beyond Objective Financial Measures, International Journal of eBusiness
and eGovernment Studies, 2011, Vol 3, No 1.
[5]. Kertesz, Sorin. Cost-benefit analysis of e-Government investments, J.F. K School of
Government, Harvard University, 2003
[6]. Khan, M. Y. and Jain, P. K. Capital budgeting: Principles and techniques in Financial
Management (pp.171 -273) McGraw-Hill Publishing, 2001
[7]. Liu Shuhua Monica and Yuan Qianli. Urban Community Grids Management in Metropolitan
China: A Case Study on Factors Contributing to Mobile Governance Success; E-Government
Success around the World: Cases, Empirical Studies and Practical Recommendations, 2013.
[8]. Nielsen Morten Meyerhoff. eGovernance Frameworks for Successful Citizen Use of Online
Services: A Danish-Japanese Comparative Analysis, Journal of Democracy JeDEM, 2017,
9(2):68-109.
[9]. Sakowicz, M. How to evaluate e-government? different methodologies and methods Warsaw
School of Economics, Department of Public Administration, 2005
[10]. Turban E., King D., Lee J.K., Liang T.P., and Turban D.C. Electronic Commerce: A
Managerial and Social Networks Perspective 8th ed. Springer, 2015
[11]. United Nations, E-Government Survey, Department of Economic and Social Affairs, New
York, 2018.
[12]. Wang L., Bretschneider S., and Gant J. Evaluating Web-based e-government services with a
citizen-centric approach, in Proceedings of the 38th Hawaii International Conference on System
Science, 2005. IEEE.

Компютърни науки и технологии 1 2019 Computer Science and Technologies 51
[13]. World-Bank. Shaping the Future of Water for Agriculture: A Sourcebook for Investment in
Agricultural Water Management. Washington: World Bank, 2005
For contacts:
Research Associate, Jovanka Damoska Sekuloska, PhD
Faculty for Computer Science and Engineering
University of Information Science and Technology ―St. Paul the Apostle‖ Ohrid
E-mail: [email protected]

Компютърни науки и технологии 1 2019 Computer Science and Technologies 52
THE END OF THE BLOCKCHAIN AS WE KNOW IT
Jovan Karamachoski
Abstract: The craze for Blockchain technologies is reaching the pick. After the turbulent 2018, these
technologies showed their main problem, and that is scalability. The two most accepted platforms, Bitcoin
and Ethereum, struggled to serve the enormous increase in the number of transactions. This created disbelief
that Blockchain is future-proof technology. Majority of the existing Blockchain platforms are using the
traditional single-chain structure with one of the two well-known consensus algorithms, Proof-of-work or
Proof-of-stake. It is obvious that the problem in these distributed and decentralized databases are the need for
complete synchronization of the database (the ledger) in real-time, or near real-time, in every node. To
overcome this scalability issue, the Blockchain community offers several solutions. Main ideas are the
implementation of Proof-of-stake or other derivatives of this consensus algorithm, implementation of
sharding and off-chain transaction offloading. These ideas will increase transaction throughput significantly,
especially in the financial Blockchain platforms. Besides the financial implementation scenario, Blockchain
technology promises even better improvements in the non-financial scenarios. The researchers are
developing advanced mechanisms to adapt the Blockchain technology in non-financial implementation
scenarios like IoT, Healthcare, Industry 4.0, supply chains and many others. The current Blockchain
technologies are extremely expensive to be implemented in scenarios where the users have to store huge
amount of textual data in the Blockchain ledger, so new generations of Blockchain technologies have to be
developed.
Keywords: Blockchain, scalability, consensus algorithm, database, non-financial scenarios
1. Introduction
Blockchain technology promises a worldwide self-sustainable solution for an everlasting
database with a lot of advantages. The extreme success of the Blockchain technology, particularly
the Bitcoin [1] and Ethereum [2], set unexpected problems to these systems as a whole. The
development of Ethereum Virtual Machine (EVM) makes the network capable to implement self-
executable scripts and automate the processes in the network. These self-executable scripts are
known as Smart contracts.
The main implementation area is in finance by the introduction of digital money. Besides that,
the researchers have spotted the potential for implementation of these technologies in other
scenarios by use of the capabilities build in EVM. Opposite to the public nature of the Bitcoin and
Ethereum Blockchain technology, there is a private type of Blockchains where the management of
the network and correctness of the data records are checked by particular nodes with a given role.
Most important private Blockchain technology is IBM Hyperledger [3].
The paper is structured as follows: Section 2 describes the first version of the Blockchain
technology and its main benefits and weaknesses, Section 3 gives the main concept for next
generation of Blockchain technologies, Section 4 introduces the non-financial usage of Blockchain
technologies and Section 5 concludes the paper.
2. Blockchain technology 1.0
The deployment of the Bitcoin in 2009 officially solved several problems of previous
technologies related to the time stamping and synchronization and non-repudiation of the data in a
common ledger. The main idea for digital time-stamping and database synchronization to notarize
documents, dates bask in 1991 with the academic solution provided by Stuart Haber and W. Scott

Компютърни науки и технологии 1 2019 Computer Science and Technologies 53
Stornetta [1]. Bitcoin is built on top of this idea by adding the idea for digital money and
implementation of proof-of-work as a consensus algorithm.
In general, to protect the system from intentional mistakes and errors the Blockchain system
implements a one-way function to the data entries in the system. The structure of the data block
gives the strength of the Blockchain system against several potential attacks. The main
advancement in the structure is the implementation of the output of the hash function of one data
block in the header of the next data block. This way the system is creating a chain of interrelated
consecutive block that is almost impossible to be changed. Additional resistance to attacks is
introduced by the implementation of a consensus algorithm where the parties in the network agree
upon single truth in the network, even though they do not know each other. This is the Byzantine
fault tolerance (BFT) [4] property of the system. Two main consensus algorithms are proof-of-work
and proof-of-stake with several alternatives to optimize system performance. Figure 1 presents the
main structure of the data blocks from the Blockchain database (ledger).
Fig. 1. Blockchain technology main structure
According to the characteristics of the current Blockchain solutions, most of them are from
the similar, single chain type, implementing consensus algorithms that are Byzantine fault tolerant.
After the craze for the cryptocurrency on the markets and the huge spikes of the number of
transactions, these technologies showed their weakness. Practically, the Blockchain systems were
almost non-functional due to extensive increase in the number of transactions between the users and
extensive waiting time to verify the transaction.
The last decade in the development and deployment of Blockchain technologies shows most
of the problems related to the maintenance of fully distributed and decentralized systems. The two
of the most famous Blockchains, Bitcoin and Ethereum, are often accused of their power
inefficiency. The actual backers of the systems, known as miners, practically are solving compute-
intensive puzzle, so they are spending lot of energy to finalize the algorithm. The estimated power
consumption of these networks with over 75% of total market cap, is estimated to 100 TWh per
year in 2018 when they pick in popularity [5][6]. Besides this drawback of the two main Blockchain
platforms, the general conclusion from the problems and the failure of every Blockchain
technology, and also main cause for the slow adoption of the Blockchain solutions is the scalability.
Likewise Bitcoin and Ethereum platforms, there are plenty of other cryptocurrencies like, Ripple
[7], Litecoin [8], EOS [9] who are offering the same general functionality with slight improvements
of scalability over the Bitcoin and Ethereum, but with decreased trust and security.
The scalability issue is a multidimensional problem. Mainly there a four scalability issues:
scalability of the storage, scalability of the verification throughput, latency inflexibility and address

Компютърни науки и технологии 1 2019 Computer Science and Technologies 54
space scalability. In the next generations of Blockchain technologies, there is a need to address this
scalability issues.
3. Blockchain technology 2.0
The development of next generation of Blockchain technologies focuses mainly on delivering
a solution for scalability issue regarding the transaction throughput or verification throughput.
Ethereum in its second generation announces solving the problem with the scalability of the number
of transactions by implementation proof-of-stake consensus algorithm. According to Vitalik
Buterin, the co-founder of Ethereum, there is trilemma regarding the decentralization, scalability
and security parameters [10]. This means that any improvement in scalability will sacrifice the
degree of decentralization and the security of the network.
In the following generations of Ethereum, the focus will be in further improvement of the
transaction throughput by the implementation of sharding [11]. The speedup in the transaction rate
will continue with the implementation of off-chain transaction capabilities similar to the Lightning
network [12]. It is obvious that the main intention is to increase the transaction rate, which means
the main focus of the Ethereum developers is the financial implementation scenarios of Ethereum.
The long term development plans for Ethereum, bring focus to the scalability improvement by
implementation of either crypto-economic algorithms or use of helper chains (like Plasma chains
[13] and State channels [14]). With the helper chains, the idea is to declog the main chain from
incomplete transaction or transaction closed in one platform or use-case.
4. The future of non-financial Blockchain systems
The development of EVM and introduction of Smart contracts raised the awareness of the
academia about the potential non-financial implementations of Blockchain technologies.
Researchers are seeing huge potential in the Blockchain technology to offer IoT services on a
worldwide scale, to enhance the healthcare system, improve the Industry 4.0 standard, cloud
storage, supply chains, digital identity, energy market, Digital Rights Management, Ownership
management and many more. Most of these implementation scenarios are almost impossible to be
implemented on a large scale on the current Blockchain platforms due to expensive maintenance
and the scalability issues that are pointed out. This means that the development of future-proof non-
financial Blockchain solution needs a definition of a particular protocol to suit the requirements for
the particular scenario.
There are several projects developing a Blockchain for non-financial implementation, like
IOTA [15], Sia [16], Datum [17], VeChain [18]. In a non-financial scenario, most of the data
circulating in the system are text or images. This will create enormous stress on the storage capacity
of the system. For this reason and with the intention to increase the transaction throughput, there is
a need for a radical change of the current version of the Blockchain technologies.
A most intuitive approach to increase transaction throughput is to increase the number of
Blockchains by deploying mesh-chain or parallel chains. Figure 2 shows the difference in the
structure between a single chain, mesh-chain and parallel chains. The IOTA Foundation has created
a mesh-chain system, by use of Directed Acyclic Graphs (DAG) to increase the number of
transactions several thousand times more than the classical Blockchain systems. Sia and Datum are
Blockchain-based platforms where the users can store data in a cloud using single chain technology
as the main Blockchain to manage the storage of the data. VeChain also uses single chain
technology with slight centralization. It introduces verifier nodes to approve the data on the
Blockchain.

Компютърни науки и технологии 1 2019 Computer Science and Technologies 55
a)
b)
c)
Fig. 2. Structural comparison between a) single chain, b) mesh-chain and c) parallel chains
Further ideas for non-financial Blockchains are the implementation of 2 tier network of
Blockchains. The Blockchains will be divided into in-house and out-of-house Blockchain network
for use in the smart home scenarios [19]. Another idea is the implementation of regional or
countrywide segmentation [20] or implementation of individual Personal Blockchains to introduce
the Self-Sovereign Identity [21] and manage personal records for a healthcare system. The ideas
presented in [20] tackles several dimensions from the scalability problems in order to deliver
worldwide healthcare system.
5. Conclusion
It is obvious that the Bitcoin and Ethereum networks showed their real potential, but also
opened a lot of issues regarding Blockchain technology. There is no optimal single solution for
every implementation scenario. The optimal solution for the future-proof Blockchain technology
has to be adapted to the implementation scenario. The parallelism of the chains is the best suited for
most of the scenarios as a future-proof approach. It will easily scale, modify, and communicate in-
between the chains.
References
[1] S. Nakamoto, ―Bitcoin: A peer-to-peer electronic cash system,‖ 2008.
[2] V. Buterin and others, ―Ethereum white paper: A next-generation smart contract and
decentralized application platform,‖ Ethereum [Online resource]. URL:
http://blockchainlab.com/pdf/Ethereum_white_paper-

Компютърни науки и технологии 1 2019 Computer Science and Technologies 56
a_next_generation_smart_contract_and_decentralized_application_platform-vitalik-
buterin.pdf, 2014.
[3] E. Androulaki, A. Barger, V. Bortnikov, C. Cachin, K. Christidis, A. De Caro, D. Enyeart, C.
Ferris, G. Laventman, Y. Manevich, and others, ―Hyperledger fabric: a distributed operating
system for permissioned blockchains,‖ in Proceedings of the Thirteenth EuroSys Conference,
2018, p. 30.
[4] L. Lamport, R. Shostak, and M. Pease, ―The Byzantine generals problem,‖ ACM Transactions
on Programming Languages and Systems (TOPLAS), vol. 4, no. 3, pp. 382–401, 1982.
[5] ―Bitcoin Energy Consumtion.‖ [Online]. Available: https://digiconomist.net/bitcoin-energy-
consumption. [Accessed: Sep-2019].
[6] ―Ethereum Energy Consumption.‖ [Online]. Available: https://digiconomist.net/ethereum-
energy-consumption. [Accessed: Sep-2019].
[7] D. Schwartz, N. Youngs, A. Britto, and others, ―The ripple protocol consensus algorithm,‖
Ripple Labs Inc White Paper, vol. 5, p. 8, 2014.
[8] ―Litecoin.‖ [Online]. Available: https://litecoin.org. [Accessed: Sep-2019].
[9] B. Xu, D. Luthra, Z. Cole, and N. Blakely, ―EOS: An Architectural, Performance, and
Economic Analysis,‖ 2018.
[10] ―Ethereum 2.0: A Complete Guide. Scaling, Part One.‖ [Online]. Available:
https://medium.com/chainsafe-systems/ethereum-2-0-a-complete-guide-3739a74be61a.
[Accessed: Sep-2019].
[11] Y. Gao and H. Nobuhara, ―A proof of stake sharding protocol for scalable blockchains,‖
Proceedings of the Asia-Pacific Advanced Network, vol. 44, pp. 13–16, 2017.
[12] S. Martinazzi, ―The evolution of Lightning Network‘s Topology during its first year and the
influence over its core values,‖ arXiv preprint arXiv:1902.07307, 2019.
[13] J. Poon and V. Buterin, ―Plasma: Scalable autonomous smart contracts,‖ White paper, pp. 1–
47, 2017.
[14] J. Coleman, L. Horne, and L. Xuanji, ―Counterfactual: Generalized state channels,‖ 2018.
[15] S. Popov, ―The tangle,‖ IOTA [Online resource]. URL:
https://assets.ctfassets.net/r1dr6vzfxhev/2t4uxvsIqk0EUau6g2sw0g/45eae33637ca92f85dd9f4a3
a218e1ec/iota1_4_3.pdf, 2018.
[16] D. Vorick and L. Champine, ―Sia: Simple decentralized storage,‖ Nebulous Inc, 2014.
[17] R. Haenni, ―Datum network: The decentralized data marketplace,‖ White paper v15, 2017.
[18] VeChain, ―VeChain: Development plan and whitepaper,‖ Whitepaper, 2018.
[19] A. Dorri, S. S. Kanhere, and R. Jurdak, ―Blockchain in internet of things: challenges and
solutions,‖ arXiv preprint arXiv:1608.05187, 2016.
[20] J. Karamachoski and L. Gavrilovska, ―Toward scalable architecture for the next generation
Blockchain-based Healthcare systems,‖ Balkancom 2019, 2019.
[21] K. Wagner, B. Nemethi, E. Renieris, P. Lang, E. Brunet, and E. Holst, ―Self-sovereign
Identity: A position paper on blockchain enabled identity and the road ahead,‖ Blockchain
bundesverband, 2018.
For contacts:
MSc. Jovan Karamachoski
UIST ―St. Paul the Apostle‖, Ohrid
Republic of North Macedonia
E-mail: [email protected]

Компютърни науки и технологии 1 2019 Computer Science and Technologies 57
DESIGN AND IMPLEMENTATION OF OPTICAL SENSOR
Zhejno Ivanov
Abstract: The usage of several identical optical sensors of the "optical curtain" type to detect the
presence of an object in one of several adjacent rectangular bands is considered. In the transmitter
of these sensors the light source is an infrared LED. When the object interrupts the transmitter light
beam, the photo receiver activates a relay.
An optical sensor of this kind is being analyzed. In the horizontal plane, the transmitter emits light
in a too wide spatial angle, which prevents the simultaneous operation of several closely located
sensors, because the light from the transmitters fall on the receivers of the neighbor sensors.
In the article a reduction of the optical curtain width by a suitable mounting design, is proposed.
Keywords: Optical sensor, optical curtain, design
1. Introduction
A device that performs different actions depending on the presence of people on some of the
steps of a staircase in a building can be implemented using several identical sensors, one sensor
placed on each step. Each sensor will send a digital signal to the device when there is a person on
the step.
When choosing a sensor, safety, low cost, market accessibility and ease of implementation are
taken into account. The literature describes the use of optical sensors for such purposes. These types
of sensors belong to the group of presence sensors [2]. At each end of each step, there is an optical
transmitter and a sensor receiver. When a passing object interrupts the light beams of the
transmitter, a relay is activated in the photo receiver. This optical sensor is of the "light curtain"
type and is widely used in security systems [3].
The device of two similar optical sensors used in practice was examined and some of their
characteristics were measured. They have the required sensitivity and can detect an object as far as
the length of the step. There are no problems when using a single sensor or multiple sensors
mounted far apart. However, a group of closely spaced sensors interfere with each other and do not
work properly because the transmitter light bundle is too wide and falls into the receivers of
neighboring sensors. The narrowing of the spatial angle of the light beam can be realized in two
ways:
by changing the optical system of the sensor, which requires a change of the sensor
construction;
by placing additional apertures along the path of the light emitted and received, which can
be done without altering the factory design of the sensor.
2. Construction and mounting design of the optical sensor
The choice of an optical sensor for the device was imposed by its price and dimensions.
Structurally, the ―light curtain‖ sensors consist of a transmitter module and a receiver module
located in separate boxes. The transmitter contains one or more infrared light sources, typically with
light wavelengths in the near infrared range of 900-1000 nm. The receiver is built with a
semiconductor infrared light sensor that controls one or more contact outputs.
We will discuss two types of optical sensors of this kind, sold in our country. The ABT-20,
ABT-30, ..., ABT-150 sensors create a two-beam light curtain - Fig. 1.

Компютърни науки и технологии 1 2019 Computer Science and Technologies 58
Fig. 1. A light curtain in front of a window
The transmitter transmits at a narrow angle from the horizontal and the vertical plane.
According to catalog data, the distance at which an object intersects the beam is 20-150 m in open
space, depending on the model. The sensor construction is shown in Fig. 2.
The boxes of the receiver and transmitter of the sensor are made of gray transparent plastic
and act as filters that transmit only infrared light into the operating light spectrum [1]. Inside them
are mounted 2 LEDs in the transmitter and 2 phototransistors in the receiver. There is an optical
system composed of several lenses between the housing and the LED as well as between the
housing and the phototransistor. The lenses narrow the angle of the light beams (typically 600)
emitted by the LEDs, and in the receivers narrow the angle of light input into the photosensitive
elements.
Fig. 2. Construction of the sensor transmitter and receiver
The transmitter transmits at a narrow angle from the horizontal and the vertical plane.
According to catalog data, the distance at which an object intersects the beam is 20-150 m in open
space, depending on the model. The sensor construction is shown in Fig. 2.
The boxes of the receiver and transmitter of the sensor are made of gray transparent plastic
and act as filters that transmit only infrared light into the operating light spectrum [1]. Inside them
are mounted 2 LEDs in the transmitter and 2 phototransistors in the receiver. There is an optical
system composed of several lenses between the housing and the LED as well as between the
housing and the phototransistor. The lenses narrow the angle of the light beam (typically 600)

Компютърни науки и технологии 1 2019 Computer Science and Technologies 59
emitted by the LEDs, and in the receivers narrow the angle of light input into the photosensitive
elements.
To increase the sensitivity of the sensor, the LEDs in the transmitter do not emit light
constantly, but on pulses with a carrier frequency of several kHz and a low duty cycle, which allows
for several times higher pulse output power at low average power consumption. A bandpass filter is
inserted in the receiver, passing only a frequency that matches that of the transmitted pulses from
the transmitter. This greatly reduces the effect of ambient light on the operation of the device and
significantly improves the signal / noise ratio.
Another widely used sensor of this kind is the CV PBS-20. It uses only one light beam to
realize the light curtain. The construction of the sensors is similar to that described above.
Dimensions, consumption and cost are smaller. In addition, these sensors operate at distances of up
to 5 meters.
The appearance of the CV receiver and transmitter CV PBS-20 is shown in FIG. 3. and the
construction of the open sensor is shown in Fig. 4.
Fig. 3. Sensor CV PBS-20 exterior
Fig. 4. Construction of optical sensor CV PBS-20

Компютърни науки и технологии 1 2019 Computer Science and Technologies 60
The radar formula (1) can be applied with some modification to the propagation of light in an
optical sensor consisting of an optical receiver and a transmitter.
43
2
64Pr
r
DrDtPt
(1)
In the formula the radiation power is denoted by Pt and the input power of the receiver by Pr.
Dt and Dr are the directivity coefficients of the transmitting and receiving antennas. λ is the
wavelength. σ is the effective reflectivity of the object. r is the distance between objects [4].
For the optical presence sensors under consideration, the factor σ≈1 when there is no object
between the transmitter and the receiver. Then all the transmitter's luminous power is directed to the
receiver through the air between them. The minimum signal input power of the receiver required for
the safe operation of the sensor depends on the technology used in the receiver elements and circuit
design, as well as the ambient light noise. Due to mobility, low consumption, dimensions, weight
and cost of the device, the power of the transmitting LEDs is limited. Thus, the design of the optical
system of the transmitter and receiver makes a significant contribution to increasing the distance
and reliability of the sensors. The ultimate goal is to get high directivity of the optical antennas. For
this purpose, the transmitter should emit light sharply directed in a narrow spatial angle, and the
receiver must perceive the emitted light only in a narrow spatial angle with a sharp maximum of
sensitivity in the direction of the transmitter.
The sensors must correctly detect people on the steps of the building, when the length of the
step of the building being 2.5-3.5 m and the width being 0.35 m. It was decided because of the
lower cost and dimensions to use the CV PBS-20 sensors. The tests showed that the sensor responds
correctly up to 4 m away, however, the transmitter of the sensor has a very wide radiation angle in
the horizontal plane - more than 100, which causes the beam to fall into the receivers of the
neighboring sensors and disrupt their normal operation. To reduce this angle, the transmitters and
receivers of the sensors were mounted at one end of a 15 cm opaque tube and a 2 cm diameter
diaphragm was installed at the other end of the tube.
The path of the light rays from the transmitter LED to the receiver phototransistor is shown in
Fig. 5.
Fig. 5. Path of the light rays from the transmitter
If the receiver is not mounted behind the diaphragm, simply using triangles shown in Fig. 5
the following is obtained: 𝑙
𝐿=
𝑑
𝐷 (2)
where l = 15 cm is the distance from the LED to the diaphragm at the end of the tube, L=300 cm is
the distance between the receiver and the transmitter, d = 2 cm is the diameter of the aperture of the
diaphragm and D is the diameter of the light spot on the receiver. From (2), D = 40 cm is obtained.
If the receiver is placed behind a diaphragm with a diameter d, at the same distance l from it, due to
the symmetry of the structure, the diameter of the light bundle decreases twice. Thus, the rays from
D Photo
transistor
l
L
d
LED

Компютърни науки и технологии 1 2019 Computer Science and Technologies 61
the transmitter sensors do not fall into the adjacent photodetectors if they are more than D / 2, ie 20
cm apart.
3. Conclusions
It has been experimentally found that 12 such optical sensors, mounted on the specified ladder
design with a length of 3 m and a step width of 35 cm, operate independently of each other without
interfering with each other.
The proposed method for eliminating the influence of closely located presence optical sensors
with LEDs is a simple, low-cost solution that does not change the design of the sensor. It requires
additional simple details. Sensors that use laser diodes and / or a more sophisticated optical system
are more accurate, more stable, faster, and work longer distances, but are several times more
expensive.
References
[1]. Fraden, J. Handbook of modern sensors. Physics, designs, and applications. 3-rd Edition. San
Diego, CA., Springer, 2004. ISBN 0-387-00750-4.
[2]. Morris, A., R. Langari. Measurement and Instrumentation. London, UK: Elsevier Inc., 2012, pp
325-327. ISBN 978-0-12-381960-4.
[3]. Инженеринг ревю – 9/2009. Sofia, TLL Media Ltd., 2009, pp. 64-66. ISSN 1311-0470.
[4]. Червяков, Г. Технические системы охраны периметров и объемов. Мет. Пособие. Изд. 4-
е. Москва, Таганрогский Государственный Радиотехнический Университет, 2005.
For contacts:
Assoc. Prof. Zhejno Ivanov
Computer Science and Engineering Department
Technical University of Varna, Bulgaria
E-mail: [email protected]
Bulgaria
Communications
Chapter

Компютърни науки и технологии 1 2019 Computer Science and Technologies 62
ANALYSIS OF SOME ISSUES IN RISK ASSESSMENT FOR
INFORMATION SECURITY
Petko G. Genchev, Milena N. Karova
Abstaract: In the modern world, the importance of information security is growing. This is why many
organizations are building information security management systems. The basis of these systems is risk
management. This article discusses some issues related to risk assessment in building information security
management systems. An attempt has been made to summarize and unify problems and to clarify the causes
of these issues. A more detailed analysis of some of the problems has been made and tasks have been
formulated to eliminate or to reduce the cause is impact of the causes of the problems.
Key words: problems in risk assessment for information security.
АНАЛИЗ НА НЯКОИ ПРОБЛЕМИ ПРИ ОЦЕНКА НА РИСКА ЗА
ИНФОРМАЦИОННАТА СИГУРНОСТ
Петко Г. Генчев, Милена Н. Карова
Резюме: В съвременния свят все повече нараства значението на сигурността на информацията. Това е
причина много организации да изграждат системи за управление на сигурността на информацията. В
основата на тези системи е заложено управление на риска. В тази статия са разгледани някои
проблеми, свързани с оценката на риска при изграждане на системи за управление на сигурността на
информациятаа Направен е опит за обобщаване и обединяване на проблемите, и изясняване на
причините за тези проблеми. Направен е по-детайлен анализ на някои от проблемите и са
формулирани задачи за премахване или намаляване на влиянието на причините за проблемите.
Ключови думи: проблеми при оценка на риска за информационната сигурност.
1. Introduction
In today's world, more and more organizations are relying on information technology to help
them achieve their business goals, such as faster response to service or better quality. Therefore the
security of information has an enormous importance for organizations. We need a systematic
approach to risk management as regards security of information that help to define the requirements
for information security and create an effective system of governance. The risk is the effect of
uncertainty on objectives and the risk of information so security is often expressed in a combination
of the effects of event information so security and probability of occurrence event. The subject of
risk assessment is called an information asset, and an asset is anything that has value to the
organization. The information assets in the management of security information consists of more
than hardware and software. The information asset can be hardware, software, people, information,
service and more. The risk assessment, both process and related techniques, offers an analytical and
structured approach to the security status of the organization [2].
The purpose of this article is to provide a main overview of the issues involved in the
construction and operation of Information Security Risk Management Systems (ISRMs). The
review was made on articles on the topic in the last 7-8 years. The problems are structured
according to the impact they have on the processes of construction and operation of the ISRM and
the risk assessment activities as a basic element of the ISRM. Based on this comprehensive
description of the problem there is an analysis of the problems and outlines proposals for solving
more - important ones. Finally, conclusions are drawn about the nature of the problems.

Компютърни науки и технологии 1 2019 Computer Science and Technologies 63
The article is structured in 3 sections. The first section discuses and structures a large part of
the problems related to the ISRM, the second section analyzes the more significant problem groups
and proposes measures for reducing the problems. In conclusion, the main directions that should be
addressed in order to facilitate the construction and operation of an ISRM system are outlined.
2. Main problems in ISRM
In this section we have describe some of the problems found in the publications of the last
eight years. Taking into account some examples of building Information Security (IS) management
systems, an unusual arrangement of the problems with their impact on the construction and
organization of the operation of an ISRM system was carried out. This arrangement aims to support
the structuring of recommendations for the activities facilitation for the ISRM construction, as well
as to increase the efficiency of such system.
Issues related to data collection and processing:
There is a lack of information on specific implementations of ISRM [1] ;
Comprehensive, publicly available and reliable data on occurrences, impacts and their
probabilities are not available. The use of such data would be useful in developing a new
system for ISRM, as well as in cases where there is information accumulated in the
organization, but it is good to compare it with industry average (benchmark) data to assess
completeness, reliability and the relevance of inside information [10];
It should be noted that the accumulated probability data do not reflect changes in event
behavior [10];
IS incident and threat statistics are not as accessible as other data. For some threats,
such as the frequency of car accidents, there are extensive statistics; however, other threats are
less understood due to lack of data. The insurers are not able to determine probabilities with
the same security degree they can determine with traditional insurance lines. [9];
With the inability to remain "ever vigilant", many organizations release important risk
data [4];
The collection of a large information amount needed for a good risk assessment poses
the question of selection and quality assessment of the information collected [4];
The decisions are often made without the necessary information and are instead based
on management's assumptions [9];
Lack of empirical research and good data [8];
Lack of validation and testing. It turns out that IP control measures are being tested a
little, leading to a lack of knowledge about the effectiveness of security measures. Some
authors argue that security technology has low efficiency and developed testing methods are
not strictly scientific or no mathematical proof [8];
IS specialists are not sufficiently trained to design experiments and publish results [8].
Problems with risk assessment methods:
Many evaluation methods are used. The Risk analysis methods depend on the asset
nature and many valuation methods are used for organizations with many and varied assets.
[5];
There are no structures in order to assist organizations in determining the most
appropriate risk analysis method [5] . In the literature there are more than 200 methods for
risk management, and many approaches to ISP risk assessment are difficult to categorize by
researchers and practitioners [10];

Компютърни науки и технологии 1 2019 Computer Science and Technologies 64
There is no coherent method for measuring information security risks. Although many
methods have been proposed, there are still shortcomings that impede the accurate assessment
of IS risk . The Quantitative risk analysis methods may not include all the variables required.
The qualitative methods tend to produce contradictory results [9] . There must be tools in
place for IS professionals to perform quantitative risk analysis . There are difficulties in the
probabilities calculation for quantitative methods , as well as the insufficient amount of
accumulated data is available [8];
The lack of validation and verification of existing methods. This problem is a
consequence of the lack of empirical research and good data within the IS [8];
It is argued that the subjective assessment methods and risk matrices add their own
sources of error to the ISRM . For example, different people at different levels in an
organization will evaluate the rocks differently. The Critics also state that the risk of low
probability but a large impact is not the same as the risk with little effect, but with a high
probability [8];
There is an "over-sale" of methods that have no proven effect. The proliferation of such
methods is financially stimulated and undermines the use of theoretical methods that work.
[8].
Problems related to subjective factor:
The selection of risk assessment methods is based on expert judgment and subjective
judgment. This lack of objective quantitative practical guidance affects the prioritization and
the vulnerable assets analysis [3];
Risk assessment is a subjective analysis of costs and probabilities based on existing
security measures. Methods have been developed that seek to add semi-quantitative value
based on subjective judgments [9];
People generally do poor risk assessment. The way we perceive risk is influenced by
gender, age, race, emotional state, organizational rank, and more. In their judgments, default
experts tend to underestimate risk and show overconfidence in their own judgments [8] . For
procedural reasons, the valuer is usually simplified, otherwise it will be lost in detail [10];
The reluctance to report incidents leads to a lack of knowledge of the system
effectiveness. The People who happen to (or cause) accidents they can have many incentives
to not report them [8];
When there are a relying on managerial perceptions based on heuristics instead of facts,
it can lead to a wrong organizational strategy and it increases industrial threats [9].
Performance issues:
It is important to analyze the risk assessment effectiveness in organizations. Taking a
risk assessment is an expensive business, it is normal to put the question "how effective is the
practice of risk assessment in the organizations given the budget constraints for a typical IS ?"
[1];
The inability to prove that the ISRM works may be worse than there is no a system in
place. The resources are spent on something that can have a zero impact on an organization's
business. The failure to have a ISRM system can lead the organization to a worse state than it
was before, such a management system was introduced [8];
The Cost-effectiveness is needed .For example, the finding the benefits of a particular
safety measure outweigh its costs does not rule out the possibility of even greater benefits
being obtained from similar costs elsewhere [9];
The Company constraints (price targets, prioritization) affect the performance.
Taubenberger et al. [10] describe that in the system of ISRM implementation, the low and

Компютърни науки и технологии 1 2019 Computer Science and Technologies 65
several medium risks are not mitigated due to personal and company specific limitations such
as perception, price targets and activities prioritization;
The lack of a sufficient security budget is often an obstacle to achieve the desired level
of IS protection [9];
IS policies need to be read and understood by employees [9];
It is not enough to implement security measures, they must be properly managed to be
effective [9];
The good implementation (installation and configuration) of security measures is
required. Тhe еffective measures can be implemented in order to protect organizational
information; however, they are installed and configured by people, which adds an error
component to their performance [9].
Missed or undervalued sources of risk:
The security should be seen as a process, not a product. For most part of people , the
risk management is actually "Risk Identification" and they view security as a product, and not
as a process [8];
It underestimates the protection of reliability and security of business processes in an
organization [8];
The significant sources of risk are not taken into account during the risk management
process. The are some examples: intangible assets such as knowledge; vulnerabilities arising
from the complex relationships between multiple information assets; indications of malicious
threats such as fraud, espionage or sabotage; lack of systematic and continuous training in IS-
related incidents; inability to identify attack patterns or model complex or persistent attack
scenarios [1] . It is not possible to be sure of the completeness and authenticity of identifying
all threats and vulnerabilities. The underlying conditions are constantly changed and it leads
to a behavior change and a severity of the threats and vulnerabilities [10];
The co-occurrence of risks is not taken into account. The models used to determine risks
and dependencies are bad because they do not take into account the co-occurrence of risks. In
the current methods, the assessments are made on decomposed elements of the model. The
organization is not addressed as a whole [10]. The correlations between risk situations can be
different and varied, e.g. two or more risk events tie together and create a domino effect, etc.
"cascading risk". Also there are situations when one risk damages more than one system at a
time [8];
The environmental impacts are not taken into account. In order to correctly identify
events, probabilities and impacts, we must have a knowledge about the risk environment
broad, the company and the outside world [10];
The Intangible assets are skipped. If the intangible assets are not recognized, the
valuation will be incomplete as they determine marginal social and non-technical dimension
in the organization. There are analysts who claim that the current ISRM vision is too technical
when it comes to assets. The problem is that the perception of assets influences the risk profile
of the evaluated organization [8];
The risk of human behavior is not adequately assessed. Their behavior is not objective
or rational, it can follow personal interests or it can herd instincts as well as be prejudiced
[10];
Ignoring the risks associated with human actions at the expense of technological aspects
(applications, devices, viruses and hacking). The fact that more attention is paid to the
technical scope there is not a potential to analyze human factors risks, to neglect intangible
assets and to cause organizational disconnection in both risk management and cost [8];
Gaps are made at accepted risk. Very often, the effect on the security level or on the
policies of companies do not take into account when the risk is accepted [10].

Компютърни науки и технологии 1 2019 Computer Science and Technologies 66
Vulnerability, Threats, and Impact Issues:
Choice of many variants of vulnerability-threat pairs [2] ;
The wrong choice of non-existent threat-vulnerability pairs can cause organizations to
spend unnecessary time and money to prevent non-existent risk and neglect real weaknesses
[2];
An inaccurate assessment of the likelihood of a threat, the loss of a threat and the
vulnerability to a threat can lead to a misunderstanding of the risks [9];
An accurate quantification of potential losses from IS incidents becomes a problem for
decision makers [9].
Organizational problems:
It is necessary to use a common language for information security. It will facilitate the
communication and it will help to achieve a common understanding of IS between companies.
It will bridge the language gap that leads to confusion among the experts, people and
organizations [8];
Campaigning - there are no precise rules for the risk assessment pertinence[1];
As the complexity increases with the diversity of dramatically growing information
systems, the adaption to a particular model becomes more complex [6].
3. Analysis of the problems and suggestions to reduce the problems effect on the system
efficiency
Analysis of problems related to data collection and data processing:
The lack of information on specific implementations of the ISRM provoke it very difficult to
build such a system with own resources and specialists in the organization. This problem involves
external expertise or the use of an information system that contains templates built on the basis of
external experts. On the other hand, the lack of publicly available and reliable data on occurring
events, impacts and their probabilities reflects the problem that such data are not properly collected
in the organizations or, if available, they are not prepared for publication. To overcome the
problems of current data collecting and management of storage and processing information, we
propose to take the following organizational measures:
It is necessary for each risk assessment to collect probability data, select and accumulate
by type of vulnerability and threat. This will accumulate data to reflect to some extent the
dynamics of event behavior;
If there is a change in the risk assessment, it should be attempted to explain the change
and add it to the vulnerability or threat statistics;
All asset owners are required to keep current information on the operation of the assets
they are responsible for. It is necessary to keep statistics on the non-fulfillment of this
obligation;
During the process of purchasing or forming a new information asset, or after that, it
can look for technology and methods for performing IP verification tests on each information
processing tool used;
All information asset owners are familiar with the asset security testing technology and
periodically undergo a documented refresher course;
Each owner of an information asset must be obliged to periodically perform tests to
prove the asset's IS . The frequency and testing technology should be defined in a specific
document;
Each asset owner must be obliged to produce and provide to his directors an asset
security report, IS incidents, and a proposal to resolve the issues identified, together with a

Компютърни науки и технологии 1 2019 Computer Science and Technologies 67
financial statement. If necessary, the Asset Respondent should seek assistance from the IT
department or from his / her supervisor to find external experts.
To reduce the negative effect of some of the problems associated with risk assessment
methods, we propose the following measures:
To alleviate the problems associated with many risk assessment methods, it is necessary
to define and create an instrument that allows the assets to be automatically categorized and
grouped by type of risk assessment method;
For each risk assessment method used, it should be defined how the method is
validated;
It should be to determine, the necessary information to validate the effectiveness of the
applied risk assessment method by experts and management and to collect this information on
a regular basis;
Determine the attitude of each asset to the organization's policies and business strategy
by introducing a weighting factor that reflects the asset importance to the context of the
organization (accounting for the impact of the risk on the asset separately);
The subjectivity problem is complex and multifaceted. It is not possible to fully overcome
the subjective factor in risk assessment because it is a probabilistic assessment. To reduce the
effects of subjectivism and to facilitate subjective decision we propose the following measures:
Wherever possible, the range of options should be restricted;
In order to reduce the effect of human misjudgment, it is necessary to make the
selection or assessment by several persons independently of one another, using a single
technology, and then to use an average or integer value depending on the weighting factor for
each participant in the choice or judgment;
To force the asset owner to report security incidents, a periodic asset security status
report may be applied to remind the owner to pay attention to security and to detect bad faith.
no reflection of the facts, if there are;
It is necessary for the asset owners and external experts to prepare, at an appropriate
level and in an appropriate volume, a risk level information for each asset and to provide it for
use by the firm's management;
With regard to informed decision-making, it is possible to arrange for the decision
introduction should be taken after confirming the decision-maker's knowledge of the topic
gathered information.
Effectiveness could be measured by the ratio of the information security invested to the value
of any losses that an organization should be sufferred from a loss of security. In fact losses are,
equal in impact and subject to more accurate determination. The question is what is the minimum
amount of protection invested and what measures will be put in place to provide the necessary
protection. It is also important what the losses (impact) will be if the safeguards are inadequate and
an accident occurs . The following measures may be applied to increase the efficiency of the ISRM
system:
The effectiveness of the risk assessment will be improved if the collected and
categorized assets security information is periodically scanned manually or automatically,
after which the findings of the screening are stored in a database for further analysis;
All inputs to reduce the level of risk must be accompanied by a methodology for
controlling the use and efficiency of operation;
The IS requirements must be applied in such a way that they do not allow for
circumvention, even with the cost of inability to perform their duties. For example, the

Компютърни науки и технологии 1 2019 Computer Science and Technologies 68
inability to use the information resources if the access password has not been changed within
the specified time;
When introducing new data processing tools, it is necessary to define and describe all
the features of the installation , as well as more responsible settings and modifications, so that
they can be subject to periodic monitoring during operation;
We need to introduce automatic control means of compliance with company
requirements in terms of IS, where possible and necessary, with the results being announced
at higher levels of management.
In order to reduce the gaps and underestimate the sources of risk, the following should be
considered:
Information on all information security incidents should be monitored and collected;
Interviews with the owner of each asset and other professionals relevant to the asset
should be conducted periodically . Draw on these interviews to draw conclusions about trends
and the emergence of new vulnerabilities or threats;
The information collected and processed must be made available to experts for analysis
and identification of attack patterns or for modeling complex or persistent attack scenarios;
Determine the ratio of the asset to other assets . Who is influenced and influenced by IS.
Determine and agree with management the degree of influence (in%);
When calculating the risk value for each asset, take into account the impact of the
affected assets, taking into account the% impact. The final level of risk for an asset should be
a function of the vulnerabilities and threats to that asset plus the impact of the inherent risk of
interacting with other assets;
To monitor and record any change in the context of the company . With a new element
in context, evaluate its impact on which assets and how it affects;
In defining the intangible assets, participate a representative of the organization's
management to ensure the completeness and accuracy of the inventories;
All intangible assets should have the same description and information security, as well
as all tangible assets. If necessary, introduce a technology to align the collection and
processing of information on intangible assets in a uniform manner with tangible assets;
Introduce special measures for the control and organization of human activities , in
order to avoid unforeseen and unregulated reactions;
For each asset , develop and maintain a record of the level of risk and the measures
applied to reduce the level of risk, regardless of what the original levels of risk were and
whether they were adopted;
To overcome vulnerability, threat and impact issues, we offer:
If external lists of descriptions of vulnerability-threat pairs are used , those lists must be
made available to the organization for control and future use in the operation of an asset or in
the context of a company change;
The estimation of the probability values for each pair should be made by several valuers
who are either directly related to the asset, or indirectly related to the asset, or are experts in
the field, or are in a responsible position in the organization.
4. Conclusion
The review and analysis of the problems leads to the conclusion that the main part of the
problems is related to the underestimation, failure to fulfill or circumvent the recommendations and
requirements, which give the standards for the implementation of the ISMS and the ISRM . Various

Компютърни науки и технологии 1 2019 Computer Science and Technologies 69
reasons influence the failure to comply with the organizational and technical recommendations and
requirements of the standards. Some are related to financial reasons and others to incompetence and
subjective reasons. It is necessary to conclude that in order to increase the efficiency of the
introduction of the ISRM system, it is necessary to introduce the means to discipline the staff and to
introduce stricter responsibilities at all levels of management.
Many of the problems found are due to the same causes, but they affect different elements or
processes in the ISRM. This means that removing a group of causes will solve several problems at
once.
The initial review of the problems suggests that most problems are related to the need to
introduce a single tool for collecting and processing information for the construction, processing
and adaptation of the system to a rapidly changing environment. Closer analysis leads to the
conclusion that a large group of problems are related to the reporting and consideration of complex
interconnections of information, organizational, technical and subjective nature. In all likelihood,
this will be a software product in which these relationships and influences need to be properly
defined, accounted for and processed. There is a need for a thorough and precise definition of the
necessary requirements to f functionalities you need to realize the product. It must support the
accumulation of operational information to monitor the performance of responsibilities introduced
to systematize and provide the necessary information to make informed decisions and to store these
solutions and make them available for information and execution of employees. On the other hand,
such a software product should allow for the introduction of settings that determine the monitoring
and reporting of interrelations and influences between individual elements of the ISRM. These
settings should be able to change dynamically, thus providing adaptation to the changing
environment. Last but not least, the program must exercise hierarchical, authorized access to its
resources while protecting its stored information.
References
[1]. Webb J., A. Ahmad, S. B. Maynard, G Shanks, A situation awareness model for information
security risk management. //Computers & Security,Volume 44, July 2014, Pages 1-15.
[2]. Yu-Chih Wei, Wei-Chen Wu, Ya-Chi Chu, Performance evaluation of the recommendation
mechanism of information security risk identification. // Neurocomputing, Volume 279, 1
March 2018, Pages 48-53.
[3]. Nadher Al-Safwani, Yousef Fazea, Huda Ibrahim, ISCP: In-depth model for selecting critical
security controls. //Computers & Security, Volume 77, August 2018, Pages 565-577.
[4]. Palaniappan Shamala, Rabiah Ahmad, Ali Zolait, Muliati Sedek, Integrating information quality
dimensions into information security risk management (ISRM), // Journal of Information
Security and Applications, Volume 36, October 2017, Pages 1-10
[5]. Palaniappan Shamala, Rabiah Ahmad, Mariana Yusoff, A conceptual framework of info
structure for information security risk assessment (ISRA), // Journal of Information Security and
Applications, Volume 18, Issue 1, July 2013, Pages 45-52;
[6]. Suleyman Kondakci, Analysis of information security reliability: A tutorial, // Reliability
Engineering & System Safety, Volume 133, January 2015, Pages 275-299
[7]. Ana Paula Henriques de Gusmão, Lúcio Camara e Silva, Maisa Mendonca Silva,Thiago Poleto,
Ana Paula Cabral Seixas Costa, Information security risk analysis model using fuzzy decision
theory, // International Journal of Information Management, Volume 36, Issue 1, February
2016, Pages 25-34
[8]. Gaute Wangen & Einar Snekkenes, A Taxonomy of Challenges in Information Security Risk
Management, //https://ntnuopen.ntnu.no/ntnu-xmlui/bitstream/handle/11250/2483955/
Wangen+1+Taxonomy.pdf?sequence=2

Компютърни науки и технологии 1 2019 Computer Science and Technologies 70
[9]. Richard G. Taylor , Potential Problems with Information Security Risk Assessments, //
Information Security Journal: A Global Perspective, 24:177–184, 2015
[10]. Stefan Taubenberger, Jan Jürjens, Yijun Yu, Bashar Nuseibeh, Problem Analysis of
Traditional IT-Security Risk Assessment Methods – An Experience Report from the Insurance
and Auditing Domain // HAL Id: hal-01567605, https://hal.inria.fr/hal-01567605, Submitted on
24 Jul 2017
For contacts:
Ass. Prof. Petko G. Genchev
Department of Computer Science and Technologies
Technical University of Varna
Email: [email protected]

Компютърни науки и технологии 1 2019 Computer Science and Technologies 71
TECHNOLOGY, QUALITY AND INNOVATION - KEY ASPECTS
OF COMPETITIVENESS OF INDUSTRIAL ENTERPRISES
Krasimira Dimitrova
Abstract: This study focuses on key aspects of competitiveness - technology, quality practices and
innovative approaches in industrial enterprises. Their role is essential for the implementation of company
policies aimed at using innovation to enhance the competitiveness. This role is necessary and important for
investment in innovation and business decisions making. Quality management integrated in innovation
focuses on two factors of competitiveness: controlling the risks of failure caused by disruption of past
manufacturing and consumer practices and optimizing market access for innovation. This study analizes the
opportunities for the successful integration of modern technologies and quality into the innovation process in
order to ensure of industrial enterprises the most cost-effective competitiveness over time.
Keywords: Technology, Quality, Innovation, Innovation process, Competitiveness, Fourth Industrial
Revolution, Global Competitiveness Index.
1. Introduction
This survey is in the range of a research project of Department of Industrial Management of
Technical University of Varna numbered NP14/2019, financed specifically by the state budget and
aims to analyze the links between technologies, quality and innovation and their impact on the
competitiveness of industrial enterprises. Teachers and students from the department are involved in
the project. This publication looks at some basic theoretical aspects of the competitiveness of
industrial enterprises in Bulgaria in the face of the ever-expanding opportunities of information and
communication technologies and their impact on business.
Creating innovation is a process that requires collective knowledge and experience.
Technologies by their very nature can also be seen as products or outputs. Quality systems provide
the conditions to produce the necessary products that meet predefined criteria, directly related to
innovation and aimed at meeting the needs of consumers. The relationship between technology,
innovation and quality is based on creating new value and maintaining the ability to create it in the
future. Companies seeking competitive advantage must be able to effectively manage their ideas.
Ideas management focuses on identifying and selecting relatively few ideas with exceptional quality
from a flow of raw concepts. [1]
In January 2018 the 48th Annual World Economic Forum in Davos, Switzerland has officially
introduced the name Fourth Industrial Revolution (4IR). It is clear that not only this revolution has
not an alternative, but it will undoubtedly change the future prospects of countries and peoples, the
balance of power globally and the map of the world. [9]
With the 4IR, humanity has entered a new phase. 4IR has become a reality for millions of
people around the world, creating new opportunities for businesses, governments and individuals.
The World Economic Forum introduces the new Global Competitiveness Index GCI 4.0, based on
40 years of experience in benchmarking the engines of long-term competitiveness. Having
conceptualized 4IR, World Economic Forum contributes to global thinking and policy development
to integrate the concept of GCI 4.0 into the definition of competitiveness. The index integrates well-
established aspects with new and emerging levers that drive productivity and growth. It emphasizes
the role of human capital, innovation and flexibility as defining features of economic success in the
EU. It calls for better use of economic development technologies, but also warns that this is only
possible as part of a holistic approach with other competitive factors and offers objective, data-
driven analysis for impartial, future-oriented and rational policies and solutions.[9], [7]

Компютърни науки и технологии 1 2019 Computer Science and Technologies 72
The results of GCI 4.0 suggest that most economies are far from "borderline" competitiveness
- an aggregate ideal across all competitiveness factors. In the face of rapid technological change,
political polarization and fragile economic recovery, competitiveness is the definition, evaluation
and implementation of new ways of growth and prosperity. One of the determining factors for long-
term growth and higher incomes is productivity. The new GCI 4.0 sheds light on the emerging set
of factors critical to the performance of the 4IR and requires a new tool to evaluate them.[9], [7]
2. New tools for understanding and assessment of competitiveness
New concepts. With the inclusion of new concepts for data collection, GCI 4.0 provides new
and more nuanced ideas for factors that will increase in importance over the course of 4IR: human
capital, innovation, sustainability and flexibility. These factors are reflected in an entrepreneurial
culture, companies that embrace innovative ideas, multilateral cooperation, critical thinking, social
trust and complement with more traditional components such as Information and Communication
Technologies (ICT) and physical infrastructure, macroeconomic stability, intellectual property,
education.
New metrics. GCI 4.0 introduces a new progress rating from 0 to 100. The limit 100
corresponds to the maximum value for each indicator.
12 pillars of competitiveness. There are totaly 98 indicators in the Competitiveness Index
obtained from a combination of data from international organizations and the World Economic
Forum Report. They are organized into 12 pillars in GCI 4.0 (Fig. 1) [7]
Fig. 1. The Global Competitiveness Index 4.0 2018. [7]
For the second half of the 20th century, the path of development seems relatively clear: lower-
income economies could be developed through progressive industrialization, using low-skilled
labor. In the context of GCI 4.0, the sequence has become less clear as technological and capital
costs are lower than before, but their successful use relies on a number of other factors. And a
strong performance in one pillar cannot compensate for a poor performance in another. Investing in
technology without investing in digital skills will not bring significant productivity benefits. To
increase competitiveness, no area can be overlooked. [7]

Компютърни науки и технологии 1 2019 Computer Science and Technologies 73
Fig. 2. Global Competitiveness Index 4.0 for Bulgaria for 2018. [7]
Technology
4IR is different from the previous industrial revolutions in the way it is based on the merger
of technologies and the increasing harmonization and integration of research fields. Almost every
new development in every field already uses digital capabilities. Advanced robots will not exist
without new approaches to artificial intelligence that depend on digital systems and computing
power. The digital and physical worlds also collide in areas such as autonomous vehicles, 3D
printing etc. Advances in sensors enable robots and autonomous systems to better understand and
respond to their environment and engage in a broader range of tasks beyond the factory where they
have been the most widely used historically. These systems can now access information remotely
through clouds and connect to each other to share information and learn collectively. As the next
generation of robots emerges as an element of the Internet of Things (IoT), there will be an
increasing emphasis on human-machine collaboration. [9]
The physical and biological worlds merge partly thanks to the creation of new materials that
are intended to imitate the biological world. The discovery of new classes of recyclable, thermoset
polymers, called polyhexahydrotriazines, is an important step towards a more sustainable economy.
New materials are now routinely used in medical implants, tissue engineering and the creation of
artificial organs, and 3D printing is increasingly being used to create custom structures. Biological
and digital worlds also overlap in the form of sensors used to monitor personal health and behavior,
in genetic engineering, as well as to understand and influence brain activity. Progress that could
once be limited to digital systems, such as the application of cryptography to blockchain technology
to create programmable, secure and widespread records, is now widespread in the real world. [9]
The progress in computer technology, sensors, mobile connectivity, artificial intelligence,
robotics, 3D printing and advanced materials are changing manufacturing systems. New business
models based on platforms and evolving capabilities to offer new services rather than simply deliver
products will change the way manufacturing companies operate.
Information technology is at the heart of innovation, and advances in the industry are
affecting every business. The digital communications industry is facilitating unprecedented levels of

Компютърни науки и технологии 1 2019 Computer Science and Technologies 74
global Internet usage, online social interaction and financial inclusion. As the industry transforms,
effective policies and regulation that support business can increase productivity. At the same time,
the industry needs to be open to new models of collaboration and governance to better meet the
challenges, such as privacy and growing infrastructure requirements.
4IR has brought about changes in the business model that will significantly disrupt labor
markets. New job categories will appear, while others will disappear. According to the report on the
future of jobs at the World Economic Forum for 2016 most industries will require new skills from
their workers, and 7.1 million jobs will be lost by 2020. [6]
In 2016 The Organization for Economic Co-operation and Development (OECD) reports a
rapidly developing trend of complete replacement of workers with computers. OECD points out that
even mid-level jobs that require some skills are usually routine and thus potentially automated. This
deletion of mid-level jobs, coupled with the expansion of low-skilled jobs and increased demand for
highly-skilled workers, leads to an increase in social polarization. [9]
Quality
The processes of globalization are changing the modern understanding of the management
system - modern management is becoming increasingly involved in market relations, models of
management and organizational forms are changing. The introduction of innovations gives an
advantage and an opportunity to modernize production structures and services, to improve products
and technologies, and to increase their international competitiveness. The long-term goals of
innovation are to increase international competitiveness, stimulate the use of science, technological
solutions and organizational innovations in business. [1]
Given the dominance of the technological and turbulent environment with unprecedented
customer expectations, the development of quality management in the age of Industry 4.0. has and
will have an increasing impact on the economy, decision-making models, business models, human
and technological perspective.[12]
Technology is a broad concept in the context of innovation and encompasses the processes by
which an organization transforms labor, capital and information into products that deliver value to
customers and other stakeholders. This technological concept extends beyond engineering and
manufacturing and covers marketing, investment and management processes. It also includes
quality management.
Technological innovations provide virtually unlimited opportunities to improve the quality of
products and services. This includes innovations in information technology, biotechnology,
nanotechnology, energy technology, social technology and more. The capabilities of new IT
solutions are creating new ways of working in processes and doing business through networks or
ecosystems of organizations, which is also a challenge from a quality management perspective.[12]
The contribution of quality is mainly focused on ensuring that innovation will:
create and strengthen the desired links between the company and the target market sectors;
create the expected purchase value of products and services that integrate innovation by
stimulating some of the perceptions that customers have about those products and services;
provide the resources that internal and external investors and producers of products or
services will require to produce them;
meet the regulatory and security requirements of the clients and institutions of the
countries in which these market sectors are located.
Innovation
The innovation process is the materialization of new ideas, guided by the projection of a very
uncertain future in terms of the methods of use and the return on investment that they will produce.

Компютърни науки и технологии 1 2019 Computer Science and Technologies 75
Innovation is defined as ways to update, change and improve internal processes, production
techniques and management methods. Innovation must meet certain criteria to be successful,
including meeting customer needs, meeting cost and return on investment requirements, improving
employee satisfaction and product quality. Innovation helps to bring new concepts, knowledge,
products, services and processes into organizations and the external market.
Innovative products are the ones that replace or upgrade the current ones. They provide new
features or other benefits that allow users to work more efficiently and cheaply.
Process innovation is about finding better ways to get things done. Compared to product
innovation, there may be no new ingenious idea to build, test, fund, sell, launch, and service. In
some cases, the product is a product with a long product life cycle. Although the product itself can
change very little, although innovation is still important for competitiveness and long-term success.
Therefore, the processes involved in manufacturing and delivering a product are those where
changes can continue to offer more value to customers and stakeholders.
While innovative new products and services, along with new manufacturing and delivery
processes, are often used to improve organizational performance, the entire business model can
become obsolete and inefficient, requiring a dramatic change in the thinking of executives. The
need for innovation in the business model is often driven by the increasing need for flexibility in the
business structure, which in turn is driven by the increasing speed of market change.
Innovation adds value and a successful innovative solution can improve the process and its
outcome. But innovations and improvements are often mentioned in tandem. Not all improvements
are innovations, while most innovations are improvements. However, there are some innovations
that are not improvements. The relationship is shown on the Fig. 3.
Fig. 3. Relationship between innovation and improvement.[9]
There is often a distinction between breakthrough innovation and incremental innovation.
Both types of innovation are valuable to organizations. An organization can benefit greatly when it
is skilled in both breakthroughs and incremental innovation. Much of what applies to quality
technologies can generally be characterized as incremental innovation. However, innovations,
which may not be technologically significant enough to warrant much attention, can still be
extremely economically important. Both types of innovation show benefits for organizations and
customers. Every introduction of an innovation into a product or service brings with it a number of
uncertainties that can lead to different risks of failure. In order to accept a commitment to
significant resources in this type of project, it is necessary to include in their management an
effective regulatory system that is able to identify these risks as quickly as possible in order to avoid
their negative impact, using the full creative potential of the team. This is the natural role of the
quality system integrated in the innovation process. This is about finding and maintaining that
"dynamic equilibrium" between making the most of value creation opportunities and controlling the
risk of failure.[10]
This paper reviews some theoretical linkages between quality and innovation and the way
they could be applied and inter-applied to ensure the most cost-effective competitiveness over time
from the creation of innovation to the production system for the products and services that will
benefit it. An organisation can take a quality approach towards innovation and an innovation

Компютърни науки и технологии 1 2019 Computer Science and Technologies 76
approach towards quality. These specific quality processes are known as "competitive quality
processes".
The innovation process consists of the following steps:
Deciding to promote new ideas to support the company's progress;
Creating an idea that can respond to the needs of society;
Brief characterization of products or services that could benefit from the innovation;
Identifying potential customers for these future products or services;
Characterizing the future uses of products or services that would incorporate innovation;
Creation of experimental projects that present the idea as accurately as possible;
Conducting initial tests for the feasibility of future products or services;
Deciding to initiate prospective studies on how to use the idea for the benefit of the
company;
Conducting prospective studies on the possible socio-economic applications of innovation
and its impact on the company and its position;
Making a decision to guarantee the company's ability to mobilize the necessary resources,
internally and externally, to fully implement its innovation process;
Identification of future stakeholders in the innovation project;
Conducting studies on the nature and feasibility of exchanging with future project
stakeholders required for its full implementation;
Solving contractual issues with these stakeholders and building a processor to carry out the
innovation process;
Building a processor responsible for implementing the innovation process and external
communication network;
Deciding on the gradual design of projects that give a more accurate idea of the idea;
Ggradual design of these projects in order to accurately represent the innovation
configuration;
Deciding to conduct prospective studies on the socio-economic impact of future products
and services that will include innovation;
How can the world achieve economic growth while tackling climate change and other
challenges related to natural resources? The global environment and economic security are
inevitably linked to increasing greenhouse gas emissions, environmental degradation and the
depletion of natural resources, which jeopardize sustainable growth and existing business models.
According to the International Labor Organization's 2016 report till this time, 200 million people
were unemployed globally, and by 2020. More than 300 million additional jobs are needed to
provide livelihood for the next generation of workers. In a 2013 report Carl Benedict Frey and
Michael Osborne from University of Oxford estimate that in the next decade or two, almost half of
all professions may be affected by automation and technology. Therefore, new approaches to job
creation and skills development are urgently needed in both the private and public sectors. [2]
Manufacturing is experiencing a decade of stagnation in productivity and fragmentation of
demand; thus, innovation is delayed. Where innovation in the fourth industrial revolution has taken
place, there is an unprecedented increase in efficiency with minimal relocation of workers. This
demonstrates how advanced technology thinking can create a better, cleaner world through new
levels of production efficiency. The technologies of 4IR can transform the nature of the work itself
by upgrading skills and engaging workers with minimal changes.
Three technological mega-trends are emerging - connectivity, flexible and intelligence
automation. They are the main drivers of the fourth shift in the paradigm of the Industrial
Revolution in manufacturing:
Connectivity - creates connections between discrete network nodes, increasing visibility;

Компютърни науки и технологии 1 2019 Computer Science and Technologies 77
Flexible automation - includes response, automation and remote movement
mechanisms;
Intelligence - automates the recognition and translation of decision-making events.
The adoption of technology on a large scale can have a radical impact on organizations. Early
adoption of technology is crucial, as companies waiting to pass the risks miss out on a large share of
the benefits. Leaders of early-stage companies, instead of waiting for technology and transition
costs, will reap the greatest benefit. Thus, the most important factor here is related to the
competitive advantage of leading players, far exceeding the higher transition costs and capital costs
associated with early adoption. [5]
3. General characteristics of the 4IR
Diffuse technologies in geographical regions and SMEs - the full benefit of 4IR in
manufacturing can only be realized if the value chains and production ecosystems are fully
transformed, including all small and medium-sized enterprises, which contribute 50-60% of value,
added to the OECD countries. Therefore, companies need to spread the technologies of 4IR across
their entire production network and include emerging economies. This will not only improve the
overall results, but will also distribute the knowledge more evenly.
Large and Small Enterprises. Innovation is accessible not only to large organizations but
also to small and medium-sized enterprises (SMEs) that can have transformative impact by focusing
on pragmatic solutions that do not require large investments.
Industrial revolution technologies - The world faces a significant challenge with regard to
climate change, with a recent report of Intergovernmental Panel on Climate Change (IPCC) stating
that emissions must be reduced by 45% by 2030 in order to stay below 1.5°C. Factories must
therefore use the technologies of 4IR to improve their energy efficiency, increase production and
reduce waste and emissions, while increasing overall competitiveness. [13]
Production system innovation. Companies are expanding their competitive edge through
operational excellence. They aim to optimize their production system, increasing productivity and
quality of their operations. They usually start innovating at one or more manufacturing sites and
then deploy them.
End-to-end value-added chain innovation. Companies start new businesses by changing the
economics of operations. They innovate throughout the value chain by offering new or improved
value propositions to customers through new products, new services, more customization, smaller
batch sizes or significantly shorter lead times. Businesses remain focused on innovation and first
transform the value chain, then scale their learning and capabilities in other parts of the business.
Qualitative leap from the industrial to the post-industrial paradigm - 4IR can be
described as a set of new technologies that connect the physical, digital / biological world and affect
everything - economy, technology and society as a whole. This revolution includes "emerging
technological breakthroughs" in areas such as new energy - hot and cold fusion, artificial
intelligence, robotics, IoT, autonomous vehicles, 3D printing, quantum computers, new information
technology, biotechnology and nanotechnology. On the 4IR platform, humanity is entering the post-
industrial paradigm; [9]
Additive Manufacturing vs Subtractive Manufacturing - Production is based on the so-
called. "Manufacturing production." The latter is a fitting name to describe the technologies that
build 3D objects by adding a layer to the material, whether the material is plastic, metal, concrete,
or one day, and human tissue. This type of technology is characterized by the use of computer and
3D modeling software (Computer Aided Design - CAD), machinery and coating materials. After a
CAD sketch is created, the triple-printer apparatus reads CAD data and defines layers down or adds
consecutive layers of fluid, dust, sheet or other layer to layer to produce a 3D object. The term
Additive Manufacturing encompasses many technologies, including subgroups such as 3D printing,

Компютърни науки и технологии 1 2019 Computer Science and Technologies 78
Rapid Prototyping (RP), Direct Digital Production (DDM), production of layers and production of
additives. This is quite different from the so-called. 'Production-taking' characteristic of the
industrial paradigm where, for example, if a workpiece is taken, it is cut, drilled, lathed, sanded, etc.
until the necessary product is obtained;[8]
New energy - it is primarily about the so-called. "Hot" and "Cold fusion", energy from
renewvable power sources etc.
Nanotechnology emerged in the early 1980s. The object of nanotechnology is the study and
manipulation of various nanomaterials. As a result of the difference in scale, most of the
nanomaterials (semiconductors, metals, etc.) form specific physicochemical properties that differ
from those of the same materials in their traditional use. These different properties are used to
create new devices, devices, technologies, methods of diagnostics and treatment in medicine and
others. Often nanotechnologies are called "closing technologies" because their use can lead to a
drastic downsizing or closure of even entire industries, such as the so-called "technology
shutdown". nanomaterial zipper anti-corrosion coatings that make it possible to make timeless
products, ie those that do not corrode; [8]
The Internet of Things (IoT) is a network of physical devices, vehicles, household
appliances and other items, with integrated electronics, software, sensors, drives and network
connectivity that allow these sites to connect and exchange data. Each is uniquely identifiable
through its built-in computing system, but is able to interact within the existing Internet
infrastructure. Experts estimate that by 2020 it will consist of about 30 billion objects. The Internet
of Things allows objects to be recognized or remotely controlled in existing network infrastructures,
creating opportunities for more direct integration of the physical world into computer-based
systems, resulting in increased efficiency, accuracy, and economic benefits in addition to reduced
human intervention. [8]
When technology is complemented by sensors and actuators, technology becomes an example
of a more general class of cyber-physical systems, including technologies such as smart grids,
virtual power plants, smart homes, smart vehicles and smart cities. "Things", in the IoT sense, can
relate to a wide variety of devices, such as cardiac implant implants, farm animal bio-transponders,
live animal feed streams in coastal waters, cars with built-in sensors, DNA analytical monitoring
devices for environmental / food / pathogens or on-site devices that assist firefighters in search and
rescue operations. IoT is an "inseparable combination of hardware, software, data and services."
These devices collect useful data using various existing technologies and then autonomously
transmit data between other devices.
Artificial Intelligence (AI), also known as "Machine Intelligence" (MI) is the intelligence
displayed by machines, as opposed to Natural Intelligence (NI), shown by humans and animals. In
computer science, AI research is defined as the study of "smart agents": any device that perceives
the environment and takes actions that increase its chances of success in achieving any goal.
Objectives of AI:
1. Forming arguments and solving problems;
2. Knowledge presentation;
3. Planning;
4. Training;
5. Language translation;
6. Perception;
7. Movements and manipulation;
8. Social intelligence, ie use for forecasting;
9. Creativity;
10. General intelligence;
The new industrial paradigm needs a new type of human factor in which creative and
innovative potential, self-motivation and self-management are key. At the same time, such a

Компютърни науки и технологии 1 2019 Computer Science and Technologies 79
revolution has led to massive layoffs of people employed. This will create serious social problems
with numerous, diverse and long-term consequences for the development of human society from a
political, economic and cultural point of view if the current social organization of labor is
preserved.
4. Bulgaria faces the challenges of 4IR
Bulgaria faces the challenge of the vital need to change the industrial to the post-industrial
paradigm, i.e. with a new technological mode of reproduction in extremely bad form. High
technology in the face of the electronics industry has disappeared, as have many others. The so-
called "Information services" are mainly at the expense of the so-called Outsourcing which does not
create sufficient conditions for sustainable dynamics for the country. Even the relatively high
growth rates of over 3.5% in recent years are the result of factors related to today's turbulent
environment, i.e. they are also subject to strong fluctuation and instability. In the last two decades in
Bulgaria, no projects have been implemented for the construction of a fundamentally new large
industrial enterprise, of new power plants, of ships. Road infrastructure is in poor condition. It is
undoubtedly very difficult to create a favorable economic environment in a situation where
companies are sunk in debt, with overdue claims exceeding BGN 10 billion. This is the corruption,
the gray and "dark" sectors, the criminalization of business life. Today Bulgaria is at a crossroads.
The future and the decades to come will depend on what direction the country will go now in the
coming years. And that means whether our country will be able to integrate dynamically enough
into the emerging global system of post-industrial division of labor. [8]
5. Conclusion
Overcoming conventional business management thinking requires businesses to respond
quickly to new trends and focus on products, processes, results and customer value. Otherwise, few
companies that support the traditional business approach could survive in today's dynamic business
environment. Integration of processes becomes absolutely essential for the business, as well as the
need for new methods to help organizations become more efficient and competitive. Today's
network economy brings a new and expanded scope of business activity. The use of new
technologies for trading platforms and collaboration requires the introduction of innovative ways to
achieve the desired effect. [3]
New production concepts require fundamentally new ways of technological construction. The
implementation of global information networks allows intensifying production and significantly
improving the quality of the product being manufactured. Special attention is paid to new software
products and their compatibility with the requirements of modern industrial reality, such as
digitalization, artificial intelligence and virtual reality. The place and role of Concurrent
Engineering (CE) in the new world of smart technology is not only a subject of research, but also a
huge challenge for its practical utility. The development of scientific and technical progress led to
such technologies by means of which it is possible the application of modern organizational forms
in the transfer of information as well as for coordination and permanent control of the stages of
development and manufacturing. This development is characterized mainly by improvement of
hardware and software products for transfer of information - computer networks. According to its
scope of activities they are local and global. The development of global information networks
enable the creation of virtual manufacturing where all exchanges of data, results and technologies is
based on the principles of CE. The role of CE for optimization of resources in real time and needs
of flexibility of the engineering process are intertwined with the capabilities of totally integrated
automation. Cooperation between machine-web, machine- man and machine-machine in the value
chain in real time is a modern production system [4].
Компютърни науки и технологии 1 2019 Computer Science and Technologies 80
Some basic guidelines and tools for implementing 4IR in Bulgaria [8]
Nano and biotechnology based on own resources;
New information technology;
Intelligent Mechanical Engineering - end products such as robot production, home robots
etc.;
Smart agriculture;
Humanitarian technologies etc.;
References
[1]. Boer E., Leurent H., Widmer A., ‗Lighthouse‘ manufacturers lead the way—can the rest of the
world keep up?, 2019;
[2]. Frey C. B., Osborne M. A. The future of employment: How susceptible are jobs to
computerasation? September 17, 2013;
[3]. Panayotova T., The Role of Concurrent Engineering in Development and Digitalization of
Industrial Activities, "Innovations in discrete productions", Year VI, Issue 1 / 2018, ISSN
(Print) 1314-8907, ISSN (Web) 2534-8469,
a. https://stumejournals.com/journals/innovations/2018/1/pdf, (p12-14);
[4]. Panayotova T., Development of a formal model for the implementation of business network Re-
engineering, "Innovations", Year VII, ISSUE 1/2019, Sofia, ISSN print 2603-3763, ISSN Web
2603-3771, https://stumejournals.com/journals/innovations/2019/1/pdf, (p 31-35);
[5]. Salvendy G., Handbook of Industrial Engineering - Technology and Operations Management,
ISBN 0471-33057-4, 3 Edition, 2001;
[6]. Schwab Klaus, The Global Competitiveness Report published by the World Economic Forum
2016;
[7]. Schwab Klaus, The Global Competitiveness Report published by the World Economic Forum
2018;
[8]. Стефанов Н., „Четвъртата Индустриална революция―/4ИР/ и България –2018 -
https://pogled.info/avtorski/Nako-Stefanov/chetvartata-industrialna-revolyutsiya-4ir-i-
balgariya.93970
[9]. https://www.weforum.org/agenda/2018/10/10-things-you-and-your-government-should-know-
about-competitiveness-in-the-fourth-industrial-revolution/
[10]. https://intelligence.weforum.org/topics/a1Gb0000000pTDkEAM?tab=publications
[11]. https://asq.org/quality-resources/innovation
[12]. https://www.eaq.ee/quality2013/sites/www.quality2013.eu/files/webform/full-
papers/Tallinn-Helsinki%20EOQ2013.pdf
[13]. https://www.ipcc.ch/sr15/chapter/chapter-5/
For contacts:
Assoc. Prof. PhD Eng. Krasimira Dimitrova
Department of Industrial Management
Technical University of Varna
E-mail: [email protected]

Компютърни науки и технологии 1 2019 Computer Science and Technologies 81
OPPORTUNITIES FOR RESEARCH THE IMPACT OF
INTELLECTUAL CAPITAL ON CREATING VALUE IN
INDUSTRIAL ENTERPRISES
Tanya Panayotova
Abstract: In contemporary realities the value of business emerges as a main criterion for valuation of
effectiveness of each economic activity. The perspective of intellectual capital enables the re-evaluation and
the effective utilization of the hidden resources of the company increasing its value. A review of the
definition of intellectual capital and the methods for its assesment have been made. The choice of VAIC TM
- Value added intellectual coefficient with its co-use with Tobin's Q ratio for evaluation of the company's
intellectual capital is justified. Based on the information collected and analyzed, a formal model for
measuring the IC and its impact on the value of the enterprise is proposed.
Keywords: Intellectual capital, management, model, value, VAIC TM
, Tobin's Q ratio
1. Introduction
In modern conditions, business is facing new and greater challenges associated with the
growing globalization and the development of scientific and technological progress. Organizations
must constantly change their business processes and procedures to respond adequately to the
requirements, expectations and needs of customers and competitors [1]. In a world of constent
changes, a need for new instruments exists which to evaluate business performance efficiency,
which give to the investors and managers a clear idea of the real potential of the company in its
strategic context of development.
The models of development in modern economic conditions show that in order to achieve
prosperity and competitive advantage, companies increasingly rely on the creation and use of
intellectual resources. The traditional economy, associated with the material production of
equipment and consumer products, is increasingly giving way to development, economic
exploitation and transfer of intellectual products. This tesys is also supported by the the information
from sources for creation of value in the developed economies, in which they are shifted from
tangible to intangible assets. The size of the intangible assets, used in the enterprises is growing
constantly as in recent years 87 % of the value of the public companies forming the S&P index is
due to the intangible assets. This conclusion should be reviewed in dynamics, as in 1985 the share
of the intangible assets in the marked value of the companies was only 32 %, which means, that in
30 years the market has increased the role and importance of the intangible assets almost 3 times.
[6].
Studies show that Bulgarian industrial enterpises have many problems, but also great unused
potential for increase of their competitiveness [2]. The existence of significant difference between
the market and accounting value of the enterprise is a proof for the existence of unrecognized non-
material resourses, which are created internally. This potential may be realized through building a
system of consistent activities for improving the opportunities for extracting value from the
intellectual property, intellectual assets and human capital.
The purpose of this publication is to examine the impact of the intellectual capital on the
creation of value in the industrial enterprises and on this ground to propose a model for analysis and
assesment.

Компютърни науки и технологии 1 2019 Computer Science and Technologies 82
2. Summarized staging
Intelecual capital as expression of the non-mateiral advantages of the business
The methodology of the current study is subordinated to the aim set. On this basis, a review
of the definition of intellectual capital (IC) as expression of the non-material advantages of the
business has been made.
For the first time the term ―intellectual capital‖ was used in 1968 by John Hallbraith in
context of ―intelecual activity‖. In the scientific literature the term was justified in 1991 by
Steward, according to whom, the intelecual capital represents ―capital asset, comprising of an
intellectual material‖. To be consireded as intellectual capital, the knowledge must be asset, capable
to be used for creation of wealth [11]. A few years later Edvinsson (1977) associated IC with
―possessing of knowledge, practical experience, technology of work, customer relation and
professionall skills, which give competitive advantage on the market‖ [3]. The term has been
examined by many other authors such as Mouritsen (1998, 2000), Lynn (1988, 2000), Bukh, Larsen
and Mouritsen (2001), Guthrie, Yongvanich (2004), Bulyga (2005), Chan (2009) and other. Modern
business process concepts impose for an increasingly widespread presentation of intellectual capital
(IC) as an integrated indicator for the value of all kinds intellectual assets of the companies.
It is difficult to identify accurately and define the essence of IC. From the examined literature
sources, it appears that different variations in definitions exist. In general, it can be accepted that it
is complex, dynamically changing component of generaion of an economic value and it‘s character
is intangible. There are three basic elements in the structure of the IC - human capital, structural
capital and relationship capital. In order to generate value added of the company, it is important that
the essential elements of the IC to be in continuous interaction. It follows that the creation of wealth
for the organization is based on a chain of transfers, i.e. individual knowledge and skills (human
capital) in organizational knowledge and practices (structural capital), which subsequently affects
the client capital through provision of new products and services.
The emergence of a concept of the IC is seen as a development of a concept for development of the
intangible assets, for which a greater clarity as a way of reporting exists. The issues related to
intangible assets are normatively definied in the International Accouting Standarts (―IAS‖) - 38
Intangible Assets. One of the major problems associated with the accounting and measuring of the
IC is the fact that its core elements are difficult to formalize and measure. This is also the perceived
difference between IC and intangible assets, namely only the elements of the IC that are measurable
and have found a place in the company's balance sheet as intangible assets. In this way a sources
that form the core value for companies remain unaccounted, for which in line with the maxim "you
can only manage what you know," has a negative impact on the processes of developing strategies
and decision-making on the management of enterprises by the managers [5].
3. Choise of approach for evaluation of intellectual capital
The various conditions (internal and external) of existence and realization of the activity of
organizations from different areas of the economy, the views on the determining parameters of the
value of the IC, the pursuit of their full identification and coverage in the analysis and the
assessment lead various companies and researchers to develop multiple methods for assessing IC.
At present, the most comprehensive classification and systematization of the most significant
methods used to estimate the value of ICs is made by (Sveiby), who, as a result of years of
observations and studies, identifies and describes 44 of them, performs their grouping by common
features, dividing them into four groups: [5]
- Direct Intellectual Capital Methods (D1C) - The components of the IC for each
organization may be different. They are individually identified and measured by a system of
indicators, after which the full value is determined by summing the value of the individual

Компютърни науки и технологии 1 2019 Computer Science and Technologies 83
indicators;
- Market Capitalization Methods (MCM) - the difference between the market capitalization
and the calculated share capital of the company is the IC. It is calculated on the basis of the
full value of the intangible assets in financial terms, the measurement of IC is overall, most
often by calculating the difference between the market value and the carrying amount of the
company.
- Return on Assets Methods (ROA) - methods by which the growth of intangible assets and
annual financial results are compared with industry averages. The value of the excess over the
industry average for a given industry is used to calculate the IC value.
- Scorecard Methods (SC) - the various components of the IC are identified and their value is
determined on the basis of score cards or graphs. This group of methods is the only one that
does not use financial terms when evaluating the IC. The value of individual intangible assets
is determined by various indicators, which are presented individually in tables and graphs.
Depending on the goals set and the required management information, a summary assessment
can be made.
However [10], these methods do not characterize the value added generated by intellectual
capital. As Kasarova (2013) points out, the best idea of the effectiveness of IC is given by the
VAICTM
model - Value added intellectual coefficient, which takes into account the effectiveness of
tangible and intangible assets through the value they generate when being used together [4].
3.1. Model VAIC TM
- Value added intellectual coefficient
VAIC TM
is a trademark of Intellectual Capital Center and provides a single base for
comparison between companies in different economies and economic sectors and uses information
from financial statements. VAIC demonstrates the intellectual capacity of the company and its
overall efficiency. The higher its value, the higher the potential of the company is and its ability to
create added value, which is, in fact, a new way of understanding organizational performance [4].
The basic idea of the indicator is that the the successful crealation of value is related to the
efficient use of IC and the capital employed (CE).
Or:
𝑉𝐴𝐼𝐶 = 𝐼𝐶𝐸 + 𝐶𝐸𝐸 (1)
Whereas:
ICE - Intellectual Capital Efficiency
CEE- Capital Employed Efficiency
1) Intellectual Capital Efficiency
VAIC views ICE as the sum of its components: Human Capital Efficiency and
StructuralCapital Efficiency:
𝐼𝐶𝐸 = 𝐻𝐶𝐸 + 𝑆𝐶𝐸 (2)
where:
HCE - Human Capital Efficiency
SCE - StructuralCapital Efficiency
Human capital is a key resource for generating value added in the company and is treated as
an investment rather than an expense. Human capital efficiency (HCE) is calculated as the ratio
between value added (VA) and human capital (HC):
𝐻𝐶𝐸 =𝑉𝐴
𝐻𝐶 (3)
With an HCE value below 1, it can be concluded that the company does not create enough
value added with which to cover its obligations to its employees. Optimal HCE levels take values

Компютърни науки и технологии 1 2019 Computer Science and Technologies 84
above 2.5 and indicate highly efficient organisation. They are usually observed in high-tech
industries.
Value added (VA) is formed by the amount of profit before interest and taxes (EBIT),
depreciation of tangible and intangible assets (DA) and human capital (HC):
𝑉𝐴 = 𝐸𝐵𝐼𝑇 + 𝐷𝐴 + 𝐻𝐶 (4)
The second component of intellectual capital - Structural Capital Potential (SCE), is
calculated as a ratio between Structural Capital (SC) and Value Added (VA):
𝑆𝐶𝐸 =𝑆𝐶
𝑉𝐴 (5)
Structural capital (SC) represents the difference between value added (VA) in a company and
human capital (HC), measured by the cost of salaries and social security of the company.
𝑆𝐶 = 𝑉𝐴 − 𝐻𝐶 (6)
The structural capital (SC) is depending on the created value added and in inverse proportion
with the human capital. In other words, the greater the share of human capital (HC) in value added
(VA) is, the smaller the share of structural capital (SC) is. It is logical that the potential of human
(HC) and structural (SC) capital should increase with the increase in overall efficiency of
intellectual capital.
According to Pulic [8], the effectiveness of intellectual capital refers to the work of
knowledge-carrying employees and embodying it in created products and services.
2) Invested Capital Efficiency (CEE)
In order to obtain complete information on the efficient use of the company's resources, the
potential of invested (deposited) capital (CEE) must also be taken into account. Its role cannot be
neglected, as the intellectual capital operates jointly with physical and financial capital:
𝐶𝐸𝐸 =𝑉𝐴
𝐶𝐸 (7)
3) Overall indicator for overall efficiency
In order to provide a single overall indicator for overall efficeny in creation of value added,
the three performance indicators need to be collected:
𝑉𝐴𝐼𝐶 = 𝐻𝐶𝐸 + 𝑆𝐶𝐸 + 𝐶𝐸𝐸 = 𝐼𝐶𝐸 + 𝐶𝐸𝐸 (8)
The VAIC ratio can be viewed as a first step in the process of defining the intellectual
involvement in value creation within a company.
According to the author of this publication, defining the situation in an enterprise in terms of
its intellectual capacity and its overall efficiency, requires tracing the amendmend in ∆VAIC
between two comparable periods. Based on the results obtained, an analysis and evaluation of the
degree of the value creation process and the degree necessary for the enterprise are made.
The VAIC meter has rather diagnostic nature, which requires its use with other systems and
models for assessing the company's intellectual capital.
This study proposes that the potential use of VAICTM
to be related with its jointly use with
Tobin's Q ratio.
3.2. Tobin's Q ratio) – (q)
It is a method of measuring the value of a company‘s IC, which can be classified to Market
Capitalization Methods (MCM). The ratio is the proportion between the market value of the

Компютърни науки и технологии 1 2019 Computer Science and Technologies 85
company's shares to their book value or the market value of the company to the book value of the
company [12].
The indicator reflects all components of the value which are not reflected in the financial
statements. In addition to such diverse factors as predictable future earnings, broker concerns,
expert opinions and market failures, it indirectly reflects and the intangible assets, most commonly
referred to as "intellectual capital".
If q>1, this means that the market value is higher then the balance value, which results to the
effect of a factor unaccounted by the traditional accounting practice and this difference is mainly
due to the value of the company's IC. This is a sign for the investors to invest in the company
because the assets (shares) are worth more than what was paid for them. On the contrary, if q <1,
the book value of the assets is higher than the market, therefore, no funds should be invested in
them and the company should release itself from the assets that lead to this decrease.
4. Formal model for assessing the impact of the intellectual capital
In this study, the author proposes a formal model for measuring the IC and its impact on the
value in the enterprise, which contains several steps:
Stage One: Defining the situation of the enterprise.
As a first step of the algorithm, it is necessary to calculate the IC‗s value by joitnyl using
VAICTM with the Tobin Ratio (q).
Second stage: Analysis and assessment of the situation.
At this stage, the change in ∆VAIC and ∆ q between two comparable periods is calculated, as
a result of which the achieved level of the process for creation of value is determined and the
required level is formulated.
Third stage: Creation of IC navitagor (Intellectual capital navigator - ICN).
ICN is a digital and visual representation of managers' perceptions of the ability of different
opportunities to create value for the organization. Thereby, they can follow the interrelations
between the elements, their relative importance to the company, the ways of transfusion (transition)
from one kind to another [5]. The successful introduction of the ICN creation process has been used
with some refinement and adaptation of the model proposed by Roos, Pike, and Fernstrom (2005)
[9]. The choice is mainly justified by the fact that the model best represents the essence of the
process and, in the author's opinion it corresponds to the greatest extent to the specifics of the
creation of value.
The essence of the modified ICN model creation is represented in several basic steps:
Identifying the sources of value for the organization and deploying them in a form of
a resource distinction tree (RDT). Each organization's resources portfolio can be divided into five
categories. Traditional economic resources are divided into two categories - monetary and physical,
while IC-related resources are divided into three categories - resources from external (mostly client)
relationships (ER), organizational resources (OR) and human resources (HR). Behind this division,
the main characteristic lies on the differences in the approach and the way they are managed and
operated. RDT is shown in Fig 1.

Компютърни науки и технологии 1 2019 Computer Science and Technologies 86
SOURCES OF VALUE FOR
THE COMPANY
HUMAN
ORGANISATIONAL
RELATIONS
PHYSICAL
MONETARY
1
Accumulation of
knowledge
Creating
competence
Motivation and
commitment
Appropriate
behavior
Ability to formulate
problems
Network relation
creation
Network relation
managing
Network relation use
Ability to solve
problems
2
Research and
technology
Management
system
Quality control
system
Financial control
system
Information
archive
Organisational
structure
Trademarks and
brands
Intelectual
property
Processes
3
Customer
requirements
New Clients
Potential
employees
Owners
Strategic partners
Main suppliers
Sources of funding
Public
Supporter
organisations
4
Prototypes
Enterprise and
equipment
5
1 Revenue
2 Revenue
3 Revenue
4 Revenue
Fig. 1. Sources of value for the company
Specifying the sources of value for the organization. Following of this procedure requires
passing from sumarised approach of the assesemnt of the activities and processes in the
organization to looking at the details, in their fundamental sources of value.
Determining the relative importance (weights) of sources of value. The sources of value
have different importance for maximizing the benefits of the enterprise. Therefore, they should have
different weight at the assessment of the impact of IC in the creation of value.
Determining the level, to which the sources meet the requirements and the contribution of IC
in the creation of value.
Fourt stage: Drafting summarized assessment and management decision.
The summarized assesement of the level, in which the sources of value meet the requirements
for maximizing the benefits of the enterprise, are determined by taking into account the reporting of
the common assesments of the degree of satisfaction of the individual sources and the relative
importance of those sources.
Stage Five: Implementation of a system for realization and control

Компютърни науки и технологии 1 2019 Computer Science and Technologies 87
5. Algorithm of the model
Stage One:
Defining the
situation of the
enterprise
ButtonCalculate the IC‗s value by joitnyl using
VAIC with the Tobin Ratio (q).
Second stage:
Analysis and
assessment of the
situation.
Third stage:
Creation of IC
navitagor
(Intellectual capital
navigator - ICN).
ButtonCalculate the change in ∆VAIC and ∆ q
between two comparable periods
Determining the achieved level of the
process for creation of value
The required level is formulated
Button
Identifying the sources of value for the
organization and deploying them in a
form of a resource distinction tree (RDT
ButtonSpecifying the sources of value for the
organization
ButtonDetermining the relative importance
(weights) of sources of value
Button
Determining the level, to which the
sources meet the requirements and the
contribution of IC in the creation of value
Fourt stage:
Drafting summarized
assessment and
management
decision.
Stage Five:
Implementati
on of a system for
realization and
control
Fig. 2. Algorithm of the model
Conclusion
A need for new tools for evaluating the efficiency of business operations exists, which gives
not enough clear view to the investors and managers about the real potential of the company in the
strategic context of its development.

Компютърни науки и технологии 1 2019 Computer Science and Technologies 88
Studies show that industrial enterprises in Bulgaria have great unused potential to increase
their competitiveness. . This potential may be realized by building a system of consistent activities
for improving the opportunities by extracting value from the intellectual property, intellectual assets
and human capital. In support of this thesis are the results from a survey among enterprises from
different sectors in the country [7]. The main questions in the survey have included information for
indicating the portfolio of resources from:
- external relations (mostly client);
- organizational resources (research on technology, organizational structure, processes,
patents issued for inventions, certificates of registered utility patents, registered trademarks,
registered industrial designs, other intellectual property);
- human resources (competence, attitudes, intellectual qualities).
The analysis of the results of the survey outlines several summaries [7]:
The management of activities, associated with the intellectual capital is a complex and
contradictory task for companies; it is difficult to systematize the available information in an
orderly perspective.
Only the elements of intellectual capital that are measurable and took place in the company's
balance sheet are classified as intangible assets;
Much of the intellectual capital‘s value is brought indirect to the company. It cannot be
directly associated with the realization of the corporate value. Therefore, the relationship between
them is often difficult to be identified and even more difficult to quantified;
The contribution of intellectual capital to the company is expressed in revenues from
products and services, R&D protection against infringement of foreign intellectual property rights,
protection of intellectual property rights.
On the basis of these summaries, it can be concluded that IC, as an expression of the non-
material advantages of the business, is not enough known in practice. The value which is generated
as a result of an IC can only be maximized if its basic elements are known and the economic
processes are managed systematically and deliberately. This entails adopting of a new management
approach that goes beyond the limitations of traditionally applied management approaches and
continually monitors the factors that influence the recognition of intellectual capital and the need to
implement good management practices.
This publication proposes a formal model for measuring of the IC and its impact on the
enterprise value. The assessment of the impact of the intellectual capital gives opportunity to
rethink the hidden resources, which help to turn the value into profit.
References:
[1]. Dimitrova, K. Innovative Information and Communication Technologies - a Precondition for a
Higher Competitiveness of the Organization Proceedings of the 1st International Conference
―Applied Computer Technologies‖, ISBN 608-66225-0-3, University of Information Science
and Technology ―St. Paul the Apostle‖ – Ohrid, Macedonia, 2018.
[2]. Dimitrova, K. Modeling, measurement and management of business processes in organization
Advances in Intelligent Systems and Computing, Print ISBN 978-3-319-68323-2, Online ISBN,
978-3-319-68324-9. DOI: 10.1007/978-3-319-68324-9_45EID: 2-s2.0-85031286968 Springer,
Cham България, 2018, pp 410-419.
[3]. Edvinsson, L., Malone, M. Intellectual Capital: Realizing your Company‘s True Value by
Finding Its Hidden Brainpower. Harper Business. New York. 1997.

Компютърни науки и технологии 1 2019 Computer Science and Technologies 89
[4]. Kasarova, V. The New Metrics of Corporate Financial Success. Evdemonia Production LtD,
Sofia, 2013.
[5]. Mitev, N., Methods for evaluation of intellectual assets of the organization. Softrade, Sofia,
ISBN 978-954-334-144-3, 2013.
[6]. Ocean Tomo LLC, http://www.oceantomo.com/blog/2015/03-05-ocean-tomo-2015-intangible-
asset-market-value/, 2015.
[7]. Panayotova and team, Opportunities For Management of Intellectual Capital at Industrial
Enterprises in North-Eastern Region, Annual Journal of Technical University of Varna., Vol. 2,
http://www2.tu-varna.bg/tu-varna/index.php/izdatelska-deinost/2018-02-12-08-19-09/2018-02-
12-07-47-48, 2016, pp 43-45.
[8]. Pulic, A., Intellectual capital – does it create or destroy value?. Journal of Business Performance
Management, vol.8, No.1, 2004.
[9]. Roos G., Pike S. and Fernstrum L. Managing Intellectual Capital in Practice. Butterworth-
Heinemann, Elsever Inc, 2005.
[10]. Sveiby, K., The New Organizational Wealth: Managing and Measuring Knowledge- Based
Assets. San Fransisco: Berrett-Koehler Publishers Inc, 1997.
[11]. Stewart, T. Intellectual capital. The new wealth of organizations. New York. Doubleday/
Currency. 1997.
[12]. Tobin, J., A General Equilibrium Approach To Monetary Theory, Journal of Money, Credit
and Banking, Vol. 1, No. 1, Available from: http://www.jstor.org/stable/1991374), 1969, pp. 15-
29.
For contacts:
Assoc. Prof. Eng. Tanya Panayotova, PhD
Department of Industrial Management
Technical University of Varna
E-mail: [email protected]

Компютърни науки и технологии 1 2019 Computer Science and Technologies 90
MODEL OF ADAPTIVE CONTROL OF DISTRIBUTED
PARAMETERS THERMAL SYSTEMS
Dian B. Dzhibarov
Abstract: Discreet models are developed for describing a class of thermal systems with partial differential
equation. Different algorithms have been studied for parameter identification: method of least square error
/MLQ/; extended method of least square error /EMLQ/; method of iterative quadratic maximum likelihood
/IQML/ and various algorithms for evaluating controller parameters: controller with dead motion /CDM/;
controller with minimal deflection /CMD/. Control problems for distributed parameters systems, described
by parabolic PDEs plate type have been investigated.
Keywords: Partial differential equation (PDE), distributed parameter systems, heat transfer, adaptive control
design
1. Introduction
The design of adaptive control for thermal dynamic systems, described with distributed
parameters have been studied in the recent years. Different processes like diffusion, convection,
heat transfer are part of a huge diversity of applications in engineering and science researching. The
book [4] introduces a methodology for adaptive control of parabolic PDEs with unknown
parameters such as reactors, convection-diffusion systems in chemical, thermal, aerospace and
energy systems. Some approaches to discretization of models with distributed parameters are
investigated to eliminate or reduce initial and boundary value problem , [3] proposed method of
integrodifferential relations MIDR for optimal control design heat transfer, [5] use variation of
principle of the MIDR applied in the PDE systems, [2] explore thermal systems, controlled from
the boundary and contain unknown parameters that affect entire area.
2. Setting the task
One case of systems modeled with private differential equations is heat control in the plate
with length L, with coefficient of thermal conductivity a. Thermal objects with distributed
parameters are describe by parabolic differential equation type:
),(),(),(
2
2
txfdx
txda
dt
txd
(1)
Where:
a is the coefficient of thermal conductivity,
θ - the function, describes the distribution of temperature,
x - space variable,
t - time and
f (x, t) - function of the disturbing impacts. The problem is solved in the presence of
inhomogeneous and homogeneous boundary conditions of the type:
00 )()0,( xx (2)
ututLt )(),(),0( (3)
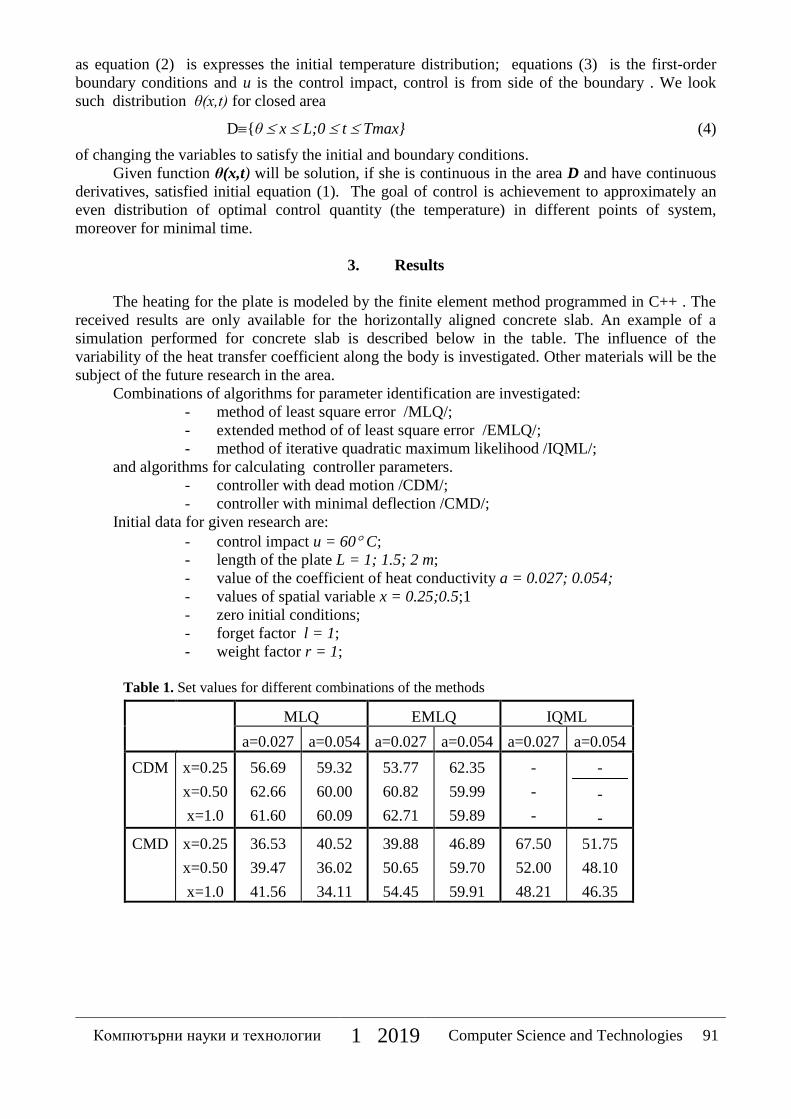
Компютърни науки и технологии 1 2019 Computer Science and Technologies 91
as equation (2) is expresses the initial temperature distribution; equations (3) is the first-order
boundary conditions and u is the control impact, control is from side of the boundary . We look
such distribution θ(x,t) for closed area
D{θ x L;0 t Tmax} (4)
of changing the variables to satisfy the initial and boundary conditions.
Given function θ(x,t) will be solution, if she is continuous in the area D and have continuous
derivatives, satisfied initial equation (1). The goal of control is achievement to approximately an
even distribution of optimal control quantity (the temperature) in different points of system,
moreover for minimal time.
3. Results
The heating for the plate is modeled by the finite element method programmed in C++ . The
received results are only available for the horizontally aligned concrete slab. An example of a
simulation performed for concrete slab is described below in the table. The influence of the
variability of the heat transfer coefficient along the body is investigated. Other materials will be the
subject of the future research in the area.
Combinations of algorithms for parameter identification are investigated:
- method of least square error /MLQ/;
- extended method of of least square error /EMLQ/;
- method of iterative quadratic maximum likelihood /IQML/;
and algorithms for calculating controller parameters.
- controller with dead motion /CDM/;
- controller with minimal deflection /CMD/;
Initial data for given research are:
- control impact u = 60 C;
- length of the plate L = 1; 1.5; 2 m;
- value of the coefficient of heat conductivity a = 0.027; 0.054;
- values of spatial variable x = 0.25;0.5;1
- zero initial conditions;
- forget factor l = 1;
- weight factor r = 1;
Table 1. Set values for different combinations of the methods
MLQ EMLQ IQML
a=0.027 a=0.054 a=0.027 a=0.054 a=0.027 a=0.054
CDM
x=0.25
x=0.50
x=1.0
56.69
62.66
61.60
59.32
60.00
60.09
53.77
60.82
62.71
62.35
59.99
59.89
-
-
-
-
-
-
CMD x=0.25
x=0.50
x=1.0
36.53
39.47
41.56
40.52
36.02
34.11
39.88
50.65
54.45
46.89
59.70
59.91
67.50
52.00
48.21
51.75
48.10
46.35

Компютърни науки и технологии 1 2019 Computer Science and Technologies 92
4. Conclusions
One of the goals on the topic is to consider the behavior of the distributed parameters system
with random noise in the area {-2, 2} and no noise and combination of heat conductivity coefficient
and spatial variables. The results show that the obtained temperature can differ by several degrees
when the body is heated. This demonstrates that the variability of the heat transfer coefficient along
the surface of the body should be taken into account when considering a problem of heat transfer in
materials with low conductivity. The designed model and the developed approach can be used
when modeling the heat transfer for more control laws in the future.
References:
[1] Велев К. , Адаптивни системи, Темпус, София, 1995
[2] Джибаров Д., Адаптивно управление на топлинни обекти с разпределени параметри,
Journal of the Technical University at Plovdiv ―Fundamental Sciences and Applications‖, Vol.
13, 2006 Anniversary Scientific Conference‘ 2006
[3] Asherman H., Kostin G., Saurin V., Approaches to control design and optimization in heat
transfer problems – Journal of Computer and Systems Sciences International, 2010, pp. 380-391
[4] Krstic M.& Smyshlyaev A., Adaptive control of parabolic PDEs: Princeton University press,
2010.
[5] Rauh A., Asherman H, Saurin V, Kostin G., Verification and experimental validation of flatness
based control for distributed heating systems, International review of mechanical engineering,
2010, pp. 188-200
For contacts:
Assistant professor, Dian B. Dzhibarov
Department of Automation
Technical University of Varna
E-mail: [email protected]
Компютърни науки и технологии 1 2019 Computer Science and Technologies 93
IDENTIFICATION OF NONLINEAR SYSTEMS USING HAAR
WAVELET FUNCTIONS
Mariyana Todorova, Reneta Parvanova
Abstract: Wavelet functions are aveable for describing functions, including nonlinear functions, due to their
interesting properties. Haar wavelets are a set of complete orthogonal basis. The attention is directed to them,
therefore thay are easy to use and computations. Application of Haar wavelet functions method for
identification of nonlinear dynamic systems is described in the paper. Both the effect of noise and sampling
period on the accuracy of the obtained parameter estimates is evaluated.
Keywords: Haar wavelet functions, nonlinear model, parameter identification, second order mathematical
model
1. Introduction
The wavelet functions are applied successfully to approximation of functions [1]-[6], signal
processing [7]-[12], fault detection [13], identification [14]-[15], etc.
Due to their properties of finite support and self - similarity, they are suited to depict functions
with local nonlinearities and fast variations. For signals represented as functions of time, the wavelet
functions provide efficient localization in both time and frequency or scale.
A family of wavelets can be constructed from a function 𝜓 𝑡 𝜖𝐿2(𝑅). It denote the vector space
of measurable functions that are absolutely and square integrable:
𝜓(𝑡)
∞
−∞𝑑𝑡 < ∞ (1)
𝜓(𝑡) 2∞
−∞𝑑𝑡 < ∞ (2)
Sometimes ψ(t) is known as a "mother wavelet" which is confined in a finite interval. "Daughter
wavelets" 𝜓𝑎 ,𝑏 𝑡 are then formed by translation b and contraction a.
𝜓𝑎 ,𝑏 𝑡 =1
𝑎𝜓
𝑡−𝑏
𝑎 , a, b ∈ R, a≠0 (3)
where a is positive and defines the scale and b is any real number and defines the shift. The pair (a,
b) defines a point in the right half plane R+ × R.
The Haar wavelets, proposed in 1909 by Alfred Haar, are the simplest type of wavelets. The
obtaining of this kind of wavelets is done by a basic (mother) wavelet function ψ(t) and a scaling
function φ(t), which are determined by the following formulas:
𝜓 𝑡 = 1, 0 ≤ 𝑡 < 1/2−1, 1/2 ≤ 𝑡 < 1
0, 𝑜𝑡ℎ𝑒𝑟𝑤𝑖𝑠𝑒
(4)
𝜙 𝑡 = 0, 0 ≤ 𝑡 < 1 1, 𝑜𝑡ℎ𝑒𝑟𝑤𝑖𝑠𝑒
(5)

Компютърни науки и технологии 1 2019 Computer Science and Technologies 94
The orthogonal set of Haar functions (Fig.1) is a group of square waves with magnitude of
1 in some intervals and zeros elsewhere. Just these zeros make the Haar transform faster than other
square functions such as Walsh‘s.
Fig. 1. Orthogonal set of Haar functions
In discrete form, Haar wavelets are related to a mathematical operation called the Haar
transform. The Haar transform can be used for removing noise.
Haar wavelets are used to expand all signals, since thay can form a complete orthogonal basis
for the appropriate function space. In doing so, the differential equations can be transformed into a
system of algebric equations in unknown parameters or into matrix equations. Using the least
squares method, the unknown system parameters are estimated.
In the paper the Haar wavelet method is applied to the identification of dynamic systems,
described by second order nonlinear mathematical models. Several good properties of Haar wavelets
are used in the algorithm. The identified model is validated by comparing the simulated output
signal with that of the obtained mathematical model. The summary relative parameter errors and
relative output errors are also used for comparison.
2. Application of Haar wavelet functions in defining the mathematical model parameters
Let it be assumed that the mathematical model is of the type
𝑎 4. 𝑦′′ 𝑡 . 𝑦′ 𝑡 + 𝑎 3. 𝑦′′ 𝑡 + 𝑎 2.𝑦′(𝑡) + 𝑎 1. 𝑦(𝑡) = 𝑢(𝑡) (6)
The estimation of the parameters of equation (6) can be done by the following basic steps.
1) Representation of the equation (6) into a matrix form
𝐴. 𝑄 = 𝑈 (7)
where:
A - a matrix containing the approximating and detailing coefficients of the output of the system;
U - a matrix containing the approximating and detailing coefficients of the input of the system;
Q - a matrix containing the model parameter estimations.
2) Application the least squares method to solve the matrix equation and find the desired
parameter estimates.
0 1 2 3 4 5 6 7 8 9 10-2
0
2
0 1 2 3 4 5 6 7 8 9 10-2
0
2
0 1 2 3 4 5 6 7 8 9 10-2
0
2
0 1 2 3 4 5 6 7 8 9 10-2
0
2
0 1 2 3 4 5 6 7 8 9 10-2
0
2
0 1 2 3 4 5 6 7 8 9 10-2
0
2
0 1 2 3 4 5 6 7 8 9 10-2
0
2
0 1 2 3 4 5 6 7 8 9 10-2
0
2

Компютърни науки и технологии 1 2019 Computer Science and Technologies 95
3) Quality assessment of the resulting model.
3. Numerical experiments
Numerical experiments with equation (6) were performed to confirm the working efficiency
of the method, where the exact values of the parameters are as follows: 𝑎4 = 0; 𝑎3 = 400; 𝑎2 = 4;
𝑎1 = 1. The oscillations y(t) at sampling interval Δt = 0.1s and time of observation T0 = 1200s are
simulated. Using wavelet functions properties, the differential equation (6) can be represented as the
following matrix equation
𝑎𝐿,1𝐼𝑉 𝑎𝐿,1
𝐼𝐼𝐼
𝑎𝐿,2𝐼𝑉 𝑎𝐿,2
𝐼𝐼𝐼
𝑑𝐿,1𝐼𝑉
𝑑𝐿,1𝐼𝐼𝐼
𝑑𝐿,2𝐼𝑉
𝑑𝐿,2𝐼𝐼𝐼
𝑎𝐿,1𝐼𝐼 𝑎𝐿,1
𝐼
𝑎𝐿,2𝐼𝐼 𝑎𝐿,2
𝐼
𝑑𝐿,1𝐼𝐼 𝑑𝐿,1
𝐼
𝑑𝐿,2𝐼𝐼
𝑑𝐿,2𝐼
.
𝑎 4
𝑎 3
𝑎 2
𝑎 1
=
𝐴𝐿,1
𝐴𝐿,2
𝐷𝐿,1
𝐷𝐿,2
(8)
where:
L- decomposition level;
aL- level approximation of the output signal;
dL- level detail;
𝑎 4 , 𝑎 3, 𝑎 2, 𝑎 1 - parameter estimations;
AL = level approximation of the input signal u(t).
Suitable Matlab file is proposed using the algorithm. The estimations of the parameters of the
mathematical model (6), the summary relative parameter error δ and the relative output error Е are
obtained. The original output signal y(t) and the model output signal ym(t) are compared and are
shown in Figs. 2 – 4.
Fig. 2. The original output signal y(t) and the model output signal ym(t) (∆t=0,1s)

Компютърни науки и технологии 1 2019 Computer Science and Technologies 96
Fig. 3. The original output signal y(t) and the model output signal ym(t) (∆t=1s)
Fig. 4. The original output signal y(t) and the model output signal ym(t) (∆t=4s)
The sampling interval ∆t significantly affects the values of the parameters as shown in Figs.
2 - 4 and Table 1.

Компютърни науки и технологии 1 2019 Computer Science and Technologies 97
Table 1. Influence of the sampling interval ∆t over the accuracy of the model
∆t [s] 0.1 1 4
𝑎 4 0.0000 0.0000 0.0000
𝑎 3 400.2009 402.0871 409.4162
𝑎 2 4.1000 5.0008 8.0134
𝑎 1 1.0000 1.0000 1.0000
E [%] 0.0013 0.0950 0.7387
δ [%] 0.0561 0.5786 2.5588
The impact of the noise level γ over the model accuracy is shown in Fig. 5 and Table 2.
Table 2. Influence of the noise over the model accuracy
γ [%] 0 0.10 0.25 0.50
𝑎 4 0.0000 24.0602 157.9510 588.6595
𝑎 3 409.4162 407.6009 398.6547 370.0009
𝑎 2 8.0134 8.0133 8.0156 8.0246
𝑎 1 1.0000 0.9999 0.9992 0.9969
E [%] 0.7387 0.7360 0.7275 0.7930
δ [%] 2.5588 6.3870 39.4998 147.3515
Fig. 5. The original output signal y(t) and the model output signal ym(t) ((∆t=4s, γ=0,5%)
Increasing the noise level has the greatest influence on the estimation of the parameter a4.
4. Conclusions
The paper examines the possibility of applying Haar wavelet functions in parameter identification of second order nonlinear mathematical model. The results indicate that the Haar wavelet method can reliably identify the characteristics of the second order systems. The presented studies examine the impact of the sampling interval over the accuracy of the assessment of the parameters of the model. By decreasing the sampling interval, a relative error at output E =

Компютърни науки и технологии 1 2019 Computer Science and Technologies 98
0.0013% is reached. Based on the obtained results using deteriorated data, it can be concluded that the noise level significantly affects the parameters with small values.
References
[1]. Cao, L., D. Chen, J. Fan, Face Recognition Using the Wavelet Approximation Coefficients and
Fisher‘s Linear Discriminant, 5th International Congress on Image and Signal Processing (CISP
2012), 2012, pp. 1253-1256.
[2]. Riera-Guasp, M., A. Antonino, J. Roger-Folch, P. Molina, The use of the wavelet
approximation signal as a tool for the Diagnosis of Rotor Bar Failures, Vienna, Austria,
International Symposium on Diagnostics for Electric Machines, Power Electronics and Drives -
SDEMPED 2005, 2005.
[3]. Tam, K., S. Wong, C. Tse, Wavelet-Based Piecewise Approximation of Steady-State
Waveforms for Power Electronics Circuits, IEEE International Symposium on Circuits and
Systems, 2005, pp. 2490-2493.
[4]. Todorova, M., R. Parvanova, Application of wavelet functions in signal approximation,
Macedonia, The 1st International Conference Applied Computer Technologies (ACT 2018),
2018, pp. 86 – 89.
[5]. Vetterli, M., Wavelets, Approximation, and Compression, IEEE Signal Processing Magazine,
2001, pp. 59-73.
[6]. Yang, J., S. Fu, L. Yuan, H. Ma. Iterative Learning Control Using Wavelet Approximation for
Permanent Magnet Linear Synchronous Motor, Seoul, Korea, Proceeding of International
Conference on Electrical Machines and Systems, 2007, pp. 614-618.
[7]. Damlamian, А., S. Jaffard, Wavelet Methods in Mathematical Analysis and Engineering,
France, Universite Paris XII, 2010, pp.179.
[8]. Liu, J., Damage Detection via Wavelet Transform, Taiwan, Graduate Institute of
Communication Engineering College of Electrical Engineering and Computer Science National
Taiwan University, 2011, pp. 22.
[9]. Tang, Y., Wavelet Theory Approach to Pattern Recognition 2nd Edition, Chongqing University,
China and Hong Kong Baptist University, Hong Kong, Series in Machine Perception and
Artificial Intelligence - Vol. 74, 2009, pp. 463.
[10]. Todorova, M., R. Ivanova, Research and signal analysis with different classes of wavelets,
Macedonia, 51st International Scientific Conference on Information, Communication and
Energy Systems and Technology Systems (ICEST), 2016, pp. 157 – 160.
[11]. Vries, A., Wavelets, Germany, FH Sudwestfalen University of Applied Sciences, 2006, pp.36.
[12]. Wang, X., J. Wang, H. Dai, Y. Li, Research on Fault Signals Recognition in GIS Based on
Wavelet Theory, 24th Chinese Control and Decision Conference (CCDC), 2012, pp. 1442-1445.
[13]. Chen, C. M., K. A. Loparo, Electric fault detection for vector-controlled induction motors
using the discrete wavelet transform, Proceedings of the American Control Conference, 1998,
pp. 3297-3301.
[14]. Du, H., S. Nair, Identification of friction at low velocities using wavelet basis function
network, Proceedings of the American Control Conference, 1998, pp. 1918-1922.
[15]. Todorova, М., R. Parvanova, Application of wavelet functions for identification of ship
models, International Maritime Association of the Mediterranean, 2019.
[16]. Burrus, C. S., A. Gopinath, and H. Guo, Introduction to Wavelets and Wavelet Transforms,
Prentice Hall, 1998.
For contacts:
Assoc. Prof. PhD, Mariyana Todorova
Department of Automation
Technical University of Varna
E-mail: [email protected]

Компютърни науки и технологии 1 2019 Computer Science and Technologies 99
POSSIBLE PROBLEMS AND FACTORS AFFECTING QoS IN
TRANSMISSION OF VOICE OVER IP NETWORK
Plamena J. Edreva, Todorka N. Georgieva
Abstract: This article introduces issues and factors that affect QoS when transmitting voice data over an IP
network. The factors affecting the quality of service are analyzed and the possible problems that arise when
transmitting data over the VoIP network are emphasized. Guidelines are given for the practical solution of
the problems that have arisen.
Keywords: VoIP, QoS, IP
1. Introduction
The basic requirement for VoIP networks is the quality of services. If VoIP telephony cannot
offer quality equivalent to that of classic telephones, then the application will not make sense [1].
Delays and packet loss are not critical to much of the traffic that passes through the IP data network.
Packets that arrive in the wrong order are buffered and after the delayed packets arrive, their order
is restored and the missing ones are sent again. In contrast, voice data is hypersensitive to slowing
down and losing packets. This leads to poor connection quality.
2. Factors affecting quality, approaches to achieving and managing QoS
2.1. Factors influencing QoS in voice transmission
Several factors can reduce the quality of audio transmitted over the network:
● reliability;
● bandwidth;
● delay;
● jitter;
● packet loss;
● security.
A major factor in the transition from traditional to IP telephony is the reliability of the future
system. The standard goal is to achieve 99.999% reliability. This means no more than 5.3 minutes
per year for the system not to operate. With proper planning, design, implementation and operation,
this can be achieved with IP telephone networks.
Manufacturers of classic plants achieve the desired reliability by accepting the system to be
inoperable only when the problem is within the system itself. The definition itself does not cover
the whole process of a single call from start to finish. For a complete analysis of an IP telephone
system, the elements that affect reliability must be considered and evaluated individually:
● hardware;
● software;
● transmission environment;
● power supply;
● Network design.
Hardware reliability is determined by the Telcordia method - Part Counting, which analyzes
the average failure time for all the components in the conversation path between point A and point
B.

Компютърни науки и технологии 1 2019 Computer Science and Technologies 100
In order to accurately determine the reliability of a network device, it is necessary to consider
the time at which it does not work due to software problems.
The power supply affects the entire IP telephone network. Power failure does not only affect a
device, it affects the entire network.
The design of the network topology and the network protocols used are important for
reliability. Recovery or transfer time to a backup device may exceed 5 minutes if the network is
incorrectly designed with inappropriate protocols and configurations.
One of the important things when building VoIP networks is determining the bandwidth
required for quality voice communications. Insufficient bandwidth can result in packet loss and
other service quality issues.
One of the benefits of VoIP is that it integrates voice and data into a single network. Voice
services are more sensitive to lack of bandwidth.
Delay is the length of time a packet reaches its recipient. Delay cannot be completely avoided,
but the aim is to achieve a minimum. Not always high delay leads to poor connection quality, but it
may cause a lack of speaker synchronization.
Jitter is the difference between the time it takes for a package to be received and the time it is
received [2]. One of the reasons for jitter is the change in queue size in network device buffers.
Another reason is the ability of individual packets to cross different paths across the network. Media
gateways use compression buffers to avoid the negative effect of jitter. They help to reconstruct the
voice data. In these buffers, packages that have arrived earlier are waiting for an interval of time.
There are many reasons for losing packages. It cannot always be avoided. When there is
network congestion, buffers on network devices may overflow. This results in rejection of newly
received packages. The allowable percentage of lost packets depends on the codec used. Using
G.711, losses below 5% would not cause a drop in quality. This percentage is significantly lower
for highly compression codecs such as G.723.1 and G729A. They are 1% and 2%, respectively. In
order to enter these boundaries, various Class of Service (CoS) methods are used that give priority
to the transmission of VoIP traffic.
The rapid deployment of VoIP provides prerequisites for increasing the risk of security threats
and necessitates the urgent development of a security environment. Security threats can be divided
into two classes:
● Service denial threats - renders system resources unusable;
● threats to compromise personal resources - data resources become available or used by
attackers [3].
The most common attack is DoS. It causes a loss of service or the network stops functioning
for minutes or even days. The attack is accomplished by exhausting the system's resources or by
consuming the entire bandwidth. Bandwidth consumption is an attack on network resources. A
"service failure" occurs when the network connection capacity is busy and data transmission is
impossible or too slow. Another threat is wiretapping. This is done by improperly intercepting Real-
time Transport Protocol (RTP) packets that transmit voice data. Another possible risk is the
problem of spam spreading over IP phones. An example is the time taken by a VoIP phone user to
delete unwanted advertising messages. VoIP technology uses IP packets and standard security
measures are not always applicable.
Using virtual LANs helps with security. The VLAN used for voice data must be separated
from the rest by packet filtering mechanisms or firewalls.
Traffic carrying voice data should be encrypted whenever possible, but not all end devices
have the necessary encryption resources. Then, so-called firewalls are used.
Firewalls are used to create a barrier between the local and the internal network and its
connection to the outside world. There are four main features of a firewall:
● block data likely to conceal hacking attacks;

Компютърни науки и технологии 1 2019 Computer Science and Technologies 101
● hide network information by masking the IP address of the network with the IP address
of the firewall for outbound traffic;
● keep logs of the information flow with records of specific events [4];
● Limit traffic to avoid denial of service attacks, routers and switches must be configured
in a way that prohibits one type of traffic from running out of resources, such as
bandwidth, memory, or processor time.
2.2 Approaches to achieving the required quality of service
There are many different suggestions for achieving and securing QoS. They can be grouped
into three groups:
● Reservation of resources. Resources are assigned for the duration of a session and they
are reserved for that session before it is built. Thus, there is a certain refusal of the full
freedom of access to resources under the IP philosophy and a return to the practice of
channel switching to choose and preserve the path between subscribers before the call
begins;
● categorizing traffic. Here is a categorization of traffic flows from different telefony
services into different classes. Different classes of traffic can be given different priority.
Usually, traffic from isochronous services, such as speech, has a higher priority over
elastic traffic, such as email. To some extent, this approach is easier to implement, but it
should not be allowed for the traffic flow of a telefony service to take up the entire
resource. Therefore, a method of equitable allocation of resources is needed;
● providing additional resources. The simplest way to satisfy QoS requirements is to
resize the network. Not the cheapest way, but probably the most used one so far. If you
need to run VoIP traffic on a data network, it is natural to add an additional resource to
the network.
2.3. QoS management
QoS management helps set and evaluate QoS goals and policies. A more general description
of the methodology for achieving a quality of service is as follows:
The network is measured and surveyed in order to determine the traffic characteristics,
identify bottlenecks in the network. It is also good to examine the behavior of the applications to
which QoS will apply. Imposing quality on network maintenance and monitoring go hand in hand.
QoS cannot be achieved without sufficient network information.
QoS techniques are available when the traffic characteristics are well researched and
applications selected for the purpose of improved service quality are selected.
Evaluate the results by testing the reactions of the selected applications to determine if the
QoS objectives have been achieved. In an ever-evolving network environment, QoS is not a one-off
solution, but is an ongoing process of design, analysis, control, configuration, an integral part of
network design [5].
3. Conclusion
VoIP dramatically reduced communication costs by sharing network infrastructure between
data and voice. IP telephony is increasingly replacing traditional telephone networks. One of the
steps for implementing an IP telephone system is to configure the network devices for voice data
transmission and the necessary mechanisms that ensure the quality of services.

Компютърни науки и технологии 1 2019 Computer Science and Technologies 102
4. References
[1]. D. Richard Kuhn, Tomas J. Walsh, Steffen Fries. Security Considerations for Voice over IP
Systems. //National Institute of Standards and Technology, 2005, NIST SP 800-58
[2]. William C. Hardy, "VoIP Service Quality - Measuring and Evaluating Packet-Switched Voice",
McGraw-Hill, 2003, ISBN 0071410767
[3]. Rainer Martin, Ulrich Heute, Christine Antweiler, Advances in Digital Speech Transmission,
John Wiley & Sons, Ltd, 2008, ISBN 978-0-470-51739-0
[4]. Angela Orebaugh, ―Wireshark and Ethereal Network Protocol Analyzer Toolkit‖, Syngress
Publishing, 2007, ISBN 9780080506012
[5]. Kun I. Park , ―QoS in Packet Networks‖, Springer, 2005, ISBN 978-0-387-23390-1
For contacts:
Ass. Prof. Plamena Edreva
Department of CST, TU-Varna
Email: [email protected]
Assoc. Prof. Todorka Georgieva
Department of KTT, TU-Varna
e-mail: [email protected]

Компютърни науки и технологии 1 2019 Computer Science and Technologies 103
SOFTWARE DEFINED NETWORKS – A BRIEF STUDY
Rosen S. Radkov
Abstract: Modern computer networks are complex to manage, and adapting to new business requirements
and problems is very difficult. This article presents a brief study of the new computer network management
technology called Software Defined Networks. In this paper are expailed motivation of their creation, their
main concepts and trends of their development. Software Defined Networks separate from each other the
functional layers of a computer network - data plane from control plane. This functionality enhances the
programming capability, flexibility and manageability of the network. Keywords: OpenFlow, Software-defined networking, dependability, network virtualization
1. Introduction
The management of data flows on computer networks is usually decentralized. Modern
computer networks are large in size and complex in structure, which makes it difficult to manage
them using this decentralized approach. To implement the desired high-level network policies,
network administrators must configure many network devices individually. This is usually done
using command line interface (CLI) commands that are specific to the operating systems of each
manufacturer. In addition to the complexity of their configuration, computer networks need to adapt
to changes in their load and be resistant to the dynamics of their faults. The task is more complex,
because current networks are vertically integrated. Control plane, which decides how to handle
network traffic, etc. data plane, which redirects traffic according to the decisions made by the
control logic, resides in the network devices, reducing flexibility and limiting the development of
the network infrastructure. In a heterogeneous network, there are virtually no mechanisms for
automatically configuring it. Implementing a specific policy in such a dynamic environment is
therefore a major challenge.
2. Motivation for development of Software Defined Networks
The architecture of a computer network can be represented by three planes of functionality: a
management plane, a control plane and a data plane (Fig.1).
Fig. 1. Architecture of computer network
The management plane realize network management functionality and it corresponds to
software services [1], used for device configuration and monitoring of devices health status. The
protocols used to populate the forwarding tables of the elements of the data plane are the essence of
the control plane. The data plane include the network devices that are responsible for forwarding the
data. Network policies are defined in the management plane, the control plane imposes policies and

Компютърни науки и технологии 1 2019 Computer Science and Technologies 104
the data plane implements them by forwarding the data. Traditional networks are highly
decentralized and the control and data planes are tightly interconnected because they are embedded
in the same network devices. In the beginning of the Internet this was considered as important
feature as it seemed the best way to ensure the sustainability of the network, which was a the main
goal of the network design. In practise this approach is more effective in terms of network
performance, with rapid increases in line speed and port density.
The result is a very sophisticated and relatively static architecture [2], [3] which makes
traditional networks very complicated to set up and manage. Often, incorrect network
configurations are encountered in practice, which is a prerequisite for errors in their operation.
According Feamster [4] more than 1000 configuration errors were observed in BGP routers. An
incorrectly configured device can lead to unwanted network behavior (including, but not limited to,
packet loss, redirection circuits, unscheduled routes, or breach of service contract). Some vendors
offer customized solutions for specialized hardware, operating systems, and management programs
for network management. To provide quality support for the network infrastructure, network
operators must acquire and maintain a variety of management solutions and relevant specialist
teams. On the other hand, the costs of acquiring and maintaining network infrastructure are
considerable, with a long payout period that hinders the rapid addition of new features and services
such as access control, load balancing, energy efficiency, traffic engineering. The complexity of the
network is also increasing due to the presence of a number of intermediate devices that add
functionalities such as IDS, IPS, DPI and more.
A number of trends have encouraged network equipment manufacturers and users to rethink
traditional approaches to network architecture design. Particular attention should be paid to the
following:
a) Change in the volume and patterns of network traffic
The application software systems used today are not always the classic client-server model,
and in many cases send requests to multiple servers. This is a prerequisite for generating more
volume. There is an enormous number of employees who require remote access to the corporate
network to fulfill their work responsibilities. They access from various types of computing devices -
mobile personal devices such as smartphones, tablets and laptops. This, on the one hand, helps their
remote work, but at the same time contributes to a significant increase in network traffic. Also
influenced by the increased number of devices in the IoT category. Most such devices generate
relatively little traffic, but there are exceptions, such as CCTV cameras. The increasing number of
such devices is putting a significant strain on the corporate network.
b) Increasing distribution and use of cloud services
The large-scale development of data centers has helped the development of the so-called third
party services which are so called cloud services. The technologies they provide provide greater
flexibility for IT solutions to deliver different types of services, as well as shorter time for
deployment of IT infrastructure. However, cloud service providers need an intelligent way to
manage the resources that are shared between different clients, because the traditional way impedes
their development.
c) Increasing data volume - Big Data
The processing of large data sets necessitates the easy incorporation of additional capacity and
better management of the serving network infrastructure into the data centers.
d) The need for an intelligent system that makes it easy to implement the policies required by
businesses and easily manage the behavior of network devices.
Although modern technologies allow the transmission environment to provide more
bandwidth and network devices have increasing performance, traditional network architectures are

Компютърни науки и технологии 1 2019 Computer Science and Technologies 105
difficult to adapt and adjust to the increasing complexity of business processes served, volatility and
large load volume, quality of service (QoS) requirements.
3. The essence of Software Defined Networks
The Software Defined Networks (SDN) originate from Stanford University, where team of
scientists lead by Nick McKeown developed OpenFlow [5]. The ideas embedded in the definition
of SDN suggest that a network architecture be created in which the data forwarding that takes place
in the data plane is controlled by a remote control plane separated from the data plane. The
OpenFlow specification describes both the protocol through which the controller and switch
interact, as well as the expected behavior of the switch. Exemplary architecture of the OpenFlow
solution is illustrated on Figure 2.
Fig. 2. Architecture of an OpenFlow solution
The operation of an OpenFlow solution can be described in a simple way in the following
ways:
• Flow tables are loaded from the controller into the switches.
• Each of the switches evaluates the incoming packets, searches the tables for a matching
flow, and then performs the action associated with it.
• If the switch does not find a matching flow, it forwards the packet to the controller for
instructions on what action to take with it.
• Once the controller make decision, he updates the switch tables to handle them locally.
The networking industry has repeatedly changed the ideas embedded in the original view of
SDN, and sometimes the SDN is considered to be any software that manages the network. So let's
try to better define what is a SDN.
It can be said that the architecture of an SDN network is subject to four basic principles [6]:
1) Separation of Control plane and Data plane. Control function is removed from network
devices and they are converted into packet forwarding devices.
2) The characteristics of the data flow, not the destination, are used as criteria when deciding
on a forwarding. SDN, respectively OpenFlow, defines data flow as a sequence of packets between
source and destination. All flow packets are handled by the same forwarding rules on network
devices. This makes it possible to unify the behavior of different types of network devices: routers,
switches, firewalls, and middleboxes [7]. Flow-based control allows for unprecedented flexibility,
limited only to the capabilities of embedded flow tables [8].
3) A component called the SDN controller or network operating system (NOS) is introduced
into which the control logic is moved. Like the traditional operating system, NOS is a software
platform that, by introducing an abstract type of network, facilitates devices programming.
4) For network programming, network applications are used which, by using the NOS
functions, interact with the data plane devices. They do not need to have direct contact with network
devices. This is a major feature of SDN.
Centralized network management provided by SDN offers the following additional benefits:
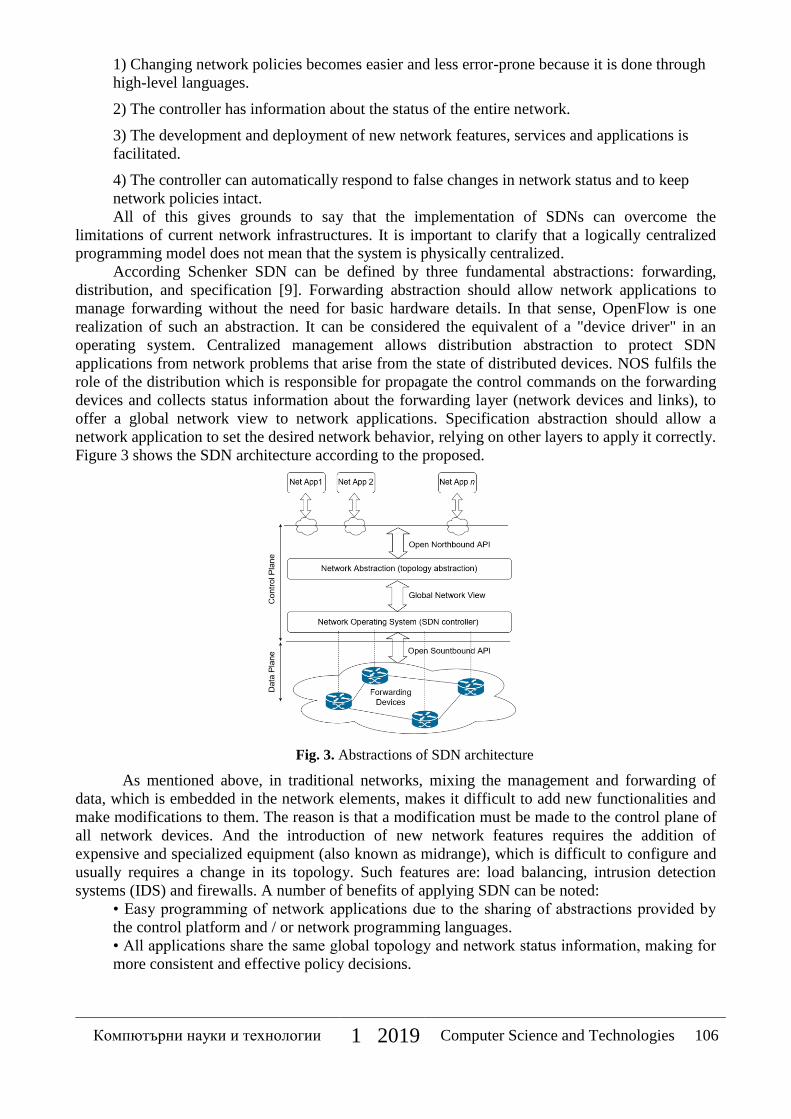
Компютърни науки и технологии 1 2019 Computer Science and Technologies 106
1) Changing network policies becomes easier and less error-prone because it is done through
high-level languages.
2) The controller has information about the status of the entire network.
3) The development and deployment of new network features, services and applications is
facilitated.
4) The controller can automatically respond to false changes in network status and to keep
network policies intact.
All of this gives grounds to say that the implementation of SDNs can overcome the
limitations of current network infrastructures. It is important to clarify that a logically centralized
programming model does not mean that the system is physically centralized.
According Schenker SDN can be defined by three fundamental abstractions: forwarding,
distribution, and specification [9]. Forwarding abstraction should allow network applications to
manage forwarding without the need for basic hardware details. In that sense, OpenFlow is one
realization of such an abstraction. It can be considered the equivalent of a "device driver" in an
operating system. Centralized management allows distribution abstraction to protect SDN
applications from network problems that arise from the state of distributed devices. NOS fulfils the
role of the distribution which is responsible for propagate the control commands on the forwarding
devices and collects status information about the forwarding layer (network devices and links), to
offer a global network view to network applications. Specification abstraction should allow a
network application to set the desired network behavior, relying on other layers to apply it correctly.
Figure 3 shows the SDN architecture according to the proposed.
Fig. 3. Abstractions of SDN architecture
As mentioned above, in traditional networks, mixing the management and forwarding of
data, which is embedded in the network elements, makes it difficult to add new functionalities and
make modifications to them. The reason is that a modification must be made to the control plane of
all network devices. And the introduction of new network features requires the addition of
expensive and specialized equipment (also known as midrange), which is difficult to configure and
usually requires a change in its topology. Such features are: load balancing, intrusion detection
systems (IDS) and firewalls. A number of benefits of applying SDN can be noted:
• Easy programming of network applications due to the sharing of abstractions provided by
the control platform and / or network programming languages.
• All applications share the same global topology and network status information, making for
more consistent and effective policy decisions.

Компютърни науки и технологии 1 2019 Computer Science and Technologies 107
• There is no need to develop a location strategy for new features, as network applications can
reconfigure routing devices from any part of the network.
• The integration of different applications becomes easier [29]. For example, load balancing
and routing applications can be combined sequentially, with load balancing decisions having
precedence over routing policies.
The composition of an SDN in detail can be defined as a set of the following components:
Forwarding Devices (FDs): These are hardware devices with no sophisticated software that
perform a set of elementary operations and are part of the data plane. They work on the basis of
defined sets of instructions (eg flow rules) used to take action on incoming packets (eg, forward to
specific ports, accept/drop, forward to a controller and etc.). These instructions are defined by the
southbound interfaces (for example, OpenFlow, ForCES and etc.) and installed on the these devices
by the SDN controllers via the southbound protocols.
Data Plane (DP): It consists of interconnected routing devices that are connected to each other
through network connections.
Southbound Interface (SI): It defines, through the API, the set of instructions of the
forwarding devices as well as the communication protocol between the forwarding devices and the
control plane elements.
Control Plane (CP): The elements of the control plane program the forwarding devices using
SI. Applications and controllers form the control plane, which is why some call it the "network
brain"[6].
Northbound Interface (NI): This is the interface that application developers need. For this
purpose, the network operating system provides them with an API called the northbound interface.
The northbound interface abstracts the low level instruction sets used by southbound interfaces to
program forwarding devices.
Management Plane (MP): This plane consists of a set of applications that utilize the features
offered by NI to apply network control and logic of operation. This list may include applications
related to routing tasks, firewalls, load balancing, monitoring etc.. This plane defines policies that
translate into southbound-specific instructions that program the behavior of forwarding devices.
4. Development forecasts
The development and implementation of SDN is accompanied by a number of requirements
that can be applied to this technology. They can be summarized as follows:
1) Adaptability
Networks need to adapt and respond dynamically to application needs, business policies, and
network status.
2) Automation
Policy changes should be propagated automatically to reduce manual work and errors.
3) Maintainability
This functionality is necessary to minimize downtime when make software updates, hardware
upgrades or prophylactic of the components of the SDN.
4) Model management
It is needed to make network management possible at model level to avoid reconfiguring all
network devices in the event of a change in network architecture or concept.
5) Mobility
Control functionality must be mobility-responsive, including mobile user devices and virtual
servers.
6) Integrated security

Компютърни науки и технологии 1 2019 Computer Science and Technologies 108
Network security should be integrated into the applications, not as an additional solution.
7) On-demand scaling
According the Statista statistics [10] the size of the SDN market worldwide from 2013 to
2021 (Fig.4). In 2019, the global SDN market was expected to reach 9.5 billion U.S. dollars in size.
Fig. 4. SDN market size worldwide from 2013 to 2021
According to another studies [11], [12], the global market for SDN products and services in
cloud organizations and providers will grow from $7.8 billion in 2015 to $35.6 billion in 2018 and
$59 billion in 2023. This includes network infrastructure, SDN devices and connected with this
consultancy.
For the ten years since the beginning, hundreds are technology companies working for SDN
development.
5. Conclusions
Because traditional networks are complex, they are difficult to manage. The development of
cloud services is difficult in the traditional way of managing networks. Software-defined networks
create the ability to make network management easier and smarter. They separate the control and
information planes of the network architecture and include centralized network management. It
enables network management to be done directly by the applications using the API, without needing
to know the network architecture in detail. Along with the wonderful ideas that are embedded in the
SDN, there are new challenges related to the reliability, scalability and security of SDN.
References
[1] R. Presuhn, Version 2 of the Protocol Operations for the Simple Network Management Protocol
(SNMP). 2002.
[2] A. Ghodsi, S. Shenker, T. Koponen, A. Singla, B. Raghavan, and J. Wilcox, ―Intelligent design
enables architectural evolution,‖ Proc. 10th ACM Work. Hot Top. Networks, HotNets-10, 2011.
[3] B. Raghavan, T. Koponen, A. Ghodsi, M. Casado, S. Ratnasamy, and S. Shenker, ―Software-
defined internet architecture: Decoupling architecture from infrastructure,‖ Proc. 11th ACM
Work. Hot Top. Networks, HotNets-11, pp. 43–48, 2012.
[4] N. Feamster and H. Balakrishnan, ―Detecting BGP configuration faults with static analysis,‖

Компютърни науки и технологии 1 2019 Computer Science and Technologies 109
2nd Conf. Symp., pp. 43–56, 2005.
[5] K. Greene, ―TR10: Software-defined Networking,‖ MIT Tech Review 10 Breakthrough
Technologies, 2009. [Online].
Available:
http://www2.technologyreview.com/article/412194/tr10-software-defined-networking/.
[6] D. Kreutz, F. M. V. Ramos, P. E. Verissimo, C. E. Rothenberg, S. Azodolmolky, and S. Uhlig,
―Software-defined networking: A comprehensive survey,‖ Proc. IEEE, vol. 103, no. 1, pp. 14–
76, 2015.
[7] H. Jamjoom, D. Williams, and U. Sharma, ―Don‘t call them middleboxes, call them
middlepipes,‖ HotSDN 2014 - Proc. ACM SIGCOMM 2014 Work. Hot Top. Softw. Defin.
Netw., pp. 19–24, 2014.
[8] N. McKeown et al., ―OpenFlow: enabling innovation in campus networks,‖ ACM SIGCOMM
Comput. Commun. Rev., vol. 38, no. 2, p. 69, 2008.
[9] S. Schenker, ―The future of networking and the past of protocols,‖ 2011.
[10] Statista 2019, ―Software-defined networking (SDN) market size worldwide from 2013 to
2021,‖ 2019. [Online].
Available:
https://www.statista.com/statistics/468636/global-sdn-market-size/.
[11] S. Central, ―How big is The SDN Market?,‖ 2016. [Online].
Available:
https://www.sdxcentral.com/reports/sdn-market-size-infographic-2013.
[12] I. GlobeNewswire, ―Software Defined Networking (SDN) Market Size,‖ 2019. [Online].
Available:
https://www.globenewswire.com/news-release/2019/04/04/1797303/0/en/Software-Defined-
Networking-SDN-Market-Size-USD-59-Billion-by-2023-Growing-at-Massive-CAGR-of-42-
41.html.
For contacts: Assist. Prof. Rosen Radkov, PhD
Software and Internet Technologies Dept. Technical University of Varna
E-mail: [email protected]
Bulgaria
Communications
Chapter

Компютърни науки и технологии 1 2019 Computer Science and Technologies 110

Компютърни науки и технологии 1 2019 Computer Science and Technologies 111
ИЗИСКВАНИЯ ЗА ОФОРМЯНЕ НА СТАТИИТЕ ЗА СПИСАНИЕ
"КОМПЮТЪРНИ НАУКИ И ТЕХНОЛОГИИ‖
I. Статиите се представят разпечатани в два екземпляра (оригинал и копие) в размер до 6
страници, формат А4 на адрес: Технически университет – Варна, ФИТА, ул. „Студентска‖ 1,
9010 Варна, както и в електронен вид на имейл адреси: [email protected] или
II. Текстът на статията трябва да включва: УВОД (поставяне на задачата), ИЗЛОЖЕНИЕ
(изпълнение на задачата), ЗАКЛЮЧЕНИЕ (получени резултати), БЛАГОДАРНОСТИ към
сътрудниците, които не са съавтори на ръкописа (ако има такива), ЛИТЕРАТУРА и
информация за контакти, включваща: научно звание и степен, име, организация, поделение
(катедра), e-mail адрес.
III. Всички математически формули трябва да са написани ясно и четливо (препоръчва се
използване на Microsoft Equation).
IV. Текстът трябва да бъде въведен във файл във формат WinWord 2000/2003 с шрифт Times New
Roman. Форматирането трябва да бъде както следва:
1. Размер на листа - А4, полета: ляво - 20мм, дясно - 20мм, горно - 15мм, долно - 35мм,
Header 12.5мм, Footer 12.5мм (1.25см).
2. Заглавие на български език - размер на шрифта 16, удебелен, главни букви.
3. Един празен ред - размер на шрифта 14, нормален.
4. Имена на авторите - име, инициали на презиме, фамилия, без звания и научни степени -
размер на шрифта 14, нормален.
5. Два празни реда - размер на шрифта 14, нормален.
6. Резюме и ключови думи на български език, до 8 реда - размер на шрифта 11, нормален.
7. Заглавие на английски език - размер на шрифта 12, удебелен.
8. Един празен ред - размер на шрифта 11, нормален.
9. Имена на авторите на английски език - размер на шрифта 11, нормален.
10. Един празен ред - размер на шрифта 11, нормален.
11. Резюме и ключови думи на английски език, до 8 реда - размер на шрифта 11, нормален.
12. Основните раздели на статията (Увод, Изложение, Заключение, Благодарности,
Литература) се форматират в едноколонен текст както следва:
a. Наименование на раздел или на подраздел - размер на шрифта 12, удебелен,
центриран, един празен ред преди наименованието и един празен ред след него -
размер на шрифта 12, нормален;
b. Текст - размер на шрифта 12, нормален, отстъп на първи ред на параграф – 10 мм;
разстояние от параграф до съседните (Before и After) за целия текст – 0.
c. Цитиране на литературен източник - номер на източника от списъка в квадратни
скоби;
d. Текстът на формулите се позиционира в средата на реда. Номерация на формулите -
дясно подравнена, в кръгли скоби.
e. Фигури - центрирани, разположение спрямо текста: ―Layout: In line with text‖. Номер
и наименование на фигурата - размер на шрифта 11, нормален, центриран. Отстояние
от съседните параграфи – 6 pt.
f. Литература – всеки литературен източник се представя с: номер в квадратни скоби и
точка, списък на авторите (първият автор започва с фамилия, останалите – с име),
заглавие, издателство, град, година на издаване, страници.
g. За контакти: научно звание и степен, име, презиме (инициали), фамилия,
организация, поделение (катедра), e-mail адрес, с шрифт 11, дясно подравнено.
Образец за форматиране можете да изтеглите от адрес http://cs.tu-varna.bg/ - Списание
КНТ, Spisanie_Obrazec.zip.

Компютърни науки и технологии 1 2019 Computer Science and Technologies 112