0 21 3 complete.doc
TRANSCRIPT
ISSN 0827 3383
International Journalof
Special Education
VOLUME 21 2006 NUMBER 3
Teachers' Attitudes Toward Students With Disabilities In Haïti
The Technologically Dependent/Medically Fragile At Risk Student
Time-Out Interventions And Strategies: A Brief Review And Recommendations
Alchemy And Aberrant Behaviour:A Jungian Approach To Working With Boys With Behaviour Disorders
An Empirical Study On Teachers’ Perceptions Towards Inclusive Education In Malaysia
The Effects Of Constant Time Delay And Strategic Instruction On Students With Learning Disabilities’ Maintenance And Generalization
Aggressive Behaviour Among Swazi Upper Primary And Junior Secondary Students: Implications For Ongoing Educational Reforms Concerning Inclusive Education
Evaluation Of Turkish Hearing Impaired Students’ Reading Comprehension With The Miscue Analysis Inventory
The Effects Of Visualizing And Verbalizing Methods In Remedial Spelling Training: Individual Changes In Dyslexic Students’ Spelling Test Performance
Comorbid Diagnosis And Concomitant Medical Treatment For Children With Emotional And Behavioral Disabilities
Early Identification And Interventions For Children At Risk For Learning Disabilities
Individual, Family, And School Factors Associated With The Identification Of Female And Male Students For Special Education
Parents’ And Special Education Teachers’ Perspectives Of Implementing Individualized Instruction In P. R. China-An Empirical And Sociocultural Approach
Parents’ And Local Education Authority Officers’ Perceptions Of The Factors Affecting The Success Of Inclusion Of Pupils With Autistic Spectrum Disorders
Effective Interventions For Individuals With High-Functional Autism
Counting In Egyptian Children With Down Syndrome
International Journal of Special Education
REVISED EDITORIAL POLICY 2006
The International Journal of Special Education publishes original articles concerning special education. Experimental as well as theoretical articles are sought. Potential contributors are encouraged to submit reviews of research, historical, and philosophical studies, case studies and content analyses in addition to experimental correlation studies, surveys and reports of the effectiveness of innovative programs.
Send your article to [email protected] as attachment by e-mail, in MSWORD for IBM format ONLY .
Articles should be single spaced (including references). Submit one original only. Any tables must be in MS-WORD for IBM Format. Please include a clear return e-mail address for the electronic return of any material. Published articles remain the property of the Journal.
E-mailed contributions are reviewed by the Editorial Board. Accepted articles may be revised for clarity, organisation and length.
Style: The content, organisation and style of articles should follow the Publication Manual of the American Psychological Association (2001). An article written in an obviously deviating style will be returned to the author for revision.
Abstracts: All articles will be preceded by an abstract of 100-200 words. Contributors are referred to the Publication Manual of the American Psychological Association for assistance in preparing the abstract.
Responsibility of Authors: Authors are solely responsible for the factual accuracy of their contributions. The author is responsible for obtaining permission to quote lengthy excerpts from previously published material. All figures submitted must be submitted within the document.
JOURNAL LISTINGSAnnotated and Indexed by the ERIC Clearinghouse on Handicapped and Gifted
Children for publication in the monthly print index Current Index to Journals of Special Education (CIJE) and the quarterly index, Exceptional Child Education Resources (ECER).IJSE is also indexed at Education Index (EDI).
The journal appears at the website: internationaljournalofspecialeducation.com
The editor can be reached at [email protected]
2
VOLUME 21 2006 NUMBER 3
I N D E X
Teachers' Attitudes Toward Students With Disabilities In Haïti………………...………………………1Errol Dupoux, Helen Hammond, Lawrence Ingalls and Clara Wolman
The Technologically Dependent/Medically Fragile At Risk Student……………………...…….……..15Thomas G. Ryan
Time-Out Interventions And Strategies: A Brief Review And Recommendations……………….……22Tera L. Wolf, T. F. McLaughlin and Randy Lee Williams
Alchemy And Aberrant Behaviour:A Jungian Approach To Working With Boys With Behaviour Disorders…………………………………………………...……….…….30
Robert O’Dea
An Empirical Study On Teachers’ Perceptions Towards Inclusive Education In Malaysia…………………………………………………………………………………..36
Manisah Mohd Ali, Ramlee Mustapha and Zalizan Mohd Jelas
The Effects Of Constant Time Delay And Strategic Instruction On Students With Learning Disabilities’ Maintenance And Generalization …...……………………….…….….….45
M. Flores, D. Houchins and M. Shippen
Aggressive Behaviour Among Swazi Upper Primary And Junior Secondary Students: Implications For Ongoing Educational Reforms Concerning Inclusive Education…………………………………………………………...….………..58
Lawrence Mundia
Evaluation Of Turkish Hearing Impaired Students’ Reading ComprehensionWith The Miscue Analysis Inventory…………………………...……………………………...………68
Ümit Girgin
The Effects Of Visualizing And Verbalizing Methods In Remedial Spelling Training: Individual Changes In Dyslexic Students’ Spelling Test Performance……………...………85
Günter Faber
Comorbid Diagnosis And Concomitant Medical Treatment For Children With Emotional And Behavioral Disabilities………………………...…………………..96
Kristina M. Hall, Krista A. Bowman, Katie Ley and William Frankenberger
Early Identification And Interventions For Children At Risk For Learning Disabilities…………………………………………………..…………………………..…..108
Stephen M. Lange and Brent Thompson
Individual, Family, And School Factors Associated With TheIdentification Of Female And Male Students For Special Education………….….…………….….…120
Donald P. Oswald, Al M. Best and Martha J. Coutinho,
Parents’ And Special Education Teachers’ Perspectives Of Implementing Individualized Instruction In P. R. China-An Empirical And Sociocultural Approach…………………..……..…….138
Yi Ding, Kathryn C. Gerken, Don C. VanDyke and Fei Xiao
Parents’ And Local Education Authority Officers’ Perceptions Of The FactorsAffecting The Success Of Inclusion Of Pupils With Autistic Spectrum Disorders……………….…..151
Emma M. Waddington and Phil Reed
Effective Interventions For Individuals With High-Functional Autism……………...…………….…165Ann X. Huang and John J. Wheeler
Counting In Egyptian Children With Down Syndrome…………………………………...…………..176Hala Abdelhameed and Jill Porter
3
TEACHERS' ATTITUDES TOWARD STUDENTS WITH DISABILITIES IN HAÏTI
Errol DupouxHelen HammondLawrence Ingalls
University of Texas at El Pasoand
Clara WolmanBarry University
After conducting a thorough review of the state of inclusion of students with disabilities in Haïti, the authors present a study that investigates the attitudes of urban and rural teachers in Haïti toward inclusion. Participants were administered the Opinions Relative to Integration (ORI) of Students with Disabilities instrument. Reliability of the ORI for Haitian teachers was .68, as determined by the Spearman-Brown reliability coefficient. Teachers’ attitudes toward integration were not associated with years of teaching experience, education was positively associated with attitudes, and teachers in rural Haïti did not differ from teachers in urban Haïti. Other findings indicated that variables representing teachers’ cognitions and beliefs were more important in predicting attitudes than variables related to the teachers’ actual experiences of teaching.
Estimates of global populations indicate that more children with disabilities live in developing and third world countries than in industrialized countries (UNESCO, 1996). In 1995, the Ministère de L’Éducation Nationale of Haïti estimated that 11% of the population had a disability, of which 15% (120 000) were children of school age; this percentage is about 5% greater than the estimate of the incidence of disabilities in a school age population in the USA and Canada, for example (Landrum, 1999; Mallory, Charlton, Nicholls, & Marfo, 1993; Nkabinde, 1993; Scheer & Groce, 1988; Weintraub, 2005). In May 2005, the enrolment of students with disabilities in school was about 2%, almost double the previous percentage reported in 1995 by the Ministère de L’Éducation Nationale (Personal communication with Dr. Michel Peant, Haïti’s National Coordinator for the Society of the Blind and National Secretary for the Integration of the Handicapped People , May 6, 2005). However, since lack of identification affects prevalence figures, it can be assumed that the percentage of school-aged children with disabilities is even greater, either because they are not currently attending school in Haïti or are struggling in regular classrooms without the appropriate services. In 1993, of the 54 000 candidates who participated in the final examination for a high school certificate, only two students with identified disabilities (visual impairments) participated in that testing (Ministère de L’Éducation Nationale, 1995).
Presently, Haïti is in the unenviable position of being the country with the second highest proportion of students in private schools, while also carrying the stigma of being one of the poorest countries in the world (Background Notes on Countries of the World, 2003; Salmi, 2000). The average Haitian family earns $425 in US currency per year (Background Notes on
4

Countries of the World, 2003). Overall, about 40% and 80% of students of school age do not attend primary and secondary schools, respectively, which may explain the high illiteracy rate of 47% in Haïti. Education in Haïti is essentially a private enterprise with little control from the government. Seventy-five percent of primary students and 82% of secondary level students are enrolled in private schools (Salmi, 2000). Less than 10% of the school age population is enrolled in public schools. At the elementary level, only 65% of those eligible for primary education are enrolled in schools, although public education is free from first to sixth grade (Background Notes on Countries of the World, 2003).
In the rural areas, the enrolment rate is about 23%. Overall, across areas, 63% of those enrolled will complete elementary school (Salmi, 2000). Beyond the primary level, from 15 to 22% of those eligible for secondary education are actually enrolled in schools (Background Notes on Countries of the World, 2003; Salmi, 2000). Fifty-five percent of those attending secondary schools live in Port-au Prince, the capital of Haïti. Only 38 students will graduate from high school for every 1000 children who begin first grade (Ministère de L’Éducation Nationale, 1995).
Concerning students with disabilities, it was reported that less than 1% (600) of this population was identified and were receiving special services, and most were enrolled in private schools (Ministère de L’Éducation. 1995). One of the structural problems is that low performing students are not routinely tested; thus, many students who would be classified in the high incidence categories (i.e. speech and language, intellectual disabilities, learning disabilities, emotional disorders) in a developed country are an integral part of regular classrooms in Haïti. However, while the regular setting seems to be integrated, it is not so by design but rather by default. Many teachers indicated that they would welcome a formalized process of testing to help them target those students who need specialized instruction.
Arbeiter and Hartley (2002) reasoned that a lack of general knowledge about disability, as well as a lack of access to special programs that exist in the most populated cities in third world countries, seem to act as barriers to enrolment. Miles (1985) surmised that since many students with disabilities are not identified, it follows that they are casually integrated in regular classes. While school systems around the world have spent vast resources in labeling and classifying students to provide them with a segregated education, Haïti’s response to low achievement and poor performance clearly reflects a medical model of disability (i.e. personal handicap and deficiency). Academic failure is blamed on the student, while remediation of low achievement is solely the responsibility of the family unit.
LimitationsHaïti has been affected by many of the factors confronting developing countries: severe economic limitations, shortage of trained personnel, and geographic isolation of a large sector of the population. By and large, these are the results of the incidence of poverty and unemployment. The main features of schools in Haïti are a reliance on a rigid curriculum, rote learning, and a resistance to experiential and cooperative learning approaches (Ministère de L’Éducation. 1998).
There are three categories of schools in Haïti: public schools, private schools, and humanitarian organizations. Only humanitarian schools provide free of charge basic reading and writing for students with disabilities, especially those with visual and hearing impairments, as well as those who are taught vocational skills. Across the three category of schools, a significant number of teachers do not possess teaching credentials. Moreover, there are no meaningful teacher in-service programs to upgrade teacher methodology and knowledge of subject matter (Ministère de L’Éducation. 1998). Special education training is not part of the courses offered or degree conferred by any of the universities. In terms of space and infrastructure, schools are chronically overcrowded and lack electricity, water, and the necessary hygienic facilities.
5
Overall, students with special needs have not been formally tested and classified. They are left to fend for themselves within the regular setting. Usually, the main reason is a lack of funding, since most schools operate on a tuition basis. This relieves the parents from the shame of failure, and the school from evaluating the delivery of education to all students. Currently, students with severe disabilities are served in a number of government residential institutions that house mostly adults with psychiatric disorders, and in private schools. In general, students’ institutionalization or placement in special programs depends on the financial means of the parents.
Readiness and CultureIt has been suggested that integration in developing countries can be facilitated much more easily and successfully than in North America and Western European countries, because in the former, students with disabilities are already in the mainstream, unlike in countries with a dual system of regular and special education (UNESCO, 1997, 1999). Recognizing that schools in developing countries have large class sizes, untrained teachers, inadequate teaching techniques, transportation problems, and lack of resources and facilities (Baine, 1993), Mushoriwa (2001) commented that one of the arguments put forward by policy makers pertaining to facilitating inclusive education in poor countries is to consider the regular classroom as the mainstream model. This position takes into consideration the prohibitive costs associated with implementing the inclusive model, which is expected to meet the needs of a small number of children, as opposed to additional services provided to the existing regular classroom for low achievers, regardless of the shortcomings of such a model. There is an urgency to address the educational needs of students with disabilities; however, there is a major crisis in general education. Among some policymakers and the educational elite in Haïti, special education is considered a luxury or a benefit that only industrialized nations can afford. To paraphrase the former Secretary of Education for Haïti, an advocate for special education: When the main house is on fire, who cares about what would become of the guest house? (Personal communication with E. Buteau, Haïti’s former Secretary of Education, September 26, 2003).
The Haitian Constitution sets out that the first six years of education are compulsory. This statement has never materialized in any other legislative mandates for many reasons, not the least of which has to do with the role that children of the poor play in providing for the comfort of middle and upper classes of Haitian society (Gibbons & Garfield, 1999; Janak, 2000). Many parents in the provinces place their children with wealthier families in the cities in order to ensure that they get food and shelter. In return, these children work from sunrise to sundown at various household chores. At times, they are sent great distances to buy the necessities for the household. Usually, they get ready the school uniforms for the wealthier children their age who attend school, while they stay back to prepare food or clean the house to facilitate the comfort of the sons and daughters of the house as they return from school and attend to their homework. These children can be found even in the houses of the framers of Haïti’s latest Constitution. Obviously, compulsory education would destroy a source of cheap labor in Haïti (Janak, 2000).
Beginning Steps Toward IntegrationAlthough special education in Haïti has a solid history in a few expensive private schools
under the administration of teachers with Master’s degrees in special education, obtained mostly from universities in the United States, public schools lack any formal response to students’ failure to learn. However, public education’s response to the needs of children with disabilities is in a state of transition. Based on protocols agreed upon by the country’s leadership, and a deadline of 2004 imposed by international organizations supporting equality of education for children (Personal communication with E. Buteau, Haïti’s former Secretary of Education, 2003, September 23, 2003; Organization of American States, 1999), there is a
6

movement in the executive branch to recognize that low-performing students need extra help through identification, and possibly special services.
While as of 2004 the legislature had shown no urgency in passing legislation to reform education with regard to quality education for all students. By contrast, the Office of Special Education has been expanded, with branches located in the two most populated provinces outside of Port-au-Prince, the capital, in order to pilot an integration program in a few public schools. In this pilot program, mainstreaming classes largely resemble the current regular setting, except that students with disabilities may have been identified. This design is receiving international support in order to ascertain the feasibility of expanding such a model to other Haitian schools and provinces. Foreign organizations have given extensive start-up funding for many educational projects related to special needs, in addition to educational ideas and methods (UNESCO, UNICEF, USAID, World Bank). Such programs rely on foreign financial assistance and therefore espouse foreign strategies and concepts (e.g. rehabilitation), without questioning the feasibility of implementing them in the Haitian context and maintaining them within severely limited local resources. It has been the case in Haïti that foreign donors often do not sustain their efforts over long periods of time.
Inclusion/Integration in the International ContextAs Smith, Polloway, Patton and Dowdy (2004) conceptualized the term inclusion, it refers to students with disabilities becoming part of the general education classroom, receiving a meaningful curriculum with necessary support, and being taught with effective strategies. In contrast, integration refers to educating students with disabilities in close proximity to students in regular classrooms (Arbeiter & Hartley, 2002). Although the term inclusion is more widely accepted in the USA and the UK, internationally, the term integration is more preferred (Booth, 1996; Pijl & Dyson, 1998). For the purposes of this paper, inclusion and integration will be used interchangeably for the following reasons: (1) to encompass the range of programmatic models in Haïti used to integrate students in the general track; and (2) because participants in the study do not distinguish between the two terms.
Since the mid- to late-1980s, there has been a strong international movement to include students with disabilities in the general setting (UNESCO, 1994, 1999). This is evident within the literature for the following continents and geographical areas: Europe (Ainscow & Haile-Giorgis, 1999; Didaskalou & Millward, 2001; Flem & Keller, 2000; Pijl & Dyson, 1998; Senel, 1998), Australia-Oceania (Campbell, Gilmore, & Cuskelly, 2003), Asia (Clarke & Nomanbhoy, 1998; Kataoka, Van Kraayenoord, & Elkins, 2004; Poon-McBrayer, 2004), Africa (Arbeiter & Hartley, 2002; Barnartt & Kabzems, 1992; Engelbrecht, Oswald, Swart, & Eloff, 2003), the Americas (Clark & Artiles, 2000; Hammond & Ingalls, 2003, Scruggs & Mastropieri, 1996; Woloshyn, Bennett, & Berrill, 2003), the Middle East (Alghazo & Naggar Gaad, 2004; Gumpel & Awartani, 2003; Heiman, 2001), and the West Indies (Dupoux, Wolman, & Estrada, 2004; Hall & Dixon, 1995; Lambert, Lyubansky, & Achenbach, 1998; Newton & Brathwaite, 1987). Historically, educational researchers have taken varied positions regarding inclusion or integration as programmatic model. Supporters point to academic and social gains of the student with the disability, as well as acceptance of diversity among fellow students and community members, as benefits of inclusion (Lipsky & Gartner, 1996; Whitaker, 2004). Opponents note concerns about the lack of training, personnel and administrative support and the uncertainty of academic and social gains through adopting such model (Lewis & Doorlag, 2003; Peterson & Hittie, 2003; Salend, 2001, 2005). Although these issues are important, one of the critical factors determining the success of the inclusionary program is the attitudes of the teachers who are involved in the program (Bruneau-Balerrama, 1997; D’Alonzo, Giordano, & Vanleeuwen, 1997; Hammond & Ingalls, 2003; Lanier & Lanier, 1996; Lewis & Doorlag, 2003; Olson, Chalmers, & Hoover, 1997; Peterson & Hittie, 2003; Salend, 2001,
7

2005; Smith, et al., 2004; Stoler, 1992; Waldron, McLeskey, & Pacchiano,1999). Issues of access and integration are strongly related to teachers’ attitudes toward inclusion (Welch, 1989). The Salamanca Report suggested that attitudinal factors could affect and influence integration of students in the general classroom (UNESCO, 1994). Cook and Gerber (1999), Larrivee and Cook (1979), Lewis and Doorlag (2003) and Salend (2005) stated that teachers’ attitudes are a prerequisite to successful integration of students with disabilities and the cooperation and commitment of those directly involved in implementing policies are essential (Avramidis, Bayliss, & Burden, 2000). Teachers’ Attitudes Toward Inclusion or Integration of Students with DisabilitiesResearch on teachers’ attitudes has been carried out in most regions of the world and mirrors the political agendas of these countries in focusing attention on the exclusion of children from educational opportunities (UNESCO, 1994). Globally, some countries have enacted legislation pertaining to integration of students with disabilities (Abosi, 2000) and some are just beginning the process of implementing these programs and/or policies (Meijer, 1998; UNESCO, 1994). Overall, research seems to support the notion of a general culture of teaching (Lortie, 1975), in that teachers’ attitudes toward students with disabilities are consistent and similar irrespective of the different national cultures in which teaching takes place (Thematic Group 9, 1996). For example, a cross cultural study conducted on teachers’ attitudes in Haiti and the USA revealed that teachers had similar attitudes toward inclusion (Dupoux et al., 2005).
In many areas of the world, special education is provided as a supplement to or parallel to general education. In other regions, countries are just meeting the basic learning needs of their populations with special needs (Ainscow & Haile-Giorgis, 1999). Dissatisfaction with the integration model has led to the emergence of an inclusive orientation practice that broadens the range of children to be served in general settings (Meijer, 1998; UNESCO, 1994). However, professionals continue to debate integration pertaining to placement of pupils in general settings, since these students require differentiated and individualized teaching (Kauffman, Landrum, Mock, Sayeski, & Sayeski, 2005; Hornby, 1999; Stainback & Stainback, 1984). Typically, general educators find it difficult to respond to the mandate to integrate students with disabilities to the maximum extent appropriate in general settings. They may perceive this as an additional burden on their already stressed workloads (Meijer, 1998; Scruggs & Mastropieri, 1996). One of the most important factors affecting teachers’ attitudes toward integration or inclusion is the type and severity of disabilities. Research has revealed that, irrespective of teaching experience, severity of disability shows an inverse relationship with positive attitudes such that as the perception of severity increases, teachers’ positive attitudes decrease (Forlin, Douglas, Hattie, 1996). A cross-cultural study of fourteen nations found that teachers favored certain types of disabilities for integration in the regular setting (Bowman, 1986). This is supported by other research showing that teachers are more disposed to accept students with mild disabilities than students with behavioral-emotional disabilities (Dupoux et al., 2005; Ward, Center, & Bochner, 1994). Generally, teachers find it difficult to teach students with more severe disabilities, particularly students with social maladjustments and emotionally disturbance, due to a lack of training and support and large class sizes (Leyser & Tappendorf, 2001; Scruggs & Mastropieri, 1996). Other factors that have been studied with regard to how they affect teachers’ attitudes toward integration include gender, teachers’ experiences and contacts with students with disabilities, level of education, training, administrative support, and class size. With regard to gender, Alghazo and Naggar Gaad, (2004) report that male teachers’ attitudes toward integration are more negative than female teachers, while no gender difference was reported by Berryman (1989). Studies that examined teachers’ experiences noted that teachers’ acceptance of
8

integration is related to previous experience with children with disabilities (Taylor, Richards, Goldstein, & Schilit, 1997). According to Leyser, Kapperman, and Keller (1994), overall teachers’ contact and interactions with people with disabilities promote positive attitudes towards integration. While some studies have indicated that individuals with a higher education level were more negative toward integration (Antonak, Mulick, Kobe, & Fiedler, 1995; Stoler, 1992), other studies found the opposite trend (LeRoy & Simpson, 1996; Villa, Thousand, Meyers, & Nevin, 1996).
Teachers’ attitudes also appear to vary based on integration inservice training. Stoler (1992) and Leyser et al. (1994) reported positive teacher attitudes after inservice training, while other studies found that staff development failed to improve teachers’ attitudes (McLesky & Waldron, 1995; Wilczenski, 1993). Factors related to administrative support have been linked to teachers’ commitment to integration. Teachers consider the presence of organizational support and resources as critical in forming positive attitudes toward integration (Kruger, Struzziero, & Vacca, 1995). An additional component of positive attitude is related to class size. General educators reported that reducing class size to 20 students would facilitate their integration effort (Pollard & Rojewski, 1993; Scruggs & Mastropieri, 1996).
Theoretical BackgroundTheories and values held by teachers strongly shape their teaching practices and preferences for students (Kagan, 1992). Pajares (1992) pointed out that all teachers hold beliefs about their work, their students, and in a broader context, their confidence to affect student performance. There is potential for conflict as teachers respond to school’s expectations that are different from their beliefs, and in turn try to reconcile them in their classroom practices (Macnab & Payne, 2003). It is well established that teachers’ expectations about students will affect their instructional goals and methods (Mavopoulou & Padeliadu, 2000). Moreover, teachers’ instructional tolerance (the range of variance in disabilities a teacher can effectively accommodate) necessitates the exclusion of some students with disabilities because, since teachers’ knowledge is finite, some students fall outside of teachers’ unique stocks of pedagogical knowledge and skills. As a result, teachers simplify their instructional tasks to target the range of students with similar instructional needs that fall within their instructional tolerance (Gerber, 1988, 1995; Gerber & Semmel, 1985). In view of the many responsibilities imposed on teachers, Lampert (1985) described teachers as “dilemma managers with ambiguous identities.” In such environments, teachers’ beliefs are situational because they are consumed with a variety of implicit and explicit mandates that define and limit their instructional practices (Duffy, 1982). In order to cope with these pedagogical dilemmas as well as variance in students’ instructional levels (Gerber, 1988, 1995), teachers seem to agree with the philosophy that schools should provide benefits for all children, but seem to disagree that the general classroom is the only avenue (Scruggs & Mastropieri, 1996; Zigmond & Baker, 1996).
The Present StudyThis follow-up study was undertaken to examine the attitudes of urban and rural teachers in Haïti toward integration of students with disabilities. A comparative study of urban teachers in Haïti and the USA revealed that urban teachers in both countries support the philosophy of integration while recognizing that it is not realistic for all students with disabilities (Dupoux et al., 2005). The present study investigated teachers’ attitudes toward inclusion in Haïti at a time when the Haitian government is forging ahead with a new programmatic model to bridge the gap between the current system and an integrated program. The predictive variables used in this study included gender, education level, years of teaching experience, number of students in the classroom, type of teacher (regular or special education), number of students with disabilities taught, categories of disability served, range of effective accommodation, and teachers’ perceptions of other teachers’ attitudes.
9

The following hypotheses guided the research:1. On average, the attitudes of teachers toward integration in Haïti will be similar in
urban and rural areas.2. Attitudes toward integration will be positively associated with the number of
years of teaching experience.3. Teachers with higher levels of education will have more positive attitudes toward
integration than teachers with lower levels of education.4. On average, teachers’ actual teaching experiences will be less powerful predictors
of attitudes toward integration of students with disabilities than teachers’ cognitions and beliefs.
MethodParticipantsThe sample for this study consisted of 183 elementary and secondary urban and rural teachers in Haïti. The sample of teachers was recruited from three public schools, five Catholic schools, and six nondenominational private schools. One of the two public schools in Haïti included in the study is currently piloting mainstreaming classes.
InstrumentsParticipants were administered the Opinions Relative to Integration (ORI) of Students with Disabilities. The instrument is a modified version of a questionnaire originally constructed by Larrivee and Cook (1979), and revised by Antonak and Larrivee (1995). This rating instrument measures teachers' attitudes toward the integration of students with disabilities in regular settings by presenting statements such as “Integration of special needs students will require significant changes in regular classroom procedures,” or “The integration of special needs students can be beneficial for regular students.” The ORI contains 25 positively and negatively worded statement options rated on a 6-point Likert scale ranging from disagree very much (-3) to agree very much (+3).
Reported psychometric characteristics for the ORI have been satisfactory (Antonak & Livneh, 1988); a split-half reliability as determined by the Spearman-Brown reliability coefficient of 0.92 was reported in 1979 and 1982. With the latest revision of this instrument in 1995, the mean of the Spearman-Brown corrected split-half reliability estimate was 0.87, and a Cronbach’s alpha homogeneity coefficient of 0.83 was reported. The ORI was field-tested in a previous study with teachers in Haïti. The Pilot study indicated that no changes or revisions were necessary even after translation into the French language and modifications (e.g. handicap instead of disability) to establish concept equivalence for the Haitian linguistic context. Reliability of the ORI for Haitian teachers in a previous study was determined to be 0.76 using a split-half procedure (as determined by the Spearman-Brown reliability coefficient), and a Cronbach’s alpha of 0.67 (Dupoux et al., 2005).
In this study, a factor analysis indicated that there is only one dimension of attitudes for this sample, as opposed to the four factors proposed by the developers of the ORI (Antonak & Larrivee, 1995). Consequently, only the total score of the scale was used in the analyses. The sum of responses of the scale ranges from 0 to 150, with a higher score indicating a more favorable attitude (Antonak & Livneh, 1988).
In addition to the ORI, a background instrument, developed by the first author, requested information about gender, level of education (bachelor’s, master’s or above), total number of years of teaching experience, average number of students in the classroom, type of teacher (regular or special education), number of students with disabilities taught during the past three years if the teacher was a regular teacher, categories of mild to moderate disability (Learning Disabilities, Physical Disabilities, Emotional Problem, Deafness or Blindness) that teachers had served over the years, categories of disabilities (Mobility, Visual or Hearing, Learning Disabilities, Emotional Problem) that teachers thought they could effectively accommodate,
10

and teachers’ perceptions of other teachers’ attitudes toward integration (favorable, neutral, or unfavorable).
ProceduresSurvey packages were distributed to teachers by the school principal or an assigned teacher during staff meetings. The school principal or the assigned teacher collected the sealed envelopes at the end of the faculty meeting and mailed them to the first author. The entire package required about 15 minutes to complete. All responses were anonymous. The survey packet had three sections. It began with a cover letter describing the purpose of the study and the rights of the participants. The second section addressed general background information about teachers. The last section included the ORI (Antonak & Larrivee, 1995).
ResultsDescription of the SampleOverall, the return rate was 72%. The number of urban respondents (n = 114) was greater than the number of rural respondents (n = 70). Of the 184 participants, females represented 52% (n = 95) of the sample. Only 13% of the respondents (n = 23) reported a graduate degree as the highest level of education attained. The average years of teaching experience was 13.1 (SD = 6.60) and the average class size was 40.1 (SD = 11.94).
With respect to mild to moderate categories of disability that teachers have dealt with over the years, teachers were much more likely to have had experience with the learning disability category (64%) than with any other disability. Teachers reported less experience with physical disabilities (44%), deafness or blindness (19%), and emotional problem (10%).
The learning disability category was the easiest item endorsed by teachers as a category of disability they believed they could effectively accommodate (73.9%). Mobility impairment was the category next most frequently endorsed by teachers (47.3%). Less than a quarter of the respondents did not believe they could effectively accommodate students with visual or hearing disabilities (22.8%). Even fewer teachers believed they could effectively accommodate students with emotional disorders (13.6%). Teachers more commonly perceived their colleagues’ attitudes toward integration as neutral (48.9%), while reporting that other teachers have a favorable attitude (28.3%) slightly more often than an unfavorable attitude (22.8%) toward integration.
Analysis of Teachers’ AttitudesReliability of the ORI for Haitian teachers was determined to be 0.68 using a split-
half procedure (as determined by the Spearman-Brown reliability coefficient). Twelve items on the ORI had reverse wording and were recoded so that higher scores represented more favorable attitudes toward integration. In order to proceed with the scoring, each respondent’s responses were summed, and a constant of 75 was added to the total to eliminate negative scores. As a result, scores could range from 0 to 150.
Teachers in rural Haïti (M = 80.19, SD = 16.69) on average had similar attitudes toward integration to teachers in urban Haiti (M = 77.80, SD = 15.65), t (182) = 1.03, p = .31. Contrary to predictions, attitudes were uncorrelated with years of teaching experience, r = .07, p = .33. Results indicated that on average, teachers with Master’s degrees have more positive attitudes toward integration (M = 86.43, SD = 15.37) than teachers with less than a Master’s degree (M = 77.60, SD = 12.47), t (182) = 2.63, p = .009.
A series of four items was used to assess teachers’ attitudes about their abilities to effectively accommodate students with mild to moderate disabilities (mobility, visual/hearing, learning, emotional disabilities). Collectively, these items were statistically significant predictors of teachers’ attitudes, F (4, 183) = 2.47, p < .05, in a regression equation. An index of teachers’ tolerance was created from the predicted value for attitude based on this regression,
11
combining the four items. The index was used as the dependent variable in the subsequent multiple regression analysis.
A multiple regression was conducted to assess whether the actual experience of teaching (years of teaching experience, class size, special education or regular teacher, and number of special education students a regular teacher has had in class) has less influence on a teacher’s attitude than the variables representing teachers’ cognitions and beliefs (instructional tolerance, education level, teachers’ perception of colleagues’ attitudes). The variables representing the actual experience of teaching were entered as the first block in the regression model and they explained only 2.8% of the variance in attitude, F(4,179) = 1.29, p = .28. The variables representing the teacher’s cognitions and beliefs were entered as the second block and they explained an additional 5.3% of the variance in attitude, F(3,176) = 3.40, p = .02. Therefore, teachers’ cognitions and beliefs explained almost twice as much of the variance in attitude as teachers’ actual experience of teaching.
DiscussionThere have been unprecedented efforts by world organizations (UNESCO, 1994) to encourage governments around the world to provide equal access to education to students with disabilities, as part of a broad human rights agenda (Chow, Blais, & Hemingway, 1999). One of the main objectives of this study was to understand how urban and rural teachers in Haïti, a country in the beginning stages of formulating a national policy for integrating students with disabilities in the regular classroom, respond to the demands of providing the same educational experience to all students.
Findings indicated that teachers in rural areas did not differ from teachers in urban areas in their attitudes toward integrating students with disabilities. In fact, both groups of teachers had a moderate level of acceptance of students with disabilities. Contrary to expectations, years of experience was not correlated with attitudes toward integration. This finding supports the regression analysis conducted in this study, which showed that the actual teaching experiences of teachers were less important in predicting attitudes than the teachers’ owns ideas and beliefs.
Although years of teaching experience was not associated with attitudes, having a higher educational degree was positively correlated with attitudes toward integration. This finding underscores the importance of education in implementing changes, and in this particular case, in acceptance and willingness to accommodate students with disabilities.
Predictors of attitudes toward integration of students with disabilities were grouped into the categories of actual teaching experience and teachers’ own cognitions and beliefs. Out of almost 9% of the variance in teachers’ attitudes, 5% was explained by variables representing the teachers’ cognitions and beliefs. Nevertheless, almost 90% of the variance in teachers’ attitudes remained unexplained in this study. Teachers’ thinking is complex as they consider multiple factors in determining how they should respond to the integration movement. There might be unobservable personal variations that cannot be captured by administering a survey of teachers’ attitudes.
Teachers’ own cognitions and beliefs, in part, may have their sources in their experiences while they were students, they may be the product of their teacher training (Pajares, 1992), or they may be a combination of their training and falling in-line with the prevailing ideas or beliefs within the context of the school (Acker, 1990; D’Andrade, 1981). Greene (1973) suggests that because teachers are isolated in their classroom, they are estranged from the importance of school policies over the day-to-day realities of their particular classrooms. In this fragmented reality, grand ideas such as integration seem less of a concern, and therefore appear as an estranged collective process and added burden.
12
Recommendations for Further ResearchFuture research on teachers’ attitudes should be related to teachers’ personality characteristics, such as locus of control, and to behavioral indicators of attitudes, such as pursuing an advanced degree in special education (Antonak & Larrivee, 1995). Teacher attitude is a multidimensional construct; for example, introducing the predictor teacher efficacy in the study design may help generate a teacher profile that aids in selecting teachers who may successfully carry the educational reform into their classroom, especially in countries in the beginning stages of integration.
Practical ImplicationsTwo findings in this study, the positive correlation between education and attitudes as well as the role of teachers’ beliefs and ideas, indicate the need to educate teachers before acceptance and accommodation of students with disabilities can really occur. The authors recommend the development of workshops for teachers in Haïti about students with disabilities and instructional strategies to support these students. Increasing teachers’ knowledge and awareness about these students could be an important step in implementing integration in Haïti, and other third world countries. Moreover, developing in the near future a degree program in special education in one of the universities in Haïti could be a fundamental step toward providing a thorough education to the future teachers of students with disabilities, thus changing and improving attitudes toward this population of students.
Moreover, there is an assumption that a mandate codifying the rights of students with disabilities has the potential of affecting teachers’ attitudes in a positive way. The legislature in Haïti can emulate disability legislation in the USA and Canada by enacting a law that provides the basis for classroom practices and that relates to the rights of students with disabilities to be educated in the least restrictive environment.
Additionally, in the Caribbean region, educators uninformed about the integration movement can be exposed to this educational reform movement. To accomplish this, political leaders in countries in the area can move in the direction of integrating students with disabilities, as in Haïti, or can adopt supportive policies of countries with a substantial political influence in the region, such as the USA and Canada. Examples of integration models in the USA and Canada can be emulated until nations in the region can design a system that fits their culture, and implement a financing scheme that can be sustained in the midst of severe economic limitations.
ReferencesAbosi, C. O. (2000). Trends and issues in special education in Botswana. The Journal of Special Education, 34(1), 48-53.Acker, S. (1990). Teachers’ culture in an English primary school: Continuity and change. British Journal of Sociology of Education, 11(3), 257-273.Ainscow, M., & Haile-Giorgis, M. (1999). Educational arrangements for children categorizedas having special needs in Central and Eastern Europe. European Journal of Special Needs Education, 14(2), 103-121.Alghazo, M. E., & Naggar Gaad, E. (2004). General education teachers in the United Arab Emirates and their acceptance of the inclusion of students with disabilities. British Journal of Special Education, 31(2), 94-100.Antonak, R., & Larrivee, B. (1995). Psychometric analysis and revision of the opinions relative to mainstreaming scale. Exceptional Children, 62(2), 139-142.Antonak, R., & Livneh, H. (1988). The measurement of attitudes toward people with disabilities: Methods, psychometrics, and scales. Springfield, Il: Charles C Thomas.Antonak, R. F., Mulick, J. A., Kobe, F. H., & Fiedler, C. R. (1995). Influence of mental retardation severity and respondent characteristics on self-reported attitudes toward mental retardation and eugenics. Journal of Intellectual Disability Research, 39(4), 316- 325.
13
Arbeiter, S., & Hartley, S. (2002). Teachers' and pupils' experiences of integrated education in Uganda. International Journal of Disability, Development and Education, 49(1), 61-78.Avramidis, E., Bayliss, P., & Burden, R. (2000). A survey into mainstream teachers' attitudes towards the inclusion of children with special education needs in the ordinary school in one local education authority. Educational Psychology, 20 (2), 191-212.Background Notes on Countries of the World (2003). Republic of Haïti. Philadelphia: US Department of State.Baine, D. (1993). Special education in developing countries: instructional content and process.In: P. Mittler, R. Brouilette & D. Harris (Eds.), World yearbook of education 1993. London: Kogan Page.Barnartt, N. S., & Kabzems, V. (1992). Zimbabwean teachers' attitudes towards the integration of pupils with disabilities into regular classrooms. International Journal of Disability, Development and Education, 39(2), 135-46.Berryman, J. D. (1989). Attitudes of the public toward educational mainstreaming. Remedial and Special Education, 10(1), 44-49.Booth, T. (1996) A perspective on inclusion in England. Cambridge Journal of Education, 26(1), 87-99.Bowman, I. (1986). Teacher training and the integration of handicapped pupils: Some findings from a fourteen nation UNESCO study. European Journal of Special Needs Education, 1, 29-38.Bruneau-Balderrama, O. (1997). Inclusion: Making it work for teachers, too. The Clearing House, 70(6), 328-330.Campbell, J., Gilmore, L., & Cuskelly, M. (2003). Changing student teachers' attitudes towards disability and inclusion. Journal of Intellectual & Developmental Disability, 28(4), 369-380.Chow, P., Blais, L., & Hemingway, J. (1999). An outsider looking in: Total inclusion and the concept of equifinality. Education, 119(11), 7-12.Clark, D. M., & Artiles, J. A. (2000). A cross-national study of teachers' attributional patterns. Journal of Special Education, 34(2), 77-90.Clarke, C., & Nomanbhoy, M. D. (1998). Attitudes of Singapore pre-school centre personnel on integrating children with disabilities. Early Child Development and Care, 144, 119-128.Cook, B., & Gerber, M. (1999). Attitudes of principals and special education teachers toward students with mild disabilities: Critical differences of opinion. Remedial and Special Education, 20(8), 54-63.D’Andrade, R. G. (1981). The cultural part of cognition. Cognitive Science, 5(4), 179-195.D'Alonzo, B. J., Giordano, G., & Vanleeuwen, D. M. (1997). Perceptions by teachers about the benefits and liabilities of inclusion. Preventing School Failure, 42(1), 4-11.deMarrais, B. K., & LeCompte, D. M. (1999). The way schools work: A sociological analysis of education. New York: Addison Wesley Longman.Didaskalou, S. E., & Millward, J. A. (2001). Greek teachers' perspectives on behavior problems: Implications for policy-makers and practitioners. European Journal of Special Needs Education, 16(3), 289-299.Duffy, G. (1982). Fighting off the alligators: What research in real classrooms has to say about reading instruction. Journal of Reading Behavior, 14(3), 357-373.Dupoux, E,. Wolman, C., & Estrada, E. (2005). Teachers’ attitudes toward integration of students with disabilities in Haiti and the United States. International Journal of Disability, Development and Education, 52(1), 45-60.Engelbrecht, P., Oswald, M., Swart, E., & Eloff, I. (2003). Including learners with intellectual disabilities: Stressful for teachers? International Journal of Disability, Development and Education, 50(3), 293-308.Flem, A., & Keller, C. (2000). Inclusion in Norway: A study of ideology in practice. European Journal of Special Needs Education, 15(2), 188-205.Forlin, C., Douglas, G., & Hattie, J. (1996). Inclusive practices: How accepting are teachers? International Journal of Disability, Development and Education, 43(2), 19-33.
14

Gerber, M. M. (1988). Tolerance and technology of instruction: Implications for special education reform. Exceptional Children, 54(2), 309-314.Gerber, M. M. (1995). Inclusion at the high-water mark? Journal of Special Education, 29(3), 181-199.Gerber, M. M., & Semmel, M. I. (1985). The microeconomics of referral and reintegration: A paradigm for evaluation of special education. Studies in Educational Evaluation, 11, 13-29.Gibbons, E., & Garfield, R. (1999). The impact of economic sanctions on health and human rights in Haïti. American Journal of Public Health, 89(10), 1499-1504.Greene, M. (1973). Teacher as stranger: Educational philosophy for the modern age. Belmont, CA: Wadsworth Publishing Company.Gumpel, P. T., & Awartani, S. (2003). A comparison of special education in Israel and Palestine: Surface and deep structures. Journal of Special Education, 37(1), 33-48. Hall, M. W., & Dixon, M. (1995). Effective teachers: Views and actions of Caribbean special education teachers in training. British Journal of Special Education, 22(4), 165-168.Hammond, H., & Ingalls, L. (2003). Teachers' attitudes toward inclusion: Survey results from elementary school teachers in three southwestern rural school districts. Rural Special Education Quarterly, 22(2), 24-27.Heiman, T. (2001). Inclusive schooling-middle school teachers' perceptions. School Psychology International, 22(4), 451-462.Hornby, H. (1999). Inclusion and delusion: Can one size fit all. Support for Learning, 14(4), 152-157.Janak, C. T. (2000). Haiti’s “Restavec” slave children: Difficult choices, difficult lives. . . yet . . . Lespwa fe Viv. The International Journal of Children’s Rights, 8(4), 321–331.Kagan, D. (1992). Professional growth among pre-service and beginning teachers. Review of Educational Research, 62(2), 129-170.Kauffman, M. J., Landrum, J. T., Mock, R. D., Sayeski, B., & Sayeski, L. K. (2005). Diverse knowledge and skills require a diversity of instructional groups: A position statement. Remedial and Special Education, 26(1), 2–6.Kataoka, M., Van Kraayenoord, E. C., & Elkins, J. (2004). Principals' and teachers' perceptions of learning disabilities: A study from Naar Prefecture, Japan. Learning Disability Quarterly, 27(3), 161-175.Kruger, L. J., Struzziero, J., & Vacca, D. (1995). The relationship between organizational support and satisfaction with teacher assistance teams. Remedial and Special Education, 16(1), 203-211.Lambert, C. M., Lyubansky, M., & Achenbach, M. T. (1998). Behavioral and emotional problems among adolescents of Jamaica and the United States: Parent, teacher, and self-reports for ages 2 to 18. Journal of Emotional & Behavioral Disorders, 6(3), 180-188.Lampert, M. (1985). How do teachers manage to teach?: Perspectives on problems in practice. Harvard and Educational Review, 55(3), 178-194.Landrum, E. J. (1999). Adolescent novels that feature characters with disabilities: An annotated bibliography. Journal of Adolescent & Adult Literacy, 42(4), 284-291.Lanier, N. J. St Lanier, W. L. (1996). The effects of experience on teachers' attitudes toward incorporating special students into the regular classroom. Education, 117(2), 234-240. Larrivee, B., & Cook, L. (1979). Mainstreaming: A study of the variables affecting teacher attitude. The Journal of Special Education, 13(3), 315-324.LeRoy, B., & Simpson, C. (1996). Improving students outcomes through inclusive education. Support for Learning, 11(1), 32-36.Lewis, R. B., & Doorlag, D. H. (2003). Teaching special students in general education Classrooms (6th ed.). New Jersey: Merrill Prentice Hall.Leyser, Y., Kapperman, G., & Keller, R. (1994). Teacher attitudes toward mainstreaming: A cross-cultural study in six nations. European Journal of Special Needs Education, 9(3), 1-15. Leyser, Y., & Tappendorf, K. (2001). Are attitudes and practices regarding mainstreaming changing? A case of teachers in two rural school districts. Education, 121(4), 751-761.Lipsky, D. K., & Gartner, A. (1996). Inclusion, school restructuring, and the remaking of the American society. Harvard Education Review, 66, 762-796.
15
Lortie, D.C. (1975). Schoolteacher: A sociological study. Chicago, IL: University of Chicago Press.MacNab, S. D., & Payne, F. (2003). Beliefs, attitudes and practice in mathematics teaching: Perceptions of Scottish primary school student teachers. Journal of Education for Teaching, 29(1), 55-68Mallory, B. L., Charlton, J. I., Nicholls, R. W., & Marfo, K. (1993). Traditional and changing views of disability in developing countries: Causes, consequences, cautions. The International Exchange of Experts and Information in Rehabilitation Monograph, 53.Mavropoulou, S., & Padeliadu, S. (2000). Greek teachers' perceptions of autism and implications for educational practice. Autism: The International Journal of Research & Practice, 4(2), 173-183.McLeskey, J., & Waldron, L. N. (1995). Inclusive elementary programs: Must they cure students with learning disabilities to be effective? Phi Delta Kappan, 295-299.Meijer, W. J. (1998). Integration in Europe: Provisions for pupils with special educational needs. Trends in 14 European Countries. European Agency for Development in Special Needs Education. Miles, M. (1985). Children with disabilities in ordinary schools. Peshawar, Pakistan: Mental Health Centre.Ministère de L’Éducation Nationale de la Jeunesse et des Sports. (1995). Projet d’ élaboration du plan national éducation 2004 : Actes du séminaire d’ élaboration de la stratégie du plan national d’ education. Port-au-Prince, Haïti: Author.Ministère de L’Éducation Nationale de la Jeunesse et des Sports. (1998). Le plan national d’éducation et de formation. Port-au-Prince, Haïti: Author.Mushoriwa, T. (2001). A study of the attitudes of primary school teachers in Harare towards the inclusion of children in regular classes. British Journal of Special Education, 28(3), 142-147.Newton, E. H., & Brathwaite, W. E. (1987). Priorities and program effectiveness in teacher education: A study of the perceptions of teachers in training and their tutors. Teaching and Teacher Education, 3(3), 193-204.Nkabinde, P. Z. (1993). The role of special education in a changing South Africa. Journal of Special Education, 27(1), 107-115.Olson, M. R., Chalmers L., & Hoover, J. H. (1997). Attitudes and attributes of general education teachers identified as effective inclusionists. Remedial and Special Education, 18(1), 28- 35.Organization of American States. (1999). Inter-American Convention on the Elimination of All Forms of Discrimination against Persons with Disabilities (29th session). Organization of American States, General Assembly.Pajares, F. M. (1992). Teachers’ beliefs and educational research: Cleaning up a messy construct. Review of Educational Research, 62(3), 307-322.Peterson, J. M., & Hittie, M. M. (2003). Inclusive teaching: Creating effective schools for all learners. Boston: Allyn & Bacon.Pijl, S. J., & Dyson, A. (1998). Funding special education: A three-country study of demand-oriented models. Comparative Education, 34(3), 261-279.Pollard, R., & Rojewski, J. (1993). An examination of problems associated with grading students with special needs. Journal of Instructional Psychology, 20(2), 154-162.Poon-McBrayer, K. F. (2004). To integrate or not to integrate: Systemic dilemmas in Hong Kong. Journal of Special Education, 37(4) 249-256.Salend, J. S. (2001). Creating inclusive classrooms: Effective and reflective practices (4th ed.). New Jersey: Merrill.Salend, J. S. (2005). Creating inclusive classrooms: Effective and reflective practices for all students (5th ed.). New Jersey: Pearson- Merrill Prentice Hall.Salmi, J. (2000). Equity and equality in Private Education: The Haitian paradox. Compare, 30(2), 163-178.Scheer, J., & Groce, N. (1988). Impairment as a human constant: Cross-cultural and historical perspectives on variation. Journal of Social Issues, 44, 23-37.
16
Scruggs, E. T., & Mastropieri, A. M. (1996). Teacher perceptions of mainstreaming/inclusion, 1958-1995: A research synthesis. Exceptional Children, 63(1), 59-75.Senel, G. H. (1998). Special education in Turkey. European Journal of Special Needs Education, 13(3), 254-261.Smith, T. E., Polloway, E., Patton, J. R., & Dowdy, C. A. (2004). Teaching students with special needs in inclusive settings (4th ed.). New Jersey: Pearson-Merrill Prentice Hall.Stainback, S., & Stainback, W. (1984). A rationale for the merger of special and regular Education. Exceptional Children, 51, 102-111.Stoler, R. D. (1992). Perceptions of regular education teachers toward inclusion of all handicapped students in their classrooms. The Clearing House, 66(1), 60-62. Taylor, R., Richards, S., Goldstein, P., & Schilit, J. (1997). Teacher perceptions of inclusive settings. Teaching Exceptional Children, 29(3), 50-56.Thematic Group 9. (1996). Enhancing cooperation between mainstreaming and special Education. Funen, Denmark: Modersmalets Trykkeri.UNESCO (1994). World conference on special needs education: Access and quality. (Final Report). Salamanca: Author.UNESCO (1996). Inclusive schooling and community support programs. Paris: Author.UNESCO (1997). First steps: Stories on inclusion in childhood education. Paris: Author.UNESCO (1999). Salamanca-five years on: A review of UNESCO activities in the light of the Salamanca statement and framework for action on special needs education. Paris: Author.Villa, R., Thousand, J., Meyers, H., & Nevin, A. (1996). Teacher and administrator perceptions of heterogeneous education. Exceptional Children, 63(1), 29-51.Ward, J., Center, Y., & Bochner, S. (1994). A question of attitudes: Integrating children with disabilities in the regular classroom. British Journal of Special education, 21(1), 34-39.Waldron, N. L., McLeskey, J., & Pacchiano, D. (1999). Giving teachers a voice: Teachers' perspectives regarding elementary inclusive school programs (ISP). Teacher Education and Special Education, 22(3), 141-153. Weintraub, F. (2005). The evolution of LD policy and future changes. Learning Disability Quarterly, 28(2), 97-99.Welch, M. (1989). A cultural perspective and the second wave of educational reform. Journal of Learning Disabilities, 22, 537-540.Whitaker, P. (2004). Fostering communication and shared play between mainstream peers and children with autism: approaches, outcomes and experiences. British Journal of Special Education, 31(4), 215-223.Wilczenski, F. L. (1993). Changes in attitudes toward mainstreaming among undergraduate education students. Educational Research Quarterly, 17, 5-17.Woloshyn, V., Bennett, S., & Berrill, D. (2003). Working with students who have learning disabilities-teacher candidates speak out: Issues and concerns in preservice education and professional development. Exceptionality Education Canada, 13(1), 7-28.Zigmond, N. & Baker, M. J. (1996). Full inclusion for students with learning disabilities: Too much of a good thing? Theory Into Practice, 35(1), 26-34.
17
THE TECHNOLOGICALLY DEPENDENT/MEDICALLY FRAGILE AT RISK STUDENT
Thomas G. RyanNipissing University
This article considers our current technologically sophisticated educational system as it attempts to meet the needs of a school population that is more diverse, needy, and exceptional than at any other point in history. The very nature of the term ‘at risk’ is based on the perception that students may dropout due to their living situation which affects their academic lives. Within this at risk population there is a further level of need which includes students who are at risk of not only failure in school but also are identified as medically fragile/technology dependent (mf/td). It is this mf/td designation that is illuminated as these students require onsite complex medical care to manage ‘multiple’ risks via technologic support, multiple team member efforts, and coping mechanisms just to complete each day.
The current technologically sophisticated educational system attempts to meet the needs of a school population that is more diverse, needy, and exceptional than at any other point in history. Educators quickly realize the special needs of students as children encounter difficulties academically and socially. The very nature of the term at risk is based on the perception that students may dropout due to their living situation which affects their academic lives. Our at-risk population continues to grow daily as an increasing number of young people live in conditions characterized by extreme stress, chronic poverty, crime, and lack adult guidance ( Parkay, Hardcastle Stanford, Vaillancourt, Stephens, 2005, p.185). Within this at risk population there is a further level of need and this level includes students who are at risk of not only failure in school but also are identified as medically fragile/technology dependent (mf/td). The mf/td label is most often due to medical conditions requiring complex care. To meet the needs of these mf/td students who are at ‘multiple’ risk requires technologic support, multiple team member efforts, and coping mechanisms just to complete each day (Rehm, 2002).
Educators have no choice when confronted with the needs of mf/td at risk students. These students rely on family, school and the community at large to meet both their academic and health needs. Educators must work within a team as the education of mf/td at risk students demands a modified environment which is complex yet the use of technology should not drive the vision. The vision should drive the use of technology (Surgenor, 1992, p. 137). Our human capacity to take and shape technology is foremost in deciding just how much inclusion may be possible for each student hence the most meaningful change in schools is that which comes from within. Education and the educators within undertake a personal journey that is influenced by many forces that are in some way related to technology which is so deeply intertwined throughout our lives that it is sometimes hard to recognize, because of its pervasive nature (Ortega & Ortega, 1995, p. 11). Educators reflect, create and improve learning for all students so if the mf/td student requires medical devices to aid function, avert death, and maintain life support during each school day (Winzer, 2002), teachers will work to meet or exceed these targeted outcomes.
Current State of AffairsThe current labels technology dependent and medically fragile can best be defined as circumstances that require technological health intervention(s) to support life functioning. A
18
medical device or health intervention is required to maintain body function and often life itself. In the United States, it is estimated that between 11,000 and 68,000 children were reliant on technology (OTA, 1987, p. 6), and it is plausible that given the requisite supports each person could attend their community school. Each year there has been a slow augmentation of these numbers as technologic and medical advances continue to increase the odds that a td/mf person can live longer and more fully than previously expected. The American Academy of Pediatrics (1999) has similarly noted that there have been increases in the population of children who have serious chronic conditions, in part, because of improvements in survival rates for children with serious and/or life-threatening genetic, congenital, and postnatally acquired conditions (eg., cystic fibrosis, organ failure, cancer, human immunodeficiency virus, or severe prematurity) (Rehm, 2000, p. 2).
In Ontario recent data compiled by the Ministry of Health – Long Term Care (MoHLTC) Office of Integrated Services for Children suggests a prevalence rate of .057% within the Ontario population (Waterloo Region District Health Council, 2001, p. 4). This Health Unit estimates that approximately 1700 children in Ontario are considered td/mf. Each of these students may have the opportunity to attend school if the essential supports, team efforts, and vision are created within the local school and community. However, the Provincial Health Planning Database (2000) suggests,
the number of children with disabilities living in a geographic area is influenced by the array of services available in that area. Therefore, more urbanized parts of the district may have larger numbers of children in need of services than in rural areas. (p. 14)
Parents are attracted to an area that has expertise, services, and community supports that are essential for their child’s complex health and educational needs. Table 1 shows the number of children & youth with varying disability levels throughout a district and Ontario, in 1996.
Table one is summative yet lacks details of specific needs of individuals and the medical circumstances of each person. For instance, Td/mf students include many types of health exceptionalities such as, arthritis, cerebral palsy, clubfoot, hydrocephalus, limb deficiencies, multiple sclerosis, muscular dystrophy, scoliosis, and spina bifida. While there are many more health conditions that may be housed under the umbrella term of td/mf these seem to be most common in children and youth who attend school. Within our communities as this population of complex care students grows, they become more visible, known, and newsworthy in community planning. This leads to “activism by people with disabilities, their family members, and other advocates who have sought equal access to public services and facilities for all persons regardless of health or mobility status” (Rehm, 2000, p. 3).
School and Community SupportsWithin the school community and the political make-up of most regions is a complex series of relationships that allow support agencies to exist in a collaborative manner. For example, in January of 2000 The Integrated Services for Children Division (ISCD) was put into place to direct the Long Term Care (LTC) services in Ontario which are provided by Children’s Treatment Centres (CTC). CTC’s in turn are responsible for in home support to children who are not able to access services outside of the home. In addition, the CTC also includes a School Health Support Services program. This vital program enables students to attend school while receiving Long
Term Care (LTC) services. Each Children’s Treatment Centre offers LTC services to children and youth who are able be moved to attend. Most often children’s LTC services can be defined as
those community-based health and support services that are available for children with multiple special needs and/or complex care needs (Waterloo Region District Health Council, 2001, p. 5).
19

Table 1The number of children & youth with varying disability levels throughout a
district and Ontario, in 1996.Geography /Age Category
Population General Disability Rate (6.9%)
Multiple Special Needs Rate (2%)
Complex Care Needs Rate (.057%)
Waterloo Region 0-4 5-19 Total (0-19) % Total Pop.
30,433 88,588 119,021 (28.5) 418,334
2,100 6,133 8,212
609 1,772 2,380
17 50 67
Wellington-Dufferin 0-4 5-19 Total % Total Pop.
16,285 48,323 64,608 (28.9) 223,745
1,124 3,334 4,458
326 967 1,290
9 28 37
District 0-4 5-19 Total % Total Pop.
46,718 136,911 183,629 (28.6) 642,079
3,224 9,447 12,670
934 2,738 3,673
26 78 104
Ontario 0-4 5-19 Total % Total Pop.
756,053 2,221,814 2,977,867 (26.8) 11,100,876
52,168 153,305 205,473
15,121 44,436 59,557
431 12,66 1,697
Sources: Provincial Health Planning Database, 2000 (Population Figures); Statistics Canada (1996).
An example would be a student with cystic fibrosis who requires percussion therapy, to extricate mucus from their upper body, medication, and a strict diet to compensate for inadequate (pancreas) organ function. In order to better understand the levels and groups of required care the The Office of Integrated Services for Children (1999) designed the following table. (Table 2 next page)
When faced with such complex care it is common for most educators to feel inadequate. Indeed, Rehm (2002) makes it clear that,
school personnel have regular and increasing contact with children with chronic conditions and that they often feel inadequately prepared to understand the nature of children's health concerns or to handle medical emergencies in the classroom (Krier, 1993). School nurses and aides deliver most routine health treatments in the classroom, including medication administration, respiratory treatments, diapering or catheterization, and tube feeding (Koenning, et al., 1995). Parents and school nurses provide most of the information educators receive about children's health care needs
20
(Koenning, et al., 1995). Practicing physicians are not often active participants in planning for health services and special needs for children with chronic conditions (Palfrey, Singer, Walker, Butler, 1986). Despite the importance of school nurses as on-site resources for educators planning services for children with special needs, nurses are often "shared" by several schools and therefore not necessarily included in evaluations and planning for special education services. (p. 6)
Table 2Definition of Children who are MF and/or TD with Complex Care Needs
Group No. Care Requirements
Group 1 Children dependent at least part of each day on mechanical ventilation
Group 2 Children requiring prolonged intravenous administration of: nutritional substances drugs
Group 3 Children with daily dependence on other device-based support for: Tracheotomy tube care Suctioning Oxygen support Tube feeding
Group 4 Children with prolonged dependence on other devices which compensate for vital body functions who require daily or near daily nursing care, including: Apnea (cardio respiratory) monitors Renal dialysis due to kidney failure Urinary catheters or colostomy bags plus substantial nursing care
Group 5 Children with chronic conditions who are not technologically dependent but who require as great a level of care as Group 4, including: Children who are completely dependent on others for activities of daily living; Children who require constant supervision or monitoring resulting from the complexity of their condition and/or the quantity of oral drugs and therapy they receive.
(The Office of Integrated Services for Children, 1999)
In addition to the educators, special educators, nurses, teacher aides, administrators, and parents there could be several other team members in place to support a Td/mf student. These include Occupational Therapists, Physiotherapists, Speech-Language Pathologists, Social Workers, Psychologists, Psychometrists, Augmentative Communication Technologists, Recreation Therapists, Homemaking services, Personal Support Aides, Attendant Services, Dietetic services and Respite services for families caring for medically fragile and technologically dependent children. With larger teams there are points of tension, errors, and this only heightens the risk for the already at risk td/mf student.
21
Locally, a Central Ontario Board of Education has put in print a document entitled: Building the Future Together: Strategic Planning Toward the Year 2000. The resource suggests educators must be committed to providing the best possible educational opportunities through which each student may develop the necessary knowledge, skills and attitudes to become a responsible, contributing participant in a changing global society (Muskoka Board of Education, 1999, p. 48).
This inclusive vision is proactive yet when faced with the complex care and educational needs of a Td/mf at risk student the entire team needs to develop and embrace similar values, expectations, and outcomes in order for the team strategy to succeed via careful planning, application and maintenance. As well, there needs to be community support such as the Parents of Technologically Dependent Children (PTDC) of Ontario Kids Country Club with organizations in London, Guelph, and Cambridge, Ontario as these vital community supports strive to create a community where all children are cherished through advocacy, support and respite services (Parents of Technologically Dependent Children, 2003). This organization of stakeholders includes parents, advocates, and the community at large who work closely with the Ministry of Community, Family and Children’s Services and other professionals who often provide services in a volunteer mode. The vision of this community support group is to,
value each other and our friendships. Together we can hope and dream. Give us tomorrow but give us today where people have value and belong and the only label is their name. Together we will open doors that once were closed. Our needs may be different we can ensure the building of a caring community. Our children will live quality lives. But with respect for each other. (Parents of Technologically Dependent Children, 2003)
To attain some of these goals requires practical and assertive movement from educators who need to accept several contemporary realities:
Technology is an inseparable part of our daily existence.Technology is with us from the moment we wake up until the time that we turn in at night.Technology is even with us while we sleep.Technology is at the heart of our buildings and structures.Technology assists us in coping with the environment outside.Technology is vital in transporting us from place to place.Technology allows us to solve many of the challenges that face us. Technology is something that strikes fear in the hearts and minds of people.Technology intimidates.Technology is complicatedTechnology is advancing at ever-increasing rates.
(Lambton county Board of Education, 1994, p. 2)
Uncertainty can cause educators to put forward thoughts that all educators can and need to address. For instance, Wadsworth (1993) asks, Help! Is this an Intensive Care Unit or a classroom? Her paper offers practical suggestions for educators working with Td/mf students. Educators need to manage the physical environment (field trips, classroom layout & equipment), specialized equipment (modified desk, wheelchair desk, computer, audio, video), staff training, emergency response team & plans, student/family needs (peer relationships), counseling liaison, regular meetings (IEP, IPRC) for communication and monitoring (Wadsworth, 1993). What is implied is that there is a need to go beyond the Individual Educational Plan (IEP) and develop a written health care plan. The Health plan includes such items as monitoring and backup systems and schedules that detail frequency and duration of care at school. As well, the Td/mf students in regular classes (rather than special education classes) require more time to function, and transition. Health plans explain how nurses, aides, and caregivers will provide required follow-up activities.
22

Educators in Canada who work within Special Education attempt to do what is necessary to fulfill their obligations and comply with such imperative documents as the Canadian Charter of Rights and Freedoms, the Provincial Human Rights Code, the Provincial Education Act and regulations made under the act, and other relevant legislation. Most Boards strike committees such as the Special Education Advisory Committee (Ontario) to oversee the special education programs however, the hierarchy and number of stakeholders can slow a process and impinge on its effectiveness. An average Board of School Division would have a Special Education Superintendent, Manager of a Individual Placement and Review Committee, Coordinators of Special Education, Supervisors of Special Services, Office Supervisor/Administrator, Assistant Secretaries, (secretary IPRC/Psych/general secretary Special Ed), Psycho-educational Consultants, Speech & Language Pathologists, Child and Youth Counsellors, School Social Workers, Secretaries (MASS, OCTU), Regional Coordinator, and finally, the local school with its own stakeholders. What can happen, and usually does, is that information is mislaid and communication is deficient hence we then enter into a problem solving process that is often nicely laid out by the Board yet takes a great deal of time and energy to move through. Meanwhile the needy at risk Td/mf student attends school daily as stakeholders attempt to untangle themselves. Fortunately, the front line teacher is on the job each day unencumbered and taking care of the needs of all students.
ConclusionStudents have a right to an education and educators have a legal responsibility to educate all students including those who may be labeled Td/mf. Most Boards in Ontario have an integrated services delivery model for professional support services. Most often, the support is via the Special Education Advisory Committee with extended partnership agreements with community agencies that aim to enhance and expand the level of professional support services in its schools. By combining staff from each Board and the community agencies, three levels of professional support are most often offered throughout a region: clinical, targeted and universal. For example, universal programs target the student population as a whole while targeted programs focus on small groups of high-risk students and clinical programs provide interventions for individual symptomatic children. The complex care required for a Td/mf student would be considered clinical and as such be addressed on an individual case-by case basis. With rising numbers in Canada, it is only a matter of time before the training, support and expertise is more common, mainstream and available in all larger urban areas.
ReferencesAmerican Academy of Pediatrics (1999). Policy statement: care coordination: integrating health and related systems of care for children with special health care needs (RE9902). Pediatrics. 1999, 104(4):978-981.Lambton Board of Education. (1994). Technology: Primary - Junior Education.
Sarnia, ON: Author.Muskoka Board of Education. (1994). Building the future together.planning toward the year 2000. (1-64). Bracebridge, ON: Author.Ortega, C.A. & Ortega, R. (1995). Integrated elementary technology education. The Technology Teacher, 2, 11-16.Parents of Technologically Dependent Children (2003, Fall) Parents of technologically dependent children of Ontario Newsletter. Chestnut Hill, London, Ontario.Parkay, F. W., Hardcastle Stanford, B., Vaillancourt, J.P., Stephens, H.C. (2005). Becoming a teacher. (2nd ed.). Toronto, ON: Pearson.Rehm, R. S. (2002). Creating a context of safety and achievement at school for children who are medically fragile/technology dependent. Advances in Nursing Science, 24(3), 71-85.Statistics Canada. (1996). Health and Activity Limitations Survey, 1991. Ottawa, Ontario: Government of CanadaSurgenor, E. (1992). Designing Learning Systems. Cambridge, MA: Brookline Books.
23

The Office of Integrated Services for Children. (1999) Ministry of Health and Long Term Care Annual Report. Toronto, ON: Queens Printer.Wadsworth, D. E. (1993, April) Help! Is this an intensive care unit or a classroom? Paper presented at the Annual International Conference of the Council for Exceptional Children, San Antonio, TX.Waterloo Region District Health Council (2001, January). Background Paper: A profile of the long term care sector Waterloo, Wellington, and Dufferin . Waterloo, ON: Author.Winzer, M. (2002). Children with exceptionalities in Canadian classrooms. Toronto, ON: Prentice - Hall.
24

TIME-OUT INTERVENTIONS AND STRATEGIES: A BRIEF REVIEW AND RECOMMENDATIONS
Tera L. WolfT. F. McLaughlin
andRandy Lee WilliamsGonzaga University
The present paper reviews the literature regarding time-out interventions employed in home, school, and clinical settings. Characteristics examined include types of time-out, populations and settings, legal implications, and research implications. Policy recommendations for teachers, parents, and clinicians regarding time-out interventions are included.
The use of time-out as an acceptable therapeutic procedure has gained wide acceptance in schools, clinics, and hospitals. Time-out is a behavior change technique used to decrease the frequency of a target behavior, and is most effective for behaviors that are maintained either by attention or tangible reinforcers and if there is high discriminability between the time-out environment and the reinforcing environment, often referred to as time-in (Turner & Watson, 1999). The time-out technique involves placing a child in an environment limited in sensory stimulation contingent upon the emission of deviant behavior (Webster, 1976). Time-out has been effective in reducing such behaviors as tantrums, inappropriate social behaviors, yelling, aggression, time spent out-of-seat, and inappropriate verbalizations (Alberto, Heflin, & Andrews, 2002; Mortimer, Adamsky, & McLaughlin, 1998).
Time-out is a complicated and intricate intervention, involving far more than simply withdrawing an individual from ongoing activities and then returning him or her after a predetermined period of time. Effective timeout procedures are likely to vary a great deal, depending upon such factors as who is administering the intervention, the individual involved, and the setting (Harris, 1985).
Time-out is frequently misunderstood and even incorrectly defined by both professionals and lay persons (Harris, 1985). This may be due to such factors as changes in the conceptualization of time-out over time, the variety of ways to implement time-out, the multiple definitions which exist in the literature, occasional paradoxical effects, and difficulties in differentiating between time-out and response cost or extinction (Alberto et al., 2002). As the use of time-out in both basic research and applied settings increased, definitions of time-out changed and began to focus on contingent withdrawal from the opportunity to obtain reinforcement and a meaningful discrepancy between the time-in and time-out environments (Harris, 1985).
Few behavioral management techniques have generated as much controversy as isolation timeout. Educators and other professionals have used timeout procedures to modify a broad range of maladaptive behaviors in children and youth. Timeout is a somewhat aversive procedure on the continuum of behavior-reduction techniques, which also include environmental modification, differential reinforcement, response cost, overcorrection, aversive conditioning, and corporal punishment (Costenbader & Reading-Brown, 1995).
The continuum of ascending restrictiveness involved with using time-out includes such procedures as planned ignoring, during which social attention is removed from the individual;
25
contingent observation, where a student watches from the periphery but may not participate in group activities during the timeout period; exclusion timeout, when a student is removed from the reinforcing environment but may sit facing the corner of the room; and isolation or seclusion timeout, the most restrictive of these interventions, in which the student is removed from the classroom and stays alone in a barren room for a specified period of time.
Types of Time-OutHarris (1985) outlined three major types of time-out: exclusionary, non-exclusionary, and isolation time-out. Of these three, the first two types seem best suited for classroom use because the child does not need to be removed from the room (in accordance with the policy of least restrictive intervention).
Exclusionary. Exclusionary time-out involves removing the child from the reinforcing situation but not from the room or area of activity (e.g., playground, gym). When a child displays the inappropriate target behavior, he or she is immediately removed from the activity for a period of time. Examples of this type of time-out are sending a child to a corner of the room or a chair positioned away from the ongoing activity. The child is not allowed to view or be involved in any activity for a specified amount of time (Harris, 1985; Mace & Heller, 1990; Mortimer et al., 1998).
Nonexclusinoary. Nonexclusion time-out is similar to exclusion time-out in that the child is removed from the reinforcing situation for a certain amount of time but may still observe the ongoing activity of the class (Harris, 1985). Nonexclusinoary time-out has been further divided into three subcategories: contingent observation, removal of stimulus conditions, and ignoring (Costenbader & Reading-Brown, 1995; Harris, 1985). Harris (1985) defines the first subcategory, contingent observation, as a procedure wherin the individual is required to sit on the periphery of the ongoing activity and observe the appropriate behaviors of her or his peers for a brief period of time (p.280).
This type of time-out would be ideal during some activity such as recess or a structured group academic task in which the child can observe appropriate peer behaviors and see those behaviors being reinforced. To make contingent observation time-out most effective, the teacher must reinforce appropriate behaviors and the resulting reinforcement (Turner & Watson, 1999). After time-out is over, the teacher must then monitor the child to reinforce the first appropriate behavior demonstrated by the target child to ensure a rich time-in environment and to increase the discriminability between time-out and the classroom (Marlow, Tingstrom, Olmi, & Edwards, 1997).
The second subcategory of non exclusionary time-out, removal of stimulus conditions, imposes the contingent removal of reinforcing stimuli such as work or play materials, food, or opportunity to gain tokens (Alberto et al., 2002; Harris, 1985) for a certain amount of time after target behaviors are displayed. The reintroduction of reinforcing stimuli should be contingent upon demonstrating appropriate behavior to avoid inadvertently reinforcing inappropriate behavior (Harris, 1985).
The third category of nonexclusionary time-out, ignoring, involves withholding social attention contingent upon inappropriate behavior without removing the child from the situation (Turner & Watson, 1999). Ignoring is difficult to use in the classroom for three primary reasons: (a) some behaviors annoy, distract, or interfere with instruction to such an extent that they are almost impossible to ignore, (b) peer attention may maintain or contribute to the maintenance of a behavior, and (c) some behaviors are dangerous to the student and others (Turner & Watson, 1999). However, ignoring a child’s misbehavior is a simple procedure and can be quite effective given the proper circumstances (i.e., for a behavior that is mildly annoying, maintained solely by teacher attention, does not evoke attention from peers, and is not dangerous or destructive).
26

Isolationary. The third broad category of time-out is referred to as isolation. Isolation involves the removal of the child from the reinforcing environment to an environment where, at least theoretically, there are no reinforcers available to the child (Tingstrom, 1990). Isolation typically entails placing the student in a different area such as another room for a specified amount of time. As effective as this type of time-out can be (Costenbader & Reading-Brown, 1995), isolation requires extra personnel, (Harris, 1985), has specific federal, state, and local guidelines for its use (Yell, 1990), and is generally regarded as a more restrictive form of punishment (Mayerson, 2003). Because of these reasons, it may be difficult to use isolation in the standard classroom.
Use of isolation time-out should be determined by criteria which include the chronicity and intensity of the behavior, the danger of the behavior to those in the classroom, and the effectiveness of other techniques to change the behavior (Tingstrom, 1990). It should be then implemented only if the specific state and local legal prerequisites have been met (Yell, 1990).
Populations and SettingsProponents of using time-out with young children extol its virtues, at least for children two or three years of age and older (Readdick & Chapman, 2000). Numerous studies (Rortvedt & Miltenberger, 1994; Mace & Heller, 1990; Wilson, Robertson, Herlong, & Haynes, 1979; Alberto et al., 2002, Reitman & Drabman, 1996; Yeager & McLaughlin, 1995) have shown various effective uses of time-out with preadolescent children in the home, schools, and treatment facilities.
A study of Reitman and Drabman (1999) illustrates how the ongoing data-based monitoring of timeout use by parents enhanced the treatment of an 8-year-old boy, referred because of noncompliance in the home. Timeout was selected as the primary behavior change strategy and parents were instructed in implementing and recording each instance of timeout on a simple data form. In therapy sessions these data were reviewed and used to direct the course of treatment. Some of the benefits of the timeout record included, enabling rapid refinements in the timeout procedure by providing a feedback mechanism to the therapist, illustrating the need for adjunctive treatments and revision of case formulation, and more generally, by serving as a means of documenting treatment efficacy.
Numerous studies have evaluated the use of time-out in classroom and school environments in the areas of aggression (Lucas, 2000; Mortimer et al., 1998; Wilson, et al., 1979; Webster, 1976) and disruptive and noncompliant behavior (Mace & Heller, 1990;; Mace, Page, Ivancic & O’Brien, 1986; Rortvedt & Miltenberger, 1994; Reitman & Drabman, 1996; Yeager & McLaughlin, 1995;). The use of time-out has also been implemented in academic settings of community-based instruction (CBI) (Alberto et al., 2002), speech and language classrooms (Marrow et al., 1997), music education (Spradling, 1985), and physical education (Johnson, 1999; White & Bailey, 1990;).
Whittington and Moran (1990) evaluated Peace begins with me (Whittington, Crites, Kreidman, Beck, 1989 cited in Whington & Moran 1990), a published prevention curriculum for use with kindergarten through sixth-grade children. Time out was viewed as an efficient means of providing space and time for the young child to mull over wrongdoings, refresh feelings of guilt, and ponder socially desirable responses in similar circumstances. The curriculum offers keys to attitude and behavior changes as these relate to self-esteem and self control. Children lean nonviolence and a foundation for basic coping skills and positive mental health. They integrate time-out, self-talk, empathy, gender-neutral attitudes, feelings awareness, assertiveness, conflict resolution, health, parent appreciation, and other concepts as personal tools for daily survival. Lesson topics must be adapted to the developmental levels of children. The use of time out appears to be widespread however, preschool teachers
27
often use time-out frequently throughout the day, but for very short durations, often on or two minutes (Zabel, 1986).
Incidentally, Betz (1994) believes that there are right and wrong ways to enforce time-outs. Some ways to make time-out for young children more effective according to Betz is to first approach the child physically rather than broadcasting displeasure in behavior from across the room. Second, a teacher should get down on a knee so that eye levels of student and teacher are level and tell the child exactly what the offense is quietly and calmly. Third, the teacher should escort the child to the time-out area and keep the time-out duration short; the suggested limit is about one minute per year of age. Finally, the teacher should not forget about the child in time-out, otherwise the effectiveness of the time-out could be jeopardized.
Gartrell (2001) believes that time-out, when used as discipline, is one of a group of techniques that still rely on blame and shame to bring a child’s behavior back into line. Referring especially to toddlers, Gartrell offers five reasons why time-out is an undesirable practice: (1) the imposed external control of the time-out inhibits a child’s ability to build internal controls and may cause a child last feelings of being ineffectual, (2) the child placed on a time-out chair does not have personal needs met, including the need to develop alternative strategies, (3) the time-out diminishes the child’s developing self-worth and self-confidence, and may cause others to view the child as a trouble maker, (4) the young child has difficulty understanding the relation of actions to consequences and may feel bewildered by the time-out experience, and (5) opportunities for learning valuable lessons in social relationships are lost during the period of isolation; and humiliation from the time-out may diminish the value of adult follow-up.
Bezt (1994) emphasizes that time-out fails to teach desirable behavior and should be reserved for use only when a child is wildly out of control or is a threat to other children. There is speculation that time-out may be hurtful in a number of ways. Readdick and Chapman (2000) point out that if the child perceives it as a punishment, time-out can have serious side effects that are commonly associated with punishment, including increases of other maladaptive behaviors and withdrawal from or avoidance of the adults administering time-out. In addition, given their social inexperience, young children ten to internalize negative labels, see themselves as they are labeled, and react accordingly (Readdick & Chapman, 2000).
Furthermore, Harris (1985) points out that when procedural time-out is experienced as an aversive consequence by the subject and results in reduction or suppression of the target behavior, then time-out is properly classified as a punisher. In fact, time-out is typically defined or classified as a punishment procedure based on the assumption that it will be experienced as aversive by the subject and reduce the frequency of a behavior. Harris describes how time-out may function as a negative reinforcer or escape procedure even when a validated reinforcement procedure exists in the time-in environment.
Hannon (2000), a kindergarten teacher who decided against using time-out after years of incorporating this technique in her classroom states that, not relying on time out has been both frightening and a relief…belatedly, I have realized and deeply regret how much time was wasted in time-out by children misled by my lack of clarity. I see now how important it is that I discuss and model my expectations for appropriate behavior with children. Many of the children benefit from well-timed and clear discussions or demonstrations concerning developmentally appropriate behavior. When we have a bad day, the fault is often due to inappropriate expectations or insufficient preparation on my part (p. 113).
The use of time-out procedures is a topic of major importance to teachers of behaviorally disordered students. A survey of special education teachers (Zabel, 1986) identified variables associated with use of time-out. Among those variables were restrictiveness of placement and age of child. Teachers or self-contained special educational classrooms reported using time-
28

out more frequently than did teachers of resource rooms. Teachers of younger children reported using the technique more frequently than did teachers of older children and youth. Respondents to Zabel’s survey reported that they used the time-out procedure about five times per week and that, on average, each child remained in time-out for 12 min. Verbal and physical aggression were the two behaviors most frequently reported to result in time-out. About half of respondents reported that they kept a log of their use of time-out, and less than a quarter of the sample reported that their school districts had written guidelines for the use of time-out procedures.
Zabel (1986) discusses the use of time-out intervention as appearing to lessen as students get older, perhaps because teachers have more sophisticated, language-based interventions for use with older students. Also, as students get older, the question of physical persuasion for those who might refuse to go to time-out must be considered in light of both possibility and appropriateness.
However, a study by Costenbader and Reading-Brown (1995) which investigated the use of isolation time-out in a special education facility administered by a consortium of 26 rural school districts in upstate New York found that older students comprised the majority of students in time-out. All students were classified as emotionally disturbed (ED) by their home school districts, and all students received 100% of their education in special classes. Students were placed in this facility by their home school districts only after less restrictive intervention strategies for controlling behaviors had been tried and failed. This facility represented the most restrictive school-based placement in the six-county area. Students in this special education facility were divided into a Lower School, consisting of grades K-6, and an Upper School, consisting of grades 7-12.
Information used in the study was taken from computer data routinely gathered to monitor the use of isolation time-out rooms in the special education facility over one academic year. Three infractions-talking, failure to follow directions, and students electing to take a voluntary time-out period accounted for 70% of all incidents. Only 1% of all time-outs were reportedly caused by aggressive physical conduct.
In 1986, Zabel found that younger students experienced the time-out procedure more frequently than did older students. In contrast, Costenbader and Reading-Brown (1995) found that older students in the more restrictive placement are spending more time in time-out for more separate behavioral incidents than are younger students. The differential use of voluntary timeout best accounts for this. Although 22% of the timeouts experienced by older students were voluntary, less than 1% of those taken by younger students were self-determined. Undoubtedly, a number of these behavioral incidents would have escalated from voluntary to teacher-assigned timeout had the student not chosen to separate himself or herself from the classroom.
Legal Implications of Time OutThe use of behavior reduction procedures, such as timeout, with students with BD has been an area that has spawned a great deal of debate. Although the Individuals with Disabilities Education Act (IDEA), Section 504 of the Rehabilitation Act of 1973, and regulations implementing these laws are quite detailed, there are no specific guidelines as to the use of the behavior reduction procedures (Yell, 1994). Yell points out that the resulting lack of guidelines has led to uncertainty among special education administrators and teachers as to the legally sound use of these procedures.
Frequently, when federal laws and regulations do not exist, it falls upon the courts to become arbiters, acting to balance competing interests through an interpretation of existing laws. The courts, in interpreting existing laws, fashion a body of law known as case law. The lack of federal guidelines has resulted in a fair amount of case law regarding behavior reduction
29

procedures. The procedures that have most frequently been the subject of litigation are the suspension and expulsion of children with disabilities.
Timeout has also been the subject of litigation. A small body of case law has been developing regarding the use of timeout procedures with students with behavioral disorders. Yell (1994) analyzed a number of cases on the use of behavior reduction procedures with students in special education and concluded that timeout is a controlled intervention. That is, timeout is legally permissible is used correctly. However, misuse of controlled interventions could result in rulings against school districts. This is particularly true in cases involving the use of seclusion/isolation timeout. In such cases school districts may be liable for large attorney’s fees awards. Thus it is extremely important that teachers be aware of legal considerations in the use of timeout. Four federal court cases have dealt with the use of timeout with students with BD. These cases involved teachers using timeout procedures with special education students. In their decisions, the court’s discussed guidelines and procedures that should be followed in using timeout. Three of these cases-Cole v. Greenfield-Central Community Schools (1986), Dickens v. Johnson County Board of Education (1987), and Hayes v. Unified School District No. 377 (1989) directly addressed the use of timeout procedures (Yell, 1994). The fourth case, Honig v. Doe (1988), concerned the use of suspension and expulsion but briefly mentioned timeout when offering guidelines to school districts using behavior reduction procedures with students in special education. All of these court cases have involved law suits brought by parents against teachers, principals, and school districts that used exclusion and seclusion/isolation timeout or similar procedures to reduce the undesirable behaviors of students with BD.
Most abuses occur, experts say, when educators don’t understand the purpose of timeout, or overuse it (Lang, 1997). Intended only as a temporary measure, timeout quickly becomes ineffective and even dangerous when children are placed in small, enclosed places for long periods of time. In Georgia, the Thomaston case is one of several reported uses of cardboard boxes for school discipline, said Denise Freeman, a spokesman for Citizens United for Rural Empowerment, an educational clearinghouse based in Tignall, Ga. (Lang, 1997). Students have also been placed in broom closets, locked rooms, or plywood boxes designed specifically for timeout.
Research ImplicationsAlthough time-out is frequently used by teachers, researchers and practitioners, it has become a controversial procedure because of misunderstanding, ineffective use, and ethical considerations. Regardless of the type of time-out used, it is the discrepancy between the time-in and time-out environments that provides the conceptual basis for time-out. When time-out is determined to be the intervention of choice, the least restrictive and aversive procedure likely to be effective should be designed on an individualized basis.
Constructing such procedures, however, depends a great deal on professional judgment due to the scarcity of parametric studies. Research comparing time-out and alternative interventions is also scarce, although effective alternatives to time-out have been documented (Harris, 1985; Gartrell, 2001; Betz, 1994; Hannon, 2002; Lang, 1997 Pica & Howard, 1993). Parametric and comparative research is requisite to the development of a comprehensive knowledge base concerning time-out interventions (Harris, 1985). Careful documentation of time-out procedures as well as both positive and negative results is also essential. Since time-out continues to be widely used, these issues must be addressed by researchers and practitioners.
ReferencesAlberto, P., Heflin, L.J., & Andrews, D. (2002). Use of the timeout ribbon procedure during community-based instruction. Behavior Modification, 26, 297-11.Betz, C. (1994). Beyond time-out: Tips from a teacher. Young children, 49, 10.
30

Costenbader, V.K., & Reading-Brown, M. (1995). Isolation timeout used with students with emotional disturbance. Exceptional Children, 61, 353-363.Gartrell, D. (2001). Replacing time-out: part one—Using guidance to build an encouraging classroom. Young Children, 56, 8-16.Hannon, J. (2002). No time for time out. Kappa Delta Pi Record, 38, 112-4.Harris, K. R. (1985). Definitional, parametric, and procedural considerations in timeout interventions and research. Exceptional Children, 51, 279-288.Johnson, R. (1999). Time-out: Can it control misbehavior? Journal of Physical Education, Recreation and Dance, 70, 32-46.Lang, L. (1997). Often effective, timeout target in abuse cases. Education Week, 16, 1.Lang, L. (1997). Too much timeout. Teacher Magazine, 8, 6-7.Lucas, R.L. (2000). The effects of time-out and DRA on the aggressive behavior of a spirited two-year-old. Child and Family Behavior Therapy, 22, 51-56.Mace, F. C., & Heller, M. (1990). A comparison of exclusion time-out and contingent observation for reducing severe disruptive behavior in a 7-year-old boy. Child & Family Behavior Therapy, 12, 57-68.Mace, F. C., Page, T. J., Ivancic, M.T., & O’Brien, S. (1986). Effectiveness of brief time-out with and without contingent delay: A comparative analysis. Journal of Applied Behavior Analysis, 19, 79-86.Marlow, A.G., Tingstrom, D.H., Olmi, D.J., & Edwards, R.P. (1997). The effects of classroom-based time-in/time-out on compliance rates in children with speech/language disabilities. Child and Family Behavior Therapy, 19, 1-13.Mayerson, A.B. (2003). Should we eliminate time-out rooms? Educate children, don’t imprison them. American Teacher, 87, 4.Mortimer, S., Adamsky, S., & McLaughlin, T. F. (1998). Use of isolated time out to reduce aggression and non-compliance with an elementary school student with severe behavior disorders: A long term analysis. International Journal of Special Education, 13(1), 34-45. Pica, L., Jr., & Margolis, H. (1993). What to do when behavior modification is not working. Preventing School Failure, 37, 29-33.Readdick, C. A., & Chapman, P. L. (2001). Young children’s perceptions of time out. Journal of Research in Childhood Education, 15, 81-87.Reitman, D., & Drabman, R. S. (1996). Read my fingertips: A procedure for enhancing the effectiveness of time-out with argumentative children. Child & Family Behavior Therapy, 18, 35-40.Reitman, D., & Drabman, R. S. (1999). Multifaceted uses of a simple timeout record in the treatment of a noncompliant 8-year-old boy. Education and Treatment of Children Special Issue: Level 1 research: Improving our education and treatment through simple accountability procedures, 22, 136-145.Riley, K. (2003). Should we eliminate time-out rooms? Used wisely, they can help students. American Teacher, 87, 4.Rortvedt, A. K., & Miltenberger, R. G. (1994). Analysis of a high-probability instructional sequence and time-out in the treatment of child noncompliance. Journal of Applied Behavior Analysis, 27, 327-30.Spradling, R. L. (1985). The effect of timeout from performance on attentiveness and attitude of university band students. Journal of Research in Music Education, 33, 123-137.Tingstrom, D.H. (1990). Acceptability of time-out: The influence of problem behavior severity, interventionist, and reported effectiveness. Journal of School Psychology, 28, 165-169.Turner, H. S., & Watson, T. S. (1999). Consultant’s guide for the use of time-out in the preschool and elementary classroom. Psychology in the Schools, 36, 135-148.Webster, R. E. (1976). A time-out procedure in a public school setting. Psychology in the Schools, 13, 72-76.White, A. G., & Bailey, J. S. (1990). Reducing disruptive behaviors of elementary physical education students with sit and watch. Journal of Applied Behavior Analysis, 23, 353-59.
31
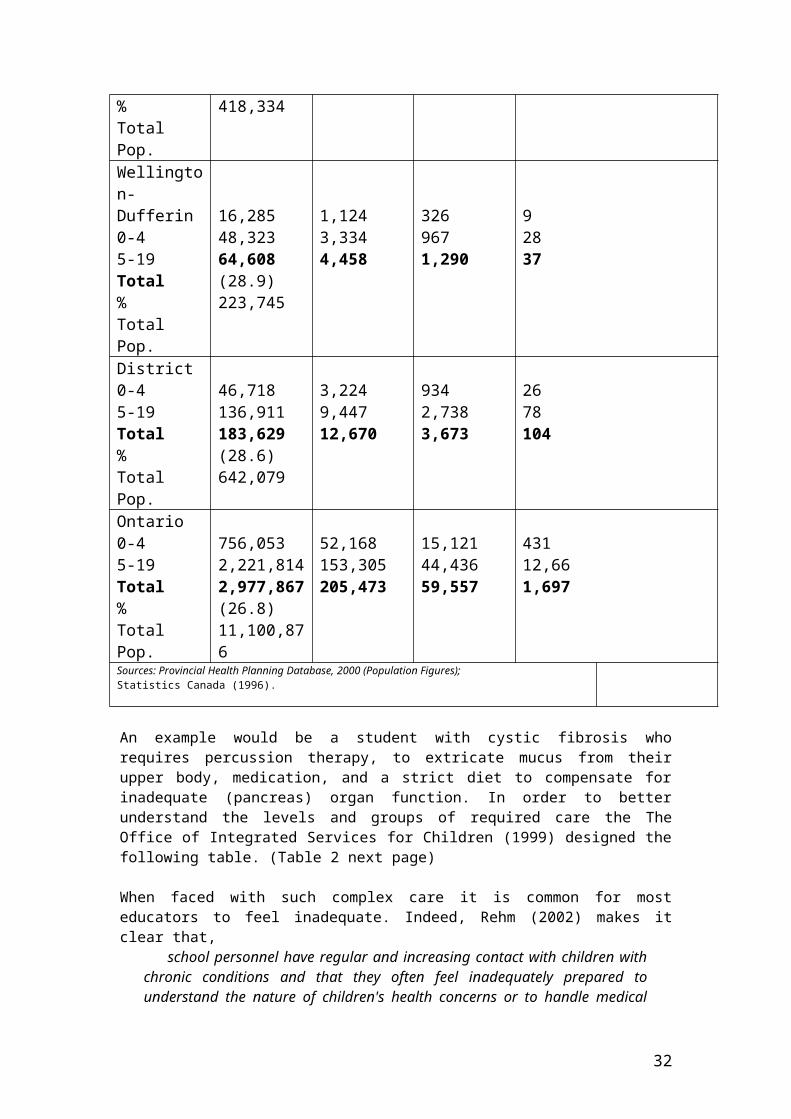
Whittington, R., & Moran, G. (1990). Teaching nonviolence through time out: A curriculum for elementary school classrooms. Social Work in Education, 12, 237-248.Wilson, C.C., Robertson, S.J., Herlong, L.H., & Haynes, S.N. (1979). Vicarious effects of time-out in the modification of aggression in the classroom. Behavior Modification, 3, 97-111.Yeager, C., & McLaughlin, T.F. (1995). Use of a time-out ribbon and precision requests to improve child compliance in the classroom: A case study. Child & Family Behavior Therapy, 17, 1-9.Yell, M.L. (1990). The use of corporal punishment, suspension, expulsion, and timeout with behaviorally disordered students in public schools: Legal considerations. Behavioral Disorders, 15, 100-109.Yell, M.L. (1994). Timeout and students with behavior disorders: A legal analysis. Education and Treatment of Children, 17, 293-301.Zabel, M.K. (1986). Timeout use with behaviorally disordered students. Behavioral Disorders, 12, 15-21.
32

ALCHEMY AND ABERRANT BEHAVIOUR:A JUNGIAN APPROACH TO WORKING WITH BOYS WITH
BEHAVIOUR DISORDERS
Robert O’DeaNew South Wales Department Of Education And Training
Alchemy is an ancient philosophy on which the two modern day sciences of chemistry and analytical psychology are grounded.In education in New South Wales (NSW) at the present time, the behaviour of boys is of increasing concern to schools, to teachers, to parents and to society at large as evidenced by the over-representation of boys in school suspension figures, detention and intensive learning classes, remedial reading and behaviour units, special programs and special schools.This paper outlines an action research study of the aberrant behaviour of seven boys from Sydney schools who were all clinically diagnosed as emotionally, conduct or behaviourally disordered. Jung’s alchemic process was employed to assist each boy to understand his inner conflict and how it contributed to his behaviour. This approach was able to successfully bring about positive change in the unacceptable, challenging, aberrant behaviour of each of the boys. One boy’s process is outlined in more detail.
Terms used in this paper:Aberrant – disturbed behavior that represents a deviation from expected social behaviour.IST(B) – Itinerant Support Teacher for Behaviour.Behaviour Disorders – a generic term for students who display emotional, behavioural and /or conduct difficulties and disorders.
Over many years of involvement in special education, this author has observed that the behaviour of boys in schools and in society has deteriorated to a point where boys may be considered to be in crisis. It is for this reason that the term aberrant has been used in this paper to describe the behaviour of the boys, because it appears deviant, out of balance and indicative of a more serious social phenomenon. Furthermore, the inability or unwillingness of schools to develop and implement effective strategies to adequately cope with this increasingly aberrant behaviour of boys seems to have left education in crisis. Many different strategies and approaches to the education of boys have been tried and suggested and have met with varying degrees of success. Yet, still, many boys continue to struggle academically and socially and the great majority of students identified and classified as having behaviour disorders in schools in NSW continue to be over-whelmingly boys. Boys and young men also constitute a high proportion of students in detention classes and detention centres, in remedial classes and programs, and in units for disturbed behaviour. In light of this, the effectiveness, implementation and suitability of any strategies and approaches that have been employed so far have to be questioned. Observations of boys in dropout centers or any Timezone, casualty wards or in many schools, particularly many secondary schools, across NSW will tell the same story.
In fact, the behaviour of students in schools has become of such concern in NSW that eleven special schools for disruptive and unruly students and bullies (Vass, 2001, p1) have been established. It will be no surprise that many of the students in these schools are, and will be, boys. Boys are struggling, as shown in an overview of the statistics.
33

NSW STATISTICS Boys are nine times more likely to be in detention classes or expelled from schools.
Risk-taking behaviour is more common in males and condoned by peer and societal pressure from other males and from many females.
Males commit suicide at a significantly higher rate than females and the Australian male youth suicide rate is reportedly the second highest in the world.
The caseloads of IST(B) teams in the Metropolitan East Region of Sydney are comprised mostly, and in some areas completely, of boys.
Most of the students with learning difficulties are boys and some research estimates that up to twenty percent of male children has some form of attention deficit disorder often displayed as a behaviour disorder or learning difficulty.
Autism Spectrum Disorder, with all its associated problems affects boys four times more commonly than girls.
Boys are now displaying the symptoms of compulsive disorders such as anorexia nervosa, anxiety, neurosis and mental illness in much greater numbers than previously.
Boys are over-represented in remedial reading and intensive learning classes, and in units for behaviour disorders.
This need for schools to be more proactive and introspective about students’ aberrant behaviour led to an interest in a more holistic approach to education as provided by the psychology of Jung and the process of alchemy.
An Overview Of AlchemyIt is not within the scope of this paper to discuss at length the very complicated process of alchemy and interested readers may refer to this author’s PhD thesis or to the excellent coverage of alchemy by Jung (1951), von Franz (1980), Grossinger (1983), Heinrich (1995) and Ramsey (1997). This paper will focus on the Jung’s work in the area of alchemy.
Jung’s interest in Eastern philosophy, medicine and alchemy was instrumental in pioneering, certainly in the Western academic world, the belief that the alchemists were ... only ostensibly and secondarily involved in a chemico-physical process (Grossinger, 1983, p.278). Primarily, the chemical changes in the inanimate substances involved in the alchemic process, were a means, a vehicle, for the unconscious, introspective human transformation of the alchemists through their own involvement. Alchemy, in Jung’s view, had less to do with the chemical experiments and more to do with the exploration of the psyche, which was expressed in pseudo-chemical language. In other words the rituals, symbols, secrecy and complicated processes of The Great Work concealed a psychological course in introspection and self-change and it is this on which Jung based what he called analytical psychology.
Jungian alchemy is based on the three stages of Ancient alchemy: The Lesser Work, The Middle Work (a term coined by this author) and The Great Work, as shown in Figure 1.
In Jung’s view involvement in this process of alchemy has the potential to bring about effective, expansive and important change by assisting to make the foundations of the psyche more secure. Involvement in the process shown in Figure 1 facilitates and allows extremely difficult, harmful, hurtful or confronting experiences to be perceived as positive experiences, as a different perception is allowed to flood into consciousness.
34
Figure 1An Overview of Jungian Alchemy
The Lesser Work: NigredoSymbol: Lead
The Ego StateProjection and transference of the contents of the shadow.Beliefs: It is somebody else’s fault. Life isn’t fair.Question: Whose fault is this? Why is it happening to me?
The Middle Work: AlbedoSymbol: SilverThe Beginning of the Process of IntrospectionIntrospection and withdrawal of projection and of transference.Beliefs: I can’t understand it. I can’t help it. Questions: What does it mean? Why is it happening?
The Great Work: RubedoSymbol: GoldA State of Higher Consciousness in all Things Self-awareness and the desire to make the world a better place.Beliefs: I can help others. I can make a difference.Questions: What can I learn from this? What is the bigger picture?
Jung identified seven major concepts that facilitate higher consciousness and these are shown and definitions given in Figure 2.
Figure 2The Processes of Jungian Alchemy
Concept Jungian AlchemyParticipation mystique
The reflection of what is happening within, in the unconscious, reflecting without, in the conscious world.
The shadow The darker side of the psyche, where unresolved issues and repressed feelings lie.
Projection The unconscious and involuntary attribution of the contents of one’s shadow onto others.
Transference All the exceedingly complex processes that bind people together in any situation.
Cryptomnesia The unconscious recollection of a thought that one feels is one’s own.
Synchronicity Meaningful coincidence.The recognized triad of space, time, causality.
Individuation The feeling of standing on solid ground within oneself.Self-understanding.
This author took the process and concepts of alchemy as described above and employed them with a target group of boys as described in the research study.
The StudyThe research question that was investigated in the study was to what extent could Jung’s alchemic process and concepts lead boys through the alchemic process and change their aberrant behaviour? Out of a sample of twenty boys with identified and clinically diagnosed behaviour disorders, a group of seven boys was selected to be involved in the program, along with their teachers and parents. Parental and teacher permission for the involvement of the boys in the research was a prerequisite to inclusion in the study. Figure 3 shows an overview of the procedures and the research methodology used in the study.
35

Figure 3Overview of Procedures and Methodology
The Research Paradigm = Qualitative Research through throughEthnographic Studies = The Aberrant Behaviiour of Boys through throughThe Methodology = Action Research through throughMethodological Triangulation = Different Methods/Same Study through throughThe Data Collection Methods = 1 Participant Observations kept in a
dated Research Journal 2 Narrative and Written Records
3 IST(B) Referrals 4 IST(B) Evaluations 5 In-Depth, Taped Interviews
through throughThe Data Reporting Method = Discourse Analysis
For the purposes of this paper, one boy’s program will be overviewed and described, a boy who was referred to in the research study by the alias of Jimmie.
Jimmie’s ProgramJimmie was a seven-year-old boy in Year 1 at an inner city school. He was referred to the IST(B) service because he was a student of above average intelligence who was underachieving at school, he displayed some bizarre and sometimes dangerous and violent behaviours, he exhibited a morbid obsession with death and dead things, and it was thought that he might have suicidal tendencies as he frequently talked about his own death and threatened to kill himself. He was being seen by a child psychologist and had a history of violence and aggression towards others – both adults and peers.
a) The InterventionUsing the baseline data provided by the school and IST(B) observational baseline data, Jimmie’s program became one that addressed his needs, as he perceived them to be. In other words, the intervention honoured his perception of the problem and established a suitable intervention. Also, through the free interaction of the alchemic processes described above, Jimmie’s program was allowed to unfold and reveal itself on a needs’ basis. Figure 4 below, gives an overview of Jimmie’s alchemic journey.
Figure 4An Overview of Educational Alchemy for Jimmie
Nigredo Suicidal tendencies. Morbid obsessions. Violent. Unpredictable. Ego state Bizarre Behaviours. Inappropriate social skills.
Projection of the The recurring nightmare.shadow Academic failure
Albedo Connectedness to IST(B). Participation mystique. Withdrawal of Involvement in dream therapy. Curriculum modification.projection Connection with parents, psychologist. Team approach.
Setting –up of whole class behaviour management system.
Rubedo Confrontation with dream monster. Unmasking of persona.Moving towards Acceptance by teachers and peers. Making and having friends.
individuation Synchronistic events.Beginning of academic and social success.
36

b) Behavioural ChangeIn the research study, baseline data was compared to post-intervention data to evaluate and measure if the use of alchemy could facilitate observable behavioural change in the case studies. The results were positive as shown in Figure 5.
Figure 5An Overview of Jimmie’s Behavioural Change
Baseline Data Dangerous, suicidal tendencies and actions. Running into moving traffic. Hiding under vehicles. Running away from adults.
Ego state Bizarre Behaviours. Morbid obsessions with dead things.Projection of the Hitting, biting, scratching, fighting with peers. Stealing.shadow Inability to access the curriculum. Poor writing, motor skills.
Intervention Strong connection with IST(B). Painting, drawing a dream book. Withdrawal of Establishing friendships with peers. Following rules of games.projection IST(B) meetings with parents, grandparents and psychologist.
Establishing school/ home approach to behaviour management.Changing class teacher’s attitude towards Jimmie and his family.
Post Intervention Acceptance by family that Jimmie was being physically abused. Moving towards Acceptance by teachers and peers. Making and having friends. individuation Jimmie displaying a happy, smiling, friendly demeanour.
Working to ability at school. Increase in reading age.
Results and ConclusionThe success of such an approach was clearly demonstrated in Jimmie’s case, as in all the interventions in the research. Jung (1951) and von Franz (1975; 1980) would argue that in each intervention, each team of people constituted an alchemic mixture, and it was this mixture that brought about the corresponding positive change in behaviour. Furthermore, once this was achieved, the referred boys were able, some of them for the first time, to experience social and academic success: to find the inner gold.
One answer to the conundrum of boys’ aberrant behaviour and their inability to change it may lie in one of the most interesting findings of this study. With all of the seven boys involved in the research, it became clear that when these boys were caught in the nigredo state, they were virtually unable to be helped. For Jimmie, while he was caught in the recurring nightmare of the nigredo (physical abuse that nobody believed was happening), it was painfully obvious that he was beyond reach. Jung calls the nigredo the ego-bound state and describes it as an egocentric state where one’s self and one’s problems are regarded as the centre of all things. When boys are operating out of this state, changing behaviour is extremely difficult because everything in the conscious world is seen through, or viewed from behind, each boy’s dominant unconscious and problematic issue, which is suppressed and often repressed in the unconscious of each boy. This author coined the term egocentric issues to describe these because they seem to dominate the nigredo, the ego state. In fact, it may be that boys are simply not able to move into the albedo and rubedo states unless their egocentric issues are resolved. Thus, teaching boys strategies to move out of the nigredo may be a most useful strategy to employ and doing so may actually allow boys to then access the many different strategies and approaches to behaviour change and special education available to them.
A new approach to working with boys with aberrant behaviour and behaviour disorders is urgently required in schools around the world. This paper has outlined one such approach: the use of Jung’s process of alchemy. If schools are to meet the future needs of boys and find ways to assist them to change their aberrant behaviour and achieve in the education system
37

and in society, this model of educational alchemy that brings boys out from behind their egocentric issues, through understanding of their own behaviour to positive behaviour change and ultimately greater academic and social success, is one way of achieving this aim. Basically, educational alchemy is, as one student in the study group liked to call it Going for gold.
Nourishing and caring for the psyche of boys through such programs as educational alchemy, may ensure that boys have the means to find endless solutions to their own problems, to the problems of aberrant male behaviour and to that of masculinity itself. Teachers have a huge role to play in this process and through a change in individual consciousness, could make enormous changes in education and in society. As catalysts for change teachers could, in fact, greatly assist boys, schools, the education process, parents and carers and society as a whole. Coming from the heart and empowering students both educationally and emotionally to lead fulfilled lives is the challenge for education in the 21st Century, in the Aquarian Age, and future generations will judge to what extent this challenge was accepted.
Further research with the use of alchemy may provide another avenue of assisting schools and society to cater for the increasingly problematic behaviour of some boys and young men. The possibility of this approach being used with girls, young women and adults who display aberrant behaviour may indicate a wider application of Jung’s alchemic theory.
ReferencesGrossinger, R. (Ed.), (1983). The alchemical tradition in the late Twentieth century. Berkeley, California: North Atlantic Books.Heinrich, C. (1995). Strange fruit: Alchemy and religion. The hidden truth. London: Butler & Tanner, Ltd.Jacobi, J. (1968). The psychology of C.G. Jung: An introduction with illustrations (7 th ed.). London: The Chaucer Press.Jung, C.G. (1951). The collected works. London: Routledge & Kegan Paul.O’Dea, R. K. (2001). Alchemy and the Aberrant Behaviour of Boys. PhD Thesis. The University of Sydney. NSW. Australia.O’Dea, R. K. (1997). A primary behaviour management system. The Primary Update, 1 (2), 6-7. Ramsey, J. (1997). Alchemy: The art of transformation. Glasgow: Harper Collins Publishers.Rabelais, F. (1991). The complete works of Francois Rabelais. Berkeley: University of California Press. von Franz, M.L. (1975). C.G. Jung: His myth in our time. New York: G.P. Putnam’s Sons.von Franz, M.L. (1980). Alchemy: An introduction to the symbolism and the psychology. Toronto: Inner City Books.Vass, N. (2001, June). Last chance: Bullies and truants get their own schools. The Sunday Telegraph. pp.1-2.
38

AN EMPIRICAL STUDY ON TEACHERS’ PERCEPTIONS TOWARDSINCLUSIVE EDUCATION IN MALAYSIA
Manisah Mohd Ali
Ramlee Mustapha
and
Zalizan Mohd Jelas
Universiti Kebangsaan Malaysia
The hallmark of inclusive education is the teachers’ willingness to accept students with special needs. Their attitudes and knowledge about inclusive education are important as these are indicators of such willingness. The purpose of this study was to examine teachers’ attitudes and their perceived knowledge towards inclusive education in Malaysia. The respondents (n=235) were the mainstream and special education teachers in the public primary and secondary schools. They were given a set of questionnaire which sought their responses regarding their attitudes and knowledge towards inclusive education. The data were analysed using descriptive statistics such as frequency and percentages. The main finding shows that, in general, teachers have positive attitudes towards inclusive education. They agreed that inclusive education enhances social interaction and inclusion among the students and thus, it minimizes negative stereotypes on special needs students. The findings also show that collaboration between the mainstream and the special education teachers is important and that there should be a clear guideline on the implementation of inclusive education. The findings of the study have significant implications to the school administrators, teachers, and other stakeholders who directly and indirectly involved in implementing inclusive education.
Inclusive education is a concept that allows students with special needs to be placed and received instruction in the mainstream classes and being taught by mainstream teachers. According to the Malaysian Ministry of Education, students with special needs are those who are visually handicapped, or partially or fully deaf or suffer from the disability to learn (Akta Pendidikan 1996). These are the students that have been identified as suffering from physical-sensory deficiencies and learning disabilities. The Ministry of Education provides special education programmes for the three types of disabilities, namely, hearing, visual and learning disabilities.
The learning disabilities programme provides educational service to a heterogeneous group of students with mild retardation, students with autistic tendencies and students with multiple disabilities. Such students have been placed in special classes or in special schools. Placement into special needs programmes is decided based on the special needs categorizations, namely visual, hearing and/or learning disabilities. For students with visual or hearing impairments, they are either placed in special schools or in the integration programme in the mainstream schools. Students with learning disabilities are regularly
39

placed in the integration programme in the mainstream schools. Table 1 shows the types of programme and numbers of students with special needs in Malaysia.
Table 1Types of programme and the number of students with special needs in Malaysia
No of schools (No of students) Total Types of programme Primary Secondary
1. Visual impairmentsa. Special schools 6(234) 1(104) 7(338)b. Integration programme 11(124) 15(201) 26(325)
2. Hearing impairmentsa. Special schools 23(1,713) 2(523) 25(2,236)b. Integration programme 41(448) 39(965) 80(1,413)
3. Learning disabilitiesa. Special schools - -b. Integration programme 402(7,437) 160(2,786) 562(10,223)______________________________________________________________________________
Total 483(9,956) 217(4,579) 700(14,535)
(Source: Jabatan Pendidikan Khas [Department of Special Education], 2002)
The initiatives to implement inclusive education in Malaysia by the Ministry of Education were conducted through seminars (Zalizan, 1995a; 1995b; 1997), workshops and field works (Kementerian Pendidikan Malaysia, 1995). The inclusive programme in Malaysia has been conducted in regular classes as a part of a service continuum for students with special needs. Trailed from the UNESCO’s declaration of Education for All, this programme aimed at encouraging interaction between students with special needs and the mainstream students. Students with special needs are placed in regular classes and are taught by a class teacher who is also assisted by a special education teacher. In the following section, this paper discusses briefly on inclusive education in Malaysia. This is followed by the discussion on an empirical study about the teachers’ perceptions and knowledge towards inclusive education.
Overview of inclusive education in MalaysiaInclusive education in Malaysia began through the Malaysians’ involvement at the international level in seminars and workshops hosted by the United Nations particularly under the UNESCO activities. The World’s Declaration on Education for All in Jomtien, Thailand in 1990 has been focusing on integration initiatives and equity issues for all including those with special needs. Further commitment on education for all was emphasised in the UNESCO’s Sub-regional Seminar on Policy, Planning and Organisation of Education for Children with Special Needs in Harbin, China in 1993. The outcomes of the seminars and workshops on special education and Education for All have made way for the change of emphasis from integration to inclusion. The concept of inclusion assumes that the mainstream classes can be restructured and adapted so that the needs of children with special needs can be met. This orientation towards inclusion was part of the important agenda in the seminar in Spain in 1994 which brought forward the Salamanca Statement on Principles, Policy and Practice in Special Needs Education (Zalizan, 1997). This seminar was represented by 92 countries including Malaysia, and 25 international organisations.
In Malaysia, inclusive education was first introduced in the mid-1990s as part of a reform initiative that was focused on students with special needs. However, the term inclusive
40

education is loosely defined and understood by the policymakers and practitioners. Akta Pendidikan 1996 (Education Act 1996) explains that the national context towards special education is based on the principle to integrate and to make inclusive special education students who have the right to be alienated as and when necessary (Akta Pendidikan 1996). Acknowledging the obstacles to full inclusion, the students are either partly or fully included based on their level of ability to follow instructions in the mainstream classes. In Malaysia, inclusion is carried out in schools at primary and secondary levels where there are also integration programmes for students with special needs.
Theoretical FrameworkThe inclusion of individuals with disabilities in mainstream educational, occupational and societal frameworks has become an accepted concept in western countries in the last two decades (Heiman, 2004). The inclusion policy specified attendance at mainstreamed schools and also dealt with different models of implementing the inclusion and with teachers' needs in terms of practical and theoretical training. Research has shown the many positive effects of placement in inclusive classes and the different benefits for students with disabilities.
According to Heiman (2004), there are four different models of inclusion: (a) in-and-out, (b) two-teachers, (c) full inclusion and (d) rejection of inclusion. In her study of inclusive education in United Kingdom and Israel, Heiman (2004) found that most of the teachers in United Kingdom and Israel thought that an in-and-out model would be more effective for the students with learning disabilities. These teachers believe that this approach would enable students with disabilities to benefit from two worlds: the special instruction they needed together with regular lessons and interactions with their peers in regular settings. The two-teacher model was somewhat popular in Israel and less so in Britain. According to this model, two teachers teach simultaneously in the classroom with one of them, who has had training in special education, concentrating on the students with disabilities. Small percentages of teachers in both countries thought that full inclusion is the right model to apply within the regular classroom. They thought that with additional support and cooperation between teachers and with the services of the educational system, full inclusion could succeed and be the most beneficial for all. Some teachers in both countries rejected inclusion completely. The teachers in this group thought that it would be better for students with disabilities to study in separate classes, according to special programs, so they could progress at their own pace. They felt that such model is more effective since special needs students in inclusive class would never be able to reach the academic level of the mainstream students. Similar models were observed in Malaysia. Form our observation, full inclusion is the least method used. Most teachers would apply hybrid models such as two-teachers and in-and-out approaches.
Review of LiteratureDuring the past two decades, the inclusion movements have made significant progress in (a) supporting the rights of children to have their special educational needs identified and met through education legislation and the right of individuals with disabilities to equal opportunities, (b) minimizing unjustified discrimination, and (c) developing support facilities and services for individuals with special needs (Disability Rights Task Force Final Report, 2004; Ministry of Education, 2004).
According to Heiman (2004), students can be included in mainstream classes based on a multidimensional diagnosis including psychological and educational tests. The students usually receive additional academic support from a special education teacher in their regular classrooms or in a resource room. To provide flexible inclusion in the least restrictive environment, the schools need to train more mainstream teachers to handle and cope with special needs students in their classes.
41

Despite the apparent benefits of inclusion, and regardless of the teachers' commitment and positive attitudes; and notwithstanding their having the knowledge and skills necessary to meet the educational needs of diverse students with disabilities, teachers were concerned about the academic, social, and behavioral adjustment of the students with disabilities in inclusive classes. Some teachers felt that inclusion would bring little benefit to students with disabilities and, consequently, they questioned the advantages of inclusion (Heiman, 2002; Priestley & Rabiee, 2002).
Other teachers stressed their concern that as more students are included, teachers would need additional tools and skills for coping with the social and emotional problems that accompany inclusive schooling (Idol, 1997). Vaughn, Schumm, Jallad, Slusher & Samuell (1996) mentioned several aspects which might cause teachers to raise objections to inclusion, such as the large number of students in the class, budget shortages, the teachers' work load, difficulties in standardized evaluation. Still, others pointed to the lack of teamwork, or asked for guidance in dealing with students with special needs (Danne & Beirne-Smith, 2000).
Some of the mainstream teachers claimed that they had chosen to teach a specific discipline and not special education, and the inclusion policy forced them to enter areas they were unsure about or not interested in it (Vaughn, et al., 1996). Mock and Kauffman (2002) described the catch in which teachers were trapped: on one hand, teachers cannot be prepared to answer the unique educational needs of every student with special needs, and, on the other hand, teachers in inclusive classes teaching students with special needs, might function beyond their training and their specialization.
Perception and knowledge of teachers towards inclusive education in MalaysiaIn order to determine the outcome of the implementation of inclusive education in Malaysia, a survey on the attitudes and knowledge of school teachers regarding inclusive education was conducted. This descriptive study involved regular and special education teachers in public primary and secondary schools. A sample (n=300) was randomly selected from a nation-wide directory of Malaysian teachers using a stratified sampling method. The population was stratified into 5 zones northern, western, central, eastern, and southern zones. The respondents were given self-rated questionnaire to identify their attitudes and knowledge towards inclusive education. Data were analysed using descriptive statistics in the form of percentages based on the three categories: Agree, Uncertain, and Disagree. A total number of 235 of the questionnaires were returned which constituted 78% return rate. The findings were synthesised according to the aspects of teachers’ perception and knowledge towards inclusive education, collaboration with special education teachers and other related matters concerning with the implementation of inclusive education.
Table 2 depicts the teachers’ perceptions regarding inclusion education in Malaysia. Overall, the majority of respondents agreed that inclusive education is appropriate for special needs students, at least in theory. For Item 1, only half of the respondents (50.6%) agreed that students with special needs are academically better in inclusive classrooms. Nevertheless, approximately two-thirds (66%) of the respondents were in favor of the notions that special needs students should be integrated into the mainstream classes/community and that the students would be benefited from inclusive classes (Items 2, 3, and 6). Items 4 and 5 show mixed feelings of the respondents regarding academic performance of special needs and mainstream students in an inclusive setting. In Item 4, about one-thirds (32.4%) of the respondents agreed that the placement of students with special needs in regular classes negatively affects the academic performance of normal students while the rest (25.5%) were uncertain and (42.1%) disagreed. A similar pattern was seen in Item 5 where 42.1% of the teachers disagreed that the academically-talented students would be isolated in the inclusive classrooms while 27.2% of the teachers agreed and 30.6% were uncertain. With regard to Item 7, approximately two-thirds (62.5%) of the respondents believe that students with special
42

needs have the right to receive an education in mainstream classes. Most importantly, more than half (57.1%) of the respondents believe that the negative stereotype of special needs students can be minimized in inclusive classroom. In particular, labeling of the students with special needs can be reduced (Item 8).
Table 2 Teachers’ perception towards inclusive education
ITEM AGREE (%)
UNCERTAIN (%)
DISAGREE (%)
1 Students with special needs are academically better in inclusive classrooms
50.6 32.3 17.0
2 Students with special needs must be integrated into the regular community
62.1 8.1 29.8
3 In order to achieve the highest level of inclusion, it is necessary for students with special needs to be placed in regular classes with back up support
67.7 12.3 20.0
4 The placement of students with special needs in regular classes negatively affects the academic performance of mainstream students
32.4 25.5 42.1
5 The academically-talented students will be isolated in the inclusive classrooms
27.2 30.6 42.1
6 Students with special needs will benefit from the inclusive program in regular classrooms
66.8 20.4 12.8
7 Students with special needs have the right to receive an education in mainstream classes
62.5 15.3 22.1
8 Students with special needs will not be labeled as ‘stupid’, ‘weird’ or ‘hopeless’ when placed in regular classrooms
57.1 22.6 20.4
Collaborative efforts between mainstream and special education teachers in inclusive classroomsTable 3 illustrates the perceptions of Malaysian teachers regarding the collaborative efforts between mainstream and special education teachers in an inclusive classroom. Data for Item 1 shows that the majority of respondents (80%) agreed that the collaboration between the special education teachers and regular teachers is vital in the implementation of the inclusive program (Item 1). However, almost half (49.8%) of them stated the implementation of inclusive education is ineffective (Item 2). In terms of who is taking charge of inclusive classroom (Item 3), 49.3% of the respondents agreed that the mainstream classroom teacher is the one who is in-charge while 34.4% of the respondents disagreed. In addition, most of the respondents (43.5%) agreed that the presence of a special education teacher in the regular classrooms could raise difficulties in determining who really is responsible for the special students (Item 4). Finally, majority of the teachers (63%) concurred that the role of special education teacher is to assist the students with disabilities (Item 5). The success of the inclusive program depends among others, on the attitudes of the classroom teachers towards the children with special needs (Anotonak & Larrivee, 1995 & Wilczenski, 1992 in Zalizan, 2000). This includes the teachers’ perception towards the learning abilities and the willingness of the teachers to change in order to fulfill the needs of different individuals. The collaboration between the mainstream and the special needs teachers is a critical factor in determining the successful implementation of inclusive program. Zalizan (2000) suggested that in order to ensure the success of an inclusive program, a collaboration or co-operation
43

form or mode between the particular teachers should be introduced within the programme as soon as possible.
Table 3 Collaboration between mainstream and special education teachers
ITEM AGREE (%)
UNCERTAIN (%)
DISAGREE (%)
1 Special needs teachers and regular teachers need to work together in order to teach students with special needs in inclusive classrooms
80.0 6.0 14.1
2 Although the inclusive education in a good concept, its implementation is ineffective due to objections from the mainstream classroom teachers
49.8 28.9 21.3
3. Mainstream classrooms teachers have a main responsibility towards the students with special needs placed in their classrooms
49.4 16.2 34.4
4. The presence of a special education teacher in the regular classrooms could raise difficulties in determining who really is responsible for the special students
43.5 23.0 33.7
5 The special education teacher only helps the students with special needs
63.0 11.5 25.6
Strategies to improve inclusive education There are several strategies that can be employed in order to enhance the effectiveness of an inclusive programme. Table 4 highlights some of the issues that need the attention of the parties involved in implementing this program. Over half of the respondents (56.6%) stated that the mainstream classroom teachers lack the exposure and the skills to deal with students with special needs (Item 1). This response contradicts Rogers (1987)’s opinion which stated that exposure to the population of students with special needs does not influence a teacher’s perception. Within the context of the study, it is felt that the exposure to inclusive education is important in order for the teachers to understand the form of the education programme as well as to understand their role in implementing inclusive education.
The majority of the respondents (78.3%) agreed that special needs students need extra attention and help in the classroom (Item 2) and that these students were seen as having more disciplinary problems when compared to the regular students (Item 3). The lack of guidance and cooperation from the special education teachers and the limited resources in the teaching and learning of students with special needs (Items 4 and 5) were the critical aspects that need to be improved. Thus, the findings show that when dealing with the students with special needs, teachers’ willingness to adapt and change is necessary to ensure that the teaching and learning process is carried out according to the abilities of those students (Zalizan, 2000; Madden & Slavin, 1983).
The way forward with the current implementationBased on the results of the study, in general, the efforts to implement the inclusive programme received a positive response from the teachers. In relation to this, the implications
44

and suggestions for the parties involved in the implementation of inclusive education are discussed, following Table 4.
Table 4 Strategies to improve inclusive education
ITEM AGREE (%)
UNCERTAIN (%)
DISAGREE (%)
1 Mainstream classroom teachers have the training and skills to teach special needs students
29.4 14 56.6
2 Special needs students need extra help and attention 78.3 14.5 7.2
3 Students with special needs committed more disciplinary problems compared to the regular students
50.7 13.2 36.2
4 Mainstream classroom teachers received little help from the special needs teachers
47.7 26.4 26.0
5 Although inclusive education is important, the resources for the students with special needs in a mainstream classroom are limited.
70.2 15.7 14.1
Schools’ administratorsThe active involvement and support of the schools’ administrators in the implementation of inclusive education programme is critical. Schools with the administrative support for inclusive education demonstrate a significant increase of awareness regarding the concept of inclusion. A recent study (Salisbury & McGregor, 2002) suggests that the school principals have an essential role in improving the school environment and in implementing educational policy. The researchers demonstrate the complex relationships between the school staff and the school climate, and emphasize the importance of the principal’s awareness of the role of the staff in implementing the inclusion successfully. When most of the teachers share in an open dynamic discussion group regarding their beliefs, difficulties, different aspects of teaching and ways of coping with dilemmas, this encourages them to find better coping solutions and support in their difficulties with the inclusion process. In addition, when the school principal shares the decision making process with the school staff, this contributes to more educational accountability and responsibility.
TeachersThis study found that the inclusive education programme could be successfully implemented if the level of the teachers’ competency is increased. Thus, the opportunities to attend courses that are related to the inclusive education program have to be created, especially for those who lack of exposure and training in special education. Adjustments towards the pedagogical aspects can be trained internally by experienced teachers to the new teachers. The effort towards a collaborative teaching between mainstream and special education teachers should be put in place. Indirectly, this effort could help to reinforce a cooperative spirit in implementing inclusive education. Literature has shown that the success of the inclusive education depends, to a large extent, on the willingness and the ability of teachers to make accommodations for individuals with special needs (Bender, Vail, & Scott, 1995). In addition, research also shows that teachers who are aware of the inclusion policy and therefore can define the pragmatic meaning of inclusion is more willing to be part of the inclusion team. However, numerous studies found that teachers agree that the inclusive education is important, but many find it difficult to apply.
Teacher Training Institutes
45

Specifically, the role of teacher training institutes is very important. Teacher training institutes should incorporate the concept of inclusion as part of the curriculum. For example, The Faculty of Education, Universiti Kebangsaan Malaysia offers education courses with honours (special education), which trains future special education teachers. Many important aspects in relation to special education and special needs are stressed throughout the duration of the courses. This includes the aspects of inclusive education. There are also courses which are open to students from other programmes as well which indirectly help to prepare the trainee teachers to gain knowledge in relation to students with special needs. As part of the teacher training programme, it is therefore recommended that education courses make room for critical discussion regarding issues and concepts of inclusion and teaching effectiveness. It is also recommended that the trainee teachers be given structured opportunities to experience inclusive education in practice. Exposure to observing teaching children with special needs in inclusive setting is one of the essential components in the process of breaking down barriers and building positive attitude (Garner, 1996).
ConclusionResults of the study discussed in this paper revealed that teachers may form perceptions based on a number of discrete factors, that is, how these teachers perceived inclusive education programme, their opinion on the team effort or collaboration between teachers and how they viewed the possible ways of improving the related aspects of inclusive education. The discussion in this paper also indicated that teachers have a positive perception towards the implementation of the inclusive education programme. However, there are some aspects that can be improved such as the collaboration between the mainstream and special education teachers and the preparation to train regular teachers in handling and teaching students with special needs. The need to provide adequate resources to inclusive classes is never been more critical. In addition, there should be an increasing effort in promoting inclusive education programme to the public as well as to the stakeholders.
ReferencesAkta Pendidikan 1996 (Akta 550) & Peraturan-Peraturan Terpilih. Susunan oleh Lembaga Penyelidikan Undang-Undang. Kuala Lumpur: International Law Books Services.Anotonak, R. F. & Larrivee, B. (1995). Psychometric Analysis and Revision of the Opinions Relative to Mainstreaming Scale. Exceptional Children. 62: 139-49.Bender, W. N., Vail, C. O., & Scott, K. (1995). Teacher attitudes toward increased mainstreaming: Implementing effective instruction for students with learning disabilities. Journal of Learning Disabilities, 28, 87–94.Danne, C. J., & Beirne-Smith M. (2000). Administrators’ and teachers’ perceptions of the collaborative efforts of inclusion in the elementary grades. Education, 121, 2.Disability Rights Task Force Final Report (2004). From Exclusion to Inclusion. Retrieved from: http://www.disability.gov.uk/drtf/full_report/index.html.Garner, P. (1996). A Special education? The experience of newly qualified teachers during initial teacher training. British Journal of Special Education, 23(4): 176-179.Heiman, T. (2002). Inclusive schooling: Middle school teachers’ perceptions. School Psychology International, 23 (1), 174-186.Heiman, T. (2004). Teachers coping with changes: Including students with disabilities in mainstream classes: An international view. International Journal of Special Education, 19(2).Idol, L. (1997). Key Questions related to building collaborative and inclusive schools. Journal of Learning Disabilities, 30, 384-394.Jabatan Pendidikan Khas (2002). Maklumat Pendidikan Khas. Kuala Lumpur: Jabatan Pendidikan Khas.Kementerian Pendidikan Malaysia (1995). Perancangan Strategik Pendidikan Khas 2020. Kuala Lumpur: Jabatan Pendidikan Khas.Madden, N. & Slavin, R. (1983). Mainstreaming student with mild handicaps. Academic and social outcomes. Review of Educational Research, 53: 519-570.
46

Ministry of Education (2004). Mainstreaming Students with Special Needs. Retrieved from: http://www.education.gov.il/special/english6.htm. Mock R. D., & Kauffman M. J. (2002). Preparing teachers for full inclusion: Is it possible? The Teacher Educator, 37, 3, 202-217.Priestley, M., & Rabiee, P. (2002). Hopes and fears: stakeholder views on the transfer of special school resources towards inclusion. International Journal of Inclusive Education, 6 (4), 371-390.Rogers, B.G. (1987). A comparative study of the attitudes of regular education personnel toward mainstreaming handicapped students and variables affecting these attitudes. Paper presented at the Fourth Pan American Conference on Rehabilitation and Special Education, Acapulco, Mexico. (ERIC Document Reproduction Service No. ED 182 465).Salisbury, C. L., & McGregor, G. (2002). The administrative climate and context of inclusive elementary schools. Exceptional Children, 68, 2, 265-274.Vaughn, S., Schumm, J. S., Jallad, B., Slusher, J., & Samuell, L. (1996). Teachers views of inclusion. Learning Disabilities Research & Practice, 11, 96-106.Zalizan Mohd Jelas (1995a). Strategi bagi pelaksanaan pendidikan inklusif. Paper presented at Seminar Pendidikan Inklusif. Kuala Lumpur: Jabatan Pendidikan Wilayah.Zalizan Mohd Jelas (1995b). Perkembangan kini dan peningkatan pelaksanaan pendidikan khas. Paper presented at Seminar Kebangsaan Pendidikan Khas. Kuala Terengganu: Kementerian Pendidikan MalaysiaZalizan Mohd Jelas (1997). Ke-arah pendidikan inklusif di Malaysia melalui kerjasama antarabangsa. Paper presented at Seminar Kebangsaan Pendidikan Guru. Serdang: Universiti Pertanian Malaysia.Zalizan Mohd Jelas (2000). Perception of inclusive practices: The Malaysian perspectives. Educational Review, 52 (2): 187-196.Zalizan M. Jelas, Ramlee Mustapha & Manisah Mohd Ali (2002). Persepsi dan pengetahuan guru terhadap pendidikan murid dengan keperluan khas : Perkembangan profesional guru ke arah pendidikan inklusif. Laporan Laluan Pantas G2/2000. Bangi : Fakulti Pendidikan, UKM (tidak diterbitkan).
47

THE EFFECTS OF CONSTANT TIME DELAY AND STRATEGIC INSTRUCTION ON STUDENTS WITH LEARNING DISABILITIES’ MAINTENANCE AND
GENERALIZATION
Margaret M. FloresUniversity of Texas at San Antonio
David E. HouchinsGeorgia State UniversityMargaret E. Shippen
Auburn University
The purpose of this series of case studies was to compare the impact of Constant Time Delay and Strategic Instruction on the maintenance and generalization of learning. Four middle school students with learning disabilities were effectively taught two different groups of multiplication facts using Constant Time Delay and Strategic instruction. The researchers measured students’ levels of maintenance and generalization after receiving each type of instruction. Maintenance data were collected using 1-minute fluency probes. Generalization data were collected using timed (1-minute) and untimed probes. Strategic Instruction appeared to have a greater impact on the students’ maintenance and generalization of multiplication skills. The students’ performance and perceptions are discussed in terms of potential implications for the classroom.
According to the National Council of Teachers of Mathematics (2000), mathematics instruction should result in successful problem solving and logical thinking. However, in order to advance to higher levels and solve mathematical problems, it is critical that students be fluent with basic operations (Miller & Mercer, 1993a). Fluency in math computation allows students to allocate their attention to the purpose of the problem instead of computation (Case, 1992; Fleischner & Manheimer, 1997). According to Houchins, Shippen, and Flores (2006), mathematical fluency is the effortless and automatic ability to perform math operations (p. 331). Unfortunately, many students with learning disabilities are not fluent in basic mathematical operations, particularly in multiplication (Cawley, Parmar, Yan,, & Miller, 1996).
Two typical instructional methods have been used to teach multiplication fluency to students with learning disabilities. The instructional methods are Constant Time Delay (CTD), a behavioral strategy, (Cybriwsky, & Schuster, 1990; Koscinski, & Gast, 1993; Mattingly & Bott, 1990; Morton & Flynt, 1997) and Strategic Instructional Model (SIM), a cognitive strategy (Mercer, Jordan, & Miller, 1996). Both CTD and SIM have been effective in teaching multiplication facts to students with learning disabilities. Each method is briefly described below.
Constant Time DelayCTD provides teachers with a systematic, data-based method of using flashcards to teach multiplication facts. The method transfers stimulus control from a controlling prompt (e.g., teacher’s verbal prompt) to a natural cue (e.g., multiplication fact). Mattingly and Bott (1990) used CTD to teach multiplication facts to elementary students with learning disabilities, mild intellectual disabilities, and emotional behavioral disorders. As a result of the intervention, all of the students demonstrated a high rate of correct verbal responding (98.3%). The students maintained their performance up to four weeks after training and generalized their oral performance to pencil-paper tasks consisting of multiplication facts that were written vertically rather than horizontally as presented on time delay cards.
48

Cybriwsky and Schuster (1990) used CTD to teach fifteen multiplication facts to a ten-year-old student with learning and behavior disabilities. The student demonstrated mastery across teachers, settings, and materials with different orientations, appearance and color. CTD resulted in nearly errorless learning. Koscinski and Gast (1993) replicated Cybriwsky and Schuster’s (1990) findings with five elementary students with learning disabilities. The researchers measured generalization using vertical orientation rather than horizontal, reversing factors, and presenting paper-pencil tasks. The procedure was near errorless with a student-error rate of only 4%. The students transferred their multiplication skills to independent paper-pencil tasks, demonstrating generalization to typical classroom tasks.
Strategic Instruction ModelSIM differs from CTD in that there is an emphasis on the student’s cognitive processing. The purpose of the SIM is to build independent strategy use and self-regulation through explicit instruction (Lenz, Ellis & Scanlon, 1996). This model has been used to teach math problem solving and computation (Harris, Miller, & Mercer, 1995; Maccini & Ruhl, 2000; Mercer & Miller, 1992b; Miller & Mercer, 1993a; Miller & Mercer, 1993b;). Mercer and Miller (1992a) developed a SIM program based on this model for basic mathematical concepts. In addition to the principles of SIM, one of the main instructional methods used in this program is the concrete-representational-abstract (C-R-A) learning sequence. The C-R-A methodology fosters conceptual understanding of mathematical operations before memorization of facts. The concrete instructional phase involves the use of manipulatives to demonstrate the meaning of multiplication. During the second phase, the teacher and students illustrate the multiplication process by drawing lines to represent the numbers. The third instructional phase is the abstract phase that involves computing facts to automaticity.
Mercer and Miller (1992b) found that the combination of SIM and the C-R-A sequence resulted in accuracy and fluency over time for students with learning disabilities. The results from field studies indicated that students with learning disabilities were able to acquire computational skills across facts, solve word problems, and generalize skills across examiners, settings, and tasks. The students’ performance improved from an average of 5 correct facts per minute to 14 correct facts per minute after instruction. The students maintained the same level of accuracy ten days after instruction. Harris, Mercer, and Miller (1995) replicated previous findings with second grade students with learning disabilities in inclusive settings. The students’ rate and accuracy in computing multiplication facts increased from a range of 1-4 digits correct per minute during baseline to a range of 11-14 digits per minute. With regard to fluency, the increase for students with disabilities was similar to that of students without disabilities. These students acquired multiplication skills at a developmentally appropriate time.
Research has demonstrated that methods based on behavioral principles such as CTD, and those based on cognitive behavioral principles, such as SIM, are effective in teaching math facts. However, there is no literature regarding a comparison of the two methods. Therefore, the purpose of this series of case studies was to compare CTD and SIM. Specifically, maintenance and generalization of multiplication facts of students with learning disabilities were examined.
MethodResearch DesignThe purpose of this article is to present a series of case studies which examined the influence of two methods of multiplication fact instruction, CTD and SIM, with regard to maintenance and generalization. Maintenance was defined the number of correct digits per minute written when presented with previously taught multiplication facts. Maintenance was measured 1 week after instruction and 5 weeks after instruction. Generalization was defined as computation of unknown multiplication facts. Generalization was measured in two ways: (a) through a timed (1-minute) probe that included a set of unknown multiplication facts, and (b)
49

through an untimed probe that included a different set of unknown multiplication facts. This article focuses on application of CTD and SIM instruction and their effects on the performance of students with specific learning disabilities in the area of mathematics.
Setting and Participation RequirementsParticipants were students with specific learning disabilities attending sixth grade in a major southeastern city. The school was chosen based a recommendation by the district administration. Students were selected based on their area of disability eligibility, the presence of prerequisite math skills, and their knowledge of multiplication. Students whose area of eligibility was listening comprehension were not considered since this would interfere with probe administration and parts of instruction that were presented verbally. In order to participate in the study, students met the following criteria as indicated by Mercer and Miller (1992a) in the Strategic Math Series: (a) count to 81, (b) compute addition facts to 18, (c) add single column sums to 81 without regrouping, and (d) copy 40 digits in 1 minute. Students were also selected based on their lack of skill mastery with regard to multiplication facts. That is, students needed a pool of at least thirty unknown multiplication facts. The range of unknown multiplication facts was 30 to 50 multiplication facts. All of the students performed at least three grade levels below their grade placement in reading, math, and writing. The interventions took place during a thirty-minute period designated for remedial instruction. This period was school-wide, not a special education initiative. The primary researcher provided one-on-one instruction with each student for 15-20 minutes per session. The primary researcher was a white female certified in special education, with 7 years of experience. The instructor received professional development in both CTD and SIM through her teacher preparation program and professional development workshops. She implemented both instructional methods successfully with students with disabilities in her previous position as a middle school resource teacher.
Instructional ProceduresSIM was implemented according to Mercer and Miller’s (1992a) Strategic math series: Multiplication facts 0-8. CTD was conducted according to a modified version of procedures outlined by Wolery, Ault, and Doyle (1992). All procedures were identical to Wolery et al., with the exception that students were told to write their answer instead of simply providing a verbal response. Since SIM requires writing, this was an attempt to equalize time issues across both methods.
Instructional MaterialsPrior to instruction, students completed a multiplication test that included 100 multiplication facts, factors 0-9. The multiplication facts that were missed were grouped into four independent (no duplicated facts such as 6x8 and 8x6) and balanced groups of facts. To ensure that CTD did not influence SIM, groups used within each type of instruction consisted of facts that were less likely to influence the learning of other facts (for example, knowing 9x5 might lead to solving 9x6 by solving 45+9.). No strategies were taught within either method that might have encouraged such problem solving, but efforts were made to minimize the chance incidental learning. The four groups of facts were used for the two intervention phases (ten facts for each condition) and the two sets of generalization probes (five facts for each probe). Students’ writing fluency was also measured to ensure adequate motor skills to reach criterion of writing 40 digits per minute with no more than two errors. Given 1 minute, the students copied numbers written on a page.
The materials for CTD consisted of multiplication facts printed vertically in black ink on a 4-by-6 inch index card with print that was approximately 2 inches in height. The order of the flashcards was changed between each trial so that the order of presentation was not predictable. In addition to the flashcards, instructional materials included a multiplication sheet that corresponded to the flashcards. After verbally responding to the flashcards, the students wrote the answer on the multiplication sheet. This modification of CTD materials
50

was to prepare the students for the written probes. The materials for fluency instruction consisted of a sheet containing the target facts, written multiple times in a random order.
During SIM, the materials included a contract in which the teacher and student agreed to work rigorously using strategies to master multiplication facts. The materials for lessons 1-3 were paper plates, three- dimensional objects, and a worksheet with target multiplication facts written vertically and horizontally. The materials for representational phase involved drawings that were pre-printed on the lesson sheet and target multiplication facts written vertically and horizontally. After instruction at the representational level, the DRAW (Discover the sign, Read the problem, Answer, or draw tallies and/or circles and check your answer, Write the answer) was introduced where the materials consisted of a sheet printed with the strategy. The last phase of instruction involved fluency activities and the materials included facts written repeatedly and in a random order. The materials also included a chart used to record student progress after each activity. The probes for CTD and SIM consisted of multiplication facts written repeatedly in random order.
Inter-rater ReliabilityTreatment integrity was conducted during 25% of the lessons (Poling, Methot, & LeSage, 1995). Live observations were used to evaluate the instructor’s behaviors. A treatment checklist for each intervention was used in order to ensure that procedures were carried out correctly. A teacher was trained in using the treatment integrity checklists through demonstration and practice. When the teacher completed a checklist with 100% accuracy, treatment integrity checks began. Treatment integrity was calculated at 100% for the study.
Treatment FidelityInter-rater reliability was conducted for 25% of all of the multiplication probes administered. A teacher was trained through demonstration and practice in the scoring procedures and reliability checks began after the teacher had scored a probe with 100% accuracy. The primary researcher collected data on a daily basis and scored fluency probes. The trained teacher scored the same multiplication probes. To calculate inter-rater reliability, the total number of agreements between the teacher and the primary researcher were divided by the total number of observations and this answer was multiplied by one hundred (Poling et al., 1995). Inter-rater reliability was calculated for CTD responses, independent written work during SIM, fluency, and mastery probes. Inter-rater reliability was 100% for the study.
Case Study 1: SamSam’s backgroundSam was a 12 year-old African American male in the 6th grade who qualified for special education services with specific learning disabilities in the areas of mathematics computation, reading decoding, and written expression. Sam also qualified for services through other health impairments with a medical diagnosis of sickle cell anemia which interfered with his educational performance due to frequent illness and fatigue. Sam’s cognitive ability was within the average range (WISC-III, FS=89). Sam performed below grade level in the areas of math computation (2:0), reading decoding (K:1), and written expression (2:0). Sam was an outgoing middle school student who verbalized excitement about participating in instruction. Sam reported that remembering his math facts was a problem and this caused difficulties when completing math assignments.
CTD Instruction with SamSam learned the first group of 10 multiplication facts through CTD instruction. Sam expressed enthusiasm for learning multiplication facts. He reported being very pleased with himself when he answered correctly. When Sam was unsure of an answer, he waited for the instructor’s prompt. This resulted in repeated practice with correct responses. He reported that he like CTD because instruction was fast-paced. Sam was absent on 4 occasions during instruction and this was not unusual given his medical condition and as reported by his
51

resource teacher. Sam reached the criterion for proficiency (40 correct digits written on a one-minute multiplication probe over three consecutive trials). He reached criterion after 14 probes, ranging from 4 to 46 correct digits per minute. His mean performance for CTD instruction was 26.07 correct digits per minute.
SIM Instruction with SamFive weeks after CTD instruction, Sam learned the second group of multiplication facts through SIM instruction. Sam appeared to understand multiplication throughout each phase of instruction, moving to each successive phase without re-teaching. Sam quickly learned and used the DRAW strategy appropriately. Two facts were particularly difficult for Sam, 6x8 and 8x9. During the representational phase of instruction, when given the problem 6x8, Sam solved the problem by adding the product of 5x8 to the product of 1x8 to arrive at the answer 48. He used the same procedures to solve 8x9. Instruction did not include explanation of the distributive property. Despite his progress during SIM, Sam reported that he did not like this kind of instruction because it took too long. He reported that he would rather learn using CTD because it was faster. During SIM, Sam reached criterion after 19 probes ranging from 8-48 digits per minute. His mean performance for this condition was 29.63 correct digits per minute.
Sam’s Performance Table 1 presents a summary of Sam’s and other students’ performance. One week after instruction in CTD, a multiplication probe was administered to check maintenance of his skills. Sam wrote 22 correct digits per minute (dpm). Sam reported that he was disappointed that he did not remember more of his facts after taking the first maintenance probe. Another maintenance probe was administered five weeks after CTD instruction ended. Sam wrote 8 correct dpm. Sam remembered 2 of the 10 math facts and wrote correct digits for the same fact and half of the correct digits for another fact. The instructor administered Generalization probes including 5 unknown facts, one timed probe (1-minute) and a probe with no time limit. Sam wrote 0 correct dpm when given the timed probe and 0 dpm when given the probe with no time limit. Sam reported that he was finished with the untimed probe at 2 minutes. Sam reported that he did not know those facts because he had not learned them previously. Next, Sam learned the second group of 10 multiplication facts through SIM instruction. Sam reached the criterion for proficiency (40 correct digits written on a one-minute multiplication probe over three consecutive trials). One week after instruction in SIM, a multiplication probe was administered to check maintenance of his skills. Sam wrote 38 correct digits per minute (dpm). Sam reported that he was pleased with his performance. Another maintenance probe was administered five weeks after SIM instruction ended. Sam wrote 20 correct dpm. Sam wrote most of the digits automatically, without hesitation. He began using the strategy that he had learned during SIM instruction, but ran out of time for this strategy to be useful within the 1-minute time limit The instructor administered Generalization probes including 5 unknown facts, one timed probe (1-minute) and a probe with no time limit. Sam wrote 0 correct dpm when given the timed probe and 42 dpm when given the probe with no time limit. Sam reported that he was finished with the untimed probe at 5 minutes, 20 seconds. Sam used the strategy that he had learned in SIM instruction to complete the unknown fact problems.
Table 1 Performance Summary
CTD Maintenance1-week dpm
Maintenance 5-weekdpm
Generalization1-minutedpm
GeneralizationUntimedDigits/min:sec
Sam 22 8 0 0 / 2:00Kate 32 16 9 7 / 2:54
52

Jerry 16 18 4 44 / 2:30Cindy 36 6 0 0 / 1:15SIM Maintenance
1-week dpm
Maintenance 5-weekdpm
Generalization1-minutedpm
GeneralizationUntimedDigits / min:sec
Sam 38 20 0 42 / 5:20Kate 40 19 40 50 / 1:45Jerry 40 33 40 50 / 2:25Cindy 36 20 4 50 / 5:20
Comparison of Sam’s CTD and SIM Performance Sam learned 2 groups of multiplication facts (10 in each) and reached proficiency with both instructional methods. However, there was a difference in how those groups were maintained over time. Sam’s 1-week maintenance performance decreased with both methods, the decrease was significantly lower after CTD (52% lower) than after SIM (21% lower). Sam’s 5-week performance decreased again for both methods, but the decrease was lower after CTD (83% lower) than after SIM (58% lower). The difference between Sam’s performance on the generalization probes favored SIM instruction. Sam’s learning during the CTD condition did not generalize to the unknown facts. Sam did not write any digits correctly for either of the probes. However, Sam’s knowledge of the strategy appeared to be useful in generalizing skills to the unknown facts. Sam did not write any correct digits with the timed probe. However, when given unlimited time, Sam wrote 42 dpm. Sam demonstrated his use of the strategy learned in SIM instruction by drawing the problems and solving them correctly.
Case Study 2: KateKate’s backgroundKate was an 11 year-old African American female in the 6 th grade who qualified for special education services with specific learning disabilities in the areas of mathematics reasoning. Kate’s cognitive ability was below the average range (C-TONI comp=83). She performed below grade level in the areas of math computation (3:1), reading decoding (3:1), and written expression (2:1). Although Kate qualified for services in the area of mathematics reasoning, current assessment data were not available in that area. Kate appeared friendly and was cooperative throughout the study. She reported that math was her most difficult subject and remembering math facts was difficult. Kate was interested in learning new ways to learn and remember math facts and reported that she was happy to participate.
CTD Instruction with KateKate learned the first group of 10 multiplication facts through CTD instruction. She was present for every scheduled session. Kate’s mastery of facts increased steadily over sessions. She demonstrated patience, waiting for the instructor’s prompt when she was unsure of an answer. Kate appeared engaged and eager to participate throughout each of the sessions. Kate reached the criterion for proficiency (40 correct digits written on a one-minute multiplication probe over three consecutive trials). Kate reached criterion after 10 probes, ranging from 10 to 49 correct dpm. Her mean performance for this condition was 29.8 correct dpm.
SIM Instruction with KateFive weeks after CTD instruction, Kate learned the second group of multiplication facts through SIM instruction. Each instructional phased was completed without the need for re-reaching. Kate appeared to like SIM instruction as evidenced by reports that she thought it was easier to remember her facts. She liked using the DRAW strategy for facts that she could not quite remember. She also reported that she needed more time to remember some of the math facts and that she liked that there was no time limit during instruction as in CTD instruction. Similar to Sam, Kate discovered an alternate way to solve facts problems that she did not remember. Her grouping of facts also included 8x6 and 8x9. She had mastered 8x5 and 8x8 earlier in SIM instruction. Rather than using the DRAW strategy, she added the product of 5x8 to the product of 1x8 to arrive at the answer 48. She used the same procedures to solve
53
8x9. This was not a part of the strategic instruction program. During SIM instruction, Kate reached criterion after six probes, ranging from 26 to 46 dpm. Her mean performance for this condition was 36.83 correct dpm.
Kate’s PerformanceTable 1 (above) presents a summary of Kate’s and other students’ performance. One week after instruction in CTD, a multiplication probe was administered to check maintenance of her skills. Kate wrote 32 correct dpm. Kate appeared pleased with her performance. Another maintenance probe was administered five weeks after CTD instruction ended. Kate wrote 18 correct dpm. The instructor administered Generalization probes including 5 unknown facts, one timed probe (1-minute) and a probe with no time limit. Kate wrote 9 correct dpm when given the timed probe and 7 dpm when given the probe with no time limit. Kate reported that she was finished with the untimed probe at 2 minutes and 54 seconds. Next, Kate learned the second group of 10 multiplication facts through SIM instruction. She reached the criterion for proficiency (40 correct digits written on a one-minute multiplication probe over three consecutive trials). One week after instruction in SIM, a multiplication probe was administered to check maintenance of her skills. Kate wrote 40 correct dpm. Kate appeared to be satisfied with her performance. Another maintenance probe was administered five weeks after SIM instruction ended. Kate wrote 19 correct dpm. The instructor administered Generalization probes including 5 unknown facts, one timed probe (1-minute) and a probe with no time limit. Kate wrote 40 correct dpm when given the timed probe and 50 dpm when given the probe with no time limit. She reported that he was finished with the untimed probe at 1 minute, 45 seconds. Kate used the strategy that she had learned in SIM instruction to complete the unknown fact problems.
Comparison of Kate’s CTD and SIM PerformanceKate learned 2 groups of multiplication facts (10 in each) and reached proficiency with both instructional methods. However, there was a difference in how those groups were maintained over time. Kate’s 1-week maintenance performance decreased with both methods, the decrease was significantly lower after CTD (45% lower) than after SIM (13% lower). Her 5-week performance decreased again for both methods, but the decrease was lower after CTD (67% lower) than after SIM (59% lower). The difference between Kate’s performance on the generalization probes favored SIM instruction. Her learning during the CTD appeared to generalize to unknown facts to some degree. She wrote 9 correct dpm during the timed probe and 7 correct dpm during the untimed probe. However, Kate’s knowledge of the strategy appeared to be more useful in generalizing skills to the unknown facts. She wrote 40 correct dpm with the timed probe and , when given unlimited time, wrote 50 correct digits. Kate demonstrated her use of the strategy learned in SIM instruction by drawing the problems and solving them correctly.
Case Study 3: JerryJerry’s backgroundJerry was an 11 year-old African American male in the 6 th grade who qualified for special education services with specific learning disabilities in the areas of mathematics computation and reading decoding. Jerry’s cognitive ability was within the average range (Stanford-Binet, Comp=85). Jerry performed below grade level in the areas of math computation (3:5) and reading decoding (2:5). Jerry was a quiet and reserved middle school student who reported interest in participating in instruction. Jerry reported having difficulty completing math problems because he did not know all of his multiplication facts.
CTD Instruction with JerryJerry learned the first group of 10 multiplication facts through CTD instruction. Jerry was present for every scheduled session. He began mastering facts immediately after presentation using a zero-second delay. There were only two instances of teacher prompts during presentation with the 4-second delay. Although Jerry mastered facts quickly, he reported that
54

is was hard to remember and that he didn’t like that the answers were hidden on the back of the flashcard. Jerry reached the criterion for proficiency (40 correct digits written on a one-minute multiplication probe over three consecutive trials). Jerry reached criterion after five probes, ranging from 16 to 40 correct dpm. His mean performance for this condition was 31.6 correct dpm.
SIM Instruction with JerryAfter 5 weeks of CTD instruction, Jerry began SIM instruction with the second group of facts. He completed each instructional phase and there was no need for re-teaching. Jerry mastered facts quickly and used the DRAW strategy on several probes when he did not automatically remember facts. Jerry reported that he like SIM instruction because it was easier to remember facts. Jerry reached criterion after nine probes, ranging from 18 to 50 dpm. His mean performance for this condition was 30.89 correct dpm.
Jerry’s Performance Table 1 (above) presents a summary of Jerry’s and other students’ performance. One week after instruction in CTD, a multiplication probe was administered to check maintenance of his skills. Jerry wrote 16 correct dpm. Jerry appeared frustrated with his performance after the probe and reported that he wished he could remember more of his facts after taking the first maintenance probe. Another maintenance probe was administered five weeks after CTD instruction ended. Jerry wrote 18 correct dpm. The instructor administered Generalization probes including 5 unknown facts, one timed probe (1-minute) and a probe with no time limit. Jerry wrote 4 correct dpm when given the timed probe and 44 dpm when given the probe with no time limit. Jerry reported that he was finished with the untimed probe at 2 minutes and 30 seconds. Next, Jerry learned the second group of 10 multiplication facts through SIM instruction. Jerry reached the criterion for proficiency (40 correct digits written on a one-minute multiplication probe over three consecutive trials). One week after instruction in SIM, a multiplication probe was administered to check maintenance of his skills. Jerry wrote 40 correct digits per dpm. Another maintenance probe was administered five weeks after SIM instruction ended. Jerry wrote 33 correct dpm. The instructor administered Generalization probes including 5 unknown facts, one timed probe (1-minute) and a probe with no time limit. Jerry wrote 40 correct dpm when given the timed probe and 50 dpm when given the probe with no time limit. Jerry reported that he was finished with the untimed probe at 2 minutes, 25 seconds. Jerry used the strategy that he had learned in SIM instruction to complete the unknown fact problems.
Comparison of Jerry’s CTD and SIM PerformanceJerry learned 2 groups of multiplication facts (10 in each) and reached proficiency with both instructional methods. However, there was a difference in how those groups were maintained over time. Jerry’s 1-week maintenance performance decreased with facts learned during CTD (60% decrease), but not after SIM (20% decrease). Jerry’s 5-week performance decreased for both methods, but the decrease was lower after CTD (55% lower) than after SIM (34% lower). The difference between Jerry’s performance on the generalization probes favored SIM instruction. Jerry wrote 4 correct dpm on the first generalization probe. However, when given the untime probe, Jerry’s performance was surprisingly higher with 44 correct digits written in about 2 minutes. Jerry’s knowledge of the strategy appeared to be useful in generalizing skills to the unknown facts. Jerry wrote 40 correct dpm with the timed probe. His performance increased to 50 correct digits written in about 2 minutes.
Case Study 4: CindyCindy’s backgroundCindy was an 11 year-old African American female in the 6 th grade who qualified for special education services with specific learning disabilities in the area of mathematics reasoning. Cindy’s cognitive ability was below the average range (WISC-III FS=76). She performed below grade level in the areas of math computation (3:2), reading decoding (3:2), and written
55

expression (3:2). There were current data regarding math reasoning although this was her area of eligibility. The resource teachers reported being most concerned about her performance in math. They reported that she had a particularly difficult time learning, demonstrating memory problems to a greater extent than other peers with specific learning disabilities.
CTD Instruction with CindyCindy learned the first group of 10 multiplication facts through CTD instruction. Cindy was present for every scheduled session. Cindy made slow progress at the beginning of instruction. She mastered 2 facts and maintained that level of performance for 7 sessions. Cindy was impatient during instruction as evidenced by quick incorrect responses rather than waiting for the instructor’s prompt. Her progress was more sporadic than the other students in that one say she would appear to have mastered a fact one day but not the next. During the last 5 probes before the criterion, there was a large increase in her performance and this increase continued until the criterion was reached. Cindy reached the criterion for proficiency (40 correct digits written on a one-minute multiplication probe over three consecutive trials). Cindy reached criterion after 16 probes ranging from 2 to 44 correct dpm. Her mean performance for this condition was 17.5 correct dpm.
SIM Instruction with CindyFive weeks after CTD instruction, Cindy learned the second group of multiplication facts through SIM instruction. Each instructional phased was completed without the need for re-reaching. Cindy did not appear to like SIM instruction. She learned the DRAW strategy without difficulty and used it appropriately when she could not remember a fact. Cindy reported that she liked SIM instruction better than CTD because the DRAW strategy provided her with a plan that she could use to remember facts. Cindy reached criterion after 13 probes, ranging from 0 to 42 dpm. Her mean performance for this condition was 23.69 correct dpm.
Cindy’s PerformanceTable 1 (above) presents a summary of Cindy’s and other students’ performance. One week after instruction in CTD, a multiplication probe was administered to check maintenance of her skills. Cindy wrote 36 correct dpm. Cindy appeared pleased with her performance. Another maintenance probe was administered five weeks after CTD instruction ended. Cindy wrote 6 correct dpm. The instructor administered Generalization probes including 5 unknown facts, one timed probe (1-minute) and a probe with no time limit. Cindy wrote 0 correct dpm when given the timed probe and 0 correct digits when given the probe with no time limit. Cindy reported that she was finished with the untimed probe at 1 minutes and 15 seconds. Next, Cindy learned the second group of 10 multiplication facts through SIM instruction. She reached the criterion for proficiency (40 correct digits written on a one-minute multiplication probe over three consecutive trials). One week after instruction in SIM, a multiplication probe was administered to check maintenance of her skills. Cindy wrote 36 correct dpm. Another maintenance probe was administered five weeks after SIM instruction ended. Cindy wrote 20 correct dpm. The instructor administered Generalization probes including 5 unknown facts, one timed probe (1-minute) and a probe with no time limit. Cindy wrote 4 correct dpm when given the timed probe and 50 correct digits when given the probe with no time limit. She reported that he was finished with the untimed probe at 5 minute, 20 seconds. Cindy used the strategy that she had learned in SIM instruction to complete the unknown fact problems.Comparison of Cindy’s CTD and SIM Performance Cindy learned 2 groups of multiplication facts (10 in each) and reached proficiency with both instructional methods. Although her performance decreased with both methods, her performance was slightly lower with the CTD condition (18% lower) than with the SIM condition (14% lower). Her 5-week performance decreased again for both methods, but the decrease was lower after CTD (86% lower) than after SIM (52% lower). The difference between Cindy’s performance on the generalization probes favored SIM instruction. Her learning during the CTD did not appear to generalize to unknown facts, writing 0 correct digits on both timed and untimed probes. However, Cindy’s knowledge of the strategy
56
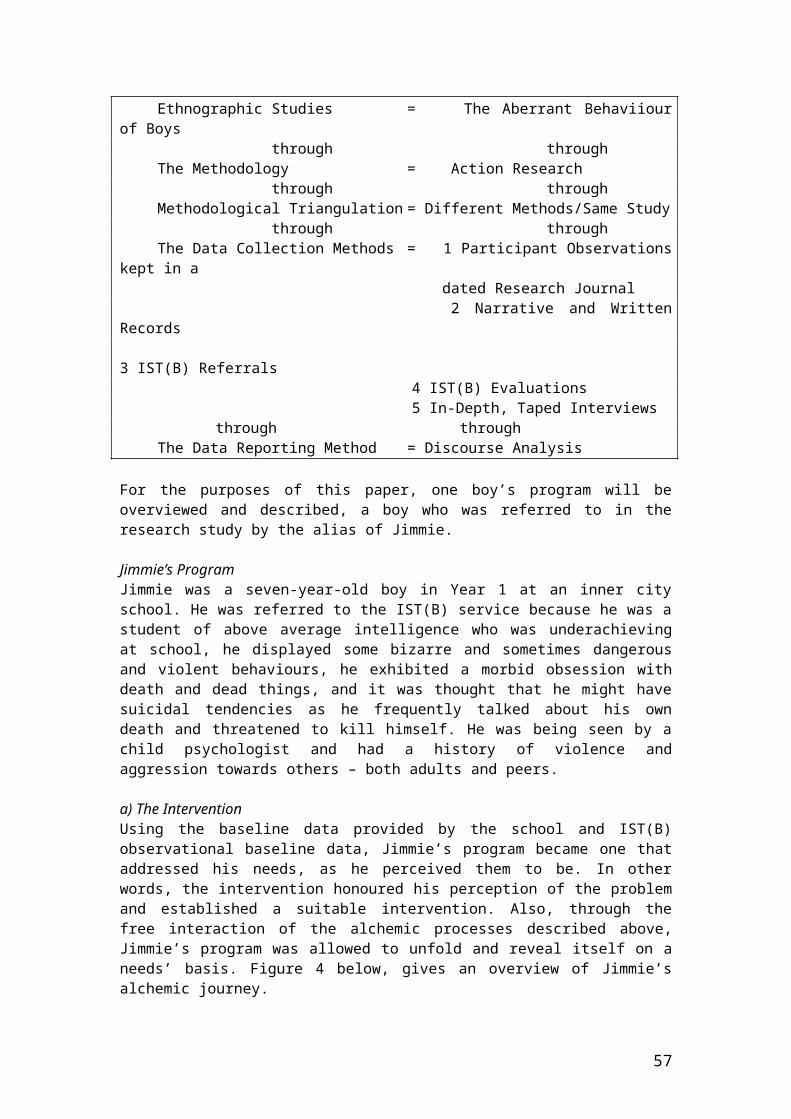
appeared to be more useful in generalizing skills to the unknown facts. She wrote 4 correct dpm with the timed probe and , when given unlimited time, wrote 50 correct digits. Cindy demonstrated her use of the strategy learned in SIM instruction by drawing the problems and solving them correctly.
DiscussionInstruction and Performance This investigation was designed to examine the differences between CTD and SIM with regard to maintenance and generalization of multiplication facts. Consistent with previous studies, the students maintained their learning (Mattingly & Bott, 1990). However, this study measured maintenance both one and five weeks after instruction rather than three weeks in other studies. This study extended previous SIM and CTD findings with regard to generalization, defining it as computation of untaught multiplication facts. Mattingly and Bott (1990) and Cybrinsky and Schuster (1990) defined generalization as the transfer of verbal identification to written tasks. Koscinski and Gast (1993) defined it as the ability to identify the same previously taught facts using a different orientation and through completion of written multiplication facts. Mercer and Miller (1992b) defined generalization as the ability to use previously taught facts in other mathematical algorithms, across settings, and with different examiners.
This study demonstrated a difference between CTD and SIM with regard to generalization and maintenance. After SIM, two students wrote more correct digits during the timed generalization probe and all of the students wrote more digits during the untimed probe. These increases were significantly higher with increases of 39 and 43 more digits. Three of the four students maintained a higher level of fluency one week after the SIM condition with increases as high as 16 and 24 more dpm. All of the students maintained a higher level of fluency five weeks after the SIM condition, with increases as high as 15 dpm.
Student Background, Behavior, and PerceptionsThe students all had similar backgrounds with regard to age, grade, ethnicity, achievement, special education eligibility, and amount of special education services. The students’ behaviors were consistent with their performance in that engagement and ease of following procedures was consistent with the number of probes completed before mastery. For example, Cindy had great difficulty during CTD, frequently impulsively responding with incorrect answers rather than waiting for the teacher’s prompt. This frequent practice with incorrect responses may have contributed to her rate of progress. There was a surprising finding in the students’ perceptions of the CTD and SIM. All of the students but Sam perceived SIM instruction as the better instructional method. This was surprising because Sam performed much better during SIM instruction. He discovered an alternate way to solve unknown multiplication facts through the distributive property. He also used the DRAW strategy during generalization which led to a significant increase in his performance on the untimed probe. Despite his increased performance and demonstration of understanding of multiplication, he perceived CTD as better way to learn because it was fast-paced. This did not appear to affect his performance and it is not known how the perceptions of the other students influenced their performance.Implications of FindingsThe students in this study were older than the students involved in most of the previous research (Mattingly & Bott, 1990; Cybrinsky & Schuster, 1990; Koscinski & Gast, 1993; Harris et al., 1995) and had a history of failure. A concern regarding the students’ age might be the amount of instructional time devoted to learning basic multiplication facts rather than other mathematical skills (Cawley, Parmar, Yan, & Miller, 1996). However, ten to fifteen minutes outside of regularly scheduled math instruction for as few as five days produced an increase in proficiency and fluency. It is realistic that middle school teachers could devote this amount of time to instruction (Zigmond & Baker, 1990). Although both interventions were implemented individually, CTD can be used in a group format (Keel & Gast, 1992; Keel,
57
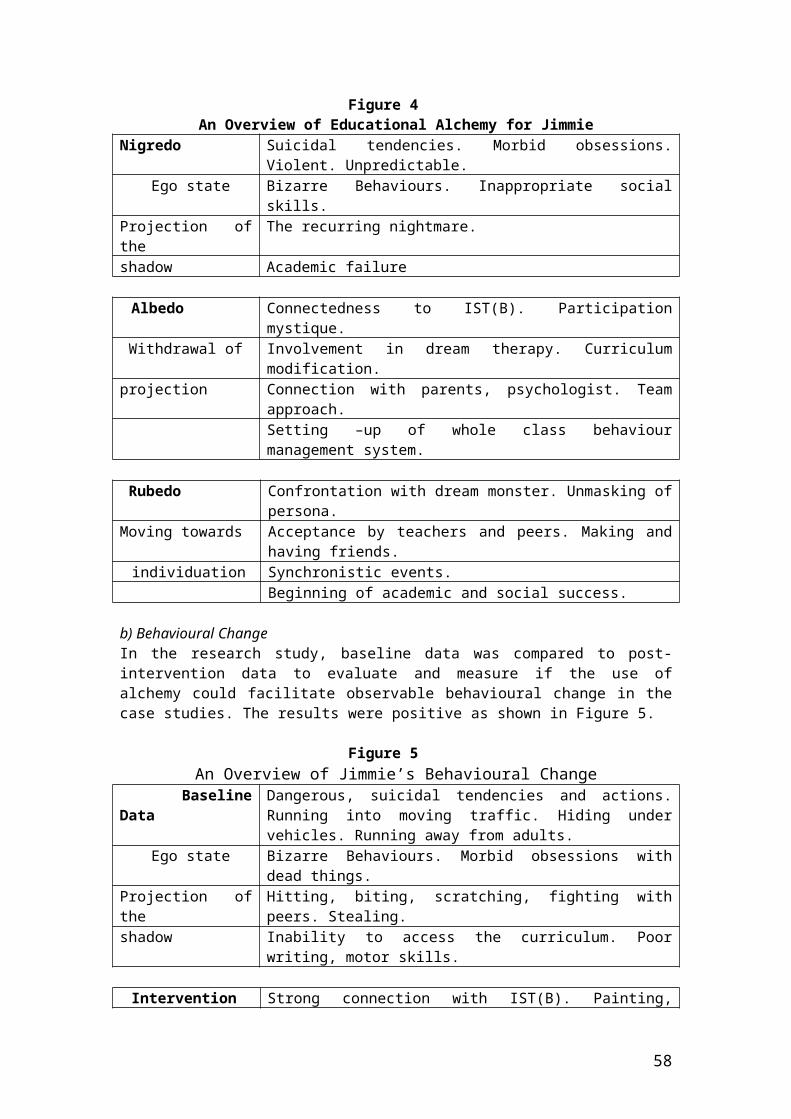
Slaton, & Blackhurst, 2001; Koscinski & Hoy, 1993) and SIM was designed for group instruction (Mercer & Miller, 1992a). Group implementation would be a more efficient use of time.
The most significant implication for the results of this study was the effects of SIM on maintenance and generalization. The students maintained greater levels of fluency on the 5-week maintenance measures. According to cognitive theory, learning occurs through a process involving attention, perception, encoding information for storage, and retrieving previously learned information (Case, 1992; Pressley, 1995). Perhaps manipulating objects and using visual representations increased students’ attention and built a more elaborate mental framework for multiplication, leading to more efficient storage and retrieval of information. Other evidence that the students demonstrated greater understanding of multiplication was that they discovered other strategies for solving multiplication problems. During SIM, when given the problem 6x8, two students added the product of 5x8 to the product of 1x8 to arrive at the answer 48. Two other students solved 8x9 using the same procedure. Perhaps the manipulation of objects and use of visual representations led to increased understanding and use of the distributive property.
The increased generalization performance might have been due to the students’ strategy-use during the SIM condition. It was evident that the students used this strategy during the generalization probes because they translated the numerical problems into pictures on the timed generalization and untimed generalization probes. In addition to maintaining their knowledge of multiplication facts, the students applied their strategic knowledge to another task. The use of the DRAW strategy for unknown multiplication facts took more time, but led to greater accuracy. This may explain the students’ increase in accuracy when there was no time limit for completion.
Limitations The limitations of this study are in the area of external validity, the degree to which the results can be generalized beyond the experimental conditions (Kazdin, 1982). First, the students who participated in this study were similar with respect to grade level, ethnicity, disability, amount of time served in special education, and level of achievement. It is not known whether the same results would be obtained with characteristically different students. A further limitation of this study is the generality of the behavior change agent (Kazdin, 1982). The primary researcher delivered instruction rather than the students’ math teacher. This may have increased the treatment integrity, but the results may be less practical or applicable. Also, the likelihood that this type of instruction will continue to be implemented by the students’ teacher is probably small since she did not experience the students’ progress firsthand. Implementation of these methods by a teacher in a typical classroom situation would strengthen the results. In order to bridge the gap between research and practice, appropriately trained teachers should implement research procedures in a typical classroom situation. Finally, the amount of time employed for the maintenance condition is a limitation. The study was conducted during the second semester of the school year and maintenance measures up to 5 weeks ensured that students finished both conditions by the end of the school year. A longer maintenance condition would have increased validity and in practice, maintenance would be expected to be much longer than five weeks.
Future Research and ConclusionFurther research is needed to investigate how long the treatment effects are maintained. Measurement of maintenance each week for several weeks might provide more practical maintenance information. Also, further research may be needed in order to investigate whether and/or how much practice is needed to maintain the treatment effects over time. Further investigation of generalization is also needed. Although generalization of multiplication skills to untaught facts was measured, this study did not involve programmed instruction for generalization. This is a component of other programs following SIM (Deshler,
58

Schumaker, Harris, & Graham, 1999; Schmidt, Deshler, Schumaker, & Alley, 1989). The generalization measures in this study did not extend to problem solving and real world application of skills as called for by the National Teacher of Mathematics Standards (2000). Future research should involve instruction and measurement in this area.
CTD and SIM have demonstrated improvements in the mathematical performance of students with LD (Cybrinsky & Schuster, 1990; Koscinski & Gast, 1993; Harris et al., 1995; Mattingly & Bott, 1990; Mercer & Miller, 1992b ; Miller & Mercer, 1993a; Miller & Mercer, 1993b). Both teaching strategies are effective, but SIM may have a greater impact on the maintenance and generalization of skills. It is important that teachers know which strategies improve the retention of math skills for students with LD, so that these students have a greater likelihood of academic success.
ReferencesBeck, R. Conrad, D., & Anderson, P. (1999) Basic Skill Builders. Longmont, CO: Sopris West Educational Services.Campbell, J.M. (2004). Statistical comparison of four effect sizes for single subject designs. Behavior Modification, 28, 234-246.Case, R. (1992). The mind’s staircase: Exploring the underpinnings of children’s thought and knowledge. Hillsdale, N.J.: Erlbaum.Cawley, J. F., Parmar, R. S., Yan, W. F., & Miller, J. H. (1996). Arithmetic computation of students with learning disabilities: Implications for instruction. Learning Disabilities Research and Practice, 11, 230-237.Cybriwsky, C.A., & Schuster, J.W. (1990). Using constant time delay procedures to teach multiplication facts. Remedial and Special Education, 11(1), 54-59.Deshler, D. D., Schumaker, J., Harris, K., & Graham, S. (1999). Teaching every adolescent every day: Learning in diverse high school classrooms. Cambridge, MA: Brookline Books.Fleishner, J.E., & Manheimer, M.A. (1997). Math interventions for students with learning disabilities: Myths and realities. School Psychology Review, 26, 397-419.Georgia Department of Education. (2000). Exceptional students: State rules, categories of eligibility. Retrieved September 1, 2003, from Georgia Department of Education Web site: http://www.doe.k12.ga.us/_documents/doe/legalservices/160-4-7-.02.pdfHarris, C. A., Miller, S. P., & Mercer, C. D. (1995). Teaching initial multiplication skills to students with disabilities in general education classrooms. Learning Disabilities Research & Practice, 10, 180-196.Houchins, D. E., Shippen, M. E., & Flores, M. M. (2006) Math assessment and instruction for students at-risk. In R. Colarusso, & C. O’Rourke (Eds.), Special education for all teachers (313-356). DuBuque, IA: Kendall Hunt.Kazdin, A.E. (1982). Single-case research designs: Methods for clinical and applied settings. New York: Oxford University Press.Keel, M. C., & Gast, D. L. (1992). Small group instruction for students with learning disabilities: Observational and incidental learning. Exceptional Children, 58, 357-368.Keel, M., Slaton, D. B., & Blackhurst, A. E. (2001). Acquisition of content area vocabulary for students with learning disabilities. Education and Treatment of Children, 24, 46-71.Koscinski, S.T., & Gast, D.L. (1993). Use of constant time delay in teaching multiplication facts to students with learning disabilities. Journal of Learning Disabilities, 26, 583-544.Koscinski, S.T., & Hoy, C. (1993) Teaching multiplication facts to students with learning disabilities: The promise of constant time delay. Learning Disabilities Research and Practice, 8, 260-263.Lenz, K., Ellis, E., & Scanlon, D. (1996). Teaching learning strategies to adolescents and adults with learning disabilities. Austin, TX: Pro-ed.Maccini, P., & Ruhl, K.L. (2000). Effects of graduated instructional sequence on the algebraic subtraction of integers by secondary students with learning disabilities. Education and Treatment of Children, 23, 465-489.
59

Mattingly, J.C., & Bott, D.A. (1990). Teaching multiplication facts to students with learning problems. Exceptional Children, 56, 438-449.Mercer, C. D., Jordan, L., & Miller, S. P. (1994). Implications of constructivism for teaching math to students with moderate to mild disabilities. The Journal of Special Education, 28, 290-306.Mercer, C.D., & Miller, S.P. (1992a). Multiplication facts 0 to 81. Lawrence, KS: Edge Enterprises.Mercer, C. D., & Miller, S.P. (1992b). Teaching students with learning problems in math to acquire, understand, and apply basic math facts. Remedial and Special Education, 13(3), 19-35.Meyers, L., & Grossen, N. (1974). Behavioral research: Theory, procedure, and design. San Fransisco: W.H. Freeman.Miller, S.P., & Mercer, C.D. (1993a). Using data to learn about concrete-semiconcrete-abstract instruction for students with math disabilities. Journal of Learning Disabilities Research and Practice, 8, 89-96.Miller, S.P., & Mercer, C.D. (1993b). Mnemonics: Enhancing the math performance of students with learning difficulties. Intervention in School and Clinic, 29(2), 78-82.Morton, R.C., & Flynt, S.W. (1997). A comparison of constant time delay and prompt fading to teach multiplication facts to students with learning disabilities. Journal of Instructional Psychology, 24, 3-13.National Council of Teachers of Mathematics. (2000). Principles and standards for school mathematics. Reston, VA: Author.Poling, A., Methot, L.L., & LeSage, M.G. (1995). Fundamentals of behavior analytic research. New York: Plenum.Pressley, M. (1995). What is intellectual development about in the 1990’s? Good information processing. In F. E. Weinert & W. Schneider (Eds.). Memory performance and competencies: Issues in growth and development. Hillsdale, NJ: Erlbaum.Richards, S.R., Taylor, R.L., Ramasamy, R., & Richards, R.Y. (1999). Single subject research: Applications in educational and clinical settings. San Diego, CA: Singular.Schmidt, J. L., Deshler, D. D., Schumaker, J. B., & Alley, G. R. (1989). Effects of generalization instruction on the written language performance of adolescents with learning disabilities in the mainstream classroom. Journal of Reading and Writing and Learning Disabilities, 4, 291-309.Tawney, J.W., & Gast, D.L., (1984). Single subject research in special education. Columbus, OH: Merrill.Wolery, M., Ault, M.J., & Doyle, P.M. (1992). Teaching students with moderate to severe disabilities: Use of response prompting strategies. New York: Longman.Zigmond, N., & Baker, J. (1990). Mainstream experiences of learning disabled students (Project MELD): A preliminary report. Exceptional Children, 57, 176-185.
AGGRESSIVE BEHAVIOUR AMONG SWAZI UPPER PRIMARY AND JUNIOR SECONDARY STUDENTS: IMPLICATIONS FOR ONGOING EDUCATIONAL
REFORMS CONCERNING INCLUSIVE EDUCATION
60

Lawrence Mundia,University of Brunei Darussalam
Swaziland is planning to introduce inclusive education as part of education for all. The innovation may benefit learners with emotional and behavioural disorders (EBD). A purposive teacher sample (N = 47) was used to generate and identify behavioural problems that are prevalent in Swazi schools. Aggression was one of the many conduct disorders cited. Using a purposive sample of 300 students, the study found aggression to be indeed a problem among upper primary and junior high school students. The type of school attended was found to be correlated with aggression. Students with moderate to severe aggressive behaviours were found on all categories of learners used in the study. However a significant difference in the number of aggressive students was obtained on only two variables, the type of school students attended and the kind of guardians students lived with at home. There were more students with aggressive tendencies in government schools than other types of schools. Furthermore, aggressive students lived mainly with both biological parents. Teachers rely mainly on punishment to deal with aggressive students. The findings have implications for the ongoing educational reforms concerning inclusive education in Swaziland. Three major recommendations were made to address them. Teacher skills in handling aggressive cases need to be enhanced by both preservice and inservice courses. School counselors need to be appointed to provide suitable psychological intervention. Finally, a more detailed investigation using qualitative procedures was recommended to gain in-depth insights into the problem and its solutions.
The need to study students’ behavioural disorders is increasing in the world these days as more psychotic incidents of students fatally wounding or killing teachers and fellow pupils in schools for various reasons are being reported by the news media. Such reports portray teaching as an unsafe, dangerous and security-risk profession. Students with emotional and behavioural disorders (EBD), learning disabilities (LD), and those who live under at-risk or difficult circumstances constitute newer categories of exceptional learners in Swaziland. Although these students tend to be the majority in exceptional populations of learners in Swaziland and other developing countries, their education is usually accorded a low status along with the education of those who are gifted / talented. For example there are no special schools and centres for EBD, LD, the at-risk, and gifted students in Swaziland and many developing countries. On the contrary top priority is often accorded to the education of students in the older traditional categories of disabilities (blind, deaf, physical, intellectual, and communication) and there are many special schools and centres for learners with such special needs in most developing countries. Consequently as a result of these problems there are few or no incidence statistics about people with EBD, LD, or those living in unusual conditions in some developing countries such as Swaziland. The objectives of the present study were to:
Determine the student behavioural problems prevalent in Swazi upper primary and junior secondary schools.
Measure the relationship between aggression and selected demographic variables. Assess the nature and extent of student aggression. Find out if there are differences in aggression between various categories of students. Identify the strategies teachers frequently use to manage student behaviour problems.
61

Types of Aggressive BehaviourThere are many different kinds of behavioural disorders. Aggression is just one of the several known categories of conduct problems. The behavioural disabilities that are related to aggression can be divided into two main groups: verbal and physical. Verbal aggression includes acts such as using insulting language, displaying anger, threatening, swearing, and being sarcastic, all in order to cause emotional or psychological pain. On the other hand physical aggression aims to cause bodily damage and includes bullying, destructing, vandalism, gangsterism and fighting. According to Shaffer (2002) an aggressive act is any form of behaviour designed to harm or injure a living being. In aggression, the desire to harm is intentional rather than accidental (Sdorow, 1995; Matlin, 1998). Longitudinal research on the long-term stability of aggression shows that the trait is a reasonably stable attribute. However research also indicates that the rate of physical aggression (fighting) tends to decline from middle childhood through adolescence (Shaffer, 2002). Aggression is different from and should not be confused with rough-and-tumble play that does not have any harmful intent (Humphrey and Smith, 1984; Shaffer, 2002). The following are some of the numerous types of aggression commonly found in the literature.
Relational aggression (also known as social aggression). This occurs where a person, usually a female, behaves maliciously with the intention of damaging an adversary’s self-esteem, friendship, or social status (Shaffer, 2002). Other forms of relational aggression include: snubbing or ignoring another person to make him / her feel bad; not talking with a person following an argument; and spreading malicious gossip / lies about others (Shaffer, 2002). An example of relational aggression happened in Brunei Darussalam when a teenage girl gave a false story accusing a man of raping her (Ezam, 2003). Relational aggression is most common among females.
Verbal abuse (nonphysical aggression). The examples of this form of emotional or expressive aggression include name-calling, teasing, quarreling, extortion, intimidating, vicious gossiping, and cruel rumour campaigns (Christie and Christie, 1999; Nicholson & Ayer, 1997). The intention here is to harm or injure another persons’ feelings indirectly.
Physical aggression. There are many examples of this form of hostile aggression that include, but are not limited to bullying, kicking, molesting, harassing, biting, hitting, pushing, and torturing. Other examples of hostile aggressives are street gangsters, school bullies, and children who repeatedly attack their peers (Shaffer, 2002). Shaffer adds that the incidence of bullying by school age girls occurs just as frequently as is true for boys. Habitual bullies however aggress mainly those who are provocative, passive, weak, and socially isolated / withdrawn (Olweus, 1993). Violence is used to cause destruction and the aggression is both direct and overt.
Retaliatory (reactive) aggression: making an attack in return for a similar attack occurs where a person behaves aggressively when there is a real or imagined provocation from another or other people (Shaffer, 2002). This is often done in form of self-defense or revenge.
Instrumental (proactive) aggression: occurs when a person behaves aggressively, not necessarily, to revenge, but to get a reward to satisfy specific personal goals such as gaining access to a certain object, space, or privilege and the aggressor is quite confident that aggression will pay off (Shaffer, 2002; Mussen, Conger, Kagan, & Huston, 1984). An example of this type of aggression are bullies who beat up other kids because they get payoffs of various types from their actions.
62
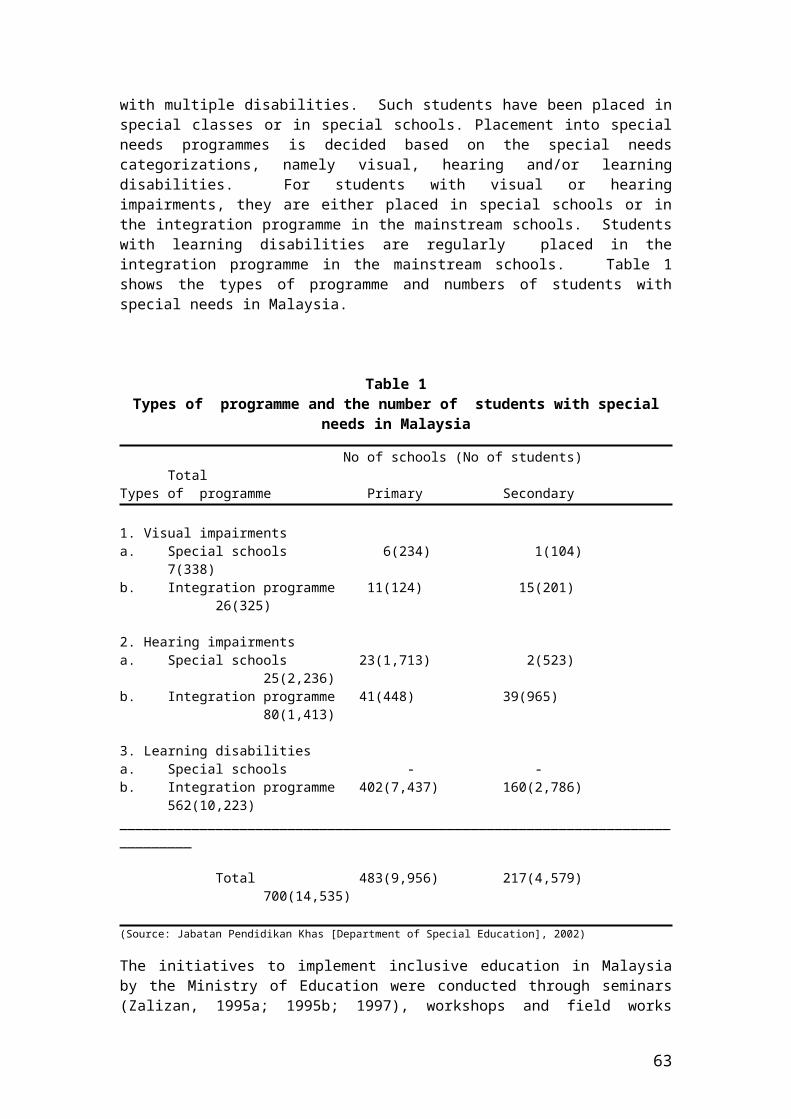
Causes of Aggressive BehaviourThere are many possible causes of aggression in humans. The causes can, however, be divided into two broad categories: biological (chromosomal, genetic and hormonal), and environmental (classical and operant conditioning, social learning or modeling, child-rearing practices, parental / teacher leadership style, and reinforcements). The following are examples of some casual factors from this wide range of sources.
Biological factors. Although biology is implicated in the causation of human aggression, many studies on this issue have had either inconclusive or inconsistent results (Pinel, 1990). For instance the inconsistent evidence that testosterone affects the aggressive behaviour of humans is, according to Pinel (1990), attributable to two factors. First, hormones have less of an effect on human aggression than they do on aggression in other species. Second, the tests of aggression that have been used to study human aggression are markedly different from those that have proven successful in the study of aggression in other species such as rats. Despite this limitation a few points can be noted from sources such as Pinel (1990) about the role of biological factors in human aggression. First, studies of human patients in clinical settings indicate that brain stimulation can elicit aggressive affect. Second, the stimulation of the lateral hypothalamus has been shown to elicit predatory, defensive and social aggression in all species. Third, the fact that social aggression in many species occurs more frequently between male than between females is often attributed to the organizational and activation effects of testosterone. Biologically, males are more aggressive physically and verbally than females (Carlson,1987; Mussen, Conger, Kagan, & Huston, 1987). However the tendency for boys to act more aggressively than girls is least in toddlers (Shaffer, 2002). Females use more social (relational) aggression than overt aggression. Fourth, those who advocate psychosurgery for the treatment of human aggression usually recommend lesions to the amygdala. Fifth, it is possible that violent criminal behavior is hereditary because it tends to run in families (Matlin, 1998).
Individual characteristics. The main possible contributing factors to aggression here include having a difficult temperament, inappropriate social skills, misinterpreting other people’s behaviour as hostile, and inability to find nonaggressive solutions to conflicts (Salvin, 1994).
Home and school environments. The possible source or cause of aggressive tendencies here is the negative influence of parents and teachers whose parenting and leadership styles are dictatorial, coercive, or oppressive (Mwamwenda, 1995). Children model these undesirable aggressive behaviours. Out-of-control children are typically reared in coercive home environments (Shaffer, 2002). In addition, factors such as being cold and rejecting, ignoring aggression among children, constant or erratic use of physical punishment to control aggression, nuturing aggressive tendencies, high permissiveness toward aggressive acts, and low punitiveness to aggressive behaviours can all facilitate the development of aggression among children (Shaffer, 2002). Shaffer further says that child rearing in low income families encourages violence in three ways: encouraging children to respond forcibly to provocations; applying physical punishment such as spanking; and lack of parental monitoring of children.
Peer influence. Making friendship with antisocial peers or belonging to deviant-oriented peer groups whose members have antisocial attitudes and behaviours can lead to the development of aggressive tendencies through modeling violent peers.
Exposure to media violence. A lot has been researched and written on this matter. Many studies have confirmed the contribution of the electronic media (television, video and internet) to the development of aggression and violence among young people from infancy to adolescence (Shaffer, 2002). Young people love watching too much action – packed violent programs on television, video and internet. They also like playing violent television, video
63

and internet include Meeky Mouse, Akira, Spyderman, Mutant Ninja Turtles, Counter Strike, Mortal Kombat, Batman, Karate, boxing, and wrestling. Many young people see aggressive figures in these brutal programs as their heroes. They model their aggressive behaviours and get reinforced vicariously while watching or playing the program / game on the television, video, or internet.
Community and social factors. Tolerance and acceptance of aggression and violence in the community or society increase the likelihood that children brought up in these contexts will become aggressive and violent. This is because aggressive behaviour is largely learned and maintained in a manner similar to the other learned behaviours (Craig, 1980). According to Shaffer (2002) aggression is socialised in three main ways. First, parents play rougher with sons than with girls. Second, parents discourage daughters’ aggression more than sons’ aggression. Third, physically rough play is part of the androgynous gender role.
Prevention of Aggressive BehaviourAggression has many psychological effects and social costs on both the perpetrator and victim. For instance the aggressor may be isolated due to peer rejection, have no long – term friend(s), and be expelled from school. The victim looses freedom, forfeits self – assertion, becomes submissive and lives under fear. Aggression can disrupt the school’s educational processes and disturb group and intergroup relationships in the school community. Because of its many adverse impacts, aggression should be prevented or minimized in all social contexts (home, school, and work). The best programs to reduce aggressive behaviours are those which are preventative and family-focused. Parents and teachers can reduce aggression by removing aggressive toys, videos, and games from the playrooms thereby creating non aggressive environments (Shaffer, 2002). Aggression can be reduced by addressing most of the non biological factors that cause it. Parents and teachers can, for example, also control the type of programs and games children watch and play on television, video and internet at home and school. Unfortunately most parents and teachers in developing countries are still not very computer literate and can not effectively use programs or applications such as “Stop Pop Up” that can block access to unwanted internet sites with aggression, violence, sex or pornography (Lefrencois, 2001). Although aggression can not be reduced to zero, there are many procedures that can decrease it significantly. These include the cognitive behaviour modification scheme, schedules of reinforcement and behaviour shaping under operant conditioning, the aggression replacement training, ART model (Glick, 1996), and the whole school approach to bullying (Olweus, 1993). Anti-violence intervention programs in schools have been shown to be effective as early as kindergarten (Shaffer, 2002).
Method DesignThe study adopted the field survey approach to investigate the problem. Field survey research has many limitations which are known by both researchers and users of research results. For instance, the presence of the researcher during data collection (by interview, observation or questionnaire) may have effects that can sensitise the research participants to give socially desirable responses to research items. In addition, the outcomes of a survey study might not show cause-and-effect relationship among the variables probed. Several ethical measures and precautions were taken during the conduct of the study to reduce researcher effects. Despite the weakness, the rationale for using the field research method was three-fold: first, to involve as many students as possible in exploring the problem; second, to give on-the-spot assistance to research participants who needed help about completing the research instrument; and third, to generate research questions or hypotheses for further detailed investigation.
SamplesThe study used two nonprobability samples: teachers and students. The purposive teacher sample consisted of 47 serving and highly experienced teachers. The purpose of this sample was to generate and identify behavioural problems that were deemed to be prevalent in Swazi
64

primary and secondary schools. The teacher sample consisted of 20 males and 27 females. Most of them taught in primary schools (28) while the rest (19) were secondary school teachers. They represented both rural schools (26) and urban schools (21). All taught at coeducation schools. Each had a diploma qualification in education. The teachers’ age ranged from 25 to 54 (mean = 34.86; SD = 6.93). Their teaching experience ranged from 5 to 20 years (Mean = 11.50; SD = 4.76). According to the last education census statistics, Swaziland has about 539 primary schools with 213,041 students and 51 junior high schools with 4,943 students (Central Statistics Office, 2000). The study could not use all these schools and students due to lack of time and other constraints. Instead, a sample of 300 students was selected purposively from 15 schools for use in the study. There were only three criteria for inclusion of schools and students in the study sample. First, research participants were drawn from schools with ease of access in terms of transport. Second, students were recruited from a variety of schools (upper primary, junior secondary , urban and rural schools, and government, mission and private schools) to have a wide range of opinions on the research problem. Third, both genders were represented in the study. The student sample consisted of an equal number of males (150) and females (150). They were in both rural schools (170) and urban schools (130). The students represented three types of schools: government (165); church / mission (86); and private (49). Of the 300 students, 141 were in upper primary school while 159 were in junior secondary school.They originally came from all parts of Swaziland: Hhohho (119); Manzini (96); Shiselweni (10); and Lubombo (75). The age range of the students was 10-20 years (Mean = 15.42; SD = 2.17).
InstrumentsTwo instruments were used to collect the data for the study. The first self-report instrument administered to the teacher sample was constructed by the researcher. This instrument was a checklist. The checklist had three sections collected teachers’ biodata, their ratings of aggressive behaviours prevalent in schools, and strategies teachers use to solve them. Although the instrument did not lend itself calculable to quantitative evidence of reliability, five former colleagues of the researcher at the University of Swaziland judged it to have had adequate content validity.
The second self-report instrument administered to the student sample was adapted from Townend (1994). The instrument had a demographical section which collected students’ biodata using eight items. The rest of the instrument consisted of 80 mixed items measuring passiveness, manipulativeness, assertiveness, and aggressiveness (20 items for each behavioural trait). A linguist at the University of Swaziland was used to adapt 11 of the 80 items to suit the education level and language skills of the students. This modification was done without altering the original meaning of the effected items. Of the 80 items, only 20 measuring aggression were relevant for this study. The other 60 items were allowed to remain in the instrument to control classical measurement errors, social desirability and to prevent students from developing a response set. The instrument was pretested using a class of 41 Grade 7 students at one of the upper primary schools. The Cronbach alpha reliabilities ranged from .77 for aggressiveness to .83 for assertiveness items (passiveness .79 and manipulativeness .80). The instrument was also rated to have had high content validity by five former colleagues of the researcher at the University of Swaziland. In addition, interscale correlations were all negative and mostly low (aggression vs. assertiveness: rho (41) = - .111, p > .05; aggression / passiveness = - .356, p > .05; aggression / manipulativeness = - .044, p > .05). Aggression was thus different from assertion, passivity and manipulativeness.
Data AnalysisData were analysed in a variety of ways to meet the objectives of the study stated earlier. To describe the two samples adequately biodaata were analysed by descriptive statistics (frequencies, percentages, means and standard deviations. The teachers’ checklist of
65

behavioural problems thought to be prevalent in Swazi schools was scored by frequencies and percentages to determine the major problems. Spearman’s rank-order correlation (rho) was used to assess the relationship between the students’ demographic characteristics and aggression. This analysis was performed to identify variables that could be investigated in future in-depth studies for possible causal connections with aggression. Descriptive statistics (Mean, Mode, Median and standard deviation) were used to analyse the students’ aggression data. This analysis was conducted to give insights into the extent of aggression among the students as one whole group. After this, aggression data were put into three score intervals recommended by Townend (19944). Using cross tabulation, frequencies in each score interval were obtained per subsample or category of each demographic variable. This information enabled the researcher to compute chi-squares to find out if there were any significant differences in aggression between subsamples of students based on demographic variables. The justification for using the descriptive and nonparametric statistics (rho and x²) was based on three reasons. First, both samples were nonprobability. Second, nonprobability samples provide data sets that are distribution-free in terms of the statistical assumptions of normality and random errors. Third, only non-inferential statistics can be used to analyse non-random data.
ResultsAggressive behaviour in schools According to the teachers surveyed, there seems to be a considerable number of behaviour problems in Swazi primary and junior secondary schools (Table 1). Of the fourteen conduct disorders presented in the checklist, three (fighting, destructiveness, and bullying) are highly related to aggression. Among these three, fighting and bullying feature prominently as major problems.
Table 1Behavioral problems common in schools (N = 47)
Behaviour Frequency* Percentage*
Jealous 22 46Stealing 45 96Fighting 43 89Disruptive / hyperactive 37 79Attention-seeking 37 79Cheating / lying 47 100Drug abuse 27 57Destructive 17 36Sex offences 29 61Truant 30 64Complainants 24 51Bullying 44 93Smoking 29 61Gambling 14 29* Non-additive frequencies and percentages.
Relationship between aggression and demographic variablesThe literature reviewed in this study revealed that behaviour problems are caused by many factors. In some cases, factors interact to cause a single or multiplicity of behaviour disorders. From eight biographical variables used in this study, only one (type of school attended) was found to be significantly associated with aggression (Table 2). The connection is however inverse and being a correlation no cause and effect are implied at this stage. Only one variable (guardians) neared significance at the .05 level.
Table 2Relationship between aggression and selected demographic characteristics (N = 300)
Variable rho
Gender .112
66
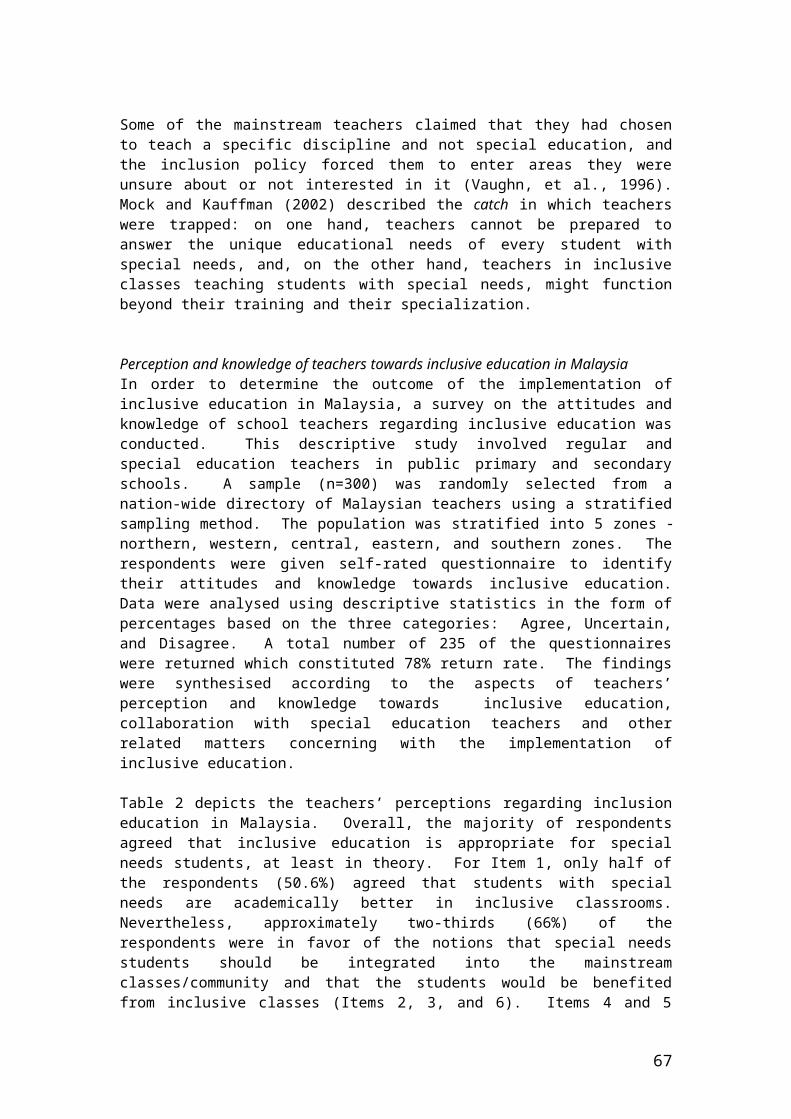
Age .087Location of school attended .014Type of school attended . 196־ **Region of origin .076Guardians .045Practicing religion .060
Level of education enrolled .027 . ** P < .01 (two tailed)
Amount and extent of student aggressionThe study did not find much evidence of severe aggression in the students surveyed contrary to the views of the teacher sample. For instance there were only few students in the 14-20 (severe aggression) score interval and the largest aggression score was only 16 rather than 20, the highest possible maximum (Table 3). The distribution of aggression scores was approximately normal as indicated by central tendency measures. Despite this there was a large number of students in the mild-to-moderate range of the scale (7-13 score band) who were potentially aggressive. The commonest score (mode) fell in this range.
Table 3Analysis of Student Aggression scores (N = 300)
Attribute Score Frequency* Percentage*
Lowest aggression score 1.00 1 0.30Highest aggression score 16.00 2 0.70Mean 9.00 23 8.00 Mode 8.00 37 12.30Median 8.00 37 12.30Little or no aggression 0-6 80 26.70Mild to moderate aggression 7-13 202 67.30Severe to profound aggression 14-20 18 6.00
* Non-additive frequencies and percentages
Differences in aggression between various subsamplesIn terms of the aggression categories recommended by Townend (1994) two points were noted. First, there were a few students with severe aggressive behaviours (14-20 score range) in all the subgroups (see Table 4). Second, there were more students with moderate aggressive behaviours (7-13 score range) among the males, in 16-20 year-olds, in urban schools, in government schools, at junior secondary school level, in students who stay with both parents, and among those who claimed to be practicing religion. Significant differences in aggression between various categories of students were, however, obtained on only two variables: location of the schools attended and the students’ guardians (Table 4).
Table 4Differences in aggression between various groups (N = 300)
Variable Group (n) Frequencies in Score Categories 0-6 7-13 14-20
Chisquare (df)
Gender Males (150)Females (150)
37 103 10 43 99 8
0.75 (2)
Age 10-15 years (140)16-20 years (160)
41 88 11 39 114 7
2.97 (2)
Location of School Rural (170)Urban (130)
46 110 14 34 94 4
3.69 (2)
Type of School Government (165) 32 117 16 18.16**
67

Church / Mission (86)Private (49)
33 51 2 15 34 10 (4)
Level of education Upper Primary (123)Junior secondary (177)
38 77 8 42 125 10
2.18 (2)
Region of origin Hhohho (119)Manzini (96)Shiselweni (10)Lubombo (75)
39 77 3 19 69 8 2 7 1 20 49 6
8.04
(6)
Guardian(s) Both parents (135)
Father (27)Mother (90)Grand parent(s) (36)Other people (12)
41 86 8 3 19 5 27 61 2 6 27 3 3 9 0
15.85*
(8)
Practicing religion Yes (237) No (63)
65 159 13 15 43 5
0.75 (2)
* p < .05** P < .01
Control of student behaviour problems in schoolsSwazi teachers appear to use a variety of techniques to address behaviour problems in schools. A representative list of some of the strategies employed is presented in Table 5. Unfortunately punishment, an aversive or negative reinforcement that is supposed to be used sparingly and as a last resort, is overused. The more desirable procedures of discussing the problem with the student, parents, and school counsellor (in form of counselling and guidance) are underutilised. One of the factors contributing to this problem is that schools lack trained and experienced counsellors / school psychologists to help with the management of behavioural cases especially aggressives.
Table 5Teacher strategies to behaviour management (N = 47)
Action(Percentage*) Frequency* Ignore the problematic student (25) 12 Refer the student to the headteacher (71) 33 Discuss the problem with the student (43) 20 Punish the student (93) 44 Discuss the problem with the parent(s) (54) 25 Discuss with the school counsellor (7) 3 *Non-additive frequencies and percentages.
Discussion The list of behavioural problems used in the checklist for this study represented mainly physical conduct disorders. Only two (cheating / lying and complaining) were nonphysical. There are probably more different types and categories of behaviour problems in Swazi schools (both physical and nonverbal). Future research can identify additional behavioural disabilities particularly the nonverbal and nonphysical types.
A significant relationship between aggression and the demographic variables used was obtained by correlation on the type of school attended. Apart from age, the rest of the variables were categorical. It is possible the variables might be related to aggression interactively. Further research could use more sophisticated statistical procedures such as multiple regression analysis to probe the joint relationship of two or more of these variables to aggression. Variables such as the type of school attended that are identified to be highly related to aggression should be investigated for both statistical and practical significance. The latter would be insightful in determining the causes of aggression and the effects of such aggression in schools. More in-depth qualitative research should investigate the reasons why
68

there are more students with moderate to severe aggressive tendencies in government schools (X² (df = 4) = 18.16, p < .01) and in families with both biological parents (X² (df = 8) = 15.85, p <. 05).
The number of students with moderate to severe aggressive inclinations should also be a source of concern to both Swazi teachers and school authorities because of the disruptive effects that aggression can have on educational processes. This finding calls for teacher education (both inservice and preservice) to address aggression with a long-term solution. Current teacher reliance on punishment to solve behavioural problems in schools is unsatisfactory for two main reasons. First, previous research in the literature indicates that punishment does not have a durable or long- lasting effect. Second, punishment is only effective if administered soon after the misconduct / offense and when the reasons for its application are properly explained to the recipient at the time of using it. Third, punishment may aggravate the aggression problem due to the effects of conditioning.
ConclusionAccording to evidence emerging from this study there are student behaviour problems of many kinds in Swazi schools. Aggression is one of the potential major problems. The study recommends that more detailed investigations, both quantitative and qualitative, be conducted to gain deeper perceptions into the nature of the problem, its possible causes, and solutions that are likely to be most effective in addressing it. An enhancement of teacher skills in handling behaviourally aggressive cases needs to be given high consideration and priority by relevant authorities in the present circumstance. Teachers ought to use approved forms of punishment sparingly as a last resort. Research indicates that punishment does not have a long-term effect and it tends to worsen the undesirable behaviour rather than reduce or eliminate it.
ReferencesAry, D. V., Duncan, T. E., Biglan, A., Metzler, C. W., Noell, J.W. & Smolkowski, K. (1999) Development of adolescent problem behaviour, Journal of Abnormal Child Psychology, 27 (92), 141-153.Carlson, N. R. (1987) Psychology: science of behaviour (Boston, Allyn & Bacon).Central Statistical Office. (2000) 1997 Census statistics (Mbabane, Government Printer).Christie, G. & Christie, C. (1999). Reducing and preventing violence in schools. Paper presented at the Australian Institute of Criminology Conference. Available online at: http://www.peacebuilderoz.com/papers/june99.html. (accessed 12 September 2003).Conger, R.D., Neppl, T., Kim, K. J. & Scaramella, C. (2003) Angry and aggressive behaviour across three generations: a prospective longitudinal study of parents and children, Journal of Abnormal Child Psychology, 31(2), 143-162.Craig, G. J. (1980) Human development (London, Prentice-Hall).Ezam, R. (2003) Teen girl jailed for false testimony. Borneo Bulletin, page 4, May 22.
Glick, B. (1996) Aggression replacement training in children and adolescents, in: Hatherleigh guide to child and adolescent therapy (New York, Hatherleigh Press).Humphreys, A.P. & Smith, P.K. (1984) Rough-and –tumble in preschool and playground, in: P. K Smith (Ed.) Play in animals and humans (Oxford, Basil Blackwell).James, O. (1995) Juvenile violence in a winner-looser culture (London, Free Association Books).Lefrancois, G.R. (2001) Of children - an introduction to child and adolescent development (Wadsworth, Thomson Learning).Matlin, M.W. (1998) Psychology (New York, Wadsworth).Mussen, P. H., Conger, J.J., Kagan, J. & Huston, A.C. (1984) Child development and personality (New York, Harper & Row).Nicolson, D. & Ayers, H. (1987) Adolescent problems (London, David Fulton Publisher).Olweus, D. (1993) Bullying at school (Oxford: Blackwell).
69
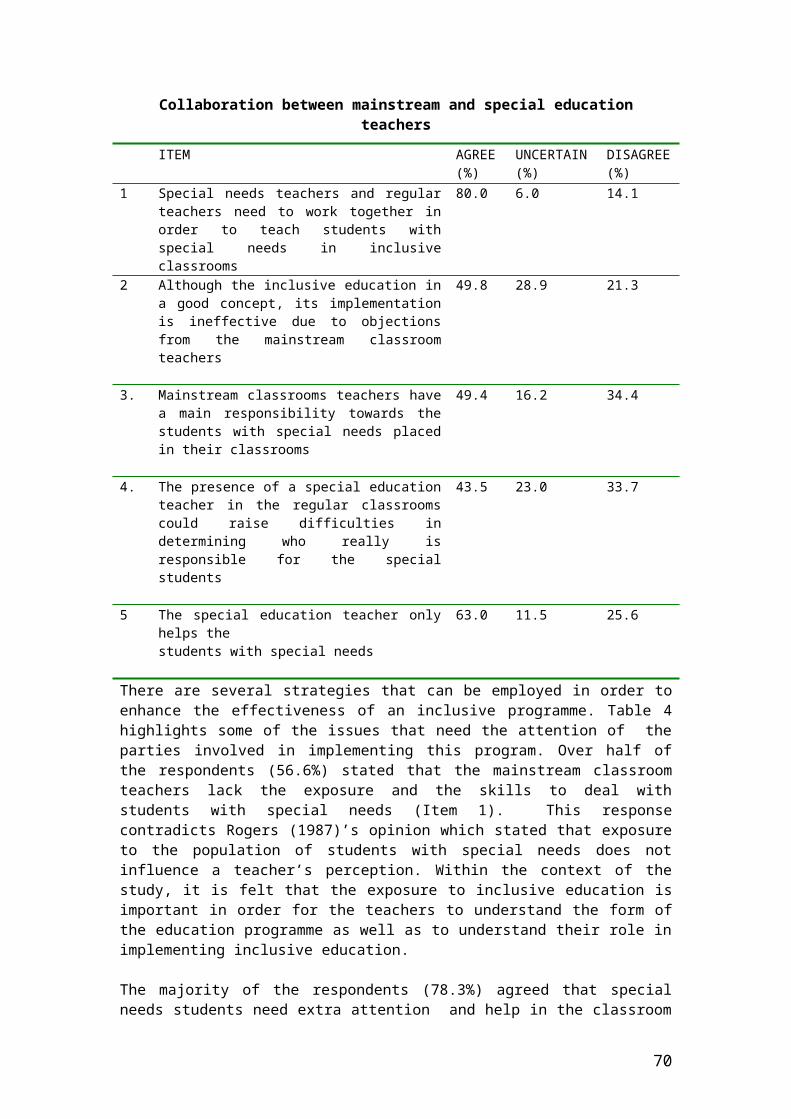
Salvin, R. E. 91994) Educational psychology: theory and practice (London, Allyn and Bacon).Sdorow, L. M. (1995) Psychology (New York, Brown and Benchmark).Shaffer, D. R. (2002) Developmental psychology: childhood and adolescence (Wadsworth, Thomson Learning).Townend, A. (1994) Developing Assertiveness (London, Routledge).
EVALUATION OF TURKISH HEARING IMPAIRED STUDENTS’ READING COMPREHENSION WITH THE MISCUE ANALYSIS INVENTORY
Ümit Girgin Anadolu University.
The purpose of the current study is to evaluate the reading comprehension of hearing impaired 8th graders who are being trained through an
70

auditory-oral approach. The evaluation is conducted through miscue analysis using complex stories. To realize this aim, the following research questions are formulated. (1) To what extent do hearing impaired K-8 students use the language cue systems (i.e. syntax, semantics and graphophnonics) during reading. (2) What is their reading comprehension level? (3) Is there a consistency between the mistakes they make and their reading comprehension levels?Ten severe to profoundly hearing impaired secondary students who are at the Research and Education Center for Children with Hearing Impairment (i.e. İÇEM) at Anadolu University participated in the current descriptive study. Since there is not any ready reading inventory in Turkey, stories with different levels along with retelling, question-answer and fill-in-the-blanks forms regarding those stories were prepared. Results suggest that when hearing impaired students read a story at their instructional level, they do use their knowledge of syntax, semantics and graphophnonics, they understand what they read and there is a consistency between the mistakes they make and their reading comprehension.
In reading education, the expertise of teachers of the reading process is as important as students’ background knowledge and proficiency in reading. Readers comprehend what they read using their background knowledge and reading skills. They need to decipher and understand the written materials using these skills and knowledge. It is necessary for teachers to evaluate the texts that are deciphered and comprehended by the readers so that they can develop students’ insufficient strategies in reading comprehension.
Reading can be defined in several ways. Among those definitions, different aspects of reading are listed such as speaking out all words given on a page or interacting with the text to construct meaning. Reading comprehension is the process of combining the cue systems of the language, namely, syntax, semantics, pragmatics and graphophnonics with the prior knowledge and experiences. If readers have a purpose to read and if the material interests them, they involve their background knowledge in the process, too, which facilitates reading comprehension. Previous research particularly emphasizes that reading comprehension is an active and interactive process between the readers and the written materials in which readers attribute meanings to the text through their background knowledge (Goodman, 1995; Lewis & Wray, 2000; Rasinski & Padak, 2004; Zwiers, 2004).
Goodman, Watson and Burke (1987), define reading as the process of problem solving and meaning construction. Readers construct meaning while they are thinking about what the author tries to tell. During this construction, they use their language, their thoughts and their background knowledge. In order to develop the crucial elements of reading comprehension, namely decoding and understanding, reading strategies should be taught in a specific sequence and these strategies should later be combined so that the comprehension process is realized. Within time, the notion of literacy has changed, that is, simultaneous development of reading strategies and the gains readers get through interacting with the texts are given more importance. In order to get a clearer picture of this new literacy concept in both general and special education, which focuses not only decoding the text but also comprehending it, the necessity to revise the education and evaluation in classes arose (Chaleff & Ritler, 2001; Ewoldt, 1981; Schirmer, 2000).
In teaching and developing reading, it is important to evaluate every single student constantly in order to assist them during their meaning construction process more effectively (Miller, 2001). This application has an additional importance for teachers working with hearing impaired children because of the difference in the language development process of the hearing impaired students, hearing loss and poor academic achievement they demonstrate (Paul, 1998).
71

Research revealed that hearing impaired children’s knowledge of language is not same as their hearing peers. Thus, students who have serious hearing problems or who have impaired hearing at the pre-acquisition stage of language confront with problems while they are learning to read (Girgin, 1999; Paul, 1997; Quigley & Paul, 1985). However, previous research revealed that hearing impaired children employ the same reading skills and strategies as their hearing peers (Moog & Geers, 1985; Schirmer, 2000). In reading evaluation, miscue analysis is used to evaluate students’ oral reading mistakes. Using miscue analysis plays a crucial role in determining and developing reading strategies regarding reading comprehension. Informal reading inventories which contain different levels of texts are used in order to conduct the miscue analysis.
Miscue AnalysisIn the United States, Kenneth Goodman, Yetta M. Goodman and Carolyn Burke investigated children’s first years of literacy in the 1970s and developed the miscue analysis for reading evaluation. In miscue analysis, the idea is to observe children interacting with the text and evaluate what they do (Goodman et al., 1987; Goodman, 1995).
Miscue is the word read differently from its original from during oral reading including reading words that are not in the text, not reading words that are in the text, skipping words, replacing the words in the text with other words. It is emphasized that miscues done during oral reading are done during silent reading as well (Goodman, 1995). No matter how proficient they are, all readers can make mistakes. There are two basic principles in miscue analysis. First, all readers make mistakes and these differences in reading are not always wrong. Second, miscues give us information about readers’ prior knowledge, past experiences, undertakings to construct meaning from the text and active reading strategies they use (Davenport, 2002; Rasinski, 2003).
Miscues made during oral reading give important information about readers’ thinking and use of the language’s cue systems. These systems help readers understand how reading is realized and control the meaning construction process through asking questions while reading (Goodman, 1995). The cue systems of the language employed by readers are explained below.Syntax: is a system regarding the structure of the language and involves the grammatical rules along with the information about sequencing words in order to construct meaningful sentences. When readers read a sentence, they think whether that sentence carries the characteristics of a sentence concordant with the rules peculiar to the language (Davenport, 2002; Goodman et al., 1987).
Semantics: is the meaning system of the language and provides information about the meanings of words, phrases and sentences along with the ways those meanings can change in different situations. When readers read a sentence, they think whether the sentence carry a meaning (Davenport, 2002; Goodman et al., 1987).
Pragmatics: This system involves the language which is accepted and expected in specific situations, or the language that should be used in line with the social rules. When readers read a sentence, they think about what to say in that specific situation or environment (Davenport, 2002; Goodman et al., 1987)
Graphophnonics: This system involves information about the relationship between the letters, sounds of those letters and the form of the letter sequences in words. Readers think how letters and sounds of letters help in choosing the meaningful word to construct a meaningful speech unit. (Davenport, 2002; Goodman et al., 1987)
It is necessary and crucial that readers focus on the meaning of the text. In order to realize this, all cue systems should process in harmony and provide readers with information in a
72
balanced way. The harmonious processing of those systems can be explained with the following example. In a story called Yasemin is at the Pastry-Shop, the events of Yasemin’s going to the pastry shop, buying some pastry, and having an accident are reported. In such a story, when the readers do not understand the word package in a statement in the story, Uncle Hakkı helped the little girl package the pastries, they involve in the following processes: (1) When the readers confront with a word they do not know such as package they work out the necessary information from the text and make guesses using the graphophnonics system. (2) Readers’ syntax helps them guess which words can be suitable for this particular sentence. Readers think that there is a noun after the word they do not know, so it can be a verb. However, this operation is not done consciously. Readers, as natural and proficient speakers, make improvisations without saying anything about these operations using their information on grammatical rules. (3) Semantics help readers select words by checking other words within the statement and relating them to the subject of the story. Thus, the word to be used before the pastries is guessed. Guesses could be like eat; sell or package. (4) Pragmatics narrows down the choices made by the reader in accordance with the content of the story along with the social status of the characters. What can Uncle Hakkı do to help the little girl? Put the pastries in a basket; package them,; cut them, etc. (5) The graphophonics system is used again and the first letter of the word is checked, then the visual information is controlled again. Among the selections that are narrowed down, the most appropriate one is chosen. Readers can use everything they know from the beginning of the story, check the letters and can understand that the word is not eat or sell but package. All decisions are made simultaneously within a short span of time. Readers use the strategies of confirmation, inference and guessing along with the cue systems of the language. The decision comes out itself and appears all of a sudden (Davenport, 2002).
Evaluation of miscues made during oral reading helps researchers observe all these operations occurring in readers’ minds and understand the strategies readers employ to construct the meaning. These miscues are generally an internal part of meaning construction process from the text. In miscue analysis, children are observed while they are interacting with the text and an inventory of their mistakes is prepared. Through observation of these mistakes, children’s syntax, semantics, pragmatics and graphophonics knowledge is determined. Besides, their skills and strategies regarding their comprehension of what they read are determined through the procedure of retelling, question-and-answers and fill-in-the-blanks activities. Standardized tests concentrate on the products of reading whilst miscue analysis examines the active meaning construction process employed by readers to work out the meaning (Goodman, 1995). Thus, the reading needs of learners at any age can be determined. Important oral reading miscues are as follows: Replacing a word with something else (substitution), adding a new word (addition), skipping a word or phrase (omission), correcting a mistake while reading (correction), repeating the word or phrase (repetition) (Goodman, 1995; Goodman et al., 1987).
Informal Reading InventoryMiscue analysis can be used in all types of reading methods. Students’ development at all levels from beginners to advance can be observed and determined (Shanker & Ekwall, 2000). In order to observe students’ development, it is important to choose reading materials suitable for their levels. Previous research suggests that in miscue analysis, students’ strategies are mostly determined using reading materials at their instructional levels (Chaleff & Ritter, 2001; Paul, 1998; Wilhelm, 2001). In order to evaluate students’ in terms of the reading materials in line with their instructional levels, ready informal reading inventories can be used or a new reading inventory can be developed by the teacher.
In the informal reading inventory, students’ reading comprehension knowledge is scrutinized through registering qualitative and quantitative data whilst they are retelling what they read, answering the questions and filling in the blanks in the reading material. Evaluations are
73
diagnostic since reading inventories are generated in order to meet the needs of each student. Thus observations cannot be compared with each other. The most important characteristic of the informal reading inventory is that they are based on observations and they provide information about the cognitive characteristics of the readers. Therefore, collected data is valid for a single student whilst it is not useful to comment on the performance of other students. Another reason to use reading inventories is to document the reading developments of students. These inventories are teacher-controlled and child-centered. They provide useful information to teachers about students’ developments and give parents information about the students’ achievement levels and necessary skills to develop them (Gillet & Temple, 1990; Miller, 2001). Many informal reading inventories provide ready word lists, questions and answers to control reading comprehension, forms for student stories based on reading and fill-in-the blanks forms that are suitable for different levels from pre-school to 8th grade.
Preparation of Informal Reading InventoriesDevelopment of informal reading inventories involves two phases. First, the material in the inventory is developed. In this phase, reading materials are selected, reading comprehension questions and answers are developed, the evaluation form for the retelling procedure is generated and fill-in-the-blanks papers for each text are prepared. In the second phase, the material is piloted and applied.
In teacher-made informal reading inventories, texts can be selected from story books or texts similar to those used in the school. Texts in published inventories are either selected from story books or prepared particularly for the tests. Selecting and using the same stories or texts used in the classroom can interfere with the evaluation of students and mislead teachers in understanding students’ development of reading strategies (Gillet & Temple, 1990).
While conducting the miscue analysis, what is criticized most is the selection of the texts. The purpose of selecting texts is to use a reading material which is suitable for students’ instructional level so that students can read them fluently and understand it using self-guiding and correction strategies (Jensama, 1980; LaSasso & Swaiko, 1983; Paris, 2002). For instance, a reading material which is assumed to be easy for a student can be difficult to him when the subject matter is fishing. This is because a student who is not living by the sea or who does not have experience in fishing can have problems in understanding the terminology in an unfamiliar subject. Informal reading inventories should contain interesting, authentic, correct dialogs, descriptions and subjects students can recognize and understand. The text should constitute a whole in itself. It should not be an extract taken from the middle of a story.
Since instructors working with hearing impaired students cannot get sufficient information regarding the evaluation of students’ reading comprehension based on standardized norm-referenced tests (Jensema, 1980), they can acquire more information through the application of this child-centered evaluation approach to hearing impaired children. When the studies involving miscue analysis are examined, it is seen that there are few studies conducted with hearing impaired students. Ewoldt (1981) examined the reading process of four hearing impaired students with serious hearing loss aged between 7 and 17 who are being trained through the total communication approach. Students read 25 stories and were asked to tell the stories with American Sign Language (ASL). Besides, reading comprehension and fill-in-the-blanks exercises were conducted. It was found that hearing impaired students can understand what they read, have similar reading behaviors as their hearing peers and can use language cue systems (i.e. syntax, pragmatics, graphophonics) when they are given materials suitable for their current levels.
Chaleff and Ritter (2001) studied with hearing impaired students with serious hearing loss aged 5, 7 and 12 who were trained with the total communication approach. After determining students’ miscues, those miscues were reviewed working individually with each student and focusing on the reasons behind the miscues. It was found that hearing impaired students used
74
language cue systems; however, their reading comprehension skills were worse than their peers. Reading process of hearing impaired students who were trained through auditory-oral approach was not evaluated through the miscue analysis. In Turkey, reading evaluation of hearing and hearing impaired students through miscue analysis was not conducted yet. Besides, there is not any informal reading inventory generated for either intact or hearing impaired students. However, reading comprehension has been examined through the retelling procedure (Girgin, 1999) and question-answer method (Akçamete, 1999; Girgin, 1987; İçden, 2003; Tüfekçioğlu, 1992).
This study is conducted in order to meet the need for the development of a reading evaluation material, selection of the type and basic characteristics of stories for inclusion in the material, application of those stories and interpretation of the results. Reading development and strategies of 8th graders are determined through the miscue analysis involving reading comprehension, question-and-answer and fill-in-the-blanks using complex stories organized in accordance with students’ reading levels. The reason to choose 8 th graders is to evaluate the reading comprehension strategies of students who have been trained with auditory-oral approach since 3 year-old, to determine their reading development levels, to understand the contribution of the education they receive and to determine what should be done in further Turkish courses they are going to take. Besides, it is hoped that sharing the findings with the families will enlighten their parents for their further educational decisions.
The purpose of the current study is to evaluate the reading comprehension of 8 th graders, who are being trained through auditory-oral approach, by using complex stories and the miscue analysis. The research questions are as follows
1- To what extent do hearing impaired 8th graders use the language cue systems (i.e. syntax, semantics and graphophnonics)?
2- What is their reading comprehension level?3- Is there a consistency between the miscues they make and their reading
comprehension?
Method and ProceduresParticipantsThe current descriptive study is conducted with 10 students studying in the Research and Preschool Education Center for Children with Hearing Impairment at Anadolu University (i.e. İÇEM). İÇEM is an educational institution, where hearing impaired children are diagnosed at an early age and trained during daytime through auditory-oral. Data were collected in May 2005. The demographic information regarding participants is provided in Table 1.
Table 1Demographic information of the participants
Participant ID Date of Birth* Gender Hearing Loss (dB)1 February 21, 1990 Female 1082 April 1, 1990 Female 963 May 28, 1990 Male 1034 June 8, 1990 Male 1145 September 9, 1990 Male 896 October 5, 1990 Female 1007 October 24, 1990 Male 898 November 29, 1990 Male 1009 December 1, 1990 Male 10710 June 28, 1991 Male 90
*Participants’ dates of birth are chronologically ordered.
75
Except for the 2nd participant, all students were diagnosed at the İÇEM audiology clinics and fitted with proper hearing aids. Their families had got parent guidance three years. They started the nursery school of İÇEM at the age of four and received education for there years through İÇEM and at the same time their parents went on parent guidance program. When they are 6, they started elementary school at İÇEM and finished K-8 in 2005. The 2nd student in Table 1 was diagnosed at İÇEM and her/his parent had got parent guidance to; however, she did not get training at İÇEM’s nursery school. She/he got her/his education in the integration classes till the 5th grade. She/he went on her/his education 6th through 8th grades at İÇEM. Besides, the 1st student received cochlear implant after the 6 th grade. None of the students had a second physical handicap and none of their parents was hearing impaired.
Data CollectionDetermining the Stories and their LevelsSince there is not any ready informal reading inventory in Turkey, texts at different levels used in the study, reading comprehension, question-answer and fill-in-the-blanks forms used were prepared by the researcher. It is emphasized that texts used in the miscue analysis should be prepared in terms of three levels namely, independence, instruction and frustration. Besides, it is important that texts should contain interesting and authentic dialogues, correct descriptions and subject-matters, and characters that are understandable and familiar to children (LaSasso & Swaiko, 1983; Paris & Carpenter, 2003; Woods & Moe, 1989). Therefore, texts that are familiar, appropriate, interesting and likeable were selected through screening elementary school Turkish course-books and through asking elementary school Turkish teachers to get expert opinion. According to teachers, students read complex stories. Complex grammatical structures, words, idioms and concepts were reviewed, and unfamiliar items, statements and words were revised. During these revisions, it was considered that short texts reduce the chance of working out the meaning from the clues whilst long texts place a burden on students’ memories (LaSasso & Swaiko, 1983). The titles of the stories were as follows: At the Zoo, The Child and the Tree, The Lost Bag, and The Heron.
Complex stories have different characters experiencing a couple of problems, a large number of solutions for the problems, and a large number of suggestions made as solutions (Gillet & Temple, 1990; Hughes, Mc Gillivary, & Schmidek, 1997). The integrity of the selected stories was determined in accordance with the grammars of the stories. Thus, contexts of the stories (i.e. time, place, and characters), problems, reactions, scenarios, interferences, the results of the interferences, and results statements were determined (Gillet & Temple, 1990). After determining these statements, a consensus between independent raters was reached in order to increase reliability. The reliability was calculated through dividing the number of identical ideas to the sum of identical and different ideas and multiplying the result by 100 (Tekin & Kırcaali-İftar, 2001). All reliability indices in this study were calculated through this formula. The reliability indices of the consensus between the raters for four stories, namely, At the Zoo, The Child and the Tree, The Lost Bag and The Heron were 82 %, 80, 82 % and 92 % successively.
In order to determine the difficulty level of the stories, the average lengths of the T-units are examined. T-unit refers to every single main clause and all other subordinate clauses related to that main clause (Hughes et al., 1997). The T-units in the stories were determined first. Then, the reliability indices for the consensus between the raters were calculated, which were, 82 % for At the Zoo, 80 % for The Child and the Tree, 82 % for The Lost Bag and 84 % for The Heron. The average lengths of the T-units were calculated through dividing the total number of words in a story to the number of T-units. If the average lengths of the T-units increase, the complexity of the story increases as well (Hughes et al., 1997). Table 2 provides the average lengths of the T-units.
Table 2The average lengths of T-units in the stories
76

Name of the Story Total Number of words
Total Number of T-units
Average lengths of T-units
At the Zoo 227 31 7The Child and the Tree
253 35 7
The Lost Bag 324 38 8,5The Heron 265 26 10
When Table 2 is examined, it is observed that At the Zoo and The Child and the Tree are at the simple level, The Lost Bag is at the instructional level and The Heron is at the frustration level. In order to determine the difficulty of the stories, subordinate clause index was calculated as well. The subordinate clause index was found through dividing the total number of clauses to the total number of t-units. The result of the division is always higher than 1.0 since every T-unit has at least one clause. If the result digresses from 1.0, the difficulty of the statements increases as well (Hughes et al., 1997). Table 3 provides the subordinate clause indices of the stories.
Table 3 Subordinate clause indices of the stories
Name of the Story Total Number of Clauses
Total Number of T-units
Subordinate Clause Index
At the Zoo 70 31 2,25The Child and the Tree
82 35 2,34
The Lost Bag 85 38 2,23*The Heron 79 26 3,10
When the subordinate clause indices are examined, it can be observed that the subordinate clause index of The Lost Bag is smaller than that of The Child and the Tree. However, in order to determine the difficulty of a story, it is important to conduct further analyses. One of those analyses is to concentrate on different words. Stories that do not repeat the same words and use different words are more difficult. To determine the word difference, all words are counted within a story. When a word occurs again, it is not counted as a different word. To count a word as different, it should occur in the text for the first time. To find the words’ difference index, the total number of different words in the story is divided by the square root of twice the total number of words (Type-token ratio). (Woods & Moe, 1989; 13). Table 4 provides the difference indices of the stories.
Table 4Difference indices of the stories
Name of the Story Total Number of Words
Total Number of Different Words
Words’ Difference Index
At the Zoo 227 165 7,7The Child and the Tree
253 171 7,6
The Lost Bag 324 228 8,9The Heron 265 223 9,6
According to Table 4, the first two stories are at the independent level, the third one is at the instructional level and the last one is at the frustration level. After examining the text difficulty of the stories, retelling forms for each story were developed. The retelling form was developed in accordance with that of Ewoldt (in Thackwell, 1992). This form was comprised of three sections. In the first section, characters in the story were written and graded in accordance with their importance total score being 25 points. In the second section, important
77

events were written, each event was graded and a total of 50 points was given. In the third section, details in the story were written, each detail was graded and a total of 25 points was given. After the retelling forms were prepared by the researcher, a consensus between independent raters was reached for reliability. The reliability indices were 80 % for At the Zoo, 81 % for The Child and the Tree, 81 % for The Lost Bag and 84 % for The Heron.
While preparing the questions and answers, three types of questions were asked. Questions that had an identical answer within the text, questions that did not have an identical answer but could be inferred from what is within the text, and finally questions that required children to integrate their experiences with the information provided in the text to answer the questions (Miller, 2001). A total of 10 questions were asked four of them having identical answers, four being inference questions and two requiring children to use their background knowledge along with the information provided in the text. Each question was worth 10 points. The reliability indices of all stories in terms of the questions and answers were 100 %.
While preparing the fill-in-the-blanks papers, every 5th word were deleted from the text (LaSasso, 1980). The first two sentences in the first paragraph and the last two sentences in the last paragraph were left intact so that they could provide clues to students. While deleting every 5th word, the next or the previous words was chosen whenever the same word occurred as the 5th word. Students were expected to fill in the blanks with the exact words occurred in the story. However, when they wrote a meaningful and suitable word which did not change the meaning of the sentence, the response was accepted (Thackwell, 1992). This procedure measures the readers’ skills to work out the meaning regarding the whole story and to guess the statement structure (Miller, 2001; Thackwell, 1992). Before the stories were developed and the data were collected, the stories were piloted with four 6 th, 7th and 8th graders who did not have a hearing impairment along with five hearing impaired 7 th graders who did not participate in the study. This process elaborated the process of application.
ApplicationApplications are conducted through working with each student individually. Data were collected by experienced researcher in terms of working with the hearing impaired in a soundproof room. While collecting data, according to students’ reading proficiency levels, 40 to 60 minutes were given to students for reading, filling in the blanks, reading comprehension and answering the questions. Students who asked for extra time were given an additional 10 minutes. In order to make the application more effective, the followings were taken into account: (1) While determining the story to be read by students, they were asked to start from the story which was supposed to be at their instructional levels. In order not to give clues to the students, the fill-in-the-blanks forms were given before they were exposed to oral reading and they were asked to read the story silently and fill in the blanks. When students asked for help while filling in the blanks, they were not supported but encouraged to reread and review the story from the very beginning to the end (Thackwell, 1992). (2) After the fill-in-the-blanks part was over, oral reading started. A copy of the story was used by the researcher to follow the reading of students so that she could check the miscues (Davenport, 2002). (3) After the oral reading, students were asked to retell what they had read. Students were not asked questions while reading; however, they were encouraged with statements such as What happened next?; Good for you!; Proceed, please! If students could not retell what they read, a lower level of story was selected supposing that the level of the story was hard for them. (4) After retelling procedure, question-and-answer section was applied. Students’ answers were taken down by the researcher. Whenever students did not understand a question, the question was repeated and every single thing student said was documented. The whole procedure was video-recorded to sustain the objectivity of the data. For each student, a dataset was generated containing miscues during oral reading, reading comprehension, question-and-answer and fill-in-the blanks. The analysis of this dataset is explained below.
78
Data AnalysisIn order to answer the first research question, that is, to determine the extent to which students use syntax, semantics and graphophnonics, an inventory of their miscues was prepared. Statements within the story were numbered (i.e. 1st sentence, 2nd sentence) and double-checked through watching the video-recordings. After determining the miscues, they were examined to see whether they violate the syntax, semantics, and intended meaning of the statement. Besides it was also checked whether there was a similarity in terms of graphophnonics between the words students produced and the actual words occurring in the text. Percentages were calculated for above indices.
Before calculating the percentages; (a) it was checked whether each miscue violated the syntactic correctness of the statement or not. If it did not change the syntax for the worse, or if the syntactic structure of the statement was still all right after the miscue, the statement correctness column was marked with yes.
(b) It was checked whether the statement carried a meaning after the miscue. If it carried a meaning, the semantic correctness column was marked with yes. For instance, while reading the 7th sentence of The Heron, Şu gölde nesilleri kuruyacak (i.e. their generation will become extinct in this lake), the 7th student read the word nesilleri (i.e. their generation) as nesleri. Even though he said a pseudo word rather than nesilleri the rules of syntax were not violated. However, the sentence was turned into Şu gölde nesleri kuruyacak (i.e. their nesleri will become extinct in this lake). When the sentence was examined to see whether it still had a meaning, it was observed that it had a meaning even thought a nonsense word was used. However, what would become extinct was uncertain. Thus, the column labeled does it have a meaning was marked with yes.
(c) It was checked whether the miscue, the word nesleri, violated the actual intended meaning of the author. The author tries to explain that the heron generation will become extinct. With the miscue, the intended meaning was replaced with a defective meaning. Thus, the cell regarding whether the miscue changed the actual intended meaning of the statement was marked with yes with a comment partially changed the intended meaning.
(d) The similarity of graphophonics between the uttered word and the actual word was checked. If there were differences involving just one or two letters, the words were considered highly similar. If the differences involved two or three letters, the words were considered moderately similar. Finally, if there were more differences, there were no similarities column was marked (Davenport, 2002).
After asking above questions and marking relevant columns with either yes or no, the percentages of syntactic acceptability, semantic acceptability, and the possibility of changing the author’s intended meaning was calculated. In this calculation, the number of syntactically correct statements was divided by the number of total statements and multiplied by 100 to find the syntactic correctness percentage. Similarly, the number of semantically correct statements was divided by the number of total statements and multiplied by 100 to find the semantic correctness percentage. Finally, the number of statements whose meanings were changed was divided by the number of total statements and multiplied by 100 to find the meaning change percentage (Davenport, 2002).
While finding the percentages of graphophnonics similarities, deletions, additions, self-corrections and repetitions were not considered (Davenport, 2002). Letter and sound similarities were examined in cases of substitutions. In order to find the percentages, the number of letter-sound similarities in the miscues was calculated first. Within these miscues high letter-sound similarities were determined. The total number of high letter-sound similarities was divided by the total number of similarities and multiplied by 100 to determine
79
high letter-sound similarity. Similarly, the total number of moderate letter-sound similarities was divided by the total number of similarities and multiplied by 100 to determine moderate letter-sound similarity.
In order to answer the second research question (i.e. what is their reading comprehension level?), students’ scores on reading comprehension, question-and-answer and fill-in-the-blanks sections were calculated. To calculate the reading comprehension scores, video recordings were watched again. Expressed characters, basic events and details were marked and the scores were calculated on the reading comprehension evaluation from.
For the fill-in-the-blanks scores, words written in the blanks were examined under three headings. (1) Correct responses were determined to calculate fill-in-the-blanks point. When the students wrote the very same word in the story, this was accepted as a correct response and the total of those responses were written to the correct responses column.
(2) If students did not write the very same word while filling in the blanks, but wrote something that did not change the meaning of the statement, this response was accepted as correct as well. The total of these responses were written to the different but does not change the meaning column.
(3) Words that changed the meaning and that were wrong were determined, and the total of those words were written to the not correct, changes the meaning column. The number of correct responses was divided by the number of blanks and multiplied by 100 to find the correct response percentage. The percentages of the second and the third group were found via this method as well (Thackwell, 1992). The dataset belonging to 30 % of the students participated in the study was controlled by another expert in the field and the reliability between the raters was found as 100 %.
ResultsEach student participated in the study read the stories at an instructional level in which they could read fluently, correct their miscues, self-guide during reading and work out the intended meaning (Table 5)
Table 5 Stories read by the participants
Order Participant Name of the Story1 1st participant The Lost Bag2 2nd At the Zoo3 3rd The Heron4 4th At the Zoo5 5th The Lost Bag6 6th The Heron7 7th The Heron8 8th The Child and the Tree9 9th At the Zoo10 10th At the Zoo
When the stories read by the students are examined, it can be seen that that four students read “At the Zoo”, two students read “The Lost Bag”, three students read “The Heron”, and one student read “The Child and the Tree”.
80

The first question focusing on the extent to which hearing impaired 8 th graders use language cue systems (i.e. syntax, semantics and graphophonics) during reading was answered with percentages in Table 6.
Table 6 Percentages of students’ use of syntax, semantics and graphophonics
ParticipantName of the Story
Number of T-units
Syntactic Correctness
(%)
Semantic Correctness
(%)
Meaning Change
(%)
Letter-sound similarity (similarity of graphophonics)
(%)
7th participantThe Heron 26
100 96 96 100 high3rd participant 96 96 96 75 high / 25 moderate6th participant 100 100 88 100 high5th participant The Lost
Bag28
100 100 94 100 high1st participant 100 100 94 100 high2nd participant
At the Zoo 31100 90 87 85 high / 15 moderate
9th participant 96 96 90 50 high / 50 moderate4th participant 96 96 96 100 high10th participant 100 100 87 80 high / 20 moderate
8th participantThe Child and the Tree
3597 97 94 100 high
When Table 6 is examined, it can be seen that all students participated in this study could use the language cue systems (i.e. syntax, semantics and graphophonics) during instructional level story readings. The amount of miscues students made during reading changed the syntactic structure and meaning correctness at an extent between 96 % and 100 %.
In order to answer the second research question, in other words, to determine students’ reading comprehension levels, reading comprehension, question-and-answer and fill-in-the-blanks scores were examined. Reading comprehension scores of the students are provided in Table 7.
Table 7Reading comprehension scores of the students
Participant Name of the StoryCharacters (25 points)
Basic Events (50 points)
Details (25 points)
Total
7th participantThe Heron
25 43 20 883rd participant 25 38 8 716th participant 25 35 10 705th participant
The Lost Bag25 30 15 70
1st participant 25 45 18 882nd participant
At the Zoo
21 31 3 559th participant 24 34 3 614th participant 21 34 16 7110th participant 24 41 13 78
81
8th participantThe Child and the Tree
25 30 15 70
As the Table 7 indicates, except for the 2nd student, all students mentioned characters and received either 24 or 25 points on this part. While talking about the characters, the 2 nd student did not mention the turtle, the bird, the monkey, the rabbit, and Atatürk Forest and received 21. When the basic events are examined, it is observed that the 2 nd student got the lowest score (31 out of 50) again whilst the 7th student got the highest score (43 out of 50). When students’ points on details are examined, it is observed that the highest score was received by the 7th student whilst the lowest scores were received by the 2nd and 9th students. When the total scores are examined, it is observed that all scores were above 50, highest score belonging to the 7th student whilst the lowest one belonging to the 2nd student. Students’ question-and-answer scores are given in Table 8.
Table 8Students’ question-and-answer scores
ParticipantName of the Story
QUESTIONS
1 2 3 4 5 6 7 8 9 10 Total7th participant
The Heron
10 0 10 10 5 5 10 10 10 10 803rd participant 10 10 5 10 5 5 5 10 10 5 756th participant 5 10 0 10 5 10 10 5 10 10 755th participant The Lost
Bag10 10 10 5 5 10 0 10 10 10 80
1st participant 10 10 10 7,5 5 10 0 7,5 10 10 802nd participant
At the Zoo
0 0 7,5 10 0,5 5 5 5 10 10 609th participant 10 10 7,5 5 10 10 5 5 7,5 10 804th participant 10 5 7,5 10 7,5 5 10 0 10 10 7510th participant 10 10 7,5 5 5 10 7,5 5 10 10 80
8th participantThe Child and the Tree 5 10 10 5 10 5 0 7,5 5 10 70
When Table 8 is examined, it is seen that students answered the questions with direct and clear answers. However, the 7th student who read The Heron did not understand the 2nd
question, Why did the heron make a plan?, and could not give the answer He was too old to go fishing and understood that he would die, so he made a plan which was directly provided within the text. The 6th student did not understand the 3rd question, Why did the crab tell herons about the danger? Moreover, she did not understand the meaning of the statement Şu gölde nesilleri kuruyacak (i.e. their generation will become extinct in this lake). Even though she read the statement correctly, she inferred the meaning that the lake itself will become extinct. Thus she gave an answer like the lake is going to dry, fish must go somewhere, they should not disappear. However, the right answer was He understood that he would be hunted with the fish by the hunters.
All students understood the inference questions and answered them right except for a few of them. For instance, the 5th question in The Heron What was the heron’s plan should be answered like To cause fish to move and eat them while they are moving. The 7th student answered this question as He tells them to hide in a larger river; however, the fish does not know how to go there. So, he tells that he can carry them there in his mouth. However, he tells a lie, goes to the forest and eats them with pleasure. Since the student mentioned eating fish, he was given half a point. The 5th student answered the same question as To eat the fish, to eat the crab, eat them all and deceive them. Since he did not mention to cause the fish to move but just eating fish, he was given half a point as well.
82
The 5th student who read The Lost Bag had problems in answering the 7 th inference question Why did not Berk get upset about not finding his bag?, which should be answered as He was not upset, because he thought that the bag was in the class or he thought that he would find the bag in the class the next day. The 5th student answered this question as He was not aware that he forgot the bag in the class, so he did not get upset. The 1st student answered the very same question as Because Berk has another old bag. The answer was not correct.
All students correctly answered the questions that required children to integrate their experiences with the information provided in the text. When their scores are examined, it is observed that they got scores between 70 and 80. The fill-in-the-blanks scores of the students are provided in Table 9.
Table 9 Students’ fill-in-the blanks scores
ParticipantName of the Story
N of blanks
Correct Responses (%)
Different but do not change the meaning (%)
Different and change the meaning (%)
Correct Response + Differences that do not change the meaning (%)
7th participantThe Heron 43
20 47 18 42 5 11 38 893rd participant 12 28 15 35 16 37 27 636th participant 13 30 14 32 16 37 27 625th participant The Lost
Bag45
18 40 20 44 7 15 38 841st participant 21 47 17 37 7 15 38 842nd participant
At the Zoo 36
3 8 16 44 17 47 19 529th participant 5 14 19 52 12 33 24 664th participant 12 33 14 39 10 27 26 7210th participant 9 25 12 33 15 41 21 58
8th participantThe Child and the Tree
297 24 14 48 8 28 21 72
When students’ correct responses are examined, it is observed that the 7 th student got the highest score whilst the 2nd student got the lowest score. However, when the words that did not change the meaning were considered as correct, students all had percentile scores exceeding 50 %. For instance, the 9th student who read At the Zoo replaced the word first with the word all and the meaning slightly shifted from They first visited the nests to They visited all the animal nests. This did not violate the syntactic correctness and the meaning of the statement, so this response was considered correct. Moreover, he replaced the word monkeys with squirrels and the meaning shifted from.. they saw colorful birds, turtles, monkeys, to .. they saw colorful birds, turtles, squirrels, which did not violate the syntactic and semantic correctness of the statement, either. However, the same student replaced the word visited with blue which violated the meaningfulness of the statement and that statement was considered wrong.
To examine the last research question of the study (i.e. is there a consistency between the miscues they make and their reading comprehension?), their syntax, semantics, and graphophonics percentages were provided along with their reading comprehension, question-and-answer, and fill-in-the-blanks scores (Table 10)
Table 10Percentages of students’ use of syntax, semantics and graphophonics along with their
reading comprehension, question-answer and fill-in-the-blanks scores
83

When Table 10 is examined, it is seen that when students read a story at the instructional level, there occurred a consistency between their use of language cue systems (i.e. syntax, pragmatics, and graphophonics) and their reading comprehension, question-and-answer and fill-in-the-blanks scores.
Discussion and SuggestionsDetermining the miscues students make while reading do not completely explain their reading process (Hempenstall, 1999). However, it gives opportunities to evaluate their oral reading and meaning construction knowledge. This information is used to determine the objectives of reading education and to support students. Besides, it helps learners to evaluate themselves and have self-esteem (Chaleff ve Ritter, 2001).
Findings of the current study revealed that hearing impaired students trained through the auditory-aural approach could use the language cue systems (i.e. syntax, semantics, and graphophonics) when they read a story at the instructional level. This finding is in line with the findings of studies conducted with hearing impaired students (Ewoldt; 1981; Yurkowski & Ewoldt, 1986; Chaleff & Ritter, 2001). Similar to the current study, those studies emphasized that students should read stories at their current level that they can read fluently, correct and self-guide themselves while reading.
When students’ retelling scores were examined, it was observed that their scores on retelling were higher than 50 out of 100. Using Ewoldt’s retelling evaluation tool (in Thackwell, 1992), it can be stated that students use reading strategies efficiently, retell important events, understand the gist of the stories most of the time, retell the important figures along with the changes in those figures. When students’ question-answer scores were examined, it was seen that they could answer questions, which had direct and identical answers within the text whilst they were having problems with some of the inference questions. Based on their answers on the third type of question, it can be said that they can integrate their prior experiences with the information given in the text (İçden, 2003). When students’ responses in the fill-in-the-blanks activities were examined, which evaluated students’ knowledge on sentence structure, grammar and comprehension; it was seen that the percentage of writing the identical word in the story was quite low. Students could not remember some of the words in the story; however, they wrote different words that did not change the meaning of the statements, which were accepted correct (Thackwell, 1992). Students’ scores were 50 or higher. Thus, it can be stated that students remember important events and details in the story and they can use their knowledge regarding the sentence structure and grammar.
84

There was a consistency between the mistakes students made and their reading comprehension. They usually repeated the reading mistakes during retelling and answering the questions as well (Davenport, 2002).
Further research with these students who can use syntax, semantics and graphophonics should concentrate on their use of graphophonics knowledge, because most of the mistakes they made resulted from using suffixes. For example they said kaçını rather than kaçınızı, bekliyorlar rather than bekliyorlarmış. It should be emphasized in Turkish and grammar courses along with other courses where necessary that the whole word should be taken into account rather than the beginning of the words, since the suffixes can change the meaning of words or statements. Besides, students’ language use and reading comprehension should be further examined through individual and group studies evaluating their written and oral language. Because, students are likely to confront with difficulties in reading the structures of a language, whose written and oral forms are understood and used with difficulty.
When students’ reading scores were examined, it is observed that the 2nd student had lower scores. This reveals that the story she read (i.e. At the Zoo) was not at her instructional level. Including easier stories within the reading inventories is important to determine students’ exact reading proficiency levels and to sustain ideal instruction within the class. The fact that the 2nd student had lower scores in reading comprehension might be because of the training she has received, because she had training in the immersion class till the 6 th grade. Since the classes are too large at the elementary level in Turkey, it is quite difficulty to arrange the curriculum in line with the individual characteristics of the children. Thus, it can be said that students with serious hearing loss cannot attain experiences and skills necessary to improve their reading strategies. The reading curriculum should be developed and implemented based on the observations regarding students’ individual characteristics and achievement levels. Even though the miscue analysis is an evaluation method requiring a lot of time, it profoundly investigates students’ reading comprehension and reveals each student’s strengths and weaknesses. Thus, it accelerates the process of teaching reading strategies along with the development of language cue systems.
ReferencesAkçamete, G. (1999). Improving question skills for students with hearing impairment. The European Journal of Special Needs Education, 4(2), 171-77. Chaleff, C. D. & Ritter, M. H. (2001). The use of miscue analysis with deaf readers. The Reading Teacher, 55(2), 190-200.Davenport, M. R. (2002). Miscues not mistakes: Reading assessment in the classroom. Portsmouth: Heinemann.Ewoldt, C. (1978). Reading for the hearing or hearing impaired: A single process. American Annals of the Deaf, 945-48.Gennaoui, , M. & Chaleff, C. (2000). Miscue analysis for deaf readers. Odyssey. Gillet, J. W. & Temple, C. (1990). Understanding reading problems: Assessment and instruction (3rd ed.). Illinois: Scott, Foresman / Little, Brown Higher Education.Girgin, Ü. (1987). Doğal işitsel sözel yöntemle eğitim gören işitme engelli çocuklarda okumaanlama davranışının irdelenmesi. Yayımlanmamış yüksek lisans tezi, Anadolu Üniversitesi, Sosyal Bilimler Enstitüsü, Eskişehir.Girgin, Ü. (1999). Eskişehir ili ilkokulları 4 ve 5. sınıf işitme engelli öğrencilerinin okumayı öğrenme durumlarının çözümleme ve anlama düzeylerine göre değerlendirilmesi. Eskişehir: Anadolu Üniversitesi Eğitim Fakültesi Yayınları No: 62.Goodman, Y. M., Watson, D. J. & Burke, C. L. (1987). Reading miscue inventory:Alternative procedures. New York: Richard C. Owen Publishers Inc.Goodman, Y. M. (1995). Miscue analysis for classroom teachers: Some history and some procedures. Primary Voices K-6, 3(4), 2-9.Hempenstall, K. (1999). Miscue analysis: A critique. Effective School Practices 17(3), 87-93.
85
Hughes, D., Mc Gillivray, L. & Schmidek, M. (1997). Guide to narrative language: Procedures for assesment. Wisconsin: Thinking Publication.İçden, G. (2003). Üniversite hazırlık sınıfi işitme engelli öğrencilerinin okuma sonrası soruları yanıtlamalarında "soru yanıt ilişkileri" stratejisinin kullanımı.Yayımlanmamış yüksek lisans tezi, Anadolu Üniversitesi, Sosyal Bilimler Enstitüsü, Eskişehir.Jensema, C. (1980). Considerations in utilizing achievement tests for the hearing impaired. American Annals of the Deaf, 125(4), 495-98. LaSasso, C. (1980). The validity and reliability of the cloze procedure as a measure of Readability for prelingually, profoundly deaf students. American Annals of the Deaf, 125(5), 559-63.LaSasso, C. & Swaiko, M. A. (1983). Considerations in selecting and using commercially prepared informal reading inventories with deaf students. American Annals of the Deaf, 128(4), 449-452.Lewis, M. & Wray, D. (2000). Literacy in the secondary school. London: David Fulton Publishers.Miller, W. H. (2001). The reading teacher’s survival kit. San Francisco: Jossey-Bass.Moog, J. S & Geers, A. E. (1985). EPİC: A program to accelerate acedemic progress in profoundly hearing-impaired children. The Volta Review, 87, 259-277.Paris, S. G. (2002). Measuring children’s reading development using leveled texts. The Reading Teacher, 56(2), 168-70.Paris, S. G. & Carpenter, R. D. (2003). FAQs about IRIs. The Reading Teacher, 56(6), 578-80.Paul, P. V. (1997). Reading for students with hearing impairments: Research review and implications. Volta Review, 99(2), 73-87.Paul, P. V. (1998). Literacy and Deafness: The development of reading, writing and literate thought. Boston: Allyn and Bacon.Quigley, S. P. & Paul, P.V. (1985). Reading and deafness. London and Philadelphia: Taylor-Francis.Rasinski, T. V. (2003). The fluent reader: Oral reading strategies for building word recognition, fluency and comprehension. New York: Scholastic Professional Books.Rasinski, T. V. & Padak, N. (2004). Effective reading strategies: Teaching children who find reading difficult (3rd ed.). Upper Saddle River, N. J.: Pearson/Prentice Hall.Shanker, J. L. & Ekwall, E. E. (2000). Reading inventory (4th ed.). Boston: Allyn and Bacon. Schirmer, B. R. (2000). Language literacy development children who are deaf (2nd ed.). Boston: Allyn and Bacon. Thackwell, R. (1992). Reading evaluation. Christchurch: Van Asch College Resource Center.Tekin, E. & Kırcaali-İftar, G. (2001). Özel eğitimde yanlışsız öğretim yöntemleri. Ankara: Nobel Yayın Dağıtım. Tüfekçioğlu, U. (1992). Kaynaştırmadaki işitme engelli çocuklar: Eskişehir ilindeki normal okullarda eğitim gören işitme engelli öğrencilerin durumu. Eskişehir: Anadolu Üniversitesi Yayınları No: 627, Eğitim Fakültesi Yayın No: 24.Wilhelm, J. D. (2001). Improving comprehension with think-aloud strategies. New York: Scholastic Professional Books.Woods, M. L. & Moe, A. J. (1989). Analytical reading inventory (4th ed.). Columbus: Merrill Publishing Company. Yurkowski, P. & Ewoldt C. (1986). A case for the semantic processing of the deaf reader. American Annals of the Deaf, 131(3), 243-47.Zwiers, J. (2004). Building reading comprehension habits in grades 6-12: A toolkit of classroom activities. Newark: International Reading Association.
86
THE EFFECTS OF VISUALIZING AND VERBALIZING METHODS IN REMEDIAL SPELLING TRAINING: INDIVIDUAL CHANGES IN DYSLEXIC
STUDENTS’ SPELLING TEST PERFORMANCE
Günter FaberArbeitsstelle für pädagogische Entwicklung und Förderung
in Goslar (Germany)
87
A remedial spelling training approach is presented which systematically combines certain visualizing and verbalizing methods to foster dyslexic students' orthographic knowledge and strategy use. It essentially depends upon an integrative application of algorithmic graphs and verbal self-instructions: Visualization and verbalization are intended to focus the students’ attention, cognitions, and behaviors on the algorithmic rule components for enhancing their task orientation and self-regulation skills. To that degree, the intervention must provide an intensive and consistent cognitive modeling phase as well as a broad range of special training materials which, in particular, are comprised of various algorithmic and self-instructional task formats. In the present replication study the temporal training effects on the spelling test performance of 9 students with severe spelling difficulties were eva-luated. Achievement-related pre-test and follow-up data were analyzed after a treatment time of 40 hours. Empirical results could demonstrate individually and statistically significant gains in students’ general and error-specific spelling test performance – in both systematically trained and, to a somewhat lower degree, only incidentally considered spelling skill areas.
Many dyslexic students have no or only scarce knowledge of the important orthographic rules and are not familiar with their implications – and thus they do not follow structurally adequate criteria as much as those seeming subjectively plausible to them. Often they resort to their existing phonological spelling skills, and they try in vain to master the critical word items in terms of phonological correctness (Bailet, 1990; Carlisle, 1987; Darch, Kim, Johnson & James, 2000; Manis & Morrison, 1985; Steffler, 2004). Due to their errors, these students then seem irritated and disappointed over their unsuccessful spelling efforts as they have, from their viewpoint, genuinely pondered over the words and could even come up with an explanation for their decision to choose the spelling they used. Therefore, the task in remedial spelling training is to enhance, round off, or catch up on the orthographic skills of the students concerned, the acquirement of which had been un-successful for them so far – so as to avoid, last but not least, the motivational and socio-emotional long-term effects of failure experiences accumulated in the individual (Faber, 2002a,b; Humphrey, 2002; Licht & Kistner, 1986; Tobias, 1992). The development and per-sistence of these learning difficulties can be traced back essentially to fundamental knowledge and strategy deficiencies: the students concerned are lacking relevant knowledge with regard to the critical demands; in addition, they do not possess suitable metacognitive planning and control concepts for the acquirement of appropriate learning strategies – or they are unable to adequately apply solution approaches formally known to them (Borkowski, Johnston & Reid, 1987). Therefore, adequate remedial interventions have to teach students the knowledge of relevant rules in an understandable way, and useful behavioral patterns with regard to the in-struction strategy have to be worked out so as to bring this knowledge to application (Larkin & Ellis, 2004; Mäki, Vauras & Vainio, 2002; Scheerer-Neumann, 1993; Zimmerman, 2000).
In particular, learning theories from the view of action psychology point up the necessity of an instructional approach which enables the students to understand the underlying logic of a certain spelling rule and to form a cognitive concept or tool for further problem solving in that given spelling domain (Arievitch & Haenen, 2005; Gal’perin, 1989). In this sense, the training must include systematic orientation guides for the presentation of the object of learning in a way suitable to the students, as well as effective structuring remedies for a proper acquirement of the skills on the part of the students. Accordingly, the task of gradually developing relevant skills requires, first of all, finding suitable ways of conveying orthographic rules which guarantee that the issues at hand can actually be followed and understood by the students. Most of all, this requires considerations in the direction of resolving the verbal, abstract complexity of orthographic rules by subdividing them into
88
single information chunks of a concrete nature which, when looking at them from the students´ view, seem logically consistent, reliable, and mentally controllable. To that degree, an orientation basis significantly enhancing the learning process can be achieved by implementing visualization and verbalization methods subdividing the orthographic regulations into their characteristic sub-operations, thus presenting them in a methodical sequence of relevant decision criteria – in symbolic-graphic form and as descriptive as possib-le (Clarke, 1991). In this way, the students receive materialized, quasi prototypic patterns of orthographic problem-solving which are supposed to enable them to acquire knowledge and certainty of the relevant rules in clearly structured steps. If these conditions are fulfilled the next task is to implement adequate strategies making it possible for the students to carry over their acquired knowledge of the orthographic rules to corresponding spelling routines, and to apply it autonomously in order to meet orthographic demands. Therefore, their orthographic knowledge has to be relocated from the physical activity level into their consciousness, habi-tualizing it there as a behaviorally active pattern of thinking. Thus, the acquirement of skills and strategies is supposed to take place by educationally initiated and monitored internalization processes. In order to achieve this, it is absolutely essential, in the view of action psychology, to carry over the action from the exterior to the interior speech by putting the orthographic rule processing completely into language (Bodrova & Leong, 1998; Galperin, 1989), having the students commenting their rule application aloud – until they master it so well that they gradually need less and less time for the operation and are finally able to do without verbal teacher assistance. Now the students approach the orthographic solution without materialized structuring or overt self-instructions, and they have successfully automatized it as a continuous spelling strategy.
In that sense, the successful acquirement and application of orthographic rules may be facilitated significantly if one can successfully manage to subdivide the complex meaning of the rules into clearly structured intermediate algorithmic steps which can easily be visualized – and if one can also successfully manage to support the acquirement of these intermediate algorithmic steps with consistent verbalizing methods. In doing so, the acquirement of orthographic spelling skills may predominantly dependent upon the implementation of suitable visua-lizing methods, the development of relevant solution strategies, and most of all, the use of effective verbalizing methods (Thackwray, Meyers, Schleser & Cohen, 1985). For the success of the remedial process it may be crucial to combine both instruction approa-ches (and thus the implementation of visualizing and verbalizing methods as well) as closely as possible.For the beginning stages of the translating experience of the intermediate algorithmic steps into language and their subsequent consolidation with regard to the learning strategy, it seems methodically self-evident to utilize and adjust the principles of cognitive modeling and self-instructional learning (Meichenbaum & Asarnow, 1979) – as their efficien-cy in the development of strategic skills on the part of the students has been proven sufficiently long since, across a wide range of educational problems and school grades (Ellis, Deshler, Lens, Schumaker & Clark, 1991; Harris, 1990; Montague, 1997; Schunk, 1986).
89

From a methodical viewpoint, the systematic use of visualizing and verbalizing methods in remedial spelling training requires an algorithmic problem-solving plan which is capable of both structuring the acquirement of orthographic knowledge and facilitating the development of orthographic strategies simultaneously – by providing the specific problem-solving steps as well as the self-instruction steps at the same time. In this regard, an algorithmic flow chart (Figure 1 above) has proven to be a suitable method that focuses the students’ attention on the target word, first of all, introducing a reflexive
problem-solving action, that determines the relevant orthographic problem as a concrete issue in question, that introduces an algorithmically structured problem-solving approach to clear the issue
in question with definite decision criteria in clearly structured intermediate steps, that presents the algorithmically founded spelling of the target word as a reliable solution, and that eventually carries over this solution to an orthographically adequate spel ling of
the target word.
The application of this problem-solving plan has to be demonstrated by the teacher first by thinking aloud. In the course of this, the teacher also informs the students in detail of the meaning of the problem-solving algorithm and the benefits of the thinking aloud technique for one's own enhancement of orthographic skills (Pressley, 1986; Schunk & Rice, 1987). Under these circumstances, the students can test and practice the problem-solving plan with the teacher's guidance. At first, they apply the plan by thinking aloud, without exception. In doing so, they follow the algorithmic plan determined by them on a respective worksheet step by step with a colored pencil. In the case of errors or uncertainties, the teacher discontinues the ongoing solution attempt and starts to determine the correct solution approach together with the students, repetitively modeling the correct step if needed. In this way, each target word is analyzed by itself before a decision is made. Both the self-instructions and the colored marking of the solution approach should contribute to the students slowing down in their solution behavior, thus replacing impulsive guessing with reflexive action patterns. At the same time, they should be able to perceive their proceeding more consciously and control it more precisely, as the combination of visualized algorithms and verbal self-instruction ren-ders the own success/failure experience more comprehensible. The flow chart helps to precisely locate and promptly eliminate any difficulties in executing a certain problem-solving step.
For the systematic work with algorithmic flow charts of this nature, methodically adequate practice materials in particular play a central role (Faber, 2006). They have to de pict the or-thographic demands using algorithmically formatted exercise types consistently enabling the students to convert the orthographic skills acquired by them into a strategically adequate behavior (Figure 2).
90
gi¢t
-e -en -er
… comes from "ge-ben"
… so I write "b"
Figure 2. Algorithmic and self-instructional task format: An example

Previous empirical evaluation resultsThe results of evaluation studies so far conducted in the field of systematic remedial training with graphic problem-solving algorithms and verbal self-instructions could establish and prove significant gains in performance on the part of four training cohorts whose intervention was completed after nearly two years in each case. In the meantime, the relevant analyses encompass an intervention period of about eight years, and they are based on data compiled from overall N = 100 dyslexic children and adolescents – not taking the ongoing study (with the fifth training cohort) into consideration. Overall, it was possible to replicate and to gradually specify the pertinent results and findings (Faber, 2006):
On the basis of relevant norm test scores, the students trained over a longer period of time were able, interindividually as well as intraindividually, to achieve highly significant gains in spelling performance. This result is maintained even when empirically taking into consideration regression-related gains in performance prior to the treatment. At the same time, the students trained over a longer period of time were able to achieve, particularly in statistical and practical terms, significant gains in the systematically trained spelling skill areas. To a slightly lesser but still significant extent, this also holds good for the spelling skill areas only incidentally considered. In this respect, strategic transfer effects must have taken place in the course of the intervention. The analyses could establish significant improvements in the untrained spelling skill areas as well, which also indicates the possibility of strategic transfer effects. The gains in performance achieved in each case and cohort were not significantly correlated to gender, age, or regular school training conditions. Finally, some first empirical evidences suggest that advances in the students’ performance – with the proviso of conceptually adequate approaches, procedures, and training conditions – can be achieved largely independent of any teacher effects. These preliminary findings, however, have to be replicated again, by all means, with additional evaluation studies – and they have to be specified further with regard to a comprehensive series of conceptual and/or methodical questions of detail.
Evaluation studyEvaluation goals. With another evaluation setting, the objective of the study was to replicate and to differentiate the results of previous evaluation findings. In this sense, the performance data of the present training cohort were supposed to be analyzed in detail, considering the fol-lowing questions: (1) Does the students’ general spelling test performance significantly increase? (2) Do their individual error-rates in three systematically trained spelling skill areas significantly decrease, and, to a somewhat lower extent, (3) do their individual error-rates in two incidentally considered spelling skill areas significantly decrease as well?Subjects. The training cohort was comprised of 9 (4 female and 5 male) students from different grade levels (Figure 3) who displayed normal cognitive abilities but had extensive orthographic difficulties which, in most cases, had already been accumulated over a longer period of time. Descriptive spelling error analyses revealed clear evidence, that the students’ orthographic difficulties could be traced back to a lack of rule-dependent competencies and strategies in most cases – violations of the phonologically based spelling of words were relatively rare overall (Figure 3). In the majority of cases, the performance problems were as-sociated with inadequate (mostly impulsive, inactive and unfocused) learning styles, motivational orientations mainly characterized by test anxiety and avoidant behaviors, as well as socio-emotional conspicuities in a large number of cases.
Basic training conditions. In all cases studied, the spelling training consisted of an in-dividually compiled sequence of area-specific training steps addressing different orthographic problems with extensive use of visualized problem-solving algorithms and verbal self-instructions. This concerned the spelling skill areas explosive consonant graphemes (gk/dt/bp), i-graphemes (i/ie/ih), as well as doubling of consonants (II+). In contrast, the incidentally considered spelling skill area capitalization was only picked out as a central theme in cases of individual uncertainties or errors; the students were then supposed to show
91
the critical front part of the word with the aid of a corresponding signal card and by thinking aloud (Faber, 2006). Similarly, the incidentally considered skill area of phonologically based spelling was picked out as a central theme as required, by also focusing the students’ attention on the critical work part with signal cards (Blackwell & McLaughlin, 2005), and getting them to think aloud about their spelling activities. Often this concerned problems around the subjects of differentiating phoneme sounds and, in particular, structuring or segmenting words – the mastery of which is, with elaborate syllablization exercises, already a central component part of the spelling strategies imparted in the training units dealing with explosive sounds and doubling of consonants. The intervention took place once a week for 60 minutes each with single individuals or groups of two. It was carried out by the author and another teacher who received regular consultation with regard to questions as to the diagnostic and methodical im-plementation of the approach.
Measurements and statistical analyses. The students’ spelling achievement were first assessed in pre-test 1 six months prior, on an average, to the beginning of the training, again in pre-test 2 directly at the beginning of the training, and in subsequent follow-up tests after 40 hours into the training. According to grade level, this took place with standardized, norm-referenced spelling tests (Faber, 2006). In pre-test 2, it was possible to use parallel forms of the instruments employed in pre-test 1. As follow-up measures instruments with norms for the next higher grade level were administered in each case. Evaluation of test results was carried out quantitatively on the basis of grade-related T score norms, as well as qualitatively with the proviso of descriptive error categories. For this purpose, individual error rates were generated from an especially developed word list (Faber, 2004). It promises, as to content and psy-chometry, more adequate results with regard to the students’ individual error ratio, as these are not any longer directly depending upon the item pool of a certain spelling test. The internal consistency of the word list amounted to α = .93 (Cronbach’s Alpha). The sum total of list words correctly written correlated with the T score norms of the spelling test procedu-res by r = .56 (p = .005) and turned out to be significantly influenced by the grade level (r = .55, p = .007) but not by gender (r = .01, p > .05). Due to the previous course of the training, the corresponding error percentage scores in the learning skill areas explosive consonant graphemes, i-graphemes and doubling of consonants were used, for the study at hand, as error-specific performance criteria for the systematically trained spelling competences – and the error percentage scores in capitalization and phonologically based spelling were used as error-specific performance criteria in the incidentally considered skill areas. As children and adolescents with severe spelling difficulties in particular tend to several misspellings in one single word often, the ordinary test sum scores can, foreseeably, only roughly reflect the extent of their individual problems. Therefore, their individual error frequency was recorded as an additional performance criterion, relativizing the sum total of individual errors in the spelling test with the total item sum of the corresponding procedure. With the test norm scores, the error frequency of all students at measurement time 2 correlated to r = -.73 (p = .000).
Students’ individual changes in spelling performance were, at first, documented for each single case and subjected to a conventional visual data inspection. Data from pre-test 1 and 2 respectively were the base rate to control for positive changes in unaddressed problems. Follow-up data (from measurement time 3) served as indicator for intervention-related improvements. This was done to explore particular intra-individually marked student development, also with regard to subject-specific effects of the intervention. Furthermore, summarizing statistical examination of total performance effects in the entire cohort was carried out using nonparametric Wilcoxon tests with an (one-tailed) alpha error probability of p < .05 (Siegel & Castellan, 1988). This procedure should clarify to what extent individual improvements are so similar that interindividually reliable replication of certain intervention effects for all students can be assumed.
Results.
92

The visual inspection of single-case data shows that most students have clearly improved standardized test results (Figure 3). The extent of the improvements, however, varies significantly. While some test results are remarkable, and almost instantaneous, other cases developed in a much slower manner. In addition, the comparisons between pre-test and follow-up data concerning the error-specific results show that all students have reduced their initial error ratio in the systematically trained areas to a greater or lesser extent: All students have decreased their individual error rates, which was, in some cases, extremely high before the training – and some have made remarkable progress.
93
010203040506070
spT
est 1
spT
est 2
spT
est 3
gk+2
gk+3
ieih
2
ieih
3
ll+2
ll+3
grok
l2
grok
l3
laut
g2
laut
g3
Kathrin, Grade 4
T-s
core
s/er
ror
rate
s
010203040506070
spT
est 1
spT
est 2
spT
est 3
gk+2
gk+3
ieih
2
ieih
3
ll+2
ll+3
grok
l2
grok
l3
laut
g2
laut
g3Saskia, Grade 3
T-s
core
s/er
ror
rate
s
010203040506070
spT
est 1
spT
est 2
spT
est 3
gk+2
gk+3
ieih
2
ieih
3
llss2
llss3
grok
l2
grok
l3
laut
g2
laut
g3
Richard, Grade 4
T-s
core
s/er
ror
rate
s
010203040506070
spT
est 1
spT
est 2
spT
est 3
gk+2
gk+3
ieih
2
ieih
3
ll+2
ll+3
grok
l2
grok
l3
laut
g2
laut
g3
Julius, Grade 4
T-s
core
s/er
ror
rate
s
After 40 hours of remedial training, at measurement time 3, all students make significantly less multiple spelling errors per word than at the beginning of the training at measurement time 2 (Table 1).
While summarizing this individual case data into group-statistically analyzable achieve-ment parameter, the average test scores of all tested students, which differed significantly before the intervention, had increased during the follow-up test by an average of 10 T-score-points (Figure 4). The extent of the intraindivi-dually achieved changes can be verified from an inference-statistical perspective for the enti-re group (Wilcoxon test: Z = -2.68, p = .007). There is no noteworthy correlation between the extent of the achievements so far, e.g. the difference between the second and third mea-surement time, and the grade the student is in (r = .-16, p = .712). The students’ age do not influence the improved test results. This is also
94
010203040506070
spT
est 1
spT
est 2
spT
est 3
gk+2
gk+3
ieih
2
ieih
3
ll+2
ll+3
grok
l2
grok
l3
laut
g2
laut
g3
Pascal, Grade 5
T-s
core
s/er
ror
rate
s
010203040506070
spT
est 1
spT
est 2
spT
est 3
gk+2
gk+3
ieih
2
ieih
3
ll+2
ll+3
grok
l2
grok
l3
laut
g2
laut
g3
Erik, Grade 4
T-s
core
s/er
ror
rate
s
010203040506070
spT
est 1
spT
est 2
spT
est 3
gk+2
gk+3
ieih
2
ieih
3
ll+2
ll+3
grok
l2
grok
l3
laut
g2
laut
g3
Nadja, Grade 7T
-sco
res/
erro
r ra
tes
010203040506070
spT
est 1
spT
est 2
spT
est 3
gk+2
gk+3
ieih
2
ieih
3
ll+2
ll+3
grok
l2
grok
l3
laut
g2
laut
g3Belinda, Grade 7
T-s
core
s/er
ror
rate
s
010203040506070
spT
est 1
spT
est 2
spT
est 3
gk+2
gk+3
ieih
2
ieih
3
ll+2
ll+3
grok
l2
grok
l3
laut
g2
laut
g3
Benjamin, Grade 8
T-s
core
s/er
ror
rate
s
Figure 3. Individual changes in total spelling test performance (spTest: T-scores) and in different spelling skill areas (error rates). The numbers indicate the various measurement times (1= before the beginning of the training, 2= at the beginning of the training, 3= follow-up after 40 training hours).
30
35
40
45
50
55
60
Pretest 1 Pretest 2 Follow-Up
Spelling Test Performance
Mea
n T
-Sco
res
(Nor
ms)
Figure 4. Changes of spelling test performance in the training cohort: Norm-referenced spelling test scores 6 months prior to the training (pre-test 1), at the beginning of the training (pre-test 2), and after 40 hours of training time (follow-up)
true for the gender variable, which does not correlate with the improvement in spelling test performance (r = -04, p = .910).
The group-statistical analyses regarding error-specific student improvements in the systemati-cally trained spelling skill areas have similar results (Table 1). The errors regarding the skill area of explosive consonant graphemes (gk+) as well as the skill area of i-graphemes (ieih) and doubling of consonants (II+) decreased after 40 hours of training to an extent that cannot be attributed to chan-ce, as evidenced by inference-statistical analysis. But there are also substantial changes with regard to the incidentally considered spelling skill areas. As could be expected, changes in this area are less significant, but are also statis-tically more significant than could be explained by chance. The average error ratio for ca-pitalization (grokl) and phonologically based spelling (lautg) has notably decreased. Altogether, for the entire training cohort spelling per-formance has improved in a statistically significant man-ner.
Discussion. The results of the present eva-luation study show noted performance gains in the stu-dents’ spelling after 40 hours of remedial training – both for individual cases, which show in-tra-subjectively noteworthy student changes, and for the entire group, whose competence in-crease is more significant than can be attributed to chance and thus prove inter-subjective re-plicability of the case-related achieved results. As expected, the students improved most in the systematically trained spelling skill areas and less in the only incidentally considered spelling skill areas. Students’ performance gains in the incidentally considered area of phonologically based spelling, unless they arrived at syllabizing solution strategies by transfer, which had been systematically studied in connection with the explosive consonant and double consonant skill area. If the improvements in the capitalization skill area, which was also trained implicitly, are the result of the respective signal card and/or strategic transfer effects, remains to be seen. Possibly, the algorithmic and self-instructive process has lead to a more conscious awareness of language-structural word markers.
Considering the small size of the sample, these interim results should only be seen as a first impression and thus only allow for preliminary conclusions about the possible effects of the intervention. We are waiting for finalizing analyses, since the results for each individual case need to be stabilized and improved upon with further training. With this caveat, these results confirm the findings from previous research on the group level and point to the positive effects of systematic work with algorithmic and self-instructive learning in remedial spelling training: The students’ improvements are much more significant between test points 2 and 3 than between 1 to 2, which is proof for the effects of the intervention. The heterogenous composition of the training cohort has not influenced these results – on the contrary, changes
95
Table 1. Error rates in various spelling skill areas: Pre-test and follow-up data (gk+ = explosive consonant gra-phemes, ieih = i-graphemes, ll+ = doubling of conso-nants, grokl = capitalization, lautg = phonologically ba-sed spelling)
Spelling skill area gk+ (systematically trained)Pre-test 2 Follow-up Wilcoxon pMedian = 27 Median = 10 Z = -2.55 .011
Spelling skill area ieih (systematically trained)Pre-test 2 Follow-up Wilcoxon pMedian = 20 Median = 8 Z = -2.49 .013
Spelling skill area II+ (systematically trained)Pre-test 2 Follow-up Wilcoxon pMedian = 50 Median = 16 Z = -2.67 .008
Spelling skill area grokl (incidentally considered)Pre-test 2 Follow-up Wicoxon pMedian = 12 Median = 5 Z = -2.10 .036
Spelling skill area lautg (incidentally considered)Pre-test 2 Follow-up Wilcoxon pMedian = 16 Median = 5 Z = -2.43 .015
Total error ratePre-test 2 Follow-up Wilcoxon pMedian = 102 Median = 42 Z = -2.67 .008

can be noted across gender and grade levels. This may also be an indication for appropriate individual adaptation of the training.
Concerning the individual data, these results also provide important information about a educationally helpful assessment of the training to date: The progress, evaluated by spelling tests, seems quite marginal, even though the respective students have significantly improved in various areas. The results of the norm-referenced spelling tests can (so far) only somewhat reflect this progress – e.g. the intra-subjectively achieved competency increase is not sufficient in a social comparison. Due to the often massive amount of errors in several areas at the beginning, these relative discrepancies between intra- and inter-individual evaluations of training effects are to be expected. For an evaluation of the students’ improvement, the case-specific before and after differences in the systematically trained areas should be used, and looked at within the context of all case-specific problem aspects – particularly the extent to which certain critical characteristics concerning cognitive-motivational, behavioral, and knowledge-based learning conditions of the respective students make learning more difficult or could even block learning.
Independent from practical and conceptual perspectives of this nature, it might be in teresting as well, eventually, to examine whether the visualizing and verbalizing methods developed can be systematically transferred to rule-specific spelling trainings in the orthographies of other languages, and whether they can be integrated into other training approaches phonolo-gically oriented (Faber, 2006; Lovett, Lacerenza, Borden, Frijters, Steinbach & De Palma, 2000; Mäki, Vauras & Vainio, 2002).
References
Arievitch, I.M. & Haenen, J.P.P. (2005). Connecting sociocultural theory and educational practice: Galperin’s approach. Educational Psychologist, 40, 155-165.Bailet, L.L. (1990). Spelling rule usage among students with learning disabilities and nor-mally achieving students. Journal of Learning Disabilities, 23, 121-128.Blackwell, A.J. & McLaughlin, T.F. (2005). Using guided notes, choral responding, and response cards to increase students performance. International Journal of Special Education, 20(2), 1-5.Bodrova, E. & Leong, D.J. (1998). Scaffolding emergent writing in the zone of proximal de-velopment. Literacy Teaching and Learning, 3(2), 1-18.Borkowski, J.G., Johnston, M.B. & Reid, M.K. (1987). Metacognition, motivation, and con-trolled performance. In S.J. Ceci (Ed.), Handbook of cognitive, social, and neuropsychologi-cal aspects of learning disabilities. Volume 2 (pp. 147-173). Hillsdale: Erlbaum.Carlisle, J. (1987). The use of morphological knowledge in spelling derived forms by LD and normal students. Annals of Dyslexia, 37, 90-108.Clarke, J.H. (1991). Using visual organizers to focus on thinking. Journal of Reading, 34, 526-534.Clifford, M.M. (1990). Student motivation and academic achievement. In P. Vedder (Ed.), Fundamental studies in educational research (pp. 59-89). Lisse: Swets and Zeitlinger.Darch, C., Kim, S., Johnson, S. & James, H. (2000). The strategic spelling skills of students with learning disabilities: The results of two studies. Journal of Instructional Psychology, 27, 15-26.Ellis, E.S., Deshler, D.D., Lens, B.K., Schumaker, J.B. & Clark, F.L. (1991). An instructional model for teaching learning strategies. Focus on Exceptional Children, 23(6), 1-24.Faber, G. (2002a). Diktatbezogene Erfolgs- und Misserfolgsattributionen: Empirische Unter-suchungsergebnisse zum subjektiven Kompetenz- und Kontrollerleben rechtschreibschwacher Grundschulkinder. Heilpädagogische Forschung, 28, 2-10.Faber, G. (2002b). Rechtschreibängstliche Besorgtheits- und Aufgeregtheitskognitionen:
96
Empirische Untersuchungsergebnisse zu ihrer Bedeutung für das Selbstwertgefühl und die Schulunlust rechtschreibschwacher Grundschulkinder. Sonderpädagogik, 32, 3-12.Faber, G. (2004). Lernhilfen. Kopiervorlagen zur systematischen Rechtschreibförderung: 45 kommentierte Arbeitsblätter auf CD-ROM (pdf-Datei). Goslar: Arbeitsstelle für pädagogische Entwicklung und Förderung.Faber, G. (2006). The systematic use of visualizing and verbalizing methods in remedial spelling training: Conceptual issues, practical applications, and empirical findings. In C.B. Hayes (Ed.), Dyslexia in children: New research (in press). Hauppauge: Nova Science Publishers.Gal’perin, P.Ya. (1989). Mental actions as a basis for the formation of thoughts and images. Soviet Psychology, 27(3), 45-64.Harris, K.R. (1990). Developing self-regulated learners: The role of private speech and self-instructions. Educational Psychologist, 25, 35-49.Humphrey, N. (2002). Self-concept and self-esteem in developmental dyslexia: Implica-tions for theory and practice. Paper presented at the Second International Biennial SELF Conference. Self-concept research: Driving International Research Agendas. Sydney: University of Western Sydney, Self-Research Centre [http://self.uws.edu.au/Conferences/2002_Humphrey.pdf].Larkin, M.J. & Ellis, E.S. (2004). Strategic academic interventions for adolescents with lear -ning disabilities. In B.Y.L. Wong (Ed.), Learning about learning disabilities (pp. 375-414). San Diego: Elsevier.Licht, B.G. & Kistner, J.A. (1986). Motivational problems of learning-disabled children: In-dividual differences and their implications for treatment. In J.K. Torgensen & B.Y.L. Wong (Eds.), Psychological and educational perspectives on learning disabilities (pp. 225-255). Orlando: Academic Press.Lovett, M.W., Lacerenza, L., Borden, S.L., Frijters, J.C., Steinbach, K.A. & De Palma, M. (2000). Components of effective remediation for developmental reading disabilities: Combining phonological and strategy-based instruction to improve outcomes. Journal of Educational Psychology, 92, 263-283.Mäki, H.S., Vauras, M.M.S. & Vainio, S. (2002). Reflective spelling strategies for elementary school students with severe writing difficulties: A case study. Learning Disability Quarterly, 25, 189-207.Manis, F.R. & Morrison, F.J. (1985). Reading disability: A deficit in rule learning. In L.S. Siegel & F.J. Morrison (Eds.), Cognitive development in atypical children (pp. 1-26). New York: Springer.Meichenbaum, D. & Asarnow, J. (1979). Cognitive-behavioral modification and metaco-gnitive development: Implications for the classroom. In P.C. Kendall & S.D. Hollon (Eds.), Cognitive-behavioral interventions. Theory, research, and practice (pp. 11-35). New York: Academic Press.Montague, M. (1997). Cognitive strategy instruction in mathematics for students with lear-ning disabilities. Journal of Learning Disabilities, 30, 164-177.Pressley, M. (1986). The relevance of the good strategy user model to the teaching of mathe-matics. Educational Psychologist, 21, 139-161.Scheerer-Neumann, G. (1993). Interventions in developmental reading and spelling disorders. In H. Grimm & H. Skowronek (Eds.), Language acquisition problems and reading disorders: Aspects of diagnosis and intervention (pp. 319-352). Berlin: de Gruyter.Schunk, D.H. (1986). Verbalization and children’s self-regulated learning. Contemporary Educational Psychology, 11, 347-369.Schunk, D.H. & Rice, J.M. (1987). Enhancing comprehension skill and self-efficacy with strategy value information. Journal of Reading Behavior, 19, 285-302.Siegel, S. & Castellan, N.J. (1988). Nonparametric statistics for the behavioral sciences (2nd ed.). New York: McGraw-Hill.
97

Steffler, D.J. (2004). An investigation of Grade 5 children’s knowledge of the doubling rule in spelling. Journal of Research in Reading, 27, 248-264.Thackwray, D., Meyers, A., Schleser, R. & Cohen, R. (1985). Achieving generalization with general versus specific self-instructions: Effects on academically deficient children. Cognitive Therapy and Research, 9, 297-308.Tobias, S. (1992). The impact of test anxiety on cognition in school learning. In K.A. Hagtvet & T.B. Johnson (Eds.), Advances in test anxiety research. Volume 7 (pp. 18-31). Lisse: Swets and Zeitlinger.Zimmerman, B.J. (2000). Attaining self-regulation: A social-cognitive perspective. In M. Boekaerts, P.R. Pintrich & M. Zeidner (Eds.), Handbook of self-regulation (pp. 13-39). San Diego: Academic Press.
98

COMORBID DIAGNOSIS AND CONCOMITANT MEDICAL TREATMENTFOR CHILDREN WITH EMOTIONAL AND BEHAVIORAL DISABILITIES
Kristina M. HallKrista A. Bowman
Katie Ley&
William Frankenberger, University of Wisconsin-Eau Claire
The purpose of the current study was to determine the types of psychiatric disorders and the corresponding medications prescribed to children enrolled in elementary Emotional Behavioral Disability (EBD) programs. The project employed a questionnaire that was distributed to elementary level teachers (EBD) to: (a) determine the proportion of children identified with single and multiple psychiatric disorders; (b) determine the proportion of children treated with single and multiple psychiatric medications; (c) investigate possible adverse drug interactions for children receiving combinations of medications for their psychiatric disorders; and (d) assess the attitudes of teachers (EBD) concerning the use of psychiatric medication to treat elementary level children. Results revealed 76.8% of the 617 students were identified as having one or more psychiatric disorder(s) and 21.2% of students were identified as having been diagnosed with multiple psychiatric disorders. Approximately 65% of the elementary students in EBD programs were identified as receiving psychiatric medication for the treatment of one or more psychiatric disorders. Fifteen percent of students were identified as receiving combinations of medications, and 6.2% were identified as receiving three or more medications concurrently. Implications of the rates of pharmacological treatment of children and potential concomitant target and adverse effects were discussed.
According to the American Academy of Child and Adolescent Psychiatry an estimated 7-12 million Americans under 18 years of age suffer from emotional, behavioral, developmental and mental disorders that are often treated with psychiatric medication (aacap.org). A meta-analysis of the current literature indicates that 9-13% of children in the United States suffer from mental disorders that warrant treatment with medication (Weisz & Jensen 1999). Research indicates that the diagnosis of psychiatric disorders among school-age children with emotional and behavioral disabilities (EBD) and concomitant treatment of such disorders with psychotropic medications has increased dramatically in the last 15 years. In 1987 Cullinen, Gadow, and Epstein (1987) reported 9.3% of children in EBD programs received psychiatric medication. In 1996, Runnheim, Frankenberger, and Hazelkorn (1996) reported 40% of children in EBD programs were treated with stimulant medication. The increasing rate of diagnosis and treatment of children with psychiatric disorders has raised many questions. The questions raised are especially important because data concerning the prevalence of psychiatric disorders among children and the prevalence of child treatment is fragmented and inconclusive (Weisz & Jensen, 1999). In addition, the validity and reliability of the diagnosis
99

of disorders such as ADHD, mood disorders, and schizophrenia in young children are controversial (Coyle, 2000).
Incidence of Psychiatric DisordersThere is a dearth of information related to the prevalence of psychiatric conditions in the school-aged population. Although the following study did not provide data for actual prevalence, an extensive review of existing literature conducted by Weisz and Jensen (1999) reported ADHD, depression, bipolar disorder, anxiety disorder, autism and obsessive-compulsive disorder to be among the most commonly treated psychiatric disorders occurring in childhood. Attention-Deficit/Hyperactivity Disorder (ADHD) has been estimated to occur in approximately 3-7% of school-aged children according to the Diagnostic and Statistical Manual of the American Psychiatric Association (American Psychiatric Association, 2000). However, estimates as high as 10% have been proposed more recently (Rowland, Umbach, Stallone, Naftel, Bohlig & Sandler, 2002).
Incidence of Treatment with Psychiatric MedicationsSome of the most commonly prescribed types of psychiatric medications for children include stimulant, antidepressant, antianxiety, antipsychotic, and antiseizure medications (Weisz & Jensen, 1999). The incidence of stimulant treatment in the school-age population has increased dramatically in the past few years as the acceptance of pharmacotherapy for ADHD increased. Currently, estimates as high as six million children being treated with stimulant medication for treatment of ADHD appear in the literature (Hearn, 2004). The large increase in the treatment of ADHD with stimulant medication since 1990 is evidenced by the following research. In a national survey of 19 school districts, Frankenberger, Lozar, and Dallas (1990) reported fewer than 1.5% of the students surveyed were diagnosed with ADHD and were receiving treatment with stimulants. More recently, Rowland, Umbach, Stallone, Naftel, Bohlig, and Sandler (2002) completed a school-based survey that revealed 10% of the 6099 children included in the study were identified as having ADHD and were treated with stimulant medication. The increase in stimulant use is also evinced by data from the United States Drug Enforcement Administration (DEA, 2002). According to DEA data, there was nearly a 900% increase in methylphenidate (Ritalin) production from 1990 to 2001. With the introduction of Concerta and Metadate, the production of methylphenidate has increased by 40% from 2000 to 2002. Furthermore, from 1993 to 2006 the production of amphetamines (Dexedrine and Adderall) increased by 7143% (DEA, 2006).
Researchers have also investigated use of antidepressant medication to treat children. Zito, Safer, dosReis, Gardner, Soeken, Boles, et al. (2002) found a three to five fold increase in antidepressant treatment among children between 1988 and 1994. Antidepressant use in children increased by 9.2% each year from 1998 to 2000 (Delate, Gelenberg, Simmons, Motheral, 2004). Selective serotonin reuptake inhibitors (SSRIs) were most frequently prescribed by pediatricians and family physicians (Delate, 2004; Zito, et al, 2002; Rushton, Clark, & Freed, 2000). However, recent research has questioned the efficacy of antidepressant medication for the treatment of children (Keller, Ryan, Strober, Klein, Kutcher, Stan, et al., 2001; Zito & Safer, 2001; Emslie, Rush & Weinberg, 1997). Furthermore, there is concern over the potential risks of antidepressant use in the pediatric population. The FDA issued a public health advisory regarding a potential increased risk of suicidality (suicide ideation and attempts) and worsening of depressive symptoms associated with pediatric use of SSRIs to treat major depressive disorder (FDA, 2004).
Researchers have generally not addressed the use of combinations of medications to treat psychiatric disorders in children. The use of multiple psychotropic medications substantially increased throughout the 1990s. A national sample of physician office visits revealed the rate of combined antidepressant and stimulant use increased 25% from 1994 to 1997 (Safer, Zito, dosReis, 2003). Children with more emotional, social, or educational difficulties were more likely to receive multiple medications (Safer, Zito, dosReis, 2003). Bussing, Zima, and Belin
100

(1998) found 20% of children in an elementary special education program were receiving multiple psychotropic medications. One of the most common psychotropic medication combinations was that of an antidepressant and a stimulant (Bussing, Zima & Belin, 1998). Rushton and Whitmore (1998) reported 30% of children in North Carolina were receiving an SSRI concurrently with a stimulant. Despite the recent increase in use of multiple psychotropic medications, there is a lack of research supporting its use and exploring potential risks. In the adult literature, consistent findings reveal that as the number of concomitant medications increases, the risk of adverse drug effects increases as well (Safer, Zito, dosReis, 2003). Such adverse effects include an increased possibility of unfavorable drug interactions that can lead to serious physical and/or behavioral complications (Ambrosini & Sheikh, 1998). Issues related to use of Psychiatric medication with childrenMany studies have demonstrated the positive impact of psychiatric medication on symptoms of psychiatric disorders in children. For example, the MTA Cooperative Group (MTA, 2004) revealed stimulant medication appeared to successfully treat symptoms of ADHD as long as the treatment continued. However, fewer data are available for other types of medications and potential risks associated with these medications have recently been identified. The period from early childhood to late adolescence is characterized by rapid physical, psychological and social change, and though children are being treated with the same psychiatric medications as are adults, their options for drug treatment are different due to pharmacokinetic and pharmacodynamic effects that change with age (Weisz & Jensen, 1999; Wiznitzer & Findling, 2003). The brain of a child is an evolving organ with myelination, pruning, and the maturation of synaptic connections continuing throughout adulthood (Wiznitzer & Findling, 2003).
While the short-term effects of multiple psychotropic medications have been documented, the long-term effects of such drugs are not known (Wiznitzer & Findling, 2003). Recent research may shed light on this issue. The MTA Cooperative Group revealed that the group treated with medication showed a significantly reduced growth rate and continued growth suppression (MTA, 2004). Until recently, experimental animal studies examining the effects of psychotropic agents on brain maturation during critical periods of development were absent from literature (Weisz & Jensen, 1999). However, recent research indicates that methylphenidate may have long term effects on the brain and behavior due to changes discovered in the brains of young animals that persisted into adulthood (Brandon, Marinelli, Baker & White, 2001; Carlezon, Mague & Andersen, 2003; Bolanos, Barrot, Berton, Wallace-Black & Nestler, 2003).
The issue of psychopharmacological treatment in the child population is difficult to address due to the fact that supporting data comes predominantly from small scale, non-blind assessments, case reports, and a few regional surveys rarely involving systematic study (Safer, Zito & dosReis 2003; Weisz & Jensen, 1999). Unfortunately, studies assessing the effectiveness of psychopharmacological treatment in children are absent from the existing research literature (Weisz & Jensen, 1999). Several important issues concerning the use of antianxiety, antipsychotic, antiseizure and combinations of medications in the childhood population currently remain unaddressed.
The purpose of the current study was to determine the types of psychiatric disorders and the corresponding medication prescribed to children enrolled in elementary Emotional Behavioral Disability (EBD) programs. Additionally, the study was designed to determine the most common psychiatric diagnoses in the elementary EBD population, along with the most common multiple diagnoses and corresponding single and multiple prescribed combinations of medication. More specifically, the study was designed to determine the proportion of children enrolled in the elementary Emotional Behavioral Disability (EBD) programs who were currently prescribed medication for psychiatric disorders. Through a comprehensive literature review and analysis of data, the current study also aims to address issues concerning
101

possible adverse drug interactions of single and multiple combinations of psychiatric medication. Finally, the study examined the attitudes of EBD teachers toward diagnosis of psychiatric disorders and use of psychiatric medication to treat children.
MethodParticipantsThe participants were elementary teachers of students with emotional and behavioral disabilities in the state of Wisconsin for the 2003-04 school year. A list of elementary EBD teachers was obtained from the Wisconsin Department of Public Instruction. Of the 3,562 teachers, 500 (14%) were randomly selected to receive the questionnaire. A cover letter (explaining the purpose of the study and assuring anonymity), questionnaire, magnet incentive and return envelope were mailed to each participant. Two weeks after the initial mailing, reminder postcards were mailed, asking teachers to complete and return the questionnaire if they had not already done so.
InstrumentA four page questionnaire was designed based on the survey employed in the Runnheim (1996) et al. study to collect the data. The questionnaire was designed to gather information through a series of Likert-type questions that assessed the teachers’ attitudes about the incidence of childhood psychiatric disorders, and the use of psychiatric medication to treat children in the teachers’ classroom. In addition, the teachers were asked to provide demographic data and information regarding the grade level(s) they taught, their class size or size of caseload, and the number of students receiving medication for a psychiatric disorder(s). For each reported student receiving medication, the teachers were asked to supply the following information: (a) grade level, (b) type of psychiatric disorder(s), and (c) the particular psychiatric medication(s) administered to treat the corresponding disorder(s).
ResultsOf the 500 questionnaires distributed, 146 teachers (29%) returned a questionnaire. Of the questionnaires, 39 were returned as unusable due to not reaching the appropriate individuals and five were returned after data analysis was completed. A total of 102 teachers provided information on 617 elementary-aged children in Wisconsin placed in programs for students with emotional and behavioral disabilities.
Information About the Students in EBD programsApproximately 77% (474) of the 617 students were identified as having one or more psychiatric disorder(s) and 21.2% (131) of students were identified as being diagnosed with multiple psychiatric disorders. Approximately 65% (400) of the elementary students in EBD programs were identified as receiving psychiatric medications for the treatment of one or more psychiatric disorders. Fifteen percent (94) of students were identified as receiving combinations of medications, and 6.2% (38) were identified as receiving three or more medications.
Most Common Single or Multiple Psychiatric DiagnosesTable 1 reveals percentages of children diagnosed with single or multiple psychiatric disorders. Approximately 52% (322) of elementary students in EBD programs were identified as having ADHD. The next most common disorder reported was anxiety disorder, with 12% (74) of students identified, and bipolar disorder was identified for 10.4% (64) of the students.
102

Table 1Percent of Children With Single or Multiple Psychiatric Disorders
Disorder Number PercentageADHD 322 52.2Anxiety 74 12.0Bipolar 64 10.4Depression 56 9.1Autism 18 2.9Seizure Disorder 14 2.3Other 57 9.2
* percentages include all children that were diagnosed with either a single or multiple disorders
Most Common Multiple Psychiatric DiagnosesTable 2 reveals that the most common multiple disorders were included in the category of other due to the extent of multiple unique combinations of two or more diagnoses which occurred very infrequently. The next most common multiple psychiatric diagnosis was ADHD and anxiety disorder identified for 3.7% (23) of the students. Of children diagnosed with more than two disorders, ADHD, anxiety disorder and bipolar disorder occurred most frequently accounting for 1% (8) of the students.
Table 2Percent of Children With (most common) Multiple Psychiatric Disorders
Disorders Number PercentageADHD + anxiety 23 3.7ADHD + bipolar 14 2.3ADHD + depression 13 2.1ADHD + anxiety + bipolar 8 1.3ADHD + bipolar + depression 7 1.1ADHD + OCD 7 1.1Other 59 9.6
Total 131 21.2
Most Commonly Prescribed Psychiatric Medications (Medication Specific)In order to more clearly identify patterns of pharmacological treatment of psychiatric disorders, specific medications were collapsed into classes specified in Table 3 and Table 4 that included stimulant, antidepressant, antianxiety, antiseizure or mood stabilizers, antipsychotic and other medications. Table 3 reveals that 49.3% (304) of the students were identified as receiving stimulant medication (Strattera was included in the stimulant category). Of those receiving stimulants, 46.4% (141) of the students were identified as receiving amphetamine (Dexedrine & Adderall), 36.5% (111) of the students were identified as receiving methlyphenidate (Ritalin, Concerta, Metadate & generic methylphenidate), and 17.1% (52) of the students were identified as receiving Strattera.
The next most commonly prescribed psychiatric medications were antidepressants that accounted for 10% (62) of the students. Of the students treated with antidepressants, 67.7% (42) were receiving treatment with SSRIs (Zoloft, Paxil, Prozac & Celexa). Other newer non-SSRIs (Wellbutrin, Effexor & Remeron) accounted for 29% (18) of the students.
103
Table 3Percent of Children Receiving Single or Multiple Psychiatric Medications (by drug class)
Drug Class Number Percentage Stimulant 304 49.3Antidepressant 62 10.0Antipsychotic 55 8.9Antiseizure/Mood Stabalizers 29 3.9Antianxiety 18 2.9Other 2 1.1
* percentages include all children that are receiving either single or multiple medications
Approximately 8% (50) of the students were identified as receiving antipsychotic medication, with 70% (35) of those treated with antipsychotics receiving Risperdal and 20% (10) of the students were receiving Zyprexa. Approximately 3% (18) of the students were identified as receiving antianxiety medication. It should be noted that 77.8% (14) of those treated with antianxiety medication received Clonidine. Finally, 3.9% (24) of the students were identified as receiving antiseizure or mood stabilizing medication, with 58.3% (14) identified as receiving Depakote and 20.8% (5) receiving lithium.
Most Common Combinations of Psychiatric Medications (by Drug Class)Table 4 reveals that the most common combinations of multiple psychiatric medications were identified by the category of other due to the extent of multiple unique combinations of two or more medications which occurred infrequently (4.1%, 24). The two most common medication combinations were a stimulant plus an antidepressant and a stimulant plus and antipsychotic, both of which occurred for 2.4% (15) of the students. The most common three medication combination was a stimulant, an antidepressant and an antipsychotic medication accounting for 1% (6) of the students.
Table 4Percent of Children on Multiple Psychiatric Medications (by drug class)
Drug Class Number PercentageAntidepressant + Stimulant 15 2.4Antipsychotic + Stimulant 15 2.4Stimulant + Stimulant 11 1.8Antianxiety + Stimulant 7 1.1Antidepressant + Stimulant + Antipsychotic 6 1.0Antipsychotic + Stimulant +Stimulant 5 0.8Antipsychotic + Stimulant + Antiseizure 5 0.8Stimulant + Stimulant + Antidepressant 4 0.6Antidepressant + Antidepressant + Antipsychotic + Stimulant 2 0.3Other 24 4.1
Total 94 15.2 * 6.2% (38 students) were identified as receiving three or more medications.
Teachers’ Attitudes of Childhood Psychiatric Disorders and Use of Medication The elementary EBD teachers were asked a series of questions regarding their views on the incidence of childhood psychiatric disorders and the use of psychiatric medication in the EBD classroom. The teachers' responses were based on a scale of 1 to 5 as specified in Table 5. A mean response between 4.00 and 5.00 was labeled agree or greatly increase. A mean for a particular statement between 3.50 and 3.99 was labeled a tendency to agree or increase. A mean located between 2.50 and 3.49 was labeled neutral or remained the same. A mean
104

falling between 2.01 and 2.49 was labeled a tendency to disagree or decrease. A mean of 2.00 or below was labeled disagree or decrease greatly.
Table 5Survey Questions With Means and Standard Deviations
Teachers Attitudes of Childhood Psychiatric Disorders and Use of Medication
THE FOLLOWING SCALE WAS USED TO RESPOND TO THE QUESTIONS BELOW:1= Decreased greatly 2= Decreased 3= Remained same 4= Increased 5= Increased greatly
Question N M SD
1. In your experience in the last five years the incidence of anxiety disorder in the EBD population has
100 3.82 .626
2. In your experience in the last five years the incidence of Attention-Deficit/Hyperactivity Disorder in the EBD population has
100 3.71 .715
3. In your experience in the last five years the incidence of depression in the EBD population has
98 3.66 .555
4. I am aware when a child has not taken his/her medication. 102 4.63 .5255. Medication significantly benefits students in terms of controlling their own behavior.
102 4.01 .724
6. Medication significantly improves academic performance of children with EBD.
101 3.98 .735
7. In my experience, medication has been a benefit to maintaining classroom control.
102 3.92 .841
8. Children with EBD receiving medication behave more appropriately in social situations than they would without the medication.
101 3.88 .864
9. Classroom behavior control would be much more difficult for me if children were not treated with prescription medication.
101 3.68 .916
10. Behavioral interventions can be as effective as medication for maintaining classroom control.
102 3.24 .925
11. I am concerned with the long-term impact of medication on children. 101 4.02 .88312. I believe that stimulant medication (e.g. Adderall) has few side effects. 97 2.95 .795 13. I believe that antidepressant medication (e.g. Paxil) has few side effects.
99 2.93 .732
14. I believe that antianxiety medication (e.g. Zoloft) has few side effects. 96 2.90 .70315. I believe that antipsychotic medication (e.g. Geodon) has few side effects.
92 2.77 .648
16. Most children with EBD are more teachable as a result of treatment with medication.
101 4.08 .744
17. Medication tends to improve a child’s social adjustment. 102 3.71 .83918. Most children with EBD are more likeable as a result of treatment with medication.
101 3.33 1.04
19. Medication tends to change a child’s natural personality. 102 2.74 .984
Statements 1-3 addressed opinions regarding recent trends of psychiatric disorders. Teachers tended to agree that the incidence of anxiety disorder, Attention Deficit/Hyperactivity Disorder and depression in the EBD population had increased within the last five years. Statements 4-10 assessed teachers’ attitudes concerning the effects of psychiatric medication on classroom behavior of students in EBD classrooms. In response to questions 4 and 5 the teachers agreed with the statements, I am aware when a child has not taken his/her medication, and Medication significantly benefits students in terms of controlling their own behavior. The teachers had a tendency to agree with question 6, Medication significantly improves academic performance of children with EBD and question 7, In my experience, medication has been a benefit to maintaining classroom control. On question 10, Behavioral
105

interventions can be as effective as medication for maintaining classroom control, the teachers’ responses were in the neutral range.
Statements 11-15 addressed opinions regarding the effects of psychiatric medications. The teachers agreed with question 11, I am concerned with the long-term impact of medication on children. However, teachers’ responses were in the neutral range to questions 12-15 concerning whether they believed stimulant medication, antidepressant medication, antianxiety medication, or antipsychotic medication, have few side effects.
Finally, questions 16-19 assessed teachers’ opinions regarding the social effects of psychiatric medication on their students. They agreed with question 16, Most children with EBD are more teachable as a result of treatment with medication.
DiscussionIncidence of Psychiatric DisordersFew studies have looked specifically at the prevalence of psychiatric diagnoses among children. An extensive review of existing literature conducted by Weisz and Jensen (1999) reported ADHD, depression, bipolar disorder, anxiety disorder, autism and obsessive-compulsive disorder to be among the most commonly treated psychiatric disorders occurring in childhood, even though the study did not specify actual prevalence rates. Similarly, results of the current study indicate that ADHD, anxiety disorder, bipolar disorder, and depression were the most prevalent psychiatric disorders occurring in children in EBD programs, with the exception of obsessive-compulsive disorder, which appeared very infrequently.
Incidence of Treatment with Psychiatric MedicationsCullinan, Gadow, and Epstein (1987) reported that of the 11% of children in EBD programs receiving pharmacological treatment, 71% were receiving stimulant medication. Children were treated with other types of psychiatric medications in only 3% of the EBD population at that time (Cullinan, Gadow, & Epstein, 1987). The current study revealed that of the 65% of children in EBD programs were receiving pharmacological treatment, 76% received stimulant medication alone or combined with other medications. In the current study children were treated with medications other than stimulants in 27% of the cases. In fact, almost 9% were being treated with antipsychotic medication and more than 15% of the children in EBD programs were receiving multiple psychiatric medications.
Changes in Rates of Psychiatric Medication Over TimeCullinen, Gadow, and Epstein (1987) reported that approximately 14% of children in EBD programs were receiving medication to treat all categories of psychiatric disorders including seizure disorder. In 1996 Runnheim et al. reported 40% of elementary school children in EBD classrooms in Wisconsin were receiving medication to treat ADHD. To date, only the current study has investigated the use of psychotropic medication in EBD classrooms since 1996. Results of the current study reveal that 65% of children in elementary EBD programs were receiving medication for treatment of psychiatric disorders, with 49.3% receiving psychopharmacological treatment for ADHD. In addition, the current study revealed 21.2% of children in elementary EBD programs were diagnosed with multiple psychiatric disorders and 15.2% of those diagnosed with multiple disorders were receiving concomitant multiple psychopharmacological treatment. Currently the proportion of children being treated for multiple disorders with multiple medications exceeds the proportion of children receiving any type of psychiatric medication in 1987.
Possible Adverse Effects and Drug InteractionsAn issue of concern related to side effects of medication is the use of antipsychotic medications with children. Data from the current study revealed an increasing number of children were receiving antipsychotic medication alone and in combination with other psychiatric medications. Risperdal was the antipsychotic medication used most frequently
106

with children in this study. The pharmaceutical company that produces Risperdal recently received a warning letter from the FDA stating the company had minimized the risks associated with Risperdal and made misleading claims regarding efficacy of the medication (FDA, 2004). The long-term effect this medication may have on children is generally unknown but drowsiness caused by the medication may hinder educational goals in the classroom.
The results of the current study highlight the need to address the issue of possible adverse drug interactions related to the use of multiple psychiatric medications in young children. Data from the study revealed that 15.2% of the children were receiving multiple psychiatric medications (two or more) and 6% of the sample was being treated with three or more medications. In the current study, the most common combination of medications was a stimulant taken concurrently with an antidepressant (SSRI). The combination of stimulants and SSRIs may enhance the risk of serious side effects in adults, but the type of interaction that may occur in children is unknown. Though existing research addresses interaction effects for pairs of medications, there is little research investigating the effects of three or more medications given in combination.
Teachers’ Attitudes of Childhood Psychiatric Disorders and Use of Medication Questionnaire data from the current study revealed teachers believe medication improves the behavior and learning ability of children in EBD classrooms. Teachers’ attitudes related to the target effects of psychiatric medication were generally positive while their attitudes related to side effects were generally in the neutral range. Other research indicates that teachers have not been aware of relevant information related to side effects of psychiatric medications (Snider, Busch & Arrowood, 2003). Research has shown that some medications, such as antipsychotics and antiseizure medications, may result in a number of cognitive or memory impairments that could interfere with learning (Forness & Kavale, 1988). Also, findings from a study conducted in 1984 suggest that antidepressant medication may have had adverse effects on children’s classroom performance (Forness & Kavale, 1988).
ImplicationsFirst, the current study reveals that the rate of treatment of psychiatric disorders of children in EBD programs has increased dramatically over the past 15 years. Research is needed to determine whether children in EBD programs have intensive and individualized behavioral, social, and educational interventions that are aimed at controlling and helping the child control the behaviors for which they are receiving medication. Medication can help to control symptoms while children are being treated, but children cannot learn from medication. Historically, EBD teachers employed behavioral, social and academic interventions to address the issues evinced by the children in their program. Results of the current study indicate that there is an increasing trend towards using pharmacological interventions in educational settings.
The increase in the use of medication for the treatment of psychiatric disorders and school related issues in the absence of research supporting long-term efficacy of such treatment may be attributed to the increased acceptability by society, professionals and teachers. Results of the current study revealed that teachers were aware of the positive impact medication had on controlling the behavior of children in their classroom. Teachers were less aware of the side effects and lack of long-term efficacy data related to the use of medication.
Secondly, results of the current study revealed that children in EBD programs were treated with antipsychotic medication more frequently than in the past. This trend raises questions based on the known side effects associated with such medications. Teachers should be made aware of the documented long-term effects of antipsychotic medication in the population of institutionalized children with mental retardation, and the possibility that these medications may interfere with a child’s ability to learn. (Gualtieri, Schroeder, Hicks, & Quade, 1986).
107

Finally, a significant proportion of students in EBD programs received multiple medications for multiple disorders. This finding is important because the impact of single medications on developing children is often unclear, and the impact of multiple medications is unknown. Research reveals that the potential side effects of single and multiple medications ranges from a negative effect on growth rate to impaired development and learning in young children (MTA, 2004; Forness & Kavale, 1988). The treatment of children with multiple psychiatric medications is a nascent trend and positive as well as negative long-term effects of such treatment are unknown.
LimitationsApproximately 30% of the questionnaires were returned which raises the question of whether the returned sample is representative of the original random sample. One reason the return rate was not higher may be that the questionnaire did ask teachers to provide a great deal of information that may have required them to do some research. However, the obtained data was very much in line with the results reported by Runheim, et al. (1996). In fact, the increased rate of stimulant use from the time of the Runheim et al. (1996) study to the time of the current study agreed with other data indicating similar increases in rates of stimulant treatment with children (Lefever & Dawson, 1999). The same consistency was also found in relation to the use of multiple medications (Moline and Frankenberger, 2001). The internal validity of the study was assessed via two different methods used to identify the percent of children receiving medication. Teachers were asked to specify the number of children in their EBD program and the number of children who were being treated with medication. They were also asked to provide detailed information on each child receiving medication. Both the initial number identified as receiving medication and the actual number of children for which detailed information was provided correlated exactly.
ReferencesAmbrosini, P.J. & Sheikh, R.M. (1998). Increased plasma valproate concentrations when coadministered with guanfacine. Journal of Child & Adolescent Psychopharmacology, 8,143-147.American Academy of Pediatrics. (1987). Committee on children with disabilities, committee on drugs. Medication for children with an attention deficit disorder. Pediatrics, 80, 758-760.American Psychiatric Association. (1994). Diagnostic and Statistical Manual of Mental Disorders (4th ed.). Washington DC: Author. aacap.orgAspenson, M. R., Frankenberger, W. R., & Snider, V. E. (1996). Using stimulant medication to treat children with learning disabilities and attention-deficit hyperactivity disorder. Manuscript submitted for publication.Bolanos, C.A., Barrot, M, Berton, O, Wallace-Black, D, Nestler, E.J. (2003). Methylphenidate treatment during pre-and periadolescence alters behavioral responses to emotional stimuli at adulthood. Biological Psychiatry, 54(12), 1317-1329.Brandon, C.L., Marinelli, M., Baker, L.K., White, F.J. (2001). Enhanced reactivity and vulnerability to cocaine following methylphenidate treatment in adolescent rats. Neuropsychopharmacology, 25(5), 651-661. Bussing, R., Zima, B.T., & Belin, T. (1998). Variations in ADHD treatment among special education students. Journal of the American Academy of Child & Adolescent Psychiatry, 37, 968-976. Carlezon, W.A.jr., Mague, S.D., Andersen, S.L. (2003). Enduring behavioral effects of early exposure to methylphenidate in rats. Biological Psychiatry, 54(12), 1330-1337.Coyle, J. (2000). Psychotropic drug use in very young children. Journal of the American Medical Association,8, 1059-1061.Cullinen, D., Gadow, K. D., & Epstein, M. H. (1987). Psychotropic drug treatment among learning-disabled, educable mentally retarded, and seriously emotionally disturbed students. Journal of Abnormal Child Psychology, 15, 469-477.
108

Delate, T., Gelenberg, A.J., Simmons, V.A., Motheral,B.R. (2004). Trends in the use of antidepressants in a national sample of commercially insured pediatric patients, 1998 to 2002. Psychiatric Services: A Journal of the American Psychiatric Association, 55(4), 387-391.Drug Enforcement Administration (DEA). (2002). Yearly aggregate production quotas (1990-2000). Office of Public Affairs, Drug Enforcement Administration, Washington, DC. Drug side effects, interactions, and information. (n.d.). Drug Information Online. Retrieved March 4, 2004, from http://www.drugs.com.Emslie, G.J., Rush, J., Weinberg, W.A., Kowatch, R.A., Hughes, C.W., Carmody, T., & Rintelmann, J. (1997). A double-blind, randomized placebo-controlled trial of fluoxetine in children and adolescents with depression. Archives of General Psychiatry, 54(11), 1031-1037. Epstein, M. H., Singh, N. N., Luebke, J., & Stout, C. E. (1991). Psychopharmacological intervention II: Teacher perceptions of psychotropic medication for students with learning disabilities. Journal of Learning Disabilities, 24, 477-483.Forness, S. & Kavale, K.A. (1988). Psychopharmacologic treatment: a note on classroom effects. Journal of Learning Disabilities, 21(3).Food and Drug Administration (FDA). (2004). FDA Public Health Advisory: Worsening depression and suicidality in patients being treated with antidepressant medications. Frankenberger, W., Lozar, B., & Dallas, P. (1990). The use of stimulant medication to treat attention deficit hyperactive disorder (ADHD) in elementary school children. Developmental Disabilities Bulletin, 18, 1-13.Gualtieri, C.T., Schroeder, S.R., Hicks, R.E., & Quade, D. (1986). Tardive dyskinesia in young mentally retarded individuals. Archives of General Psychiatry, 43(4), 335-340.Keller, M.B., Ryan, N.D., Strober, M., Klein, R.G., Kutcher, S.P., Birmaher, B., Hagino, O.R., Koplewicz, H., Carlson, G.A., Clarke, G.N., Emslie, G.J., Feinberg, D., Geller, B., Kusumaker, V., Papatheodorou, G., Sack, W.H., Sweeney, M., Wagner, K.D., Weller, E.B., Winters, N.C., Oakes, R., & McCafferty, J.P. Efficacy of paroxetine in the treatment of adolescent major depression: a randomized, controlled trial. Journal of the American Academy of Child & Adolescent Psychiatry, 40(7), 762-772.LeFever, G., & Dawson, K (1999). The extent of drug therapy for attention deficit hyperactivity disorder among children in public schools. American Journal of Public Health, 89, 1359-1364.Mattison, R.E. (1999). Use of psychotropic medications in special education students with serious emotional disturbance. Journal of Child & Adolescent Psychopharmacology, 9(3), 149-155. McKinney, J. D., Montague, M., & Hocutt, A. M. (1993). Educational assessment of students with attention deficit disorder. Exceptional Children, 60, 125-131.MTA Cooperative Group. (2004). National institute of mental health multimodal study of ADHD follow-up: changes in effectiveness and growth after the end of treatment. Pediatrics, 113(4), 762-769. Moline, S., & Frankenberger, W. (2001) Use of stimulant medication for treatment of attention-deficit/hyperactivity disorder: A survey of middle and high school students’ attitudes. Psychology in the Schools, 38(6),1-16.Psychiatric medications for children and adolescents. (nd). American Academy of Child and Adolescent Psychiatry. Retrieved July 15, 2004, from http://www.aacap.org/.Rowland, A.S., Umbach, D.M., Stallone, L., Naftel, A.J., Bohlig, E.M., & Sandler, D.P. (2002). Prevalence of medication treatment for attention deficit hyperactivity disorder among elementary school children in Johnston County, North Carolina. American Journal of Public Health, 92(2), 231-234. Runnheim, V., Frankenberger, W., & Hazelkorn, M. (1996). Medicating Students with Emotional and Behavioral Disorders and ADHD: A State Survey. Behavioral Disorders. 21(4), 306-314.Rushton, J.L, Clark, S.J., & Freed, G.L. (2000). Primary care role in the management of childhood depression: a comparison of pediatricians and family physicians. Pediatrics, 105(4), 957-962.
109
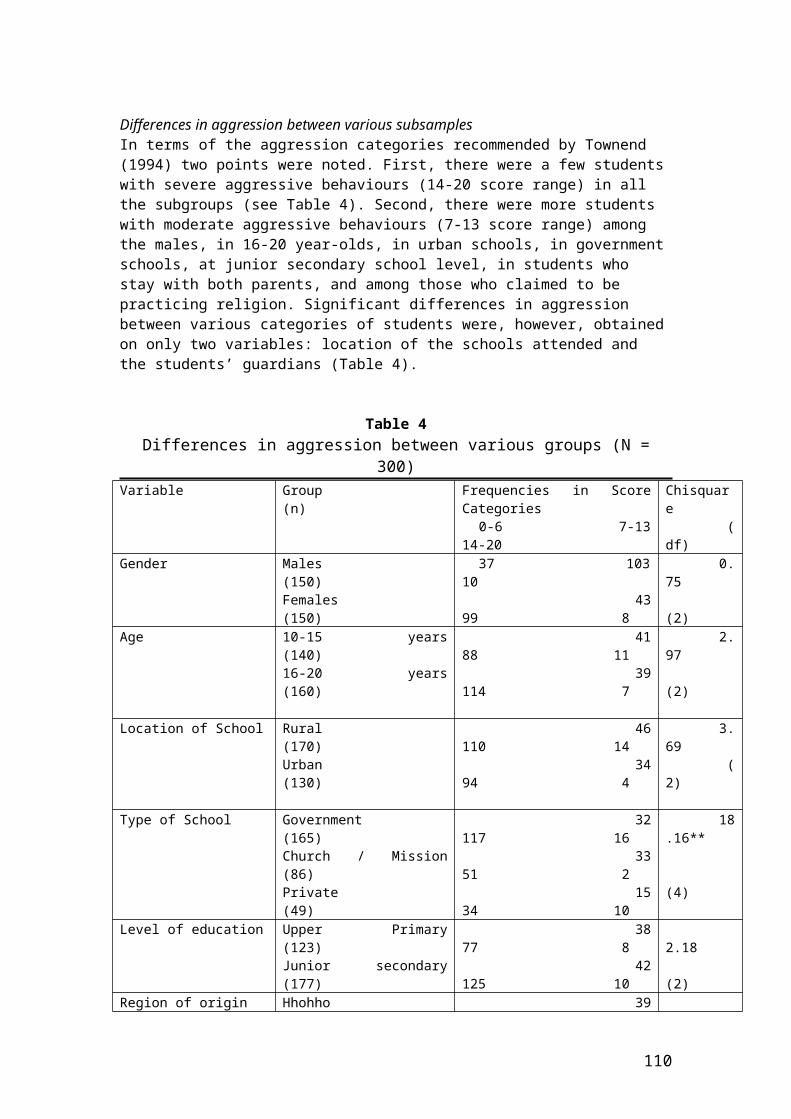
Rushton, J.L. & Whitmire, J.T. (1998). Pediatric stimulant selective serotonin reuptake inhibitor prescription trends. Archives of Pediatrics and Adolescent Medicine, 155(5), 560-565. Safer, D. J. & Krager, J. M. (1988). A survey of medication treatment for hyperactive/inattentive students. JAMA, 260, 2256-2258.Safer, D., Zito, Magno, J., dosReis, S (2003). Concomitant Psychotropic Medication for Youths. American Journal of Psychiatry, 160 (3), 438-449. Snider, V., Busch, T., & Arrowood, L. (2003) Teacher knowledge of stimulant medication and ADHD. Remedial and Special Education, 24(1):46-56.Weisz, J.R. & Jensen, P.S. (1999). Efficacy and effectiveness of child and adolescent psychotherapy and pharmacotherapy. Mental Health Services Research, 1(3), 125-153. Wiznitzer, M. & Findling, R.L. (2003). Why do psychiatric drug research in children?. Lancet, 361 (9364), 1147-1148. Zito, J.M, Safer, D.J., dosReis, S., Gardner, J.F., Soeken, K., Boles, M, & Lynch, F. (2002). Rising prevalence of antidepressants among US youths. Pediatrics, 109(5), 721-727.
110

EARLY IDENTIFICATION AND INTERVENTIONS FOR CHILDREN AT RISK FOR LEARNING DISABILITIES
Stephen M. Lange&
Brent ThompsonWest Chester University of Pennsylvania
We propose that a model for early screening of children aged 3-5 years for vulnerability for learning disabilities risk can result in preventive interventions, including collaborative interventions planned through parent-professional partnership. The goals of screening and preventive services would be to mitigate increased risk of learning disabilities in elementary school years. The present article describes the rationale for early screening, dimensions that should comprise brief screening tools for use from ages 3-5 years, and potential preventive interventions that have empirical support.
The diagnosis of learning disabilities is often determined when children begin to exhibit academic difficulties in school, and the average age when children receive learning disabilities assessments is 9years (Shaywitz, 1998). Delayed intervention can result in adverse and persistent consequences for academic skill acquisition. In contrast, early identification of children at risk for learning disabilities may offer the potential to mitigate the negative effects of delayed intervention by directing children to preventive services at an earlier age. This is persuasively argued by a National Institutes of Health consensus report, Emergent Literacy Workshop: Current Status and Research Directions, which asserted that diagnosis at kindergarten or first grade is too late (National Institutes of Health [NIH], 2000).
A Developmental Model of Learning DisabilitiesA complicating issue in learning disabilities intervention generally, with implications for prevention, is the ongoing debate surrounding definition of learning disabilities and how – or whether -- they may be appropriately diagnosed. We assume that learning disabilities can be defined as an adverse developmental outcome (Geary, 2004; Gersten, Jordan & Flojo, 2005) resulting in unexpected and significant (Fletcher, Coulter, Reschley & Vaughn 2004) difficulty with basic academics. We assume that learning disabilities result from multiple vulnerabilities that arise from biological, psychological, and social systems and their complex interactions (Rueda, 2005). Specifically, children who demonstrate learning disabilities during their elementary school years demonstrate early biological vulnerabilities including a genetic liability for mild cognitive delays or low birth weight. Once biologically vulnerable children begin to lag behind peers, their interaction with their social world and with modes of instruction systematically differ from their peers’. The interaction between an earlier vulnerability and response to intervention has been specifically studied for children who demonstrate reading disorders: Once children who have greater difficulty than peers developing reading fluency they begin to lose opportunities to practice reading connected discourse as they spend increased time learning foundation skills such as phonetic decoding. This places initially struggling readers at a continuing disadvantage as they progress through public education. Further, children who initially struggle to read passages lose access to the language experiences and content information available in print (Torgesen, 2000). Consequently, we propose a cross-theoretical, evidence-based standard for identifying vulnerabilities to target for prevention. In other words, early developmental factors that consistently predict learning disability diagnosis merit consideration as targets for preventive services, and are presumed to confer vulnerability. Differing theoretical positions regarding the etiology of the learning disability construct may
111
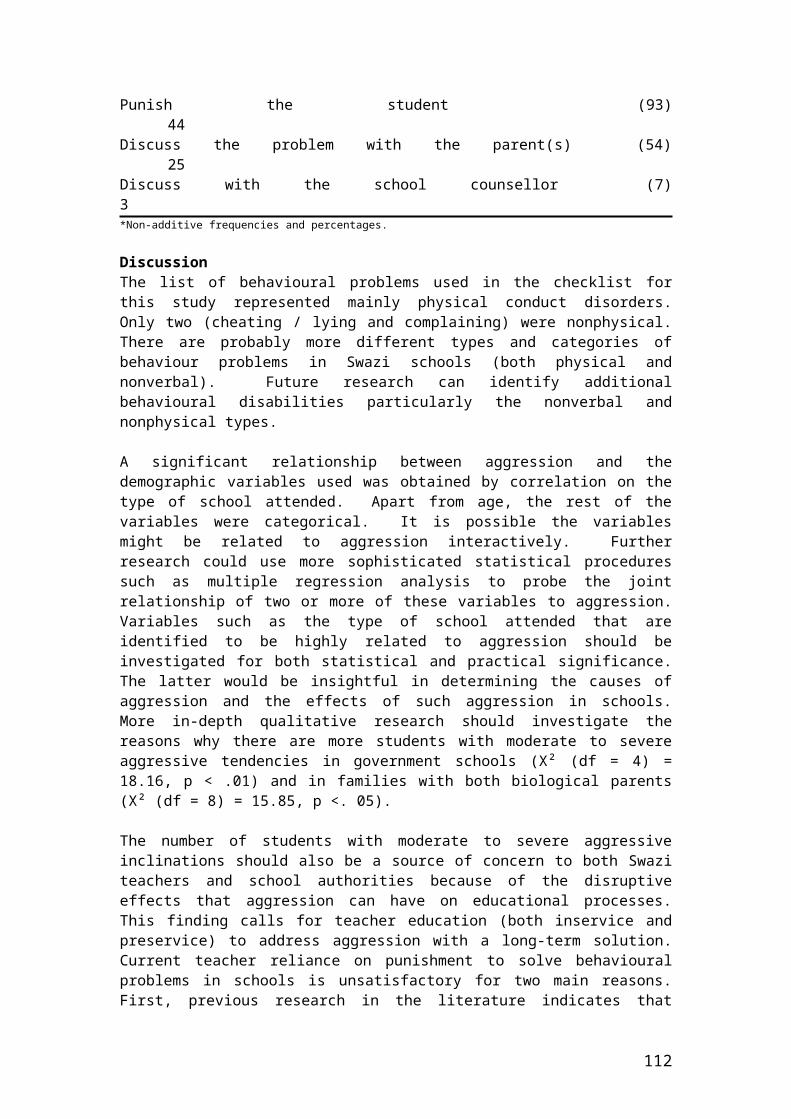
lead to preventive services that emphasize different vulnerabilities, and approaches which target different vulnerabilities are not presumed to be mutually exclusive. For example, Head Start is an example of a very comprehensive preventive intervention for academic failure that simultaneously intervenes with multiple, interacting, and dynamic systems including familial, community, economic, psychological, and biological systems. The purpose of our paper is to focus attention on the development of prevention strategies that identify young children who demonstrate a set of intrinsic, presumably organically determined vulnerabilities, particularly those that are associated with mild cognitive impairment and more specifically language delays. The importance of developing prevention strategies that mitigate risk for learning disabilities is suggested by the consensus criteria used to determine how to invest prevention resources: Priority is assigned to disorders that have a high prevalence, and those which are associated with developmental trajectories that can result adverse behavioral, social, and psychological outcomes (Biglan, Mrazek, Carnine & Flay, 2003). Learning disabilities are indeed prevalent, and as many as 17 percent of the population may have learning disabilities (Lyon, 2005). The importance of early intervention for children at risk for learning disabilities is further illustrated by their potentially pervasive effects on development. While those with learning disabilities constitute a heterogeneous and diverse population with varied outcomes, adverse consequences of learning disabilities can persist across the lifespan and extend beyond academic skill acquisition to more complex developmental tasks (National Research Center on Learning Disabilities [NRCLD], 2002). During childhood, individuals with learning disabilities face a complicated and challenging task of integrating their disability into an emerging self-concept. Children who have difficulty with this task and employ immature strategies such as denial or disavowal can become harsh self-critics. These children thus have an increased lifetime risk for a broad range of psychiatric disorders (Esser, Schmidt, & Woerner, 1990), and particularly depressive disorders and Posttraumatic Stress Disorder (McNulty, 2003). For example, when compared to other pupils, college students with learning disabilities were found to be nearly three times more likely to have depressive illness, and have more problems with their grades and quality of their coping skills (Arnold, 2000). Even when the consequences of learning disabilities such as harsh self-appraisal do not merit psychiatric diagnoses, children and adults with learning disabilities can still experience diminished confidence in the efficacy of their own academic, cognitive, and occupational efforts, having internalized repeated exposure to frustration (Cummings, Maddux, & Casey, 2000). As members of the adult workforce, those with learning disabilities are more likely to experience unemployment, or underemployment, and to earn less than non-disabled adults (Cummings et al., 2000). Even among adults who possess college degrees, routine workplace demands can prove more difficult for employees with learning disabilities than for their coworkers, diminishing their productivity and value to employers (Dickenson & Verbeek, 2002).
During early childhood, the term vulnerability aptly describes risk for learning disabilities. By itself, assessment that identifies biological risk factors for learning disabilities are neither sensitive nor specific enough for learning disability diagnosis (Jenkins & O’Connor, 2002; O’Connor & Jenkins, 1999; Schatschneider & Torgenson, 2004). The responsibility for surveillance is shared among multiple social systems including families and the medical care, daycare and educational systems. In particular, physicians and other professionals who interact with young children and who have training in child development are encouraged to provide surveillance for early signs of language and learning disorders (AAP, 2001).
Biological Predictors Vulnerabilities for Learning DisabilitiesOrganic factors are indeed associated with increased risk of learning disabilities (Scarborough, 1990). These include genetic liability for mild cognitive disorders, low birth weight, and previous evidence of comorbid mild cognitive disorders. With respect to genetic
112

liability, studies of heritability of learning disabilities indicate that the parent-child and sibling concordance rates for learning disabilities are 25-60% and 40% respectively. Multi-gene transmission of learning disabilities is the suggested mechanism (Olsen, Wise, Conners, Rack, & Fulker, 1989; Plomin & Walker, 2003). Because genes implicated in transmission of learning disabilities may also be implicated in other cognitive disorders, siblings and children of individuals with Attention Deficit Hyperactivity Disorder (ADHD) and Autistic Spectrum Disorders need to be considered at risk as well (Faraone & Biederman, 1993; Williams, Oliver, Allard, & Sears, 2003). Low birth weight (birth weight less than 2500 grams or approximately 5 pounds- 6 ounces) predisposes children to delays in development of visuo-spatial and language skills, especially for children with socio-familial stressors such as poverty, or who need more intensive medical intervention following birth (Breslau, Johnson, & Lucia 2001; Kanzawa, Shimizu, Kamada, Tanabe, & Itoigawa, 1997; Ross, Lipper, & Auld, 1996; Stanton-Chapman, Chapman, & Scott, 2001). Finally, with respect to prior diagnosis of mild cognitive disorders, a previous ADHD diagnosis indicates learning disabilities vulnerability. ADHD has a high rate of co-morbidity with learning disabilities with as many as 66% and 27% of children with ADHD experiencing either written language or reading disabilities, respectively (Mayes, Calhoun, & Crowell, 2000). Because of the high rate of co-morbidity as well as common cognitive features of the two disorders, Mayes and her colleagues, along with others (e.g., Marshall & Hynd, 1997), propose that ADHD and learning disabilities represent overlapping spectrum disorders. Language Development and Learning DisabilitiesAcademic achievement across the curriculum is inherently dependent on language, and from a developmental perspective, academic achievement, particularly but not exclusively reading and writing skills, represent the culmination of a process that begins early in a child’s development, with the emergence of oral language (Lyon, 2004). This developmental process includes experiential exposure to concepts, cultural information, and vocabulary; development of phonemic awareness; rapid and automatic access to vocabulary; and letter-, word-, paragraph- and book-level orthographic skills. Orthographic skills subsume basic concepts of print including understanding that print conveys information, that print is read in a predictable direction; that books are used in predictable ways, and especially that written symbols correspond to speech sounds – termed the alphabetic principle (Lyon, 2004; Lindquist, 1982; Nichols, Rupley, Rickelman, & Algozzine, 2004; Scarborough, 1990; Torgesen, 2000; Torgesen & Wagner, 1994; Wolf, Bowers, & Biddle, 2000).
Reading and written language disorders are the most frequently diagnosed learning disabilities (Gonzales & Nelson, 2003; Robinson, Menchetti & Torgesen, 2002). Relatively fewer students present with math disabilities, and approximately 4 or every 10 students with a mathematics disability demonstrates a co-morbid reading disorder (Robinson et al, 2002). Students with mathematics disabilities, including those without co-morbid reading disorders, frequently display deficits in foundational language skills, including assigning semantic and phonetic meaning to numerals, semantic retrieval, and verbal fluency which contribute to poor mathematics achievement (Desoete & Roeyers, 2005; Mazzocco, 2005; Mazzocco & Thompson, 2005; Robinson et al, 2002).
Standards for Screening ToolsScreening tools that focus on early vulnerabilities for learning disabilities should quickly and unambiguously screen for both organic and language differences that confer vulnerability for learning disabilities before child attain school age. While screening tools are by definition not as comprehensive as diagnostic assessment, they can provide information about individuals’ cognitive strengths and weaknesses and may be used for selecting children for further assessment or for preventive interventions (Lonigan, 2005). A screening tool should ideally incorporate interview questions for parents or other caretakers about demographic risk factors as well as tasks administered to children that screen for weaknesses in foundational language skills including rapid access to vocabulary and phonemic awareness. The advantages of
113
combining parental report with tasks presented to children include enlisting parents as active, respected participants (AAP, 2001). Finally, screening tools should provide a written record for each screening, conferring two advantages; first, directing the screener’s attention to each domain assessed, and second, providing benchmarks for comparisons over time. While each screening tool item should be referenced to a risk factor, the tool may not necessarily produce a norm-referenced summative score as a child who has one or more risk factors should be referred for further assessment and be considered for preventive interventions.
Table 1 provides a list of dimensions that should be represented in a screening tool with examples of items.
Table 1Sample Screening Questions and Tasks, Risk Factor Assessed
Parent Demographic Interview Questions Risk FactorWas your child’s birth weight less than 5 pounds or 2500 grams? Low Birth Weight
Does your child have a mother, father, sister, or brother with a learning Disability, ADHD, or an Autistic Spectrum Disorder, even if it was not formally diagnosed?
Heritability of Cognitive Disorders
Does your child have a diagnosis of ADHD? Comorbidity of LD with ADHD
Was your child combining words into short sentences or phrases by the time s/he was 2 years old?
Delayed Speech
Parent Reading Observations Interview QuestionsDoes your child “read” signs like “Coke” or McDonalds?” Orthographic Skill/
Environmental PrintDoes your child recognize parts of a book such as the cover, title, and end?Does your child point to words or letters he or she knows when reading a book?
Print Knowledge
Does you child recognize or write the letters of his or her name or other words?
Sample Tasks Administered to Children Risk FactorRhyme Detection
Segmenting Words into Phonemes
Blending Phonemes to Form Words
Phonemic Awareness
Letter Naming Orthographic Skill
Letter-Sound Correspondence Alphabetic Principle
Rapid Categorical Naming Rapid Access to Vocabulary
Currently available screening tools for prediction of learning disabilities are primarily used with children age 4 years or older (e.g., National Center for Learning Disabilities [NCLD}, 2001). Two comprehensive reviews of these measures are provided by Jenkins and O’Connor (Jenkins & O’Conner, 2002; O’Conner & Jenkins, 1999). The tools they reviewed have some important limitations: Most include assessment of beginning reading skills such as alphabet knowledge, in addition to developmentally earlier language functions. Combining surveillance for demographic risk factors with direct assessment of foundational language skills appropriate for 3 year-old children would provide optimal opportunities for early prevention. According to O’Connor and Jenkins (1999), some predicative assessments take as long as one hour to administer. Because developmental screening typically needs to be repeated over time due to the dynamic nature of development, lengthier assessments have limited utility in most practical settings where screening is likely to occur.
114

An example of a brief (less than 10 minutes to administer) screening tool is Get Ready to Read! (NCLD, 2005). The 20 questions that comprise Get Ready to Read! do not require oral responses, and children are asked to choose one of four pictures to answer each item. This tool was designed so that it can be administered by individuals without specialized assessment training. In a review of the tool by Lonigan (2005), its purpose is described as providing a snapshot of foundational language skills that can become targets for preventive intervention. Lonigan differentiates between this purpose and diagnostic evaluation which would provide more detailed information about cognitive strengths and weaknesses. Domains assessed include letter, word, and book level orthographic skills and phonemic awareness. Concurrent and predictive validity for Get Ready to Read! screening at age 4 years have been demonstrated through correlation with other preschool measures and with reading measures (word recognition and phonetic decoding skills) at age 7 years. Get Ready to Read! provides norm-referenced scores. Cut-off scores for decision making are not provided. Spanish and English versions of the tool are available (Lonigan, 2005).
Preventive Services for Children Identified as VulnerableLogically, to have any value screening needs to lead to effective preventative services. While empirically validated preventive interventions are preferable, consensus standards for evaluating prevention programs have not emerged (Biglan et al, 2003). Proposed standards for evaluating intervention effectiveness consider an intervention to be well-established when two or more well-conducted and well-described group-design studies demonstrate the intervention’s superior effectiveness to placebo treatment, or equivalent effectiveness to an already established treatment. Additionally, an intervention can be deemed well-established when its effectiveness is supported by a large number of single-case design studies by multiple researchers at multiple sites. Probably efficacious interventions are supported by more limited evidence, such as two or more studies that do not provide comparison to placebo or already established treatment, or a small number of single-case design studies (Shepard & Carlson, 2003). Further, Justice and Kaderavek (2004) propose that interventions likely to confer benefit to children include combinations of direct intervention by professionals, and indirect interventions which are collaboratively planned by professionals and parents to occur in naturalistic settings. Justice and Kadervek argue that combining direct and collaborative interventions increases the amount of children’s time devoted to intervention as well the ecological validity of interventions. Further, Shepard & Carlson (2003) propose that effective early-childhood preventive interventions are collaboratively planned with parents, view parents as important resources, respect cultural differences, and flexibly accommodate parent’s schedules. A set of proposed preventive interventions that may have utility for children identified as at risk for learning disabilities is briefly described below. The selection of preventive interventions is influenced by the perspective that language deficits that contribute to learning disabilities are observable in early childhood and further that these early language deficits place children on a developmental trajectory associated with later learning disabilities. Consequently, remediation of early language deficits represents the most appropriate target for intervention for children at increased learning disabilities risk. The interventions described target language development during early childhood using an ecological view of language development as occurring in natural contexts such as home, preschool, and community. These proposed interventions incorporate the recommendations offered by Justice and Kadverek (2004) and Shepard and Carlson (2003) that programs emphasize parent-professional partnership, and are supported by group-design effectiveness studies. However, a limitation associated with empirical support for these interventions is the selection of outcome variables in their effectiveness studies. Typically, these interventions demonstrate benefit in terms of language skill development. This does not directly imply that preventive interventions would change either the subsequent incidence of learning disabilities or the severity of disability among those who receive the interventions. Intervention outcome studies that directly assess the relationship between language intervention in early childhood and learning disabilities rate and severity would represent a gold standard for intervention effectiveness.
115

Indirect Interventions: Parent Education and ConsultationImproving Parental Language Models. Language development is mediated by experience with language models, and parents provide apprenticeship experiences for language complexity. Critical parent skills for improving children’s language include responsiveness and sensitivity to the social and affective intention of children’s communication. Parents facilitate children’s language growth when they imbue communication with positive affective tone, and provide affirmation for children’s communicative intent, and by modeling rich, complex use of language (Dodici, Draper, & Peterson, 2003). Parent behaviors that improve language development are teachable skills and professional-parent consultation can improve parents’ length of utterances, responsiveness to children’s communication, contingent use of praise for children’s communication, use of language expansion, modeling of language pragmatics such as attentive listening and turn-taking in conversation, and understanding of the differences between children’s and adults’ language development. Developmental awareness includes, for example, the need for parents to pause before responding or interrupting during conversation to accommodate their children’s slower processing speed. Systematic intervention through parent-professional partnership can increase children’s spontaneity of language, length of utterances, and variety of language forms, while decreasing yelling and oppositional behavior (Hancock, Kaiser, & Delaney, 2002).
Improving Children’s Creative and Narrative Play. Interventions designed to improve the complexity and maturity of vulnerable children’s play also confers substantial and measurable benefit in terms of their vocabulary development, length of utterances, and language complexity and diversity. Teaching adults, including parents and other caretakers, to systematically guide complex, imaginative, and social play with peers through introduction of ideas and themes for play, providing ideas for roles and narratives, unobtrusively moderating play through modeling, prompting, and providing feedback, and by aiding in recall and discussion of play experiences when play is over, facilitates children’s practice of language pragmatics, sustained social interaction, problem solving through negotiation, and exposes children to language models provided by peers during play. As well, facilitating mature, imaginative, and social play can increase the likelihood that children will derive satisfaction from play and social interaction, reinforcing communication attempts (Craig-Unkefer & Kaiser, 2002). Parent-child word games can also play an important role in facilitating language development (Hornby & Jensen-Proctor, 1984), including old games such as I spy, or 20 Questions.
Improving Orthographic and Phonemic Skills through Shared Reading. Shared reading provides children, even at very young ages, with models of reading, exposure to the phonological system of language, and information about how books and print are organized to convey information. As well, parents who read with their children provide them with important opportunities for interaction using language and encourage competence and active engagement in both communication and literacy (Woude & Barton, 2003). Thus, shared reading confers a double benefit of increased opportunities to practice listening and speaking with an adult model as well as opportunities to learn about written language through books. Unfortunately, several studies that assessed the frequency of shared reading in homes revealed that a minority of parents read to their children (Celano et al., 1998; Heubner, 2000), perhaps as few as one in four (Klass et al., 2003). Hypothesized obstacles to shared reading include role strain experienced by parents who cope with financial stressors and increased work demands in a turbulent economy (Huebner, 2000). This has a disproportional affect on shared reading in families who are at risk due to poverty, limited parental education, or membership in ethnic or language minorities (Celano et al., 1998; Huebner, 2000; Klass et al., 2003; Washington, 2001). As well, the frequency and quality of shared reading varies between families and depends on parents’ own literacy skills, beliefs about literacy, and their children’s enthusiasm for reading (Celano et al., 1998).
116

Despite the obstacles parents and children face, collaborative interventions that teach parents to enhance shared-reading experiences can increase both the frequency of shared reading and the quality of shared reading. Demonstrations of effective interventions based upon parent education have been as brief as three one-hour sessions (Hockenberger, Goldstein, & Haas, 1999). The common elements of effective intervention across studies include increasing frequency and duration of shared reading, and teaching parents to intentionally and reflectively use specific questions and prompts. Enriched adult questioning and prompting can focus on expanding the complexity of children’s use of language for communication and concept formation, as in Dialogic Reading created by Whitehurst and his colleagues (Zevenbergen, Whitehurst, & Zevenbergen, 2003), and on focusing children’s attention on orthographic and phonemic information conveyed by literature including book-level, paragraph-level, word-level, and alphabetic information. Prompts aimed at developing pre-literacy skills typically instruct children to locate, identify, or name characteristics of book organization, such as left to right and top to bottom organization of text, recognition of words in context, and letters and their sounds (Celano et al., 1998; 2002; Hokenberger et al., 1999; Huebner, 2000; Justice, Weber, Ezell, & Bakerman, 2002). Shared reading can be encouraged through use of books with strong rhyming patterns and repetition of sounds, celebration of reading through activities linked to books (Allor & McCathren, 2003), and building on families’ existing communication and literacy patterns and strengths (Justice & Kaderavek, 2003). Importantly, both parent and professional readers can enrich their shared reading skills during shared reading, with measurable benefits for children, especially when interventions are implemented both at home and by professionals (Crain-Thoresen & Dale, 1999; Whitehurst & Lonigan, 1998).
Reach Out and Read provides an example of shared reading intervention provided within a primary health care context (Klass et al., 2003). Assessment of children’s print knowledge by handing books to preschool children during well visits is an essential element of Reach Out and Read. In-office assessment offers direct observation of how children handle books as well as the quality of their verbal, motor, and affective responses to print. Reach Out and Read intervention additionally provides volunteer readers who model shared reading in pediatric waiting rooms; guidance for parents and other caretakers that provide specific information about child development, literacy development and shared reading; and a gift of a developmentally appropriate book at each visit. Program evaluations demonstrated increased frequency of shared reading, particularly among families at lower income levels and families who are members of language minorities. In addition to increasing frequency of shared reading, the Reach Out and Read program enhanced the emotional valance of shared reading, with parents reporting greater satisfaction with shared reading as an activity and greater responsiveness to shared reading among their children. Most importantly, Reach out and Read children experienced significantly greater receptive and expressive language gains compared to age-matched controls (Klass et al., 2003).
Direct Interventions Provided by ProfessionalsDirect intervention for young children at risk for learning disabilities or other poor reading outcomes from pre-school through first grade is considered a promising approach to catch them before they fail (Hus, 2001). However, preventive interventions typically demonstrate effectiveness for groups of children while individual children experience widely disparate outcomes (Gonzales & Nelson, 2003). This variation may result from differences in severity of deficits evident among children identified as at-risk, with children having the most severe impairments experiencing the smallest gains from prevention programs (Torgesen, 2000). Although the elements required for successful preventive services are not well understood, Torgesen (2000) advises that preschool prevention provide instruction that is explicitly related to literacy as opposed to language development more generally. Because acquisition of phonemic and orthographic skills appear to represent mutually dependent processes (Castles & Coltheart, 2004; Christensen, 1997; Korkman & Peltoma, 1993), typical interventions focus on explicit instruction in phonemic skills, including rhyming, segmenting, and blending
117
sounds; letter recognition; and letter-sound correspondences, mirroring Torgesen’s recommendation. Evaluations of preventive interventions which included control or comparison groups that received no or nonspecific intervention indicate that intervention is associated with improvements in precursor language skills (Allor & McCathren, 2004; Rvachew, Nowak & Cloutier, 2004), as well as later improvement in reading and spelling outcomes up to two years following intervention (Allor & McCathren, 2004; Hus, 2001; Korkman & Peltoma 1993; Schneider, Ennemoser, Roth, & Kuspert, 1999; Vadasy, Jenkins, & Pool, 2000). Effective preventive practices have been demonstrated in diverse settings using a variety staff to provide intervention. Examples include adding explicit reading prevention instruction to speech and language therapy provided by speech and language pathologists (Pokorni, Worthington, & Jamison, 2004; Rvachew, Nowak, & Cloutier, 2004), small-group intervention carried out by psychologists, educators, and speech and language pathologists in mental health, medical, and school settings (Korkman & Peltoma, 1993) and by college students with several hours of training (Allor & McCathren, 2004), as well as by volunteers with similarly minimal training (Vadasy et al., 2000) . As well, the duration of intervention programs vary, with successful programs lasting as few as 9 weeks (Hus, 2001) and as long as one school year (Allor & McCathren, 2004), with session lengths as brief as 15 minutes (Schneider et al., 1999). Vulnerable children are best served by programs which ensure fidelity of intervention practices by providing staff training prior to and during intervention, as well as those that use structured and packaged formats that explicitly guide intervention (Allor & McCathren, 2004; Korkman & Peltoma 1993).
DiscussionAcademic skills represent the culmination of a continuous process of language development beginning in early childhood. Genetic liability for learning disabilities, low birth weight, and delayed development of early language skills can predispose children to learning disabilities thus mediating the language development process. Viewed from a developmental perspective, professionals working with vulnerable children and their families can provide early intervention that offers opportunities to facilitate the language development of children with increased risk for learning disabilities, possibly mitigating their risk for later developing learning disabilities. Specifically, professionals who have daily interaction with children can help parents and other caretakers identify children’s vulnerabilities through use of screening tools, and promote through education and collaboration development of home literacy environments (Payne, Whitehurst & Angell, 1994) that offer enriched opportunities to develop foundational language skills associated with literacy. In addition to collaborative, indirect interventions, screening to identify vulnerable children can lead to appropriate referral for direct services including diagnostic assessment, an educational, speech and language, and related programs.
While empirical support provides evidence for the efficacy of preventive services in enhancing foundational language skills, this evidence does not establish that rates of learning disabilities diagnosis would decline as a result of preventive services. Approaches to demonstrating the benefits of prevention on disability frequency or severity are suggested in the broader prevention literature and are relevant to learning disabilities prevention efforts. These include establishing registries of prevention trials to collect and aggregate longitudinal and outcome data for children who receive preventive services, with emphasis on documenting the relationship between prevention and disability, on collecting long-term follow-up data , and on establishing local monitoring systems to describe both how research-based interventions are carried out locally in practice settings and the effectiveness of the programs (Biglan et al, 2003; Shepard & Carlosn, 2003).
ReferencesAllor, J. H., & McCathren, R. B. (2003). Developing emergent literacy skills through storybook reading. Intervention in School and Clinic, 39(2), 72-79.Allor J.H. & McCathren, R.B. (2004). Learning disabilities practice: The efficacy of an early
118

literacy tutoring program implemented by college students. Learning Disabilities Research and Practice, 19(2), 116-130.American Academy of Pediatrics [AAP]. (2001). Policy statement: Developmental surveillance and screening of infants and young children. Pediatrics, 108(1), 192-195.Arnold, N. G. (2000). The increased risk of depression in learning disabled college students. Dissertation Abstracts International, 61(2-B), 1069.Atkinson, P.M., Parks, D.K., Cooley, S.M. & Sarkis, S.L. (2002). Reach Out and Read: A pediatric clinic-based approach to early literacy promotion. Journal of Pediatric Health Care, 16(1), 10-15.Biglan A., Mrazek, P.J., Carnine, D. & Flay, B.R. (2003). The integration of research and practice in the prevention of youth problem behaviors. American Psychologist, 58(6/7), 443-440.Breslau, N., Johnson, E.O., & Lucia, V.C. (2001). Academic achievement of low birthweight children at age 11: The role of cognitive abilities at school entry. Journal of Abnormal Child Psychology, 29(4), 273-281.Castles, A. & Coltheart, M. (2004). Is there a causal link from phonological awareness to success in learning to read? Cognition, 91, 77-111.Celano, M., Hazzard, A., McFadden-Garden, T., & Swaby-Ellis, D. (1998). Promoting emergent literacy in a pediatric clinic: Predictors of parent-child reading. Children’s Health Care, 27(3), 171-183. Christensen, C. A. (1997). Onset, rhymes, and phonemes in learning to read. Scientific Studies of Reading, 1(4), 341-358.Craig-Unkefer, L. A. & Kaiser, A. P. (2002). Improving the social communication skills of at-risk preschool children in a play context. Topics in Early Childhood Special Education, 22(1), 3-14.Crain-Thoreson, C. & Dale, P.S. (1999). Enhancing linguistic performance: Parents and teachers as book reading partners for children with language delays. Topics in Early Childhood Special Education, 19(1), 28-40.Cummings, R., Maddux, C.D, & Casey, J. (2000). Individualized transition planning for students with learning disabilities. Career Development Quarterly. 49(1), 60-73.Dickenson, D. L. & Verbeek, R. L. (2002). Wage differentials between college graduates with and without learning disabilities. Journal of Learning Disabilities, 35(2), 175-185.Dodici, B. J., Draper, D. C., & Peterson, C. A. (2003). Early parent-child communication and early literacy development. Topics in Early Childhood Education, 23(3), 124-137.Esser, G., Schmidt, M.H., & Woerner, W. (1990). Epidemiology and course of psychiatric disorders in school-age children--Results of a longitudinal study. Journal of Child Psychology & Psychiatry & Allied Disciplines, 31(2), 243-264.Faraone, S.V. & Biederman, J. (1993). Intellectual performance and school failure in children with attention deficit hyperactivity disorder and in their siblings. Journal of Abnormal Psychology, 102(4), 616-624.Farmer, T. W., & Farmer, E. Z. (2001). Developmental science, systems of care, and prevention of emotional and behavioral problems in youth. American Journal of Orthopsychiatry, 71, 171-181.Fletcher, J.M., Coulter, W.A., Reschly, D.J. & Vaughn, S. (2004). Alternative approaches to the definition and identification of learning disabilities: Some questions and answers. Annals of Dyslexia, 54, 304-331.Geary, D.C. (2004). Mathematics and learning disabilities, Journal of Learning Disabilities, 37, 4-15.Gersten, R., Jordan, N.C., Flojo, J.R. (2005). Early identification and interventions for students with mathematics difficulties. Journal of Learning Disabilities, 34, 293-304.Gonzales, J.E. & Nelson, R. (2003). Stepping stones to literacy: A prevention-oriented phonological training program. Reading and Writing Quarterly, 19, 393-398.Hancock, T. B., Kaiser, A. P., & Delaney, E. M. (2002). Teaching parents of preschoolers at high risk. Topics in Early Childhood Education, 22(4), 191-213.
119
Heubner, C. E. (2000). Community-based support fro preschool readiness among children in poverty. Journal of Education for Students Placed At Risk, 5(3), 291-314.Hockenberger, E.H., Goldstein H. & Haas, L.S. (1999). Effects of commenting during joint book reading by mothers with low SES. Topics In Early Childhood Special Education, 19(1), 15-28.Hornby, G. & Jensen-Proctor, G. (1984). Parental speech to language delayed children: A home intervention study. British Journal of Disorders of Communication, 19(1), 97-103.Hus, Y. (2001). Early reading for low-SES minority language children: An attempt to ‘catch them before they fall’. Folia Phoniatrica et Logopaedica, 53(3), 173-182.Jenkins, J.R. & O’Conner, R.E. (2002). Early identification and intervention for young children with reading/learning disabilities. In: Bradley, R., Danielson, L., & Hallahan, D.P. (eds.). Identification of Learning Disabilities: Research to Practice. Mahwah, NJ: Lawrence Earlbaum Associates.Johnson E. O. & Breslau, N. (2000). Increased risk of learning disabilities in low birth weight boys at age 11 years. Biological Psychiatry 47(6)Justice, L.M. & Kaderavek, J.M. (2003). Topic control during shared storybook reading: Mothers and their children with language impairments. Topics in Early Childhood Special Education, 23(3), 137-151.Justice, L.M. & Kaderavek, J.M. (2004). Embedded-explicit emergent literacy intervention I: Background and description of approach. Language, Speech, and Hearing Services in Schools, 35(3), 201-222.Justice, L.M., Weber, S.E., Ezell H.K., & Bakerman, R. (2002). A sequential analysis of children's responsiveness to parental print references during shared book-reading interactions. American Journal of Speech-Language Pathology, 11(1), 30-41.Kanzawa, T., Shimizu, S. Kamada, J. Tanabe, H., & Itoigawa, N. (1997). Intelligence and learning disabilities in 6- to 8-year-old children weighing under 1000 grams at birth. International Journal of Behavioral Development, 20(1) 179-188.Klass, P.E., Needlman, R., & Zuckerman, B. (2003). The developing brain and early learning. Archives of Disease in Childhood, 88(8), 651-655.Korkman, M. & Peltoma, A. K. (1993). Preventive treatment for dyslexia by a preschool training program for children with language impairments. Journal of Clinical Child Psychology, 22(2), 277-287.Larney, R. (2002). The relationship between early language delay and later difficulties in literacy. Early Child Development & Care, 172(2), 183-193.Lindquist, G. T. (1982). Preschool Screening as a Means of Predicting Later Reading Achievement. Journal of Learning Disabilities, 15(6), 331-332.Lonigan, C. (2005). Development and promotion of early literacy skills: using data to help children succeed. Retrieved August 25, 2005, from National Center for Learning Disabilities: http://www.ld.org/earlyliteracyscreeningforum/pdf/Loniganforumpaper.pdfLyon, G. R. (2004). The NICHD Research Program in Reading development, Reading disorders and Reading Instruction. In National Center for Learning Disabilities (chap.) Retrieved October 10, 2004, from National Center for Learning Disabilities: http://www.ncld.org/research/keys99_nichd.cfmLyon, G.R. (2005). The NICHD Research program in reading development, reading disorders and reading instruction. http://www.ld.org/Research/keys99_nichd.cfmLyon, G.R., Shawitz, S.E., & Shawitz, B.E. (2003). A definition of dyslexia. Annals of Dyslexia, 53, 1-15.Marshall, R. M., & Hynd, G. W. (1997). Academic underachievement in ADD subtypes. Journal of Learning Disabilities, 30(6), 635-643Mayes, S. D., Calhoun, S. L., & Crowell, E. W. (2000). Learning disabilities and ADHD- overlapping spectrum disorders. Journal of Learning Disabilities, 33(5), 417-425.McNulty, M. A. (2003). Dyslexia and the life course. Journal of Learning Disabilities, 36(4), 363-381.National Center for Learning Disabilities. (2001). Get Ready to Read! Screening Tool. New York: Author.
120

National Institutes of Health [NIH]. (2000). Emergent literacy workshop: Current status and research directions. Author.National Research Center on Learning Disabilities [NRCLD]. (2002). Researcher Consensus Statement: NRCLD Information Digest #3. Author.Nichols, W.D., Rupley, W.H., Rickelman, R.J., & Algozzine, B. (2004). Examining phonemic awareness and concepts of print patterns of kindergarten students. Reading Research & Instruction 43(3), 56-81.O’Connor, R.E. & Jenkins, J.R. (1999). Prediction of reading disabilities in kindergarten and first grade. Scientific Studies of Reading, 3(2), 159-198.Olson, R., Wise, B., Conners, F., Rack, J., & Fulker, D. (1989). Specific deficits in component reading and language skills: genetic and environmental influences. Journal of Learning Disabilities, 22(6), 339-348.Payne, A.C., Whitehurst G.J., & Angell, A.L. (1994). The role of home literacy environment in the development of language ability in preschool children from low-income families. Early Childhood Research Quarterly, 9(3-4), 427-440.Plomin, R. & Walker, S. O. (2003). Genetics and educational psychology. British Journal of Educational Psychology, 73, 3-14.Pokorni, J.L., Worthington, C.K. & Jamison, P. J. (2004). Phonological Awareness Intervention: Comparison of Fast ForWord, Earobics, and LiPS. Journal of Educational Research, 97(3), 147-157.Rescorla, L. (2002). Language and reading outcomes to age 9 in late-talking toddlers. Journal of Speech, Language, and Hearing Research, 45, 360-371.Robinson, C.S., Menchetti, B.M. & Torgesen, J.K. (2002). Toward a two-factor theory of one type of mathematics disabilities. Learning Disabilities Research & Practice, 17(2), 81-89Ross, G., Lipper, E., & Auld, A.M. (1996). Cognitive abilities and early precursors of learning disabilities in very-low-birthweight children with normal intelligence and normal neurological status. International Journal of Behavioral Development, 19(3), 563-580.Rourke, B.P. & Del Dotto, J. (1994). Learning Disabilities: A Neuropsychological Perspective. New York: Sage PublicationsRvachew, S., Nowak, M., & Cloutier, G. (2004). Effect of phonemic perception training on the speech production and phonological awareness skills of children with expressive phonological delay. American Journal of Speech-Language Pathology, 13(3), 250-263.Scarborough, H. S. (1990). Very early language deficits in dyslexic children. Child Development, 61, 1728-1743.Scarborough, H.S. & Dobrich, W. (1990). Development of children with early language delay. Journal of Speech & Hearing Research, 33(1), 70-83. http://ecrp.uiuc.eduSchatschneider, C. & Torgeson, J.K. (2004). Using Our Current Understanding of Dyslexia to Support Early Identification and Intervention. Journal of Child Neurology, 19(10), 759-765.Schneider, W., Ennemoser, M., Roth, E., & Kuspert, P. (1999). Kindergarten prevention of dyslexia: Does training in phonological awareness work for everybody? Journal of Learning Disabilities, 32(5), 429-437.Shaywitz, S.E. (1998). Current concepts: Dyslexia. New England Journal of Medicine, 338(5), 307-312.Shepard, J. & Carlson, J.S. (2003). An empirical evaluation of school-based prevention programs that involve parents. Psychology in the Schools, 40(6), 641-656.Stanton-Chapman, T.L., Chapman, D.A. & Scott, K.G. (2001). Identification of early risk factors for learning disabilities. Journal of Early Intervention, 24(3), 193-206.Stormont, M., Espinosa, L., Knipping, N. & McCathren, R. (2003). Supporting Vulnerable Learners in the Primary Grades: Strategies To Prevent Early School Failure. Early Childhood Research and Practice: An Internet Journal on the Development, Care, and Education of Young Children, 5(2). http://ecrp.uiuc.edu.Torgesen, J. K. & Wagner, R. K. (1994). Longitudinal studies of phonological processing and reading. Journal of Learning Disabilities, 27(5), 276-287. Torgesen, J. K. (2000). Individual differences in response to early interventions in reading. Learning Disabilities Research and Practice, 15(1), 55-65.
121

Vadesy, P.F., Jenkins, J.R. & Pool, K. (2000). Effects of tutoring in phonological and early reading skills on students at risk for reading disabilities. Journal of Learning Disabilities, 33(6), 579-591.Washington, J. A. (2001). Early literacy skills in African-American children: Research considerations. Learning Disabilities Research & Practice, 16(4), 213-221.Whitehurst, G.J. & Lonigan, C.J. (1998). Child development and emergent literacy. Child Development, 69(3) 848-873.Whitehurst, G.J., Zevenbergen, A.A , Crone, D.A., Schultz, M.D., Velting, O.N., & Fischel, J.E. (1999). Outcomes of an emergent literacy intervention from Head Start through second grade. Journal of Educational Psychology, 91(2), 261-272.Williams, G., Oliver, J.M., Allard, A. & Sears, L. (2003). Autism and associated medical and familial factors: A case control study. Journal of Developmental & Physical Disabilities, 15(4), 335-349.Wolf, M., Bowers, P. G., & Biddle, K. (2000). Naming speed processes, timing, and reading: A conceptual review. Journal of Learning Disabilities, 33(4), 387-408.Woude, J.V. & Barton, E. (2003). Interactional sequences in shared book-reading between parents and children with histories of language delay. Journal of Early Childhood Literacy, 3(3), 249-273.Wood, C. & Terrell, C. (1998). Pre-school phonological awareness and subsequent literacy development. Educational Psychology, 18(3), 253-275.Zevenbergen, A.A., Whitehurst G.J., & Zevenbergen, J.A. (2003). Effects of a shared-reading intervention on the inclusion of evaluative devices in narratives of children from low-income families. Journal of Applied Developmental Psychology, 24(1), 1-15.
122

INDIVIDUAL, FAMILY, AND SCHOOL FACTORS ASSOCIATED WITH THE IDENTIFICATION OF FEMALE AND MALE STUDENTS FOR SPECIAL
EDUCATION
Donald P. OswaldAl M. Best
Virginia Commonwealth University and
Martha J. Coutinho, East Tennessee State University
The purpose of this study was to investigate factors related to placement in special education for males and females. The conceptual approach included individual, family, and school characteristics believed to influence educational performance and outcomes with emphasis was given to variables for with evidence of differential effects for males and females. Using the nationally representative, longitudinal NELS-88 data set, a logistic regression model examined the extent to which individual, family, and school characteristics were differentially associated (for male and female students) with identification for special education. The model identified a variety of characteristics associated with identification for special education, but only one individual characteristic, self-concept, for which the effect was different for male and female students. Recommendations for secondary education and transition practices and research were offered related to self-concept with respect to differences across gender, racial/ethnic, and disability status.
Placement in special education holds lifelong significance for a child. For children with disabilities not making satisfactory educational progress, IDEA (P.L. 105-17, as amended) provides for nondiscriminatory eligibility procedures and the opportunity for an individualized education. However, many now argue that special education identification for too many leads to a second-class education, and for other students, identification itself is unwarranted (Donovan & Cross, 2002). Related concerns about discrimination and bias continue to impact public opinion adversely about a service intended to assure a high quality education for individuals with disabilities (President’s Commission on Excellence in Special Education (PCESE), 2002; Donovan & Cross, 2002).
Among the factors are known to influence placement in special education are significant developmental delays; achievement deficits, particularly in reading and math; and behavioral problems, poverty, and the disability definition (Coutinho, Oswald & Best, 2002; Del'Homme, Kasari, Forness, & Bagley, 1996; Fujiura & Yamaki, 2000; Halfon & Newcheck, 1999; MacMillan, Gresham, Lopez, & Bocian, 1996). Other variables associated with identification as disabled include race and gender (Oswald, Coutinho, Best, & Nagle, 2002). Racial and ethnic disproportionality in special education is now widely recognized, but controversy about the basis for the disproportionality complicates public efforts to provide students with disabilities with equity in their education experience (Donovan & Cross, 2002; Losen & Orfield, 2002).Surprisingly, interest in gender disproportionality in special education is relatively recent (Gender differences impact learning and post-school success, 2003; U.S. Department of Education, 1998). This contrasts sharply with regular education where controversy has existed since 1972, when females were found on the wrong side of the gender gap because of deficits in math, science, and the lower likelihood of placement in the college track (Lee, Chen, Smerdon, 1996). Substantial evidence now points to the emergence of gender differences in middle school favoring females in some instances (Willingham & Cole, 1997). However,
123

attention is more often drawn to how educators may shortchange females (Lee, et al., 1996; Orenstein, 1994; Sommers, 2000).
For a long time, evidence has existed about the over representation of males in special education. The overall male to female ratio in special education has been reported between 2:1 and 3:1, although this varies depending on the disability condition (Bentzen, 1966; Hayden-McPeak, Gaskin, Gaughan, 1993; Mumpower, 1970; Oswald, et al., 2002; Valdes, Williamson, & Wagner, 1990). Longitudinal analyses of the nationally representative data base of school aged children collected by the U.S. Office for Civil Rights reveal that disproportionality is greatest for the category of Serious Emotional Disturbance (SED), where the proportion of males to females, since 1976, has been about 3.5:1. The variation in state male:female ratios is also greatest for students with SED, ranging up to nearly 6:1 (Coutinho & Oswald, in press).
The National Longitudinal Transition Study of secondary aged youth has also reported proportions of males and females identified for LD, MR, SED, and several other disability conditions (U.S. Department of Education, 1998; Valdes, et al., 1990). The proportions of males and females identified as LD and SED were comparable: 73% and 76%. The greater disproportionality for LD obtained by Valdes et al., (1990) as compared to Oswald et al., (2002), may reflect differences in the ages analyzed. Male students made up about 58% of students identified with mental retardation (MR), sixty percent (60%) of those identified as having speech impairments, and about 65% of students with multiple disabilities. Between 52-56% of those identified for a number of sensory and physical conditions, including hearing, orthopedic, deafness, other health impairments, and visual impairments were male. There was no gender disproportionality for the condition of deaf/blindness.
Males are identified at higher rates than females for almost all childhood psychiatric disorders. Male disproportionality is greatest for the conditions of attention deficit hyperactivity disorder (4-9:1), autism (4-5:1), and stuttering (3:1). More males than females are also identified for several other conditions, including mental retardation, reading disorder, language disorder, Asperger syndrome, oppositional defiant disorder, conduct disorder, Tourette’s syndrome, encopresis, and enuresis. Females are more likely to be identified for the conditions of separation anxiety and selective mutism, and there are is no gender disproportionality for feeding disorders. Only females are diagnosed with Rett’s disorder (American Psychiatric Association, 2000).
There is some concern that males are over referred for special education evaluation and inappropriately identified because of behaviors that are difficult to manage, but do not reflect a disability (Donovan & Cross, 2002; PCESE, 2002). However, the controversy about gender differences most often centers on gender disparities that affect females, particularly the equity and effectiveness of the special education process of referral, evaluation, and services (Hayden-McPeak et al., 1993; Wehmeyer & Schwartz, 2001a). At the point of identification, there is evidence that females are older, more severely disabled, demonstrate lower IQ scores, and after identification, are served in more restrictive placements (Gillespie & Fink, 1974; Gottlieb, 1987; Kratovil & Bailey, 1986; Mercer, 1973; Phipps, 1982; Wagner, et al., 1991; Wehmeyer & Schwartz, 2001b).After exiting school, females with disabilities further lag behind males. Although females with disabilities do better while in school (higher rates of academic performance and school completion, fewer suspensions and expulsions), they are less likely to work, have less job stability, and earn lower wages than males (Doren & Benz, 1998; Doren & Benz, 2001; Harvey, 2003; Valdes et al., 1990; Wagner et al., 1991). Young adult females who were served under IDEA are less likely to pursue postsecondary training (U.S. Department of Education, 1998).
124

Increasingly, the demand for a globally competitive workforce will be met by women, minorities, and individuals with disabilities (Bennett & McLaughlin, 1988; Mau, 1995). The relatively poor educational performance and outcomes of females, minorities, low achieving students, and those with disabilities is a major concern in that about 85% of the labor needed must be skilled or professional workers (Brustein &Mahler, 1994). Employers are not enthusiastic about the skills and preparedness of typically achieving youth and have even more reservations about the skills of women, minorities and those with disabilities (Bennett & McLaughlin, 1988; Secretary’s Commission of Achieving Necessary Skills (SCANS), 1991). Information about gender differences in special education is needed to implement successful and differentiated secondary transition planning and activities.
Conceptual FrameworkThe purpose of this study was to investigate factors related to placement in special education for males and females. The NELS-88 data set includes a rich set of information about students, families, and schools. The conceptual framework for the selection of potential predictors was developed to investigate gender differences in education and to recommend how to improve educational effectiveness and equity (Lee, et al., 1996).
Three classes of characteristics are hypothesized to influence students’ educational performance and outcomes: the individual, family, and school. Particular emphasis was given to variables for which there are indications in the literature of differential effects for male and female students. Individual characteristics include race/ethnicity, educational performance, school engagement, and psychological characteristics. Educational performance and other indicators differ across racial/ethnic groups, and in some studies, significant gender differences have been observed within racial/ethnic groups (Burbridge, 1991; Mau, 1995; Riordan, 1998; Riordan & Galipeau, 1998). Significant gender differences are reported for some educational performance variables, including grades, achievement, and academic background (Riordan, 1998; Riordan & Galipeau, 1998). Gender differences have been found for school engagement, which includes time spent doing homework, student aspirations, retention, and absenteeism (Lee, et al., 1996; Mau, 1995). Females still do more homework, and work less part-time, although the gap is narrowing (Riordan, 1998). Mau (1995) found Black male and White male students had significantly higher educational aspirations than Hispanic and Native American males. Differences in locus of control and self-concept may be important for understanding identification for special education. Males often attain modestly higher scores than females on global measures of self-concept (Feingold, 1994; Hanes, Prawatt, & Grissom, 1979; O’Brien et al., 1996; Quatman & Watson, 2001; Robinson-Awana et al., 2001).
Family characteristics include parent and household variables (e.g. socioeconomic status [SES]). SES variables in the NELS data set include father’s education, mother’s education, mother’s occupation, and family income. SES is often observed to exert a main effect on education indicators (Capraro, Capraro, Wiggins, & Barrett, 2000; Peng & Lee, 1992), but in some studies SES also interacts with gender (Burbridge, 1991; Lee et al., 1996). Lee et al., (1996) found 8th grade males are slightly, but significantly, more advantaged than females on SES. Burbridge (1991) reported SES influenced educational outcomes more than any other factor, and described findings that differed by SES, gender, and race. Low SES males are more likely than low SES females to score below basic in math, whereas among high SES students, the scores of males exceed those of girls across all racial/ethnic groups. Several other household characteristics that are known to influence educational outcomes and performance are also included in the family characteristics component: single parent status, low parent education, sibling dropping out, being home alone three or more hours after school without supervision, and Limited English Proficiency (Pallas, Natriello, & McDill, 1989; Peng & Lee, 1992; Ralph, 1989). The influence of parent involvement has been found to vary for students of different socioeconomic backgrounds and race/ethnicity, and there is some evidence for gender differences as well (Catsambis, 2000; Singh et al., 1995). Parent
125
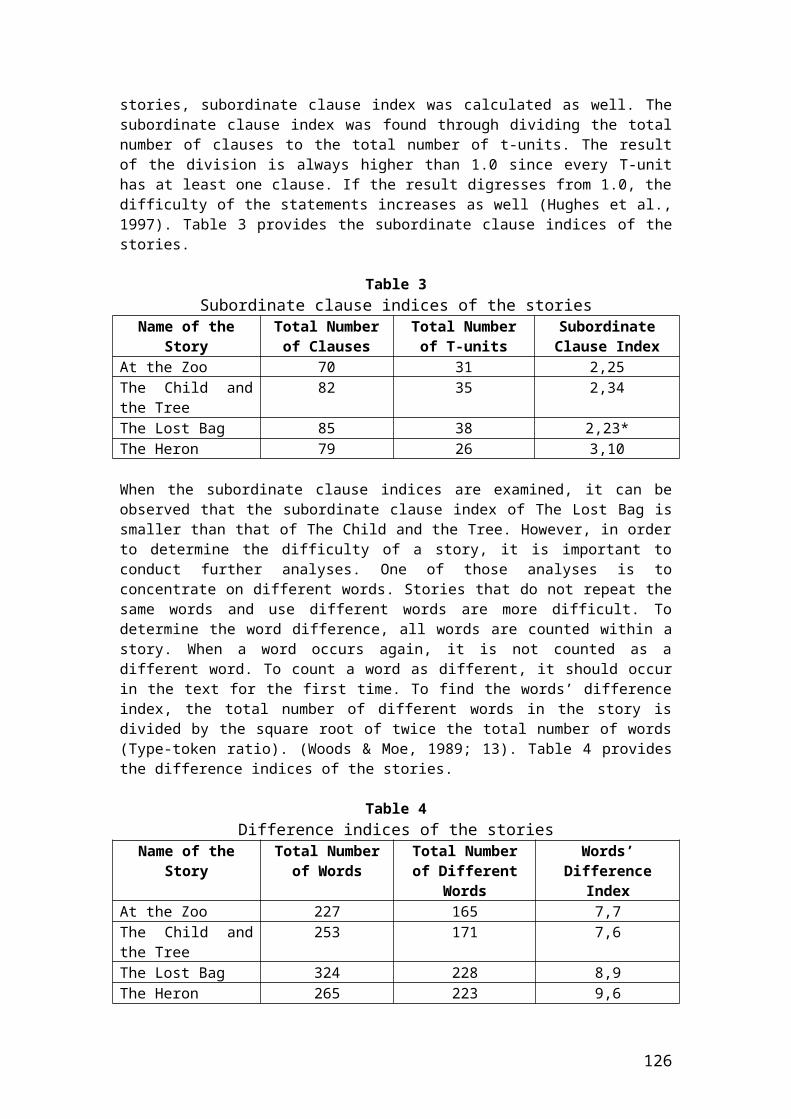
involvement as included in the present model is defined as the frequency with which a parent helps the student with homework.
School characteristics make up the third group of hypothesized predictors. Lee et al. (1996) described gender difference in the association between school climate measures and a variety of educational measures, and in some instances (e.g., social studies achievement), school characteristics that significantly influenced effectiveness were associated with gender inequity. Gender and racial differences in educational and vocational planning help-seeking behaviors have been reported. Mau (1995) observed that male students were more likely to ask a counselor about jobs or careers or for help in improving academic work, but females were more likely to ask a teacher, or friends and relatives when selecting courses or programs at school.
MethodSample The National Education Longitudinal Study (NELS) program was instituted by the National Center for Education Statistics with the aim of studying the educational, vocational, and personal development of students at various grade levels, and the personal, familial, social, institutional, and cultural factors that may affect that development. (NCES, 1994) The program began with a twelfth-grade cohort in the National Longitudinal Study of the High School Class of 1972 and was continued in the 1980s with the High School and Beyond with a cohort of tenth- and twelfth-graders. NELS-88, the data set analyzed below, involved a sample of students who were in the eighth grade in 1988. The study included a follow-up in 1990, a second follow-up in 1992, and a third follow-up in 1994. The variables included in the present study were all drawn from the initial (1988) round of data collection and selected variables were taken from each of the four Base Year components: student surveys and tests, parent surveys, school administrator surveys, and teacher surveys.
The Base Year sample was recruited using a two-stage stratified probability design to create a nationally representative sample of eighth grade schools and students. The first stage yielded 1,052 participating schools, 815 public schools and 237 private schools. The second sampling stage (student sampling) produces a random selection of 26,432 students from the participating schools, of whom 24,599 participated in the 1988 data collection. (NCES, 1994)
The NELS sample analyzed in the present study consisted of 23,926 subjects with usable data, including 11,890 males and 12,036 females. The race/ethnicity distribution of the sample was as follows: 1.2% American Indian (AI; n=286), 6.2% Asian/Pacific Islander (AS; n=1,486), 12.4% Black (BK; n=2,972), 12.8% Hispanic (HI; n=3,067), and 67.4% White (WH; n=16,115).
Subjects in the NELS sample were divided into four status groups: special education (SE), low achieving (Low), typically achieving (Typical), and gifted and talented (GT). SE students (n=3,575) were extracted from the pool first and were defined as those students whose parents answered affirmatively to the question: Has your eighth grader ever received special services for any or all of the following? Visual handicap (not correctable by glasses) [n=284], Hearing problem [n=434], Deafness [n=65], Speech problem [n=1,468], Orthopedic problem (for example, club foot, absence of arm or leg, cerebral palsy, amputation, polio) [n=247], Other physical disability [n=194], Specific learning problem (for example, dyslexia or other reading, spelling, writing, or math disability) [n=1,750], Emotional problem [n=759], Other health problem [n=596]. The total of special services received is greater than the total number of SE students because many students had received more than one type of special service. The SE sample includes 1,545 female students (43.2%) and 2,030 male students (56.8%).
Table 1Distribution of Males and Females in Each Status Group
126
GT students were extracted next and were defined as subjects whose parents answered affirmatively to the question: Is your eighth grader currently enrolled in a gifted or talented program? Low achieving students were defined as those who, among the remaining subjects, fell into the lowest quartile of standardized achievement testing scores for either reading or math. Typical students comprised the remainder of the sample. The number of male and female students in each of these groups is summarized in Table 1 (above).
ProcedureIncluding SEX and RACE, 24 variables were selected from the NELS-88 Base Year data set to reflect the three components of the conceptual model: individual characteristics, family characteristics, school characteristics. Each of these covariates is described briefly in Table 2 (below). In order to test the combined effects, all covariates were included in a multinomial logistic regression predicting the probability of being in special education (or one of the other groups). Multinomial logistic regression models the odds of group membership compared to a
127

reference group (defined as: Typical, White, Female), with all covariates at the median value. Because the covariates were expected to be related to one another, a stepwise logistic regression procedure was used first to determine which covariates remained significant when the effects of other variables were considered. The initial multinomial logistic regression included the following: a) SEX, RACE, and SEX*RACE were forced into the model, b) all nominal variables were included along with their interactions with the variables included in a), and c) all continuous variables were included as linear and quadratic effects along with their interactions with the variables included in a). Nonsignificant effects were removed from the initial model to yield a final logistic regression model.
The final model characterizes the relationship between the covariates and the probability of being in special education. The effects of primary interest for the present purpose are those interaction effects that include SEX. These effects identify those covariates that work differently for boys and girls and thus may serve to explain the basis of gender disproportionality in special education. If, for example, the GRADES by SEX interaction were significant, the inference might be that, while GRADES are related to the probability of being in special education for both boys and girls, the nature or extent of that relationship varies depending on the student’s SEX.
Table 2. Summary of Covariates
128

Table 2 Cont’d
ResultsThe top portion of Table 1, which ignores race and all other student characteristics besides gender, shows clear evidence of gender disproportionality (chi-square = 130, df = 3, p < .0001), i.e., the 17% male identification rate for SE is different from the 13% female identification. However, the extent of male over representation in the SE group varies across the five race groups (chi-square = 25, df = 9, p =0.0029). Among AS SE students, 57% are male; again a rate only marginally different than the 51% expected (OR=1.46, p-value = 0.0542). Among BK students, 55% are male, a rate significantly higher than the 49% expected (OR=1.34, p-value = 0.0158).Among HI students, 57% are male, a rate significantly higher than the 49% expected (OR=1.35, p-value = 0.0144), Finally among WH students, 57% are male, a rate clearly above the 50% expected (OR=1.50, p-value < .0001). So, although there is evidence of gender disproportionality overall, the effect does not appear to be constant among the race groups. Because of the small number of AI students in the sample, they were excluded from all subsequent analyses. Because gender disproportionality may be associated with any of the covariates in Table 2, the covariates, sex, and race were all entered as predictors in the logistic regression model.
Initial ModelAfter the nonsignificant effects were removed from the initial logistic regression the number of the variables in the model was reduced to fifteen. Several covariates were dropped from subsequent analyses because they yielded no effect in the prediction of status group. Although
129

significant when considered separately, the following covariates were not significant when the fifteen others were taken into account: RURALITY, EXPERIENCES, ATHOME, WORK, DISRUPTIVE, and CAREER. Thus, of the initial group of covariates included in the conceptual model, the variables in the final model are those that display a unique contribution to the prediction of group, when considered simultaneously with all other covariates.
Final ModelThe final model included SEX; RACE; the fifteen covariates described above; quadratic effects for some of the continuous covariates; and interactions with SEX, RACE, and SEX-by-RACE. The final model yielded 27 significant effects though not all were significant with regard to distinguishing SE students from other students. The remainder of the paper focuses on interpretation of the SE results.
The results of the final model indicate that, when the effects of significant covariates are taken into account, gender disproportionality remains significant (p<.0001). Although there are race differences in gender disproportionality, these effects are taken into account but are not the primary focus of our results. The presence of interactions in the model require the cautious interpretation of effects.
Bivariate RelationshipsIt is instructive to consider the bivariate relationship between each of the covariates in the final model and the probability of being in special education. Because the effect was similar for all four RACE groups for all of the twelve covariates in Figure 1, the RACE groups are combined. In the first panel of Figure 1, the probability of being in special education is shown to decrease as the percentage of minority students in the school increases. Two other covariates, GRADES and LOCUSCONTROL, were also inversely associated with the probability of special education, i.e., a higher grade-point average and more internal locus of control were associated with a decreased probability of special education. Four covariates were directly associated with probability of special education; higher SES, more risk factors, having been retained, and being frequently absent are associated with increased probability of special education. The other five covariates in Figure 1 were significantly related to the other group membership not reported in this paper (low, typical, or GT) but not with special education.
For each of the above covariates, the relationship to special education status was consistent across the four race groups. However, for two covariates the relationship depended upon race. Among WH students, whether or not teachers talked with them about courses was unrelated to the probability of being in special education. However, for BK students, talking about courses in school was associated with a decrease in SE proportion while, for the other two race groups, talking about courses in school was associated with an increased probability of special education.
0.00
0.05
0.10
0.15
0.20
0.25
0.30
Pro
b[S
E]
0 10 20 30 40 50 60 70 80 90Minority
0.00
0.05
0.10
0.15
0.20
0.25
0.30
Pro
b[S
E]
0 5 10 15 20SpEd
0.00
0.05
0.10
0.15
0.20
0.25
0.30
Pro
b[S
E]
0 5 10 15 20 25GT
130

0.00
0.05
0.10
0.15
0.20
0.25
0.30
Pro
b[S
E]
-1.5 -1 -0.5 0 .5 1 1.5SES
0.000
0.050
0.100
0.150
0.200
0.250
0.300
Pro
b[S
E]
0 1 2 3 4Risk
0.00
0.05
0.10
0.15
0.20
0.25
0.30
Pro
b[S
E]
1 2 3 4HwkHelp
0.00
0.05
0.10
0.15
0.20
0.25
0.30
Pro
b[S
E]
1 2 3 4 5 6 7 8HwkHrs
0.00
0.05
0.10
0.15
0.20
0.25
0.30
Pro
b[S
E]
1 1.5 2 2.5 3 3.5 4Grades
0.00
0.05
0.10
0.15
0.20
0.25
0.30
Pro
b[S
E]
-1 -0.5 0 .5 1LocusControl
0.00
0.05
0.10
0.15
0.20
0.25
0.30
Pro
b[S
E]
2 3 4 5 6Plan
0.00
0.05
0.10
0.15
0.20
0.25
0.30
Pro
b[S
E]
0 .5 1Retained
0.00
0.05
0.10
0.15
0.20
0.25
0.30P
rob
[SE
]
0 .5 1Absent
Figure 1. Final model: Bivariate relationships for covariatesLegend: Males = filled circles, Females = empty circles
131

0.00
0.05
0.10
0.15
0.20
0.25
0.30
Pro
b[S
E]
0 1Courses
Figure 2. Final model: Bivariate relationships for covariates that vary by raceLegend: Males = filled circles, Females = empty circles; Green = white students, Red = black students,
Black = Hispanic students, Blue = Asian students.
As seen in the second panel of Figure 2, the relationship with reading and math standardized test composite is more complex. There is a general overall trend for lower test scores to be related to higher probability of SE identification. While the interaction involving RACE was significant, interpretation of the relatively minor differences among RACE groups is unlikely to be fruitful. There is an apparent trend toward higher probability of SE identification among student with test composite scores greater than 60.
132
0.00
0.05
0.10
0.15
0.20
0.25
0.30
Pro
b[S
E]
35 40 45 50 55 60 65 70TestComp
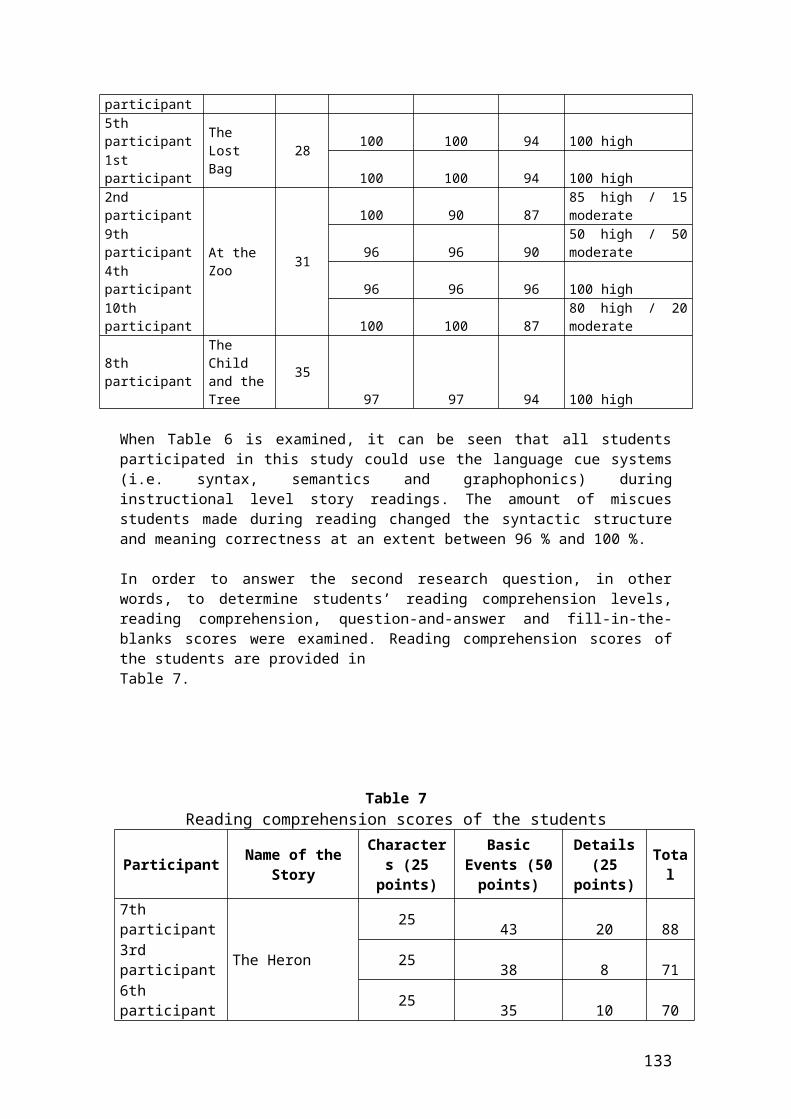
0.00
0.10
0.20
0.30
0.40
Pro
b[S
E]
-2 -1 0 1Self Concept
In the final model, only a single covariate worked differently for male and female students in the prediction of group (i.e., yielded a significant interaction involving SEX) and that covariate was CONCEPT. The implication of this result is that while there are many other main effects in the model (i.e., covariates that are associated with the likelihood of being identified as a student in special education), those effects are statistically identical for male and female students. The exception is that boys and girls differ with regard to the manner in which student self-concept is associated with identification for special education.The nature of the interaction between CONCEPT and SEX in predicting the probability of special education status is illustrated in Figure 3. For each RACE group, the solid circles represent the predicted probability of special education status (Y axis) across the distribution of CONCEPT values (X-axis) for male students while the open circles represent that probability for female students. Thus, as Figure 3 illustrates, the relationship between self-concept and the probability of being in special education for both male and female White students is inverse and linear; students with more positive self-concepts have a lower probability of being in special education than do students with a more negative self concept. The relationship for Black students is also generally inverse but is not linear and differs for male and females students such that, among Black students with the most negative self-concept, males are markedly more likely to be in special education (probability = about .35) than are females (probability = about .13).
Figure 3. Final model: Adjusted relationship between self-concept and student groupLegend: Males = filled circles, Females = empty circles; Green = white students, Red = black students,
Black = Hispanic students, Blue = Asian students.For Asian and for Hispanic students the relationship is even more complex. Among Hispanic female students, the relationship is virtually nil; the line is horizontal, indicating that the probability of being is special education is the same at all levels of self-concept. For Hispanic male students and for Asian female students, however, there is a modest, direct relationship; those with more positive self-concept tend to have a higher probability of being in special education than those with more negative self-concept. This pattern is exaggerated among
133
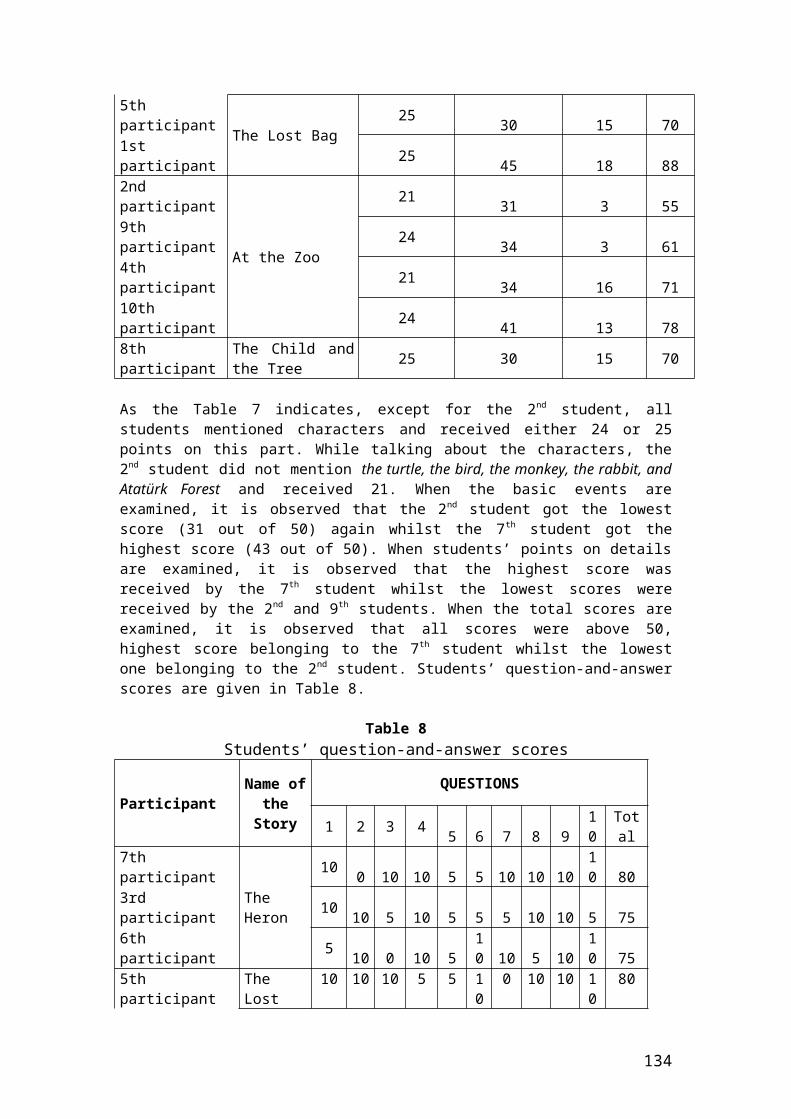
Asian male students; more positive self-concept is associated with a substantially higher probability of being in special education, compared to more negative self-concept.
In an effort to further explore the relationship between self-concept and special education, the sample was divided into tertiles in which the one-third of the sample with the lowest (i.e., most negative) CONCEPT is designated the first tertile and the one-third of the sample with the highest CONCEPT is designated the third tertile. The probability of being in special education was computed for each RACE by SEX group within each tertile. This calculation answers questions like the following example: What is the probability of being in special education for Black, male students with low self-concept? (see Table 3)
Table 3.Self-concept tertiles
Included in Table 3 is a relative risk (RR) ratio for male and female students in each RACE-by-CONCEPT tertile group, providing a single metric for characterizing male disproportionality. As is clear in Table 3, gender disproportionality is approximately equal for White student across the CONCEPT tertiles; males are about 1.3 times as likely as females to be in special education regardless of self-concept. For Asian and Hispanic students, male overrepresentation increases as self-concept increases; that is, for these two RACE groups, males in the highest CONCEPT tertile are substantially more likely than females to be in special education (RR = 1.39 and 1.5, for Asian and Hispanic students respectively), while, in the lowest tertile gender disproportionality disappears for Hispanic students (RR = 1.00) and males are underrepresented among Asian students (RR = .78). For Black students, the pattern is reversed. Among Black students with the lowest CONCEPT, males are 1.67 times as likely as females to be in special education, and there is virtually no gender disproportionality among Black students with the highest CONCEPT (RR = .96).
DiscussionBased on the results of this study, differences between males and females in self-concept may be important for understanding identification for special education. Positive self concept formation is regarded as a significant milestone of adolescence (Richman, Clark, & Brown, 1985), and low self concept has been long seen as a correlate or antecedent for many emotional or behavioral disorders later in life, including anxiety, depression, and conduct disorders (Harter, 1990; Quatman & Watson, 2001). With respect to students with disabilities,
134
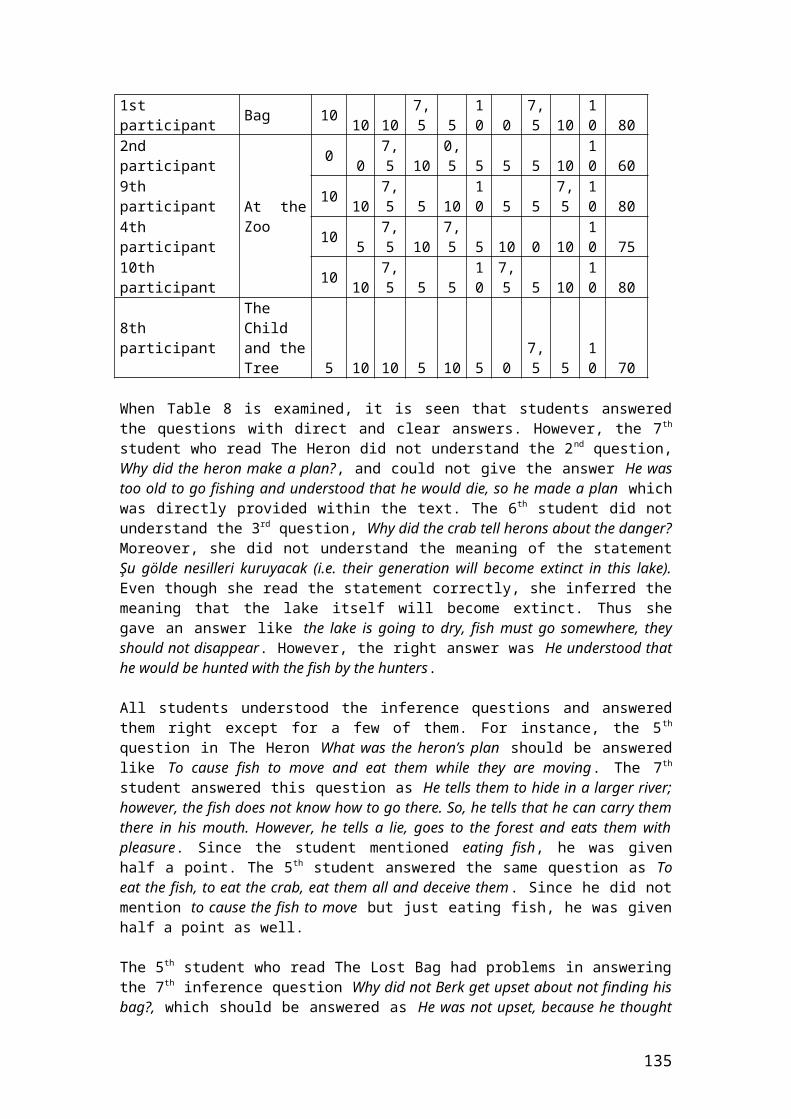
lower self-concept has been reported for students with LD, even after controlling for gender, ethnicity, age, achievement, placement, and age at which the disability was established (Heyman, 1990).
The results of this study are consistent with those of other studies that found males attain modestly higher scores on global and sub-component measures of self-concept, and these differences persist into adult life (Feingold, 1994; Hanes, et al., 1979; O’Brien, et al., 1996, Quatman & Watson, 2001; Robison –Awana, et al., 1986). Quatman & Watson (2001) observed a difference .22 standard deviation unit difference favoring males for global self, and scores equal or higher than females for several sub-components of self-concept. Despite the small differences favoring males, similar subcomponents have been found to predict global self-concept in males and females (Quatman & Watson, 2001). Results from a twin study indicated similar genetic factors influence self-concept in both males and females (Kendler, Gardner, & Prescott, 1998) and about 30% of the variance in self concept was attributable to genetic factors, whereas only about 4% was related to gender.In the present study, Black students with low self-concept were at substantially higher risk of special education placement but the direction of the relationship cannot be determined. Some students, particularly black males, may demonstrate low self-concept early on. which puts them at higher risk of placement in special education. Conversely, the special education experience may contribute negatively to self-concept. Student perception of self-concept in NELS was measured in 8th grade, years after most of the students were most likely identified. Though evidence indicates that self-concept is relatively stable (Quatman & Watson, 2001), the impact of the special education experience on self-concept is unknown.
Gender by race interactions related to self-concept have been reported frequently (Dooley & Prause, 1997; Martinez & Dukes, 1991; Wade, Thompson, Tashakkori, & Valente, 1989). Richman et al., (1985) reported that White females have lower a self-concept than other race/gender groups. Self-concept, gender differences and SES relationships have also been reported. Richman et al., (1985) observed that generally the self-concept of students from low SES was lower than that for high SES students, but high SES white students were lower on self-concept measures than black students and white middle class students.
Many studies find black students report higher global self-concept than white students (Richman et al., 1985; Dukes & Martinez, 1997; Tashakkori, 1993). However, school related subcomponents of self-concept may follow a different pattern. Hare (1985) observed that black self-beliefs in school related areas were lower than white students. This was consistent with findings obtained by Richman et al., (1985) who found white females less confident about their school ability than white males and black females, but black males were the least confident. Richmond hypothesized that school and academic achievement may be of secondary importance to black students, whereas the ability to assume adult life roles as early as possible or street wisdom may be more important in the development of self-concept (Richman et al., 1985). The self-concept measured in a school context may be highly influenced by perceptions about academic competence. If true, the higher probability of placement in special education obtained for black males in this study may relate to a perception that success in school is of relatively lower importance in the formation of beliefs about self for male students who are black.
LimitationsGeneralization of these findings is limited by the fact that the sample of students in special education is unlikely to include adequate representation of students with moderate to severe disabilities. The sample is limited to students able to participate in the self-report survey for more severely impaired students are not included. In addition, the special education is defined by parent report rather than a school record review and it is possible that a small number of students are misclassified based on faulty parent report.
135

Self-concept, in general, has been difficult to describe and interpret for students with disabilities (Gresham, Lane, & MacMillan, 1999). Many studies report students with learning disabilities and emotional and behavioral difficulties (internalizing or externalizing) demonstrate low self-esteem (Barkley, 1990; Callahan, Panichelli-Mindel, & Kendall, 1996; Heyman; 1990; Hinshaw, 1987; Patterson, 1986). Other studies have found that some students with behavioral, learning, or attentional difficulties report unrealistically high or inflated views of themselves (Bear & Minke, 1996; Diener & Milich, 1997; Gresham, MacMillan, Bocian, Ward, & Forness, 1998). In a recent study, students with behavioral difficulties, appeared to have adequate self concepts despite poorer peer acceptance, greater loneliness, poorer school adjustment, and several other significant difficulties (Gresham et al., 1998)
Recommendations for Secondary Education and Transition Practice and ResearchBased on the findings in this study, schools’ investment in the psychological well being of males and females may be important for several reasons. Gender differences in self-concept have lasting effects. High school aged males with average or above average self-concept were substantially less likely to be unemployed after school, whereas the risk only slightly decreased for females (Dooley & Prause, 1997). The magnitude of the effect for self-concept was comparable to that of aptitude or that obtained by graduating from high school. As students move from elementary through secondary grades, we suggest teachers implement transition planning activities that recognize the potential role self-concept may have on the achievement, aspirations, and outcomes of females and Black males, in particular. We also recommend teachers conduct self-evaluations of teacher-student interactions to examine how teacher beliefs may differentially influence self-concept formation or who is referred for special education.
Research is recommended to investigate the higher probability of placement in special education obtained for black males in this study and whether this finding relates to a perception that success in school is of relatively lower importance in the formation of beliefs about self for male students who are black. Research among nondisabled students has pointed to an apparent need for different strategies to improve self concept across racial and ethnic groups (Tashakkori, 1993). Comparable research is needed among students with disabilities. Findings obtained in this study indicate differences between males and females in self concept across racial/ethnic groups may be important if teachers are to accurately refer, identify, and serve students with disabilities.
Finally, the efficacy of interventions to improve self-concept should be investigated. Disability, gender, and race/ethnicity must be considered explicitly in the design of research and intervention strategies. Student outcome variables are needed that reflect recent public policy related to improved literacy and preparedness for adult life.
ReferencesAmerican Psychiatric Association. (2000). Diagnostic and statistical manual of mental disorders (Fourth edition, Text Revision). Washington, DC: Author.Barkley, R. (Ed). (1990). Attention deficit hyperactivity disorder: A handbook for diagnosis and treatment. New York: Guilford.Bear, G., & Minke, K. (1996). Positive bias in maintenance of self-worth among children with LD. Learning Disability Quarterly, 19, 22-32.Bentzen, F. (1966). Sex ratios in learning and behavior disorders. The National Elementary Principal, 46, 13-17.Bennett, W. J., & McLauglin, A. (1988). The bottom line: Basic skills in the workplace. Washington, DC: US Department of Labor and US Department of Education.Burbridge, L. C. (1991). The interaction of race, gender, and socioeconomic status in education outcomes. Paper presented at the meeting of the American Sociological Association, Cincinnati, Ohio.
136

Brustein, M., & Mahler, M. (1994). AVA Guide to the School-to-Work Opportunities Act. Washington, DC: American Vocational.Callahan, S., Panichellil-Mindel, S., & Kendall, P. (1996). DSM-IV and internalizing disorders: Modifications, limitations, and utility. School Psychology Review, 25, 297-307.Capraro, M.S., Capraro, R. M., Wiggins, & Barrett, B. (2000). An investigation of the effects of gender, socioeconomic status, race and grades on standardized test scores. Paper presented at the meeting of the Southwest Educational Research Association, Dallas, Texas.Catsambis, S. (2000). Expanding the knowledge of parental involvement in secondary education: Effects on high school academic success. Report No. 27. Baltimore, MD: National Institute on the Education of At-Risk Students (ED/OERI).Coutinho, M. J., Oswald, D. P., & Best, A. L. (2002). The influence of sociodemo-graphics and gender on the disproportionate identification of minority students as having learning disabilities. Remedial and Special Education, 23, 49-59.Coutinho, M.J., Oswald, D.P., Best, A.M., & Forness, S.R. (2002). Gender and socio-demographic factors and the disproportionate identification of minority students as emotionally disturbed. Behavioral Disorders, 27, 109-125.Coutinho, M.J., & Oswald, D.P. (in press). State variation in gender disproportionality: Findings and recommendations. Remedial and Special Education.Del'Homme, M., Kasari, C., Forness, S. R., & Bagley, R. (1996). Prereferral intervention and students at-risk for emotional or behavioral disorders. Educational and treatment of children, 19, 272-285.Diener, M., & Milich, R. (1997). Effects of positive feedback on the social interactions of boys with attention deficit hyperactivity disorder: A test of the self-protective hypothesis. Journal of Clinical Child Psychology, 26, 256-265.Donovan, M. S., & Cross, C. T. (Eds.). (2002). Minority students in special education. Committee on Minority Representation in Special Education. Washington, DC: National Academy Press.Dooley, D., & Prause, J. (1997). Effect of students’ self-esteem on later employment status: interactions of self-esteem with gender and race. Applied Psychology: An International Review, 46, 175-198.Doren, B., & Benz, M. (1998). Employment inequality revisited: Predictors of better employment outcomes for young women with disabilities in transition. The Journal of Special Education, 31, 400-405.Doren, B., & Benz, M. (2001). Gender equity issues in the vocational and transition services and employment outcomes experienced by young women with disabilities. In H. Rousso & M. L. Wehmeyer (Eds.), Double jeopardy: Addressing gender equity in special education (pp. 289-312). Albany, NY: SUNY.Dukes, R., L., & Martinez, R. O. (1997). The effects of ethnic identify, ethnicity, and gender on adolescent well-being. Journal of Youth and Adolescence, 26, 503-17.Feingold, A. (1994). Gender differences in personality: A meta-analysis. Psychological Bulletin, 116, 429-456.Fujiura, G. T., & Yamaki, K. (2000). Trends in demography of childhood poverty and disability. Exceptional Children, 66, 187-199.Gender differences impact learning and post-school success. (2003). CEC Today, 10, 1,4,7, 9 15.Gillespie, P. H., & Fink, A. H. (1974). The influence of sexism on the education of handicapped children. Exceptional Children, 41, 155-162.Gottlieb, B.W. (1987). Gender differences in cognitive profiles among urban children placed in special education. (ERIC Document Reproduction Service No. ED 387 972.)Gresham, F.M., Lane, K.L., & MacMillan, D.L. (1999). Social and academic profiles of externalizing and internalizing groups: Risk factors for emotional and behavioral disorders. Behavioral Disorders, 24, 231-245.Gresham, F.M., MacMillan, D.L., Bocian, K., Ward, S., & Forness, S. (1998). Comorbidity of hyperactivity-impulsivity-inattention - conduct problems: Risk factors in social, affective, and academic domains. Journal of Abnormal Child Psychology, 26, 393-406.
137
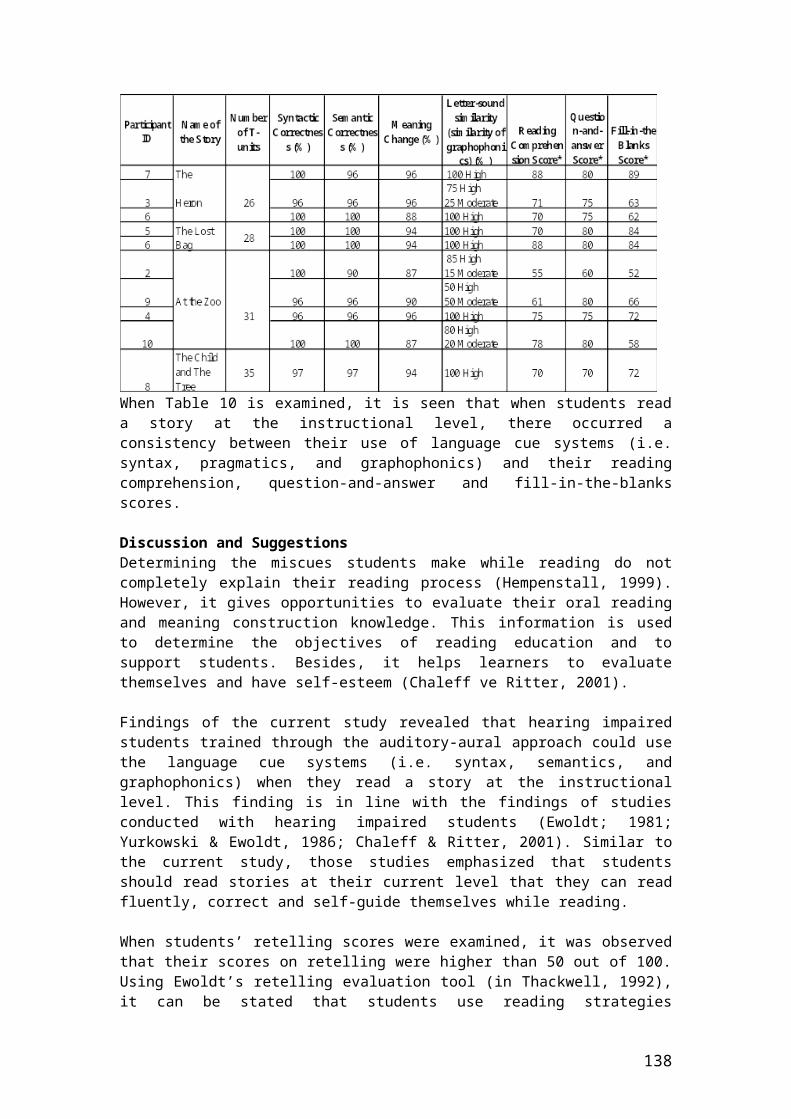
Halfon, N., & Newacheck, P. W. (1999). Prevalence and impact of parent-reported disabling mental health conditions among U. S. children. Journal of American Academy of Child Adolescent Psychiatry, 38, 600-609.Hanes, B., Prawatt, R., & Grissom, S. (1979). Sex-role perceptions during adolescence. Journal of Educational Psychology, 71, 850-855.Hare, B. R., (1985). Stability and change in self-perception and achievement among black adolescents: A longitudinal study. The Journal of Black Psychology, 11, 29-42.Harter, S. (1990). Self and identity development. In S.S. Feldman & G. R. Elliott (Eds.), At the threshold: The developing adolescent (pp. 352-387). Cambridge, MA: Harvard University Press.Harvey, M.W. (2003). Comparison of postsecondary transitional outcomes between students with and without disabilities by secondary vocational education participation: Findings form the National Education Longitudinal Study. Career Development for Exceptional Individuals, 25, 99-122.Hayden-McPeak, C., Gaskin, S. T., & Gaughan, L. K. (1993, April). Bad boys, good girls: A review of the research on gender differences of assessment, child rearing, and educational practices. Paper presented at the Annual Convention of the Council for Exceptional Children, San Antonio, TX.Heyman, W. B. (1990). The self-perception of a learning disability and its relationship to academic self-concept and self-esteem. Journal of Learning Disabilities, 23, 470-475.Hinshaw, S. (1987). On the distinction between attention deficit/hyperactivity and conduct problems/aggression in child psychopathology. Psychological Bulletin, 101, 43-463.Kendler, K.S., Gardner, C. O. & Prescott, C. A. (1998). A population-based twin study of self-esteem and gender. Psychological Medicine, 28, 1403-1409.Kratovil, J., & Bailey, S. M. (1986). Sex equity and disabled students. Theory into Practice, 25, 250-256.Lee, V. E., Chen, X., & Smerdon, B. A. (1996). The influence of school climate on gender differences in the achievement and engagement of young adolescents. Washington, D.C.: American Association of University of Women.Losen, D. J., & Orfield, G. (Eds.) (2002). Racial inequity in special education. Cambridge, MA: Harvard Education Press.MacMillan, D. L., Gresham, F. M., Lopez, M. F., & Bocian, K. M. (1996). Comparison of students nominated for prereferral interventions by ethnicity and gender. The Journal of Special Education, 30, 133-151.Martinez, R., & Dukes, R. (199l). Ethnic and gender differences in self-esteem. Youth and Society, 22, 318-338.Mau, W. C. (1995). Educational planning and academic achievement of middle school students: A racial and cultural comparison. Journal of Counseling and Development, 73, 518-526.Mercer, J. (1973). Labeling the mentally retarded. Berkeley: University of California Press.Mumpower, D. L. (1970). Sex ratios found in various types of referred exceptional children. Exceptional Children, 36, 621-622.National Center for Education Statistics [NCES]. (1994). National Education Longitudinal Study of 1988 Second Follow-up: Student Component Data File User's Manual. Washington, D.C: U.S. Department of Education.O’Brien, E. J., Leitzel., J., Mensky, L., Jeffreys, D., O’Brien, J.P. & Marchese, M. (1996). Gender differences in the self-esteem of adolescents: A meta analysis. Paper presented at American Psychological Corporation, Toronto, Canada.Orenstein, P. (1994). School Girls: Young women, self-esteem, and the confidence gap. New York: Doubleday.Oswald, D.P., Coutinho, M.J., Best, A, & Nagle, H. (2002). Trends in the special education identification rates of boys and girls: A call for research and change. Exceptionality, 11, 223-237.
138

Pallas, A., Natriello, G., & McDill, E. (June-July 1989). The changing nature of the disadvantaged population: Current dimensions and future trends. Educational Researcher, 18 , 16-22.Patterson, G.R. (1986). Performance models for antisocial boys. American Psychologist, 41, 432-444.Peng, S. S., & Lee, R. M. (1992, April). Measuring student at-riskness by demographic characteristics. Paper presented at the meeting of the American Educational Research Association, San Francisco, CA.Phipps, P. M. (1982). The LD learner is often a boy – Why? Academic Therapy, 17, 425-430.President’s Commission on Excellence in Special Education [PCESE]. (2002). A new era: Revitalizing special education for children and their families. Washington, DC: PCESE.Quatman, T., & Watson, C. M. (2001). Gender differences in adolescent self-esteem: An exploration of domains. The Journal of Genetic Psychology, 162, 93-117.Ralph, J. (January 1989). Improving education for the disadvantaged: Do you know whom to help? Phi Delta Kappan,71, 395-401.Richman, C. L., Clark, M. L., & Brown, K. P. (1985). General and specific self-esteem in late adolescent students: Race x gender x SES effects. Adolescence, 20, 554-566.Riordan, C. (1998). Gender gap trends in public secondary schools: 1972 to 1992. Revised version of a paper presented at the Annual Meeting of the American Sociological Association (San Francisco, CA, August 1998). (ERIC Document Reproduction Service No. ED 434 171).Riordan, C., & Galipeau, K. (1998). Achievement and equity in Catholic and public secondary schools: Gender gap comparisons from 1972 to 1992. Revised version of a paper presented at the Institute of Educational Initiatives (South Bend, IN, November 14, 1998). (ERIC Document Reproduction Service No. ED 434 964.)Robison-Awana, P., Kehle, T. J., Bray, M. A., Jenson, W. R., Clark, E., & Lawless, K. A. (2001). Self-esteem, gender-role perception, gender-role orientation and attributional style as a function of academic competence: Smart girls are different, but a boy is a boy is a boy. Canadian Journal of School Psychology, 17, 47-64.Robison-Awana, P., Kehle, T. J., & Jenson, W. R. (1986). But what about smart girls? Adolescent self-esteem and sex role perceptions as a function of academic achievement. Journal of Educational Psychology, 11, 854-856.Secretary’s Commission of Achieving Necessary Skills [SCANS]. (1991). What work requires of schools. A SCANS report for America 2000. Washington, DC: U.S. Department of Labor.Singh, K., Bickley, P., Trivett, P., Keith, T. Z., Keith, P. B., & Anderson, E. (1995). The effects of four component of parental involvement on eighth-grade student achievement: Structural analysis of NELS-88 Data. School Psychology Review, 24(2), 299-317.Sommers, C. H. (2000). The war against boys: How misguided feminism is harming our young men. New York: Simon & Schuster.Tashakkori, A. (1993). Gender, ethnicity, and the structure of self-esteem: An attitude. The Journal of Social Psychology, 133, 479-489.U.S. Department of Commerce. (1999). 21st century skills for 21st century jobs. Washington, D.C.: U.S. Government Printing Office.U.S. Department of Education. (1998). Twentieth annual report to Congress. Washington, D.C.: Author.Valdes, K., Williamson, B., & Wagner, M. (1990). The national longitudinal transition study of special education students: Statistical almanac (Vol. 1). Menlo Park, CA: SRI International.Wade, T., Thompson, V., Tashakkori, A., & Valente, E. (1989). A longitudinal analysis of sex by race differences in predictors of adolescent self-esteem. Personality and Individual Differences, 10, 717-729.Wagner, M., Newman, L., D’Amico, R., Jay, E. D., Butler-Nalin, P., Marder, C. & Cox, R. (1991). Youth with disabilities: How are they doing? The first comprehensive report from the national longitudinal transition study of special education students. Menlo Park, CA: SRI International.
139
Wehmeyer, M.L., & Schwartz, M. (2001a). Gender equity issues in the vocational and transition services and employment outcomes experienced by young women with disabilities. In H. Rousso & M. L. Wehmeyer, (Eds.), Double jeopardy: Addressing gender equity in special education (pp. 289-312). Albany, NY: SUNY.Wehmeyer, M. L., & Schwartz, M. (2001b). Disproportionate representation of males in special education services: Biology, behavior or bias? Education and treatment of children, 24, 28-45. Willingham W.W., & Cole, N.S. (1997). Gender and fair assessment. Mahwah, NJ: Lawrence Erlbaum Associates, Inc.
140
PARENTS’ AND SPECIAL EDUCATION TEACHERS’ PERSPECTIVESOF IMPLEMENTING INDIVIDUALIZED INSTRUCTION IN P. R. CHINA
-AN EMPIRICAL AND SOCIOCULTURAL APPROACH
Yi DingKathryn C. Gerken
and Don C. VanDykeUniversity of Iowa
andFei Xiao
Beijing Normal University
The purpose of this study was to explore the opinions and perspectives of special education teachers and parents of children in special education regarding the implementation of individualized instruction within the special education system in the People’s Republic of China. The study group consisted of a random sample of 344 parents of children in special education and 100 special education teachers in Beijing. Valid and reliable questionnaires were developed. Analysis of data from questionnaires showed that special education teachers had a positive attitude towards utilizing and providing individualized instruction, but also had concerns. Analysis of data from parents’ questionnaires showed that parents needed to learn to advocate for their children, wanted improved parent-teacher communication, but also had concerns. This study revealed potential barriers for implementing individualized instruction in China. American and Western educational programs and services may benefit the development of special education in China, but they need to be culturally sensitive and appropriate for the economic, social, and cultural realities and individualized and localized to China and its education system. Challenges and difficulties in the process of implementing specific imported educational programs should be addressed. Recognition of and attention to parents and special education teachers’ responses will assist Chinese colleagues, politicians, and school leaders in this process.
Individualized instruction for children with disabilities in the schools has long been advocated in the United States (Meyen, 1995). Only since the 1990’s has there been a focus on individualized instruction in the special education system of China. Many Chinese researchers and educators (e.g., Xiao and Liu, 1996) have stated that individualized instruction has better educational outcomes than traditional group instruction. However, they have not always had empirical support for their statements and the implementation of individualized instruction in China has encountered some challenges. Additional support for such an approach is needed if legislation to mandate such services is to occur. It is difficult to arrive at a precise definition of individualized instruction, which would satisfy all educators. A general emphasis rooted in individualized instruction is to match student needs to instructional options with concern for adapting resources by altering the instructional environment (Meyen, 1995). In 1975, The Education of All Handicapped Children Act (PL 94-142) was passed in the United States. This law and its various reauthorizations (e.g., IDEA, 2004) guarantee that all children with disabilities have the access to a free and appropriate public education. Thus, the American education system is striving to ensure that all children receive an education that is appropriate for their level of functioning.
141
Individualized instruction is not a new concept in China, however, a large-scale introduction and learning of individualized instruction has not been evidenced until the end of the Cultural Revolution in China (Ding, 1997). In Ding’s (1997) review of individualized instruction in China, several innovative education approaches in China were presented. Following the Cultural Revolution, the policy of classifying students based on their abilities had been implemented for years, but it was terminated in 1982, due to the negative impacts on students who were significantly below the average level in ability. The model of mastery learning developed by Benjamin S. Bloom was implemented in Lin Hu District Central Elementary School during the 1987-1988 academic year (Wu, 1989). In 1991, a program aimed at developing students’ individual academic interest was implemented at Shanghai Tan Wan Central Elementary School. Comparison of students’ pretest and posttest grades predicted positive outcomes (He & Gu, 1997). However, most of these empirical studies of individual instruction focused on children with an average level of intellectual ability.
The theoretical orientation of individualized instruction for populations with special needs has been gradually introduced to China. Over the past two decades, increasing attention has been given to individualized instruction in terms of research, training, and implementation for exceptional learners. Xiao and Liu (1996) systematically introduced the theories, functions, and implementation of individualized instruction used in the United States to China. Xiao and Liu (1996) also focused on the implementation of individualized instruction for students with mental retardation. In Liu’s (1996) work, he described the historical and legislative issues of the individualized education plan (IEP) in the United States, compared and contrasted the differences between the U. S. education system and the China education system, and advocated for future study of the Chinese efforts on application of IEP. Xiao and Wang (2000) introduced Individually Prescribed Instruction (IPI), Individually Guided Education (IGE), Program for Learning in Accordance with Needs (project PLAN), etc. Xiao and Wang (2000) stated that the idea of individualized instruction should be perceived as a theoretical and innovative orientation, which might promote the educational reform of the traditional group-instruction in the special education system of China.
A similar development of theoretical approaches to individualized instruction has taken place in Taiwan. For example, in Huang’s (1996) edited book, Individualized Instruction, a variety of individualized instruction models, which were primarily developed by European and American scholars and educator are summarized. The text emphasizes the general educational theories and methodologies of individualized instruction and provides specific strategies to assist the educators in using individualized instruction across different subjects. In addition, Lin (1999) introduced a comprehensive procedure for developing an IEP and provided specific recommendations for implementing IEPs.
Researchers and educators in China and Taiwan have made great strides in translating, introducing, and advocating the theories and models of individualized instruction from the United States and other Western countries (Huang, 1996). However, up to the present time, little is known how parents and special education teachers perceive and accept the idea and implementation of individualized instruction. This study explored parents and special education teachers’ perspectives regarding the implementation of individualized instruction in local special education schools. In so doing it revealed potential barriers to implementing individualized instruction in China. In comparing the differences between the U.S. and China education systems, it made recommendations and suggestions for future study of individualized instruction in China.
MethodParticipants and Setting Participating in this study were 400 parents of students with disabilities from 4 randomly selected urban special education schools in Beijing; 344 questionnaires of the 400 sent were identified as valid. Of the valid parent questionnaires, 24.4% of the parent participants had
142

college or graduate degrees; 44.2% had high school diplomas; and the remainder had at least an elementary or above. Teachers’ questionnaires were collected from 103 voluntary special education teachers; 100 out of 103 questionnaires were identified as valid. Among the valid teachers’ questionnaires, 55% of them had college or associate degrees, and 45% had professional training in special education. In addition, 59% of teachers had worked more than 6 years and 23% had less than two years of teaching experience.
InstrumentsAs part of the study a parent questionnaire was developed to examine possible factors that may have impacted the implementation of individualized instruction in China. The major factors included: (1) parents’ understanding and perspectives towards individualized instruction; (2) parents’ evaluation of current special education in China; (3) parents’ attitudes towards special education teachers’ qualification and expertise in implementing individualized instruction; and (4) parents’ perspectives of home-school communication and cooperation.
In addition, the teachers’ questionnaire was constructed to explore: (1) the special education teachers’ perspectives towards individualized instruction; (2) the possible challenges that teachers have encountered or may encounter in the process of implementing individualized instruction; and (3) teachers’ understanding of current special education procedures in China. All questionnaires included demographic questions were hand-written answers, multiple choice, and questions in the Liker scale format. Critical reviews of the questionnaire were by two experts in the Department of Special Education at the Beijing Normal University and three experienced special education teachers. The final instruments were field-tested using 5 special education teachers and 5 parents of children with mental retardation. Analysis of the data conducted by using descriptive statistics, t-test, one-way ANOVA, and chi-square.
ResultsThe results will be presented for each research question or combined for parents and teachers when the questions were the same.Parents’ and Special Education Teachers’ Understanding of Individualized InstructionIndividualized instruction was viewed as the same as individual instruction by 13.4% of the parents. Basic understanding and knowledge of individualized instruction was demonstrated by 24.1% of the parents with 62.5% demonstrating an accurate understanding. The majority (79%) of the teacher participants showed accurate understanding; 7% of them believed that there was no difference between individualized instruction and individual instruction. Table 1 shows that although 67.6% of the parents reported that individualized instruction could promote their children learning, only 22.2% of them believed that individualized instruction should be a mandatory requirement for their children’s education. We hypothesized that Chinese parents had limited exposure to and understanding of individualized instruction utilized in developed countries, even though they had a positive attitude towards it.
Table 1Parents’ and Teachers’ Overall Impression of Individualized Instruction
Items Percentage saying “true”Parents’ Feedback Teachers’ Feedback
II will promote better learning. 67.6%II should be mandatory for special education. 22.2%II will produce better education outcomes. 93%II will compensate for limitations of group instruction.
51%
II is ideal, but hard to be implemented. 21%(II= individualized instruction)The majority (93%) of the teachers reported positive attitudes towards individualized instruction; 51% of them believed that individualized instruction could compensate for the
143

limitations of group instruction. It is important to note that 21% of the teachers believed that it was challenging to implement individualized instruction in China.
Several similar questions were designed to explore the differences between parents’ and teachers’ attitudes and understanding of individualized instruction. In terms of the definition of individualized instruction, teachers demonstrated more accurate understanding than parents did. In addition, teachers displayed more advanced desire to individualize the instruction than parents did (Table 2).Parents’ and Teachers’ Evaluation of Current Special Education in China Approximately one-fifth (21.6%) of the parents reported that current instruction was not appropriate for their children; 17.8% of them advocated the improvement of the teacher training; and approximately 30% of them believed that teachers were overwhelmed by their current work. Half (49.9%) of the parents demonstrated a strong need to gain access to teachers’ extended support for their children’s education and 60.9% of them wanted to gain access to knowing more about their children’s occupational development. We hypothesized that the home-school communication may play an important role in family education and may provide resources for parents to develop their children’s occupational skills. In addition, there
Table 2 Comparison of Parents’ and Teachers’ Responses toQuestions About Individualized
InstructionItems Parents
(n=344)Teachers (n=10)
T Test
M SD M SD T 2-Tailed SigIndividualized Instruction is …(multiple
choices) 2.45 0.829 2.70 0.659 -
3.1140.002***
Pace of instruction within a class should be uniform.
2.50 1.498 3.80 1.119 -9.403
0.000***
Students in the same class should be given the same test.
2.24 1.392 3.63 1.331 -8.880
0.000***
(P<0.05*, P<0.01**, P<0.001***; Questions were in a multiple-choice format or in a liker scale.)
are 33.2 % of the parents advocated an education reform within the special education system. By applying a chi-square test, parents with different education levels demonstrated significant discrepancy in evaluating current special education instruction, teachers’ workload, and supervision of teachers’ improvement of instruction (Table 3).
Table 3Parents’ Attitudes towards Current Special Education
Items Percentage saying “true”
Chi-Square/Sig.
Current instruction is appropriate. 21.6% 13.913/0.008**Instruction methods need to be improved. 18.66% 9.076/0.059Teachers’ qualification has to be desired. 17.8% 6.094/0.192Teachers are overwhelmed by their current work. 27.4% 12.817/0.012*Teacher-centered philosophy dominates special education. 4% 4.841/0.304School managers should supervise teachers’ instruction improvement.
14.3% 10.679/0.030*
Government should make more efforts for education reform. 33.2% 6.437/0.169More communication with others should be desired. 19.8% 7.338/0.119Teachers should provide more assistance for parents. 49.9% 2.507/0.643Acknowledging more about children’s career development is necessary.
60.9% 8.821/0.066
(Questions were designed in a multiple choice format.)
The survey of teachers focused on the specific challenges that occurred in the existing special education system. About three-fifth (61%) of the teachers agreed that the discrepancy between students placed them at a very challenging position guarantee an appropriate
144
education for each student. Three-fourths of the teachers desired an education reform of current instruction and 41% of them reported that they were overwhelmed by their work and not satisfied by their current payment. Teachers with different education levels did not show significant difference in evaluating current special education (Table 4).
Table 4Teachers’ Attitudes towards Current Special Education
Items Percentage Chi-Square/Sig
The discrepancy between students is significant. 61% 2.336/0.311Instruction reform is warranted. 75% 0.353/0.838Workload is heavy and payment needs to be improved. 41% 0.182/0.913(Questions were in a multiple choice format.)
There was a significant difference (0.000***, x² test) between teachers’ desire for education reform in instruction and parents’ desire for education reform. We hypothesized that teachers worked within the special education system and were more aware of the limitations of current instruction than were parents (Table 5).
Table 5Comparison of Parents’ and Teachers’ Desire for Education Reform
Item Parents (n=344) Teachers (n=100) Chi-SquareThe government should increase the impact on education reform.
M SD M SD0.000***0.34 0.48 0.76 0.43
Teachers’ Perspectives of the Barriers of Implementing Individualized InstructionChina’s education law has not guaranteed individualized instruction yet, and approximately
half of the teachers believed that a legislative guarantee is warranted. A strong support (74%) revealed teachers’ need to gain access to preservice and inservice professional training regarding individualized instruction. Individualized instruction is not a well-
developed methodology in China and it was possible that most special teachers merely heard about this idea, but lacked experiences to apply it (Table 6).
Table 6Teachers’ Reports of Barriers to Implement Individualized Instruction
Items Percentage Chi-Square/SigLegislative guarantee is warranted. 43% 0.241/0.886Preservice and in-service training are desired. 74% 4.741/0.093Schools should provide teaching assistants. 60% 2.127/0.345Teachers need more independence to modify instruction. 44% 6.512/0.039*Parents may provide after-school assistance and relieve teachers’ workload.
50% 0.431/0.806
(Questions were in a multiple choice format.)
Three-fifth of the teachers reported the need to gain the access to assistance from teacher associates or assistants. In addition, half of the teachers reported the desire to gain assistance from parents. Compared with the special education system in the United States, special education in China was equipped with uniformed instruction textbooks and assigned instructional outlines, which were designed by the Department of Education in China. Approximately half of the teachers wanted to gain more independence of modifying the instruction to meet specific individuals’ needs, which revealed that the highly uniformed and structured instruction did not guarantee an appropriate education. Based on their educational level, the teachers varied in their desire to have more independence in modifying instruction to meet specific individuals’ needs. Teachers with higher education level demonstrated more need for independence to modify instruction (Table 6).
Parents’ Evaluation of Special Education Teachers
145
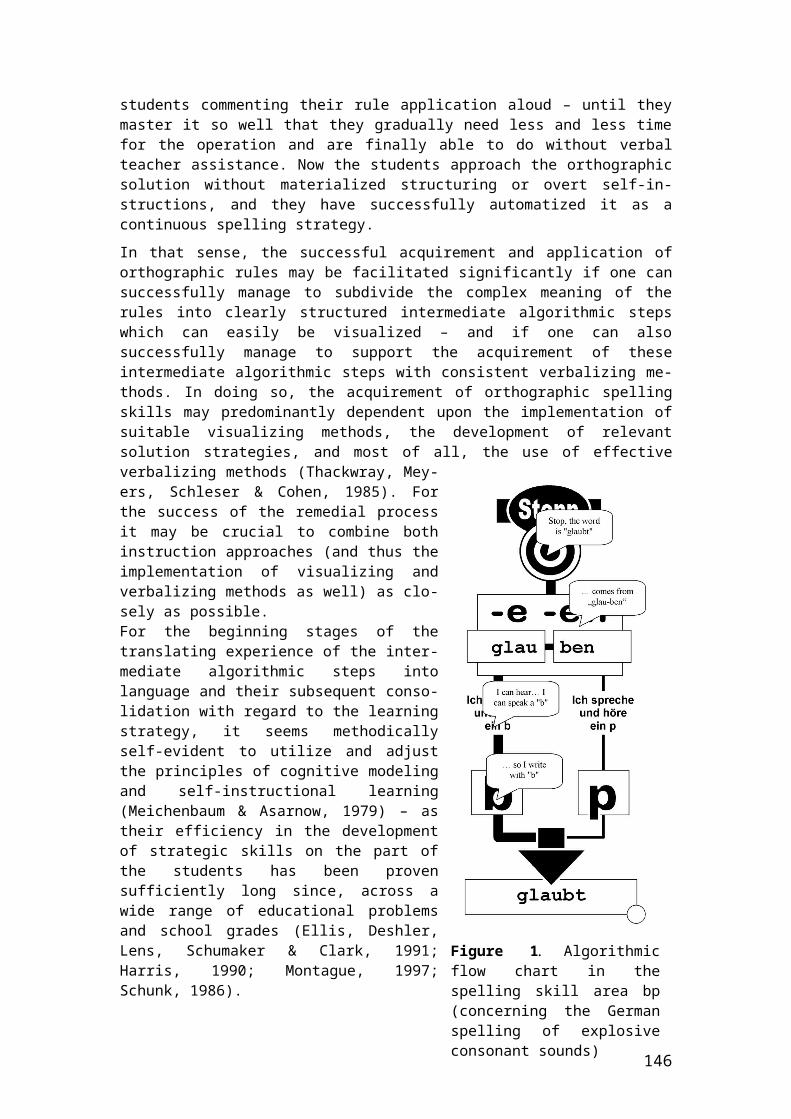
Generally, the majority of the parents reported positive or neutral attitudes towards teachers’ professional training, organization skills, and professional spirit. However, approximately 30% of the parents worried about the extended support and resources for teachers’ professional development. In other words, the availability of resources and professional support might have a significant impact of educational outcomes, even though teachers’ overall qualifications were not a big concern. Meanwhile, 23.6% parents reported that the teachers had little independence to accommodate the instruction, which corresponded to teachers’ self-report (Table 7). Table 7
Parents’ Evaluation of Special Education TeachersExcellent Adequate Average Not
AdequatePoor Mean/SD
Teachers’ Education 15.5% 31.8% 39.4% 13.1% 0.3% 1.51/0.917Teachers’ Organization Skills 15.5% 33.5% 40.2% 10.5% 0.3% 1.47/0.887Teachers’ Professional Spirit 17.2% 46.9% 26.8% 8.2% 0.9% 1.29/0.875Resources and Help 30.3% 14.3% 25.1% 25.7% 4.7% 1.63/1.400Teaching Independence 29.4% 17.5% 29.4% 21.0% 2.6% 1.50/1.206Teachers’ Qualification 13.4% 24.7% 45.8% 12.5% 3.5% 1.68/0.974
)Note: Weights of “0”, “1”, “2”, “3”, and “4” correspond to the categories of “excellent”, “adequate”, “average”,
“not adequate”, and “poor(.”
Teachers’ Attitude of Implementing individualized instructionStrong support (92%) by teachers was given to the implementation of individualized instruction. However, approximately 40% of the teachers demonstrated dissatisfaction of current group-instruction within the special education system. The majority (78%) of the teachers disagreed with utilizing uniformed examination system to evaluate special education students (Table 8). By utilizing Oneway ANOVA, teachers’ with different education backgrounds did not demonstrate significant differences in terms of their attitudes towards implementing individualized instruction.
Table 8Teachers’ Attitude towards Individualized Instruction and Current Special Education
Items Most Likely
Likely Neutral Unlikely Most Unlikely
Mean/SD
II is possible to implement. 51% 36% 6% 4% 3% 1.54/0.989We should implement II. 58% 34% 2% 5% 1% 1.52/0.785II is similar to GI. 10% 8% 13% 42% 27% 3.65/1.313GI satisfies educational goals. 11% 17% 34% 32% 6% 2.45/1.274SE has good outcomes. 2% 30% 24% 34% 10% 2.95/1.175Instruction pace should be unified. 5% 9% 5% 60% 21% 3.63/1.331Tests should be unified. 5% 13% 4% 50% 28% 3.05/1.132
)Note: Weights of “0”, “1”, “2”, “3”, and “4” are correspondent to the categories of “most likely”, “likely”, “neutral”,
“unlikely”, and “most unlikely”. II=Individualized Instruction, GI=Group Instruction, SE=Special Education (
Teachers’ Attitudes towards Current Educational Policies and Teacher Training Two-fifth of the teachers believed that current educational policies encouraged teachers to implement individualized instruction, however almost half of them demonstrated desire to gain the access to teaching assistants and other support to assist them implement the idea of individualized instruction in real world. About half (44%) of the teachers reported the need to
Table 9Teachers’ Attitudes towards Current Educational Policies and Teacher
TrainingItems Most
Likely Likely Neutral Unlikely Most
UnlikelyMean/MD
Education policy encourages utilizing II.
3% 37% 47% 9% 4% 1.64/0.847
146

Teaching assistants are warranted. 3% 43% 47% 6% 1% 1.59/0.698Teachers should voice their options and suggestions towards instruction.
4% 40% 53% 3% 0% 1.55/0.626
Comprehensive evaluation system is necessary for II.
4% 42% 45% 8% 1% 1.60/0.739
voice their opinions and suggestion about instruction and school reform. In addition, approximately half of the teachers believed that a comprehensive evaluation system is warranted for implementing individualized instruction (Table 9).
Parent Participation and Home-School Communication Parents indicated moderate support (50.9%) of the access to participation in their children’s education and school administration. A moderate support (62.5%) indicated parents’ desire to communicate and cooperate with teachers. Approximately half (44.8%) of the parents liked to provide assistance for teachers, which may relieve teacher’s workload. It showed that 37.8% parents demonstrated parents’ desire to voice their suggestion and the access to have an impact on their children’s formal education. Utilizing chi-square test, parents with different education levels revealed significant difference (0.016*) in terms of giving suggestions and having impact on school education. Parents with lower level of education demonstrated high level of desire than parents with higher level of education (Table 10).
Table 10Parents’ Attitudes towards Home-school Communication
Items Most Likely
Likely Neutral Unlikely Most Unlikely
Mean/MD Sig.
Parents have the right to participate in children’s education and school administration.
9.3% 41.6% 38.4% 8.7% 1.7% 1.52/0.847 0.028
Parents should communicate and cooperate with teachers.
14.0% 48.5% 29.1% 4.7% 3.5% 1.35/0.912 0.142
Parents may function as teaching assistants.
14.0% 30.8% 36% 14% 5.0% 1.66/1.067 0.319
Parents should voice their suggestion and have an impact on school education.
15.1% 22.7% 42.2% 16.6% 3.2% 1.70/1.028 0.016*
Interpretation and Discussion of the Findings This survey revealed parents’ and special education teachers’ attitudes regarding current special education and the implementation of individualized instruction in China. The interpretation of the reported concerns follows.
Parents’ attitudes towards current special educationA number of parents reported that they believed that the current special education instruction did not meet their children needs and that there was a need for education reform. An obvious limitation of the current special education curriculum in China is its inflexibility. Most of the special schools utilize a uniform curriculum and teachers are required to follow the curriculum outlines, which were designed by the Department of Education of China. Without taking into account of the special education children’s individual needs and the characteristics of local schools, the uniform curriculum used nationwide could produce instructional challenges for teachers who want to meet children’s needs. In addition, some uniform textbooks may not be appropriate for developing the occupational skills of children who are mentally retarded.
A small portion of parents indicated that there was need to improve teacher’s overall skills and teaching methods. In most Asian countries, teaching is perceived as a serious process and the most common form of teaching is lecturing. A variety of teaching techniques (e.g., group
147

discussion, peer tutoring, instruction with the technological assistance) may be best in helping teachers motivate their students to work on tasks.
In Beijing, it is not surprising to see a special education teacher simultaneously teach 10-14 exceptional students without a teacher associate or assistant. Compared with special education teachers in the United States, who usually have access to assistance from other school personnel, Chinese special education teachers tend to be exhausted by their instruction and class management routine. Moving to an individualized instruction model appears to be impossible, without extended assistance. According to the history of educational reform movement in the United States or other European countries, political impact and legislation play an important role in promoting appropriate education for students with disabilities. For example, in the United States, the Individuals with Disabilities Education Act (IDEA) acts as an education law that was enacted to ensure equal educational opportunities and high expectations for students with disabilities. Approximately one third of the parents indicated that there was a need for a special educational reform, which would be advocated by the government. In other words, intensive political impact and a guarantee in education law is necessary for the modification or reform of current special education in China.
The parents’ desire for support from other parents demonstrates that communication and interaction between parents is not well developed. In the United States, parent associations play a crucial role in advocating special education students’ education and services. However, Chinese parents with children who have disabilities have limited communication and interaction with each other. Mental retardation is a condition that results in pain and bewilderment in many families. Most parents with children who have mental retardation lack extended support from other parents, community, etc. There are a few parent associations for exceptional learners in China; however, the functions of these associations are not well developed. More than half of the parents also expressed a need to focus more on their children’s career development. They currently lack access to adequate occupational guidance to assist their children. Limited home-school communication may contribute to the parents’ concern. Although most Chinese parents are invited to participate in teacher-parent conferences on a semester basis, more frequent communication should be promoted in order to keep parents informed about their access to extended resources and assistance from school and local education agencies.
Teachers’ attitudes towards current special educationThe majority of the students from these four special education schools were students with mild and moderate mental retardation and they were usually placed in classrooms for children with educable and trainable mental retardation. However, the large teacher: student ratio, such as 1/10, places these special education teachers in a position to encounter failure. An assumption of group instruction is that the learners demonstrate similar cognitive functioning and have similar learning skills. The significant discrepancy between these students’ cognitive development (e.g., thinking, problem solving), learning style, attention span, etc. makes group instruction inappropriate for much of the instruction. Most of the special education teachers realized the limitations in the current curriculum, instruction techniques, and supporting services.
Compared with American special education teachers, Chinese special education teachers have very limited independence to modify the curriculum since the Department of Education of China determines the national curricula. In addition, the curriculum must be conducted based on the curriculum outlines, which are distributed by the Department of Education. In other words, the curriculum and its delivery are mandated by outside personnel and very limited adjustment/modification is allowed.
At least 41% of the special education teachers have concerns about their pay and workload, since their salary is usually lower than the average salary for regular education teachers
148
(Ashman, 1995). Low salaries may play a crucial role in motivating teachers to do a good job. In China, general education and special education have been perceived as separate systems and they are funded by different sources. Fewer financial supports are allocated to special education; therefore, fewer teachers are attracted to the special education system.
Parents’ Perspectives Towards Individualized Instruction Strong parental support (67.6%) for individualized instruction indicated that parents have realized the limitations of current group-instruction and believe that individualizing the instruction to meet students’ needs would produce better educational outcomes. Over 60% of the parents believe that it is very likely or likely that parents should communicate and cooperate with teachers which might release teachers from certain kinds of routine tasks. For example, parents might volunteer to provide supervision for their children’s after-school care, offer help for their children’s assignment and homework, and act as teacher assistants when the lead teacher wants to provide individualized instruction to a student.
In terms of individualizing students’ learning, parents’ feedback and suggestion might provide teachers with valuable information to modify the curriculum. Parents are always the first teachers of their children and understand the strengths and weaknesses of their children. Therefore, communication and interaction between parents and teachers may help teachers and parents to work together to modify instruction or educational expectations to fit each child’s need. The majority of parents reported positive attitudes towards special education teachers’ expertise. However, they reported concerns that the teachers may not have the professional training and resources they need to implement individualized instruction successfully.
Teachers’ Perspectives Towards Individualized Instruction The teachers reported strong support for utilizing individualized instruction. However, they also had specific concerns about implementing it in real world. One half of the teachers indicated a need to modify the current curriculum. A very large number of teachers (74%) displayed concerns about implementing individualized instruction, due to their limited exposure to specific knowledge and training in individualized instruction. In the United States, every student with a disability must receive services under IDEA and must have an individualized education plan. This is a vital document because it contains key information about the student and the special education and related services he or she needs. However, individualized instruction for children with disabilities has not been guaranteed by related education legislation in China. Teachers believe that the implementation of individualized instruction in China require progress in legislation and governmental advocacy.
During the procedure of developing an IEP, it is mandatory that a team of people, including the student’ parents and school professionals, write the IEP. The parent involvement in disabled students’ education has not been guaranteed by legal documentation in China. However, though school systems have strived for improving home-school communication. This survey revealed that many special education teachers desire to cooperate with parents and improve parent involvement in the procedures for individualizing students’ curriculum. It is known that an IEP for each exceptional student in the United States should be developed or reviewed annually. A systematic and consistent evaluation or review is an important component to update student’ special education and related services. We found that about half of the teacher desired an evaluation/review system to supervise the implementation of individualized instruction.
A Comparison of the Education System in China and the United States Beyond the survey, the researchers believe that the significant differences between the education systems of China and the United States have made it difficult for the special
149
education teachers in China to carry out individualized instruction. An understanding of the educational differences related to the culture, politics, and social expectation may be beneficial to Chinese special education teachers when they attempt to modify the individualized instruction models rooted in the United States. Based on the understanding and experiences of working in special education systems both in the United States and China, the major cultural and social differences between these two countries are highlighted below:
Learner-centered vs. Knowledge-centered A learner-centered educational philosophy has played an important role in American education reforms (Bransford et al., 2000). The learner-centered environment emphasizes knowledge, skills, attitudes, and beliefs that the learners bring to the educational setting and integrates them into the learning process. Therefore, the occurrence of individualized instruction corresponds to the need to make sure materials match exceptional students’ specific cognitive or physical functioning. Both general and special education systems in China have deep roots in knowledge-centered education. Generally, knowledge-centered environments focus on promoting students’ knowledge acquisition and helping students understand the content in existing interaction. However, pure knowledge instruction may result in an under-development of exceptional students’ personal needs. A combination of learner-centered and knowledge-centered educational philosophies may contribute to the improvement of education and services for Chinese students with special needs.
Teacher Training and Resources of Other Professionals The United States plays a leadership role in both general education and special education. Every special education teacher in the United States is required to have a college degree and receive temporary or regular certification. Most special education classrooms have smaller teacher: student ratio, which make it easier for the teachers to modify or individualize the curriculum. The assistance from other professionals or teaching assistants has become a necessary component of current special education in the United States. In China, a significant discrepancy in special education teacher’s qualifications occurs in urban and rural areas. Generally, urban special education teachers have a higher educational background than rural special education teachers. However, in terms of educational background, there is a significant discrepancy between Chinese and American special education teachers. Therefore, in-service training or workshops will be an important addition for Chinese special education teachers to improve their professional expertise.
In addition, different special education professionals, such as speech pathologists, school psychologists, occupational therapists, etc., provide American special education teachers with access to different professional resources. In China, the limited professional support from different special education personnel has made education even more challenging for special education teachers. A number of responsibilities that should be given to other professionals are usually assigned to special education teachers. In addition, the limited number of associates or teaching assistants has made individualized instruction extremely hard to implement in a classroom with a large teacher: student ratio. The development of a team of professional personnel and teaching associates/assistants may partially relieve Chinese special education teachers from overloaded educational routines. Rural special education teachers need more attention and support from local education agencies.
Flexible Curriculum vs. Uniformed CurriculumIndividualized instruction requires a flexible curriculum system, which can be modified to meet students’ special needs. In the United States, textbooks and curriculum are usually determined by local schools or local education agencies, which take into account their own local circumstances; recognize the requirements of their students and community; and meet the needs and expectation of all learners. In China, a uniform curriculum has been utilized across the country for several decades, except in experimental schools that have a specific aim. The original aim of unifying curriculum across the country is to standardize the
150
instruction and make it easier to supervise the national elementary and secondary curricula. However, a uniform curriculum may lack the flexibility to fit the needs of students with disabilities, due to their diverse cognitive functioning and learning styles. Redesigning or modifying the curricula may meet the needs of exceptional learners.
Comparison of Parent Advocacy Movement and Parent Involvement Special education programs throughout the United States resulted from a bottom up approach. They were initiated by parents of children with disabilities who provided leverage in the communities and states, then litigation, and finally federal legislation to ensure that every child with a disability received access to appropriate educational services. American parents have always led the fight for better services for their children (Heward, 2003). They have always been in the forefront of change, often nudging and promoting the professionals along with them. Parents across the country were making connections with one another. With American parents’ efforts, changes have occurred in many areas that have improved the lives of children and adults with disabilities and their families. Chinese parents have realized the need to ask for better systems of service for children with disabilities. However, underdeveloped parent associations and lack of cooperation among parents have led to fragmented efforts. Along with the fast-developing economy in China, increasingly families have been making more efforts to advocate for improving education and related services for their children. Forming alliances or coalitions with organizations for exceptional individuals may be an effective way for parents to cooperate with one another. An advanced and consistent parent advocacy movement may accelerate the pace of special education reform in China. It is important to remember that the Education for All Handicapped Children’s Act (PL94-142, 1975) guaranteed parent participation in nearly all phases of the special education planning process (Simpson, 1990). However, there is no clear guarantee of parent involvement in the Compulsory Education Law of the People’s Republic of China.
Comparison of the Legislation Impact American federal legislation on disabilities has played an important role in advocating the rights for exceptional learners. The 1964 Civil Rights legislation made American parents think about the need for civil rights protection for people with disabilities. Sections 503 and 504 of the Rehabilitation Act became law in 1973, which extended basic civil rights to qualified individuals with disabilities in federally assisted (public) programs. In 1975, P. L. 94-142, the Education for All Handicapped Children Act (now the IDEA) was passed, which was developed with input from parents and professionals. It opened the doors of the public school system to all children with disabilities. In addition, it acknowledged the need for parental involvement in order to maximize the benefits of education.
Similarly, legislative mandates have accelerated the development of special education in China. For example, the Resolution on the Reform of the School System was published in 1951 and required education for children, youth, and adults with disabilities (cited in Year-Book of Education in China 1949-1981, 1984, p. 385). In the 1980s and 1990s, Compulsory Education Law of the People’s Republic of China (1986) and Law of the People’s Republic of China on the Protection of Disabled Persons (1990) were passed, both of which guarantee a free education for individuals with disabilities. However, neither of the above laws guarantees an appropriate education or an individualized education plan to each exceptional student. Li and Altman (1997) argued that the China Compulsory Education Law is basically a civil rights law, rather than a program law, which should include specific programmatic stipulations.
Limitations and Recommendations While this is the first study to investigate the perspectives of Chinese parents of children with disabilities and special education teachers’ towards implementing individualized instruction in China, there are several limitations of the study that warrant further discussion. Our sample was limited to parents and special education teachers from 4 urban special education schools
151
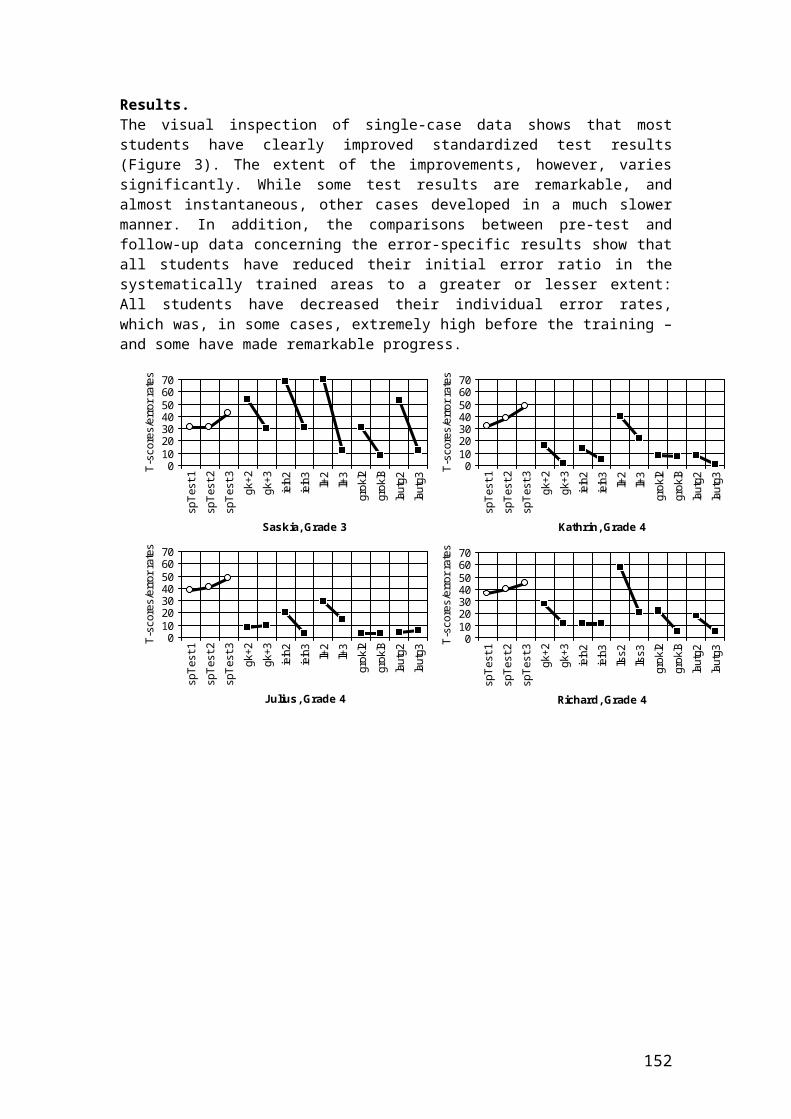
in the City of Beijing in China. It is unknown whether the characteristics of parents and special education teachers from this region might be shared by samples from other regions in China. Thus the generalization of these findings to other areas in China should be done with caution. Future research should explore the perspectives of Chinese parents and special education teachers in other urban and rural areas as well.
Secondly, the differences between the American education system and China education system were addressed by the authors’ understanding and observation of the educational systems in both countries. This discussion is also limited. Further study should address the discrepancy of the educational systems in the U.S. and China by implementing cross-cultural comparisons.
The researchers believe that the recognition and understanding of parents and special education teachers’ perspectives towards individualized instruction warrant further attention and study. Government and public agencies, which fail to recognize parents and teachers’ concerns, may fail to provide assistance and intervention in accelerating the pace of education reform in China.
In conclusion, education reform and programs that are implemented successfully in developed countries do not guarantee the same successful outcomes in countries that have a very different economy and culture. American and Western education programs and services may serve as a model of special education in China, but the transfer needs to be culturally sensitive and appropriate for the economic, social, and cultural realities, which individualize and localize China and its educational system. Challenges and difficulties in the process of implementing specific imported educational programs should be addressed. Recognition of and attention to parents and special education teachers’ responses will assist Chinese colleagues, politicians, and school leaders in learning from the successes and failures.
References: Ashman, A. F. (1995). The education of students with an intellectual disability in the People’s Republic of China: Some observations. European Journal of Special Needs Education, 10(1),47-57.Bransford, J. D., Brown, A. L., & Cocking, R. R. (2000). How people learn: Brain, mind, experience, and school. Washington, DC: National Academy Press.Ding, X. J. (1997). Jin nian lai wo guo ge bie hua jiao xue yan jiu zong shu [Literature review of recent development of individualized instruction in our country]. Shanghai Jiao Yu Yan Jiu [Shanghai Education Research], 112, 12-17. Gagne, R .M., Briggs, L. J., & Wager, W. W. (1992). Principles of instructional design. Fort Worth: Harcourt Brace Jovanovich College Publishers.He, X. Z., & Gu, M. Y. (1997). “Nong cun xiao xue sheng zhu zhong xing qu pei yang, fa zhan ge xing te chang” de yan jiu bao gao [Development of interests and individual strengths of students in rural school: A research report]. Shanghai Jiao Yu Yan Jiu [Shanghai Education Research], 4, 12-17. Heward, W. L. (2003). Exceptional children: An introduction to special education (7th ed., pp. 123-124). Upper Saddle River, New Jersey, Columbus, Ohio. Huang, Z. J. (1996). Ge bie hua jiao xue [Individualized instruction]. Taiwan Normal University Shu Yuan Limited Company. Johnson, L. J., & Pugach, M. C. (1992). Continuing the dialogue: Embracing a more expansive understanding of collaborative relationship. In W. Stainback & S. Stainback (Eds.), Controversial issues confronting special education: Divergent Perspectives (pp. 215-222). Needham Heights, MA: Allyn & Bacon.Li, Y., & Altman, R. (1997). Comparison of special education legislative mandates in the United States, China, and Taiwan. Education and Training in Mental Retardation and Developmental Disabilities, 32(2), 154-162.
152
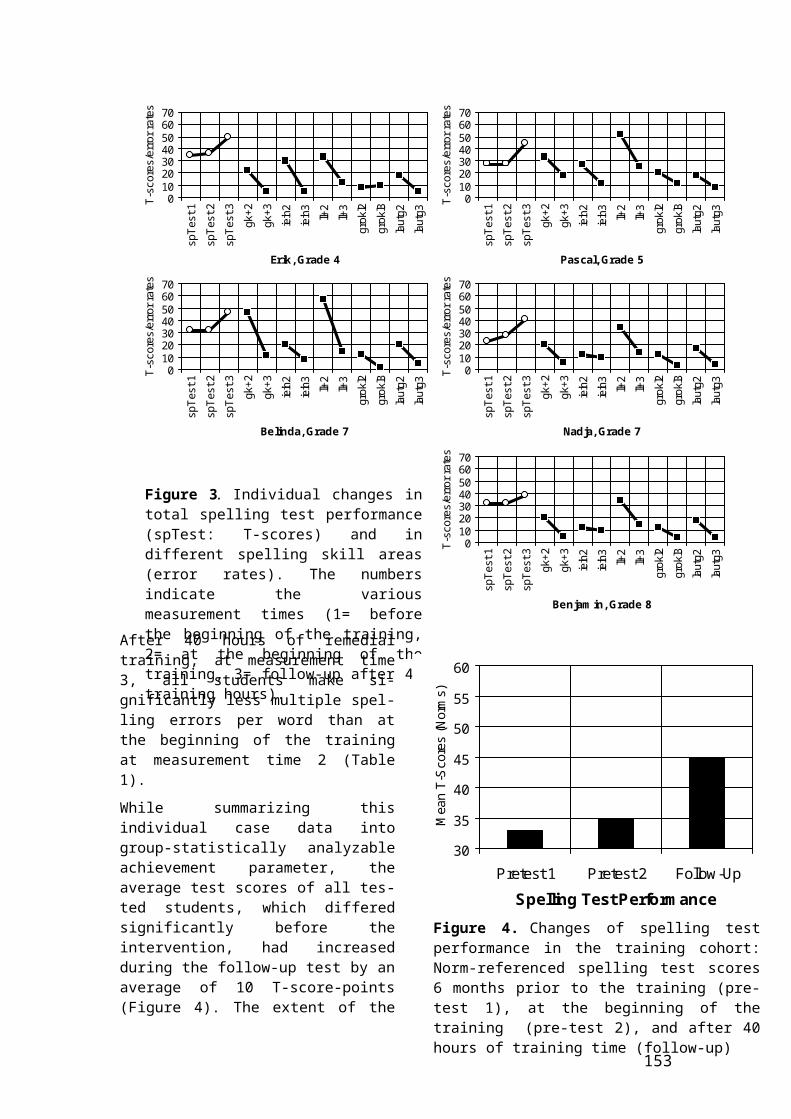
Liu Q. L. (1999). Ge bie jiao yu ji hua de li lun yu yan jiu [Theories and practices of individualized education plan]. China Women Publishing. Lin, S. Z. (1999). Ru he ni ding “ge bie jiao yu ji hua”-Gei te shu jiao yu de lao shi yu jia zhang [How to develop an “Individualized Education Plan”-For special education teachers and parents]. Taiwan Psychology Publishing. Meyen, E. L. (1995). Current and emerging instructional practices. In E. L. Meyen & T. M. Skrtic (Eds.), Special education & student disability: An introduction to traditional, emerging, and alternative perspectives (pp. 111-113). Denver, CO: Love Publishing Company. Simpson, R. L. (1990). Conferencing parents of exceptional children (2nd ed.). Austin, TX: Pro-Ed. Vergason, G. A., & Anderegg, M. L. (1992). Preserving the least restrictive environment. In W. Stainback & S. Stainback (Eds.), Controversial issues confronting special education: Divergent perspectives (pp. 45-54). Needham Heights, MA: Allyn & Bacon. Wu, Y. Q. (1989). Zai xiao xue shu xue zhong ying yong “zhang wo xue xi ce lue” de shi yan [Experiment of “Mastery Learning” in elementary mathematics]. Shanghai Jiao Yu Yan Jiu [Shanghai Education Research], 5, 1-8. Xiao, F. & Liu Q. L. (1996). Zhi li luo hou jiao yu de li lun yu shi jian [Theories and practices of education for students with mental retardation]. Beijing: Hua Xia Publishing. Xiao, F. & Wang, Y. (2000). Zhi li luo hou jiao yu tong lun [Introduction of education for mental retardation]. Beijing: Hua Xia Publishing. Zhong guo jiao yu nian jian 1949-1981 [Year-book of education in China 1949-1981] (1984). Beijing: China Encyclopedia.
153
PARENTS’ AND LOCAL EDUCATION AUTHORITY OFFICERS’ PERCEPTIONS OF THE FACTORS AFFECTING THE SUCCESS OF INCLUSION OF PUPILS
WITH AUTISTIC SPECTRUM DISORDERS
Emma M. Waddingtonand
Phil ReedSwansea University
The past ten years have seen a growing drive towards ‘full inclusion’ of children with Autistic Spectrum Disorders (ASD) in schools. However, concerns about whether inclusion for children with ASD is synonymous with their right to appropriate education have been raised amongst researchers. The current study aimed to ascertain the views of both professionals, and parents of children with ASD, regarding inclusion of children with ASD into mainstream schools by using a series of focus groups. A content analysis was used, and the results showed that parents and professionals agreed that school factors, such as school commitment; and LEA factors, such as funding, were fundamental to the success of inclusion. Professionals felt that child factors such as behavioural problems, and learning difficulties, were the primary reason for exclusion from mainstream. Significantly, both groups agreed that in order to improve successful inclusion, there needed to be more openness to alternatives to mainstream for children with ASD.
Over the past ten years there has been a growing drive towards full inclusion. This drives results, in part, from the Salamanca Statement (Unesco, 1994), and, in the United Kingdom, from a rights agenda (see Evans & Lunt, 2002; Gallagher, 2001). In contrast to this full inclusion position, there have been moves towards more cautious forms of inclusion (e.g., Vaughn & Schumm, 1995), which argues that individuals have a prevailing right to the best education.
The policy framework for inclusion in the United Kingdom has been set up by a number of documents. For example, the Government White Paper (Department for Education and Employment, 1997), which asserts the right of the pupil with special educational needs (SEN) to be educated in mainstream schools wherever possible, as well as the Code of Practice (DfEE, 1994), and the Government Programme of Action (DfEE, 1998). The latter document promotes inclusion: where parents want it and where appropriate support can be provided. This phrasing appears to acknowledge that inclusion will not necessarily benefit all children. Despite the recognition that full inclusion may not be beneficial for all children, there are no guidelines as to when inclusion will be favourable, and where it will hinder the child’s education.
154

The Warnock Committee (1978) shifted the focus from separate or alternative provision, to that normally available at mainstream schools. Since the implementation of the 1981 Education Act, there has been a trend towards the greater use of mainstream placement. The Audit Commission (1998) found that the number of children with Statements of Needs being educated in mainstream schools had risen from 40% to 55% since 1992. Current government targets encourage further development of inclusive provision (Frederickson & Cline, 2002). However, many critics fear that inclusion for some children will never be beneficial (e.g., Simpson & Myles, 1990). Others argue that the case for inclusion is driven by ideological approaches, leading to an overemphasis on ethical and moral imperatives, and a relative lack of concern in meeting the child’s individual needs (Burack et al., 1997). Such concerns have lead to a call for the replacement of full inclusion with a more responsible inclusion (O’Bri
en,2001 ; Vaughn & Schumm,1999) One of the main concerns is how to include children with behavioural problems, such as those displayed by children with Autistic Spectrum Disorder (Downing, Morrison & Berecin-Rascon, 1996). Although the number of children being included is increasing (Norwich, 2000), the number of pupils being excluded from school, mainly for unacceptable behaviour, has also steadily increased (Parsons, 2000). Unfortunately, there has been little work examining the factors that promote successful inclusion of children with ASD. One recent study looked at the attitudes of parents and professionals about the various educational provisions available for children with autism (Jindal-Snape, Douglas, Topping, Kerr & Smith, 2005). They found that parents considered that autism specific training for teachers was critical to the success of a mainstream placement. In addition, parents and professionals felt that in all provisions the quality of delivery, staff training and effective adaptation of the curriculum was fundamental to creating an inclusive environment (Jindal-Snape et al., 2005). The importance of the views of staff involved directly with the inclusion process to the success of that inclusion practice has been referred to regularly in the literature (Avramidis, Bayliss & Burden, 2000; Frederickson, Osborne & Reed, 2004; Vaughn, Schumm, Jallad, Slusher & Saumell, 1996). Frederickson et al. (2004) found that there were commonalities in the views of the definition of successful inclusion amongst teachers involved in the process of inclusion. The authors argued that this would have implications when the teachers came to design support and skill development programs for the pupils. Therefore, assessing the opinions, concerns and perspectives of those staff involved in the process of inclusion will have a significant impact on the success or otherwise of inclusion. These views, in addition to those of the carers of children with Autistic Spectrum Disorders (ASD), will be the topic of the current study.
Individuals who work, and are in close contact, with children diagnosed with ASD will have valuable insight into the factors that promote successful inclusion, and may help to develop a better understanding of what determines successful inclusion for children with ASD. The same is the case for parents of children with ASD. Parents have the ultimate say on whether their child is included or not into a mainstream school, as stated in the code of practice (DfEE, 1994). Consequently, their views will influence the success of inclusion. Given this the views of both parents of children with AD and professionals involved in the inclusion process were sought.
MethodParticipants.Parents of children with ASD, and local authority workers, were recruited from three local authorities in the South East of England. All participants were randomly selected from lists of
155

parents who had a child with a diagnosis of ASD, and local authority officers with experience of working with children with ASD. Letters were sent inviting participants to attend focus groups discussing their experiences of inclusion. The participants received no payment for the participation in this study. Eight focus group interviews were conducted in total; four groups with parents, and four with local authority workers. The composition of the groups is given in Table 1.
Table 1 Number of participants in each focus group
ParticipantsLocal Authority Workers Group 1
Group 2Group 3Group 4
5 females6 females, 2 males7 females4 females, 1 male
Parents Group 5Group 6Group 7Group 8
7 females, 1 male4 females3 females, 1 male6 females, 1 male
Focus Group Sessions.Each focus group was conducted by a trained moderator. The focus groups were structured by a scripted set of instructions consisting of the questions to be asked, and the prompts to be used when participants were unsure about how to answer. In this way, all questions were consistent in every focus group interview, and each group was conducted, as far as possible, under the same conditions. Table 2 displays a skeleton of the questions that were asked by the moderator during the focus group interviews.
Table 2Questions asked in the focus groups
1. Who decided when your child was ready to be included in a mainstream school?2. What factors lead to the decision to place a child in mainstream?3. What factors are most beneficial for inclusion?4. What is less beneficial?5. What could be improved?6. What are the advantages of having a child placed in a mainstream school instead of a special
school?7. What types of help have been offered by the professional services and when?8. If advice is to be given, when is the best time?
The length of the focus groups varied depending on the number of participants involved. The shortest focus group lasted approximately 45 minutes, and the longest focus group lasted approximately 90 minutes.
Content Analysis.All focus groups were audio-taped, and later transcribed for analysis. The transcripts were analysed using a content analysis of the text as recommended by Vaughn, Schumm and Sinagub (1996). This procedure has been used previously by Frederickson et al. (2004), and Osborne and Reed (in press). The stages of the analysis are outlined in Table 3.
Table 3Stages in Content Analysis (as cited in Vaughn et al. 1996)
_________________________________________________________________ _ 1. Identification of key themes from reading and re-reading the transcripts
2. Creating units of information from the data (phrases and /or sentences)
156

3. Categorisation of the units into themes or categories
4. Negotiation of categorisation between two researchers until all categories have been exhausted.
Once transcribed, all statements from the individual focus groups were broken down into the smallest units of information that were interpretable by themselves. A unit of information could be either a sentence or phrase. This was completed for the transcripts of all the focus groups. Once the units were established, category headings were created by reading through all the units that were suggested for each question. The category headings represented the general themes stemming from the units of information. After all units from a particular question were placed into the categories for this question, this list was passed to another assessor, who read the comments to check agreement with the unitisation and categorisation of the statements.
In order to confirm the reliability of the coding of the results, a Cohen’s Kappa analysis was used for inter-rater reliability. In order to do this, two experimenters rated all the data. A high mean level of reliability was identified between their two separate judgements for each question. The figures ranged from a low of 0.92 for Question 2, to a high of 1.00 for questions 1, 4, 5, 6, 7, & 8.
ResultsIn total 430 units were collected for the eight focus groups. Responses for each question have been categorised into themes and these are displayed in Tables 5 to 11.
Question 1: Who decided when your child was ready to be included in a mainstream school?Table 4
Percentage of participants’ responses falling into the different categories for Question 1Themes
Parents %Professionals
%Examples
Parent decided 44 47 “the decision was always ours”Joint decision with school and LEA
11 29“The school, myself, everyone involved [made the decision]”
Depends if they have a statement or not
0 12“if the child has a statement then it would be the decision that was reached following an annual review”
Never thought of anything else/didn’t realise he needed help
22 0“We had never considered anything other than mainstream”.
No other option/forced decision 11 0“It was a forced decision because they [children] would not qualify for anything else, regardless of their need”.
Parents decide against LEA recommendation
7 0
“I decided, even though in the statement it said he should go to a special school, I thought no way, I didn’t want to send him there”.
Depends on child factors (age & school)
4 12
“As it happens, had we taken a different route and sent him to a state primary school, had we chosen not to send him to the independent, the decision may not have been in our hands”.
Table 4 summarises the responses made by participants from both the parent and local authority groups to Question 1. The participants identified seven main themes. When it came
157
to deciding whether to place a child in mainstream the majority of statements from both groups agreed that the parent had the overriding say in this decision. Parents said that they: … wouldn’t want anything else other than mainstream school because I think that it is right for my children and in the case of my children I am their mom and I decide. The local authority workers agreed, and said that: …. the views of the parents are overriding, suggesting that even if the local authority felt that the child wasn’t going to be placed suitably in mainstream, the child still would be placed in mainstream. Parent’s also felt this, saying that: I decided, even though in the statement it said that he should go to a special school, I thought no way, I didn’t want to send him there.
Over a quarter of the local authority workers statements suggested that the decision to place a child in mainstream was a joint decision, in contrast to only a small group of statements made by parents. These parents and local authority workers felt that the decision was jointly made between all those involved, as described by a parent, the school, myself, everyone involved.
The second most common response from the parents was that they didn’t realise that there was a problem and, hence, did not think of anything but mainstream: we never knew he had any problems. We just took him to nursery.
A considerable number of statements from local authority workers suggested that who made this decision depended on whether the child had a statement: if they already have a statement then it goes through annual review and within that everyone participate. However, no parents felt that statementing had an impact. Another group of parents statements suggested that they felt that they had no other choice but mainstream for their child because of lack of alternatives, and felt that although the decision: …was mine but it was a forced decision because they would not qualify for anything else, regardless of their need. Another parent said that: because he is at the able side of the spectrum, we won’t be able to get him into a special school.
Question 2: What factors lead to the decision to place a child in mainstream? Table 5
Percentage of participants’ responses falling into the different categories for Question 2.
ThemeParents %
Professionals%
Examples
Choose the school that meets needs of child
32 24
“his needs were not profound enough to take him into a specialist school so it was a good compromise to get him a place in the unit”
Academic levels 10 12“mainstream is the right place for my children because of their academic levels”
Socialisation 21 12
“I thought it would be good for him to model off other kids which were “normal” and that is the main reason why we sent him to mainstream school”
Lack of alternative provision
37 44
“it is very difficult to find specialist provision. It’s not a choice for many parents. The expectation is mainstream from most of the cases we see.”
Local school 0 4
“it varies in provisions as well because if you want to keep your child local you have to look at the range of provisions there is”
Behaviour 0 4“I just think it’s down to the individual
158

whether they can cope with the situation”
For Question 2, six different themes were identified when parents and local authority workers were asked what factors led to their decision to place their child in mainstream. Both groups agreed that the most important factor leading to place a child in mainstream was a lack of alternative provision for the child. One professional said that: in an authority that talks very much about value for money it is very difficult to find specialist provision. It’s not a choice for many parents. Parents felt that they had no choice but to place their child in mainstream: they would no way get into any kind of special school, because they haven’t got learning difficulties.
Just over a third of the parents’ statements, and a quarter of the local authority workers’ statements, suggested that a child’s needs should be addressed when deciding the best provision. One parent describes her child’s case as: his needs were not profound enough to take him into a specialist school so it was a good compromise to get him a place in the unit . One authority worker said: progress made and behaviour. They need to show that they can work independently. Both parents and local authority workers felt that academic levels were a factor leading to the decision to place a child in mainstream, as one parent said: mainstream is the right place for my children because of their academic levels.
Another important factor for the parents was the socialisation of the child. Parents felt that mainstream placements would: be good for him to model off other children. For the local authority workers, socialisation was also important and they felt that children: need to know what to do when something goes wrong, so it’s part of the social skills. The authority workers also felt that the decision on mainstream could depend on the location of the school and therefore school placement decisions would vary because: if you want to keep your child local you have to look at the range of provisions there is.
Question 3: What factors are most beneficial for inclusion?Table 6
Percentage of participants’ responses falling into the different categories for Question 3
ThemeParents %
Professionals%
Examples
School factors 42 38
“there needs to be an acceptance by the school setting that the child has a right and belongs there and there should be an acceptance as well that that child has particular and individual needs and it’s the responsibility of all the people working there to help meet those as they would any other child”
LEA factors 38 25
“preparing the mainstream class teacher first through training courses which we run as a team every term, and more than that, and preparing them with the sort of strategies that the child will need in school”
Peer factors 13 11
“His friends are translators for him between the autistic world and the mainstream world and the wonderful thing is that it has been a two-way thing, it has enriched their lives as much as his”
Child Factors 7 26 “It’s about the individual needs”
159

The responses to Question 3 show a strong similarity between both parents and local authority workers across the four themes identified. Both groups felt that school factors, such as school commitment and willingness (the school has to want to [include the child]), and good communication between the school and parents, where: sharing information and making sure everybody is working consistently through out the school and at home, were the most pertinent factors in moderating the success of inclusion.
The second most important factor for parents was ‘LEA factors’, such as funding and teacher training. One parent said that it was all about: the people involved and getting them involved at a very early stage whilst another parent felt: you need somebody either with professional experience, really good experience [and] qualified. The local authority workers prioritised child factors over LEA factors, like addressing the child’s needs and social skills. One professional considered that: their level [the child’s] of communication skills that is a key indicator to how they can cope, because if they can’t understand the language in the classroom, then they will just get bombarded and their anxiety level will get high . Local authority workers regarded social skills as important and felt that: some of our pupils are very peer orientated so they are able to moderate their behaviour because they don’t want to be different and so they sort of fit in better.
Parents and authority workers agreed that peer factors, such as peer training and peer relations played a role in promoting the successful inclusion of children with autistic spectrum disorders. One parent said that wonderful friends made it possible for her child to be in mainstream: his friends are translators for him between the autistic world and the mainstream world and the wonderful thing is that it has been a two-way thing. Another parent described peer training as an important tool: if they have been educated about it then his classmates will become a team.
Question 4: What is less beneficial? Table 7
Percentage of participants’ responses falling into the different categories for Question 4
ThemeParent %
Professional%
Examples
School factors 9 7
“If you don’t have a supportive school you
might as well not bother with inclusion because
it’s not going to work.”
LEA factors 70 31
“The problem because we are not getting
funding, that it is extremely difficult for him to
stay in mainstream school because the teacher’s
haven’t got the time or the resources to cater for
his needs.”
Peer factors 3 10 “[child] was subjected to quite a lot of bullying”
Child Factors 12 47“the more aggressive ones are harder to include than the passive ones”
Parental factors 6 5
: “Some parents don’t want your children there.
I have had parents say to me get your *****
child out of our school”.
160
The responses to Question 4 show a number of discrepancies between the two groups. The categories of responses to this question covered five main themes. The majority of statements by the parents indicated that they felt that LEA factors, such as funding, were the most important causes of failure to include a child. One parent said that the problem, because we are not getting funding, that it is extremely difficult for him to stay in mainstream school because the teacher’s haven’t got the time or the resources to cater for his needs.
In contrast, the local authority workers’ statements indicated that they felt that child factors, such as not meeting the child’s needs or individual characteristics of the child such as social skills, language abilities and behaviour were principal to the failure of inclusion. One worker mentioned the importance of knowing a child’s individual needs: in primary a lot of children get through it because they are in a small supportive environment mostly the same teacher all day…they know their needs and they’ve known them from when they were tiny. Another authority worker mentioned language abilities as important as: language could be overwhelming in which case they would be better in a special school . Local authority workers also felt that social skills were fundamental: one of the reasons for children being excluded is not having those adequate social skills, that is the core of it.
Question 5: What could be improved? Table 8
Percentage of participants’ responses falling into the different categories for Question 5
Theme Parent%
Professional%
Examples
Involve school members more when making placement decisions
11 0
“ I think it should be more the people in the school (making the decisions). They should have more of an impact.”
Be more open to alternatives other than mainstream
44 33“They are all obsessed with inclusion needing to work. I want them to be honest.”
More training on ASD
22 17
“I think that teacher’s need more training in ASD. Some of them don’t even know what they ASD is.”
Peer training
11 0
“Government should put it in the curriculum to teach children about different people with different illness’ and needs.”
More resources and support11 17
“[children should] get more one to one time.”
Measure of best placement 0 33
Responses to Question 5 show a number of similarities between the local authority workers and parents. Primarily, when discussing what factors need to be improved in order for inclusion to be more successful, both groups agreed that the most important issue was to be more open to alternatives other than mainstream. One local authority worker described it as: we need to move away from needing to push our kids down the same route. Parents felt the same way, saying: they are all obsessed with inclusion needing to work. I want them to be
161

honest. Parents also felt that there needed to be more training in ASD: I think that teacher’s need more training in ASD, some of them don’t even know what ASD is!.
The next most important factor for the local authority workers was to create a measure of best placement, whereby professionals are: working towards some guidance and a measurement that panels use. The authority workers felt that in the current situation: we are putting them in a position of failing in order to provide an alternative environment. What we need to be doing is making an appropriate judgement immediately.
Question 6: What are the advantages of having a child placed in a mainstream school instead of a special school?The responses to Question 6 show considerable differences in perceptions between the two groups when discussing the benefits of placing a child in a mainstream provision versus an alternative provision. The categories of responses to this question covered five main themes. Parents indicated that the overriding benefit was that mainstream schooling improved the child’s chances of a normal life: in special schools they could get more protected and would feel more vulnerable when they left. For another parent mainstream meant that children: are being forced into social situations that they are going to encounter for the rest of their lives.
Table 9 Percentage of participants’ responses falling into the different categories for Question
6
ThemeParents
%Professionals
%Examples
Improve chances of a normal life
42 14“I would prefer him to stay in mainstream and I think it would help him to have a normal life”
Teaches diversity to other children
0 14
“I think there are benefits for the other children, that they are around children with different needs, and you know, to celebrate diversity”.
Social skills 25 58“ they will kind of pick up normal things and be with normal children”
Down to the individual child/parent
33 0“I think that has to be the individual choice of the parent”
Academic 0 14“He wouldn’t be pushed academically in a special school”
For local authority workers, the most important benefits were social skills: they will kind of pick up normal things and be with normal children. For the authority workers this factor was followed by the importance of teaching diversity to other children: I think there are benefits for other children, that they are around children with different needs, and you know, to celebrate diversity.
Question 7: What types of help have been offered by the professional services and when?Table 10
Percentage of participants’ responses falling into the different categories for Question 7
Theme Parent%
Professional%
Examples
Only with diagnosis 16 0 “If you’re child hasn’t been diagnosed you don’t get access to any
162

information.”
Nothing 60 0“None. I’ve just been having to read up about autism”
Through out 20 50“I can’t fault any of the external help that I got. They gave me all the information I could ask for.”
Had to look for it 4 0 “I had to look it all up in the internet.”
Support in choosing schools
0 50
“You can recommend [schools]. But you’re not supposed to! I tell them what they should be looking at, what school”.
Overwhelmingly, parents said they had received no help or information from the LEA saying that: we get nothing. In addition, only a small group of parents felt that they were given support at diagnosis and none thereafter: I had to look it all up on the internet. Only 1/5 parents felt that they were given support through out diagnosis and the inclusion process, and no parent felt that they were given help in choosing an appropriate school placement for their child.These results are in stark contrast with the opinions of the local authority workers, who felt they had received and given support through out and had received and given support in helping parents choose an adequate school for their child: we offer parent groups; we do have parent groups at the moment, where parents come when their child is first diagnosed as they get so much information, which will then reduce their anxiety.
Question 8: If advice is to be given, when is the best time?Table 11
Percentage of participants’ responses falling into the different categories for Question 8
Theme Parent%
Professional%
Examples
All the time 25 25“The advice needs to be given before, during, all the time really”
At least 2 terms prior to inclusion
0 50
“at least two terms before the child enters the provision. So that someone can come and shadow the child in the nursery and the child can visit the mainstream”
At diagnosis 75 25: “Everything you should get at diagnosis. You should get everything at diagnosis”.
When asked when would be the best time to receive information and help, parents overwhelmingly agreed that it should all be given at the time of diagnosis: you should get everything at diagnosis. It’s staggering that we get nothing. Another group of parents felt that the information should be ongoing: all the time. This pattern of results contrasts with the local authority workers, as half of the workers opinions were that it was important to give advice and information at least two terms prior to inclusion. A quarter felt that the support should be ongoing, and the other quarter felt that the advice should be given: as early as possible. As soon as they know that they’re child has an SEN, this way they know what to look for.
Discussion
163

The present study was an attempt to ascertain the perceptions of parents/caregivers, and local authority workers, concerning the factors that are beneficial to the inclusion of a child with ASD, and to determine what can be improved about the process. Both groups are closely involved with the process, either through teaching and delivering of provision, or by being the carer of an included child. Both groups agreed that when it came to making the decision to place a child in mainstream school, the decision was primarily the parent’s, even in cases where the LEA’s and professional’s disagreed with the parent. This view would be consistent with the code of practice, which states that parents have the ultimate say as long as this is consistent with the best use of resources, and will not interfere with the education of the other children (DfEE, 1994).
A quarter of parents felt that they made the decision to place the child in mainstream because they didn’t realise their child needed help. This could also suggest that children are not getting identified early enough for parents to start making school choices appropriate to their child’s needs. Early diagnosis is regarded as critical, but diagnosis is often delayed until school age due to lack of understanding or access to physicians (Mandell, Novak & Zubritsky, 2005).
Parents felt that they had chosen to place their child in mainstream out of lack of a better option. They believed that their child didn’t have the opportunity to enter an alternative provision, either as they were too able to qualify, or because there was no alternative. Consistent with this view, in Question 2 when discussing what factors that lead to the decision to place a child in mainstream, both groups agreed that parents came to this decision primarily due to a lack of alternative provision. Additionally, parents and local authority workers also reflected this view when discussing what needed to be improved about the current inclusive policy, saying more openness to alternatives to inclusion was essential. In a survey conducted on teachers across the United Kingdom by the Times Educational Supplement (FDS International, 2005), teachers advocated the continued availability of a range of school provisions. Similarly more researchers are calling for responsible inclusion, whereby alternatives to full time inclusion are sought. Warnock (2005) asks for a ‘re-take’ on inclusion, whereby specialist school are not disregarded as inferior education.
Both parents and local authority workers felt that finding a placement that met the child’s needs was important. In order to do this, authority workers felt that there needed to be a measure of best placement to avoid placing children in mainstream ‘to fail’. Children with autism have IQ’s that vary from severe learning disability, to superior intellectual functioning. Their behavioural difficulties also vary tremendously, as do their social and cognitive functioning (Burack & Volkmar, 1992). With such diversity, the insistence for inclusion for all persons with autism seems short-sighted and simplistic (see Mesibov, 1990). In its place there needs to be more emphasis on individual educational needs that can promote development in all domains of functioning (Burrack, Root, & Zigler, 1994; Mesibov, 1990; Zigler & Hodapp, 1987).
When discussing factors that promote the successful inclusion of children with ASD, both groups felt that school factors, such as school commitment, and having the right people involved, were the most significant promoters of successful inclusion. This is consistent with Burrack, Root and Zigler’s (1997) research that examined the attitudes of teachers. They found that teachers play a crucial role in the success of integration programmes, and that, in addition to teacher training, teacher and school commitment were critical to success. Kasari et al. (1999), in line with the current study, found that parents of children with autism were more likely to view specialised teaching and staff as important to their child’s education. Jindal-Snape, Douglas, Topping, Kerr and Smith (2005) also found that professionals and parents felt that staff attitude played a very important role in creating an inclusive environment.
164
The second most important factor benefiting inclusion for both parents and professionals were LEA factors, such as teacher training and funding. This is also consistent with Burrack et al. (1997). They found that, without support and training, only 33% of teachers were willing participants of inclusive practice. A survey run by the Times Educational Supplement (FDS International, 2005) found that training had an impact upon attitudes towards inclusion, and those with no training in SEN showed the least positive attitude scores. Likewise, Avramidis, Bayliss and Burden (2000) found that teachers with substantial training were more positive to inclusion and also felt more confident meeting IEP (Individual Education Plans) requirements as a result of their training. In accordance with the current study, Avramidis et al. (2000) also report that funding was a mediating factor to inclusion, and found that teachers wanted more non-contact time. Similarly, Diebold and Von Eschenbach (1991) noted that teachers reported that they did not have sufficient time for inclusion. In line with the current study, Jindal-Snape et al. (2005) found that parents felt that teachers should have more autism specific training to help support their children in mainstream schools, and Barnard, Prior and Potter (2000) from a national survey reported that the most desired changes expressed by parents of children with autism was more training about autism for teachers.
Professionals also focused on child factors such as behaviour, social skills and academic abilities as beneficial for inclusion whilst parents didn’t. This result is consistent with Fredrickson et al. (2004) who also found that professionals rated behaviour such as being able to follow instructions, obeying classroom rules and social progress as paramount in defining successful inclusion. Also consistent with the current study, professionals in Fredrickson et al.’s (2004) study rated learning and academic progress as an important factor in determining whether inclusion was successful. These concerns suggest that skills related to behaviour, social skills and academic abilities should be taught in order to help the child’s success in a mainstream placement. In contrast, when it came to factors that were less helpful, although the parents still felt that LEA factors such as funding and resources were the principal factors in undermining successful inclusion of a child, local authority workers felt that child factors such as behavioural problems or lack of social skills were more critical. This finding is concordant with the literature which argues that successful placement in a typical classroom may be dependent upon the display of appropriate behaviour (Downing, Morrison & Berecin-Rascon, 1996), and a lack of social skills may impede the integration of children with autism as well as reduce their interaction with the peer group (Beckman 1983; Guralnick 1990; Sherratt 2002; Strain & Danko, 1995).
Parents and local authority workers were also asked about the information/help they received from LEA. An alarming majority of parents said that they had received no information or help from the LEA. This finding is in accordance with Osborne and Reed (in press) concerning lack of information at diagnosis. In contrast with the parents, an equal proportion of local authority workers felt that they had given help through out and that they had helped parents choose an appropriate school. Whether the parent’s feelings are a true reflection of what they got, parents clearly perceive it as so, suggesting that work needs to be done addressing these concerns.
In accordance with the literature, parents and local authority workers called for a more responsible inclusive movement (Vaughn & Schumm, 1995) by recognising the alternatives to mainstream. This is in concurrence with many researchers concerned that the movement towards inclusion of children with ASD has been driven by ideological approaches (Bailey, 1998).
Although these results shed some light a number of different elements relevant to successful inclusion, there are a number of limitations to this study. The sample size and representativeness of the sample needs to be considered. Although only three boroughs were involved in the study, it should be noted that there was reasonable consistency between the perceptions of each parent and professionals group. Furthermore, all participants were
165

volunteers, and so their representativeness of all parents and professionals in general may be an issue that limits the generalisation of the conclusions that can be drawn from the data. However, it is also important to note that all participants were randomly selected. As with any analysis of focus group data, these perceptions should be considered as a measure of the strength of a feeling about the specific issues that were discussed and should not be regarded as an indication of their frequency in the general population.
This is the first focus group to look at the view of parents and local authority workers on what promotes successful inclusion of children with ASD. Parents clearly are the ones making the decision to place a child in mainstream, primarily due to a lack of alternative provision. Both parents and professionals agreed that this needed to change and that in addition to becoming more open to alternatives, a measure of best placement should be introduced in order to place children in provisions that will meet their individual needs. Consistent with earlier literature (see Burrack et al. 1997) both parents and teachers felt that the attitudes of teachers and overall school commitment were the most significant promoters of successful inclusion. Moreover both groups agreed that LEA funding, in addition to teacher training was essential to success. Professionals felt that child factors such as behaviour and social skills could undermine a successful inclusive placement, whilst parents felt that funding and resources were most important. Finally, parents felt that they hadn’t been given sufficient support or information by LEA about the process of inclusion.
ReferencesAinscow, M. (1999). Understanding the Development of Inclusive Schools. London:Falmer Press. Avramidis, E., Bayliss, P., & Burden, R. (2000). A survey into mainstream teachers’attitude towards the inclusion of children with special educational needs in theordinary school in one Local Education Authority. Educational Psychology, 20,191-211.Bailey, J. (1998). Australia: Inclusion through categorisation. In: T. Booth & M.Ainscow (Eds), From them to us: An International Study of Inclusion in Education. London: Routledge.Barnard, J., Prior, A. & Potter, D. (2000). Inclusion and autism: is it working? London: The National Autistic Society.Beckman, P. (1983). The relationship between behavioural characteristics of children and social interaction in an integrated setting. Journal of the Division for EarlyChildhood, 7, 69 – 77.Burack, J., Root, R., & Zigler, E. (1997). Inclusive Education for Students with Autism:Reviewing Ideological, Empirical and Community Considerations, in D. Cohen & F. Volkmar (eds), Handbook of Autism and Developmental Disorders. Chichester: Wiley.Burack, J.A, & Volkmar, F.R. (1992). Development of low and high functioning autistic children. Journal of Child Psychology and Psychiatry, 33, 607 – 616. Clough, P. & Corbett, J. (2000). Theories of Inclusive Education. London: Paul Chapman.Department for Education and Employment (DfEE). (1994). The Code of Practice for the Identification and Assessment of Children with Special Educational Needs.London: HMSO.Department for Education and Employment (DfEE). (1997). Excellence for all children:Meeting special educational needs. London: DfEE Publications.Department for Education and Employment (DfEE). (1998). Meeting Special Educational Needs: A Programme for Action. London: HMSO.Diebold, M.H. & Von Eschenbach, J.F. (1991). Teacher educator predictions of regular class teacher perceptions of mainstreaming. Teacher Education and Special Education, 14, 221 – 227. Downing, J.E., Morrison, A.P., & Berecin-Rascon, M. A., (1996). Including Elementary School Students with Autism and Intellectual Impairments in Their Typical Classrooms: Process and Outcomes. Developmental Disabilities Bulletin, 24, 21 – 41.Evans, J. & Lunt, I. (2002). Inclusive Education: Are there limits? European Journal of Special Needs Eudcation. 17, 1 – 14.
166

Fredrickson, N., & Cline, T., (2002). Special Educational Needs, Inclusion and Diversity. A textbook. Open University Press, Buckingham.Fredrickson, N., Osborne, L. A., & Reed P. (2004). Judgements of Successful Inclusion by Education Service Personnel. Educational Psychology, 24, 263- 290.Fredrickson, N. & Turner, J. (2003). Utilizing the classroom peer group to address children’s social needs: an evaluation of the circle of friends intervention approach. The Journal of Special Education, 36, 234 – 245.Gallagher, D.J. (2001). Neutrality as a moral standpoint, conceptual confusion and the full inclusion debate. Disability and Society, 16, 637-654.Guralnick, M. J. (1990). Major accomplishments and future directions in early childhood mainstreaming. Topics in Early Childhood Special Education, 10, 1 –17. Jindal-Snape, D. Douglas, W. Topping, K.J. Kerr, C. & Smith, E.F. (2005). Effective Education for Children with Autistic Spectrum Disorder: Perceptions of Parents and Professionals. The International Journal of Special Education, 20 (1), pp. 77 – 87.Kasari, C., Freeman, S. F. N., Baumonger, N. & Alkin, M.C. (1999). Parental perspectives on Inclusion: Effects of Autism and Down Syndrome. Journal of Autism and Developmental Disorders, 29, (4). Lipsky, D.K. & Gartner, A. (1998). Factors for successful inclusion: learning from the past, looking forward to the future. In S. V. Vitello & D.E. Mithaug (Eds.), Inclusive schooling: national and international perspectives. Mahurah, NJ: Lawrence Erlbaum Associates.Mandell, D. S., Novak, M.M., & Zubritsky, C. D. (2005). Factors associated with age of diagnosis among children with autism spectrum disorders. Pediatrics, 116, 1480-1486. Mesibov, G.B. (1990). Normalization and its relevance today. Journal of Autism and Developmental Disorders, 20, 379 – 390.Norwich, B. (2000). Inclusion in education: from concepts, values and critique to practice. In: Daniels, H (Ed.), Special Education Reformed: Beyond Rhetoric? London: Falmer Press. O’Brien (2001). Enabling Inclusion: Blue Skies….Dark Clouds? London: The Stationary Office.Parsons, C. (2000). The third way to educational and social exclusion. In, G. Walraven, C. Parsons, D. Van Veen, and C. Day (Eds.), Combating Social Exclusion through Education. Sherratt, D. (2002). Developing pretend play in children with autism: a case study. Autism, 6, 169 – 179.Simpson, R.L., & Myles. B.S. (1990). The General Education Collaboration Model: A model for successful mainstreaming. Focus on Exceptional Children, 23, 1-10.Strain, P. S. & Danko, C.D. (1995). Caregivers’ encouragement of positive interaction between preschoolers with autism and their siblings. Journal of Emotional and Behavioural Disorders, 3, 2 – 12.The Warnock Report (1978). Department of Education and Science Special Educational Needs: Report of the committee of Enquiry into the Education of Handicapped Children and Young People. (London, HMSO).Thomas, G. (1997). Inclusive schools for an inclusive society’. British Journal of Special Education, 24, 103-107.United Nations Educational, Scientific and Cultural Organisation (UNESCO). (1994). The Salamanca Statement and framework for Action on Special Needs Education.Paris: UNESCO.Vaughn, S., & Schumm, J.S. (1995). Responsible Inclusion for students with learning disabilities. Journal of Learning Disabilities, 28, 264 – 270.Vaughn, S., Schumm, J.S., Jallad, B., Slusher, J., & Saumell, L. (1996). Teachers’ views of inclusion. Learning Disabilities Research and Practice, 11, 96-106.Warnock, M. (2005). Special educational needs: a new look. Impact, 11, Philosophy of Education Society of Great Britain.Zigler, E., & Hodapp, R.M. (1987). The developmental implications of integration autistic children within the public schools. In D.J. Cohen & A.M. Donnellan (Eds.), Handbook of autism and pervasive developmental disorders,(pp. 668 – 674). New York: John Wiley & Sons.
167
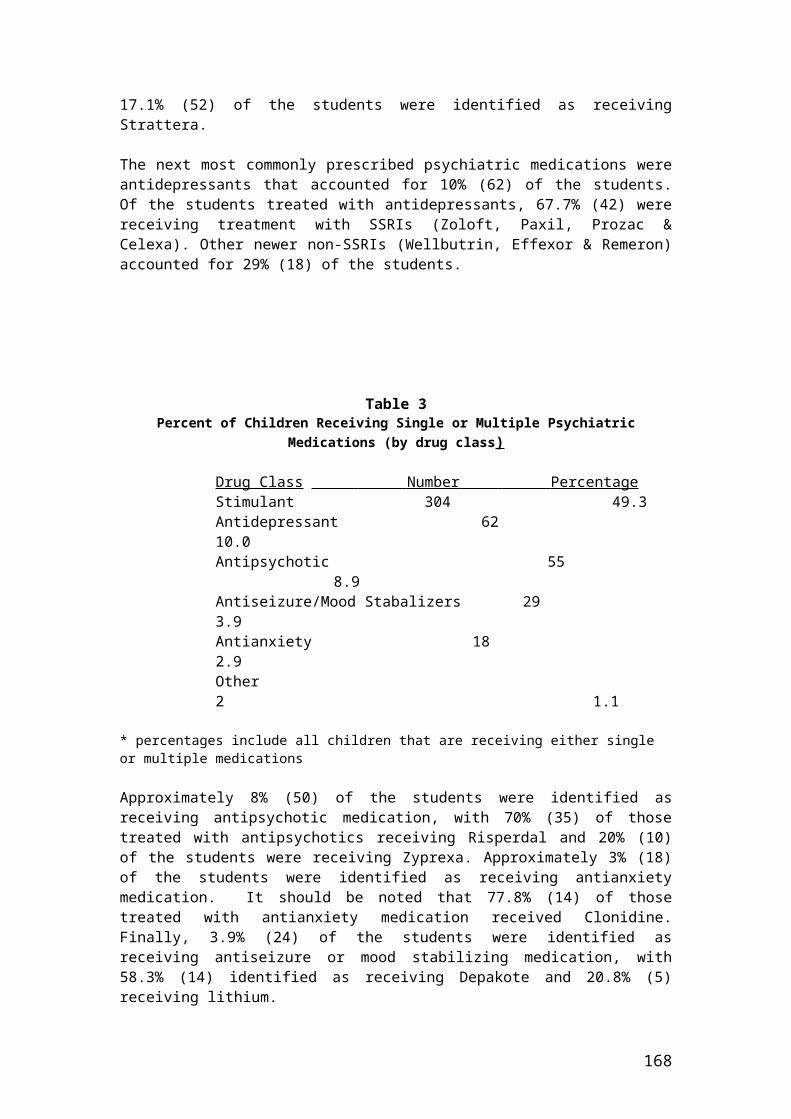
EFFECTIVE INTERVENTIONS FOR INDIVIDUALS WITHHIGH-FUNCTIONAL AUTISM
Ann X. HuangJohn J. Wheeler
Tennessee Technological University
The diagnosis of high functioning autism (HFA) is not the end of comprehensive assessments. Since the 1970s, although a great deal of research has focused on developing effective educational approaches and interventions for children with autism, there is an increasing need to develop differentially effective educational approaches or interventions that are specifically for children with HFA. This paper reviews several effective, evidence based interventions that are widely used by special educators and professionals as best practices in the United States, including structured teaching approaches, peer-medicated interventions, self-monitoring or self-management strategies, video modeling, and social stories, with a hope that people in other places of the world can also find these interventions beneficial in teaching children with HFA.
A lack of learning in any particular situation should first be interpreted as a result of the inappropriate or insufficient use of teaching strategy rather than an inability on the part of the learner (Gold, 1980, p. 15)Autism is a complex, behavior-defined developmental disorder. The diagnosis of high functioning autism (HFA) is not the end of comprehensive assessments. Having more up-to-date knowledge of this population including their characteristics, strengths, needs and interests is more important than simply a diagnosis (Kunce & Mesibov, 1998). Only with a better understanding of these individuals can researchers design more effective interventions to better serve their needs. This process requires on-going joint efforts of researchers from multiple disciplines.
Since the 1970s, researchers have made great effort to develop individualized educational programs and interventions, many of which have demonstrated their effectiveness in improving the social communication abilities and daily functioning skills of the autistic
168
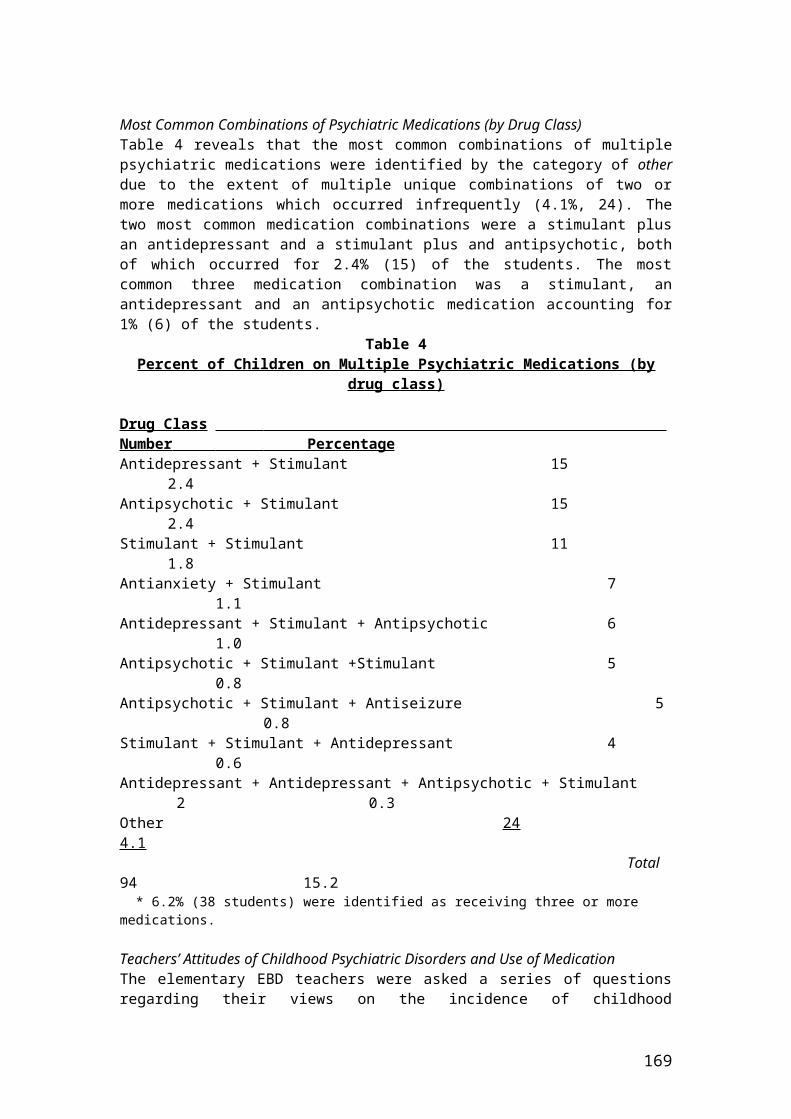
population. However, as it is evident in the available literature, most available publications are focused on children with moderate to severe autism, individuals with HFA are relatively underserved. There is an increasing need to develop differentially effective educational approaches or interventions that are specifically for children with HFA. Fortunately, research in this field in the past decade is on the rise. The following section will introduce several evidence-based, effective interventions that are widely used by special educators and professionals as best practices in the United States, including structured teaching approaches, peer-medicated interventions, self-monitoring or self-management strategies, video modeling, and social stories.
Structured Teaching ApproachesStructured teaching approaches were originally developed by researchers from the TEACCH (Treatment and Education of Autistic & related Communication handicapped Children) program at the University of North Carolina, Chapel Hill. They are regarded as the most effective individualized teaching approaches implemented in classroom settings for students with autism and include such components as routines, schedules, adapted instructional strategies, and modification of learning environments (Kunce & Mesibov, 1998). Structure teaching approaches are effective because they make the classroom environments meaningful to the target children and make necessary environmental modification to better cater for their special needs (Kunce & Mesibov, 1998).
Routines & SchedulesIndividuals with HFA are basically visual learners. Unlike ordinary people, they tend to think in pictures and might not be able to follow verbal instruction, which actually work for most typical students. Even with relatively unimpaired language ability (compared to other children with moderate to severe functioning level autism), students with HFA might still fail to adapt well in unmodified classroom environment because of pragmatic social communication difficulties as well as more general social impairments (Kunce & Mesibov, 1998, p. 231). Students with autism tend to insist on sameness and also find lack of predictability stressing.
The use of routines and schedules can help students with HFA better adapt to classroom environment by establishing consistency and predictability (Kunce & Mesibov, 1998). Researchers in the TEACCH programs found the development of systematic routines lessen the feeling of anxious, decrease behavior problems and promote learning in students with HFA (Mesibov, Scholper, & Hearsey, 1994). Accordingly, the use of individualized schedules can help students with HFA stay on track, understand, accept and follow the sequence of daily events (Kunce & Mesibov, 1998, p. 234) and adapt more flexibly and smoothly to the inevitably changes in the daily routine (p. 236), as well as decrease transitional difficulty.
Adapted Instructional StrategiesIn addition to routines and schedules, adapted instructional strategies can help children with HFA better involve in classroom learning. Due to their unique characteristics, students with HFA cannot benefit from traditional teaching methods. Kunce and Mesibov (1998) suggested, to help students with HFA better understand instruction and requirements, teachers can apply the following adapted instructional strategies:
(1) Adjusting instructional language. Despite their relative strengths in vocabulary, reading ability and speaking skills, researchers found children with HFA actually have difficulty understanding complex sentences because of the pragmatic impairments (Minshew, Goldstein, & Siegel, 1995). Researchers suggested the use of simple languages and short sentences with slower speed can help clarify instruction and expectation to students with HFA (Kunce & Mesibov, 1998).
(2) Using written information. Basically, students with HFA are visual learners, so they cannot benefit from traditional verbal instruction. Based on their relative strengths in visual spatial processing, the use of written information may be one of the most effective ways to teach this population (Kunce & Mesibov, 1998). Visual aids, including written task directions,
169

written cues, maps, pictures, handouts and checklists, provide the target students with a lasting, visual reminder and are more effective than instructional languages and other presentation styles (Kunce & Mesibov, 1998, p. 239)
(3) Taking advantage of the target student’s special interests. Students with HFA usually have strong interests in some special objects or topics. Some researchers emphasized it is important to utilize their special interests to develop academic and career skills, rather than stamping them out (Siegel, Goldstein, & Minshew, 1996, p. 244). In addition, these special interests can be also used to reinforce less preferred activities as well as to make the school environment more appealing(Kunce & Mesibov, 1998, p. 245)
Modification of Learning EnvironmentsBesides the adapted instructional strategies, environmental modification is also essential (Kunce & Mesibov, 1998). Typically, students with HFA learn better in a structured environment. Researchers suggested when possible, arrange the learning materials and furniture in ways that accommodate the students’ learning styles best and reduce potential distractions (Kunce & Mesibov, 1998). For example, offering preferential seating and providing an independent work area for students with autism are encouraged (Kunce & Mesibov, 1998). Another way to modify learning environments is to use organizational work system. For example, the use of containers with written labels is a simple but most effective way to organize tasks for students with HFA (Dalrymple, 1995; Kunce & Mesibov, 1998). Other organizational supports such as organizational notebooks and written task directions are also very helpful in promoting independence in students with HFA.
Peer-mediated InterventionThe effects of peer-medicated interventions (PMI) have been well established in the literature and regarded as one of the most promising approaches to educating individuals with autism (Goldstein, Wickstrom, Hoyson, Jamieson, & Odom, 1988; Ostrosky, Kaiser, & Odom, 1993; Robertson, Green, Alper, Schloss, & Kohler, 2003). Peer-medicated interventions (also refers to as peer tutoring) can be divided in three levels: class wide, small group and one-to-one. Matching a child with disabilities with typically developing peer partner(s) has the following advantages:
(1) providing a reciprocal and more learner-friendly environment (Perske, 1988); (2) presenting more opportunities to receive positive and corrective feedback,
individualized help and encouragement (Maheady, Harper, & Mallette, 2001, p. 7); (3) students prefer peer-teaching practices to traditional student-teacher instruction
(Maheady, Harper, & Mallette, 2001); (4) Typical peer is able to make adaptations when interacting with peers at lower
developmental levels, which increases the likelihood of successful interactions(Ostrosky et al., 1993, p. 160);
(5) facilitating generalization of the learned skills across settings and people (Ostrosky et al., 1993, p. 164);
(6) typical peers may also benefit academically and/or socially from such peer interaction (Kamps et al., 1998).
Over the past two decades, many researchers devoted tirelessly to the exploration of more effective PMI for individuals with autism and a great volume of such studies can be found in the literature. They demonstrated the effectiveness of various PMI in facilitating both academic growth and positive social interaction between individuals with autism and their normal peers. For example, Kamps et al. (1994) examined the effects of class-wide peer tutoring on three children with HFA in an inclusive general education classroom and results revealed class-wide peer tutoring improved both the students’ reading skills and social interaction. Another study by Goldstein et al. (1992) examined the effects of small group peer tutoring on social interaction between children with autism and their typical peers and results showed that 4 out of 5 target children demonstrated higher rates of social interaction. McGee et al. (1992) evaluated the effectiveness of another PMI (i.e., one to one peer incidental
170
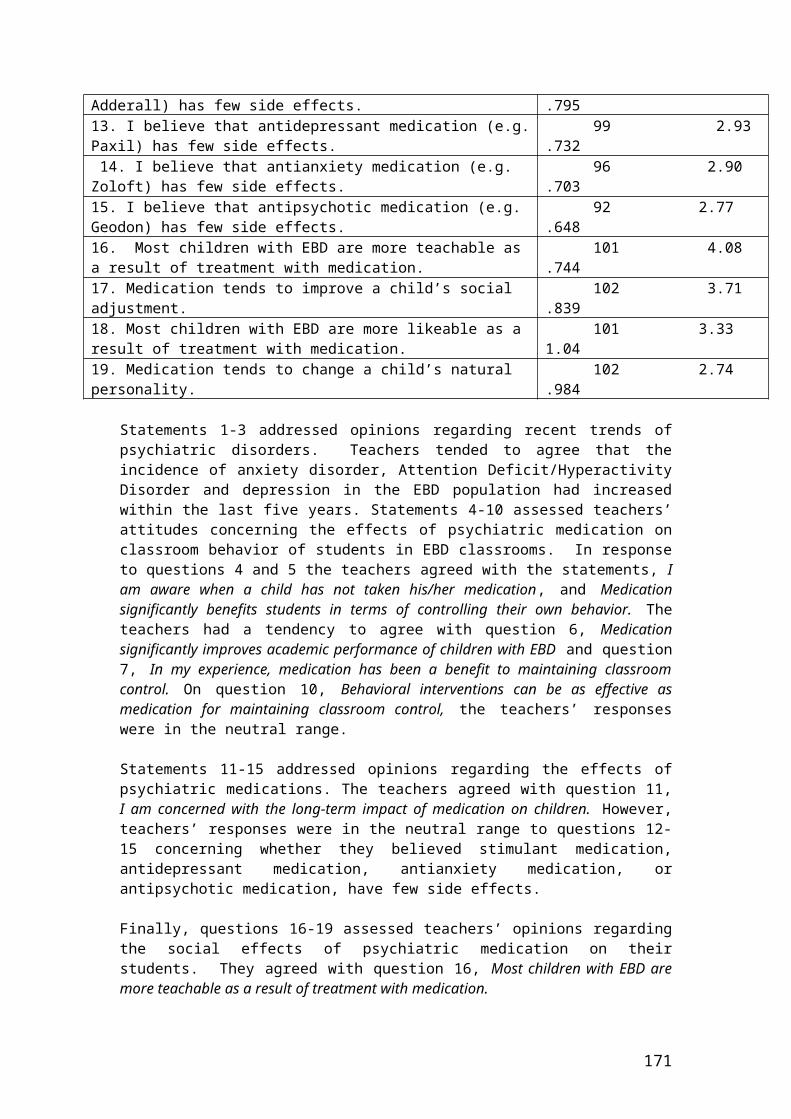
teaching) and found its effectiveness in promoting positive reciprocal interactions among children with autism and their typical peers.
Morrison, Kamps, Garcia and Parker (2001) used a multiple baseline design to determine the effects of an intervention package that combined peer mediation with monitoring strategies and found that the package increased the target children’s rates of initiations and social interaction time with typical peers. Little difference between self-monitoring and peer-monitoring strategies was found. Similarly, Thiemann and Goldstein (2004) examined the effects of another intervention package consisted of peer training and written text cueing on five elementary school students with autism and results also revealed improved child-peer interactions and social communication, as well as higher acceptance and friendship rating for children with autism.
When developing peer-mediated intervention, Ostrosky et al. (1993) suggested the best role for typical peers to play is to be facilitator rather than primary interventionist (p. 170). That is to say, peer-mediated interventions should support the child’s acquisition of social-communicative strategies by providing appropriate behavioral models, providing opportunities for successful communication, and facilitating generalization across environments and individuals (Ostrosky et al., 1993, p. 170). They proposed the following criteria for selecting typical peers:
(1) they demonstrate age-appropriate language and social skills; (2) they are familiar with the target participants, and interact positively with the target
participants in the natural settings; (3) they would like to follow adult direction and are willing to help the disabled peers (Ostrosky et al., 1993). In addition, they also proposed the following seven principles to guide the development of an effective intervention (Ostrosky et al., 1993):
1. Promote peer interaction and facilitate communication between children with and without special needs.2. Teach ALL children social-communicative strategies to maximize the effects of an intervention.3. As initial participants, choose children who are likely to be successful.4. Provide individualized instruction to children with special needs, focusing on initiation and response strategies.5. Provide instruction to nondisabled children in conversational strategies known to elicit verbal and nonverbal behaviors from children with special needs.6. A direct instruction approach should be used to teach desired social-communicative behavior to all children.7. Maintenance and generalization must be programmed for (p. 170).
Effective peer-mediated intervention should be able to maintain the target child’s join attention (Ostrosky et al., 1993). To maximize treatment efficacy of PMI, the target child’s preference, existing repertoires and strengths should be taken into consideration (Ostrosky et al., 1993). Environmental management is another important component of such intervention programs. Most individuals with autism learn better in distraction-free environments but have difficulty generalizing the acquired skills to more natural settings. To maximize generalization, Ostrosky et al. (1993) suggested multiple exemplars should be trained to facilitate generalization to untrained stimulus conditions and to untrained responses (p. 179). They also believed, consistently providing children with structured and unstructured opportunities to interact with peers will facilitate generalization as children learn that there are expectations for positive social-communicative interaction between age-mates (Ostrosky et al., 1993, p. 179).
Self Monitoring/Management StrategiesAccording to Field, Martin, Miller, Ward, & Wehmeyer (1998):
171

Self-determination is a combination of skills, knowledge, and beliefs that enable a person to engage in goal-directed, self-regulated, autonomous behavior. An understanding of one's strengths and limitations together with a belief in oneself as capable and effective are essential to self-determination. When acting on the basis of these skills and attitudes, individuals have greater ability to rake control of their lives and assume the role of successful adults (p. 2).
As one way of self determination, self monitoring, which also refers to as self management, includes such strategies as self assessment, self regulation, self recording and self reinforcement (Koegel & Frea, 1993). Koegel, Koegel, and McNerney (2001) believed self monitoring is a great technique with tremendous influence on the development of interventions for individuals with ASD. Its advantages include:
(1) less intrusive: this technique requires the student to manage his/her own behaviors, rather than being controlled and managed by other people;
(2) resource-saving: it demands less time and involves fewer resources such as professionals or educators, training and other instructional materials;
(3) user-friendly: its procedures are simple and easy to master (Ganz & Sigafoos, 2005).During the past two decades, self monitoring has been widely used as an effective intervention for children and adults with various disabilities. According to the literature, self management strategies can be applied to decrease undesirable, problematic behaviors in children and adults with mental retardation (Gardner, Clees, & Cole, 1983; Reese, Sherman, & Sheldon, 1984; Shapiro, McGonigle, & Ollendick, 1980), and to improve desirable behavior, social skills and play skills in children with autism (Koegel, Koegel, Hurly, & Frea, 1992; Stahmer & Schreibman, 1992), as well as to decrease inappropriate, stereotypic behavior in these individuals (Koegel & Frea, 1993; Koegel & Koegel, 1990).
Recently, Mancina, Tankersley, Kamps, Kravits, and Parrett (2000) reported they used a self-management treatment program and successfully reduced inappropriate vocalizations in a child with autism. In addition, Ganz and Sigafoos (2005) conducted a study to evaluate the effectiveness of a self-monitoring procedure in two young adults with autism and severe mental retardation in a vocational training program. Results showed that the use of self monitoring procedure increases the independent task completion and verbal requesting in these two individuals. Furthermore, other researchers (Agran, Sinclair, Alper, Cavin, Wehmeyer, & Hughes, 2005) also demonstrated that the application of self-monitoring strategy increase following-direction skills in 6 students with moderate to severe disabilities (including autism) in general education settings.
Since individuals with HFA have relative unimpaired intelligence and language, they are the best population to implement self-monitoring strategies and can achieve best outcomes. Researchers (i.e., Koegel, Koegel, & Carter, 1999) suggested if individuals with autism are taught and master the self-management technique, they might be able to generalize the skills to various settings and behaviors. Thus, the ultimate goal of self-monitoring strategies is to promote greater independence among individuals with HFA.
Video ModelingResearch has found that the use of video modeling (including self modeling and peer modeling) can have a great positive impact in the areas of social communication, daily functioning skills, and academic performance on children with various disabilities (e.g., Apple, Billingsley, & Schwartz, 2005; Charlop-Christy & Daneshvar, 2003; Goldstein & Thiemann, 2000; Simpson, Langone, & Ayres, 2004). Video modeling is effective because: (1) it focuses on the target children’s visual strengthen (Pierce & Schreilbman, 1994); (2) children with autism prefer to learn from video modeling to live, real world (or in-vivo) peer modeling (Charlop-Christy, Le, & Freeman, 2000). Over years, video modeling has been widely accepted as the best practice in the literature and can be used in many different ways (Sturmey, 2003).
172

Video modeling can be used to teach social skills to children with autism. For example, Simpson, Langone, and Ayres (2004) used peer video modeling to teach three social skills to four children with autism and results showed that all students gained evident improvement in the targeted social skills in natural environments. Another study by Kimball et al. (2004) demonstrated the effectiveness of video modeling in teaching autistic children activity schedules. Furthermore, other researchers (e.g., Schreibman, Whalen, & Stahmer, 2000) used a technique named video priming and successfully decreased the disruptive behaviors during transition periods for children with autism.
In addition, video modeling can be also used to teach new daily functioning skills to individuals with autism. For example, Alacantara (1994) used adult modeling (through task analysis) to teach grocery shopping skills to three students with autism and results showed they all acquired the target skills and also generalized the skills across settings. Another study by Shipley-Benamou et al. (2002) used video modeling to teach several functional living tasks to three children with autism and found that video modeling significantly facilitate the acquisition and independent performance of the target living skills. Furthermore, video modeling can be also used to improve other behavior or skills in individuals with autism. One such example is to use video modeling to teach perspective taking successfully to children with autism (Charlop-Christy & Daneshvar, 2003). Recent studies also suggested video modeling can be an effective strategy when implemented as part of an intervention package because it can maximize the intervention efficacy and generalization. For example, Apple, Billingsley, and Schwartz (2005) conducted a study of two experiments to examine the effects of video modeling alone and with self-management on compliment-giving behaviors of children with HFA. Results indicated application of both video modeling and self-management strategies produce and maintain social initiations when video modeling alone fails. Other researchers (i.e., LeBlanc et al., 2003) used another intervention package including video modeling and reinforcement to teach perspective taking skills to 3 children with autism and demonstrated positive outcomes. In addition, 2 out of 3 students can generalize their learned skills to an untrained task.
Social StoriesAccording to Baron-Cohen et al. (1985), theory of mind deficits is evident in children with HFA. They have difficulty understanding others’ thoughts, mental states, desires and intentions. These deficits are believed to be responsible for the poor social communication skills in children with HFA (Baron-Cohen, 2000). Traditional educational approaches fail to insure a meaningful improvement in their social performance. Research indicated the use of social stories is a more effective intervention (Sansosti, Powell-Smith, & Kincaid, 2004). A social story is a short story that is written from the student’s perspective and can be used to help the target student better understand complex and confusing social situations (Gray & Garand, 1993; Gray, 1997). According to Attwood (2000), social stories provide information on what people in a given situation are doing, thinking or feeling, the sequence of events, the identification of significant social cues and their meaning, and the scripts of what to do or say; in other words, the what, when, who and why aspects of social situations (p. 90).
Previous research has demonstrated the effectiveness of social stories in teaching children with autism (e.g., Hagiwara & Myles, 1999; Noris & Dattilo, 1999). Social stories can be used to educate individuals with autism across various behavior and settings. Firstly, social stories have been proven effective in decreasing undesirable behaviors. For example, Kuttler et al. (1998) used this method and successfully decreased tantrum behavior in an adolescent in residential settings. Lorimer et al. (2002)’s study showed that social stories implemented by family members are effective in decreasing the precursors to tantrum behavior in a young child in home settings. Similarly, a study by Brownell (2002) used musical social stories to improve social behaviors in 4 primary students successfully in an inclusive classroom.
173
Recently, Scattone et al. (2002) used a multiple baseline across participants design to assess the effectiveness of social stories in decreasing disruptive behaviors of 3 children with autism and results revealed positive effects for all participants.
Social stories can also increase appropriate or more socially acceptable behaviors in individuals with autism (Crozier & Sileo, 2005). Feinberg (2001)’s study demonstrated the effectiveness of social stories in increasing more socially acceptable behaviors such as initiating social activity and increasing flexibility among autistic children during social activities. A study by Romano (2002) also indicated social stories are effective in teaching appropriate greeting behavior to individuals with autism. In addition, previous research indicated the most effective and positive intervention outcomes are obtainable only when social stories are used as one of the components of an intervention package, rather than being used alone. Thiemann and Goldstein (2001) used a multiple baseline design to measure the effects of an intervention package that combined social stories and video feedback on the social communication skills in five children with autism. Results showed that all participants gained increase in their social communication skills, which are consistent with previous findings. Generally social stories are written in six basic types of sentences: descriptive, directive, perspective, affirmative, control and cooperative (Gray, 1998, 2000). Gray (1998, 2000) pointed out that these 6 types of sentences should be used at a balanced ratio: usually match 2 to 5 descriptive, perspective (or cooperative), and/or affirmative sentences with 1 directive (or control) sentence in a social story (Gray, 1998, 2000). In addition, Swaggart et al. (1995) proposed the following 10 steps necessary for creating a social story:
1. Identify a target behavior pr problem situation for social-story intervention. 2. Define target behavior for data collection.3. Collect baseline data on the target social behavior.4. Write a short social story using descriptive, directive, perspective and control sentences. 5. Place one to three sentences on each page.6. Use photographs, hand-drawn pictures, or pictorial icons. 7. Read the social story to the student and model the desired behavior.8. Collect intervention data.9. Review the findings and related social-story procedures.10.Program for maintenance and generalization (p. 14-15).
Besides the above steps, educators or professionals should also take the following related issues into consideration when developing social stories for children with autism: (1) make sure the social stories being written are within the target student’s comprehension ability (Crozier & Sileo, 2005; Gray, 1998); (2) incorporate the student’s preferences and interests into the writing of social stories (Gray, 1998); use pictures to help the target student understand the social story when appropriate and necessary (Crozier & Sileo, 2005); (3) introduce a social story to the target student in a relaxed, distraction-free environment (Gray, 1998); (4) make ongoing revision to social stories in accordance with the target student’s progress (Gray, 1998). Most social stories are developed or written by professionals or parents. Research proposed the following two key ways to implement social stories: (1) read by the target child independently, or by his/her caregiver; (2) presented through another medium, such as audio equipment, computer-based program, or via videotape (Charlop & Milstein, 1989; Sansosti et al., 2004).
ConclusionIt is evident that the interventions introduced in the previous section have been proven effective in teaching children with HFA in the United States for years. We believe children with autism in other places of the world can also find them beneficial. However, it is noted every child is unique and has his/her own strengths and needs. One child may find one of the above interventions especially beneficial while another child may experience no positive
174
behavioral change at all by using the same intervention. So it is impossible that one intervention can fit all children, nor can all children gain the same degree benefit from these interventions, either. Thus, meaningful intervention outcomes are obtainable only when interventions are built on the student’s strengths and interests. The ultimate goal of different interventions is the same: to enhance quality of life for children with autism. Like all typically developing children, children with autism also desire and deserve better education and higher quality of life. All interventions introduced previously have their limitations, and more explorations need to be done in the future to better serve children with HFA.
ReferencesAgran, M., Sinclair, T., Alper, S., Cavin, M., Wehmeyer, M., & Hughes, C. (2005). Using self-monitoring to increase following-direction skills of students with moderate to severe disabilities in general education. Education and Training in Developmental Disabilities, 40, 3-13. Alcantara, P.R. (1994). Effects of videotape instructional package on the purchasing skills of children with autism. Exceptional Children, 61, 40-55.Apple, A.L., Billingsley, F., & Schwartz, I.S. (2005). Effects of video modeling alone and with self-management on compliment-giving behaviors of children with high-functioning ASD. Journal of Positive Behavior Interventions, 7(1), 33-46. Attwood, T. (2000). Strategies for improving the social integration of children with Asperger syndrome. Autism, 4(1), 85-100.Baron-Cohen, S., Leslie, A.M., & Frith, U. (1985). Does the autistic child have a “theory of mind”? Cognition, 21, 37-46. Baron-Cohen, S. (2000). Theory of mind and autism: A fifteen-year review. In S. Baron-Cohen, H. Tager-Flusberg, & D. Cohen (Eds.), Understanding other minds: Perspectives from developmental cognitive neuroscience (pp. 3-20). New York: Oxford University Press.Brownell, M.D. (2002). Musically adapted social stories to modify behaviors in students with autism: Four case studies. Journal of Musical Therapy, 39, 117-144.Charlop-Christy, M.H., & Daneshvar, S. (2003). Using video modeling to teach perspective taking to children with autism. Journal of Positive Behavior Interventions, 5(1), 12-21.Charlop-Christy, M.H., Le, L., & Freeman, K.A. (2000). A comparison of video modeling with in vivo modeling for teaching children with autism. Journal of Autism and Developmental Disorders, 30(6), 537-552. Charlop, M.H., & Milstein, J.P. (1989). Teaching autistic children conversational speech using video modeling. Journal of Applied Behavior Analysis, 22(3), 275-285.Crozier, S., & Sileo, N.M. (2005). Encouraging positive behavior with social stories: An intervention for children with autism spectrum disorders. Teaching Exceptional Children, 37(6), 26-31.Dalrymple, N.J. (1995). Environmental supports to develop flexibility and independence. In K.A., Quill (Ed.), Teaching children with autism (pp. 243-264). New York: Delmar.Feinberg, M.J. (2001). Using social stories to teach specific social skills to individuals diagnosed with autism. Dissertation Abstracts International: Section B: The Sciences & Engineering, 62(8-B), Mar 2002, p. 3797. (UMI NO. AAI3024504)Field, S., Martin, J., Miller, Ward, R., & Wehmeyer, M. (1998) A practical guide for teaching self-determination. Published by Council for Exceptional Children, Reston, VA. Div. of Career Development and Transition (ISBN-0-86586-301-6).Ganz, J. B., & Sigafoos, J. (2005). Self-monitoring: Are young adults with MR and autism able to utilize cognitive strategies independently? Education and Training in Developmental Disabilities, 40(1), 24-33. Gardner, W.I., Clees, T.J., &, Cole, C.L. (1983). Self-management of disruptive verbal ruminations by a mentally retarded adult. Applied Research in Mental Retardation, 4, 41-58.Gold, M. (1980). “Did I say that?” Champaign, IL: Research Press.Goldstein, H., Kaczmarek, L., Pennington, R., & Shafer, K. (1992). Peer-mediated intervention: Attending to, commenting on, and acknowledging the behavior of preschoolers
175

with autism. Journal of Applied Behavior Analysis, 25, 289-305.Goldstein, H., & Thiemann, K. (2000). Effects of visually mediated intervention on the social communication of children with pervasive developmental disorders (final report). Tallahassee, FL: Florida State University, Regional Rehabilitation Center.Goldstein, H., Wickstrom, S., Hoyson, M., Jamieson, B., & Odom, S. (1988). Effects of sociodramatic play training on social and communicative interaction. Education and Treatment of Children, 11, 97-117.Gray, C.A. (1997, February). Social stories and comic strip conversations: Unique methods to improve social understanding. Paper presented at the Autism 1997 Conference of Future Horizons, Inc., Athens, GA. Gray, C.A. (1998). Social stories and comic strip conversations with students with Asperger syndrome and high-functioning autism. In E. Schopler, G.B. Mesibov, & L.J. Kunce (Eds.), Asperger syndrome or high-functioning autism (pp. 167-198)? New York: Plenum Press.Gray, C.A. (2000). The new social story book. Arlington, TX: Future Horizons. Gray, C.A., & Garand, J.D. (1993). Social stories: Improving responses of students with autism with accurate social information. Focus on Autistic Behavior, 8(1), 1-10.Hagiwara, T., & Myles, B.S. (1999). A multimedia social story intervention: Teaching skills to children with autism. Focus on Autism and Other Developmental Disabilities, 14, 82-95.Kamps, D., Barbetta, P., Leonard, B., & Delquadri, J. (1994). Classwide peer tutoring: An integration strategy to improve reading skills and promote interactions among students with autism and regular education peers. Journal of Applied Behavior Analysis, 27, 49-60.Kamps, D.M., Kravits, T., Lopez, A.G., Kemmerer, K., Potucek, J., Harrell, L.G. (1998). What do the peers think? Social validity of peer-mediated programs. Education and Treatment of Children, 21(2), 107-134. Kimball, J.W., Kinney, E.M., Taylor, B.A., & Stromer, R. (2004). Video enhanced activity schedules for children with autism: A promising package for teaching social skills. Education and Treatment of Children, 27(3), 280-198.Koegel, R.L., & Frea, W.D. (1993). Treatment of social behavior in autism through the modification of pivotal social skills. Journal of Applied Behavior Analysis, 26(3), 369-377. Koegel, R.L., & Koegel, L.K. (1990). Extended reductions in stereotypic behavior ofstudents with autism through a self-management treatment package. Journal of Applied Behavior Analysis, 23(1), 119–127. Koegel, R.L., Koegel, L.K., & Carter, C. (1999). Pivotal teaching interactions forchildren with autism. School Psychology Review, 28(4), 576-596.Koegel, L. K., Koegel, R.L., Hurley, C., & Frea, W.D. (1992). Improving social skills and disruptive behavior in children with autism through self-management. Journal of Applied Behavior Analysis, 25, 341–353.Koegel, R.L., Koegel, L.K., & McNerney, E.K. (2001). Pivotal areas in intervention for autism. Journal of Clinical Child Psychology, 30(1), 19-32.Kunce, L., & Mesibov, G.B. (1998). Educational approaches to high-functioning autism and Asperger syndrome. In E. Schopler, G.B. Mesibov, & L.J. Kunceet (Eds.), Asperger Syndrome or High-Functioning Autism (pp. 227-261)? New York: Plenum Press. Kuttler, S., Myles, B.S., & Carlson, J.K. (1998). The use of social stories to reduce precursors to tantrum behavioral in a student with autism. Focus on Autism and Other Developmental Disabilities, 13(3), 176-182.LeBlanc, L.A., Coates, A.M., Daneshvar, S., Charlop-Christy, M.H., Morris, C., & Lancaster, B.M. (2003). Using video modeling and reinforcement to teach perspective-taking skills to children with autism. Journal of Applied Behavior Analysis, 36(2), 253-258.Lorimer, P.A., Simpson, R.L., Myles, B.S., & Ganz, J.B. (2002). The use of social stories as a preventative behavioral intervention in a home setting with a child with autism. Journal of Positive Behavior Interventions, 4, 53-60.Maheady, L., Harper, G.F., & Mallette, B. (2001). Peer-mediated instruction and interventions and students with mind disabilities. Remedial and Special Education, 22(1), 4-14.
176

Mancina, C., Tankersley, M., Kamps, D., Kravits, T., & Parrett, J. (2000). Brief report: Reduction of inappropriate vocalizations for a child with Autism using a self-management treatment program. Journal of Autism and Developmental Disorders, 30(6), 599 – 606.McGee, G.G., Almeida, M.C., Sulzer-Azaroff, B., & Feldman, R.S. (1992). Promoting reciprocal interactions via peer incidental teaching. Journal of Applied Behavior Analysis, 25(1), 117-126. Mesibov, G.B., Scholper, E., & Hearsey, K.A. (1994). Structured teaching. In E Schopler & G.B. Mesibov (Eds.), Behavioral issues in autism (pp. 195-207). New York: Plenum Press.Minshew, N.J., Goldstein, G., & Siegel, D.J. (1995). Speech and language in high-functioning autistic individuals. Neuropsychology, 9, 255-261.Morrison, L., Kamps, D., Garcia, J., & Parker, D. (2001). Peer mediated and monitoring strategies to improve initiations and social skills for students with autism. Journal of Positive Behavior Interventions, 3(4), 237-250.Norris, C., & Dattilo, J. (1999). Evaluating effects of a social story intervention on a young girl with autism. Focus on Autism and Other Developmental Disabilities, 14(3), 180-186.Ostrosky, M.M., Kaiser, A.P., Odom, S.L. (1993). Facilitating children’s social communicative interactions through the use of peer-mediated interventions. In A.P. Kaiser & D.B. Gray (Eds.), Enhancing children’s communication: Research foundations for intervention (pp. 159-185). Baltimore: Brookes.Perske, R. (1988). Circles of friends. Nashville, TN: Abingdon Press.Pierce, K.L., & Schreilbman, L. (1994). Teaching daily living skills to children with autism in unsupervised settings through pictorial self-management. Journal of Applied Behavior Analysis, 27, 471-481.Reese, R., Sherman, J.A., & Sheldon, J. (1984) Reducing agitated-disruptive behavior of mentally retarded residents of community group homes: The role of self-recording and peer-prompted self-recording. Analysis and Intervention in Developmental Disabilities, 4(2), 91-107.Robertson, J., Green, K., Alper, S., Schloss, P.J., & Kohler, F. (2003). Using a peer-mediated intervention to facilitate children’s participation in inclusive childcare activities. Education and Treatment of Children, 26(2), 182-197.Romano, J. (2002). Are social stories effective in modifying behavior in children with autism? Dissertation Abstracts International: Section B: The Sciences & Engineering, 63(2-B), p. 1046. (UMI NO. AAI3044313)Sansosti, F.J., Powell-Smith, K.A., & Kincaid, D. (2004). A research synthesis of social story interventions for children with Autism Spectrum Disorders. Focus on Autism and Other Developmental Disabilities, 19(4), 194-204.Scattone, D., Wilczynski, S.M., Edwards, R.P., & Rabian, B. (2002). Decreasing disruptive behaviors of children with autism using social stories. Journal of Autism and Developmental Disorders, 32(6), 535-543.Schreibman, L., Whalen, C., & Stahmer, A. (2000). The use of video priming to reduce disruptive transition behavior in chil- dren with autism. Journal of Positive Behavior Interventions, 2(1), 3-11. Shipley-Benamou, R., Lutzker, J.R., & Taubman, M. (2002). Teaching daily living skills to children with autism through instructional video modeling. Journal of Positive Behavior Interventions, 4(3), 165-176.Siegel, D.J., Goldstein, G., & Minshew, N.J. (1996). Designing instruction for the high-functioning autistic individual. Journal of Developmental and Physical Disabilities, 8, 1-19. Shapiro, E.S., McGonigle, J.J., Ollendick, T.H. (1980). An analysis of self-assessment and self-reinforcement in a self-managed token economy with mentally retarded children. Applied Research in Mental Retardation, 1(3-4), 227-240.Simpson, A., Langone, J., & Ayres, K.M. (2004). Embedded video and computer based instruction to improve social skills for students with autism. Education and Training in Developmental Disabilities, 39(3), 240-252.Stahmer, A.C., Schreibman, L. (1992). Teaching children with autism appropriate play in unsupervised environments using a self-management treatment package. Journal of Applied
177
Behavior Analysis, 25(2), 447–459.Sturmey, P. (2003). Video technology and persons with autism and other developmental disabilities: An emerging technology for PBS. Journal of Positive Behavior Interventions, 5(1), 3-4.Swaggart, B.L., Gagnon, E., Bock, S.J., Earles, T.L., Quinn, C., & Myles, B.S., et al. (1995). Using social stories to teach social and behavioral skills to children with autism. Focus on Autistic Behavior, 10(1), 1-15. Thiemann, K.S., & Goldstein, H. (2001). Social stories, written text cues, and video feedback: Effects on social communication of children with autism. Journal of Applied Behavior Analysis, 34, 425-446.Thiemann, K.S., & Goldstein, H. (2004). Effects of peer training and written text cueing on social communication of school-age children with pervasive developmental disorder. Journal of Speech, Language, and Hearing Research, 47, 126-144.
178