01 12 portadaweb ec - web2011.ivie.esweb2011.ivie.es/downloads/docs/wpasec/wpasec-2012-01.pdf ·...
TRANSCRIPT

Wo
rkin
g p
aper
sW
ork
ing
pap
ers
ng
pap
ers
ecserie
Cristina Martínez-Sola, Pedro J. García-Teruel andPedro Martínez-Solano
WP-EC 2012-01
Trade credit policy and fi rm value

Los documentos de trabajo del Ivie ofrecen un avance de los resultados de las investigaciones económicas en curso, con objeto de generar un proceso de discusión previo a su remisión a las revistas científicas. Al publicar este documento de trabajo, el Ivie no asume responsabilidad sobre su contenido. Ivie working papers offer in advance the results of economic research under way in order to encourage a discussion process before sending them to scientific journals for their final publication. Ivie’s decision to publish this working paper does not imply any responsibility for its content. La Serie EC, coordinada por Matilde Mas, está orientada a la aplicación de distintos instrumentos de análisis al estudio de problemas económicos concretos. Coordinated by Matilde Mas, the EC Series mainly includes applications of different analytical tools to the study of specific economic problems. Todos los documentos de trabajo están disponibles de forma gratuita en la web del Ivie http://www.ivie.es, así como las instrucciones para los autores que desean publicar en nuestras series. Working papers can be downloaded free of charge from the Ivie website http://www.ivie.es, as well as the instructions for authors who are interested in publishing in our series. Edita / Published by: Instituto Valenciano de Investigaciones Económicas, S.A. Depósito Legal / Legal Deposit no.: V-292-2012 Impreso en España (enero 2012) / Printed in Spain (January 2012)

3
WP-EC 2012-01
Trade credit policy and firm value*1
Cristina Martínez-Sola, Pedro J. García-Teruel and
Pedro Martínez-Solano**
Abstract
This paper studies the shape of the relation between firm value and trade credit for a sample of Spanish
listed firms in the period 2001 to 2007. Considering the tradeoff between benefits and costs of investing in
trade credit we estimate a non-linear relationship between accounts receivable and firm value. As expected,
the results obtained show a positive relation between firm value and trade credit at low levels of receivables
and a negative one at high levels. To give robustness to the results, we analyze whether deviation from target
accounts receivable level reduces firm value. Consistent with the previous analysis, we find that deviations
from this level of receivables decrease firm value.
Keywords: accounts receivable, trade credit, firm value.
JEL classification: G30, G31.
Resumen
Este trabajo estudia la relación entre el valor de la empresa y el crédito comercial para una muestra de
empresas españolas cotizadas durante el período 2001 a 2007. A partir del tradeoff entre beneficios y costes
de la inversión en crédito comercial, se analiza la existencia de una relación no lineal entre clientes y valor
de la empresa. Conforme a las hipótesis planteadas, los resultados obtenidos muestran una relación positiva
entre valor y crédito comercial para niveles bajos de inversión en clientes y una relación negativa para niveles
altos. Para dar robustez a estos resultados, también se analiza si las desviaciones respecto del nivel objetivo de
crédito a clientes reducen el valor de la empresa. Consistente con el análisis previo, se obtiene que las
desviaciones de este nivel de clientes reducen el valor de la empresa.
Palabras clave: clientes, crédito comercial, valor de la empresa.
* We acknowledge financial support from Fundación Séneca- Science and Technology Agency from Region of Murcia- (Program: PCRTIRM 11-14). Research project 15358/PHCS/10. The authors also acknowledge support from Fundación CajaMurcia.
** C. Martínez-Sola: University of Jaén. P.J. García-Teruel y P. Martínez-Solano: University of Murcia. Corresponding author: P. Martínez-Solano, University of Murcia, Dep. Management and Finance, Faculty of Economics and Business, 30100 Murcia (Spain), e-mail: [email protected].
4
1. INTRODUCTION
Trade credit is given by a seller who does not require immediate payment for delivery of a
product. Ferris (1981) consider trade credit as a particular type of short-term loan, which tied
in both timing and value with the exchange of goods. Trade credit plays an important role in
corporate financing policy. From the seller’s point of view, the investment in accounts
receivable is an important element in a firm’s balance sheets. Specifically, in European
countries, the level of trade debtors represents on average a quarter of total assets (Giannetti,
2003). Given the significant investment in accounts receivable by most firms, the choice of
credit management policies could have important implications for the value of the firm (Pike
and Cheng, 2001).
There is a wealth of empirical literature that analyses the determinants of accounts receivable
in order to explain the existence and use of trade credit (Elliehausen and Wolken, 1993, Long,
Malitz and Ravid, 1993; Deloof and Jegers, 1996; Petersen and Rajan, 1997; Cheng and Pike,
2003; Pike, Cheng, Cravens and Lamminmaki, 2005; Niskanen and Niskanen, 2006; among
others). However, despite the huge amount of literature on trade credit, there are no studies
that focus on the straight link of effect of accounts receivable on firm value.
The literature has explained the use of trade credit based on the advantages for suppliers from
the financial, operational and commercial perspective. Some motivations for trade credit
include mitigating customers’ financial frictions (Meltzer, 1960); reductions in transaction
costs (Ferris, 1981; Emery, 1987); stimulation of sales in slack demand periods by relaxing
the credit terms (Emery, 1984); reductions in information asymmetry between buyer and
seller (Smith, 1987; Long et al., 1993; Pike et al., 2005), because trade credit acts as a signal
for product quality (Lee and Stowe, 1993; Emery and Nayar, 1998); a mechanism of price
discrimination between cash and credit customers (Brennan, Maksimovic and Zechner, 1988;
Petersen and Rajan, 1997). Finally, credit provision might improve the supplier-customer
relation (Ng, Smith and Smith, 1999; Cuñat, 2007). Consequently, granting trade credit
enhances a firm’s sales.
However, trade credit is costly and involves an opportunity cost (Nadiri, 1969; Oh, 1976).
Moreover, trade credit increases the level of investment in current assets and, therefore, may
affect the profitability and liquidity of the company. Trade credit also involves bearing the
credit risk, due to the exposure to payment default, so granting trade credit may have negative
effects on profitability and liquidity because of debt defaults (Cheng and Pike, 2003). Also,
extending trade credit leads the seller to incur some additional administrative costs (Mian and
Smith, 1992), due to costly credit management activity.

5
Thus, a firm’s accounts receivable level can be viewed as being determined by a trade-off
between costs and benefits of trade credit granted. The firm balances the benefits of credit
granted against the various costs of holding large accounts receivable. Actually, Nadiri (1969)
developed a model to select the optimal trade credit in order to maximise net profit.
Afterwards, Emery (1984) established that there is an optimal level of accounts receivable
when the marginal revenue of trade credit lending equals the marginal cost, and this condition
produces an optimal credit period.
The purpose of this paper is to analyze the effect of trade credit policy on firm value. The
paper hypothesizes that financial, operational and commercial benefits for trade credit
preponderate at lower level of receivables, while opportunity and financing costs as well as
credit risk dominate at higher levels of receivables. Accordingly, there may be a non-
monotonic (concave) relation between firm value and the investment in trade credit; positive
for low levels of trade credit granted and negative for high levels. In order to do this, we have
chosen a sample of listed Spanish firms. We use these firms because of the great importance
of trade credit in Spain, where firms have one of the longest effective credit periods in Europe
(Marotta, 2001). Additionally, studying Spanish firms is interesting since there is previous
literature which shows that those firms have a target level of trade credit to which they
attempt to converge (Garcia-Teruel and Martinez-Solano, 2010).
The importance of trade credit in Spain could be explained by the characteristics of the
financial and legal system of the country. Trade credit should be more important than bank
credit when creditor protection is weaker, because cash is easily diverted, while inputs are
more difficult to divert, and inputs illiquidity facilitates trade credit (Burkart and Ellingsen,
2004). Demirguc-Kunt and Maksimovic (2002) found that trade credit is relatively more
prevalent in countries with weaker legal protection (La Porta, Lopez-de-Silanes, Shleifer, and
Vishny, 1998), as in the case of Spain. Another reason could be the different degree of
development of financial markets between countries. In Spain there has been no real
disintermediation process, as has happened in other countries, because the development of
capital markets and, in particular, institutional funds has been led by banks (Gallego, Garcia
and Saurina, 2002). As Demirguc-Kunt and Maksimovic (2002) suggest, firms operating in
countries with more developed banking systems grant more trade credit to their customers.
To our knowledge, no study to date provides empirical research on the effect of trade credit
on firm valuation from the supplier’s point of view. Our study fills this gap. This paper
contributes to the literature by testing empirically the existence of a non-linear relationship
(concave) between accounts receivable and firm value. Later, with the aim of giving
robustness to our initial analysis, we estimate the target level of trade credit and then study
how deviations from the target affect firm value. The results obtained confirm our hypothesis
6
showing that firm value increases with receivables up to a point and then starts decreasing
with receivables. One of the main implications for researchers and managers is that
management of trade credit is an important element which affects shareholder value.
The remainder of this paper is organized as follows: in section 2, we review the trade credit
literature and develop the hypothesis. In section 3, we give a general description of the sample
and variables employed. Section 4 describes the model linking accounts receivable and firm
value, and reports the results. Next, we analyse the effect on firm value of the deviation from
target accounts receivable level. Finally, in section 5, we present the main conclusions and
implications of our study.
2. THEORETICAL FOUNDATIONS AND HYPOTHESIS
Lewellen, McConnell and Scott (1980) develop a model in which, under competition and
certainty, credit policy does not influence firms’ market value. Relaxing these assumptions
and taking into account the existence of uncertainty, they postulate that in an uncertainty
environment, where there will exist the likelihood of default, and where there are costs
involved in the credit evaluation process, there could be an effect of credit policy on firm
value. Put another way, the existence of market imperfections might impact on the trade credit
decision and allow an opportunity for the credit policy to affect firm value, implying an
optimal trade credit policy.
Firms may have incentives to offer credit, mainly because this can help to increase their sales
and, consequently, result in higher profitability. Also, the incremental cash flows arising from
the decision to extend credit can offer a valuable asset to the firm (Schwartz, 1974; and Kim
and Atkins, 1978). The benefits of granting trade credit to customers stem from several
motives.
First, trade credit reduces the information asymmetry between buyer and seller (Smith, 1987;
Long et al., 1993; Pike et al., 2005) alleviating moral hazard problems between the firm and
their customer, since it allows the customer to verify product quality before paying. This is
especially relevant for products or services that take longer to verify (Smith, 1987). Trade
credit is employed by the vendor firm to signal for product quality (Lee and Stowe, 1993;
Emery and Nayar, 1998). Trade credit can also be interpreted as an implicit quality guarantee
(Lee and Stowe, 1993; Long et al., 1993; Deloof and Jegers, 1996). In this sense, trade credit
is used by firms’ customers as a device to manage and control the quality of the items
purchased (Smith, 1987; and Long et al. 1993). Hence, trade credit can help firms to
strengthen long-term relationships with their customers (Ng et al., 1999; Wilner, 2000).
7
Trade credit can also be viewed as part of the firm’s pricing policy designed to stimulate
demand. Firms may extend the credit period or increase the cash discount, thus reducing the
price of stimulating sales (Pike et al., 2005), so allowing firms to practice price
discrimination. Similarly, Brennan et al. (1988) pointed out that vendor financing enables
price discrimination between cash and credit customers. These authors also argue that vendor
financing can be used to reduce competition since some firms can concentrate on the credit
market while other firms maintain a larger market share in the cash market.
Ferris’ Transaction Theory (1981) postulates that trade credit use brings down exchange
costs. By permitting the exchange of the goods to be separated from the immediate use of
money, trade credit may play an intermediary role in the synchronization of receipt from sales
with the outflow of money for the supplier firm. It permits a reduction in precautionary
money holdings, because supplier firms can anticipate the flow of payments from its
customers, and can manage net money accumulations more efficiently.
Finally, following Cuñat´s (2007) reasoning, granting trade credit, especially when customers
experience temporally liquidity shocks that may threaten their survival, could reinforce the
supplier-customer relation. Recent research (Kestens, Van Cauwenberge, and Bauwhede,
2011) finds that the negative impact of financial crisis on firm profitability is reduced for
firms that have increased their trade receivables during the crisis period. This supports the
idea that trade credit mitigates customers’ financial frictions (Meltzer, 1960). Furthermore,
trade credit can be viewed as a strategic investment in seeking to retain customers, in this
sense trade credit acts as a signal to the customer that the supplier seeks a mutually beneficial
longer-term trading relation (Cheng and Pike, 2003).
From an investment perspective, trade credit can generate an implicit interest income for
delayed payment if the seller can charge a higher price by offering credit terms. Firms should
invest in trade credit if the net present value of the revenue receivable with trade credit is
greater than the net present value without it (Ferris, 1981).
As a result of these benefits, we can expect a positive relationship between receivables and
value. However, investing in accounts receivable also has costs. On the one hand, granting
trade credit exposes the firm to financial risks. The role of firms as liquidity providers implies
a risk of late payment and/or renegotiation in case of default and, at worst, an increase in
delinquent accounts. It creates a potential cost of financial distress. According to the
European Payment Index Report (2011)1, 25% of all bankruptcies are due to late and/or non-
payment of outstanding invoices. Late payment limits firms growth, exposes companies to
1 The European Payment Index Report, made by Intrum Justitia, provides an insight into the payment behavior of the 25 European countries participating in the survey.

8
liquidity problems, and in some cases firms go bankrupt. On the other hand, the granting of
credit on sales requires the firm to forgo funds on which interest could be earned. Nadiri
(1969) states that one cost of trade credit is “the carrying cost”; this is the real income
foregone by tying up funds in receivables. This approach implies an opportunity cost. Also,
granting credit forces firms to obtain additional funds from the capital market to fund the
extra investment in receivables, thereby increasing their reliance on external funding.
Actually, trade credit granted will depend on the creditworthiness of the supplier and its
access to capital markets (Schwartz, 1974; Emery, 1984; Smith, 1987; Mian and Smith, 1992;
Petersen and Rajan, 1997).
Moreover, extending trade credit leads the seller to incur credit management costs. In
particular, the seller must devote some time and energy to assessing the credit risk of the
buyer and to structuring the delayed payment contract. The seller must also incur some costs
to collect the payment from the buyer. According to Ng et al. (1999), the transaction costs
associated with trade credit information and monitoring are incurred when informational
asymmetries between buyer and seller are present, reputations are hard to establish, and a high
level of specialized investment is involved.
Therefore, it might be argued that the initial positive trade credit-value relation would become
negative at high levels of receivables because the costs of trade credit would surpass the
benefits as the investment in receivables increases. Consequently, we test for two different
effects of trade credit on firm value. At lower levels of trade credit, firms would benefit from
the advantages of granting trade credit, such as increased sales and increase in revenues
through interest income and reduction in transaction costs. However, at higher levels of trade
credit, the existence of financing and opportunity costs as well as non-payment or late
payment would exceed the benefits and reduce firm value. If a firm is having difficulty
recovering its existing accounts receivable then granting more credit to its customers may
reduce firm value.
In short, the theoretical basis for our hypothesis is that trade credit literature suggests the
existence of an optimal accounts receivable (Nadiri, 1969; Lewellen et al., 1980; Emery,
1984). In this sense, Emery (1984) establishes that there is an optimal level of accounts
receivable when the marginal revenue of trade credit lending equals the marginal cost, and
this condition produces an optimal credit period. For that reason, credit managers should try
to keep accounts receivable at their target level in order to avoid the erosion of the value of
the firm by lost sales or uncollectable sales (Pike and Cheng, 2001). Consequently, one might
expect a non linear relationship between trade credit and firm value determined by a tradeoff
between costs and benefits of supplying trade credit, where there is a level of trade credit
9
granted which maximizes firm value. Based on the above discussion, we test the following
hypothesis:
H1: The relationship between the investment in accounts receivables and firm value will be
non-monotonic (concave); positive for low levels of trade credit granted and negative for high
levels.
3. DATA AND VARIABLES
Data
The dataset comprises Spanish listed non financial firms in the SABI database for 2001 to
2007. Because of the small size of the Spanish stock market (Yang, Min and Li, 2003), the
sample consists of an unbalanced panel of 54 companies for which the information is
available for at least five consecutive years2 between 2001 and 2007. It represents 349 firm-
year observations (after excluding observations with errors, missing values, and outlying
observations).
Variables
The dependent variable in the study is firm value, which has usually been measured in the
financial literature with Tobin’s Q3 (McConnell and Servaes, 1990; Berger and Ofek, 1995).
In our paper we specifically use the approximation for Tobin’s Q that Chung and Pruitt
(1994) suggest, which is defined as the market value of assets divided by the book value of
assets. Specifically, it is calculated as the ratio of market value of equity plus book value of
total debt to book value of total assets (Q) (this proxy has also been used in several papers
such as La Porta, Lopez-de-Silanes, Schleifer and Vishny, 2002; Durnev and Kim, 2005; and
Gaio and Raposo, 2011). We employ this simple measure to avoid a possible distortion
because of the arbitrary assumptions about depreciation and inflation rates to estimate the
firm’s replacement value (Perfect and Wiles, 1994). Moreover, Chung and Pruitt (1994)
demonstrate that at least 96.6 percent of the variability of Tobin’s q is explained by their
proxy market value of equity plus book value of total debt to book value of total assets (Q).
We have also constructed an additional proxy for firm value in order to test the robustness of
2 To estimate with General Method of Moments it is a necessary requisite to have at least five years of continuous data to perform the m2 test. 3 It is worth pointing out that a firm’s market value includes assets in place, as well as assets not yet in place, namely the net present value of current and future investment opportunities (Myers, 1977; and Smith and Watts, 1992). So, many studies also employ Tobin’s Q as a proxy for a firm’s growth opportunities.

10
the results. This is Market-To-Book ratio (MBOOK), defined as the ratio of market value of
equity to book value of equity (Lins, 2003). The correlation between these two measures for
firm value is 0.91.
The main independent variable to analyze is accounts receivable. We use two proxies: REC1
as the fraction of accounts receivable over total sales (Petersen and Rajan, 1997; Niskanen
and Niskanen, 2006) and REC2 as the fraction of accounts receivable over total assets (Deloof
and Jegers, 1999; Cuñat, 2007; Boissay and Gropp, 2007). We include the square of these
variables (REC2) to allow for nonlinearities. We expect a positive relationship between
accounts receivable and firm value at lower levels of accounts receivable. Similarly, we
expect a negative association between receivables and value at higher levels of accounts
receivable. Hence, we expect a positive sign for variable REC and a negative one for REC
squared.
We also include variables that could have an impact on firm value. Following the literature
cited above, these control variables include firm sales growth, firm size, and leverage.
GROWTH is measured as the annual sales growth rate. We expect this variable to be
positively related to firm value, since firms that have grown well so far are better prepared to
continue to grow in the future (Scherr and Hulburt, 2001). Also, growing firms have better
investment opportunities (Niskanen and Niskanen, 2006). The size of the firm (SIZE) is
measured by the natural logarithm of total sales. The empirical evidence on the relation
between value and size of the firm is mixed. For instance, Lang and Stulz (1994) find a
negative relation between firm size and firm value for U.S. companies, Berger and Ofek
(1995) find a positive relation, and Demsetz and Villalonga (2001) report a nonsignificant
relation. Therefore, we do not have a clear prediction for the relation between size and firm
value. Finally, leverage (LEV) is measured as total debt divided by shareholder equity.
Previous literature points in different directions with respect to the impact of debt on firm
value (Harris and Ravid, 1991). Debt may yield a disciplinary effect when free cash flow
exists (Jensen, 1986; Stulz, 1990). Firms can also debt to create tax shields (Modigliani and
Miller, 1963). However, leverage can also have a negative effect on firm value because of the
agency cost of debt (Jensen and Meckling, 1976). Hence, as with firm size, we cannot predict
the effect of leverage on firm value.
Finally, trade credit granted has sector-specific levels and trends. Several authors, such as
Smith (1987), Ng et al. (1999) and Fisman and Love (2003) find that trade credit terms are
uniform within industries and differ across industries. Smith (1987) argues that within an
industry both parts, buyers and sellers, face similar market conditions, while across industries
market conditions and investment requirements in buyers may vary significantly. For this
reason, we control for activity sector by including industry dummies in all regressions.
11
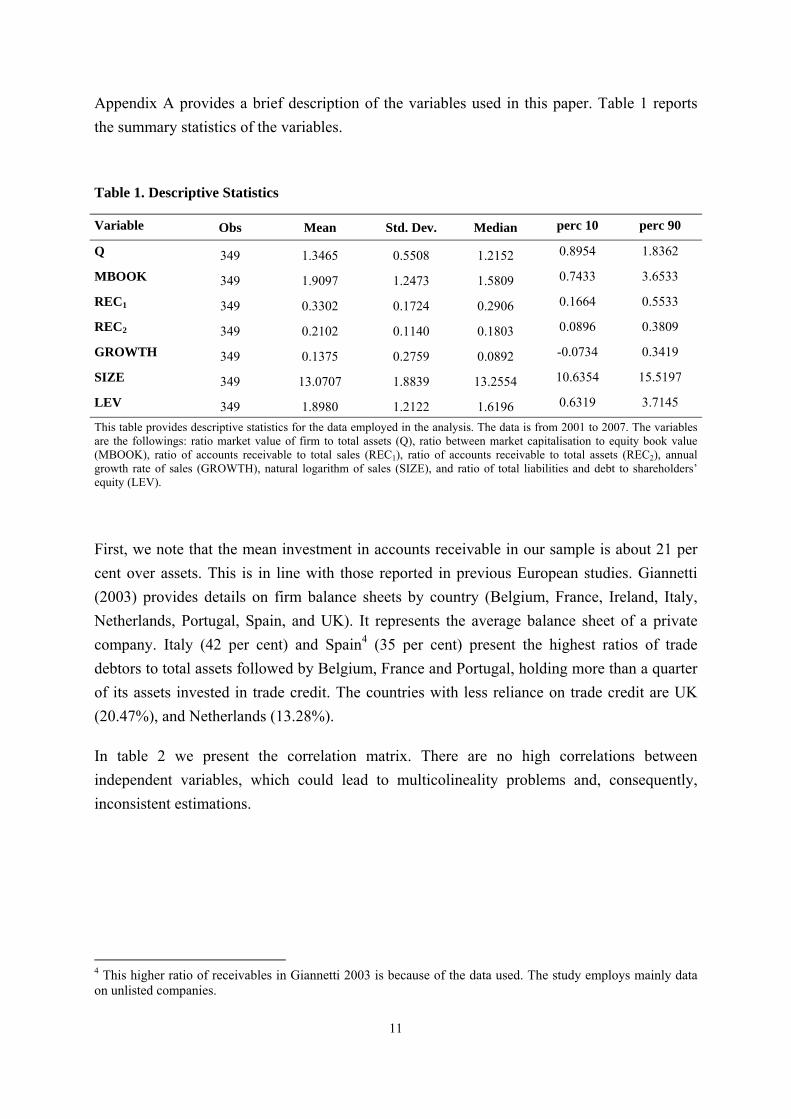
Appendix A provides a brief description of the variables used in this paper. Table 1 reports
the summary statistics of the variables.
Table 1. Descriptive Statistics
Variable Obs Mean Std. Dev. Median perc 10 perc 90
Q 349 1.3465 0.5508 1.2152 0.8954 1.8362
MBOOK 349 1.9097 1.2473 1.5809 0.7433 3.6533
REC1 349 0.3302 0.1724 0.2906 0.1664 0.5533
REC2 349 0.2102 0.1140 0.1803 0.0896 0.3809
GROWTH 349 0.1375 0.2759 0.0892 -0.0734 0.3419
SIZE 349 13.0707 1.8839 13.2554 10.6354 15.5197
LEV 349 1.8980 1.2122 1.6196 0.6319 3.7145
This table provides descriptive statistics for the data employed in the analysis. The data is from 2001 to 2007. The variables are the followings: ratio market value of firm to total assets (Q), ratio between market capitalisation to equity book value (MBOOK), ratio of accounts receivable to total sales (REC1), ratio of accounts receivable to total assets (REC2), annual growth rate of sales (GROWTH), natural logarithm of sales (SIZE), and ratio of total liabilities and debt to shareholders’ equity (LEV).
First, we note that the mean investment in accounts receivable in our sample is about 21 per
cent over assets. This is in line with those reported in previous European studies. Giannetti
(2003) provides details on firm balance sheets by country (Belgium, France, Ireland, Italy,
Netherlands, Portugal, Spain, and UK). It represents the average balance sheet of a private
company. Italy (42 per cent) and Spain4 (35 per cent) present the highest ratios of trade
debtors to total assets followed by Belgium, France and Portugal, holding more than a quarter
of its assets invested in trade credit. The countries with less reliance on trade credit are UK
(20.47%), and Netherlands (13.28%).
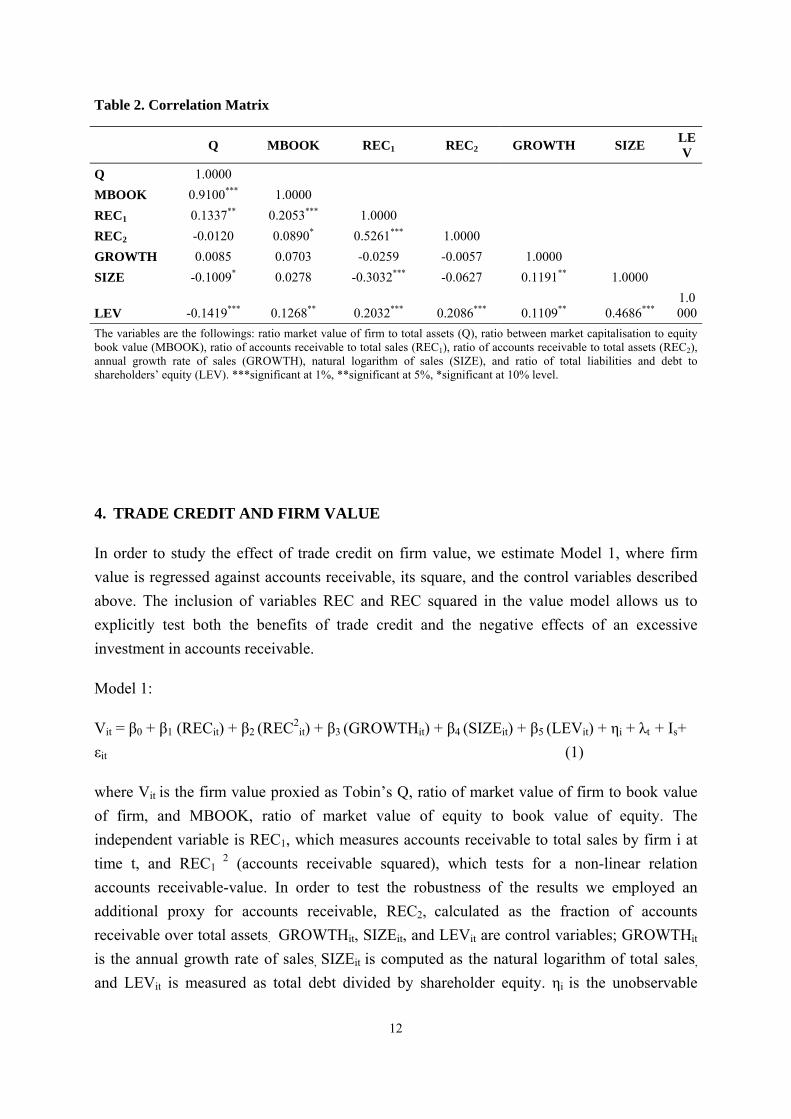
In table 2 we present the correlation matrix. There are no high correlations between
independent variables, which could lead to multicolineality problems and, consequently,
inconsistent estimations.
4 This higher ratio of receivables in Giannetti 2003 is because of the data used. The study employs mainly data on unlisted companies.
12
Table 2. Correlation Matrix
Q MBOOK REC1 REC2 GROWTH SIZE LEV
Q 1.0000
MBOOK 0.9100*** 1.0000
REC1 0.1337** 0.2053*** 1.0000
REC2 -0.0120 0.0890* 0.5261*** 1.0000
GROWTH 0.0085 0.0703 -0.0259 -0.0057 1.0000
SIZE -0.1009* 0.0278 -0.3032*** -0.0627 0.1191** 1.0000
LEV -0.1419*** 0.1268** 0.2032*** 0.2086*** 0.1109** 0.4686*** 1.0000
The variables are the followings: ratio market value of firm to total assets (Q), ratio between market capitalisation to equity book value (MBOOK), ratio of accounts receivable to total sales (REC1), ratio of accounts receivable to total assets (REC2), annual growth rate of sales (GROWTH), natural logarithm of sales (SIZE), and ratio of total liabilities and debt to shareholders’ equity (LEV). ***significant at 1%, **significant at 5%, *significant at 10% level.
4. TRADE CREDIT AND FIRM VALUE
In order to study the effect of trade credit on firm value, we estimate Model 1, where firm
value is regressed against accounts receivable, its square, and the control variables described
above. The inclusion of variables REC and REC squared in the value model allows us to
explicitly test both the benefits of trade credit and the negative effects of an excessive
investment in accounts receivable.
Model 1:
Vit = β0 + β1 (RECit) + β2 (REC2it) + β3 (GROWTHit) + β4 (SIZEit) + β5 (LEVit) + ηi + λt + Is+
εit (1)
where Vit is the firm value proxied as Tobin’s Q, ratio of market value of firm to book value
of firm, and MBOOK, ratio of market value of equity to book value of equity. The
independent variable is REC1, which measures accounts receivable to total sales by firm i at
time t, and REC1 2 (accounts receivable squared), which tests for a non-linear relation
accounts receivable-value. In order to test the robustness of the results we employed an
additional proxy for accounts receivable, REC2, calculated as the fraction of accounts
receivable over total assets. GROWTHit, SIZEit, and LEVit are control variables; GROWTHit
is the annual growth rate of sales, SIZEit is computed as the natural logarithm of total sales,
and LEVit is measured as total debt divided by shareholder equity. ηi is the unobservable

13
heterogeneity. λt control for time effects and are year dummy variables that change in time but
are equal for all firms in each of the periods considered. In this way we try to capture the
economic variables that firms cannot control and which may affect their value. Parameter Is
controls by the industry in which the firm operates. εit is the error term.
Following Arellano and Bond (1991), we employ the GMM method of estimation on the
model in first differences, which controls for unobservable heterogeneity and prevents
potential endogeneity problems of trade credit decisions. We use this technique because the
firms are heterogeneous, and there are always factors influencing firm value that are difficult
to measure or hard to obtain (see Himmelberg, Hubbard, and Palia, 1999). Examples of this
potential endogeneity are; abnormally high level of sales would lead to higher profits and also
to more trade credit given; or profitable firms tend to act as intermediaries and borrow more
in organized markets to lend more to their customers (Nilsen, 2002). This estimation assumes
that there is no second-order serial correlation in the errors in first differences. For this reason,
we use the test for the absence of second-order serial correlation proposed by Arellano and
Bond (1991). We also employed the Hansen test for over-identifying restrictions, which tests
for the absence of correlation between the instruments and the error term.
Table 3 contains the corporate value regressions using two different proxies for firm value
(Model 1). In Columns 1 and 2 we calculate firm value as Tobin’s Q (Q). In the third and
fourth columns we calculate firm value as Market-To-Book ratio (MBOOK). The second and
fourth columns present some robustness checks of this specification by altering the
independent variable (REC). The results are qualitatively very similar.
Consistent with our expectations, REC is positive and statistically significant, while REC2 is
negative and significant at 1% for the two different specifications of dependent variables (firm
value), and, moreover, for two alternative measures of accounts receivable. Our findings
provide evidence of a significant non-monotonic relation between investment in accounts
receivable and firm value. Specifically, the shape of the above-mentioned relationship is
concave. We find two opposing effects related to the benefits and cost of trade credit. This
means that accounts receivable increase the value of the firm up to the breakpoint, after
which, increases in receivables reduce the firm’s value. At low levels of trade credit, the
relation receivables-value is positive (consistent with financial, operational, and commercial
motives for trade credit). On the contrary, at high levels of trade credit the relation between
receivables and firm value is negative (consistent with the arguments of opportunity and
financing costs, as well as financial risks).

14
Table 3. Trade Credit and firm value
TOBIN´S Q MBOOK
(1) (2) (3) (4)
REC1 2.2748*** 4.1095***
6.52 4.83
REC12 -2. 0539*** -4.3197***
-7.38 -6.32
REC2 4.6915*** 10.8655***
9.59 10.76
REC22 -6.3037*** -15.0724***
-9.32 -11.07
GROWTH 0.0651*** 0.0604*** 0.1775*** 0.1732***
3.50 3.52 4.02 4.64
SIZE 0.0431 0.0783 -0.0582 0.1695
0.89 1.44 -0.39 1.30
LEV -0.0343 -0.0070 0.3137*** 0.3630***
-1.32 -0.40 4.08 6.13
m2 0.063 0.116 0.082 0.056
Hansen test 30.77 39.80 35.71 34.52
(df) (95) (95) (95) (95)
All estimations have been carried out using the two-step GMM estimator. All variables are treated as endogenous and the lagged independent variables are used as instrument. In columns (1) and (2) the dependent variable is Q (Tobin’s Q), which is market value of firm to total assets. In columns (3) and (4) the dependent variable employed to proxy firm valuation is MBOOK, which is the ratio of market capitalisation to equity book value. REC1 and REC2 measure accounts receivable. Control variables are GROWTH, SIZE, and LEV. Time and industry dummies are included in all regressions. m2 is test statistic for second order autocorrelations in residuals, distributed as standard normal N (0,1) under the null hypothesis of no serial correlation. Hansen test is a test for overidentifying restrictions, distributed as chi-square under the null of instrument validity. ***significant at 1%, **significant at 5%, *significant at 10% level.
However, it should be noted that Tobin’s q and the ratio of market value of equity to book
value of equity are not unambiguous measures of value. Previous literature has also used them
as measures of growth opportunities. In this sense an alternative explanation is possible; trade
credit policy designed to capture customers may increase firm growth by increasing market
share and maintaining and establishing new commercial relations. However these benefits
could not be unlimited, since at high levels of trade credit, extending credit to customers
implies that there are fewer funds for profitable investment projects, thus limiting firm growth
opportunities.
Regarding the control variables, GROWTH is positively related to the two proxies of firm
value in all four cases. Empirical evidence (Claessens, Djankov, Fan, and Lang, 2002; La
Porta et al., 2002; Durnev and Kim, 2005; Maury and Pajuste, 2005; Tong, 2008) also reports
a positive sign for sales growth. As for firm size, like Demsetz and Villalonga (2001), we

15
report a non-significant relation between SIZE and firm value. Finally, LEV is significant in
two of the four regressions (when the dependent variable is MBOOK). The positive
coefficient on the debt variable is consistent with a tax argument (Modigliani and Miller,
1963), and a free-cash-flow argument (Jensen, 1986). In general, the stability of the estimated
coefficients for two different specifications of the dependent variable and for different proxies
of accounts receivable supports our findings for the non-linear relationship between accounts
receivable and firm value5.
Suppliers will be willing to finance their customers as long as the benefit of investment in
accounts receivable is higher than the costs of trade credit granted. To the extent that firms
can reap the benefits of investing in trade credit (e.g. reducing asymmetries in product quality;
lower transaction costs; lower cash inventories; improved relations with customers; increased
demand and sales) and that these benefits outweigh credit management costs, financial risks,
and opportunity costs, firms should continue to extend trade credit. In contrast, firms should
not finance their customers in cases where granting trade credit adversely affects the
profitability and liquidity of the firm. These two effects imply a “reverse U-shaped”
distribution of the level of accounts receivable with respect to a firm value.
Robustness: Deviation from the target trade credit level
We have shown that there is a quadratic relation (concave) between firm accounts receivable
and firm value, as a consequence of two contrary effects. In order to give robustness to the
results we provide evidence that firm value would be reduced if firms under- or overinvest in
trade credit.
A firm’s accounts receivable deviations are defined relative to benchmark accounts
receivable. Tong (2008) develops an approach to study the relation between deviations on
either side of optimal CEO ownership and firm value. We follow this approach to analyze the
relation between deviations from target or desired accounts receivable and firm value. So, if a
non-linear accounts receivable-value relation is confirmed in our first study, where a level
which maximizes firm value exists, it is expected that deviations from this accounts
receivable level will reduce firm value.
In order to do this, we consider that the benchmark specification for the determinants of
accounts receivable is explained by the equation below, which has been supported by
previous studies on the determinants of accounts receivable (for instance, Petersen and Rajan,
1997; Niskanen and Niskanen, 2006; Garcia-Teruel and Martinez-Solano, 2010)
5 The results do not change if we introduce interest rates, measured as 1-year treasury bills.
16
Model 2:
RECit = β0 + β1 (GROWTH it) + β2 (SIZEit) + β3 (STLEVit) + β4 (FCOSTit) + β5 (CFLOWit) +
β6 (TURNit) + β7 (GPROFit) + ηi + λt + Is+ εit (2)
where RECit is accounts receivable. As in the previous section we employ two measures;
REC1, which is the ratio of accounts receivable to total sales and REC2, which is the ratio of
accounts receivable to total assets; GROWTHit is the annual growth rate of sales; SIZEit is the
natural logarithm of sales; STLEVit is short-term financing calculated as current liabilities to
total sales; FCOSTit represents the cost of external financing measured as the ratio of financial
expenses to outside financing less trade creditors; CFLOWit is the internal financing
computed as earnings after tax plus depreciation-amortization to total sales; TURNit is the
proxy for product quality, total sales to total assets less net account receivable; GPROFit is the
profit margin measured as earnings before interest and taxes, depreciation and amortization to
total sales. As above, ηi is the unobservable heterogeneity, λt control for time effects,
parameter Is controls by industry, and εit is the error term. A brief description of the variables
used in this section is provided in Appendix A.
Next, we obtain residuals from Model 2 and we include these residuals in model 3. In this
way, we define DEVIATION as the absolute value of these residuals. The aim is to find if
deviations from the target accounts receivable level affect a firm’s value. In order to do this
we estimate the following model:
Model 3:
Vit = β0 + β1 (DEVIATIONit) + β2 (GROWTHit) + β3 (SIZEit) + β4 (LEVit) + ηi + λt + Is+ εit
(3)
where Vit is firm value, proxied as Tobin’s Q, and MBOOK. The main dependent variable is
DEVIATIONit, defined as the absolute value of residuals of equation 2. The rest of the
variables are defined as above. We expect β1 <0 in Model 3, implying a negative relation
between deviations from target accounts receivable level and firm value.
In Table 4 we present panel data regressions to explain whether deviations from target
accounts receivable influence firm value (model 3). In line with our expectations,
DEVIATION is inversely related to firm value, since its coefficient is negative and significant
at 1%. These results confirm that as firms move away from the target accounts receivable
level this decreases its value. As before, we proxy value as Tobin’s Q (columns 1 and 2) and
MBOOK (columns 3 and 4) and we obtain the same results. Regarding control variables, the

17
coefficient of the variable GROWTH is positive and significant at 1%, SIZE is not significant
in any of the four regressions, and LEV is positively related to firm value in all columns.
Table 4. Deviation from the target accounts receivable level and firm value
TOBIN’S Q MBOOK
(1) (2) (3) (4)
DEVIATION -0.2977*** -0.5430*** -0.7644*** -0.8467***
-7.34 -5.02 -5.18 -3.21
GROWTH 0.0713*** 0.0765*** 0.1609*** 0.1698***
5.84 6.56 4.66 6.72
SIZE -0.0627 -0.0625 -0.1540 -0.1029
-1.46 -1.23 -1.51 -1.21
LEV 0.0472** 0.0564*** 0.2211*** 0.2984***
2.40 2.67 3.60 5.73
m2 0.143 0.117 0.081 0.063
Hansen test 39.65 41.01 37.68 39.77
(df) (42) (42) (42) (42)
All estimations have been carried out using the two-step GMM estimator. All variables are treated as endogenous and the lagged independent variables are used as instrument. In columns (1) and (2) the dependent variable is Q (Tobin’s Q), which is market value of firm to total assets. In columns (3) and (4) the dependent variable employed to proxy firm valuation is MBOOK, which is the ratio of market capitalisation to equity book value. Columns (1) and (3) correspond to the dependent variable REC1 (trade credit divided by total assets) in the determinants regression. Likewise, Columns (2) and (4) correspond to REC2 (trade credit divided by total sales). Control variables are GROWTH, SIZE, and LEV. Time and industry dummies are included in all regressions. m2 is test statistic for second order autocorrelations in residuals, distributed as standard normal N (0,1) under the null hypothesis of no serial correlation. Hansen test is a test for overidentifying restrictions, distributed as chi-square under the null of instrument validity. ***significant at 1%, **significant at 5%, *significant at 10% level.
Finally, the results confirm our hypothesis. All in all, we find a quadratic relationship between
accounts receivable and firm value and, moreover, deviations from the desired level of
accounts receivable significantly reduce firm value.
5. CONCLUSIONS
Trade credit policy might have important implications for corporate value because of the large
amount of capital invested in accounts receivable. Lewellen et al. (1980) postulate that the
existence of market imperfections might impact on the trade credit decision and allow an
opportunity for the credit policy to affect firm value, so implying an optimal trade credit
policy. Following this line of argument, in this paper we contrast the effect of trade credit
granted on firm value, assuming that the relation trade credit-value is non-linear, and
consequently, there should be a level of trade credit which maximizes firm value.

18
A salient result of our paper is that accounts receivable both entail costs and confer benefits.
Hence, investment in accounts receivable is no longer uniformly beneficial and investors will
pressure firms to limit trade credit granted to mitigate opportunity cost and financial risk, and
reduction in profitability and liquidity while also encouraging managers to maintain an
investment in accounts receivable which maximizes operational, financial, and commercial
benefits. Firm value increases with receivables up to a point and then starts decreasing with
receivables. So we can conclude that, in effect, there is an inverted U-shaped relationship
between the investment in accounts receivable and firm value, where a level of trade credit
exists at which firm value is maximized. The relation between these variables is positive
when the investment in trade credit is low, and it becomes negative for higher levels of trade
credit. Moreover, deviations from the desired receivables level reduce firm value.
It is worth pointing out the implications of our study for researchers and managers. We find
that the management of trade credit is an important element, which affects shareholder value.
It may be tempting to argue that, given that the average accounts receivable in our sample is
below target receivables, on average firms could increase their firm value by increasing their
investment in accounts receivable. However, our estimations do not incorporate firm-specific
costs or benefits of receivables. Perhaps for firms that are below the desired level of
receivables, increasing investment in receivables any higher is costly. The target value found
may be not necessarily right for an individual firm. However, we can state that trade credit
affects firm value and that there is a target value on average.
One limitation of this approach is that analyzing the relation between accounts receivable and
firm value is not sufficient to conclude that there is an optimum level of accounts receivable,
but it is a theoretical question, which should be solved analytically.
The analysis might be extended in several directions by investigating the value of investment
in accounts receivable across industries or countries. It would be also interesting to test
whether there is a nonlinear receivables-profitability relation for a sample of SMEs. These
firms may be forced to grant trade credit despite the costs associated to it, because not
granting trade credit would lose sales, and profitability would decrease, implying a linear
relation between the investment in trade credit and profitability.

19
APPENDIX A
Variables definition
Variable Definition
Qit Tobin’s Q (Chung and Pruitt, 1994) is the proxy for firm value. Ratio of market value of firm to book value of firm. It is calculated as market value of equity plus book value of total debt to total assets.
MBOOKit Market-To-Book ratio is defined as the ratio of market value of equity to book value of equity.
REC1it Accounts receivable. Fraction of accounts receivable over total sales.
REC2it Accounts receivable. Ratio of accounts receivable to total assets.
GROWTHit Growth opportunities, which is the rate of annual sales growth.
SIZEit The size of the firm is computed as the natural logarithm of gross sales.
LEVit Leverage is measured as total debt divided by shareholder equity.
DEVIATIONit DEVIATION is defined as the absolute value of residuals of optimal accounts receivable.
STLEVit Short-term leverage is short-term financing calculated as current liabilities to total sales
FCOSTit Cost of external financing is the ratio of financial expenses to outside financing less trade creditors
CFLOWit Cash-Flow is the internal financing computed as earnings after tax plus depreciation-amortization to total sales
TURNit Firm's asset turnover is calculated as the ratio of sales over assets minus accounts receivable
GPROFit Profit margin is Earnings Before Interest, Taxes, Depreciation and Amortization to total sales

20
REFERENCES
Arellano M, Bond SR, 1991. Some tests of specification for panel data Monte Carlo evidence and an application to employment equations. Review of Economic Studies 58, 277–297.
Berger PG, Ofek E, 1995. Diversification’s effect on firm value. Journal of Financial Economics 37, 39-65.
Boissay F, Gropp R, 2007. Trade credit defaults and liquidity provision by firms. European Central Bank, Working Paper Series, No. 753.
Brennan MJ, Maksimovic V, Zechner J, 1988. Vendor Financing. Journal of Finance 43, 1127-1141.
Burkart M, Ellingsen T, 2004. In-kind finance: a theory of trade credit. American Economic Review 94, 569–590.
Cheng NS, Pike R, 2003. The trade credit decision: evidence of UK firms. Managerial and Decision Economics 24, 419–438.
Chung KH, Pruitt SW, 1994. A simple approximation of Tobin´s Q. Financial Management 23, 70-74.
Claessens S, Djankov S, Fan J, Lang L, 2002. Disentangling the incentive and entrenchment effects of large shareholdings. Journal of Finance 57, 2741–2771.
Cuñat V, 2007. Trade credit: suppliers as debt collectors and insurance providers. Review of Financial Studies 20, 491–527.
Deloof M, Jegers M, 1996. Trade credit, product quality, and intragroup trade: some European evidence. Financial Management 25, 33-43.
Deloof M, Jegers M, 1999. Trade credit, corporate groups, and the financing of Belgian firms. Journal of Business Finance & Accounting 26, 945-966.
Demirguc-Kunt A, Maksimovic V, 2002. Firms as financial intermediaries: evidence from trade credit data. World Bank Working Paper.
Demsetz H, Villalonga B, 2001. Ownership structure and corporate performance. Journal of Corporate Finance 7, 209–233.
Durnev A, Kim EH, 2005. To Steal or Not to Steal: Firm Attributes, Legal Environment, and Valuation. Journal of Finance 3, 1461-1493.
Elliehausen GE, Wolken JD, 1993. The demand for trade credit: An investigation of motives for trade credit use by small businesses. The Federal Reserve Board, Working Paper.
Emery GW, 1984. A pure financial explanation for trade credit. Journal of Financial and Quantitative Analysis 19, 271-285.
Emery GW, 1987. An optimal financial response to variable demand, Journal of Financial and Quantitative Analysis 22, 209-225.
Emery GW, Nayar N, 1998. Product quality and payment policy. Review of Quantitative Finance and Accounting 10, 269-284.
Ferris JS, 1981. A transactions theory of trade credit use. Quarterly Journal of Economics 96, 243-270.
Fisman R, Love I, 2003. Trade Credit, Financial intermediary development, and industry growth. Journal of Finance 58, 353-374.
Gaio C, Raposo C, 2011. Earnings quality and firm valuation: international evidence. Accounting and Finance 51, 467–499.
21
Gallego S, Garcia A, Saurina J, 2002. The Asian and European banking system: the case of Spain in the quest for development and stability. Banco de España-Servicio de Estudios, Working Paper 217.
Garcia-Teruel PJ, Martinez-Solano P, 2010. A dynamic approach to accounts receivable: a study of Spanish SMEs. European Financial Management 16, 400-421.
Giannetti M, 2003. Do Better Institutions Mitigate Agency Problems? Evidence from Corporate Finance Choices. Journal of Financial and Quantitative Analysis 38, 185-212.
Harris M, Raviv A, 1991. The Theory of Capital Structure. Journal of Finance 46, 297-355.
Himmelberg C, Hubbard R, Palia D, 1999. Understanding the determinants of managerial ownership and the link between ownership and performance. Journal of Financial Economics 53, 353–384.
Intrum Justitia, European Payment Index, Spring 2011, http://www.intrum.com/Press-and-publications/European-Payment-Index/
Jensen MC, 1986. Agency costs of free cash flow, corporate finance, and takeovers. American Economic Review 76, 323-329.
Jensen MC, Meckling WH, 1976. Theory of the Firm: Managerial behavior, agency costs and ownership structure. Journal of Financial Economics 3, 305-360.
Kestens K, Van Cauwenberge P, Bauwhede HV, 2011. Trade credit and company performance during the 2008 financial crisis. Accounting & Finance. doi: 10.1111/j.1467-629X.2011.00452.x.
Kim YH, Atkins JC, 1978. Evaluating Investments in Accounts Receivable: A Wealth Maximising Framework. Journal of Finance 33, 403-412.
La Porta R, Lopez-de-Silanes F, Shleifer A, Vishny R, 1998. Law and finance. Journal of Political Economy 106, 1113–55.
La Porta R, Lopez-de-Silanes F, Shleifer A, Vishny R, 2002. Investor Protection and Corporate Valuation. Journal of finance 57, 1147-1170.
Lang LH, Stulz RM, 1994. Tobin´s q, Corporate Diversification, and Firm Performance. Journal of Political Economy 102, 1248-1280.
Lee YW, Stowe JD, 1993. Product risk, asymmetric information, and trade credit. Journal of Financial and Quantitative analysis 28, 285-300.
Lewellen WG, McConnell JJ, Scott JA, 1980. Capital market influences on trade credit policies. Journal of Financial Research 2, 105-113.
Lins KV, 2003. Equity Ownership and firm value in emerging markets. Journal of Financial and Quantitative Anaysis 38, 159-184.
Long MS, Malitz IB, Ravid SA, 1993. Trade Credit, Quality Guarantees, and Product Marketability. Financial Management 22, 117-127.
Marotta G, 2001. Is trade credit more expensive than bank loans? Evidence form Italian firm-level data. Working Paper (Universit`a di Modena e Reggio Emilia).
Maury B, Pajuste A, 2005. Multiple large shareholders and firm value. Journal of Banking and Finance 29, 1813–1834.
McConnell JJ, Servaes H, 1990. Additional evidence on equity ownership and corporate value. Journal of financial Economics 27, 595-613.
Meltzer AH, 1960. Mercantile Credit, Monetary Policy, and Size of Firms. The Review of Economics and Statistics 42, 429-437.

22
Mian S, Smith C, 1992. Accounts receivable management policy: theory and evidence, Journal of Finance 47, 167–200.
Modigliani F, Miller MH, 1963. Corporate Income taxes and the cost of capital: A correction. American Economic Review 53, 433-443.
Myers S, 1977. Determinants of corporate borrowing. Journal of Financial Economics 5, 147– 175.
Nadiri NI, 1969. The determinants of trade credit terms in the U.S. total manufacturing sector. Econometrica 37, 408-423.
Ng CK, Smith JK, Smith RL, 1999. Evidence on the determinants of credit terms used in interfirm trade. Journal of Finance 54, 1109–1129.
Nilsen JH, 2002. Trade Credit and the Bank Lending Channel. Journal of Money, Credit and Banking 34, 226-253.
Niskanen J, Niskanen M, 2006. The determinants of corporate trade credit policies in a bank-dominated financial environment: the case of Finnish small firms. European Financial Management 12, 81–102.
Oh JS, 1976. Opportunity cost in the evaluation of investment in accounts receivable. Financial Management 5, 32-36.
Perfect SB, Wiles KW, 1994. Alternative constructions of Tobin's q: An empirical comparation. Journal of Empirical Finance 1, 313-341.
Petersen MA, Rajan RG, 1997. Trade credit: theories and evidence. Review of Financial Studies 10, 661-691.
Pike R, Cheng NS, 2001. Credit management: an examination of policy choices, practices and late payment in UK companies. Journal of Business Finance & Accounting 28, 1013–1042.
Pike R, Cheng NS, Cravens K, Lamminmaki D, 2005. Trade credits terms: asymmetric information and price discrimination evidence from three continents. Journal of Business Finance & Accounting 32, 1197–1236.
Scherr FC, Hulburt HM, 2001. The debt maturity structure of small firms. Financial Management 30, 85-111.
Schwartz RA, 1974. An economic model of trade credit. Journal of Financial and Quantitative Analysis 9, 643-657.
Smith C, Watts R, 1992. The Investment Opportunity Set and Corporate Financing, Dividend, and Compensation Policies. Journal of Financial Economics 32, 263-292.
Smith JK, 1987. Trade Credit and Informational Asymmetry. Journal of Finance 42, 863-872.
Stulz RM, 1990. Managerial Discretion and optimal financing policies. Journal of Financial Economics 26, 3-27.
Tong Z, 2008. Deviations from optimal CEO ownership and firm value. Journal of Banking & Finance 32, 2462–2470.
Wilner BS, 2000. The exploitation of relationship in financial distress: the case of trade credit. Journal of Finance 55, 153–178.
Yang J, Min I, Li Q, 2003. European Stock Market Integration: Does EMU Matter?. Journal of Business Finance & Accounting 30, 1253-1276.

ecserie
IvieGuardia Civil, 22 - Esc. 2, 1º
46020 Valencia - SpainPhone: +34 963 190 050Fax: +34 963 190 055
Website: http://www.ivie.esE-mail: [email protected]