03 - crop protection · crop protection gk 04/08: determination of economic threshold values for...
TRANSCRIPT
CROP PROTECTION
GK 04/08: DETERMINATION OF ECONOMIC THRESHOLD VALUES FOR FUNGICIDE APPLICATION ON WHEAT
PROGRESS REPORT APRIL 2012 – MARCH 2013
1. Project detail Number: GK 04/08 Title: Determination of economic threshold values for fungicide application on wheat Duration: 1992 - 2015 Status: Continuation of existing project Project leader: Dr Tarekegn Terefe
2. Objectives 2.1 Long-term objective The long-term objective of this project is to quantify the efficacy and economic impact of fungicide application to wheat in the Western Cape production region. 2.2 Objectives for April 2012 – March 2013 To determine the efficacy of fungicides applied to two cultivars for the control of fungal diseases. To determine the effect of timing of fungicide application (tillering and flag leaf or flag leaf and heading
stage) on yields of two cultivars. To determine factors that influences the successful chemical control of fungal diseases. To determine the effect of diseases on yield and hectolitre mass. To compile guidelines for chemical disease control. 3. Report on the objectives: April 2012 - March 2013 Diseases are important biotic factors, which can limit wheat productivity in South Africa. Fungal diseases such as leaf and stem rusts are commonly found In the Western Cape. In some seasons, these diseases can reach epidemic levels, thereby severely affecting yield and quality of wheat. Major disease control strategies include genetic resistance and application of fungicides. Identification of effective fungicides, the use thereof and application timing are essential for the profitable control of wheat diseases. To determine the response of two cultivars to fungicide application at different wheat growth stages, field experiments were conducted during the 2012 season at Tygerhoek (in the Rûens) and Langgewens (Swartland), Western Cape. The experimental design was a randomised complete block with four replications. The two cultivars evaluated in this study were SST 88 (susceptible to stem and leaf rust and moderately resistant to stripe rust) and SST 056 (moderately susceptible to stem rust, moderately resistant to leaf rust and stripe rust). Seeds of these cultivars were planted on plots consisting of seven rows (7m long and 30 cm inter-row spacing). Fungicides including Artea (500 ml/ha), Duett (1000 ml/ha), Folicur (825 ml/ha), Prosaro (400 ml/ha) and Tebuconazole (825 ml/ha) were sprayed to each cultivar at two timings of applications. First window of application was at tillering and flag leaf growth stages, and the second window of application was at flag leaf and heading stages. Control plots were not treated with any of the fungicides.

At Langgewens, leaf rust was observed on all plots of SST 88 with average severity of over 50% on the fungicide untreated plots. Leaf rust infection on most plots of SST 056 was low (< 10% severity). At Tygerhoek, up to 80% leaf rust severity was recorded from fungicide untreated plots of SST 88. However, leaf rust started to develop at this locality later (post anthesis growth stage) than at Langgewens. Leaf rust severity on SST 056 at Tygerhoek was mostly less than 5%. Trace levels of stem rust, powdery mildew and Septoria leaf blotca h were observed on few plots of the two cultivars at both localities. Results indicated that leaf rust severity was higher at Tygerhoek than at Langgewens, SST 88 was more susceptible to the common disese (leaf rust) than SST 056, and untreated plots had generally higher disease severity than fungicide treated plots. 4. Results obtained in 2012 4.1 Yield 4.1.1 Langgewens At Langgewens, fungicides Artea, Duett, Folicur and Tebuconazole applied to SST 88 at tillering and flag leaf stages resulted in a significantly higher yield than the untreated control (Table 1). There was no significant difference among these four fungicides on the yield of SST 88. Generally, higher yields were obtained from fungicide applications at tillering and flag leaf stages (earlier window of application) than at flag leaf and heading (later window of application). Except for Artea and Tebuconazole applied at tillering and flag leaf stages, the remaining treatments did not significantly differ in their effect on yield of SST 056. Although SST 056 showed a significant response to two fungicides, its yield response was lower than for SST 88, suggesting that fungicide application benefited SST 88 more than SST 056.The highest yield of SST 88 (3.255 ton/ha) was recorded where Folicur was applied at tillering and flag leaf stages. This yield gain was nearly 1 ton/ha higher than for the untreated control. These results indicate that when fungicides are applied, greater yield increase occurs to susceptible cultivars than to resistant cultivars. 4.1.2 Tygerhoek At Tygerhoek, early application (at tillering and flag leaf stages) of Duett and later application (flag leaf and heading) of Artea, Prosaro and Tebuconazole significantly increased the yield of SST 88 over the untreated control (Table 2). At this locality, SST 88 benefited more from later applications at flag leaf and heading stages. This is in contrast to the result at Langgewens, where early application at tillering and flag leaf stages resulted in a higher yield. Leaf rust and other diseases developed at Tygerhoek later (after anthesis) than at Langgewens. This could be partly the reason why SST 88 responded well to later fungicide applications. This also means that farmers need to regularly monitor their wheat fields and apply fungicides to susceptible cultivars only when the target diseases are present. The highest yield of SST 88 at Tygerhoek (2.747 ton/ha) was obtained when Tebuconazole was applied at flag leaf and heading stages. This translates to a yield increase of 0.843 ton/ha over the untreated control. For SST 056, there was no significant yield difference between the control and the remaining treatments at Tygerhoek (Table 2). As described above, the low response of SST 056 to fungicide application is attributed largely to its resistance to leaf rust and other diseases. From results of studies conducted at the two localities, it is concluded that fungicides can significantly increase the yield of wheat by effectively reducing disease development on susceptible cultivars. However, the degree of yield increase achieved, depended mainly on the fungicides used. Treatments that resulted in the best yield return, can be utilized by wheat producers whenever they plant susceptible cultivars.
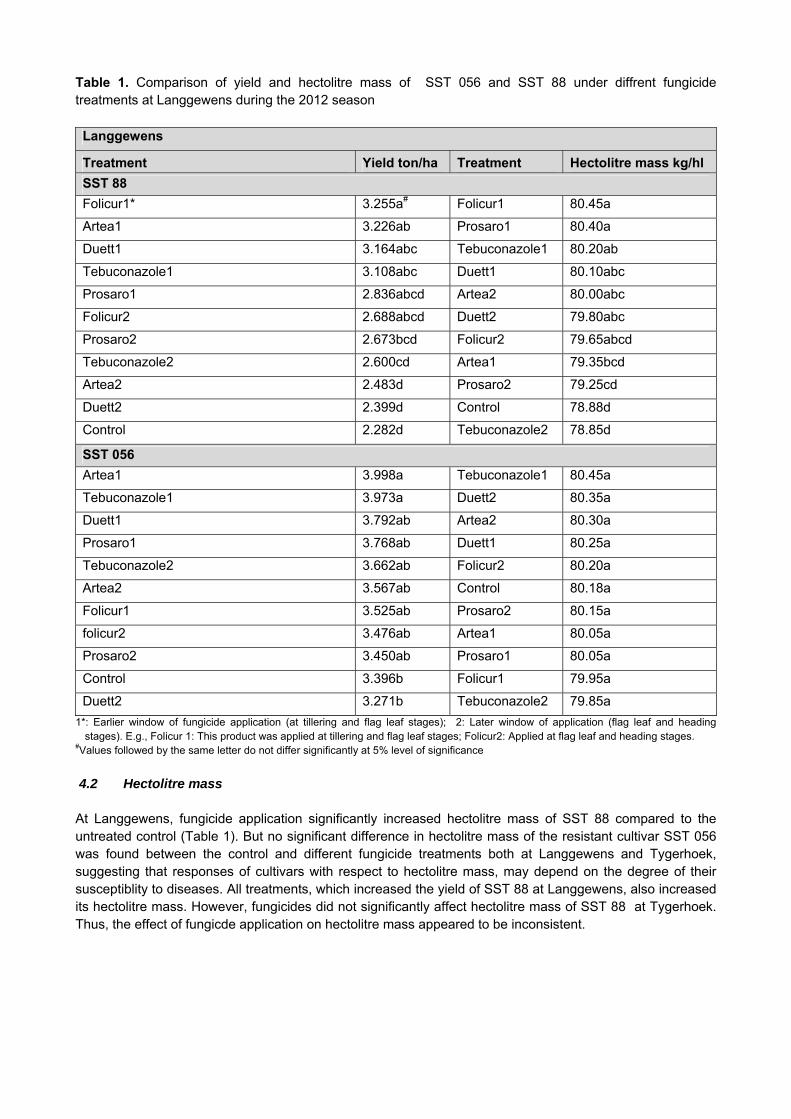
Table 1. Comparison of yield and hectolitre mass of SST 056 and SST 88 under diffrent fungicide treatments at Langgewens during the 2012 season Langgewens
Treatment Yield ton/ha Treatment Hectolitre mass kg/hl
SST 88
Folicur1* 3.255a# Folicur1 80.45a
Artea1 3.226ab Prosaro1 80.40a
Duett1 3.164abc Tebuconazole1 80.20ab
Tebuconazole1 3.108abc Duett1 80.10abc
Prosaro1 2.836abcd Artea2 80.00abc
Folicur2 2.688abcd Duett2 79.80abc
Prosaro2 2.673bcd Folicur2 79.65abcd
Tebuconazole2 2.600cd Artea1 79.35bcd
Artea2 2.483d Prosaro2 79.25cd
Duett2 2.399d Control 78.88d
Control 2.282d Tebuconazole2 78.85d
SST 056
Artea1 3.998a Tebuconazole1 80.45a
Tebuconazole1 3.973a Duett2 80.35a
Duett1 3.792ab Artea2 80.30a
Prosaro1 3.768ab Duett1 80.25a
Tebuconazole2 3.662ab Folicur2 80.20a
Artea2 3.567ab Control 80.18a
Folicur1 3.525ab Prosaro2 80.15a
folicur2 3.476ab Artea1 80.05a
Prosaro2 3.450ab Prosaro1 80.05a
Control 3.396b Folicur1 79.95a
Duett2 3.271b Tebuconazole2 79.85a
1*: Earlier window of fungicide application (at tillering and flag leaf stages); 2: Later window of application (flag leaf and heading stages). E.g., Folicur 1: This product was applied at tillering and flag leaf stages; Folicur2: Applied at flag leaf and heading stages.
#Values followed by the same letter do not differ significantly at 5% level of significance
4.2 Hectolitre mass At Langgewens, fungicide application significantly increased hectolitre mass of SST 88 compared to the untreated control (Table 1). But no significant difference in hectolitre mass of the resistant cultivar SST 056 was found between the control and different fungicide treatments both at Langgewens and Tygerhoek, suggesting that responses of cultivars with respect to hectolitre mass, may depend on the degree of their susceptiblity to diseases. All treatments, which increased the yield of SST 88 at Langgewens, also increased its hectolitre mass. However, fungicides did not significantly affect hectolitre mass of SST 88 at Tygerhoek. Thus, the effect of fungicde application on hectolitre mass appeared to be inconsistent.

Table 2. Comparison of yield and hectolitre mass of SST 056 and SST 88 under diffrent fungicide treatments at Tygerhoek during the 2012 season
Tygerhoek
Treatment Yield ton/ha Treatment Hectolitre mass kg/hl
SST 88
Tebuconazole2* 2.747a# Folicur1 79.60a
Duett1 2.731a Artea2 79.50a
Artea2 2.563ab Tebuconazole1 79.30ab
Prosaro2 2.553ab Tebuconazole2 79.25ab
Duett2 2.492abc Folicur2 79.15ab
Artea1 2.393abcd Prosaro1 79.10ab
Prosaro1 2.311abcd Control 78.85ab
Tebuconazole1 2.210bcd Duett1 78.60ab
Folicur1 2.140bcd Artea1 78.60ab
Control 2.007cd Duett2 78.45ab
Folicur2 1.904d Prosaro2 78.00b
SST 056
Prosaro2 2.964a Prosaro2 77.55a
Tebuconazole2 2.910ab Artea2 77.00ab
Artea1 2.776abc Tebuconazole2 76.90ab
Control 2.691abc Prosaro1 76.90ab
Duett1 2.684abc Folicur2 76.80ab
Artea2 2.657abc Tebuconazole1 76.80ab
Flicur2 2.578abc Folicur1 76.75ab
Duett2 2.522abc Artea1 76.75ab
Prosaro1 2.491abc Control 76.55ab
Tebuconazole1 2.418bc Duett2 76.40ab
Folicur1 2.360c Duett1 76.00b
*1: Earlier window of fungicide application (at tillering and flag leaf stages); 2: Later window of application (flag leaf and heading stages). E.g., Folicur 1: This product was applied at tillering and flag leaf stages; Folicur2: Applied at flag leaf and heading stages.
#Values followed by the same letter do not differ significantly at 5% level of significance
5. Future of the project The trials will be planted during the 2013/2014 season with the following short term objectives: To determine the efficacy of five fungicides (Folicur, Tebuconazole, Duett, Prosaro and Artea), applied to
two cultivars (SST 88 and SST 056) for the control of fungal diseases. To determine the effect of timing of fungicide application (tillering/flag leaf or flag leaf/ heading stage) on
the yield of two cultivars. To determine factors that influences the successful chemical control of fungal diseases. To determine the effect of diseases on yield and hectolitre mass. To compile guidelines for chemical disease control.

GK 04/08: DETERMINATION OF ECONOMIC THRESHOLD VALUES FOR FUNGICIDE APPLICATION ON WHEAT
PROGRESS REPORT APRIL 2012 – MARCH 2013
Summary Number: GK 04/08 Title: Determination of economic threshold values for fungicide application on wheat Duration: 1992 - 2015 Status: Continuation of the existing project Project leader: Dr Tarekegn Terefe
Diseases are important biotic factors that can limit wheat productivity in South Africa. Fungal diseases, such as leaf and stem rust, are commonly found In the Western Cape. In some seasons, these diseases can reach epidemic levels, thereby severely affecting the yield and quality of wheat. Genetic resistance and fungicides are widely used to control wheat diseases. To determine the response of two cultivars to fungicide applications at different wheat growth stages, field experiments were conducted during the 2012 season at Tygerhoek (in the Rûens) and Langgewens (Swartland), Western Cape. At Langgewens, leaf rust was observed on all plots of SST 88 with average severity of over 50% on the fungicide untreated plots. Leaf rust severity on most plots of SST 056 was < 10%. Although up to 80% leaf rust severity was recorded from fungicide untreated plots of SST 88 at Tygerhoek, this disease developed at this locality later than at Langgewens. Leaf rust severity on SST 056 at Tygerhoek was mostly less than 5%. Trace levels of stem rust, powdery mildew and Septoria leaf blotch were observed on a few plots of the two cultivars at both localities. Results indicated that disease severity was higher at Tygerhoek than at Langgewens, SST 88 was more susceptible to the common disease (leaf rust) than SST 056 and untreated plots had generally higher disease severity than fungicide treated plots. Fungicide applications at tillering and flag leaf stages significantly increased the yield of SST 88 at Langgewens. Generally, higher yields were obtained from fungicide applications at tillering and flag leaf stages (earlier window of application) than at flag leaf and heading (later window of application). Except for Artea and Tebuconazole applied at tillering and flag leaf stages, the yield of SST 056 with other treatments, did not significantly differ from the control. Yield response due to fungicide application was higher for SST 88 than for SST 056. The highest yield of SST 88 (3.255 ton/ha) was recorded at Langgewens where Folicur was applied at tillering and flag leaf stages. This yield gain was nearly 1 ton/ha higher than for the untreated control. Also at Tygerhoek, fungicides significantly increased the yield of SST 88 but for SST 056, yields from the control and fungicide treatments were not significantly different. At this locality, SST 88 benefited more from later applications. This is in contrast to the results at Langgewens, where early application at tillering and flag leaf stages gave better yield. This variation in response of SST 88, between the two localities, can be attributed to differences in the time of disease onset. The highest yield of SST 88 at Tygerhoek (2.747 ton/ha) was obtained when Tebuconazole was applied at flag leaf and heading stages. This translates to a yield increase of 0.843 ton/ha over the control. From these results, it is concluded that fungicides can significantly increase the yield of wheat by effectively reducing disease development on susceptible cultivars. Treatments that resulted in the best yield return, can be utilized by wheat producers whenever they plant susceptible cultivars. At Langgewens, fungicide application, compared to the untreated control, significantly increased the hectolitre mass of SST 88. But no significant difference in the hectolitre mass of SST 056 was found between the control and different fungicde treatments both at Langgewens and Tygerhoek, suggesting that responses of cultivars with respect to hectolitre mass may depend on the degree of their susceptiblity to diseases. All treatments that increased the yield of SST 88 at Langgewens, also increased it’s hectolitre mass. However, fungicides did not significantly affect hectolitre mass of SST 88 at Tygerhoek. Thus, the effect of fungicde application on hectolitre mass appeared to be inconsistent.

GK 04/19: MONITOR RUST OCCURRENCE IN THE WHEAT PRODUCTION AREAS PROGRESS REPORT APRIL 2012 - MARCH 2013
1. Project details Number: GK04/19 Title: Monitor rust occurrence in the wheat production areas Duration: Ongoing Status: Continuation of existing project Project leader: Dr Tarekegn Terefe 2. Objectives 2.1 Long-term objectives
To determine the frequency and distribution of leaf, yellow and stem rust races in major wheat
production areas of South Africa. To detect possible new races of leaf yellow and stem rust races in wheat producing areas of South Africa To maintain races of leaf, yellow and stem rust of wheat in a viable condition. To maintain differential wheat lines used in rust race analysis. 2.2 Short term objectives
Include newly released wheat cultivars of the Small Grain Institute and other institutions in the trap
nursery. Send out trap nurseries to co-workers. Upkeep of rust races. Multiply relevant rust races and supply to breeders and pathologists. Conduct rust surveys during the growing season. Collect and process rust samples from trap nurseries and commercial wheat fields. 3. Report on these objectives of April 2012 to March 2013 The three wheat rusts namely stem rust, caused by Puccinia graminis f. sp. tritici, leaf rust (Puccinia triticina) and yellow rust (Puccinia striiformis f. sp. tritici) are important diseases of bread wheat in South Africa. Despite the frequent emergence of new races, which can overcome race-specific resistance genes, resistant cultivars remain important in controlling wheat rusts. Monitoring the population of rust pathogens is essential to detect new races and identify sources of resistance. Thus, the main objective of this project is to continually monitor virulence changes in the population of the three rust diseases of wheat. The present survey was conducted throughout the major wheat growing regions, to determine occurrence and distribution of races of wheat rusts in South Africa during 2012. Trap nurseries planted at 23 localities in the major wheat growing regions (Free State, KwaZulu-Natal, Eastern, Northern and Western Cape) (Table 1), experimental plots of breeders and commercial wheat fields were visited at least two times during the growing season and samples of infected plants were collected to conduct race analysis using seedlings of standard differential lines listed in Table 2.
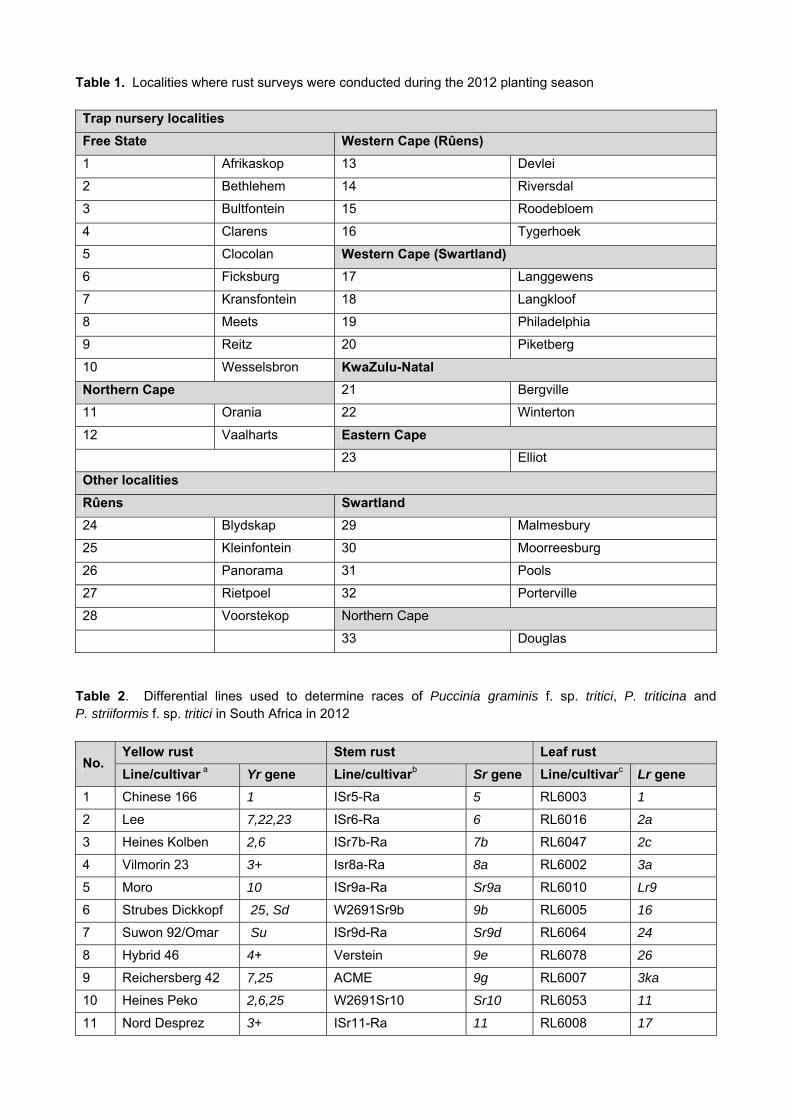
Table 1. Localities where rust surveys were conducted during the 2012 planting season Trap nursery localities
Free State Western Cape (Rûens)
1 Afrikaskop 13 Devlei
2 Bethlehem 14 Riversdal
3 Bultfontein 15 Roodebloem
4 Clarens 16 Tygerhoek
5 Clocolan Western Cape (Swartland)
6 Ficksburg 17 Langgewens
7 Kransfontein 18 Langkloof
8 Meets 19 Philadelphia
9 Reitz 20 Piketberg
10 Wesselsbron KwaZulu-Natal
Northern Cape 21 Bergville
11 Orania 22 Winterton
12 Vaalharts Eastern Cape
23 Elliot
Other localities
Rûens Swartland
24 Blydskap 29 Malmesbury
25 Kleinfontein 30 Moorreesburg
26 Panorama 31 Pools
27 Rietpoel 32 Porterville
28 Voorstekop Northern Cape
33 Douglas
Table 2. Differential lines used to determine races of Puccinia graminis f. sp. tritici, P. triticina and P. striiformis f. sp. tritici in South Africa in 2012
No. Yellow rust Stem rust Leaf rust
Line/cultivar a Yr gene Line/cultivarb Sr gene Line/cultivarc Lr gene
1 Chinese 166 1 ISr5-Ra 5 RL6003 1
2 Lee 7,22,23 ISr6-Ra 6 RL6016 2a
3 Heines Kolben 2,6 ISr7b-Ra 7b RL6047 2c
4 Vilmorin 23 3+ Isr8a-Ra 8a RL6002 3a
5 Moro 10 ISr9a-Ra Sr9a RL6010 Lr9
6 Strubes Dickkopf 25, Sd W2691Sr9b 9b RL6005 16
7 Suwon 92/Omar Su ISr9d-Ra Sr9d RL6064 24
8 Hybrid 46 4+ Verstein 9e RL6078 26
9 Reichersberg 42 7,25 ACME 9g RL6007 3ka
10 Heines Peko 2,6,25 W2691Sr10 Sr10 RL6053 11
11 Nord Desprez 3+ ISr11-Ra 11 RL6008 17

No. Yellow rust Stem rust Leaf rust
Line/cultivar a Yr gene Line/cultivarb Sr gene Line/cultivarc Lr gene
12 Compair 8+ Renown 17 RL6049 30
13 Carstens V 25,32,Cv Cns_T_mono_deriv 21 RL6051 LrB
14 Spaldings Prolific 25, Sp Festiguay 30 RL6004 10
15 Heines VII 2,25 W2691SrTt-1 36 RL6013 14a
16 Clement 2,9 CnsSrTmp Tmp RL6009 Lr18
17 Triticum spelta lb
5 LcSr24Ag 24 RL6019 2b
18 Kalyansona 2 Sr31/6*LMPG 31 RL6042 3bg
19 Yr9/*6 Avocet S 9 VPM1 38 RL6052 15
20 Yr10/*6 Avocet S 10 McNair 701 McN TcLr20 20
21 Yr15/*6 Avocet S 15 Barletta benvenuto 8b Thatcher Susceptible
22 Yr17/6*Avocet S 17 Coorong triticale 27
23 Yr24/6*Avocet S 24 Agropyron i t di
44
24 Yr26/6*Avocet S 26 Kiewiet triticale Kw
25 Selkirk 27 Satu triticale Satu
26 Avocet R A
27 Avocet S Susceptible aThe first 14 lines represent the standard world and European differential set and the remaining lines are used as a supplement to the
standard differential lines. bThe first 20 lines are the standard stem rust differential lines and the next five were used as a supplemental set. cThe first 12 lines are the standard leaf rust differential set and the remaining eight lines were additional testers.
Stem rust Stem rust was found in the majority of localities surveyed in the Western Cape in 2012. High severity (>40%) of this disease was noted on a few susceptible cultivars at localities such as Riversdal and Philadelphia. Its severity in the remaining localities was mostly low. Stem rust incidence in the Western Cape was higher in 2012 than in 2011. No stem rust was detected in any localities surveyed in the Free State, Eastern Cape, Northern Cape and KwaZulu-Natal. Also in previous surveys, stem rust was only observed occasionally in these regions as compared with the Western Cape, where it was detected more frequently. A total of 122 stem rust samples were collected and three races were identified from 91 isolates pathotyped (Table 3). The predominant race was 2SA88 (+Sr9e, +Sr38) followed by 2SA105 (+Sr27,+SrKw,+SrSatu). These two races were also most commonly detected during the preceding seasons. Race 2SA88 (member of the Ug99 race group) dominated the stem rust race population in South Africa during the past 12 years, probably due to its broad virulence and the commercial production of susceptible cultivars, in particular in the Western Cape, where stem rust regularly occurs. Race 2SA105 has been commonly found since 2005, mostly on triticale cultivars. So far, this race has been found only in the Western and Eastern Cape. Race 2SA105 and 2SA104 are similar in their virulence profile on the short differential lines, except that 2SA105 is virulent on the triticale cultivar Satu (SrSatu).

Table 3. Avirulence and virulence of races of Puccinia graminis f. sp. tritici collected from different localities in South Africa during 2012
aNorth American notation: races are named using letter codes based on their virulence pattern on differential lines.
In addition to 2SA88, Ug99 variants known in South Africa include 2SA88+ (+Sr9e, +Sr38, + wheat cv. Matlabas), 2SA106 (+Sr9e, +Sr24 +Sr38) and 2SA107 (+Sr9e, +Sr24 +Sr31, +Sr38). Race 2SA106 was first identified in South Africa in 2007 and it was occasionally found from 2008 to 2010 in the Western Cape. Race 2SA107 was first detected in 2009 and then again in 2010. Race 2SA88+ was first identified in 2010 at Afrikaskop, Free State. Races 2SA88+ and 2SA88 had similar virulence/avirulence profiles except that 2SA88+ was virulent on the wheat cultivar Matlabas, but 2SA88 was not. All three these members of the Ug99 race group were not found during surveys conducted in 2011. Samples from the 2012 survey that have been processed thus far, were also negative for these races. Resistance genes Sr13, 14, 22, 25, 26, 29, 32, 33, 35, 36, 37, 39, 42, 43 and Tmp are effective against current stem rust races in South Africa. They are, therefore, potentially useful for breeding resistant cultivars. Leaf rust Leaf rust was observed in most localities surveyed in the Western Cape. In some localities (e.g., Langkloof, Langgewens, Devlei, Tygerhoek, Roodebloem and Riversdal) higher than 40% leaf rust severity was recorded on susceptible cultivars. In the remaining localities, low (< 20%) to moderate (20-40%) leaf rust infections were detected. In the Free State, leaf rust was found at six of the ten trap localities. But its severity in these localities was mostly less than 10%. No leaf rust was observed in any of eight farmers’ fields surveyed in the Free State. In the Eastern Cape, low to high leaf rust incidence was noted on trap entries and farmers’ fields in Elliot. Leaf rust was not found in any of localities visited in KwaZulu-Natal and the Northern Cape. A higher severity of leaf rust was observed in the Western Cape than in the rest of the wheat growing areas. One hundred and fifty five leaf rust samples were collected in 2012 and five races were identified from 78 isolates pathotyped (Table 4). The most prevalent races were 3SA145 and 3SA146. These two races are relatively new in South Africa, as they were first identified in 2009 and 2010, respectively. Both are virulent on the adult plant resistance (APR) genes Lr12, Lr13 and Lr37. The frequency of 3SA145 has increased from 29% in 2010 to over 65% in 2012. However, its distribution is largely limited to the Western Cape. Similar to 3SA145, race 3SA146 is virulent on the APR genes Lr12, Lr13 and Lr37. But the two races differ in virulence on at least four resistance genes. During the past three years, race 3SA146 has been found in the Free State, Eastern Cape and KwaZulu-Natal but not in the Western Cape. Virulence and genetic studies suggested that both 3SA145 and 3SA146 most probably entered South Africa as exotic introductions. From other races detected in 2012, 3SA147 was recently identified in 2010 in Western Cape. It is similar to a previously known race 3SA124, but the former is virulent on Lr3bg. This suggests that 3SA147 might have developed from 3SA124 through a single-step mutation. Race 3SA144 was first detected in 2005 and it has occasionally been detected on triticale in the Western Cape during the past four years. This race is virulent on resistance gene Lr32, which distinguishes it from existing races. Race 3SA133 is one of the oldest races and it has been predominant for more than 20 years. Its frequency significantly decreased from 2010 onwards, probably due to a change in susceptibility of cultivars grown by commercial farmers. The following
Race NA
notationa
Avirulence/virulence formula
Frequency (%)
2SA88 TTKSF Sr24,27,31,36,44,Kw,Satu,Tmp/5,6,7b,8a,8b,9a,9b,9d,9e,9g,10, 11,17,21,30,38,McN
75.8
2SA105 BPGSC Sr5,6,7b,8b,9e,17,21,24,30,31,36,38,Tmp/8a,9a,9b,9d,9g,10,11,27,44,Kw,Satu,McN
18.7
2SA104 BPGSC Sr5,6,7b,8b,9e,17,21,24,30,31,36,38,Satu,Tmp/8a,9a,9b,9d,9g, 10,11,27,44,Kw,McN
5.5

are some resistance genes that are effective against current leaf rust races in South Africa: Lr9, 19, 21, 22a, 23, 25, 28, 29, 34, 35, 36, 38, 45, 47, 50, 51 and 52. Table 4. Avirulence and virulence of races of Puccinia triticina collected from different localities in South Africa during 2012
Race Avirulence/virulence formula Frequency (%)
3SA145 1, 2a, 2b, 2c, 9, 11, 16, 18, 24/ 3a, 3bg, 3ka, 10, 14a, 15, 17, 20, 26, 30, B 65.4
3SA146 2a, 2b, 2c, 3ka,9, 11, 16, 18, 20, 24,30/1, 3a, 3bg, 10, 14a, 15, 17, 26, B 28.2
3SA144 3a, 3bg, 3ka, 9, 10, 11, 16, 20, 26, 30/1, 2a, 2b, 2c, 14a, 15, 17, 18, 24, B 2.6
3SA147 1, 2a, 2b, 2c, 9, 11,15,16,17, 24 ,26/3a, 3bg, 3ka, 10, 14a, 18, 20, 30, B 2.6
3SA133 2a, 2b, 9, 15, 16, 17, 26/1, 2c, 3a, 3bg, 3ka, 10, 11, 14a, 18, 20, 24, 30, B 1.3
Yellow rust Yellow rust was detected in many localities in the Free State. Severity of 80% to 90% was detected on several traps entries planted at Reitz, Meets and Kransfontein. Also in Elliot (Eastern Cape), 70-90% yellow rust severity was recorded on many susceptible entries included in the traps. In the Western Cape, this disease was found only in four of 17 localities surveyed. At these four localities, it was detected only on trap entries, not in farmers’ fields and breeders’ plots. In KwaZulu-Natal, moderate amounts of yellow rust was found in one farmers’ field at Winterton, but not in commercial fields or the trap nursery planted in Bergville. No yellow rust infection was recorded in fields inspected in the Northern Cape. Consistent with previous seasons, higher severity of yellow rust was observed in the Free State and Eastern Cape, than in the remaining regions. One hundred and twenty one yellow rust samples were collected in 2012. Two races were identified from 22 samples successfully processed. The predominant race, observed at a frequency of over 75%, was 6E22A+. This race has frequently been found throughout the major wheat growing regions since it was first identified in 2005 in the Free State. Based on a test on a standard differential set and a few supplemental lines, race 6E22A+ is avirulent on Yr1, 3, 4, 5, 9, 10, 15, 24, 26, 27, 32, Cv, Sp and virulent on Yr2, 6, 7, 8, 17, 22, 23, 25, A. The second race 6E22A- was detected in samples collected from the Free State, KwaZulu-Natal, Western and Eastern Cape. It was also found during the previous seasons, mainly in the Western Cape Province. On the common differential lines, 6E22A- differs from 6E22A+ being avirulent on the wheat cultivar Avocet R (YrA). Frequency and distribution of yellow rust races observed in 2012 were generally similar to those observed during the past five years. Thus, resistance genes which have been effective against all races known in South Africa (e.g., Yr3, 4, 5, 9, 10, 15, 24, 26, 27, 32 and Sp), can still be utilized in breeding programmes. To enhance durability of these race-specific resistance genes, it is essential to deploy them in combination with race-nonspecific adult plant resistance genes such as Yr18, 29 and 46. Collaboration with the Borlaug Global Rust Initiative (BGRI) ARC-Small Grain Institute has been collaborating with the BGRI, which was established to organize global research on wheat rusts, particularly on the highly virulent stem rust race Ug99. Scientists from ARC-SGI have been involved actively in various BGRI activities, such as surveillance of the Ug99 race group and screening of wheat germplasm at Njoro, Kenya. During the past six years, hundreds of resistant germplasm have been identified at Njoro and these are being utilized to develop stem rust resistant cultivars in South Africa. During the 2012 season, a total of 176 advanced breeding lines were screened and more than 50% of these entries were resistant to Ugg99 and related races prevalent in East Africa. 4. Objectives April 2013 to March 2014 Include newly released wheat cultivars of Small Grain Institute and other institutions in the trap nursery. Send out trap nurseries to co-workers.
Upkeep of rust races. Multiply relevant rust races and supply to breeders and pathologists. Conduct rust surveys during the growing season. Collect rust samples and determine frequency and distribution of races. 5. Future of the project. The major objective of rust monitoring is to detect virulence changes in wheat rust pathogens. Organized national rust surveys have been conducted by ARC-SGI for more than two decades. Through such surveys, new and virulent races of the three rusts have been discovered constantly. This information has made a significant contribution to the development of resistant and high yielding wheat cultivars over a number of years. Wheat rust pathogens will continue to change their virulence. Thus, rust monitoring and identification of resistance sources should be conducted continuously to ensure sustainable development and availability of resistant cultivars.

GK 04/19: MONITOR RUST OCCURRENCE IN THE WHEAT PRODUCTION AREAS PROGRESS REPORT APRIL 2012 - MARCH 2013
Summary Number: GK04/19 Title: Monitor rust occurrence in the wheat production areas Duration: Ongoing Status: Continuation of existing project Project leader: Dr Tarekegn Terefe Wheat rusts are common diseases of bread wheat in most wheat growing regions of South Africa. Despite the frequent emergence of new races that can overcome race-specific resistance genes, resistant cultivars remain important in controlling wheat rusts. Monitoring the population of wheat rusts is essential to detect new races and identify resistance sources. The present survey was conducted to determine occurrence and distribution of races of leaf, stem and yellow rusts in South Africa during 2012. Trap nurseries planted at 23 localities in the major wheat growing regions (Free State, KwaZulu-Natal, Eastern, Northern and Western Cape) and commercial wheat fields were surveyed at least twice and samples of infected plants were collected to conduct race analysis. Stem rust was found in the majority of localities surveyed in the Western Cape. High severity (>40%) of this disease was noted on susceptible cultivars in localities such as Riversdal and Philadelphia. Its severity in other localities was mostly less than 20%. No stem rust was detected in all localities surveyed in the Free State, Eastern Cape, Northern Cape and KwaZulu-Natal. Also in previous surveys, stem rust was less frequently observed in these regions than in the Western Cape. One hundred and twenty two stem rust samples were collected and three races were identified from 91 isolates pathotyped. The predominant race was 2SA88 (+Sr9e, +Sr38), followed by 2SA105 (+Sr27,+SrKw,+SrSatu). These two races were detected most commonly, also during the preceding seasons. Race 2SA88 (member of the Ug99 race group) dominated the stem rust race population in South Africa during the past 12 years, probably due to its broad virulence and the commercial production of susceptible cultivars, particularly in the Western Cape. Race 2SA105 has been detected commonly since 2005, mostly on triticale cultivars Kiewiet and Tobie. In addition to 2SA88, Ug99 variants known in South Africa include 2SA88+ (+Sr9e, +Sr38, + wheat cv. Matlabas), 2SA106 (+Sr9e, +Sr24 +Sr38) and 2SA107 (+Sr9e, +Sr24 +Sr31, +Sr38). Race 2SA106 was first identified in South Africa in 2007 and it was occasionally found in the Western Cape from 2008 to 2010. Race 2SA107 was first detected in 2009 and then again in 2010. Race 2SA88+ was first identified in 2010 at Afrikaskop, Free State. Race 2SA88+ has a similar virulence/avirulence profile to 2SA88, but differs from the latter being virulent on the wheat cultivar Matlabas. None of these three members of the Ug99 race group were found during surveys conducted in 2011 and 2012. Resistance genes Sr13, 14, 22, 25, 26, 29, 32, 33, 35, 36, 37, 39, 42, 43 and Tmp are effective against current stem rust races in South Africa. They are, therefore, potentially useful for breeding resistant cultivars. Leaf rust was observed in most localities surveyed in the Western Cape. Higher than 40% leaf rust severity was recorded on susceptible cultivars in Langkloof, Langgewens, Devlei, Tygerhoek, Roodebloem and Riversdal. In the remaining localities, low (< 20%) to moderate (20-40%) infections were detected. In the Free State, this disease was found at six of the ten trap localities, but with a severity of less than 10% mostly. No leaf rust was observed in any of the farmers’ fields surveyed in Free State. In the Eastern Cape, low to high leaf rust incidence was noted on trap entries and farmers’ fields in Elliot. Leaf rust was not found in any of the localities visited in KwaZulu-Natal and the Northern Cape. A higher severity of leaf rust was observed in the Western Cape than in the rest of the wheat growing areas.
One hundred and fifty five leaf rust samples were collected in 2012 and five races were identified from 78 isolates pathotyped. The most prevalent races were 3SA145 and 3SA146. These two races are relatively new in South Africa, as they were first identified in 2009 and 2010, respectively. Both are virulent on the adult plant resistance (APR) genes Lr12, Lr13 and Lr37. The frequency of 3SA145 has increased from 29% in 2010 to over 65% in 2012. However, its distribution is largely limited to the Western Cape. Like 3SA145, race 3SA146 is virulent on the APR genes Lr12, Lr13 and Lr37. The two races differ in virulence on at least four resistance genes. During the past three years, race 3SA146 has been found in the Free State, Eastern Cape and KwaZulu-Natal, but not in Western Cape. Virulence and genetic studies suggested that both 3SA145 and 3SA146 most probably entered South Africa as exotic introductions. From other races detected in 2012, 3SA147 was identified in 2010 in the Western Cape. It is similar to a previously known race 3SA124, but the former is virulent on Lr3bg. This suggests that 3SA147 might have developed from 3SA124 through a single-step mutation. Race 3SA144 has occasionally been detected on triticale in the Western Cape during the past four years. This race is virulent on resistance gene Lr32, which distinguishes it from existing races. Race 3SA133 is one of the oldest races and it has been predominant for more than 20 years. Its frequency significantly decreased from 2010 onwards, probably due to a change in susceptibility of cultivars grown by commercial farmers. The following are some resistance genes which are effective against current leaf rust races in South Africa: Lr9, 19, 21, 22a, 23, 25, 28, 29, 34, 35, 36, 38, 45, 47, 50, 51 and 52. Yellow rust was detected in many localities in the Free State. Severity of 80% to 90% was detected on several traps entries in Reitz, Meets and Kransfontein. Also in Elliot (Eastern Cape), 70-90% yellow rust severity was recorded on many susceptible trap entries. In the Western Cape, this disease was found only in four of 17 localities surveyed. At these four localities, it was detected only on trap entries, not in farmers’ fields. In KwaZulu-Natal, a moderate amount of yellow rust was found in one farmers’ field in Winterton, but not in commercial fields or trap nursery planted in Bergville. No yellow rust was observed in fields inspected in the Northern Cape. Consistent with previous seasons, higher severity of yellow rust was observed in the Free State and Eastern Cape than in the remaining regions. One hundred and twenty one yellow rust samples were collected in 2012. Two races were identified from 22 samples processed. The predominant race was 6E22A+. This race has been observed frequently throughout the major wheat growing regions since it was first identified in 2005 in the Free State. The second race 6E22A- was detected in samples collected from the Free State, KwaZulu-Natal, Western and Eastern Cape. It was also found in previous seasons mainly in the Western Cape. On the common differential lines, 6E22A- differs from 6E22A+ being avirulent on the wheat cultivar Avocet R (YrA). Frequency and distribution of yellow rust races observed in 2012 were generally similar to those observed during the past five years. Thus, resistance genes that have been effective against all races known in South Africa (e.g., Yr3, 4, 5, 9, 10, 15, 24, 26, 27, 32 and Sp) can still be utilized in breeding programmes. To enhance durability of these race-specific resistance genes, it is essential to deploy them in combination with race-nonspecific adult plant resistance genes, such as Yr18, 29 and 46. ARC-Small Grain Institute has been collaborating with the Borlaug Global Rust Initiative (BGRI), which was established to organize global research on wheat rusts, particularly on the highly virulent stem rust race Ug99. Scientists from ARC-SGI have been actively involved in various BGRI activities, including surveillance of the Ug99 race group and screening of wheat germplasm at Njoro, Kenya. During the past six years, hundreds of resistant germplasm have been identified at Njoro and these are being utilized to develop stem rust resistant cultivars in South Africa. During the 2012 season, a total of 176 advanced breeding lines were screened and more than 50% of these entries were resistant to Ugg99 and related races prevalent in East Africa.
GK 04/22: THE CONTROL OF KARNAL BUNT PROGRESS REPORT APRIL 2012 – MARCH 2013
1. Project details Number: GK 04/22 Title: The control of Karnal Bunt Duration: Ongoing Status: Continuation of existing project Project leader: Ms Cathy de Villiers 2. Objectives 2.2 Long-term objectives The long-term objectives of the Karnal Bunt programme are as follows: Maintain the Karnal Bunt free status of ARC-Small Grain Institute (ARC-SGI) with all its infrastructure and
facilities. Maintain Karnal Bunt free status of all seed used and produced at ARC-Small Grain Institute. 2.2 Short term objectives: 2012 – 2013 The short-term objectives of the Karnal Bunt program are as follows: Continue with the washing of all seed lots used and produced at the ARC-SGI at the KB Washing Facility
in Bethlehem. Continue to test all seed material from ARC-SGI research stations and collaborators’ fields and all swabs
from harvesters, for the presence of KB teliospores before any material is brought onto ARC-SGI premises.
Investigate the viability of a KB resistance-breeding programme in South Africa, should the quarantine status of the disease be de-regulated in the US.
Be fully informed of the possible de-regulation of KB in the USA, that will also lead to the de-regulation of this disease in South Africa.
Sending of the KB protocol to keep ARC-SGI personnel informed.
3. Report on these objectives from April 2012 – March 2013: Objective 1. Continue with the washing of all seed lots used and produced at ARC-SGI at the KB Washing Facility in Bethlehem. An amount of 715.16kg of trial seed were washed in the Karnal Bunt washing facility during the 2012/2013 season. The washed seedlots assist us in preventing the spread of Karnal Bunt to different localities. The total amount of seed washed from 2005/2006 to 2012/2013 can be seen in Figure 1.
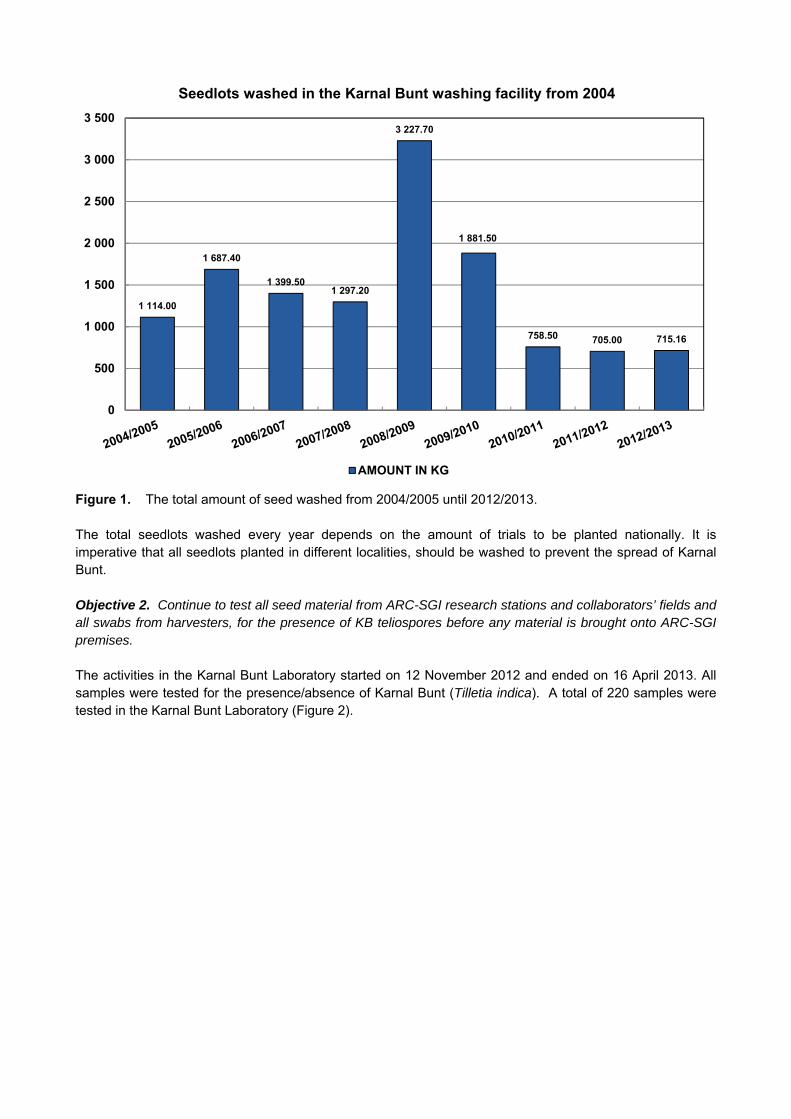
Figure 1. The total amount of seed washed from 2004/2005 until 2012/2013. The total seedlots washed every year depends on the amount of trials to be planted nationally. It is imperative that all seedlots planted in different localities, should be washed to prevent the spread of Karnal Bunt. Objective 2. Continue to test all seed material from ARC-SGI research stations and collaborators’ fields and all swabs from harvesters, for the presence of KB teliospores before any material is brought onto ARC-SGI premises. The activities in the Karnal Bunt Laboratory started on 12 November 2012 and ended on 16 April 2013. All samples were tested for the presence/absence of Karnal Bunt (Tilletia indica). A total of 220 samples were tested in the Karnal Bunt Laboratory (Figure 2).
1 114.00
1 687.40
1 399.501 297.20
3 227.70
1 881.50
758.50 705.00 715.16
0
500
1 000
1 500
2 000
2 500
3 000
3 500
Seedlots washed in the Karnal Bunt washing facility from 2004
AMOUNT IN KG

Total samples tested in the Karnal Bunt Laboratory from 2004
Figure 2. All swab and seed samples tested in the Laboratory from 2004/2005 until 2012/2013. The 2012/2013 samples consisted of 26 swabs and 194 seed samples. The total amount of samples is indicated in the dark blue bar. Objective 3: Investigate the viability of a KB resistance-breeding programme in South Africa, should the quarantine status of the disease be de-regulated in the US. Since Karnal Bunt is not de-regulated, no research can be done. Currently, there are no resistant cultivars with good adaptability to South African conditions therefore producers in South Africa are restricted to the use of chemicals or crop rotation using non-host species, to prevent this disease. The long-term solution for this problem is to use KB resistant lines with good agronomy. As soon as Karnal Bunt is de-regulated in South Africa, all current cultivars will be screened for resistance. If no resistance are present, a resistance-breeding programme will be used to incorporate resistance in local cultivars. Objective 4: Be fully informed of the possible de-regulation of KB in the USA, that will also lead to the de-regulation of this disease in South Africa. Since this disease is a quarantine organism, the progress of any research is hindered until the quarantine status of KB is lifted in South Africa. Therefore, the activities of KB are limited to the testing of seed samples and swabs, as well as the surface sterilizing of all seedlots to be planted. These actions will continue to maintain the KB free status of ARC-SGI. Tilt/Bumper is sprayed during flowering, to reduce infection. The ARC-SGI does not have the mandate to do further KB research, except for the above-mentioned to monitor the KB situation. All information generated is reported to the Divisional Manager of the ARC-Field Crops Division as well as the KB progamme manager at ARC-SGI. Objective 5: Sending of the annual KB protocol to keep ARC-SGI personnel informed. The Karnal Bunt protocol is sent out to all relevant personnel that plant/harvest in a season, to minimise the risk of spreading Karnal Bunt to uninfected areas.
14 18
33
17 13
48
19 24 26
156
126
154
175
146
179 185171
194
170
144
187 192
159
227
204195
220
0
50
100
150
200
250
SWABS SEED TOTAL SAMPLES

4. Objectives for April 2013 - March 2014: Continue with the washing of all seed lots used and produced at ARC-SGI, at the KB Washing Facility in
Bethlehem. Continue to test all seed material from ARC-SGI research stations and collaborators’ fields and all swabs
from harvesters, for the presence of KB teliospores before any material is brought onto ARC-SGI premises.
Investigate the viability of a KB resistance-breeding programme in South Africa, should the quarantine status of the disease be de-regulated in the US.
Be fully informed of the possible de-regulation of KB that will also lead to the de-regulation of this disease in South Africa.
Sending of the KB protocol to keep ARC-SGI personnel informed. 5. Future of the project ARC-SGI will have to limit its activities to the following, due to the current embargo on KB field studies as well as on laboratory investigations in South Africa: The continuation of testing of seed entering or leaving the facility to maintain the KB-free status of ARC-
SGI. The continuation of seed washing and treatment of all seed used in ARC-SGI trials with applicable
fungicides. Being fully informed of the possible de-regulation of KB as a phytosanitary disease in the USA, that could
possibly lead to de-regulation of the disease in South Africa.
GK 04/22: THE CONTROL OF KARNAL BUNT PROGRESS REPORT APRIL 2011 – MARCH 2012
Summary Number: GK 04/22 Title: The control of Karnal Bunt Duration: Ongoing Status: Continuation of existing project Project leader: Cathy de Villiers The objectives for the past year are summarised below: A total of 715.16 kg of trial seed were washed in the Karnal Bunt Washing Facility during the 2012/2013 season. The amount of seed washed is dependent on the amount of trials to be planted nationally. The activities in the Karnal Bunt Laboratory started on 12 November 2012 and ended on 16 April 2013. All samples were evaluated for the presence/absence of Tilletia indica. A total of 220 samples were tested in the Karnal Bunt Laboratory and the samples included seed and swabs. No research on Karnal Bunt can be done, since this disease is not de-regulated in South Africa. Producers in South Africa are restricted to use chemicals or non-host crops to prevent this disease. As it is a quarantine disease, the research activities are limited to test samples and to surface sterilise all seed lots. Fungicides can be used to reduce infection during flowering stage. All information is reported to the Divisional Manager of the ARC-Field Crops Division, as well as the Karnal Bunt programme manager at ARC-SGI. It is of importance that the Karnal Bunt protocol is sent to relevant personnel each year, to minimise the risk of spreading Karnal Bunt.
GK 05/03: EVALUATION OF WHEAT BREEDING MATERIAL FOR RESISTANCE TO RUSSIAN WHEAT APHID, DIURAPHIS NOXIA PROGRESS REPORT APRIL 2012 – MARCH 2013
1. Project details Number: GK 05/03 Title: Evaluation of wheat breeding material for resistance to the Russian wheat aphid,
Diuraphis noxia Duration: Ongoing Status: Continuation of existing project Project leader: Dr Astrid Jankielsohn 2. Objectives 2.1 Long-term objectives The long-term objectives of the evaluation of wheat breeding material for RWA resistance are the following: Examine and characterize Russian wheat aphid (RWA) resistance sources and choose the most suitable
for deployment in cultivars in the field. Support breeding programmes to ensure that effective, Russian wheat aphid resistance is maintained. To screen existing cultivars on the market for Russian wheat aphid resistance.
2.2 Short term objectives: 2012/2013 The short term objectives for the 2012/2013 season were as follows: To identify the broadest RWA biotype resistance by assisting wheat breeders in germplasm screening,
using the most virulent RWA biotypes. To evaluate lines in the breeding programmes in the field and screen other germplasm for RWA
resistance. To screen existing cultivars on the market for Russian wheat aphid resistance. 3. Report on objectives: 2012-2013 Objective 1: To identify the broadest RWA biotype resistance by assisting wheat breeders in germplasm screening using the most virulent RWA biotypes. Plant breeding programmes need to be adaptable to keep pace with the ever changing environmental conditions and the changes in pest virulence as a result. Insect biotypes develop as a result of an arms race between insects and plants. When insects feed on plants, there is a selection pressure by the insects on the plants. The plants need to develop some sort of strategy to survive and this leads to the development of resistant characters in the plant. Consequently, the survival of the insects is reduced and this again results in the development of counter-resistance in the insects. By breeding resistant lines, plant breeders are just speeding up the natural process in favour of the plant, but nature will follow its course and when breeders release a resistant crop, counter-resistance will eventually typically follow. New RWA resistant genes need to be incorporated into the breeding programmes all the time to keep ahead in the race. Resistance traits governed by major dominant genes are not stable over time, while those governed by several genes are more durable. The strategy of building up a combination of genes, each of which contributes only a partial degree of resistance, would in the long-term offer more effective management. Increased genetic diversity in
wheat breeding is desirable for dealing with present and future challenges caused by the need to adapt to changing climate and change in pest dynamics as a result. It does not mean that individual resistance genes lose their power to hold individual biotypes in check. The resistance genes are stable, but new or previously undetected biotypes appear that are not managed by certain resistance genes. If the RWA is being resisted in a number of ways and is rarely completely controlled, the chances of a new biotype emerging are lower. Material and Methods Germplasm was tested in the glasshouse in the seedling stage using the bioassay developed by Du Toit (1988): 1. Germplasm was planted in seedling trays in the glasshouse with 10 seedlings per entry. 2. Seedlings were infested with RWASA2 and RWASA3 at the 2 leaf stage. 3. Seedlings were evaluated for RWA resistance after two weeks. A ten-point damage rating scale
(Tolmay, 1995) was used and the mean rating for ten plants was given with scores of 1,2,3 = highly resistant; 4,5,6 = moderately resistant; 7,8,9 = susceptible and 10 = dead.The mean damage rating was calculated. A general damage assessment was given and the following abbreviations were used: HR = highly resistant; R = resistant; MR = moderately resistant and S = susceptible.
Results and Discussion Lines from the ARC-Small Grain Institute (ARC-SGI) wheat breeding programmes were screened in the glasshouse during 2012, to determine if suitable levels of resistance against the prevailing RWA biotypes exist in these breeding programmes. The Elite, Senior, Junior, Intermediate Elite, Senior and Junior lines of the Winter, as well as the Senior and Elite’s of the Spring Irrigation Breeding Programme were screened in the glasshouse against RWASA2 and RWASA3, to ensure that satisfactory levels of resistance are being used in the Breeding Programmes. In the dryland programmes, between 10 and 20% RWA resistant lines were identified in the glasshouse screening for the Senior, Winter Elite, and Intermediate Elite programmes and 32% for the Junior (EFS), Junior Intermediate and Senior Intermediate Programme (Fig.1). In the Senior Irrigation Programme 5% and in the Elite Programme 11% RWA resistant lines were identified (Fig.1). The percentage resistant lines in the Winter Dryland and the Spring Irrigation Breeding Programmes were low in 2012, compared to the previous years. In view of RWA damage reported on irrigation wheat in 2012, more resistance will be needed in these programmes.
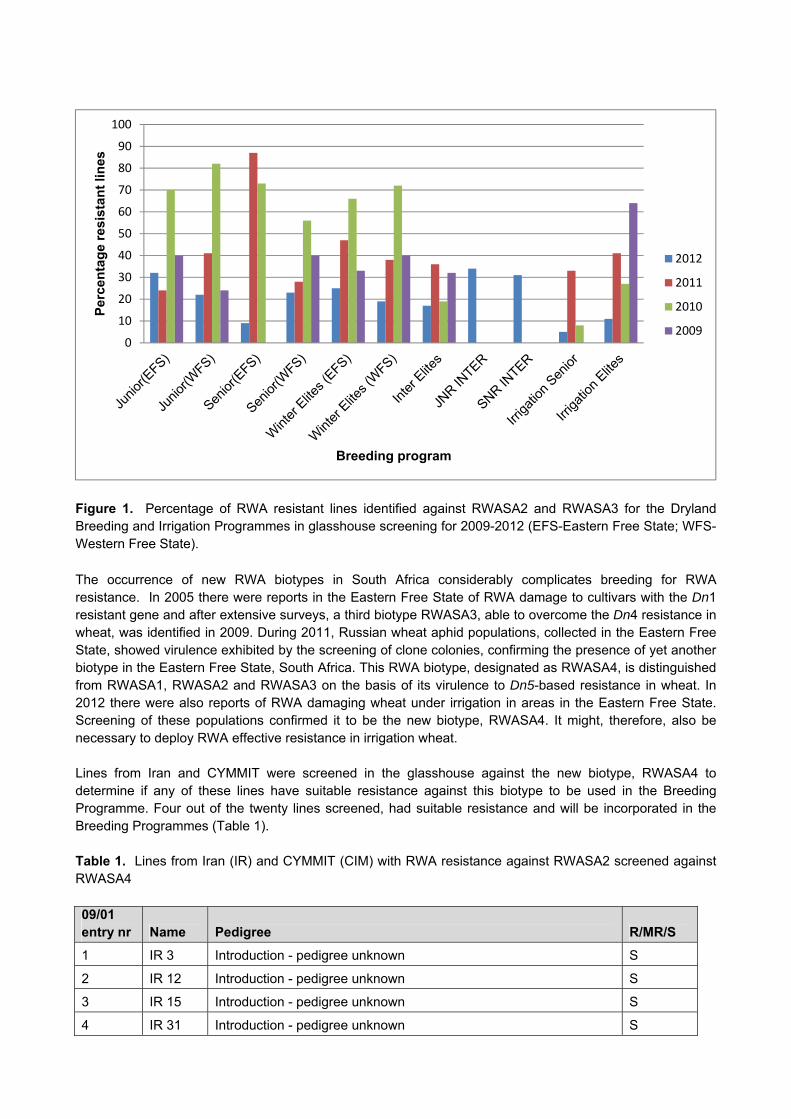
Figure 1. Percentage of RWA resistant lines identified against RWASA2 and RWASA3 for the Dryland Breeding and Irrigation Programmes in glasshouse screening for 2009-2012 (EFS-Eastern Free State; WFS-Western Free State).
The occurrence of new RWA biotypes in South Africa considerably complicates breeding for RWA resistance. In 2005 there were reports in the Eastern Free State of RWA damage to cultivars with the Dn1 resistant gene and after extensive surveys, a third biotype RWASA3, able to overcome the Dn4 resistance in wheat, was identified in 2009. During 2011, Russian wheat aphid populations, collected in the Eastern Free State, showed virulence exhibited by the screening of clone colonies, confirming the presence of yet another biotype in the Eastern Free State, South Africa. This RWA biotype, designated as RWASA4, is distinguished from RWASA1, RWASA2 and RWASA3 on the basis of its virulence to Dn5-based resistance in wheat. In 2012 there were also reports of RWA damaging wheat under irrigation in areas in the Eastern Free State. Screening of these populations confirmed it to be the new biotype, RWASA4. It might, therefore, also be necessary to deploy RWA effective resistance in irrigation wheat. Lines from Iran and CYMMIT were screened in the glasshouse against the new biotype, RWASA4 to determine if any of these lines have suitable resistance against this biotype to be used in the Breeding Programme. Four out of the twenty lines screened, had suitable resistance and will be incorporated in the Breeding Programmes (Table 1). Table 1. Lines from Iran (IR) and CYMMIT (CIM) with RWA resistance against RWASA2 screened against RWASA4 09/01 entry nr Name Pedigree R/MR/S
1 IR 3 Introduction - pedigree unknown S
2 IR 12 Introduction - pedigree unknown S
3 IR 15 Introduction - pedigree unknown S
4 IR 31 Introduction - pedigree unknown S
0
10
20
30
40
50
60
70
80
90
100
Per
cen
tag
e re
sist
ant
lines
Breeding program
2012
2011
2010
2009
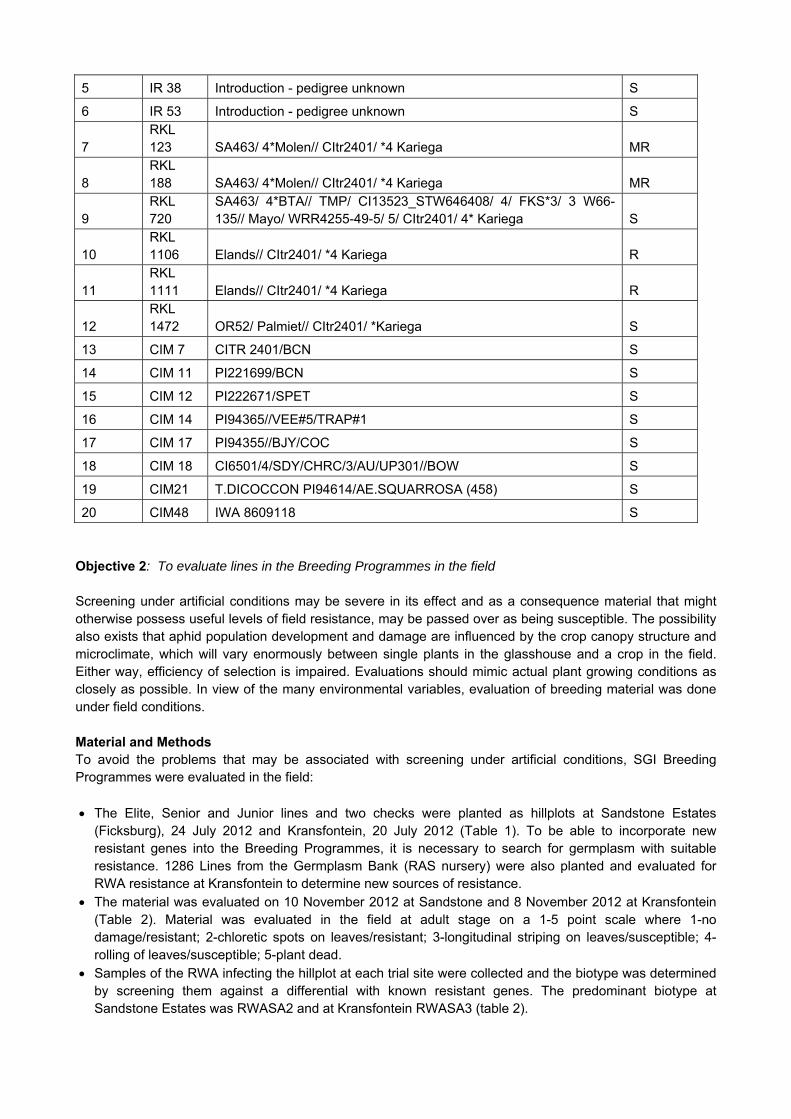
5 IR 38 Introduction - pedigree unknown S
6 IR 53 Introduction - pedigree unknown S
7 RKL 123 SA463/ 4*Molen// CItr2401/ *4 Kariega MR
8 RKL 188 SA463/ 4*Molen// CItr2401/ *4 Kariega MR
9 RKL 720
SA463/ 4*BTA// TMP/ CI13523_STW646408/ 4/ FKS*3/ 3 W66-135// Mayo/ WRR4255-49-5/ 5/ CItr2401/ 4* Kariega S
10 RKL 1106 Elands// CItr2401/ *4 Kariega R
11 RKL 1111 Elands// CItr2401/ *4 Kariega R
12 RKL 1472 OR52/ Palmiet// CItr2401/ *Kariega S
13 CIM 7 CITR 2401/BCN S
14 CIM 11 PI221699/BCN S
15 CIM 12 PI222671/SPET S
16 CIM 14 PI94365//VEE#5/TRAP#1 S
17 CIM 17 PI94355//BJY/COC S
18 CIM 18 CI6501/4/SDY/CHRC/3/AU/UP301//BOW S
19 CIM21 T.DICOCCON PI94614/AE.SQUARROSA (458) S
20 CIM48 IWA 8609118 S Objective 2: To evaluate lines in the Breeding Programmes in the field Screening under artificial conditions may be severe in its effect and as a consequence material that might otherwise possess useful levels of field resistance, may be passed over as being susceptible. The possibility also exists that aphid population development and damage are influenced by the crop canopy structure and microclimate, which will vary enormously between single plants in the glasshouse and a crop in the field. Either way, efficiency of selection is impaired. Evaluations should mimic actual plant growing conditions as closely as possible. In view of the many environmental variables, evaluation of breeding material was done under field conditions. Material and Methods To avoid the problems that may be associated with screening under artificial conditions, SGI Breeding Programmes were evaluated in the field: The Elite, Senior and Junior lines and two checks were planted as hillplots at Sandstone Estates
(Ficksburg), 24 July 2012 and Kransfontein, 20 July 2012 (Table 1). To be able to incorporate new resistant genes into the Breeding Programmes, it is necessary to search for germplasm with suitable resistance. 1286 Lines from the Germplasm Bank (RAS nursery) were also planted and evaluated for RWA resistance at Kransfontein to determine new sources of resistance.
The material was evaluated on 10 November 2012 at Sandstone and 8 November 2012 at Kransfontein (Table 2). Material was evaluated in the field at adult stage on a 1-5 point scale where 1-no damage/resistant; 2-chloretic spots on leaves/resistant; 3-longitudinal striping on leaves/susceptible; 4-rolling of leaves/susceptible; 5-plant dead.
Samples of the RWA infecting the hillplot at each trial site were collected and the biotype was determined by screening them against a differential with known resistant genes. The predominant biotype at Sandstone Estates was RWASA2 and at Kransfontein RWASA3 (table 2).

Table 2. Localities, dates planted and evaluated and predominant biotypes for evaluation trials during 2010, 2011 and 2012
Year Locality Co-ordinates Date planted Date evaluated Biotype
2010 Sandstone S28°50'13.6"E27°59'56.6 16/07/2010 26/10/2010 RWASA3
2011 Sandstone S28°50'13.6"E27°59'56.6 20/07/2011 24/11/2011 RWASA3
2012 Sandstone S28°50'13.6"E27°59'56.6 24/07/2012 10/11/2012 RWASA3
2010 Kransfontein S28°13'35.5"E28°44'23.9 21/07/2010 17/11/2010 RWASA2
2011 Kransfontein S28°13'35.5"E28°44'23.9 19/07/2011 29/11/2011 RWASA2
2012 Kransfontein S28°13'35.5"E28°44'23.9 20/7/2012 8/11/2012 RWASA2
Results and Discussion The dominant biotype where the Winter Breeding material was evaluated, was RWASA3 at Sandstone est. (Ficksburg) and RWASA2 at Kransfontein (table 2). In the dryland programs between 10 and 20% RWA resistant lines were identified in field screening for the Junior and Winter Elite Programmes and 30% for the Senior (EFS) Programme (Fig. 2). During 2012, a higher percentage of resistant lines in the Senior (EFS) and Eliltes (EFS and WFS) Breeding Programmes were identified in the field than during 2011, while the percentage of resistant lines in the Junior Breeding Programmes were lower in 2012 than in 2011 (Fig. 2).
Figure 2. Percentage of RWA resistant lines identified against RWASA2 and RWASA3 for the Dryland Breeding Programmes in field screening for 2008-2012 (EFS-Eastern Free State; WFS-Western Free State)
0
10
20
30
40
50
60
Junior (WFS) Junior (EFS) Senior (WFS) Senior (EFS) WE (EFS) WE (WFS)
Percentage
resistan
t lin
es
Breeding program
2012
2011
2010
2009
2008

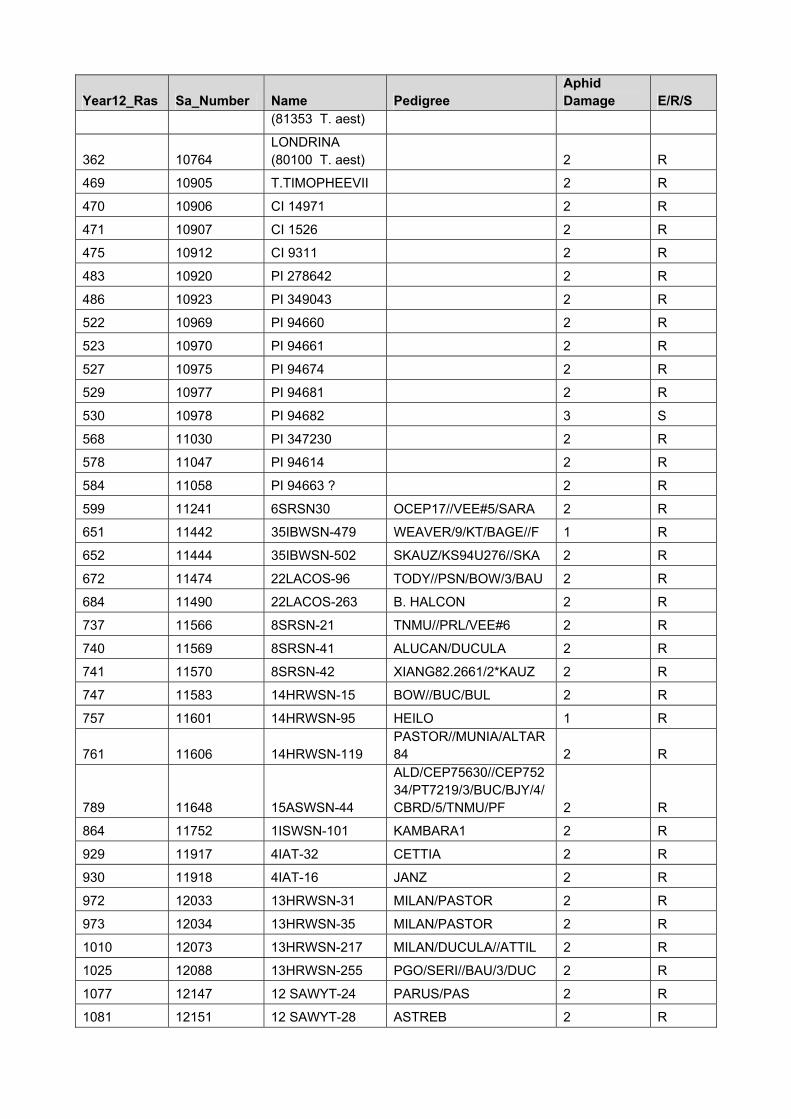
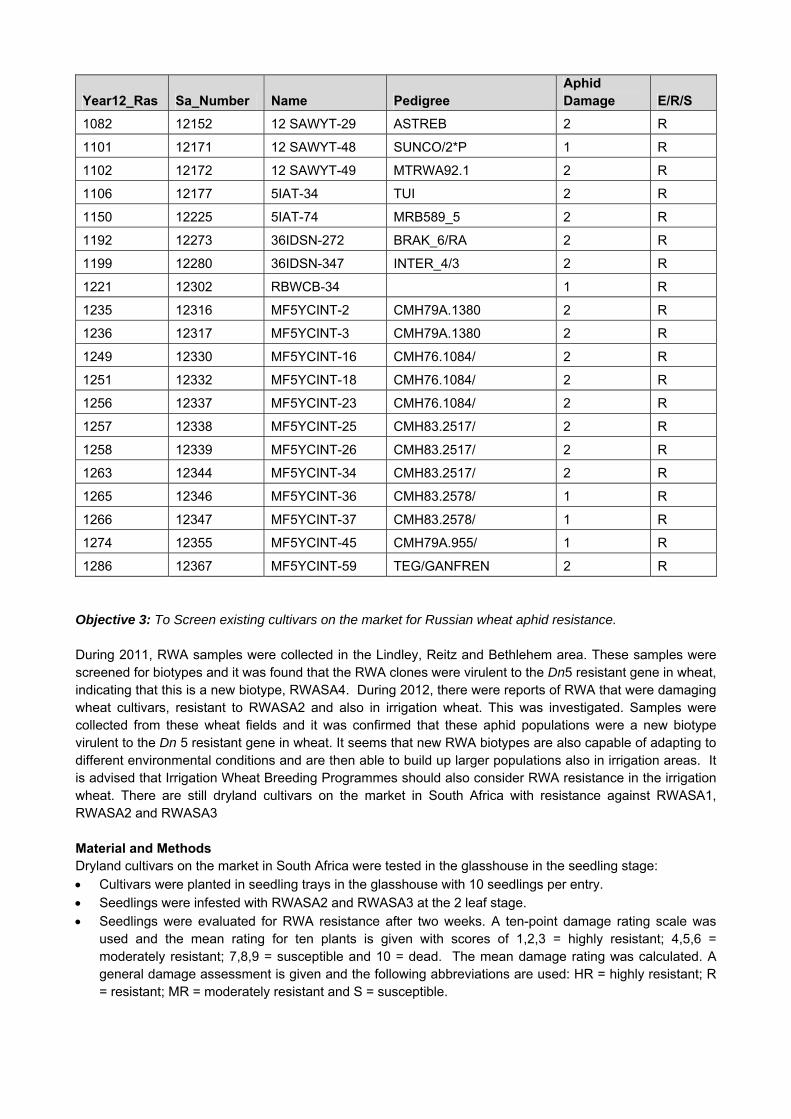
Evaluation of lines from the Germplasm Bank The starting point of a plant breeding programme intended to incorporate a desired trait into superior germplasm, is location of that trait in other genotypes. This usually requires screening large numbers of accessions in the first instance. For this purpose, 1286 lines from the Germplasm Bank (RAS nursery) were planted and evaluated for RWA resistance at Kransfontein. Of the 1286 lines from the Germplasm Bank evaluated, 81 lines (6% of the total) were identified with RWA resistance in the field. These results demonstrate the value of germplasm banks when searching for resistance to a pest in the absence of adequate resistance in material with good agronomic background. Table 3. Lines with resistance against RWASA2 from the 2012 RAS nursery
Year12_Ras Sa_Number Name Pedigree Aphid Damage E/R/S
25 9381 PI 137739 (Dn1) 2 R
45 10224 YR '99-2 F//68.44/Nzt/3/Cuc'S'/4/Algeria.M 28 2 R
52 10231 YR '99-9
Tzpp*2/Ane//Inia/3/Cno/Jar//Kvz/4/Mn72252/5/RmnF12-71/Jup'S' 2 R
74 10326 GK Torontál 2 R
82 10342 Aitsa 2 R
103 10363 Blueboy II 2 R
106 10366 Bokveld 2 R
109 10369 Bordenav Puan Sag 2 R
113 10373 BB4=Gerda 2 R
118 10382 Chokka 2 R
139 10410 Fox 2 R
147 10420 Helene 2 R
212 10510 Sadowe (Turkse koring) 2 R
229 10527 SST 23 2 R
231 10529 SST 38 2 R
236 10534 SST 333 2 R
241 10539 T8 2 R
299 10663 MINDUM '82/83 2 R
300 10664 M 79.6384 SR7a+SR12 '87 2 R
310 10686 SST 55 2 R
313 10689 SR6 SR8 SR9a '88/89 2 R
351 10745 HART USA (81325 T. aest) 2 R
354 10750 IAS-62 (80122 T. aest) 0 E
355 10751 IAS 63 (80098 T. aest) 2 R
360 10760 K TEMBO LESOTHO 1 R
Year12_Ras Sa_Number Name Pedigree Aphid Damage E/R/S
(81353 T. aest)
362 10764 LONDRINA (80100 T. aest) 2 R
469 10905 T.TIMOPHEEVII 2 R
470 10906 CI 14971 2 R
471 10907 CI 1526 2 R
475 10912 CI 9311 2 R
483 10920 PI 278642 2 R
486 10923 PI 349043 2 R
522 10969 PI 94660 2 R
523 10970 PI 94661 2 R
527 10975 PI 94674 2 R
529 10977 PI 94681 2 R
530 10978 PI 94682 3 S
568 11030 PI 347230 2 R
578 11047 PI 94614 2 R
584 11058 PI 94663 ? 2 R
599 11241 6SRSN30 OCEP17//VEE#5/SARA 2 R
651 11442 35IBWSN-479 WEAVER/9/KT/BAGE//F 1 R
652 11444 35IBWSN-502 SKAUZ/KS94U276//SKA 2 R
672 11474 22LACOS-96 TODY//PSN/BOW/3/BAU 2 R
684 11490 22LACOS-263 B. HALCON 2 R
737 11566 8SRSN-21 TNMU//PRL/VEE#6 2 R
740 11569 8SRSN-41 ALUCAN/DUCULA 2 R
741 11570 8SRSN-42 XIANG82.2661/2*KAUZ 2 R
747 11583 14HRWSN-15 BOW//BUC/BUL 2 R
757 11601 14HRWSN-95 HEILO 1 R
761 11606 14HRWSN-119 PASTOR//MUNIA/ALTAR 84 2 R
789 11648 15ASWSN-44
ALD/CEP75630//CEP75234/PT7219/3/BUC/BJY/4/CBRD/5/TNMU/PF 2 R
864 11752 1ISWSN-101 KAMBARA1 2 R
929 11917 4IAT-32 CETTIA 2 R
930 11918 4IAT-16 JANZ 2 R
972 12033 13HRWSN-31 MILAN/PASTOR 2 R
973 12034 13HRWSN-35 MILAN/PASTOR 2 R
1010 12073 13HRWSN-217 MILAN/DUCULA//ATTIL 2 R
1025 12088 13HRWSN-255 PGO/SERI//BAU/3/DUC 2 R
1077 12147 12 SAWYT-24 PARUS/PAS 2 R
1081 12151 12 SAWYT-28 ASTREB 2 R
Year12_Ras Sa_Number Name Pedigree Aphid Damage E/R/S
1082 12152 12 SAWYT-29 ASTREB 2 R
1101 12171 12 SAWYT-48 SUNCO/2*P 1 R
1102 12172 12 SAWYT-49 MTRWA92.1 2 R
1106 12177 5IAT-34 TUI 2 R
1150 12225 5IAT-74 MRB589_5 2 R
1192 12273 36IDSN-272 BRAK_6/RA 2 R
1199 12280 36IDSN-347 INTER_4/3 2 R
1221 12302 RBWCB-34 1 R
1235 12316 MF5YCINT-2 CMH79A.1380 2 R
1236 12317 MF5YCINT-3 CMH79A.1380 2 R
1249 12330 MF5YCINT-16 CMH76.1084/ 2 R
1251 12332 MF5YCINT-18 CMH76.1084/ 2 R
1256 12337 MF5YCINT-23 CMH76.1084/ 2 R
1257 12338 MF5YCINT-25 CMH83.2517/ 2 R
1258 12339 MF5YCINT-26 CMH83.2517/ 2 R
1263 12344 MF5YCINT-34 CMH83.2517/ 2 R
1265 12346 MF5YCINT-36 CMH83.2578/ 1 R
1266 12347 MF5YCINT-37 CMH83.2578/ 1 R
1274 12355 MF5YCINT-45 CMH79A.955/ 1 R
1286 12367 MF5YCINT-59 TEG/GANFREN 2 R Objective 3: To Screen existing cultivars on the market for Russian wheat aphid resistance. During 2011, RWA samples were collected in the Lindley, Reitz and Bethlehem area. These samples were screened for biotypes and it was found that the RWA clones were virulent to the Dn5 resistant gene in wheat, indicating that this is a new biotype, RWASA4. During 2012, there were reports of RWA that were damaging wheat cultivars, resistant to RWASA2 and also in irrigation wheat. This was investigated. Samples were collected from these wheat fields and it was confirmed that these aphid populations were a new biotype virulent to the Dn 5 resistant gene in wheat. It seems that new RWA biotypes are also capable of adapting to different environmental conditions and are then able to build up larger populations also in irrigation areas. It is advised that Irrigation Wheat Breeding Programmes should also consider RWA resistance in the irrigation wheat. There are still dryland cultivars on the market in South Africa with resistance against RWASA1, RWASA2 and RWASA3 Material and Methods Dryland cultivars on the market in South Africa were tested in the glasshouse in the seedling stage: Cultivars were planted in seedling trays in the glasshouse with 10 seedlings per entry. Seedlings were infested with RWASA2 and RWASA3 at the 2 leaf stage. Seedlings were evaluated for RWA resistance after two weeks. A ten-point damage rating scale was
used and the mean rating for ten plants is given with scores of 1,2,3 = highly resistant; 4,5,6 = moderately resistant; 7,8,9 = susceptible and 10 = dead. The mean damage rating was calculated. A general damage assessment is given and the following abbreviations are used: HR = highly resistant; R = resistant; MR = moderately resistant and S = susceptible.
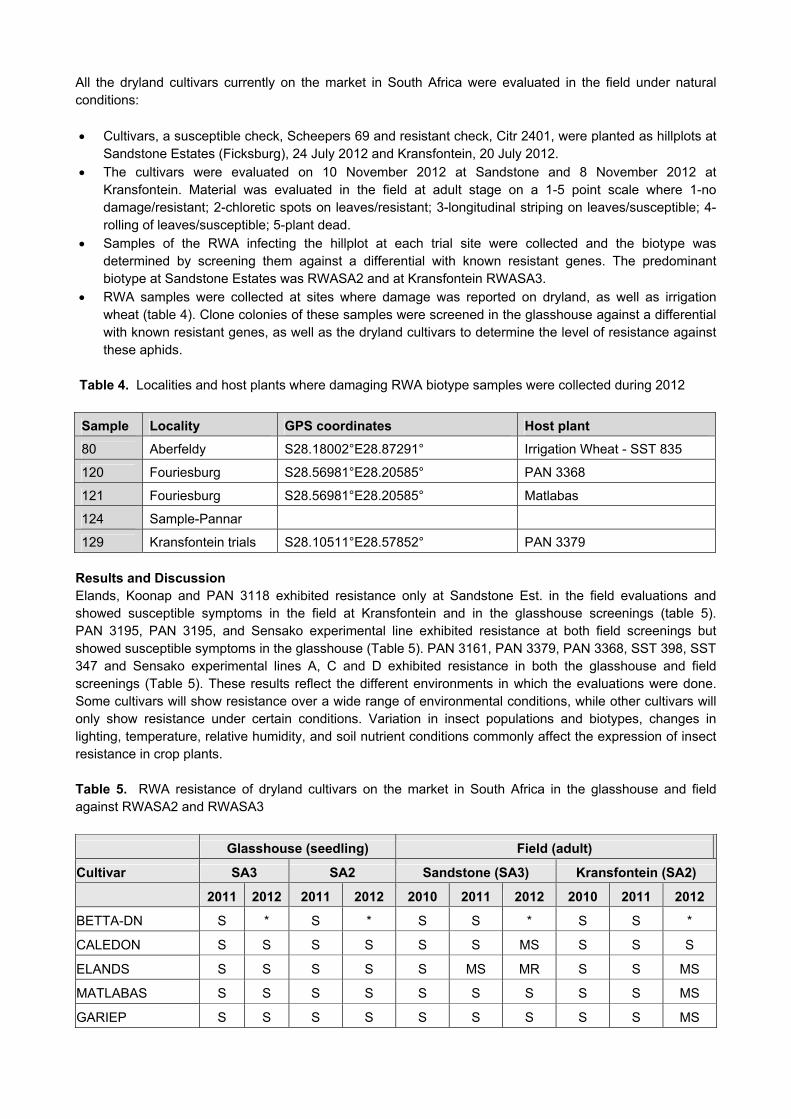
All the dryland cultivars currently on the market in South Africa were evaluated in the field under natural conditions: Cultivars, a susceptible check, Scheepers 69 and resistant check, Citr 2401, were planted as hillplots at
Sandstone Estates (Ficksburg), 24 July 2012 and Kransfontein, 20 July 2012. The cultivars were evaluated on 10 November 2012 at Sandstone and 8 November 2012 at
Kransfontein. Material was evaluated in the field at adult stage on a 1-5 point scale where 1-no damage/resistant; 2-chloretic spots on leaves/resistant; 3-longitudinal striping on leaves/susceptible; 4-rolling of leaves/susceptible; 5-plant dead.
Samples of the RWA infecting the hillplot at each trial site were collected and the biotype was determined by screening them against a differential with known resistant genes. The predominant biotype at Sandstone Estates was RWASA2 and at Kransfontein RWASA3.
RWA samples were collected at sites where damage was reported on dryland, as well as irrigation wheat (table 4). Clone colonies of these samples were screened in the glasshouse against a differential with known resistant genes, as well as the dryland cultivars to determine the level of resistance against these aphids.
Table 4. Localities and host plants where damaging RWA biotype samples were collected during 2012
Sample Locality GPS coordinates Host plant
80 Aberfeldy S28.18002°E28.87291° Irrigation Wheat - SST 835
120 Fouriesburg S28.56981°E28.20585° PAN 3368
121 Fouriesburg S28.56981°E28.20585° Matlabas
124 Sample-Pannar
129 Kransfontein trials S28.10511°E28.57852° PAN 3379 Results and Discussion Elands, Koonap and PAN 3118 exhibited resistance only at Sandstone Est. in the field evaluations and showed susceptible symptoms in the field at Kransfontein and in the glasshouse screenings (table 5). PAN 3195, PAN 3195, and Sensako experimental line exhibited resistance at both field screenings but showed susceptible symptoms in the glasshouse (Table 5). PAN 3161, PAN 3379, PAN 3368, SST 398, SST 347 and Sensako experimental lines A, C and D exhibited resistance in both the glasshouse and field screenings (Table 5). These results reflect the different environments in which the evaluations were done. Some cultivars will show resistance over a wide range of environmental conditions, while other cultivars will only show resistance under certain conditions. Variation in insect populations and biotypes, changes in lighting, temperature, relative humidity, and soil nutrient conditions commonly affect the expression of insect resistance in crop plants. Table 5. RWA resistance of dryland cultivars on the market in South Africa in the glasshouse and field against RWASA2 and RWASA3
Glasshouse (seedling) Field (adult)
Cultivar SA3 SA2 Sandstone (SA3) Kransfontein (SA2)
2011 2012 2011 2012 2010 2011 2012 2010 2011 2012
BETTA-DN S * S * S S * S S *
CALEDON S S S S S S MS S S S
ELANDS S S S S S MS MR S S MS
MATLABAS S S S S S S S S S MS
GARIEP S S S S S S S S S MS

Glasshouse (seedling) Field (adult)
Cultivar SA3 SA2 Sandstone (SA3) Kransfontein (SA2)
2011 2012 2011 2012 2010 2011 2012 2010 2011 2012
KOMATI * * * * S * * S * *
SENQU S S S S S S MS MS S MR
KOONAP S S S S S MS MR S S MS
PAN 3120 S S S S S S MS S S MR
PAN 3118 MS S S S S R MR MS MS S
PAN 3492 S * S * R * S *
PAN 3408 S * S * S * S *
PAN 3161 R R R MR ** R R ** R R
PAN 3355 S * S * S MS * S MS *
PAN 3349 * * * * S * * S * *
PAN 3364 * * * * S * * S * *
PAN 3377 * * * * S * * S * *
PAN 3144 R * R * R R * R R *
PAN 3379 R R R MR R R R R R R
PAN 3368 R R R R R R R R R R
PAN 3195 ** ** ** S ** ** MR ** ** MR
SST 316 ** S ** S ** ** S ** ** S
SST 317 ** S ** S ** ** S ** ** S
SST 322 * * * * R * * S * *
SST 356 S S S S S MS MS S MS S
SST 374 S S MS S S MS S S
SST 398 R R R R R R R R R R
SST 387 S S S S R R MS MS
SST347 R MR R MR R R R S R R
EXPA R MR R MR *** R R *** R R
EXPB MS MS MS MS *** R R *** R R
EXPC *** R *** R *** *** R *** R
EXPD *** R *** MR *** *** R *** R *Cultivar no longer commercially available **New cultivar, first seed available in 2012 ***Experimental wheat lines, first included in 2011
The RWA samples collected in areas where damage was reported were more virulent biotypes. Sample 80, collected from irrigation areas on SST 835 showed virulence to the Dn5 gene (table 6). The Dn6, Dn7 and Dnx genes, as well as the cultivars PAN 3161, PAN 3379, PAN 3368, and the experimental lines A, B, C and D showed resistance to this RWA population (Table 6). It seems that new RWA biotypes are also capable of adapting to different environmental conditions and are then able to build up larger populations also in irrigation areas. It is advised that Irrigation Wheat Breeding Programmes should also consider RWA resistance in the irrigation wheat. Sample 120, that caused damage to the RWASA2 resistant cultivar PAN 3368, showed virulence against all the Dn genes and also all the dryland cultivars except PAN 3161 (Table 6). Sample 121, collected on Matlabas, showed virulence against all the Dn genes and dryland

cultivars except the experimental lines A, B, C and D (table 6). Sample 124 showed virulence against all the Dn genes and dryland cultivars (table 6). Sample 129 that were collected on the RWASA2 resistant cultivar PAN 3379, showed the same virulence pattern as RWASA2 (Table 6). These results confirm the importance of searching for new resistant sources and incorporating it into all the Breeding Programmes. Table 6. Virulence patterns against a differential set of RWA resistant genes and dryland cultivars of RWA samples collected in areas where RWA damage were reported
Entry 80 120 121 124 129
Dn1 S S S S S
Dn2 S S S S S
Dn3 S S S S S
Dn4 S S S S S
Dn5 S S S S MR
Dn6 R S S S R
Dn7 R S S S R
Dn8 S S S S S
Dn9 S S S S S
Dnx MR S S S R
Dny S S S S S
Elands S S S S S
Matlabas S S S S S
Caledon S S S S S
Gariep S S S S S
Senqu S S S S S
TugelaDn S S S S S
Koonap S S S S S
PAN 3118 S S S S S
PAN 3161 R R S S R
PAN 3195 S S S S S
PAN 3120 S S S S R
PAN 3379 R S S S R
PAN 3368 R S S S R
SST 356 S S S S S
SST 316 S S S S S
SST 398 S S S S R
SST 387 S S S S R
SST 317 S S S S S
SST 347 S S S S R
SST 374 S S S S S
EXPA MR S R S MR
EXPB MR S MR S MR
EXPC MR S R S MR
EXPD MR S R S MR

Conclusions RWA resistant cultivars have been bred throughout the world for a long time and are numerous among commercially available wheat cultivars. Of the several constraints towards realizing the potential wheat yield, losses incurred due to biotic and abiotic stresses are enormous. Therefore, breeding for resistance in wheat takes the center-stage in any Breeding Programme with the end goal of breeding high yielding varieties. The advantage of RWA resistant cultivars for producers, is a direct economic benefit - the reduced cost of pesticides and fuel due to a reduced need for applications. Deployment of genetic resources for resistance also assists in achieving yield stability without resorting to harmful chemicals in addition to preventing environmental degradation and benefiting the resource-poor farmers who cannot afford the use of costly chemicals. These benefits are of greater importance when cereal prices are low, because low prices make the application of pesticides less cost-efficient. Despite the common and long experience in breeding for RWA resistance, the evolution of new biotypes after the cultivar occupies the wider cultivation makes breeding for resistance an ever continuous process. There are, however, some cultivars that have remained resistant for fairly long periods of time, giving credence to the fact that resistance conferring durability can be achieved. Until the functional and genetic mechanisms of resistance are determined for other resistant genotypes, it will not be known how broad the genetic base of resistance is and how useful the genotypes will be to Plant Breeders. The true test of resistance is how well a particular genotype develops and yields in the presence of aphid in the field, under a range of environmental conditions. The most important step in any breeding programme is the availability of genetic diversity for the objectives of the Breeding Programme. While the main benefits of RWA resitant cultivars are for farmers, society as a whole has a lot to gain from them as they contribute to a general reduction in pesticide use, which is recognized as a significant and worthwhile public objective, because of the environmental and health problems linked to the use of pesticides. Scientists’ efforts over many years resulted in availability of resistance in wheat and became related to wheat sustainability over decades and consequently contributed to food security. 4. Additional contributions from this project Reports: Jankielsohn, A. 2013. Evaluation of South African wheat cultivars under field conditions. Report for Cultivar Evaluation Meeting, 13 February 2013. Scientific Publications: Tolmay, V.L.; A. Jankielsohn; & S.L. Sydenham. 2012. Resistance evaluation of wheat germplasm containing Dn4 or Dny against Russian wheat aphid biotype RWASA3. Journal of Applied Entomology. Short Communication: pp1-5. Popular Publications: Jankielsohn, A. 2012. Plaaginsekte se aanpassing by omgewingsversteurings. Koringfokus, vol 30(6) November-December 2012 pp 10. 5. Short term objectives April 2013 to March 2014
To identify the broadest RWA biotype resistance by assisting wheat breeders in germplasm screening
using the most virulent RWA biotypes. To evaluate lines in the breeding programmes in the field and screen other germplasm for RWA
resistance. To Screen existing cultivars on the market for Russian wheat aphid resistance.

GK 05/03: EVALUATION OF WHEAT BREEDING MATERIAL FOR RESISTANCE TO RUSSIAN WHEAT APHID DIURAPHIS NOXIA
PROGRESS REPORT APRIL 2012 – MARCH 2013
Summary Number: GK 05/03 Title: Evaluation of wheat breeding material for resistance to the Russian wheat aphid
Diuraphis noxia Duration: Ongoing Status: Continuation of project Project Leader: Dr Astrid Jankielsohn Pest and diseases change with the changing environment and taking their ecology, distribution, virulence patterns and variability into account, is important to minimize the gap between actual and attainable yields. The impact of climate change and change in production practices will continue to impact pest species. Russian wheat aphid (RWA) has been included in the list of important international cereal pests. It is, therefore, important to ensure that cultivars released in South Africa have sufficient and lasting resistance against this damaging international pest insect. The main purpose of this project is to examine and characterize Russian wheat aphid resistance sources and choose the most suitable resistance genes for deployment in cultivars in the field. Evaluations in the glasshouse were done by infesting lines with the most virulent RWA biotype, RWASA3. Breeding lines were also evaluated under field conditions to determine whether the levels of resistance in these cultivars are sufficient against the RWA biotypes predominating in a specific area. The results reflect the different environments in which the evaluations were done. Some cultivars will show resistance over a wide range of environmental conditions, while other cultivars will only show resistance under certain conditions. The true test of resistance is how well a particular genotype develops and yields in the presence of aphid in the field, under a range of environmental conditions. Although there is generally a good relationship between seedling and adult plant resistance and between symptom development in plants in hill plots and in more densely sown plots, there are exceptions. It could be useful to identify some of the major effects arising from the interaction of the aphid with its host plants, climate, pest-disease complexes and predators and parasites.

GK 05/11: BIOLOGICAL CONTROL OF BOLLWORM, HELICOVERPA ARMIGERA, ON WHEAT USING ENTOMOPATHOGENS
FINAL REPORT
1. Project details Number: GK 05/11 Title: Biological control of bollworm, Helicoverpa armigera, on wheat using
entomopathogens Duration: April 2010 – March 2013 (Phase 2) Status: Final Report Project Leader: Dr Justin Hatting Executive summary Phase 1 of this project commenced 1 April 2005 with a final report submitted on 31 March 2009. Extension (Phase 2) was granted for field testing of a prototype product during 2010 – 2013. Research conducted during the course of this project (cf. Progress Reports 2005/6, 2006/7, 2007/8, 2008/9 and 2010/11) has generated information on the selection, screening and testing of potential pathogens of the bollworm under both laboratory and field conditions. Pathogen entities evaluated included fungi, nematodes, bacteria and viruses. The most economically feasible pathogen selected was the fungus Nomuraea rileyi (Farlow) Samson. A new bioassay protocol was developed to test the level of infection caused by various entomopathogens when administered topically versus per os. Notably, no difference in mortality was observed between the two inoculation techniques when three fungal species were compared. This data underscore the notion of possibly targeting younger instar larvae residing in the crop canopy where feeding on leaf chlorophyll occurs (prior to migration into ears). Ingestion of the fungal inoculum during feeding by younger larvae would improve control, as younger larvae are less destructive and generally more susceptible to infection by pathogens. Moreover, these assays also revealed a significant suppression of feeding activity among larvae following inoculation with at least two fungal species. Mortality data were published in the March 2012 edition of the journal “African Entomology” [Hatting, J.L. 2012. Comparison of three entomopathogenic fungi against the bollworm, Helicoverpa armigera (Hübner) (Lepidoptera: Noctuidae), employing topical versus per os inoculation techniques. African Entomology 20(1): 91-100]. The most promising pathogen, N. rileyi, was subsequently passed to the commercial production partner Plant Health Products (Pty) Ltd. in Nottingham Road, KwaZulu-Natal. Mass production techniques were developed and optimized, followed by the preparation of a prototype ULV oil formulation as well as wettable powder (WP) formulation. Field trials were conducted during year 2 (pilot trial), 3, 4 and 5 of the project. These trials revealed several challenges when dealing with bollworm infestations under open field conditions. For trial purposes, a uniform infestation (age and density) across treatment plots is required necessitating artificial introduction of larvae. Three major constraints experienced relate to (1) cannibalism among introduced larvae, (2) migration out of plots and (3) natural enemy interference. The presence of natural enemies throughout these trials did, on the other hand, present an opportunity to characterize the most important natural enemies associated with H. armigera. This information was published in the popular press. Use of a caged-plant protocol with artificial infestation of plants was subsequently introduced (i.e., Phase 2; 2010/11-2012/13) with the aim of securing larval establishment, limiting natural enemy interference and preventing larval migration. Although reputable data were gathered during the 2008 season, several problems were still encountered during Phase 2 in terms of cannibalism and predation, leading to poor larval establishment inside cages. Despite artificial infestation, % kernel damage in control (untreated) cages during the 2010, 2011 and 2012 seasons reached only 0.53±0.25, 0.86±0.6 and 1.36±0.58 in large and 0.22±0.2, 0.38±0.5 and 1.24±0.84 in
small cages, respectively. The low level of damage measured also in the treated cages could therefore not be attributed to the impact of the fungus per se. A natural bollworm infestation encountered at a site in the Western Cape (Caledon region) during 2011 was exploited by PHP (Pty) Ltd. when a trial was sprayed with the WP formulation at 5 different doses compared to the chemical Karate (lambda cyhalothrin), with equal efficacy recorded at all but the 0.5x fungal dose. This data, together with the ARC-SGI data (laboratory bioassays and 2008/2009 field trial) will largely complete the efficacy data-package required for registration. A third field trial, still needed to complete the registration package, will be handled on an ad hoc basis by PHP (Pty.) Ltd. with logistical support by ARC-SGI when and where a natural outbreak of H. armigera is encountered on wheat. 2. Objectives 2.1 Long-term objectives In general, this project aimed to develop bio-insecticides as alternative to chemical insecticides thereby addressing potential problems associated with insecticide resistance, chemical residues and environmental contamination. The long-term objectives of the project were as follows: Survey for and collect indigenous entomopathogens of the bollworm Quantify virulence (LC50) of pathogens against bollworm (laboratory bioassays) Test efficacy of formulated products (formulation by Plant Health Products Pty. Ltd.) Field evaluation of formulated products and registration of selected products under Act 36 of 1947
(establish commercially-available products) 2.2 Short term objectives The short term objectives for the 2012/2013 season were: Optimize in vitro culture protocol in new mass production facility at ARC-SGI (moisture regulation and
drying of fungal cultures grown on a solid substrate). Conduct glasshouse trials with ‘prototype’ formulation of N. rileyi against first (neonates) and second
instar larvae of H. armigera. Conduct trials with ‘prototype’ formulation of N. rileyi against H. armigera under open and/or caged field
conditions (Free State, Northern Cape and/or Western Cape). Collaborate with PHP (Pty) Ltd. Technology transfer (scientific/popular). 3. Report on the objectives for 2012/2013 (listed above) 3.1 Rearing of bollworms on artificial diet under laboratory conditions During the initial 4-year period of the project (i.e., April 2005 – March 2009) a laboratory culture of H. armigera was successfully established and maintained at ARC-SGI after sourcing living material from the ARC-PPRI (Pretoria) bollworm colony. The ARC-Plant Protection Research Institute colony had been reared under laboratory conditions for >20 years and was well adapted to the artificial diet and protocol subjected to. Also, over the years this colony had been cleared of unwanted contaminants (e.g., pathogens) which often affect insects reared under artificial conditions. Both the ARC-PPRI and ARC-SGI colonies were reared according to a protocol developed by Dr Rami Kfir [Reference: Kfir, R. 1994. Rearing the Cotton Bollworm, Heliothis armigera. In: J.P.R. Ochleng-Odero (ed.), Techniques of Insect Rearing for the Development of Integrated Pest and Vector Management Strategies, pp. 417 – 419]. However, during the interim period

2009/2010 With the onfound in ‘wiproblems wgenerationsgenerationssubsequent 3.2 Glasshlarvae of H The notion detail in theconducted d 3.2.1 Mater3.2.1.1 InsePupae of Hperspex ca(cultivar Pucollected fropaint brush in the two-tplaced in pelarva was trseedling pluopening wa1B). The pludepicted in Fig.1A. Pluinverted ovHatting) 3.2.1.2 Prep
A
it was decidset of the 20ild’ material
were encouns. However, s adapted tot glasshouse
house trial wH. armigera
of applying Ne publication during 2011/
rial and Methects and plaH. armigera w
ges 50cm xma) were intom these caand transfer
three leaf sterspex cageransferred oug. Each plu
as cut in the ug with bottleFig. 1C. Rea
ug with seedver seedlings
paration of i
ded by ARC-010/2011 fisccollected by
ntered with aan overall im
o the in vitroe and field tria
with prototyp
N. rileyi to thby Hatting (
/2012, follow
hods ants were sourcedx 50cm x 50troduced intoges and userred in grouptage. A total es of 50cm xonto wheat sug was thenlid of each be was returnearing conditio
lings insertes; Fig. 1C.
inoculum
-PPRI to tercal year, ARCy Dr Annemiea bacterial cmprovement o rearing prals.
ype formulat
he crop to ta(2012). In ored by two tria
d from ARC0cm. Pots coo the cages aed in the triaps of 5 onto p
of 13 pots x 50cm x 100eedlings (cu
n caged withbottle to secued to the trayons were ma
ed through sqcaged seed
B
minate their C-SGI had toe Erasmus ocontaminantt was experierotocol. Inse
tion of N. ril
arget young (rder to invesals in 2012/1
C-GCI. Mothsontaining seeas substratels. Trial A: Npotted barleywere infeste
0cm and maultivar Baviaah a clear 500ure the plug (y allowing fo
aintained at 2
quare cut inlings in tray
H. armigerao then seek aof ARC-Grait that slowedenced duringcts were so
leyi against
(1st and 2nd istigate this a13, reported
s were allowedlings of w for egg depNeonates wey seedlings (ced per treatmaintained at 2ans; two leaf0ml plastic b(Fig. 1A) with
or water upta22°C, natural
nto base of ly to allow w
a colony, dua new sourcen Crops Insd down the g the 2011/1
ourced from
first (neona
nstar) larvaepproach, twohere.
ed to eclosewheat (cultivaposition. Afterere collectedcultivar Pumment, totallin22°C, naturaf stage) seedbottle with vh inverted boke through th light.
id; Fig. 1B. water uptake
C
e to logisticace of H. armigstitute. Durin progression12 period asDr Erasmus
ates) and se
e was discuso glasshous
e and then rar Baviaans)r egg-hatch,
d with a fine ma; ten seedling 65 larvaeal light. Trialded in group
ventilated rooottle acting ahe plug base
bottle with vfrom base
al problems.gera which itng that year,n of healthys successives for use in
econd instar
ssed in moree trials were
released into) and barleylarvae werecamel hair’sings per pot)
e. Pots were B: A singleps of six perof. A squareas cage (Fig.e, as visually
ventilated lid(Photos: JL
. t , y e n
r
e e
o y e s ) e e r e . y
d L

Trial A & B(Pty.) Ltd. a 3.2.1.3 InocTrial A: Tharea sprayedispenser. Sprayed polight. Trial B2) and spratotalling 16 carrier agen 3.2.1.4 Para Trial A: Afte Trial B: Afte 3.2.1.5 Stat Trial A: Thelarval biomaand their intleast signific Trial B: CuThe fungusformula acc 1 Snedecor, G.2 Püntener W.,
3.2.2 Resul
B: A wettable and used at a
culation andhirteen pots ied with 30mFor controls
ots were tranB: Eight plugayed with 5mreplicates (p
nt only (no fu
Fig.
ameters qua
er 9 and 17 d
er 7, 9 and 1
tistical analy
e experimenass differencteraction. Thcant differen
mulative mos-induced mcording to Pü
W. & Cochran, , 1981 Manual f
lts
Powder forma rate of 1gra
d maintenaninfested with
ml (= 300 litre, the carrier nsferred to 5gs were posiml of producplugs). For c
ungus).
1. Plugs wit
antified
days the num
2 days the n
ysis
nt was handlces on Day 9he data were ce (LSD) at t
ortalities (Dayortality on D
üntener (1981
W.G. 1980. Stafor field trials in
mulation of Nam product p
nce of insech 5 larvae pees per ha) oagent alone
50cm x 50cmitioned in a cct inside a Bcontrols, a to
h wheat seed
mber of living
number of liv
ed as a Spli9 and 17 (mnormally dis
the 5% level
y 7, 9 and 12Day 12 was1)2.
atistical methodsplant protection
N. rileyi (straiper litre wate
ts er pot were of the fungale (no fungusm x 100cm circular persBurgerjon spotal of 16 plu
dlings in Bur
g larvae was
ing larvae wa
t-plot designmain-plots) anstributed and of significan
2) were subjes corrected
s, 7th Edition. Ion, 2nd Edition. Ag
n 7758) wasr.
randomly pol preparations) was mixedperspex cagpex base co
pray tower. Tugs were sp
rgerjon spray
recorded an
as recorded.
n and analysnd 2 treatmed means sepnce (Snedeco
ected to a 2xfor control m
owa State Univegricultural Divisi
s sourced fro
ositioned insn through a fd with water ges and mainontaining eighThis procedurayed in a s
y tower (Phot
nd body mass
is of variancents, Productarated usingor & Cochran
x2 Chi2 analymortality usi
rsity Press, pp 5on, Ciba-Geigy
om Plant Hea
side a 1m2 afinger-opera
r and sprayentained at 2ht square opure was repsimilar fashio
to: JL Hatting
s weighed.
ce (ANOVA) t and Contro
g Fishers' pron, 1980)1.
ysis at the 5ing the Sch
507. y Limited.
alth Products
area and theted perfume
ed as above.22°C, naturalpenings (Fig.eated twice,
on, using the
g)
used to testol (sub-plots)otected t-test
% test level.neider-Orelli
s
e e . l . ,
e
t ) t
. i
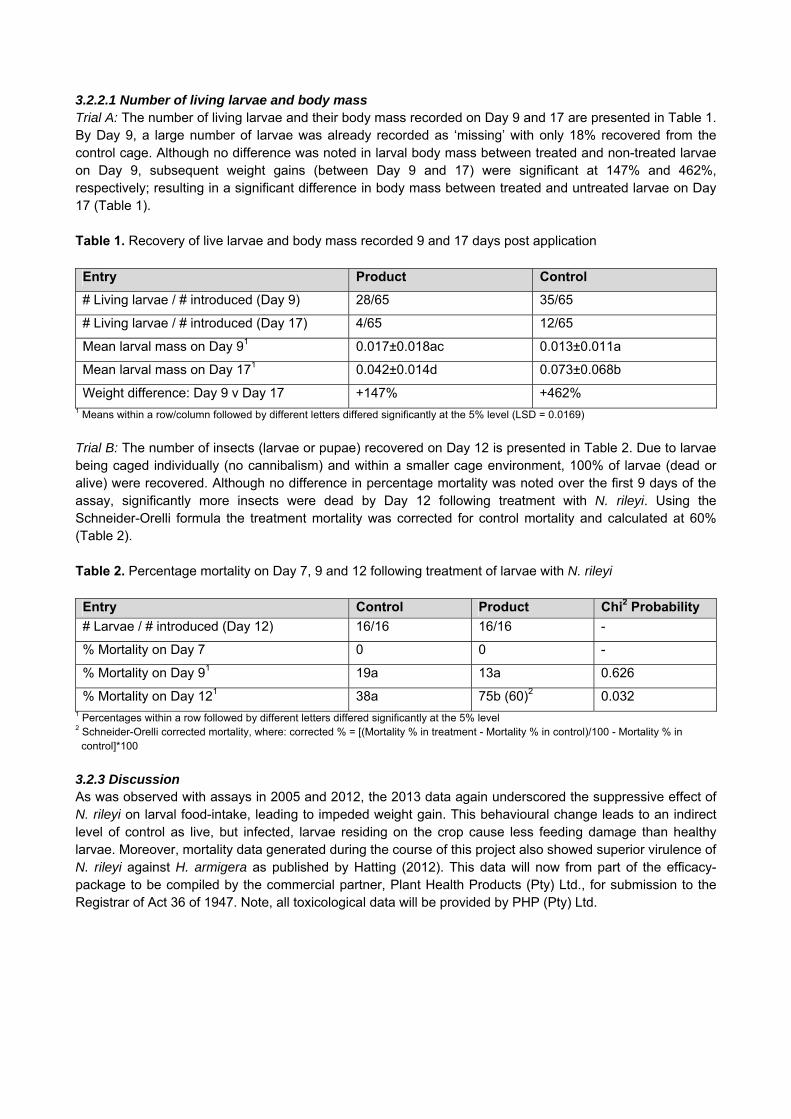
3.2.2.1 Number of living larvae and body mass Trial A: The number of living larvae and their body mass recorded on Day 9 and 17 are presented in Table 1. By Day 9, a large number of larvae was already recorded as ‘missing’ with only 18% recovered from the control cage. Although no difference was noted in larval body mass between treated and non-treated larvae on Day 9, subsequent weight gains (between Day 9 and 17) were significant at 147% and 462%, respectively; resulting in a significant difference in body mass between treated and untreated larvae on Day 17 (Table 1). Table 1. Recovery of live larvae and body mass recorded 9 and 17 days post application Entry Product Control
# Living larvae / # introduced (Day 9) 28/65 35/65
# Living larvae / # introduced (Day 17) 4/65 12/65
Mean larval mass on Day 91 0.017±0.018ac 0.013±0.011a
Mean larval mass on Day 171 0.042±0.014d 0.073±0.068b
Weight difference: Day 9 v Day 17 +147% +462% 1 Means within a row/column followed by different letters differed significantly at the 5% level (LSD = 0.0169)
Trial B: The number of insects (larvae or pupae) recovered on Day 12 is presented in Table 2. Due to larvae being caged individually (no cannibalism) and within a smaller cage environment, 100% of larvae (dead or alive) were recovered. Although no difference in percentage mortality was noted over the first 9 days of the assay, significantly more insects were dead by Day 12 following treatment with N. rileyi. Using the Schneider-Orelli formula the treatment mortality was corrected for control mortality and calculated at 60% (Table 2). Table 2. Percentage mortality on Day 7, 9 and 12 following treatment of larvae with N. rileyi Entry Control Product Chi2 Probability
# Larvae / # introduced (Day 12) 16/16 16/16 -
% Mortality on Day 7 0 0 -
% Mortality on Day 91 19a 13a 0.626
% Mortality on Day 121 38a 75b (60)2 0.032 1 Percentages within a row followed by different letters differed significantly at the 5% level 2 Schneider-Orelli corrected mortality, where: corrected % = [(Mortality % in treatment - Mortality % in control)/100 - Mortality % in control]*100
3.2.3 Discussion As was observed with assays in 2005 and 2012, the 2013 data again underscored the suppressive effect of N. rileyi on larval food-intake, leading to impeded weight gain. This behavioural change leads to an indirect level of control as live, but infected, larvae residing on the crop cause less feeding damage than healthy larvae. Moreover, mortality data generated during the course of this project also showed superior virulence of N. rileyi against H. armigera as published by Hatting (2012). This data will now from part of the efficacy-package to be compiled by the commercial partner, Plant Health Products (Pty) Ltd., for submission to the Registrar of Act 36 of 1947. Note, all toxicological data will be provided by PHP (Pty) Ltd.
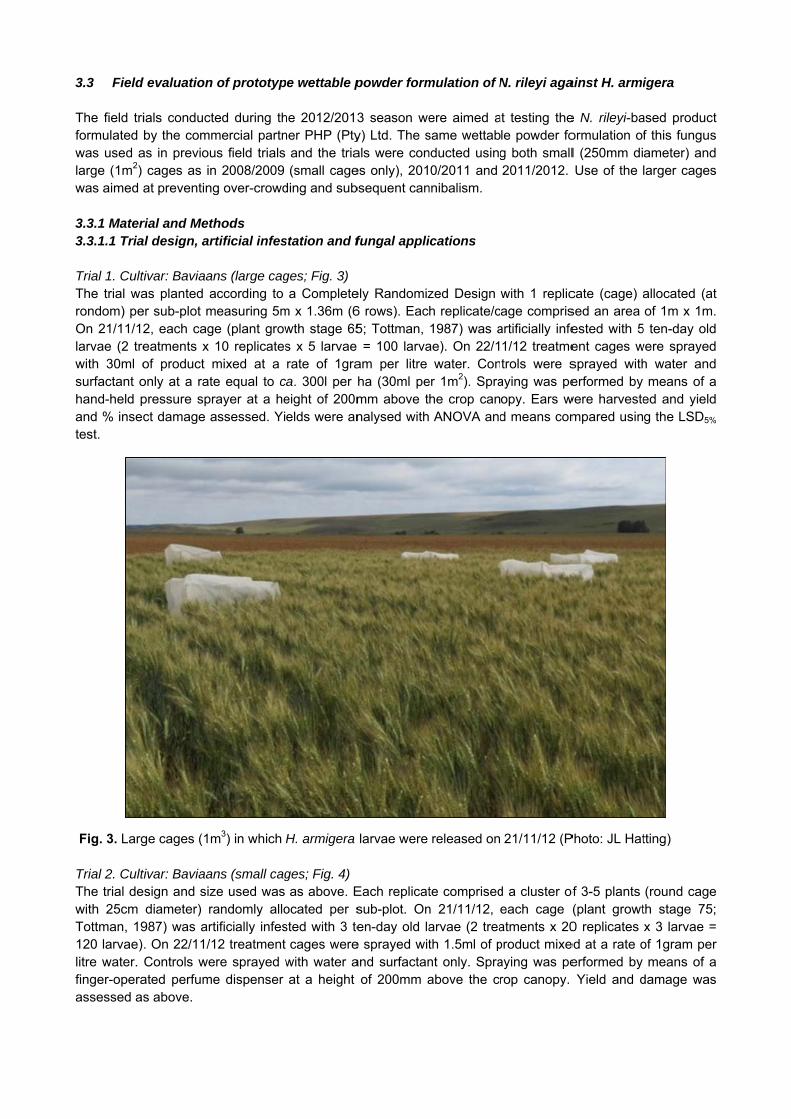
3.3 Field The field triformulated was used alarge (1m2) was aimed 3.3.1 Mater3.3.1.1 Tria Trial 1. CultThe trial warondom) peOn 21/11/12larvae (2 trewith 30ml osurfactant ohand-held pand % insetest.
Fig. 3. Larg Trial 2. CultThe trial dewith 25cm Tottman, 19120 larvae)litre water. finger-operaassessed a
d evaluation
ials conductby the comm
as in previoucages as in
at preventing
rial and Methal design, ar
tivar: Baviaanas planted aer sub-plot m2, each cageatments x of product monly at a ratepressure sprct damage a
ge cages (1m
tivar: Baviaanesign and siz
diameter) ra987) was art. On 22/11/1Controls we
ated perfumes above.
of prototyp
ed during thmercial partnus field trials n 2008/2009 g over-crowd
hods rtificial infes
ns (large cagaccording to
measuring 5me (plant grow10 replicatesmixed at a e equal to crayer at a heassessed. Yi
m3) in which
ns (small cagze used was andomly allotificially infes12 treatment ere sprayed we dispenser
pe wettable p
he 2012/2013ner PHP (Pty
and the tria(small cage
ding and sub
station and f
ges; Fig. 3) a Complete
m x 1.36m (6wth stage 65s x 5 larvae rate of 1graa. 300l per eight of 200melds were an
H. armigera
ges; Fig. 4) as above. E
ocated per ssted with 3 te
cages werewith water aat a height
powder form
3 season wey) Ltd. The sals were cones only), 201bsequent can
fungal appli
ely Randomiz6 rows). Eac5; Tottman, = 100 larvaam per litre ha (30ml pemm above tnalysed with
larvae were
Each replicatsub-plot. Onen-day old la
e sprayed witand surfactan
of 200mm a
mulation of N
ere aimed asame wettabnducted using0/2011 and
nnibalism.
ications
zed Design h replicate/c1987) was a
ae). On 22/1water. Con
er 1m2). Sprahe crop can ANOVA and
released on
te comprisedn 21/11/12, arvae (2 treath 1.5ml of pnt only. Spraabove the cr
N. rileyi aga
at testing thele powder fog both small2011/2012.
with 1 replicage compris
artificially infe1/12 treatmetrols were s
aying was peopy. Ears wd means com
21/11/12 (P
d a cluster ofeach cage atments x 20product mixeaying was perop canopy.
ainst H. armi
e N. rileyi-baormulation ofl (250mm diUse of the l
cate (cage) ased an area ested with 5ent cages wsprayed witherformed by
were harvestempared usin
Photo: JL Hat
of 3-5 plants (plant growt0 replicates
ed at a rate oerformed by Yield and d
igera
ased productf this fungusameter) andlarger cages
allocated (atof 1m x 1m.
5 ten-day oldwere sprayedh water and
means of aed and yieldg the LSD5%
tting)
(round cageth stage 75;x 3 larvae =
of 1gram permeans of a
damage was
t s d s
t .
d d d a d
%
e ;
= r a s
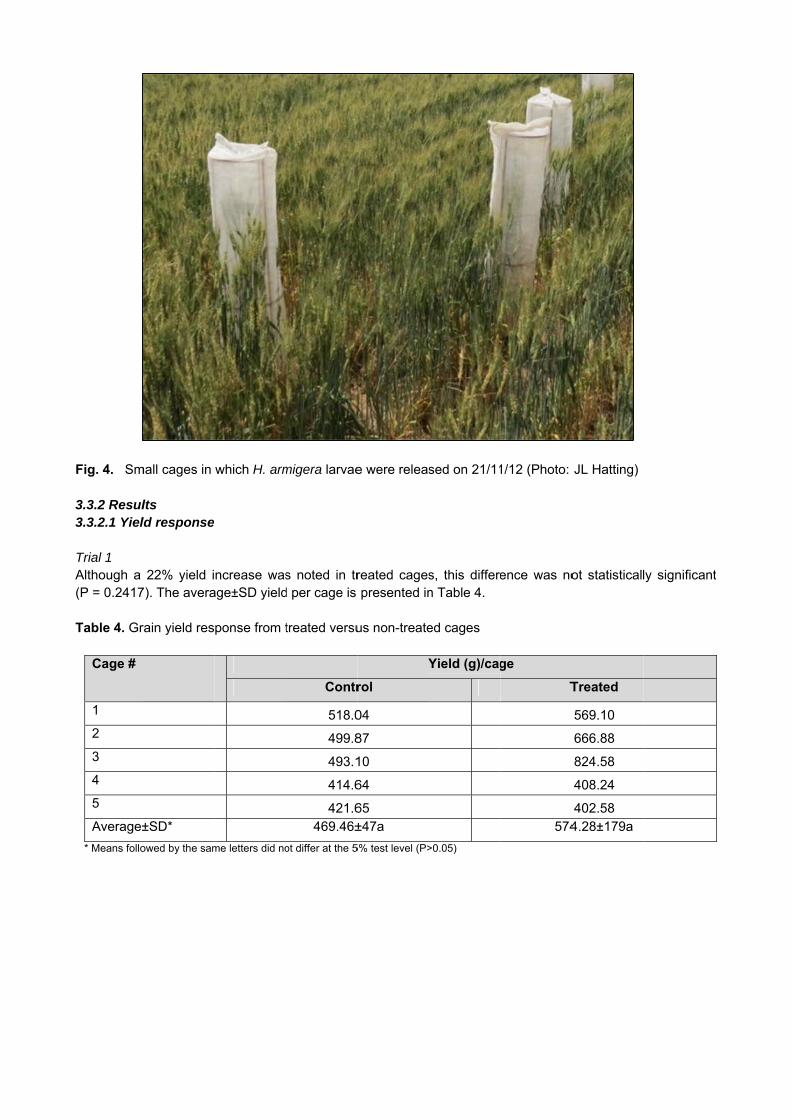
Fig. 4. Sm 3.3.2 Resul3.3.2.1 Yiel Trial 1 Although a (P = 0.2417 Table 4. Gr
Cage #
1
2
3
4
5
Average±
* Means follo
mall cages in
lts ld response
22% yield i7). The avera
rain yield res
±SD*
owed by the sam
which H. arm
ncrease wasage±SD yield
ponse from t
me letters did no
migera larvae
s noted in trd per cage is
treated versu
Contr
518.0
499.8
493.1
414.6
421.6469.46±
ot differ at the 5
e were releas
reated cagespresented in
us non-treate
Y
rol
04
87
10
64
65 ±47a
5% test level (P>
sed on 21/11
s, this differen Table 4.
ed cages
Yield (g)/cag
>0.05)
1/12 (Photo:
ence was no
ge
T
574
JL Hatting)
ot statisticall
Treated
569.10
666.88
824.58
408.24
402.58 4.28±179a
ly significantt
Trial 2 The average±SD yield per cage is presented in Table 5. Table 5. Grain yield response from treated versus non-treated plants Cage # Yield (g)/ear
Control Treated
1 1.554 1.207 2 1.730 1.829 3 1.123 1.702 4 1.537 1.266 5 1.499 1.471 6 1.188 1.707 7 1.599 1.174 8 1.578 1.292 9 1.383 1.389 10 1.584 1.276 Average±SD* 1.48±0.19a 1.43±0.24a
* Means followed by the same letters did not differ at the 5% test level
3.3.2.2 Quality response Trial 1 Although 26% more damage was noted from the control cages, the relatively low level of damage (<1.4%) indicated poor establishment of the larvae. The average percentage insect-damage and associated quality grading is presented in Table 6. Table 6. Insect-damage response from treated versus non-treated cages Cage # Percentage insect damage/cage1
Control Treated
1 1.19 0.60 2 1.30 1.42 3 1.71 0.32 4 0.54 1.16 5 2.07 1.92 Average±SD 1.36±0.582 1.08±0.62
1 % Damage = D/[(X-Y) + D]*100, where: D = weight of undamaged kernels equal to the number of damaged kernels; X = weight of undamaged + damaged kernels; Y = weight of damaged kernels 2 Quality grading: all samples qualify in class B1 - B4
Trial 2 Compared to the controls, the treated cages suffered 23% more damage, but again, the low level of control damage (<1.3%) indicated poor establishment of the larvae. The average percentage insect-damage and associated quality grading is presented in Table 7.

Table 7. Insect-damage response from treated versus non-treated cages Cage # Percentage insect damage/cage1
Control Treated
1 2.36 2.98 2 1.29 0.79 3 1.23 1.03 4 1.07 1.71 5 2.98 2.44 6 1.10 1.42 7 0.79 1.37 8 0.88 1.64 9 0.13 0.53 10 0.56 1.42 Average±SD 1.24±0.842 1.53±0.732
1 % Damage = D/[(X-Y) + D]*100, where: D = weight of undamaged kernels equal to the number of damaged kernels; X = weight of undamaged + damaged kernels; Y = weight of damaged kernels 2 Quality grading: all samples qualify in class B1 - B4
3.3.3 Discussion Although a relatively high number of larvae was released into cages during both trials, an unexpectedly low level of feeding (yield) and damage (quality) was observed from the untreated (control) cages. Slightly older larvae were released onto plants in the late milky stage in an attempt to facilitate better establishment compared to the 2011/2012 trials, but inspections 14 days after release of larvae into the cages did not indicate significant establishment. The most likely reason for the poor establishment would be cannibalism. However, unless a natural area-wide outbreak of H. armigera is available for trial purposes, artificial infestation of caged plants (to prevent migration and exclude predator interference) remains the only viable alternative. The possibility of using natural infestations was in fact considered during 2012/13 with requests sent to Mr Wessel du Toit (Tygerhoek), Mr Ben van Rensburg (Vaalharts) and Mr Manus vd Merwe (Riet Riverr) prior to the bollworm season to inform ARC-SGI of bollworm outbreaks. No such outbreaks were, however, reported and ‘on-site’ field trials could therefore not be performed by ARC-SGI. Reputable data from a single field trial is still needed to complete the registration package required by the Registrar of Act 36 of 1947. Such a trial will be handled on an ad hoc basis by PHP (Pty.) Ltd. with logistical support by ARC-SGI when and where a natural outbreak of H. armigera is encountered on wheat. 4. Technology transfer 4.1. Scientific Hatting, J.L. 2007. Comparative virulence of three hyphomycetous fungi against the bollworm, Helicoverpa
armigera, employing topical versus per os inoculation techniques. Proceedings of the 40th Annual Meeting of the Society for Invertebrate Pathology, Université Laval, Quebec City, Canada, August 12 – 16. p.112.
Hatting, J.L. 2012. Comparison of three entomopathogenic fungi against the bollworm Helicoverpa armigera (Hübner) (Lepidoptera: Noctuidae), employing topical versus per os inoculation techniques. African Entomology 20(1): 91–100.
4.2. Popular 4.2.1 Printed Hatting, J.L. 2007. Beginsels vir biologiese beheer van insekplae, met spesiale verwysing na insekpatogene.
Ons Eie, February 2007, pp. 33 – 35.
Hatting, J.L. 2007. Bolwurm en die beheer daarvan in die Wes-Kaap. SA Grain Vol. 9(9), bl. 47. Hatting, J.L. 2011. Die Afrika-bolwurm: ken jou vyand! SA Droë Bone, Somer uitgawe 43, bl. 26, 30-31. Hatting, J.L. 2011. Biologiese beheer van insekplae. Koringfokus Vol. 29(1), Jan-Feb, bl. 26-27. Hatting, J.L. 2012. Vordering met die ontwikkeling van biologiese insekdoders, Koringfokus Nov/Des 2012,
bl. 22-23. 4.2.2 Audio Hatting, J.L. 2010. Bolwurm op koring. Radio talk on ‘Radio Sonder Grense’; broadcasted on 27/10/10. Hatting, J.L. 2010. Biologiese beheer van insekte. Oral presentation during ARC-SGI Wheat Farmer’s Day,
18 November 2010.

GK 05/11: BIOLOGICAL CONTROL OF BOLLWORM, HELICOVERPA ARMIGERA, ON WHEAT USING ENTOMOPATHOGENS
FINAL REPORT
Summary Project details Number: GK 05/11 Title: Biological control of bollworm, Helicoverpa armigera, on wheat using
entomopathogens Duration: April 2010 – March 2013 (Phase 2) Status: Final Report Project Leader: Dr Justin Hatting The following objectives were accomplished during fiscal year 2012/2013: (1) Two glasshouse trials were conducted with the fungus Nomuraea rileyi against neonates and mid-instar larvae of the bollworm, respectively. Trial A: Thirteen pots containing ten Barley (Puma) seedlings each and infested with 5 larvae per pot were randomly positioned inside a 1m2 area and the area sprayed with 30ml (= 300 litres per ha) of the fungal preparation through a finger-operated perfume dispenser. For controls, the carrier agent alone (no fungus) was mixed with water and sprayed as above. Sprayed pots were transferred to 50cm x 50cm x 100cm perspex cages and maintained at 22°C, natural light. After 9 and 17 days the number of living larvae was recorded and body mass weighed. Although no difference was noted in larval body mass between treated and non-treated larvae on Day 9, subsequent weight gains (between Day 9 and 17) were significant at 147% and 462%, respectively; resulting in a significant difference in body mass between treated and untreated larvae on Day 17. Trial B: Eight wheat (Baviaans) seedling plugs were positioned in a circular perspex base containing eight square openings and sprayed with 5ml of product inside a Burgerjon spray tower. This procedure was repeated twice totalling 16 replicates (plugs). For controls, a total of 16 plugs were sprayed in a similar fashion using the carrier agent only (no fungus). After 7, 9 and 12 days the number of living larvae was recorded. Although no difference in percentage mortality was noted over the first 9 days of the assay, significantly more insects were dead by Day 12 following treatment with N. rileyi. Using the Schneider-Orelli formula the treatment mortality was corrected for control mortality and calculated at 60%. (2) Two field trials were conducted at ARC-SGI (floppy-irrigation system; cultivar Baviaans) with a prototype wettable powder formulation of N. rileyi against caged H. armigera. Two cage sizes / population densities were used but without satisfactory establishment of larvae in either trial; % insect damage (controls) remained low at only 1.36±0.58 and 1.24±0.84, respectively. (3) A radio talk was broadcasted on ‘RSG’ during May 2012. Research conducted during this project has identified and confirmed that the fungus with the most potential for development as bio-insecticide against H. armigera is N. rileyi. These results are based not only in terms of virulence (% mortality), but also inhibition of feeding post inoculation. Between ARC-SGI and PHP (Pty) Ltd., an in vitro mass production technique was established and a Wettable Powder formulation developed. Although two year’s field data were secured (ARC-SGI: 2008/2009 season and PHP: 2011/2012 season), artificial infestation using caged wheat was successful during only one of four field trials with the major constraints identified as cannibalism and interference by natural enemies. For registration purposes the above-mentioned two years’ field data will be supported by the laboratory bioassay data to demonstrate the efficacy of N. rileyi in terms of mortality (Hatting, 2012) and suppression of feeding behaviour (i.e., Progress Report 2011/12 and 2012/13). A third field trial, still needed to complete the registration package, will be handled on an ad hoc basis by PHP (Pty.) Ltd. with logistical support by ARC-SGI when and where a natural outbreak of H. armigera is encountered on wheat.

GK 05/16: MANAGEMENT OF BIOTYPIC DIVERSITY OF RUSSIAN WHEAT APHID, DIURAPHIS NOXIA
PROGRESS REPORT APRIL 2012– MARCH 2013
1. Project details Number: GK 05/16 Title: Management of biotypic diversity of Russian wheat aphid, Diuraphis noxia Duration: Ongoing Status: Continuation of existing project Project leader: Dr Astrid Jankielsohn 2. Objectives
2.1 Long-term objectives The long-term objectives of the management of biotypic diversity of Russian wheat aphid are the following: Describe biotypic diversity of Russian Wheat Aphid (RWA) and survey main wheat production systems in
South Africa and Lesotho for the presence of economically significant biotypes. Use both glasshouse and multiple field-testing environments to determine biotypic differences in
behaviour, fecundity, reproductive rates, survival, and plant damage under different environmental conditions.
2.2 Short term objectives: 2012/2013 The short term objectives for the 2012/2013 season were as follows: Survey and collect RWA in wheat production systems and at landscape level in South Africa and Lesotho. Establish clone colonies of collected RWA samples. Screen for potentially new biotypes from collected RWA samples. Investigate the success of different RWA biotypes on different alternative host plants. 3. Report on objectives: 2012-2013 Objective 1: Survey and collect RWA in wheat production systems and at landscape level Material and Methods RWA samples were collected during 2011 and 2012 from August to December on cultivated wheat and other host plants in the Free State, Lesotho and Western Cape. RWA samples were collected from oat, barley and wheat fields in the Western Cape in 2011 and 2012 during September. All main wheat production areas within the common known distribution of the RWA were sampled. Collection sites were selected off primary or secondary roads that transected major wheat or barley production areas. Sites were 10-20 km apart with distance depending on the continuity of the wheat fields or the abundance of alternative host plants. Infested leaves were placed in Petri dishes (90mm) that contained moist filter paper (3HW 90mm) and stored in an icebox for transportation to the laboratory. The number of aphids per plant, percentage plants infested, growth stage of the plants and damage on the plants were noted. The geographical co-ordinates and elevation where the samples were collected, was also captured and plotted on a map (ArcView 9.3 SU GIS).
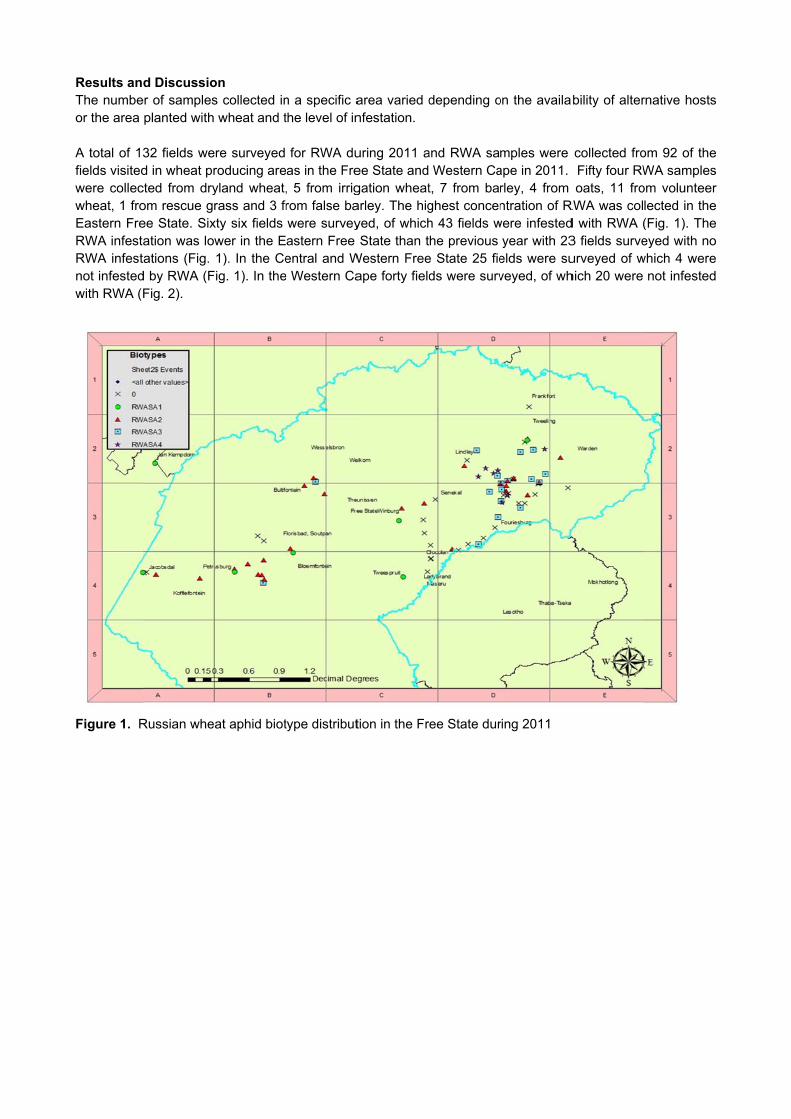
Results anThe numbeor the area A total of 13fields visitedwere collecwheat, 1 froEastern FreRWA infestRWA infestnot infestedwith RWA (F
Figure 1. R
d Discussioer of samplesplanted with
32 fields wed in wheat prcted from dryom rescue gree State. Sixation was lowtations (Fig. d by RWA (FFig. 2).
Russian whe
on s collected in wheat and t
re surveyed roducing areyland wheat,rass and 3 fr
xty six fields wer in the E1). In the Ce
Fig. 1). In the
at aphid biot
n a specific athe level of in
for RWA duas in the Fre, 5 from irrigrom false bawere surveyastern Free entral and W
e Western Ca
type distribut
area varied dnfestation.
uring 2011 aee State andgation wheatarley. The higyed, of whichState than t
Western Freeape forty field
tion in the Fr
depending o
and RWA sa Western Cat, 7 from barghest concenh 43 fields whe previous
e State 25 fieds were surv
ree State dur
on the availa
mples were ape in 2011. rley, 4 from ntration of R
were infestedyear with 23
elds were suveyed, of wh
ring 2011
bility of alter
collected fro Fifty four RWoats, 11 fro
RWA was cold with RWA (3 fields surveurveyed of which 20 were
rnative hosts
om 92 of theWA samples
om volunteerlected in the(Fig. 1). Theeyed with no
which 4 werenot infested
s
e s r e e o e d

Figure 2. R In 2012, RWregrowth. Avisited in whfields were Free State the Easternwith 9 fieldsFree State Cape duringsamples wevolunteer wirrigation wh
Russian Whe
WA were colA total of 137 heat producisurveyed in and 35 in th
n Free States surveyed wall the fieldsg 2012 with ere collectedwheat, 7 fromheat, barley,
eat Aphid bio
lected from fields were s
ing areas in the Eastern e Western C. The RWA with no RWAs surveyed w
only 9 out od from drylanm rescue graoats, volunte
otype distribu
cultivated wsurveyed forthe Free StaFree State, 8
Cape (Fig. 3,infestation wA infestation
were infestedof 35 fields snd wheat, 15ass and 1 freer wheat an
ution in the W
heat, barley,r RWA and Rate and Wes8 in KwaZulu, Fig. 4). The
was higher inns comparedd with RWA (surveyed be5 from irrigatrom wild oatnd rescue gra
Western Cape
, oats, volunRWA samplestern Cape inu Natal, 4 in e highest con the Easter to 23 the p(Fig.3). RWA
eing infested tion wheat, 1ts. Significanass during 2
e during 201
teer wheat, s were collec
n 2012 (Fig. the Northernncentration on Free State
previous yearA infestation
with RWA (12 from barlently more RW012 than in 2
1
rescue grascted from 963, Fig. 4). S
n Cape, 17 inof RWA wase than the pr (Fig. 3). Inwas low in
(Fig. 4). Fortey, 8 from oWA were co2011.
s and wheat6 of the fieldseventy threen the Centrals collected inrevious year
n the Centralthe Westernty one RWA
oats, 12 fromollected from
t s e l
n r l
n A m m

Figure 3. 2 – 10-100
Figure 4. RWA/plant;
Distribution oRWA/plant; 3
Distribution 2 – 10-100
of RWA in th3 - >100 RW
of RWA in RWA/plant; 3
he Free StateWA/plant).
the Wester3 - >100 RW
e during 2012
rn Cape durWA/plant)
2 (Aphid sco
ing 2012 (A
re: 0 - no RW
Aphid score:
WA; 1 – 1-10
0 - no RW
0 RWA/plant;
A; 1 – 1-10
;
0
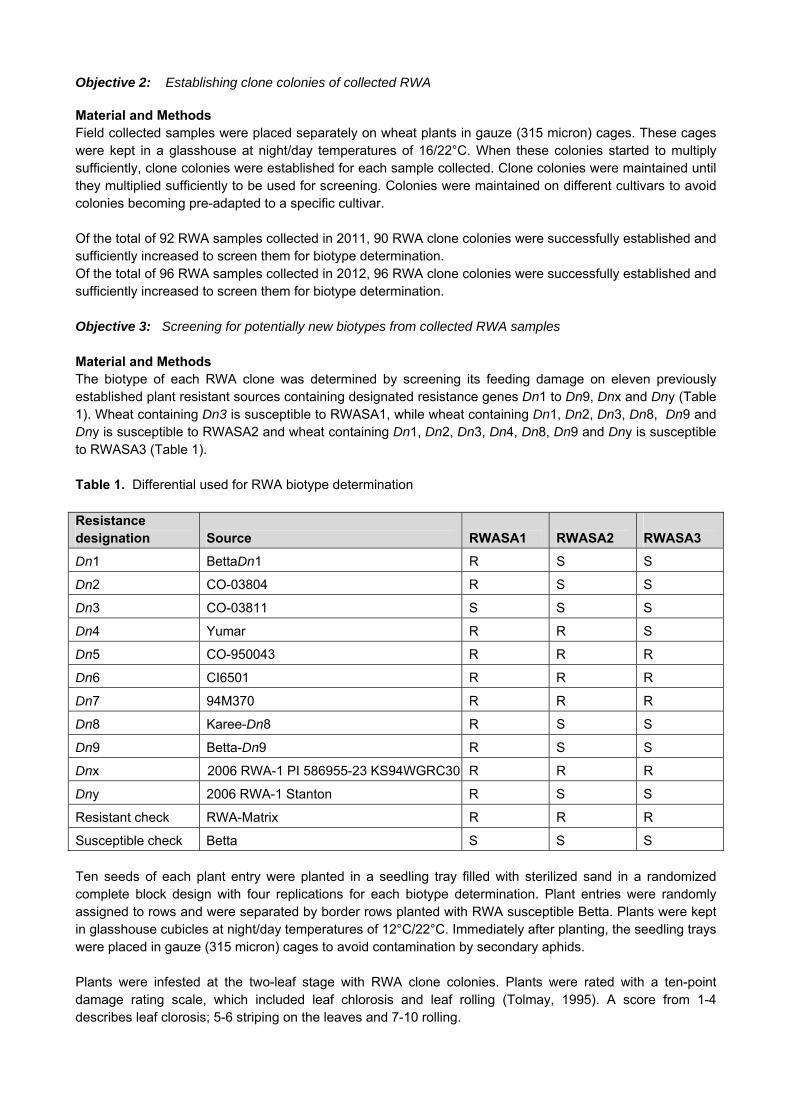
Objective 2: Establishing clone colonies of collected RWA Material and Methods Field collected samples were placed separately on wheat plants in gauze (315 micron) cages. These cages were kept in a glasshouse at night/day temperatures of 16/22°C. When these colonies started to multiply sufficiently, clone colonies were established for each sample collected. Clone colonies were maintained until they multiplied sufficiently to be used for screening. Colonies were maintained on different cultivars to avoid colonies becoming pre-adapted to a specific cultivar. Of the total of 92 RWA samples collected in 2011, 90 RWA clone colonies were successfully established and sufficiently increased to screen them for biotype determination. Of the total of 96 RWA samples collected in 2012, 96 RWA clone colonies were successfully established and sufficiently increased to screen them for biotype determination. Objective 3: Screening for potentially new biotypes from collected RWA samples Material and Methods The biotype of each RWA clone was determined by screening its feeding damage on eleven previously established plant resistant sources containing designated resistance genes Dn1 to Dn9, Dnx and Dny (Table 1). Wheat containing Dn3 is susceptible to RWASA1, while wheat containing Dn1, Dn2, Dn3, Dn8, Dn9 and Dny is susceptible to RWASA2 and wheat containing Dn1, Dn2, Dn3, Dn4, Dn8, Dn9 and Dny is susceptible to RWASA3 (Table 1). Table 1. Differential used for RWA biotype determination Resistance designation Source RWASA1 RWASA2
RWASA3
Dn1 BettaDn1 R S S
Dn2 CO-03804 R S S
Dn3 CO-03811 S S S
Dn4 Yumar R R S
Dn5 CO-950043 R R R
Dn6 CI6501 R R R
Dn7 94M370 R R R
Dn8 Karee-Dn8 R S S
Dn9 Betta-Dn9 R S S
Dnx 2006 RWA-1 PI 586955-23 KS94WGRC30
R R R
Dny 2006 RWA-1 Stanton R S S
Resistant check RWA-Matrix R R R
Susceptible check Betta S S S Ten seeds of each plant entry were planted in a seedling tray filled with sterilized sand in a randomized complete block design with four replications for each biotype determination. Plant entries were randomly assigned to rows and were separated by border rows planted with RWA susceptible Betta. Plants were kept in glasshouse cubicles at night/day temperatures of 12°C/22°C. Immediately after planting, the seedling trays were placed in gauze (315 micron) cages to avoid contamination by secondary aphids. Plants were infested at the two-leaf stage with RWA clone colonies. Plants were rated with a ten-point damage rating scale, which included leaf chlorosis and leaf rolling (Tolmay, 1995). A score from 1-4 describes leaf clorosis; 5-6 striping on the leaves and 7-10 rolling.
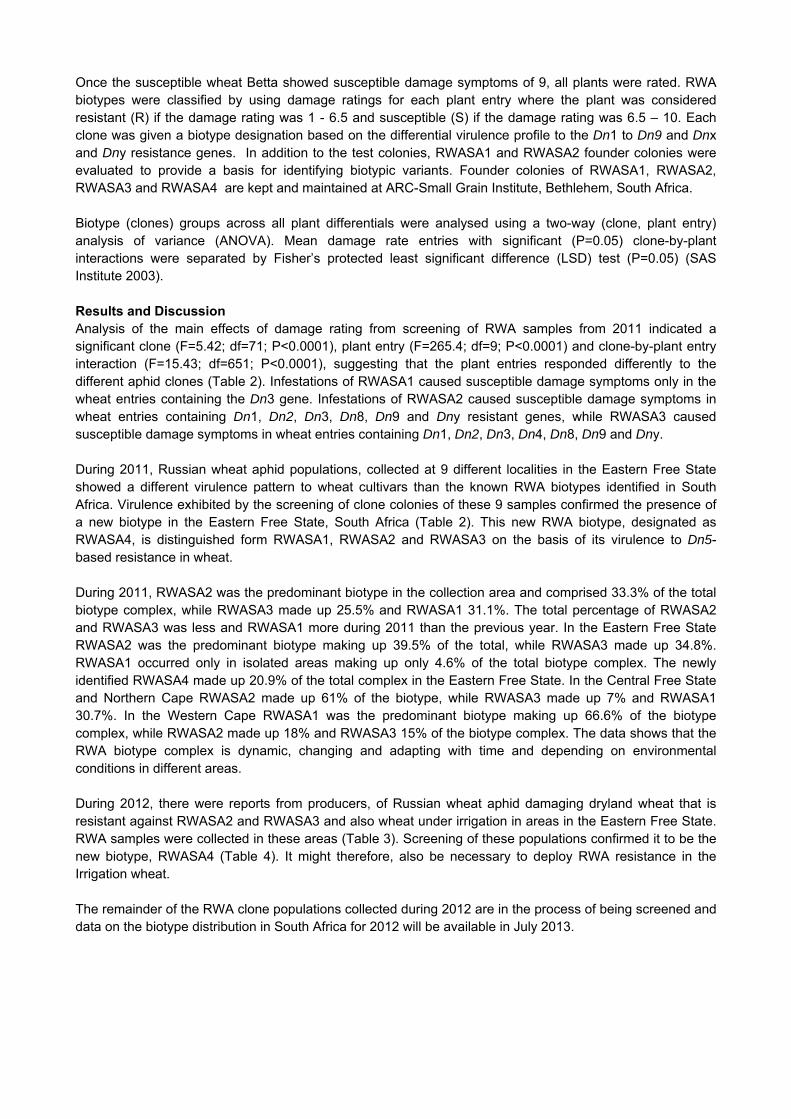
Once the susceptible wheat Betta showed susceptible damage symptoms of 9, all plants were rated. RWA biotypes were classified by using damage ratings for each plant entry where the plant was considered resistant (R) if the damage rating was 1 - 6.5 and susceptible (S) if the damage rating was 6.5 – 10. Each clone was given a biotype designation based on the differential virulence profile to the Dn1 to Dn9 and Dnx and Dny resistance genes. In addition to the test colonies, RWASA1 and RWASA2 founder colonies were evaluated to provide a basis for identifying biotypic variants. Founder colonies of RWASA1, RWASA2, RWASA3 and RWASA4 are kept and maintained at ARC-Small Grain Institute, Bethlehem, South Africa. Biotype (clones) groups across all plant differentials were analysed using a two-way (clone, plant entry) analysis of variance (ANOVA). Mean damage rate entries with significant (P=0.05) clone-by-plant interactions were separated by Fisher’s protected least significant difference (LSD) test (P=0.05) (SAS Institute 2003). Results and Discussion Analysis of the main effects of damage rating from screening of RWA samples from 2011 indicated a significant clone (F=5.42; df=71; P<0.0001), plant entry (F=265.4; df=9; P<0.0001) and clone-by-plant entry interaction (F=15.43; df=651; P<0.0001), suggesting that the plant entries responded differently to the different aphid clones (Table 2). Infestations of RWASA1 caused susceptible damage symptoms only in the wheat entries containing the Dn3 gene. Infestations of RWASA2 caused susceptible damage symptoms in wheat entries containing Dn1, Dn2, Dn3, Dn8, Dn9 and Dny resistant genes, while RWASA3 caused susceptible damage symptoms in wheat entries containing Dn1, Dn2, Dn3, Dn4, Dn8, Dn9 and Dny. During 2011, Russian wheat aphid populations, collected at 9 different localities in the Eastern Free State showed a different virulence pattern to wheat cultivars than the known RWA biotypes identified in South Africa. Virulence exhibited by the screening of clone colonies of these 9 samples confirmed the presence of a new biotype in the Eastern Free State, South Africa (Table 2). This new RWA biotype, designated as RWASA4, is distinguished form RWASA1, RWASA2 and RWASA3 on the basis of its virulence to Dn5-based resistance in wheat. During 2011, RWASA2 was the predominant biotype in the collection area and comprised 33.3% of the total biotype complex, while RWASA3 made up 25.5% and RWASA1 31.1%. The total percentage of RWASA2 and RWASA3 was less and RWASA1 more during 2011 than the previous year. In the Eastern Free State RWASA2 was the predominant biotype making up 39.5% of the total, while RWASA3 made up 34.8%. RWASA1 occurred only in isolated areas making up only 4.6% of the total biotype complex. The newly identified RWASA4 made up 20.9% of the total complex in the Eastern Free State. In the Central Free State and Northern Cape RWASA2 made up 61% of the biotype, while RWASA3 made up 7% and RWASA1 30.7%. In the Western Cape RWASA1 was the predominant biotype making up 66.6% of the biotype complex, while RWASA2 made up 18% and RWASA3 15% of the biotype complex. The data shows that the RWA biotype complex is dynamic, changing and adapting with time and depending on environmental conditions in different areas. During 2012, there were reports from producers, of Russian wheat aphid damaging dryland wheat that is resistant against RWASA2 and RWASA3 and also wheat under irrigation in areas in the Eastern Free State. RWA samples were collected in these areas (Table 3). Screening of these populations confirmed it to be the new biotype, RWASA4 (Table 4). It might therefore, also be necessary to deploy RWA resistance in the Irrigation wheat. The remainder of the RWA clone populations collected during 2012 are in the process of being screened and data on the biotype distribution in South Africa for 2012 will be available in July 2013.

Table 2. Damage ratings of Russian wheat aphid resistant sources infested with RWA clone colonies from different localities during 2011
Sample
Dn1 Dn2 Dn3 Dn4 Dn5 Dn6 Dn7 Dn8 Dn9 Dnx Dny RWA
matrix Betta Biotype
1 9 8.14 8.29 3.71 3.71 3.43 3.43 9 8.57 3.57 9 3.29 9 RWASA2
3 9 8.86 9 8.57 4.57 3.71 3.71 9 9 4.57 8.57 3.57 9 RWASA3
5 9 9 9 4.29 4.71 4.57 5 9 9 4.29 9 4.29 9 RWASA2
6 9 8.14 8.43 8 4.43 3.57 3.86 9 9 5 9 3.29 8 RWASA3
7 8.71 9 8.25 4.29 4.14 4 4.14 9 9 4.14 9 3.29 9 RWASA2
8 9 9 9 4.14 3.71 3.71 3.57 9 8.29 3.71 9 3.43 9 RWASA2
9 9 9 9 9 4.29 4.57 3.86 9 9 3.86 9 3.43 9 RWASA2
11 9 9 9 4.57 3.86 3.43 3.29 9 9 3.43 9 2 9 RWASA2
12 9 9 9 9 5.43 3.29 3.29 9 9 3.29 9 3 9 RWASA3
13 4.29 9 8 3.57 4 3.57 4 5.71 4.57 3.71 4.14 3.71 9 RWASA1
14 9 9 9 9 4.43 4.57 3.43 8.29 7.86 3.43 9 3 9 RWASA3
15 4 4.57 9 4.29 4.43 3.43 3.29 4.71 4 3.57 4.86 3 9 RWASA1
16 6.56 8 9 5.86 5.57 3 3.86 6.8 7.14 4.43 7.86 3.86 9 RWASA2
25 9 9 7.86 4.71 4.43 3.43 4.71 9 9 2.57 9 3.57 9 RWASA2
26 9 9 9 8.14 4.71 4.43 3.57 9 9 4 9 3 9 RWASA3
37 4 4.43 8.71 4.43 3.43 3.71 3 4.43 4 3 4.43 3 9 RWASA1
39 4.57 9 8.57 4.43 4 3.43 3.43 5.43 4 4.57 5.14 3 8 RWASA1
40 5.57 4 8.14 4.43 3.57 3.71 3.43 5.29 4 2.57 4.8 2.43 9 RWASA1
41 4.43 3.57 8.43 3.71 3.43 3.29 3.29 5.43 3.71 3.57 5.14 3 9 RWASA1
43 4 9 5.71 4.29 4.71 3.57 3.43 4.57 4.43 4.43 5.57 3 9 RWASA1
45 4 9 4.43 4.43 4.57 4 3.57 4.57 4.29 4 5.29 3.57 9 RWASA1
46 4.57 8.29 9 4.57 3.43 3.29 3.86 4.86 4 4 5.71 3.43 9 RWASA1
48 3 3 9 3.29 2.71 2.57 3.43 5.57 4.57 3.57 4 2.57 9 RWASA1
49 4 5.14 7.43 3.57 4.57 3.57 3.29 5.57 4.86 3.43 4.71 3.57 9 RWASA1
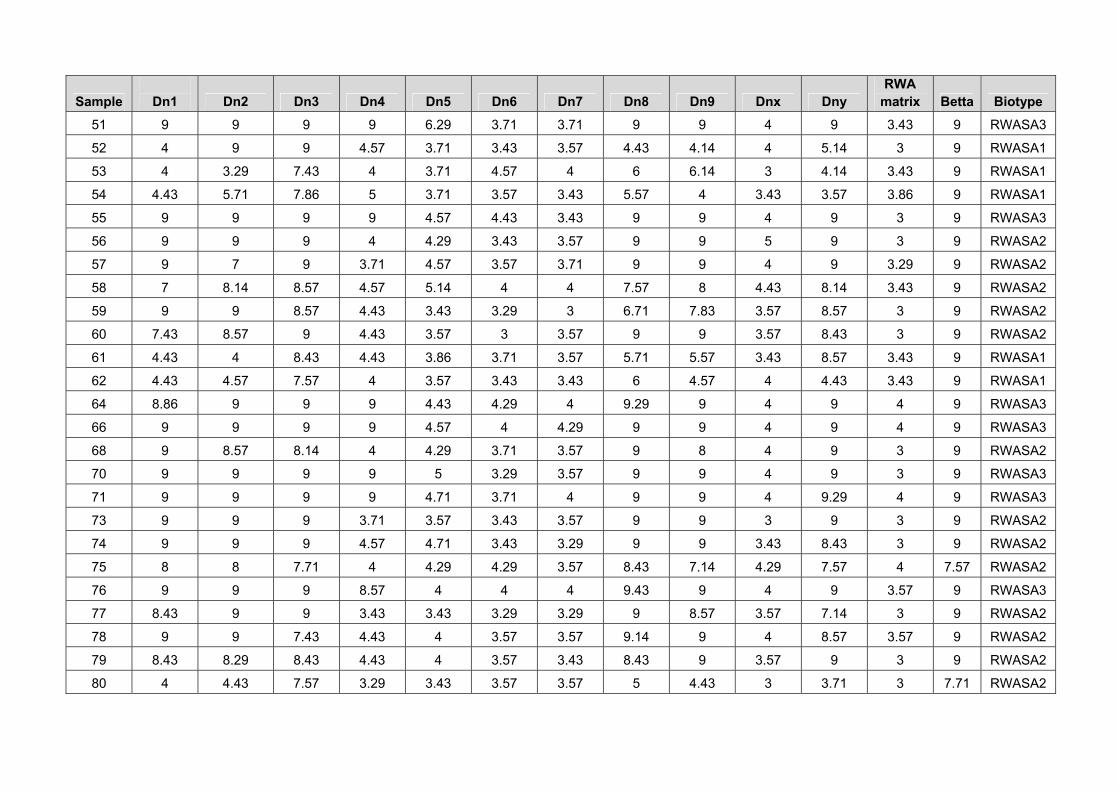
Sample
Dn1 Dn2 Dn3 Dn4 Dn5 Dn6 Dn7 Dn8 Dn9 Dnx Dny RWA
matrix Betta Biotype
51 9 9 9 9 6.29 3.71 3.71 9 9 4 9 3.43 9 RWASA3
52 4 9 9 4.57 3.71 3.43 3.57 4.43 4.14 4 5.14 3 9 RWASA1
53 4 3.29 7.43 4 3.71 4.57 4 6 6.14 3 4.14 3.43 9 RWASA1
54 4.43 5.71 7.86 5 3.71 3.57 3.43 5.57 4 3.43 3.57 3.86 9 RWASA1
55 9 9 9 9 4.57 4.43 3.43 9 9 4 9 3 9 RWASA3
56 9 9 9 4 4.29 3.43 3.57 9 9 5 9 3 9 RWASA2
57 9 7 9 3.71 4.57 3.57 3.71 9 9 4 9 3.29 9 RWASA2
58 7 8.14 8.57 4.57 5.14 4 4 7.57 8 4.43 8.14 3.43 9 RWASA2
59 9 9 8.57 4.43 3.43 3.29 3 6.71 7.83 3.57 8.57 3 9 RWASA2
60 7.43 8.57 9 4.43 3.57 3 3.57 9 9 3.57 8.43 3 9 RWASA2
61 4.43 4 8.43 4.43 3.86 3.71 3.57 5.71 5.57 3.43 8.57 3.43 9 RWASA1
62 4.43 4.57 7.57 4 3.57 3.43 3.43 6 4.57 4 4.43 3.43 9 RWASA1
64 8.86 9 9 9 4.43 4.29 4 9.29 9 4 9 4 9 RWASA3
66 9 9 9 9 4.57 4 4.29 9 9 4 9 4 9 RWASA3
68 9 8.57 8.14 4 4.29 3.71 3.57 9 8 4 9 3 9 RWASA2
70 9 9 9 9 5 3.29 3.57 9 9 4 9 3 9 RWASA3
71 9 9 9 9 4.71 3.71 4 9 9 4 9.29 4 9 RWASA3
73 9 9 9 3.71 3.57 3.43 3.57 9 9 3 9 3 9 RWASA2
74 9 9 9 4.57 4.71 3.43 3.29 9 9 3.43 8.43 3 9 RWASA2
75 8 8 7.71 4 4.29 4.29 3.57 8.43 7.14 4.29 7.57 4 7.57 RWASA2
76 9 9 9 8.57 4 4 4 9.43 9 4 9 3.57 9 RWASA3
77 8.43 9 9 3.43 3.43 3.29 3.29 9 8.57 3.57 7.14 3 9 RWASA2
78 9 9 7.43 4.43 4 3.57 3.57 9.14 9 4 8.57 3.57 9 RWASA2
79 8.43 8.29 8.43 4.43 4 3.57 3.43 8.43 9 3.57 9 3 9 RWASA2
80 4 4.43 7.57 3.29 3.43 3.57 3.57 5 4.43 3 3.71 3 7.71 RWASA2
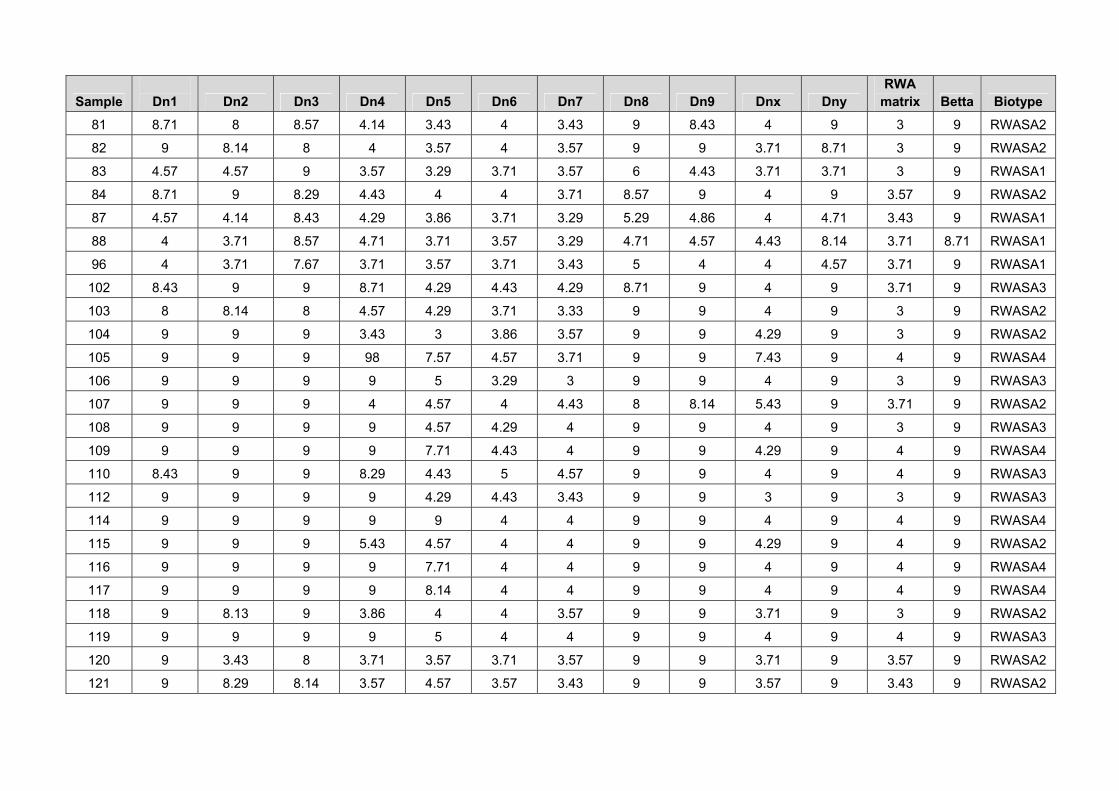
Sample
Dn1 Dn2 Dn3 Dn4 Dn5 Dn6 Dn7 Dn8 Dn9 Dnx Dny RWA
matrix Betta Biotype
81 8.71 8 8.57 4.14 3.43 4 3.43 9 8.43 4 9 3 9 RWASA2
82 9 8.14 8 4 3.57 4 3.57 9 9 3.71 8.71 3 9 RWASA2
83 4.57 4.57 9 3.57 3.29 3.71 3.57 6 4.43 3.71 3.71 3 9 RWASA1
84 8.71 9 8.29 4.43 4 4 3.71 8.57 9 4 9 3.57 9 RWASA2
87 4.57 4.14 8.43 4.29 3.86 3.71 3.29 5.29 4.86 4 4.71 3.43 9 RWASA1
88 4 3.71 8.57 4.71 3.71 3.57 3.29 4.71 4.57 4.43 8.14 3.71 8.71 RWASA1
96 4 3.71 7.67 3.71 3.57 3.71 3.43 5 4 4 4.57 3.71 9 RWASA1
102 8.43 9 9 8.71 4.29 4.43 4.29 8.71 9 4 9 3.71 9 RWASA3
103 8 8.14 8 4.57 4.29 3.71 3.33 9 9 4 9 3 9 RWASA2
104 9 9 9 3.43 3 3.86 3.57 9 9 4.29 9 3 9 RWASA2
105 9 9 9 98 7.57 4.57 3.71 9 9 7.43 9 4 9 RWASA4
106 9 9 9 9 5 3.29 3 9 9 4 9 3 9 RWASA3
107 9 9 9 4 4.57 4 4.43 8 8.14 5.43 9 3.71 9 RWASA2
108 9 9 9 9 4.57 4.29 4 9 9 4 9 3 9 RWASA3
109 9 9 9 9 7.71 4.43 4 9 9 4.29 9 4 9 RWASA4
110 8.43 9 9 8.29 4.43 5 4.57 9 9 4 9 4 9 RWASA3
112 9 9 9 9 4.29 4.43 3.43 9 9 3 9 3 9 RWASA3
114 9 9 9 9 9 4 4 9 9 4 9 4 9 RWASA4
115 9 9 9 5.43 4.57 4 4 9 9 4.29 9 4 9 RWASA2
116 9 9 9 9 7.71 4 4 9 9 4 9 4 9 RWASA4
117 9 9 9 9 8.14 4 4 9 9 4 9 4 9 RWASA4
118 9 8.13 9 3.86 4 4 3.57 9 9 3.71 9 3 9 RWASA2
119 9 9 9 9 5 4 4 9 9 4 9 4 9 RWASA3
120 9 3.43 8 3.71 3.57 3.71 3.57 9 9 3.71 9 3.57 9 RWASA2
121 9 8.29 8.14 3.57 4.57 3.57 3.43 9 9 3.57 9 3.43 9 RWASA2
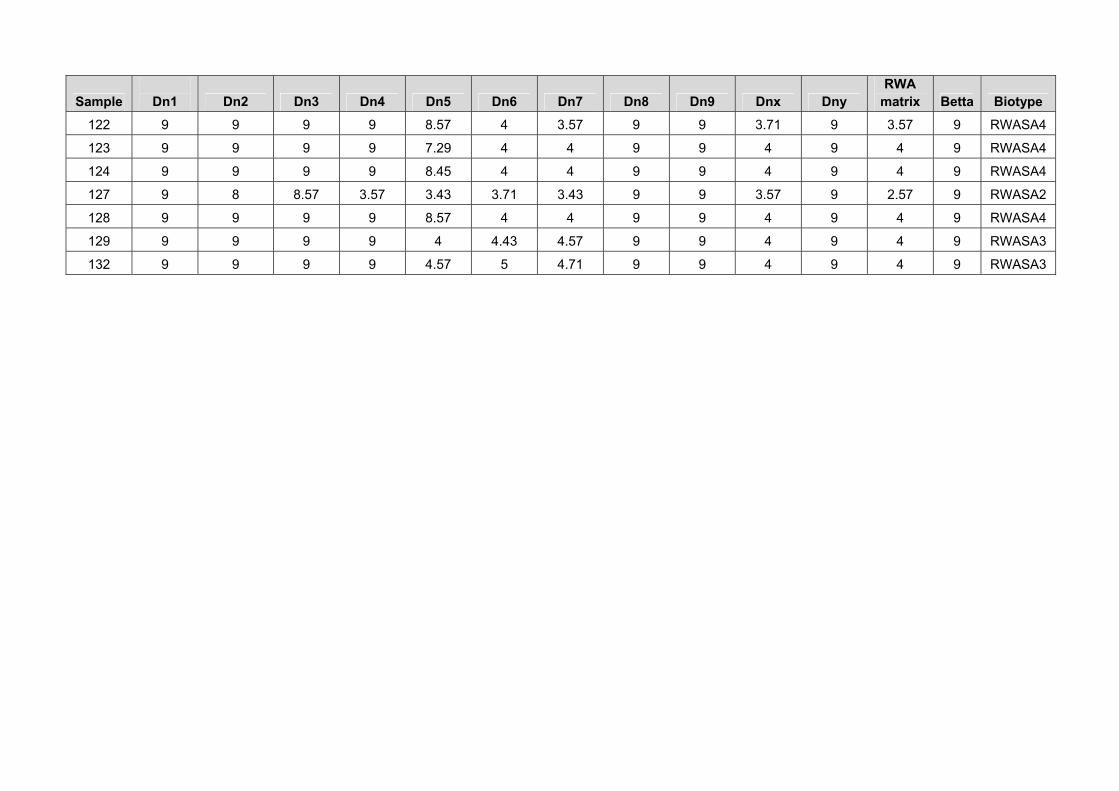
Sample
Dn1 Dn2 Dn3 Dn4 Dn5 Dn6 Dn7 Dn8 Dn9 Dnx Dny RWA
matrix Betta Biotype
122 9 9 9 9 8.57 4 3.57 9 9 3.71 9 3.57 9 RWASA4
123 9 9 9 9 7.29 4 4 9 9 4 9 4 9 RWASA4
124 9 9 9 9 8.45 4 4 9 9 4 9 4 9 RWASA4
127 9 8 8.57 3.57 3.43 3.71 3.43 9 9 3.57 9 2.57 9 RWASA2
128 9 9 9 9 8.57 4 4 9 9 4 9 4 9 RWASA4
129 9 9 9 9 4 4.43 4.57 9 9 4 9 4 9 RWASA3
132 9 9 9 9 4.57 5 4.71 9 9 4 9 4 9 RWASA3

Table 3. Localities and host plants where damaging RWA biotype samples were collected during 2012
Sample Locality GPS coordinates Host plant
80 Aberfeldy S28.18002°E28.87291° Irrigation Wheat - SS T835
120 Fouriesburg S28.56981°E28.20585° PAN 3368
121 Fouriesburg S28.56981°E28.20585° Matlabas
124 Sample-Pannar
129 Kransfontein trials S28.10511°E28.57852° PAN 3379 Table 4. Virulence patterns against a differential set of RWA resistant genes of RWA samples collected in areas where RWA damage was reported during 2012
Entry 80 120 121 124 129
Dn1 S S S S S
Dn2 S S S S S
Dn3 S S S S S
Dn4 S S S S S
Dn5 S S S S MR
Dn6 R S S S R
Dn7 R S S S R
Dn8 S S S S S
Dn9 S S S S S
Dnx MR S S S R
Dny S S S S S
Objective 4: Investigating the success of different RWA biotypes on different alternative host plants The success of all animal specie populations is determined fundamentally by food resources. Some insects can get around the problems of limitations of host range by adapting to a new host or a greater selection. The distribution of RWA increased with a broader host range. Sometimes selective pressure, such as the introduction of insect-resistant crop genotypes, can lead to the evolution of biotypes, which then have close host-related distributions. Herbivores have developed a number of strategies, which show variation within populations, to overcome host plant defence. Two important components in host-range ecology and evolution are host preference and herbivore performance. The intrinsic rate of population increase (rm) has often been used as an index of herbivore performance. Material and Methods The intrinsic rate of population increase (rm) was determined for the three South African biotypes, RWASA1, RWASA2, RWASA3 on 7 different host plants. The RWA biotypes were obtained from colonies established from field collections made in the Eastern Free State in 2009. These biotypes were screened on a differential set to confirm biotype status. RWA colonies were maintained in gauze cages (gauze 73 size: 315 micron) on different wheat cultivars, in the glasshouse at 25 ± 2°C with a photoperiod of 14:10 (L: D). Seed for wheat cultivars, Tugela, TugelaDn, TugelaDn5 and oats (SWK001) were obtained from ARC-Small Grain Institute, while seed for wild oats, rescue grass and false barley were field collected where plants grew around the wheat fields and RWA samples were collected. Seed were planted in seedling trays (7X14 cones) in a randomized block design with 10 replicates for each plant. First instar aphids for each biotype were obtained

from reproducing adult aphids and transferred to separate wheat plants. These aphids were kept until reaching the adult, reproductive stage. Plants were infested at the two leaf stage with 1 adult RWA per plant. There were three treatments with three different biotypes RWASA1, RWASA2, RWASA3. The three treatments were kept separately in gauze cages to avoid cross contamination between the biotypes. Biotype (clones) groups across all host plant entries were analysed using a two way (biotype, host plant entry) analysis of variance (ANOVA). Mean intrinsic rate of increase (rm) rate entries with significant (P=0.05) biotype-by-host plant entry interactions were separated by Fisher’s protected least significant difference (LSD) test (P=0.05) (SAS Institute 2003). Results and discussion Host suitability is determined by reproduction on that host by the aphid. The suitability of a host for RWA can therefore, be measured by determining the intrinsic rate of population increase (rm) of the particular RWA biotype. All three RWA biotypes were able to survive and reproduce on all host plants tested, indicating that these host plants were all suitable hosts for all three biotypes (Table 5). For RWASA1 the Rescue grass and false barley did not differ significantly from the susceptible wheat cultivar, Tugela as hosts in terms of population increase on the host (Table 5). The intrinsic rate of increase for the three biotypes differed significantly on susceptible Tugela, Rescue grass and False barley with RWASA1 having the highest intrinsic rate of increase, followed by RWASA2 and RWASA3 with the lowest intrinsic rate of increase (Table 5). The intrinsic rate of increase on TugelaDn was significantly higher for RWASA3 and lowest for RWASA1 (Table 5). TugelaDn is resistant against RWASA1, but susceptible to RWASA2 and RWASA3. The intrinsic rate of increase for RWASA2 and RWASA3 is significantly lower on TugelaDn5, which is resistant to these two biotypes (Table 5). It can therefore be concluded that there was a reduced performance of biotypes on resistant cultivars. On both oats and wild oats the intrinsic rate of increase for RWASA2 and RWASA3 was significantly higher than for RWASA1, indicating that the herbivore performance for RWASA2 and RWASA3 was higher on the alternative hosts, oats and wild oats, than for RWASA1 (Table 5). From the results it can be concluded that the different biotypes have a different reproductive ability and therefore, different herbivore performance on different host plants. This indicates that the different biotypes will have different survival rates on different host plants. The ability of a RWA biotype to reproduce on a specific alternate host plant in the absence of wheat is the key to the survival of the biotype in an area. If a RWA biotype has the ability to reproduce on alternative host plants in the area, it will be able to build up populations early in the season when the temperatures increase. This in turn will give the RWA biotype an advantage by colonizing cultivated wheat in large numbers early in the season. RWA is polyphagous and may encounter differential selective pressures from non-cultivated hosts. There are a number of different host plants, other than cultivated wheat, that RWA could survive on in this area and wheat is therefore not essential for RWA survival. It has been suggested that biotypic diversity occurred naturally in aphid populations before resistant cultivars were deployed and that host-adapted races have diverged on non-cultivated grass species that aphids use as alternate hosts between harvest and planting. Non-cultivated hosts can play an important role in the evolution and maintenance of biotypes and biotypic diversity can be much greater among RWA collected from non-cultivated grasses than cultivated wheat. RWA spend at least part of the year on a non-cultivated host and during this time RWA populations can be under strong selection pressure. Non-cultivated hosts may play an important role in maintaining aphid genetic diversity and exposure to selective pressures on grasses provides incentive for additional diversity, possibly leading to biotypes adapted to exploit resistant cultivars. Table 5: The intrinsic rate of population increase (rm) for three RWA biotypes on seven different host plants
RWASA1 RWASA2 RWASA3 LSD=0.015
Tugela 0.285±0.03aA 0.264±0.01aB 0.225±0.03aC
TugelaDn 0.189±0.03bA 0.204±0.04cB 0.227±0.04aC
TugelaDn5 0.17±0.02bcA 0.189±0.01dB 0.176±0.02bAB
Oats 0.149±0.06bcA 0.176±0.04dB 0.165±0.01bAB
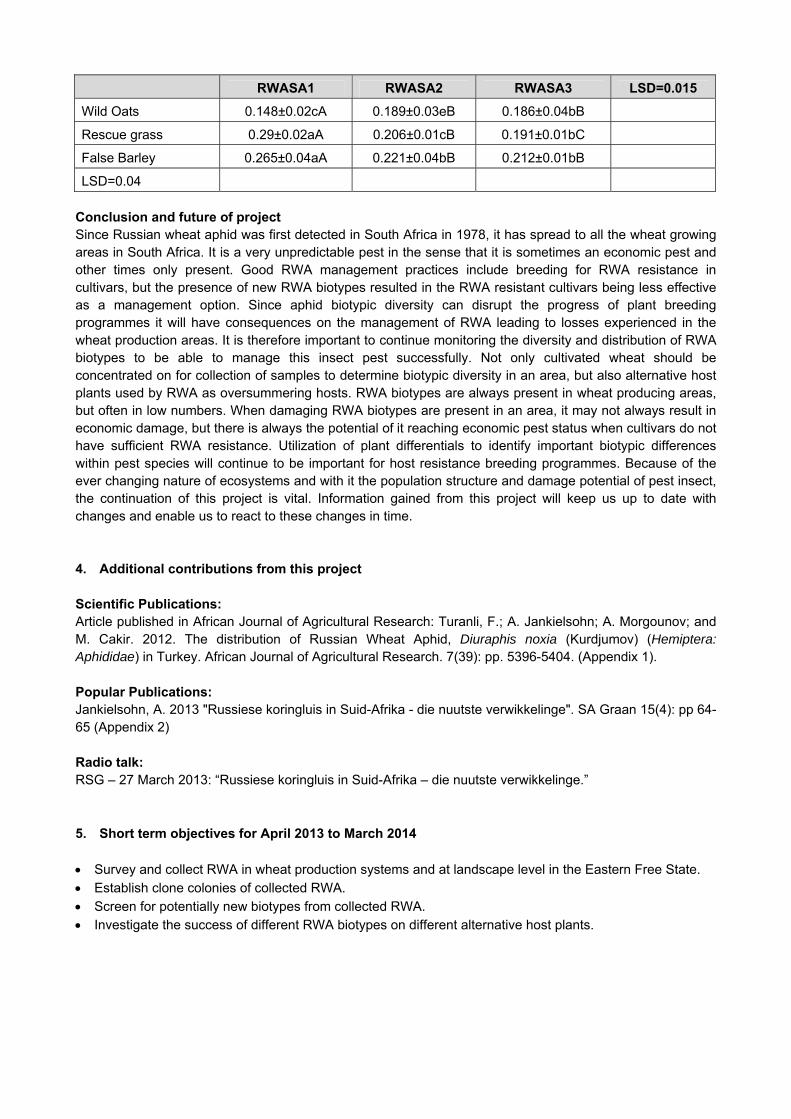
RWASA1 RWASA2 RWASA3 LSD=0.015
Wild Oats 0.148±0.02cA 0.189±0.03eB 0.186±0.04bB
Rescue grass 0.29±0.02aA 0.206±0.01cB 0.191±0.01bC
False Barley 0.265±0.04aA 0.221±0.04bB 0.212±0.01bB
LSD=0.04 Conclusion and future of project Since Russian wheat aphid was first detected in South Africa in 1978, it has spread to all the wheat growing areas in South Africa. It is a very unpredictable pest in the sense that it is sometimes an economic pest and other times only present. Good RWA management practices include breeding for RWA resistance in cultivars, but the presence of new RWA biotypes resulted in the RWA resistant cultivars being less effective as a management option. Since aphid biotypic diversity can disrupt the progress of plant breeding programmes it will have consequences on the management of RWA leading to losses experienced in the wheat production areas. It is therefore important to continue monitoring the diversity and distribution of RWA biotypes to be able to manage this insect pest successfully. Not only cultivated wheat should be concentrated on for collection of samples to determine biotypic diversity in an area, but also alternative host plants used by RWA as oversummering hosts. RWA biotypes are always present in wheat producing areas, but often in low numbers. When damaging RWA biotypes are present in an area, it may not always result in economic damage, but there is always the potential of it reaching economic pest status when cultivars do not have sufficient RWA resistance. Utilization of plant differentials to identify important biotypic differences within pest species will continue to be important for host resistance breeding programmes. Because of the ever changing nature of ecosystems and with it the population structure and damage potential of pest insect, the continuation of this project is vital. Information gained from this project will keep us up to date with changes and enable us to react to these changes in time. 4. Additional contributions from this project Scientific Publications: Article published in African Journal of Agricultural Research: Turanli, F.; A. Jankielsohn; A. Morgounov; and M. Cakir. 2012. The distribution of Russian Wheat Aphid, Diuraphis noxia (Kurdjumov) (Hemiptera: Aphididae) in Turkey. African Journal of Agricultural Research. 7(39): pp. 5396-5404. (Appendix 1). Popular Publications: Jankielsohn, A. 2013 "Russiese koringluis in Suid-Afrika - die nuutste verwikkelinge". SA Graan 15(4): pp 64-65 (Appendix 2) Radio talk: RSG – 27 March 2013: “Russiese koringluis in Suid-Afrika – die nuutste verwikkelinge.”
5. Short term objectives for April 2013 to March 2014
Survey and collect RWA in wheat production systems and at landscape level in the Eastern Free State. Establish clone colonies of collected RWA. Screen for potentially new biotypes from collected RWA. Investigate the success of different RWA biotypes on different alternative host plants.
GK 05/16: MANAGEMENT OF BIOTYPIC DIVERSITY OF RUSSIAN WHEAT APHID, DIURAPHIS NOXIA
PROGRESS REPORT APRIL 2012 – MARCH 2013
Summary Number: GK 05/16 Title: Management of biotypic diversity of Russian wheat aphid, Diuraphis noxia. Duration: Ongoing Status: Continuation of project Project Leader: Dr Astrid Jankielsohn Three Russian wheat aphid biotypes have to date been identified in South Africa, RWASA1 in 1978, RWASA2 in 2005 and RWASA3 in 2009. During 2011 Russian wheat aphid populations, collected at 9 different localities in the Eastern Free State showed a different virulence pattern to wheat cultivars than the known RWA biotypes identified in South Africa. Virulence exhibited by the screening of clone colonies of these 9 samples confirmed the presence of a new biotype in the Eastern Free State, South Africa. This new RWA biotype, designated as RWASA4, is distinguished form RWASA1, RWASA2 and RWASA3 on the basis of its virulence to Dn5-based resistance in wheat. During 2012, there were reports from producers of Russian wheat aphid damaging dryland wheat that is resistant against RWASA2 and RWASA3 and also wheat under irrigation in areas in the Eastern Free State. RWA samples were collected in these areas. Screening of these populations confirmed it to be the new biotype, RWASA4. It might, therefore, also be necessary to deploy RWA resistance in irrigation wheat. Aphid biotypic diversity can disrupt the progress of Plant Breeding Programmes leading to a decreased ability to manage this pest. Selective pressures expressed by resistant cultivars and non-cultivated hosts may help explain observed biotypic variation. The objective of this study was to determine the distribution and diversity of RWA biotypes in the wheat producing areas of South Africa and Lesotho. The data shows that the RWA biotype complex is dynamic, changing and adapting with time and depending on environmental conditions in different areas. The results also show that the different biotypes have a different reproductive ability and therefore ability to survive, on different host plants. The ability of a RWA biotype to reproduce on a specific alternate host plant in the absence of wheat is the key to the survival of the biotype in an area. RWA biotypes are always present in wheat producing areas, but often in low numbers. When damaging RWA biotypes are present in an area it may not always result in economic damage, but there is always the potential of it reaching economic pest status when cultivars do not have sufficient RWA resistance. Because of the ever changing nature of ecosystems and with it the population structure and damage potential of pest insects, the continuation of this project is vital. Information gained from this project will keep us up to date with changes and enable us to react to these changes in time.
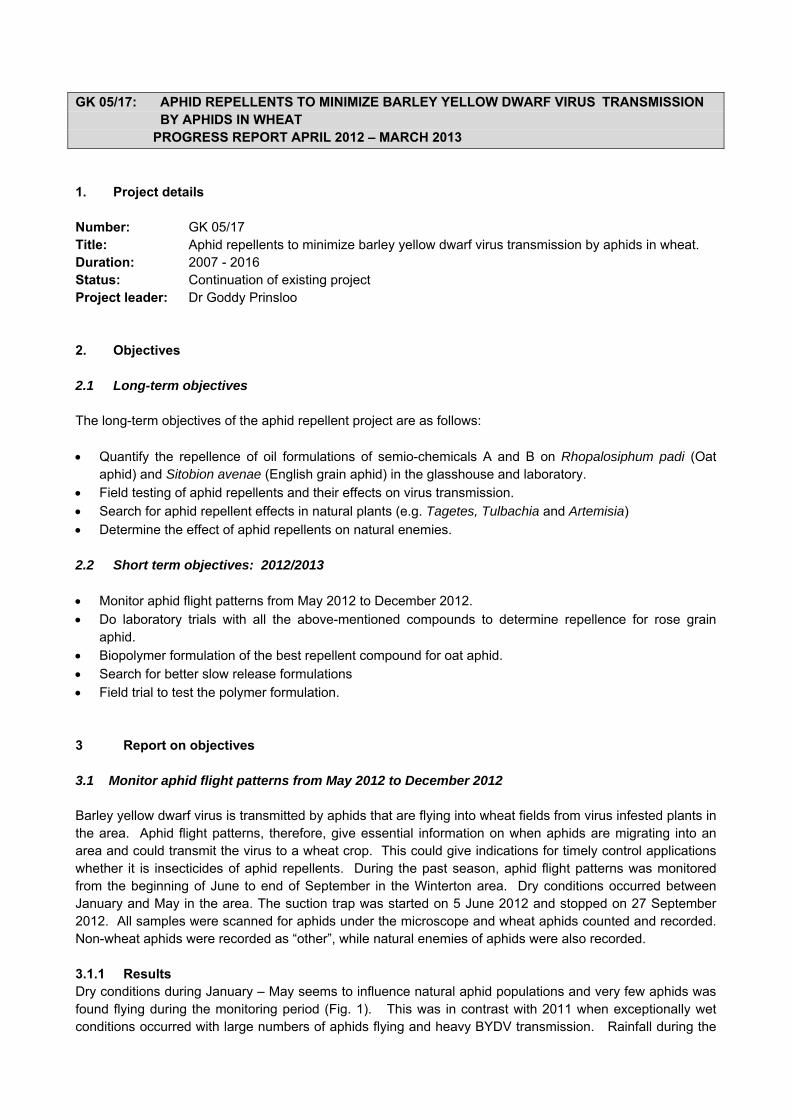
GK 05/17: APHID REPELLENTS TO MINIMIZE BARLEY YELLOW DWARF VIRUS TRANSMISSION BY APHIDS IN WHEAT
PROGRESS REPORT APRIL 2012 – MARCH 2013
1. Project details Number: GK 05/17 Title: Aphid repellents to minimize barley yellow dwarf virus transmission by aphids in wheat. Duration: 2007 - 2016 Status: Continuation of existing project Project leader: Dr Goddy Prinsloo 2. Objectives 2.1 Long-term objectives The long-term objectives of the aphid repellent project are as follows: Quantify the repellence of oil formulations of semio-chemicals A and B on Rhopalosiphum padi (Oat
aphid) and Sitobion avenae (English grain aphid) in the glasshouse and laboratory. Field testing of aphid repellents and their effects on virus transmission. Search for aphid repellent effects in natural plants (e.g. Tagetes, Tulbachia and Artemisia) Determine the effect of aphid repellents on natural enemies. 2.2 Short term objectives: 2012/2013 Monitor aphid flight patterns from May 2012 to December 2012. Do laboratory trials with all the above-mentioned compounds to determine repellence for rose grain
aphid. Biopolymer formulation of the best repellent compound for oat aphid. Search for better slow release formulations Field trial to test the polymer formulation. 3 Report on objectives 3.1 Monitor aphid flight patterns from May 2012 to December 2012 Barley yellow dwarf virus is transmitted by aphids that are flying into wheat fields from virus infested plants in the area. Aphid flight patterns, therefore, give essential information on when aphids are migrating into an area and could transmit the virus to a wheat crop. This could give indications for timely control applications whether it is insecticides of aphid repellents. During the past season, aphid flight patterns was monitored from the beginning of June to end of September in the Winterton area. Dry conditions occurred between January and May in the area. The suction trap was started on 5 June 2012 and stopped on 27 September 2012. All samples were scanned for aphids under the microscope and wheat aphids counted and recorded. Non-wheat aphids were recorded as “other”, while natural enemies of aphids were also recorded. 3.1.1 Results Dry conditions during January – May seems to influence natural aphid populations and very few aphids was found flying during the monitoring period (Fig. 1). This was in contrast with 2011 when exceptionally wet conditions occurred with large numbers of aphids flying and heavy BYDV transmission. Rainfall during the
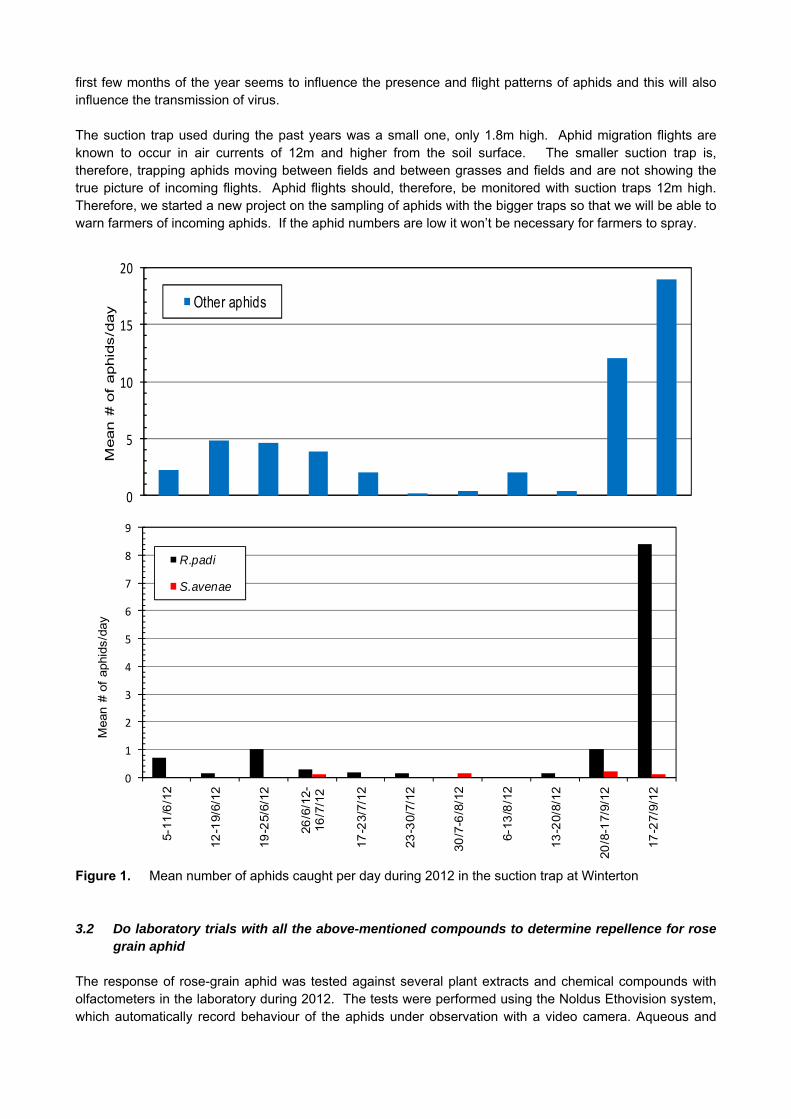
first few months of the year seems to influence the presence and flight patterns of aphids and this will also influence the transmission of virus. The suction trap used during the past years was a small one, only 1.8m high. Aphid migration flights are known to occur in air currents of 12m and higher from the soil surface. The smaller suction trap is, therefore, trapping aphids moving between fields and between grasses and fields and are not showing the true picture of incoming flights. Aphid flights should, therefore, be monitored with suction traps 12m high. Therefore, we started a new project on the sampling of aphids with the bigger traps so that we will be able to warn farmers of incoming aphids. If the aphid numbers are low it won’t be necessary for farmers to spray.
0
5
10
15
20
Mean #
of
aphid
s/d
ay Other aphids
0
1
2
3
4
5
6
7
8
9
5-1
1/6
/12
12
-19/6
/12
19
-25/6
/12
26
/6/1
2-
16
/7/1
2
17
-23/7
/12
23
-30/7
/12
30
/7-6
/8/1
2
6-1
3/8
/12
13
-20/8
/12
20
/8-1
7/9
/12
17
-27/9
/12
Mean #
of
aphid
s/d
ay
R.padi
S.avenae
Figure 1. Mean number of aphids caught per day during 2012 in the suction trap at Winterton 3.2 Do laboratory trials with all the above-mentioned compounds to determine repellence for rose
grain aphid The response of rose-grain aphid was tested against several plant extracts and chemical compounds with olfactometers in the laboratory during 2012. The tests were performed using the Noldus Ethovision system, which automatically record behaviour of the aphids under observation with a video camera. Aqueous and
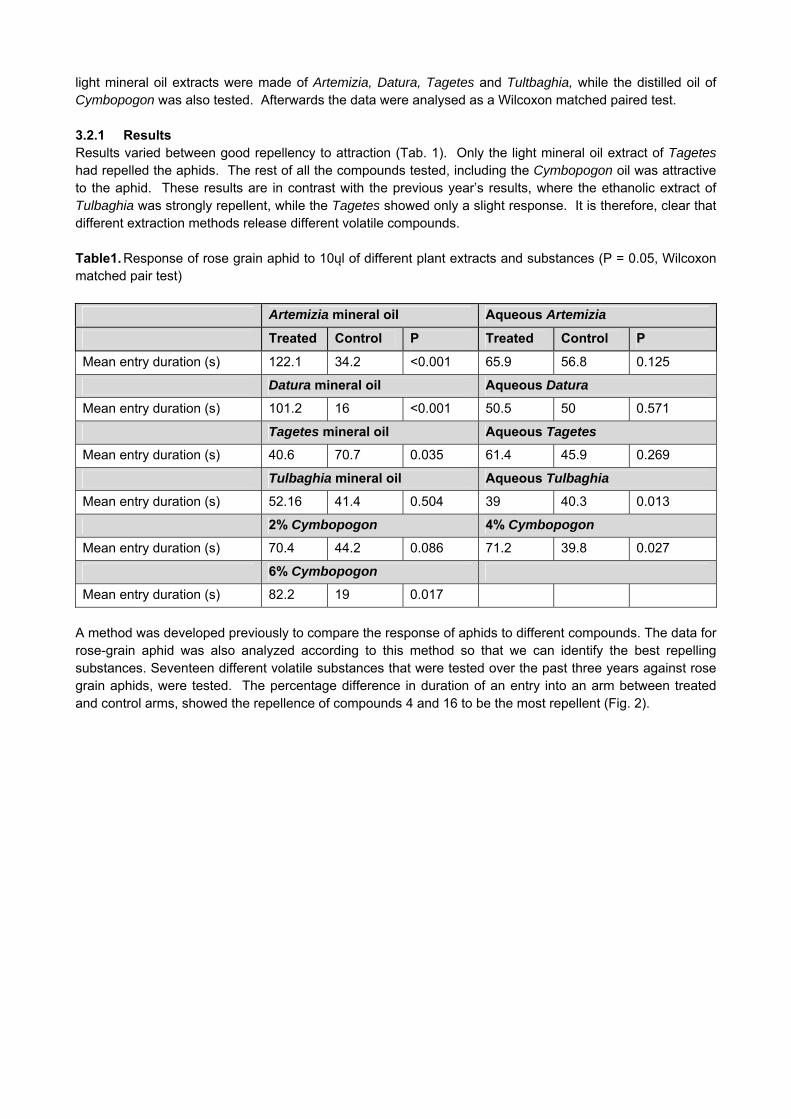
light mineral oil extracts were made of Artemizia, Datura, Tagetes and Tultbaghia, while the distilled oil of Cymbopogon was also tested. Afterwards the data were analysed as a Wilcoxon matched paired test. 3.2.1 Results Results varied between good repellency to attraction (Tab. 1). Only the light mineral oil extract of Tagetes had repelled the aphids. The rest of all the compounds tested, including the Cymbopogon oil was attractive to the aphid. These results are in contrast with the previous year’s results, where the ethanolic extract of Tulbaghia was strongly repellent, while the Tagetes showed only a slight response. It is therefore, clear that different extraction methods release different volatile compounds. Table1. Response of rose grain aphid to 10ųl of different plant extracts and substances (P = 0.05, Wilcoxon matched pair test)
Artemizia mineral oil Aqueous Artemizia
Treated Control P Treated Control P
Mean entry duration (s) 122.1 34.2 <0.001 65.9 56.8 0.125
Datura mineral oil Aqueous Datura
Mean entry duration (s) 101.2 16 <0.001 50.5 50 0.571
Tagetes mineral oil Aqueous Tagetes
Mean entry duration (s) 40.6 70.7 0.035 61.4 45.9 0.269
Tulbaghia mineral oil Aqueous Tulbaghia
Mean entry duration (s) 52.16 41.4 0.504 39 40.3 0.013
2% Cymbopogon 4% Cymbopogon
Mean entry duration (s) 70.4 44.2 0.086 71.2 39.8 0.027
6% Cymbopogon
Mean entry duration (s) 82.2 19 0.017
A method was developed previously to compare the response of aphids to different compounds. The data for rose-grain aphid was also analyzed according to this method so that we can identify the best repelling substances. Seventeen different volatile substances that were tested over the past three years against rose grain aphids, were tested. The percentage difference in duration of an entry into an arm between treated and control arms, showed the repellence of compounds 4 and 16 to be the most repellent (Fig. 2).
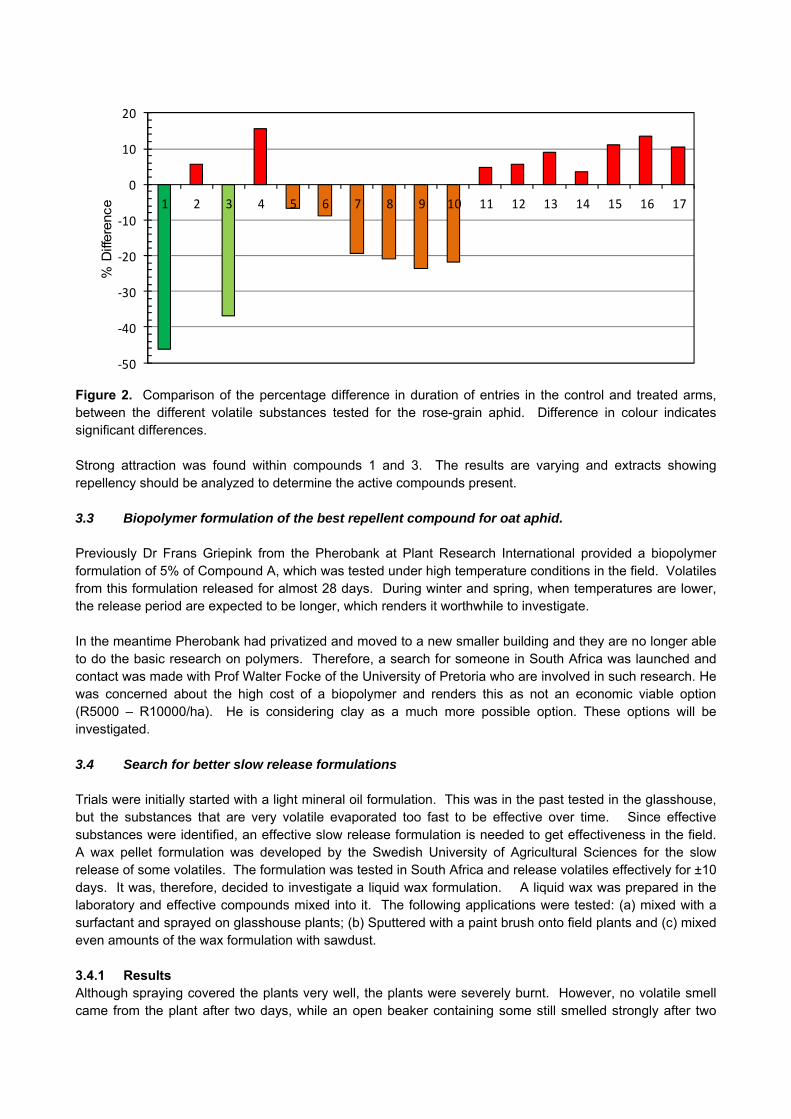
‐50
‐40
‐30
‐20
‐10
0
10
20
1 2 3 4 5 6 7 8 9 10 11 12 13 14 15 16 17
% D
iffere
nce
Figure 2. Comparison of the percentage difference in duration of entries in the control and treated arms, between the different volatile substances tested for the rose-grain aphid. Difference in colour indicates significant differences. Strong attraction was found within compounds 1 and 3. The results are varying and extracts showing repellency should be analyzed to determine the active compounds present. 3.3 Biopolymer formulation of the best repellent compound for oat aphid. Previously Dr Frans Griepink from the Pherobank at Plant Research International provided a biopolymer formulation of 5% of Compound A, which was tested under high temperature conditions in the field. Volatiles from this formulation released for almost 28 days. During winter and spring, when temperatures are lower, the release period are expected to be longer, which renders it worthwhile to investigate. In the meantime Pherobank had privatized and moved to a new smaller building and they are no longer able to do the basic research on polymers. Therefore, a search for someone in South Africa was launched and contact was made with Prof Walter Focke of the University of Pretoria who are involved in such research. He was concerned about the high cost of a biopolymer and renders this as not an economic viable option (R5000 – R10000/ha). He is considering clay as a much more possible option. These options will be investigated. 3.4 Search for better slow release formulations Trials were initially started with a light mineral oil formulation. This was in the past tested in the glasshouse, but the substances that are very volatile evaporated too fast to be effective over time. Since effective substances were identified, an effective slow release formulation is needed to get effectiveness in the field. A wax pellet formulation was developed by the Swedish University of Agricultural Sciences for the slow release of some volatiles. The formulation was tested in South Africa and release volatiles effectively for ±10 days. It was, therefore, decided to investigate a liquid wax formulation. A liquid wax was prepared in the laboratory and effective compounds mixed into it. The following applications were tested: (a) mixed with a surfactant and sprayed on glasshouse plants; (b) Sputtered with a paint brush onto field plants and (c) mixed even amounts of the wax formulation with sawdust. 3.4.1 Results Although spraying covered the plants very well, the plants were severely burnt. However, no volatile smell came from the plant after two days, while an open beaker containing some still smelled strongly after two
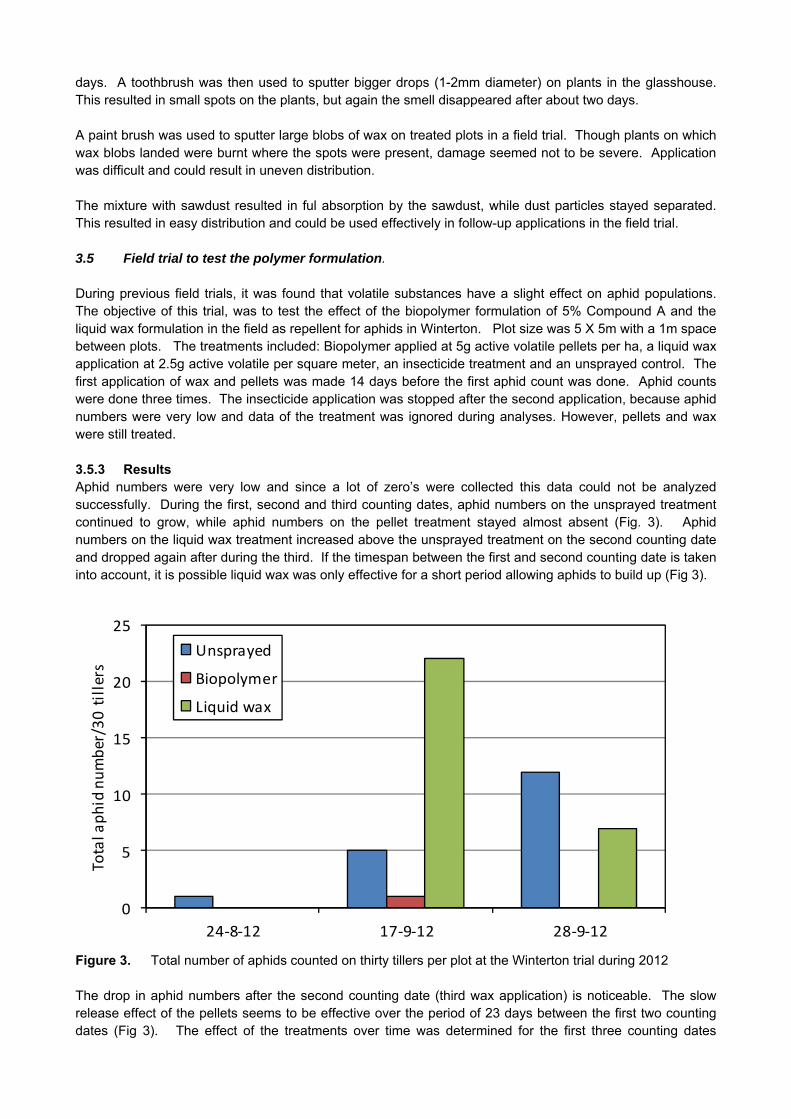
days. A toothbrush was then used to sputter bigger drops (1-2mm diameter) on plants in the glasshouse. This resulted in small spots on the plants, but again the smell disappeared after about two days. A paint brush was used to sputter large blobs of wax on treated plots in a field trial. Though plants on which wax blobs landed were burnt where the spots were present, damage seemed not to be severe. Application was difficult and could result in uneven distribution. The mixture with sawdust resulted in ful absorption by the sawdust, while dust particles stayed separated. This resulted in easy distribution and could be used effectively in follow-up applications in the field trial. 3.5 Field trial to test the polymer formulation. During previous field trials, it was found that volatile substances have a slight effect on aphid populations. The objective of this trial, was to test the effect of the biopolymer formulation of 5% Compound A and the liquid wax formulation in the field as repellent for aphids in Winterton. Plot size was 5 X 5m with a 1m space between plots. The treatments included: Biopolymer applied at 5g active volatile pellets per ha, a liquid wax application at 2.5g active volatile per square meter, an insecticide treatment and an unsprayed control. The first application of wax and pellets was made 14 days before the first aphid count was done. Aphid counts were done three times. The insecticide application was stopped after the second application, because aphid numbers were very low and data of the treatment was ignored during analyses. However, pellets and wax were still treated. 3.5.3 Results Aphid numbers were very low and since a lot of zero’s were collected this data could not be analyzed successfully. During the first, second and third counting dates, aphid numbers on the unsprayed treatment continued to grow, while aphid numbers on the pellet treatment stayed almost absent (Fig. 3). Aphid numbers on the liquid wax treatment increased above the unsprayed treatment on the second counting date and dropped again after during the third. If the timespan between the first and second counting date is taken into account, it is possible liquid wax was only effective for a short period allowing aphids to build up (Fig 3).
0
5
10
15
20
25
24‐8‐12 17‐9‐12 28‐9‐12
Total aphid number/30 tillers
Unsprayed
Biopolymer
Liquid wax
Figure 3. Total number of aphids counted on thirty tillers per plot at the Winterton trial during 2012 The drop in aphid numbers after the second counting date (third wax application) is noticeable. The slow release effect of the pellets seems to be effective over the period of 23 days between the first two counting dates (Fig 3). The effect of the treatments over time was determined for the first three counting dates
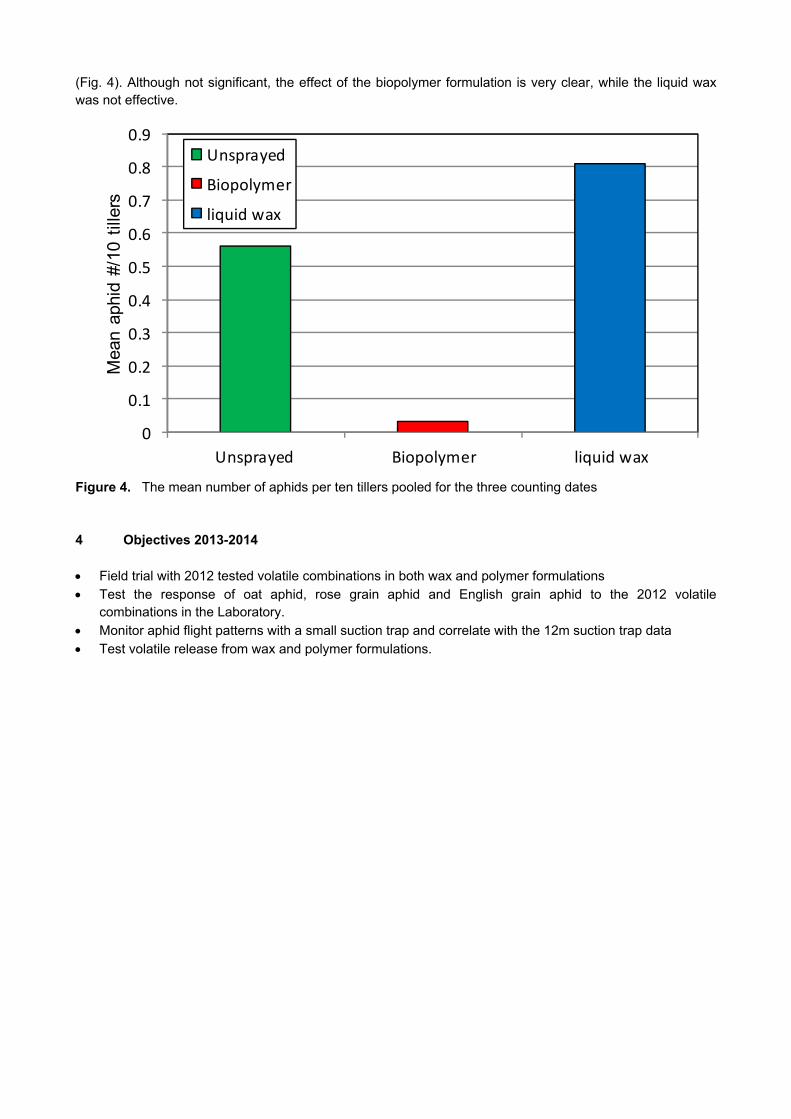
(Fig. 4). Although not significant, the effect of the biopolymer formulation is very clear, while the liquid wax was not effective.
0
0.1
0.2
0.3
0.4
0.5
0.6
0.7
0.8
0.9
Unsprayed Biopolymer liquid wax
Mea
n ap
hid
#/10
till
ers
Unsprayed
Biopolymer
liquid wax
Figure 4. The mean number of aphids per ten tillers pooled for the three counting dates 4 Objectives 2013-2014 Field trial with 2012 tested volatile combinations in both wax and polymer formulations Test the response of oat aphid, rose grain aphid and English grain aphid to the 2012 volatile
combinations in the Laboratory. Monitor aphid flight patterns with a small suction trap and correlate with the 12m suction trap data Test volatile release from wax and polymer formulations.
GK 05/17: APHID REPELLENTS TO MINIMIZE BARLEY YELLOW DWARF VIRUS TRANSMISSION BY APHIDS IN WHEAT PROGRESS REPORT APRIL 2012 – MARCH 2013
Summary Number: GK 05/17 Title: Aphid repellents to minimize barley yellow dwarf virus transmission by aphids in wheat. Duration: 2007 - 2016 Status: Continuation of existing project Project leader: Dr Goddy Prinsloo Aphid numbers varied between years and it is, therefore, essential to determine aphid numbers migrating into the area where irrigated wheat is planted, as well as the time of migration. This information would enable the farmers to make informed decisions on when they should apply chemicals or not. During 2012, all farmers in the Winterton area applied chemicals about fourteen days after emergence of the plants. However, aphid numbers were so low, that this possibly would have no effect. The erection of 12m high suction traps will be of immense value in this instance. Varying results were found when the rose grain aphid’s response to plant extracts and essential oils were tested. It showed us that different methods of extraction could release different responses and it is essential to determine the active repelling compounds from these extracts. In this way we could identify strong repellents for aphids. Biopolymers seemed to be expensive as slow release formulations and a midway should be found between the cost of the formulation and the period of release. If an application could work effectively for a period of two months, it could be expensive, as only one application is necessary. If more than one application is needed, a more economic viable option should be found. A liquid wax formulation was developed and tested in the laboratory glasshouse. This formulation was found to be more effective when large blobs could be distributed. Volatile substances were quickly released from fine droplets. The liquid wax was tested in the field together with a biopolymer. The biopolymer seemed to be more effective in the release of volatile substances over a long period. Effective slow release of volatile substances could keep the aphid numbers in a plot at a very low level and in this way could prevent high levels of transmission of barley yellow dwarf virus.
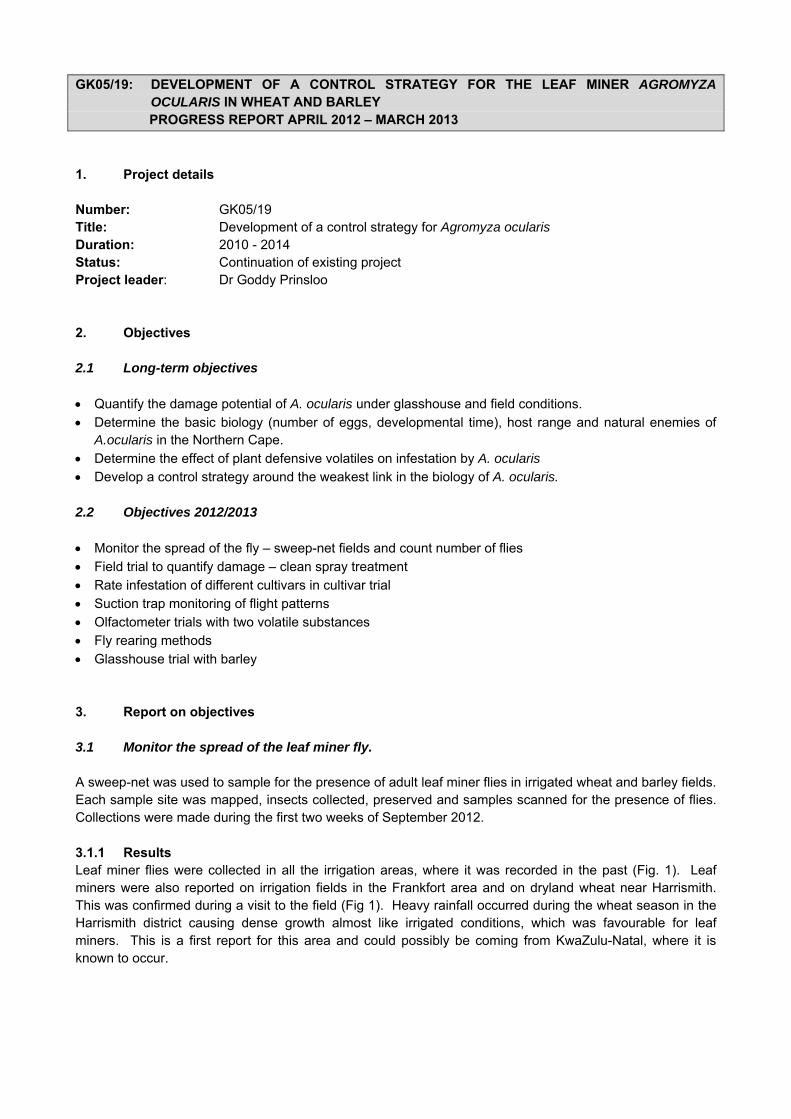
GK05/19: DEVELOPMENT OF A CONTROL STRATEGY FOR THE LEAF MINER AGROMYZA OCULARIS IN WHEAT AND BARLEY
PROGRESS REPORT APRIL 2012 – MARCH 2013
1. Project details Number: GK05/19 Title: Development of a control strategy for Agromyza ocularis Duration: 2010 - 2014 Status: Continuation of existing project Project leader: Dr Goddy Prinsloo 2. Objectives 2.1 Long-term objectives Quantify the damage potential of A. ocularis under glasshouse and field conditions. Determine the basic biology (number of eggs, developmental time), host range and natural enemies of
A.ocularis in the Northern Cape. Determine the effect of plant defensive volatiles on infestation by A. ocularis Develop a control strategy around the weakest link in the biology of A. ocularis. 2.2 Objectives 2012/2013 Monitor the spread of the fly – sweep-net fields and count number of flies Field trial to quantify damage – clean spray treatment Rate infestation of different cultivars in cultivar trial Suction trap monitoring of flight patterns Olfactometer trials with two volatile substances Fly rearing methods Glasshouse trial with barley 3. Report on objectives 3.1 Monitor the spread of the leaf miner fly. A sweep-net was used to sample for the presence of adult leaf miner flies in irrigated wheat and barley fields. Each sample site was mapped, insects collected, preserved and samples scanned for the presence of flies. Collections were made during the first two weeks of September 2012. 3.1.1 Results Leaf miner flies were collected in all the irrigation areas, where it was recorded in the past (Fig. 1). Leaf miners were also reported on irrigation fields in the Frankfort area and on dryland wheat near Harrismith. This was confirmed during a visit to the field (Fig 1). Heavy rainfall occurred during the wheat season in the Harrismith district causing dense growth almost like irrigated conditions, which was favourable for leaf miners. This is a first report for this area and could possibly be coming from KwaZulu-Natal, where it is known to occur.
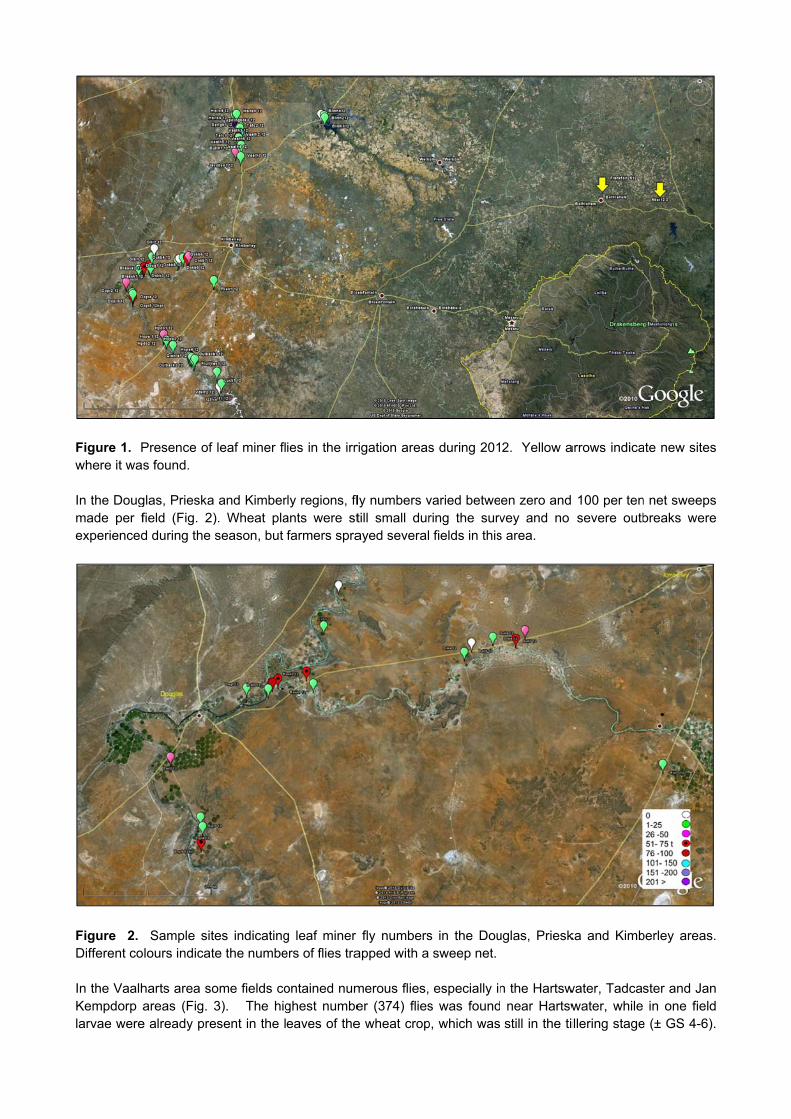
Figure 1. Pwhere it wa In the Dougmade per fexperienced
Figure 2. Different co In the VaalhKempdorp alarvae were
Presence of s found.
glas, Prieska field (Fig. 2)d during the
Sample sitolours indicat
harts area soareas (Fig. 3
e already pre
leaf miner fl
and Kimber). Wheat plaseason, but
es indicatinge the numbe
ome fields co3). The hig
esent in the l
ies in the irr
rly regions, flants were stfarmers spra
g leaf miner ers of flies tra
ontained numghest numbeeaves of the
rigation areas
ly numbers vtill small durayed several
fly numbersapped with a
merous flies,er (374) fliese wheat crop
s during 201
varied betwering the surv fields in this
s in the Dou sweep net.
especially ins was foundp, which was
2. Yellow a
en zero and vey and no s area.
uglas, Priesk
n the Hartsw near Hartswstill in the ti
arrows indica
100 per tensevere outb
ka and Kimb
water, Tadcaswater, while illering stage
ate new sites
n net sweepsbreaks were
berley areas.
ster and Janin one field
e (± GS 4-6).
s
s e
.
n d .

Severe outbhad to spray
Figure 3. Different co 3.2 Fiel Two wheat regions in ttrials were treatment, aBiomectin svolatile trealiquid wax weeks befofor easier astage. Thearea per tillekernel mass 3.2.1 Res 3.2.1.1 DouLow infestaleaves per parameterssignificantly(Table 4) wmeans that therefore notrial (Table 5
breaks followy against lea
Sample siteolours indicat
ld trial to qu
trials and twthe Northernlaid out in aan unspraye
started three atment was inmixed with tre flag leaf s
application. e number of er damaged,s were deter
sults
uglas barleyation was extiller infested. The mea
y so on the thwithout signif
although 11o significant 5).
wed later in thaf miner. Low
es indicatinge the numbe
uantify dama
wo barley trian Cape. All wa Latin squaed control aweeks after
ncluded as athree volatilestage. Anoth Infestation tillers infeste
, were determmined.
y xperienced wd (Tables 1, an leaf areahird samplingicant differen1% of leaf su
differences
he season ow fly number
g the numbeers of flies tra
age
als were marwheat and bre. The Dou
and a singleplant emerg
a forth treatme compounder three appwas measured, number mined. Trials
with no signif2). This m
a damaged g date (Tablences betweeurface was loin yield or y
on both barlers were found
er of leaf miapped with a
rked out in a barley fields wuglas trials ine spray at flgence and coment in the Vads for the firplications werred three timof leaves in
s were harve
ficant differeeans that thper leaf wae 3). Howeven treatmentost, 89% of yield compon
y and wheatd in the Bloe
ner flies in sweep-net.
farmer’s fielwere plantedncluded threag leaf stag
ontinued till gaalharts trialrst applicatiore made whe
mes at two wfested, leaf
ested and the
ences betwehe clean spraas higher onver, the leaf as on any of leaf area is snents was m
t and most ofmhof area.
the Vaalhart
d in both thed by commee treatments
ge. The cleagrain filling ats. The volat
on, which waere the wax w
week intervalarea per lea
e yield, hecto
en treatmenay treatmentn the no sparea damagethe samplinstill available
measured bet
f the farmers
rts and Bloe
e Douglas anercial no-till ps, namely a an spray tret three week tile applicatioas conductewas mixed wls, starting fraf damaged olitre mass a
nts in tillers it did not infl
pray treatmeed per tiller w
ng dates (Tae for photosytween treatm
s in this area
mhof areas.
nd Vaalhartsplanters andclean spray
eatment withintervals. A
on entailed ad about twowith sawdustrom flag leafand the leafnd thousand
infested anduence these
ent, but onlywas very lowble 4). Thisynthesis andments in this
a
.
s d y h A a o t f f d
d e y w s d s
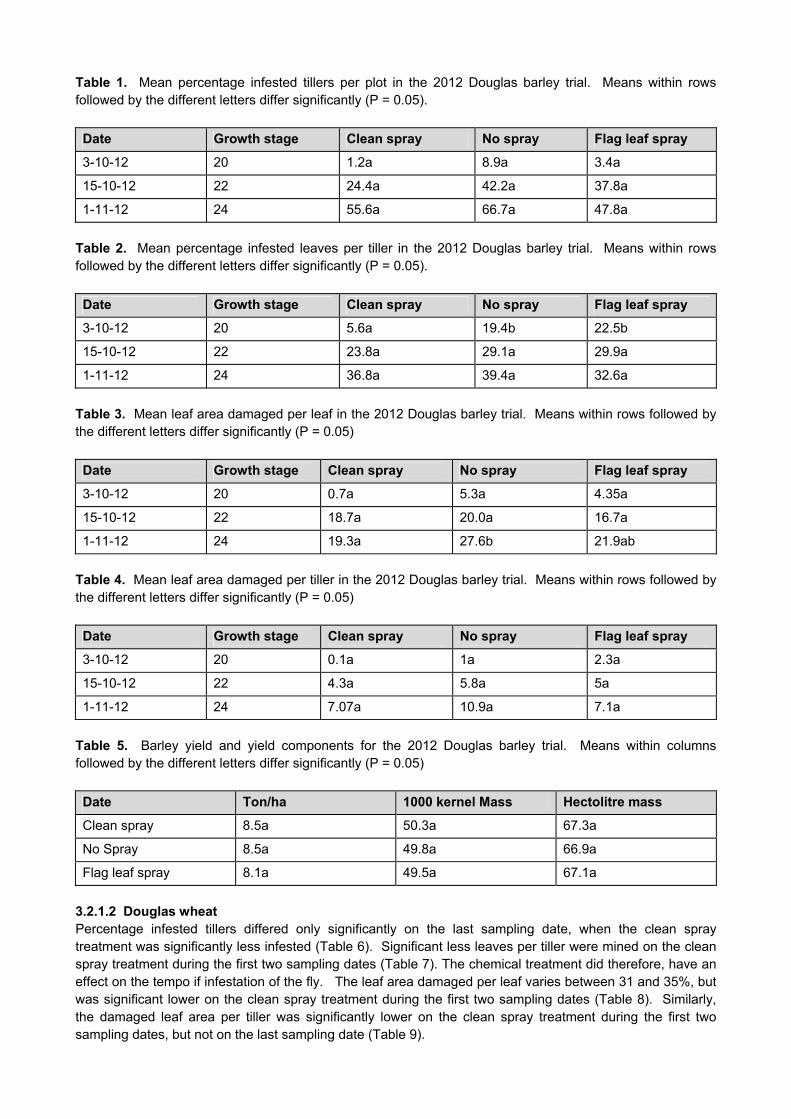
Table 1. Mean percentage infested tillers per plot in the 2012 Douglas barley trial. Means within rows followed by the different letters differ significantly (P = 0.05).
Date Growth stage Clean spray No spray Flag leaf spray
3-10-12 20 1.2a 8.9a 3.4a
15-10-12 22 24.4a 42.2a 37.8a
1-11-12 24 55.6a 66.7a 47.8a
Table 2. Mean percentage infested leaves per tiller in the 2012 Douglas barley trial. Means within rows followed by the different letters differ significantly (P = 0.05).
Date Growth stage Clean spray No spray Flag leaf spray
3-10-12 20 5.6a 19.4b 22.5b
15-10-12 22 23.8a 29.1a 29.9a
1-11-12 24 36.8a 39.4a 32.6a
Table 3. Mean leaf area damaged per leaf in the 2012 Douglas barley trial. Means within rows followed by the different letters differ significantly (P = 0.05)
Date Growth stage Clean spray No spray Flag leaf spray
3-10-12 20 0.7a 5.3a 4.35a
15-10-12 22 18.7a 20.0a 16.7a
1-11-12 24 19.3a 27.6b 21.9ab
Table 4. Mean leaf area damaged per tiller in the 2012 Douglas barley trial. Means within rows followed by the different letters differ significantly (P = 0.05)
Date Growth stage Clean spray No spray Flag leaf spray
3-10-12 20 0.1a 1a 2.3a
15-10-12 22 4.3a 5.8a 5a
1-11-12 24 7.07a 10.9a 7.1a
Table 5. Barley yield and yield components for the 2012 Douglas barley trial. Means within columns followed by the different letters differ significantly (P = 0.05)
Date Ton/ha 1000 kernel Mass Hectolitre mass
Clean spray 8.5a 50.3a 67.3a
No Spray 8.5a 49.8a 66.9a
Flag leaf spray 8.1a 49.5a 67.1a
3.2.1.2 Douglas wheat Percentage infested tillers differed only significantly on the last sampling date, when the clean spray treatment was significantly less infested (Table 6). Significant less leaves per tiller were mined on the clean spray treatment during the first two sampling dates (Table 7). The chemical treatment did therefore, have an effect on the tempo if infestation of the fly. The leaf area damaged per leaf varies between 31 and 35%, but was significant lower on the clean spray treatment during the first two sampling dates (Table 8). Similarly, the damaged leaf area per tiller was significantly lower on the clean spray treatment during the first two sampling dates, but not on the last sampling date (Table 9).

Table 6. Mean percentage infested tillers per plot in the 2012 Douglas barley trial. Means within rows followed by the different letters differ significantly (P = 0.05).
Date Growth stage Clean spray No spray Flag leaf spray
3-10-12 18 42.2a 78.9a 63.3a
15-10-12 21 37.8a 55.6a 44.5a
1-11-12 23 3.3a 28.9b 21.1b
Table 7. Mean percentage infested leaves per tiller in the 2012 Douglas barley trial. Means within rows followed by the different letters differ significantly (P = 0.05)
Date Growth stage Clean spray No spray Flag leaf spray
3-10-12 18 23.3a 33.9b 32.5b
15-10-12 21 30.3a 31.8b 35.4c
1-11-12 23 19.4a 33.1a 31.7a
Table 8. Mean leaf area damaged per leaf in the 2012 Douglas barley trial. Means within rows followed by the different letters differ significantly (P = 0.05)
Date Growth stage Clean spray No spray Flag leaf spray
3-10-12 18 12.1a 19.6a 24a
15-10-12 21 14.5a 20.2b 21.5b
1-11-12 23 5.2a 18.5a 21.3a
Table 9. Mean leaf area damaged per tiller in the 2012 Douglas barley trial. Means within rows followed by the different letters differ significantly (P = 0.05)
Date Growth stage Clean spray No spray Flag leaf spray
3-10-12 18 2.8a 6.7a 7.8a
15-10-12 21 4.4a 6.4b 7.6b
1-11-12 23 1.63a 6.12a 6.69a
When data was grouped together to determine the overall effect, the clean spray treatment did have a supressing effect on leaf miner infestation (Fig. 4). Compared to the barley results, it seemed that the insecticide was far more effective on the wheat. The no spray treatment had more than 50% infested tillers, while more than six percent of the leaf surface on a tiller was damaged (Fig. 6A, C). In contrast the overall infestation on the clean spray treatment was half as much (Fig. 6A, C). In spite of these differences, the trial yield and yield components showed no significant differences between treatments (Table 10). Once again, the percentage leaf area that was lost, is lower than 10% and it means that more than 90% of the leaf area is still available for photosynthesis. The farmer sprayed his field for leaf miner, but closed the nozzles when it moved over the trials. This caused a reduction in the number of flies present in the surrounding field, which reduced the infestation pressure in the trial.

0
10
20
30
40
50
60
Clean spray No Spray Flag leaf spray
% in
fest
ed t
iller
s
A
0
5
10
15
20
25
Clean spray No Spray Flag leaf spray
%le
afa
rea/
leaf
dam
aged
LSD = 4.288
B
0
1
2
3
4
5
6
7
8
9
Clean spray No Spray Flag leaf spray
% le
afar
ea p
er t
iller
dam
aged
C Figure 4. The mean number of infested tillers (A), percentage leaf area damaged per leaf (B) and the percentage leaf area damaged per tiller grouped for all three sampling dates of the wheat trial in Douglas during 2012 Table 10. Wheat yield and yield components for the 2012 Douglas trial. Means within columns followed by the different letters differ significantly (P = 0.05)
Date Ton/ha 1000 kernel Mass Hectolitre mass
Clean spray 7a 31.5a 71.1a
No Spray 6.4a 32.3a 69.7a
Flag leaf spray 7.1a 32.7a 70.7a
3.2.3.3 Vaalharts barley At the first sampling date, the percentage infested tillers on both the clean spray and volatile treatments were significant lower than the other treatments (Table 11). The volatile treatment seemed to have an effect on leaf miner infestation. For the second volatile application, the liquid wax was mixed with sawdust for easier application. The change in formulation seems to release the volatiles in a much shorter period, resulting in the same infestation level as the no spray and flag leaf spray treatments (Table 11). The number of leaves infested per tiller was not influenced by the spray or volatile treatments on the first two sampling dates, but significant differences occurred on the last sampling date (Table 12). Table 11. Mean percentage infested tillers per plot in the 2012 Vaalharts barley trial. Means within rows followed by the different letters differ significantly (P = 0.05)
Date Growth stage Clean spray Volatile treatment Flag leaf spray No spray
20-09-12 17 6.65a 5.02a 15b 12.5b
9-10-12 20 44.2a 76.7b 68.3b 60.8b
24-10-12 23 16.7a 40.61b 43.11b 55.61c
LSD = 20.58
LSD = 1.308
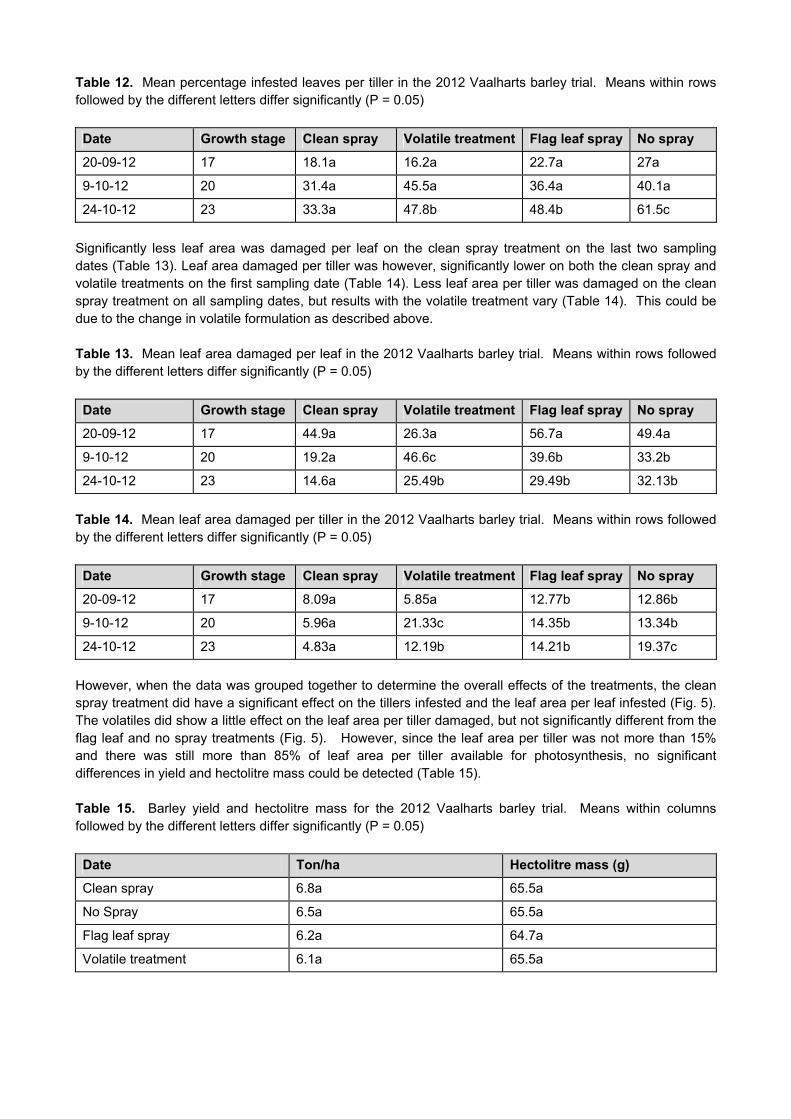
Table 12. Mean percentage infested leaves per tiller in the 2012 Vaalharts barley trial. Means within rows followed by the different letters differ significantly (P = 0.05)
Date Growth stage Clean spray Volatile treatment Flag leaf spray No spray
20-09-12 17 18.1a 16.2a 22.7a 27a
9-10-12 20 31.4a 45.5a 36.4a 40.1a
24-10-12 23 33.3a 47.8b 48.4b 61.5c
Significantly less leaf area was damaged per leaf on the clean spray treatment on the last two sampling dates (Table 13). Leaf area damaged per tiller was however, significantly lower on both the clean spray and volatile treatments on the first sampling date (Table 14). Less leaf area per tiller was damaged on the clean spray treatment on all sampling dates, but results with the volatile treatment vary (Table 14). This could be due to the change in volatile formulation as described above. Table 13. Mean leaf area damaged per leaf in the 2012 Vaalharts barley trial. Means within rows followed by the different letters differ significantly (P = 0.05)
Date Growth stage Clean spray Volatile treatment Flag leaf spray No spray
20-09-12 17 44.9a 26.3a 56.7a 49.4a
9-10-12 20 19.2a 46.6c 39.6b 33.2b
24-10-12 23 14.6a 25.49b 29.49b 32.13b
Table 14. Mean leaf area damaged per tiller in the 2012 Vaalharts barley trial. Means within rows followed by the different letters differ significantly (P = 0.05)
Date Growth stage Clean spray Volatile treatment Flag leaf spray No spray
20-09-12 17 8.09a 5.85a 12.77b 12.86b
9-10-12 20 5.96a 21.33c 14.35b 13.34b
24-10-12 23 4.83a 12.19b 14.21b 19.37c
However, when the data was grouped together to determine the overall effects of the treatments, the clean spray treatment did have a significant effect on the tillers infested and the leaf area per leaf infested (Fig. 5). The volatiles did show a little effect on the leaf area per tiller damaged, but not significantly different from the flag leaf and no spray treatments (Fig. 5). However, since the leaf area per tiller was not more than 15% and there was still more than 85% of leaf area per tiller available for photosynthesis, no significant differences in yield and hectolitre mass could be detected (Table 15). Table 15. Barley yield and hectolitre mass for the 2012 Vaalharts barley trial. Means within columns followed by the different letters differ significantly (P = 0.05)
Date Ton/ha Hectolitre mass (g)
Clean spray 6.8a 65.5a
No Spray 6.5a 65.5a
Flag leaf spray 6.2a 64.7a
Volatile treatment 6.1a 65.5a
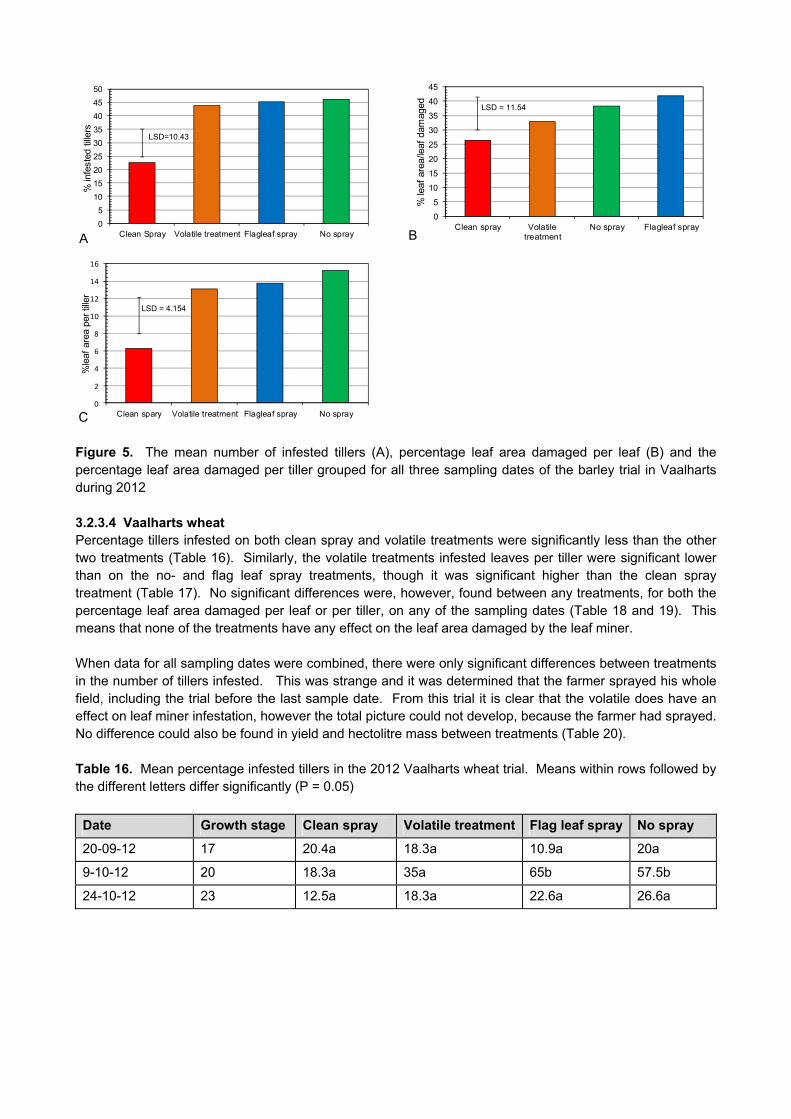
0
5
10
15
20
25
30
35
40
45
50
Clean Spray Volatile treatment Flagleaf spray No spray
% in
fest
ed t
iller
s
0
5
10
15
20
25
30
35
40
45
Clean spray Volatiletreatment
No spray Flagleaf spray
% le
af a
rea/
leaf
dam
aged
0
2
4
6
8
10
12
14
16
Clean spary Volatile treatment Flagleaf spray No spray
%le
af a
rea
per
tille
r
Figure 5. The mean number of infested tillers (A), percentage leaf area damaged per leaf (B) and the percentage leaf area damaged per tiller grouped for all three sampling dates of the barley trial in Vaalharts during 2012 3.2.3.4 Vaalharts wheat Percentage tillers infested on both clean spray and volatile treatments were significantly less than the other two treatments (Table 16). Similarly, the volatile treatments infested leaves per tiller were significant lower than on the no- and flag leaf spray treatments, though it was significant higher than the clean spray treatment (Table 17). No significant differences were, however, found between any treatments, for both the percentage leaf area damaged per leaf or per tiller, on any of the sampling dates (Table 18 and 19). This means that none of the treatments have any effect on the leaf area damaged by the leaf miner. When data for all sampling dates were combined, there were only significant differences between treatments in the number of tillers infested. This was strange and it was determined that the farmer sprayed his whole field, including the trial before the last sample date. From this trial it is clear that the volatile does have an effect on leaf miner infestation, however the total picture could not develop, because the farmer had sprayed. No difference could also be found in yield and hectolitre mass between treatments (Table 20). Table 16. Mean percentage infested tillers in the 2012 Vaalharts wheat trial. Means within rows followed by the different letters differ significantly (P = 0.05)
Date Growth stage Clean spray Volatile treatment Flag leaf spray No spray
20-09-12 17 20.4a 18.3a 10.9a 20a
9-10-12 20 18.3a 35a 65b 57.5b
24-10-12 23 12.5a 18.3a 22.6a 26.6a
A B
C
LSD=10.43
LSD = 11.54
LSD = 4.154

Table 17. Mean percentage infested leaves per tiller in the 2012 Vaalharts wheat trial. Means within rows followed by the different letters differ significantly (P = 0.05)
Date Growth stage Clean spray Volatile treatment Flag leaf spray No spray
20-09-12 17 19.2a 22.2a 14.6a 20.9a
9-10-12 20 20.4a 29.6b 39.5c 33.5c
24-10-12 23 27.9a 31.4a 30.75a 28.82a
Table 18. Mean leaf area damaged per leaf in the 2012 Vaalharts wheat trial. Means within rows followed by the different letters differ significantly (P = 0.05)
Date Growth stage Clean spray Volatile treatment Flag leaf spray No spray
20-09-12 17 50.4a 34.2a 32.3a 32.3a
9-10-12 20 15.2a 20.7a 21.2a 19.4a
24-10-12 23 14.8a 14.2a 13.3a 14.2a
Table 19. Mean leaf area damaged per tiller in the 2012 Vaalharts wheat trial. Means within rows followed by the different letters differ significantly (P = 0.05)
Date Growth stage Clean spray Volatile treatment Flag leaf spray No spray
20-09-12 17 9.3a 7.2a 6.1a 6.9a
9-10-12 20 3.3a 6.1a 8.5a 6.9a
24-10-12 23 4.1a 4.1a 4.1a 4.5a
Table 20. Wheat yield and hectolitre mass for the 2012 Vaalharts wheat trial. Means within columns followed by the different letters differ significantly (P = 0.05)
Date Ton/ha Hectolitre mass (g)
Clean spray 8.2a 84.1a
No Spray 7.9a 84.2a
Flag leaf spray 8.2a 84.0a
Volatile treatment 8.0a 84.3a
3.2.2 Conclusion Although clean spray treatments were conducted, infestation still occurred on these treatments, which mean that the insecticide is not fully effective. This infestation occurred on the lower leaves as demonstrated by the Vaalharts wheat trial, where the clean spray treatment and the no spray treatment are compared (Fig. 6A, B). This is probably caused by the translaminar action of Abamectin. Since it is sprayed on the upper leaves of the crop, the upper leaves are protected well, but where the action is not up-to standard in the lower leaves, it is not protected well and infestation is possible. Though the upper two leaves were protected during this trial, no significant differences in yield could be realised. The relatively low leaf area damaged per tiller could be one of the main reasons for these results, which means that the plant that is growing under optimal conditions still had enough green leaf surface for photosynthesis.

0
2
4
6
8
10
12
14
16
18
leaf 1 leaf 2 leaf 3 leaf 4 leaf 5 leaf 6 leaf 7
Tota
l in
fest
ed
lea
ves
/ 30
tille
rs
20/09/2012
09/10/2012
24/10/2012
0
5
10
15
20
25
30
35
leaf 1 leaf 2 leaf 3 leaf 4 leaf 5 leaf 6 leaf 7
Total infested leaves/30 tillers
20/09/2012
09/10/2012
24/10/2012
Figure 6. Total infested leaves per 30 tillers on (A) clean spray treatment and (B) no spray treatment on the 2012 Vaalharts wheat trial What is interesting, is that the volatile treatment seems to have an effect on infestation and this should be followed up. If leaf miner does not have a serious effect on the yield itself, a repellent for the flies could be a viable option to keep fly numbers at low levels in the field. 3.4 Suction trap monitoring of flies During the previous seasons’ different flight peaks were identified for leaf miner flies and it was decided to start monitor early in the year to determine if any flight peaks occurred earlier in the year. 3.4.1 Results No flies were present in samples during the first six months of monitoring (Fig. 7). Unfortunately the trap was out of order during August and flies were trapped from the beginning of September till the trap was moved by mid-November. A major flight peak was found by the end of September, when infestations occurred in fields, while a second smaller peak occurred in first half of November (Fig. 7). Time span between the flight peaks were very close to the 30 life span that was determined by Adendorff (2010). The flight pattern followed the same pattern as in 2011. The presence of flies during the summer months seems to be low and not detectable. This highlights the mystery around the survival of the flies under field conditions during summer.
A
B

0
1
2
3
4
5
6
7
8
9
27/2
-5/3
/12
6-1
2/3
/12
dam
ag
ed
12-1
9/3
/12
20-2
6/3
/12
27/3
-2/4
/12
3-1
5/4
/12
dam
ag
ed
16-2
3/4
/12
23-3
0/4
/12
1-2
9/5
/12
dam
ag
ed
30/5
-4/6
/12
4-1
1/6
/12
11-1
8/6
/12
18-2
5/6
/12
25/6
-16
/7
16/7
- 2
3/7
23/7
- 3
0/7
Ou
t of
ord
er
10/9
-17
/9
17/9
-24
/9
24/9
-1/1
0/1
2
1-8
/10
/12
8-1
5/1
0/1
2
15-2
2/1
0/1
2
22-2
9/1
0/1
2
29/1
0-5
/11/1
2
5-1
2/1
1/1
2
12-1
9/1
1/1
2
19-2
6/1
1/1
2
Mean #
flie
s p
er
day
Figure 7. Mean number of Agromyza ocularis flies present in the suction trap samples collected during 2012. Arrows indicate population peaks. 3.5 Rearing methods The colony that was started during 2011, lost its strength with each new cycle until April 2012, when it died out. It was decided to follow different rearing methods by catching flies from heavy infested fields in the Vaallharts area. Flies were caught with a sweep-net and the flies were transferred to a plastic bottle, which was covered with gauze. They were fed with sugar water, which was wiped on the gauze. The flies were released in a cage with wheat and barley plants in the glasshouse. 3.5.3 Results After about two weeks, heavy mined leaves containing many larvae were found in the cage. Leaves were cut and placed into plastic bags for pupation, resulted in many pupae being harvested. The colony was, however, not expanding during the following cycles. Collecting flies in the field seemed to be a good option to start up a new colony, although they seem to lose their strength in the subsequent cycles. 3.6 Olfactometer trials with two volatile substances Since not enough flies could be reared in the glasshouse olfactometer tests, could not be performed. 3.7 Glasshouse trials with wheat and barley Damage by the leaf miners was mimicked in the glasshouse by cutting leaves from plants at certain stages. Since barley showed very little damage, it was decided to repeat the barley trial. The data of both wheat and barley trials were then used to calculate a scale that can be used as an indication of the amount of damage that could be expected in the field. 3.7.1 Results There were no significant differences in the mean number of heads per tiller and the kernels per head (Table 22). The grain weight and thousand kernel mass per head was significantly different during this trial showing an 5.7% yield loss when the flag leaf was cut (Table 22). When both the flag and second leaves were cut, 8.9% yield loss was detected (Table 22). A third trial was conducted, but the difference in yield loss between the two treatments were not significantly different and the trial could not be used.

Table 22. Different yield components of the barley cultivar Puma in the second leaf abscission glasshouse trial
Control Flag leaf cut Flag + 2nd leaf cut
Mean head number per plant 23.8a 20.2a 17.3a
Mean kernel number per head 23.35a 22.2b 22.5c
Mean grain mass per head (g) 1.25a 1.18b 1.14c
Mean thousand kernel mass (g) 53.4a 52.7b 50.4c
3.7.2 Calculation of yield loss for field conditions The data for the three wheat cultivars (Kariega, Duzi and Krokodil) generated during 2011 and data generated from the first two barley trials were used to calculate the mean percentage yield loss (Tables 21 A, B). These means were used to calculate percentage yield loss per tiller in a wheat and barley field situation. Damage was calculated for losing the flag leaf and second leaf surface with increments of 10 -100%, as well as the amounts of tillers infested per field. Table 21. Mean percentage yield loss as measured during glasshouse trials A – Wheat, B - Barley A Flag leaf Flag +2nd leaf
Kariega 17.4 34
Duzi 18.8 36.4
Krokodil 13 31.3
Mean 16.4 33.9
B Flag leaf Flag +2nd leaf
Barley 1 9.8 15.1
Barley 2 5.7 8.9
Mean 7.7 12
Based on the results from the glasshouse trials, it means that when a wheat flag leaf is totally lost, ± 16.4% yield loss could occur. Even worse, if both the flag and second leaves are totally lost, ± 34% yield loss could occur. However, damage of this magnitude is only possible when every tiller in the whole field lost flag leaves. Such severe damage was never found in any field and chances are small to find. From Fig. 8 it is clear that 8.2% or even ± 17% yield would be lost if 50% of the tillers have lost the flag or both the flag and second leaf respectively. A more realistic figure would be that between 10 and 30% of the tillers in a field could be damaged so extremely, that it could realise yield loss of 2 - 5% for the total flag leaf and 3 – 10% when both upper leaves are lost. If we consider the percentage leaf area damaged per tiller during the field trials, it was found to be lower than 10%. This means, that there was still 90% or more leaf area available for photosynthesis, which seemed to be enough without any significant effect on yield. It was, therefore, decided to calculate the yield loss with increments of 10% leaf area lost per leaf/leaves for both scenarios (Tables 23, 24). From Table 23 it is, therefore, possible to experience 4.1% yield loss when 50% leaf area is dead on 50% of all tillers per field. When 50% of both the flag leaf and second leaf are lost on 50% of all tillers per field, this could result in 8.5% yield loss (Table 24). In terms of grain weight, this realise to 328kg and 680kg per hectare for the respective scenarios. The tables could be used to determine potential yield loss when certain amounts of damage occur per field.

Barley experienced much less damage than wheat, probably because it has a small flag leaf and large leaf sheath. Total flag leaf abscission, resulted in 7.8% yield loss, while both upper leaves resulted in 12% loss. To realise this damage in the field again, each and every tiller should experience the loss described. The softer leaves of barley seemed easier mined by the larvae and therefore, more severe damage occurred on this crop. However, when the low level of damage is taken into account, barley can suffer more severe damage than wheat, without much yield loss. Therefore, when the yield loss was expressed in terms of percentage tillers per field, 50% tillers loosing total flag leaves would result in 4% damage (Fig. 9), while the loss of both upper leaves would result in 6% yield loss (Fig. 9). It is only in severe cases that total leaf area is lost, but when there are still some leaf area present, the damage is even less. Therefore, when 50% of the flag leaf are lost on only 50% of the tillers, only 2% (Table 25) yield will be lost. Such infestation and damage to leaf was experienced some times in the past, but the farmers could not experience yield loss during harvesting, because of the low damage level as shown in Table 25. Even when the leaf area of both upper leaves are 50% destroyed, only 3% yield loss (Table 26) will occur, which could be easily missed by farmers as it is only 240kg of grain per hectare.
0
5
10
15
20
25
30
35
40
10 20 30 40 50 60 70 80 90 100
% Y
ield
loss
% tillers infested per field
Flag leaf
Flag and second leaf
Figure 8. Percentage wheat yield loss correlated with the percentage infested tillers per field/hectare Table 23. Percentage wheat yield loss as a product of leaf area lost per flag leaf correlated with the percentage infested tillers per field
Percentage leaf area lost
% infested tillers/field 10% 20% 30% 40% 50% 60% 70% 80% 90% 100%
10 0.16 0.33 0.49 0.66 0.82 0.98 1.15 1.31 1.48 1.64
20 0.33 0.66 0.98 1.31 1.64 1.97 2.30 2.62 2.95 3.28
30 0.49 0.98 1.48 1.97 2.46 2.95 3.44 3.94 4.43 4.92
40 0.66 1.31 1.97 2.62 3.28 3.94 4.59 5.25 5.90 6.56
50 0.82 1.64 2.46 3.28 4.10 4.92 5.74 6.56 7.38 8.20
60 0.98 1.97 2.95 3.94 4.92 5.90 6.89 7.87 8.86 9.84
70 1.15 2.30 3.44 4.59 5.74 6.89 8.04 9.18 10.33 11.48
80 1.31 2.62 3.94 5.25 6.56 7.87 9.18 10.50 11.81 13.12
90 1.48 2.95 4.43 5.90 7.38 8.86 10.33 11.81 13.28 14.76
100 1.64 3.28 4.92 6.56 8.20 9.84 11.48 13.12 14.76 16.40
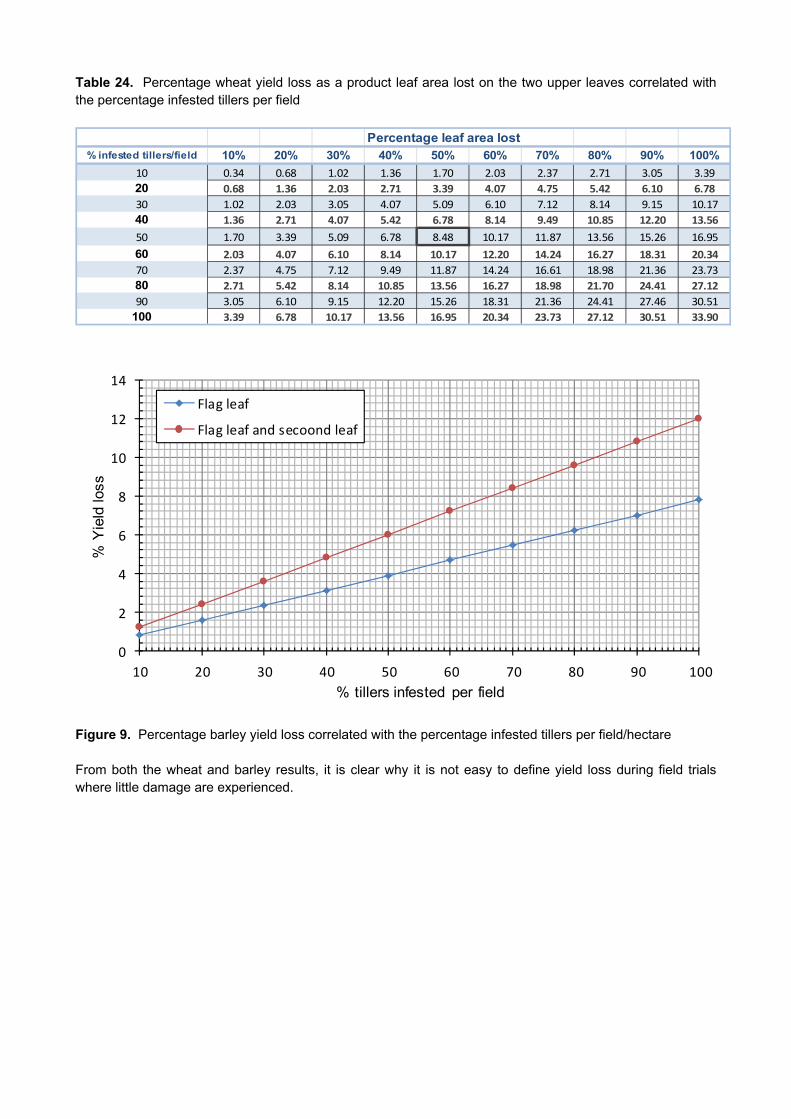
Table 24. Percentage wheat yield loss as a product leaf area lost on the two upper leaves correlated with the percentage infested tillers per field
Percentage leaf area lost % infested tillers/field 10% 20% 30% 40% 50% 60% 70% 80% 90% 100%
10 0.34 0.68 1.02 1.36 1.70 2.03 2.37 2.71 3.05 3.39
20 0.68 1.36 2.03 2.71 3.39 4.07 4.75 5.42 6.10 6.78
30 1.02 2.03 3.05 4.07 5.09 6.10 7.12 8.14 9.15 10.17
40 1.36 2.71 4.07 5.42 6.78 8.14 9.49 10.85 12.20 13.56
50 1.70 3.39 5.09 6.78 8.48 10.17 11.87 13.56 15.26 16.95
60 2.03 4.07 6.10 8.14 10.17 12.20 14.24 16.27 18.31 20.34
70 2.37 4.75 7.12 9.49 11.87 14.24 16.61 18.98 21.36 23.73
80 2.71 5.42 8.14 10.85 13.56 16.27 18.98 21.70 24.41 27.12
90 3.05 6.10 9.15 12.20 15.26 18.31 21.36 24.41 27.46 30.51
100 3.39 6.78 10.17 13.56 16.95 20.34 23.73 27.12 30.51 33.90
0
2
4
6
8
10
12
14
10 20 30 40 50 60 70 80 90 100
% Y
ield
loss
% tillers infested per field
Flag leaf
Flag leaf and secoond leaf
Figure 9. Percentage barley yield loss correlated with the percentage infested tillers per field/hectare From both the wheat and barley results, it is clear why it is not easy to define yield loss during field trials where little damage are experienced.

Table 25. Percentage barley yield loss leaf as a product of area lost per flag leaf and the percentage infested tillers per field
Percentage leaf area lost
% infested tillers/field 10% 20% 30% 40% 50% 60% 70% 80% 90% 100%
10 0.08 0.15 0.23 0.31 0.39 0.46 0.54 0.62 0.69 0.77
20 0.15 0.31 0.46 0.62 0.77 0.92 1.08 1.23 1.39 1.54
30 0.23 0.46 0.69 0.92 1.16 1.39 1.62 1.85 2.08 2.31
40 0.31 0.62 0.92 1.23 1.54 1.85 2.16 2.46 2.77 3.08
50 0.39 0.77 1.16 1.54 1.93 2.31 2.70 3.08 3.47 3.85
60 0.46 0.92 1.39 1.85 2.31 2.77 3.23 3.70 4.16 4.62
70 0.54 1.08 1.62 2.16 2.70 3.23 3.77 4.31 4.85 5.39
80 0.62 1.23 1.85 2.46 3.08 3.70 4.31 4.93 5.54 6.16
90 0.69 1.39 2.08 2.77 3.47 4.16 4.85 5.54 6.24 6.93
100 0.77 1.54 2.31 3.08 3.85 4.62 5.39 6.16 6.93 7.70 Table 26. Percentage barley yield loss as a product of leaf area lost on the two upper leaves correlated with the percentage infested tillers per field
Percentage leaf area lost% infested tillers/field 10% 20% 30% 40% 50% 60% 70% 80% 90% 100%
10 0.12 0.24 0.36 0.48 0.60 0.72 0.84 0.96 1.08 1.20
20 0.24 0.48 0.72 0.96 1.20 1.44 1.68 1.92 2.16 2.40
30 0.36 0.72 1.08 1.44 1.80 2.16 2.52 2.88 3.24 3.60
40 0.48 0.96 1.44 1.92 2.40 2.88 3.36 3.84 4.32 4.80
50 0.60 1.20 1.80 2.40 3.00 3.60 4.20 4.80 5.40 6.00
60 0.72 1.44 2.16 2.88 3.60 4.32 5.04 5.76 6.48 7.20
70 0.84 1.68 2.52 3.36 4.20 5.04 5.88 6.72 7.56 8.40
80 0.96 1.92 2.88 3.84 4.80 5.76 6.72 7.68 8.64 9.60
90 1.08 2.16 3.24 4.32 5.40 6.48 7.56 8.64 9.72 10.80
100 1.20 2.40 3.60 4.80 6.00 7.20 8.40 9.60 10.80 12.00 4 Objectives 2013/14 Test previously tested volatile formulation in a barley and wheat field trial. Mass rear flies from collected flies in the field. Test response of adult flies to four different volatile compounds in the laboratory Monitor the spread of the fly throughout the irrigation areas. Monitor flight patterns of flies with small suction trap.

GK05/19: DEVELOPMENT OF A CONTROL STRATEGY FOR THE LEAF MINER AGROMYZA OCULARIS IN WHEAT AND BARLEY
PROGRESS REPORT APRIL 2012 – MARCH 2013
Summary Number: GK05/19 Title: Development of a control strategy for Agromyza ocularis Duration: 2010 - 2014 Status: Continuation of existing project Project leader: Dr Goddy Prinsloo The spreading of the leaf miner fly seems to be restricted to wet conditions where dense plant growth is present. Although mined leaves were found in the Frankfort and Harrismith areas no serious outbreak conditions were found. These areas should be surveyed in future to determine if it is a growing problem in these areas. The Vaalharts area seems to be the most seriously infected area during 2012. Survival of leaf miners in this area should be investigated. Although clean spray treatments were conducted in the field trials, infestation still occur on these treatments which mean that the insecticide is not fully effective. This infestation was found on the lower leaves, probably because the translaminar action of Abamectin is not good in the lower leaves. Though the upper two leaves were protected during this trial no significant differences in yield could be realised. The relatively low leaf area damaged per tiller could be one of the main reasons for these results, which means that the plant which is growing under optimal conditions had still enough green leaf surface for photosynthesis. No flight patterns could be identified from the suction samples for the first six months of the year, but two flight peaks occurred during the season when they were present in the fields. A diapause in the life cycle could be responsible and the survival of the flies during summer should be investigated. Leaf abscission trials on barley in the greenhouse reveal 5.7% and 8.9% yield loss when the flag leaf and both flag and second leaf was abscise respectively. The mean yield loss determined for wheat and barley were used to extrapolate what happened in the field and to determine the percentage infestation needed to determine when it is really necessary to spray. For wheat it was determined that 8.2% or even ± 17% would be lost if 50% of the tillers have lost the flag or both the flag and second leaf respectively. A more realistic figure would be that between 10 and 30% of the tillers in a field could be extremely damaged, which could realise yield loss of 2 - 5% for the total flag leaf and 3 – 10% when both upper leaves are lost. The percentage leaf area damaged per tiller during the field trials it was found to be lower than 10%. This means that there was still 90% or more leaf area available for photosynthesis which seemed to be enough without any significant effect on yield. It was therefore decided to calculate the yield loss with increments of 10% leaf area lost per leaf/leaves for both scenarios. Calculations showed that 4.1% yield loss would occur when 50% leaf area is dead on 50% of all tillers per field. When 50% of both the flag leaf and second leaf are lost on 50% of all tillers per field this could result in 8.5% yield loss. In terms of grain weight this realise to 328kg and 680kg per hectare for the respective scenarios, which is very low. For barley the damage is even lower. When 50% of the flag leaf area is lost on only 50% of the tillers only 2% yield will be lost. Such infestation and damage to leaf was experienced some times in the past, but the farmers could not experience yield loss during harvesting which is because of the low damage level as shown. Even when the leaf area of both upper leaves are 50% destroyed only 3% yield loss will occur which could be easily missed by farmers because it is only 240kg of grain per hectare. These calculations explains why it is so difficult to show any differences in yield during a field trail, but also that farmers still not experience critical losses due to heavy infestations.

GK 05/20: SEASONAL OCCURRENCE OF FALSE BOLLWORM LEUCANIA LOREYI IN THE NORTHERN CAPE IRRIGATION AREAS
PROGRESS REPORT MARCH 2013
1. Project details Number: GK 05/20 Title: Seasonal occurrence of false bollworm Duration: 2012 - 2016 Status: Continuation of existing project Project leader: Dr Goddy Prinsloo 2 Objectives 2.1 Long-term objectives The long-term objective of the cultivar evaluation programme is as follows: To monitor and map the seasonal occurrence of False armyworm in the Northern Cape irrigation
areas for the establishment of an early warning system for the farmers. 2.2 Short term objectives: 2012/2013 The short term objectives for the 2012/2013 season were as follows: Put traps out at 5 different sites and determine numbers every 14 days . Visit once a month and survey wheat/barley/maize fields for presence of larvae. Send moths for identification to confirm presence. Warn farmers if high numbers are present. Ask farmers to report the presence of larvae and map the presence. Collect climatic data. Collect larvae and establish colony in glasshouse. 3 Report on objectives 3.1 Five trap sites and moth number monitoring Five trap sites were chosen: Douglas, Bull Hill, Vaalharts, Hartswater and Viljoenskroon. Four Delta traps were placed at almost even distances around a centre pivot irrigated field at each site (Fig. 1). These traps contained a female sex pheromone lure, which attract the male moths and a sticky card that male moths could stick to. The traps were emptied, moths counted and the lures replaced at 2 week intervals. Temperatures were also recorded at each site at hourly intervals using an I-button data logger.

Figure 1. logger 3.1.1 ResMoths wereat Douglas,numbers at site was cacorrespondiSeptember did not drop According tthe South Aavailability opossible thatrapping of m Reports froof appearanpart of Chingeneration. conditions. not enough made. 3.2 Month Regular surlarvae. Howof the larvaebarley fieldsHartswater first decide
Delta trap
sults e caught thro between thethe end of Jught during ing drop in m(Fig. 2). At
p to zero betw
to literature, African situaof host plantat moths comoths and th
m the subtronce of a first na, dry weath
From these The same sto make any
hly survey’s
rveys on the wever, it seeme and larvaes during Octarea. Sinceto look out
showing the
oughout the ye beginning July could bemid-Octobermoth numbeViljoenskroo
ween the pea
moths live 1tion, we couts could pos
ould come frherefore, no
opical regiongeneration
her during wie reports it issituation is py conclusions
on wheat/b
crops in thems that diffe
e could not betober, which
e larvae are dt for their dis
pheromone
year at all fivof August an
e related to lor and during ers by the enon, four popuaks (Fig. 2).
0 - 17 days uld expect tossibly play anrom differentclear cyclic p
n of China, sand warm conter and hums clear that fossible in Sos and we nee
barley/maize
vicinity of thrent insectice easily foun is the mostduring the dastinctive fee
e lure inside
ve trap sites nd the end oow temperatthe end of J
nd of July aulation peaks
at temperato see severan important t feeding sitpatterns.
how that temonditions durmid weather false armywouth Africa aed at least a
e fields for p
he traps werecides used bynd. Surveys t important tay hiding un
eding sympto
and the scre
(Fig. 2). A of November tures. The hJanuary 201nd a populas could be id
tures of 20 -al peaks on role. If sevetes and plan
mperatures dring this timeduring sprin
worm outbreaand this shounother years
presence of
e able to givy the farmerswere therefo
time for damder dead lea
oms on plan
een containin
possible mo(Fig. 2). Hoighest moth 3 (Fig. 2). Ation peak wadentified alth
25°C in Japthe graphs ieral food sounts into the
during Deceme, usually leag often resul
aks are the ruld be investis data before
larvae.
e us an indics have an inore, conducte
mage on barlaf material onnts. The diff
ng the temp
oth flight cyclowever, the dnumbers at
At Vaalharts, as recorded
hough the mo
pan. If this win Fig. 2. Hurces are avtraps, causi
mber determads to outbrelted in an injresult of optigated. Data
e any conclus
cation of the nfluence on ted on severaley in the Van the soil sufficulty and h
erature data
e was founddrop in moththe Douglasthere was aduring mid-
oth numbers
was true, forHowever, thevailable, it ising constant
mine the timeeaks. In thisurious fourthimal climatica to date aresions can be
presence ofhe presenceal wheat andaalharts andrface, it was
high level of
a
d h s a -s
r e s t
e s h c e e
f e d d s f
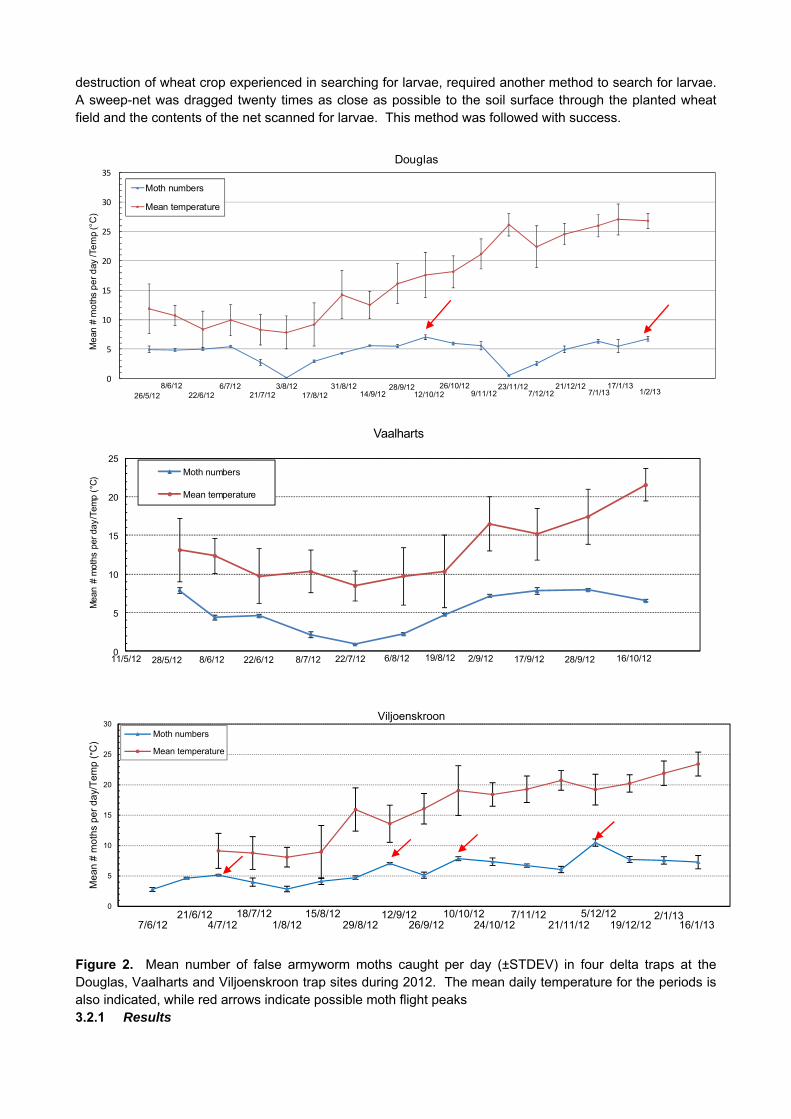
destruction of wheat crop experienced in searching for larvae, required another method to search for larvae. A sweep-net was dragged twenty times as close as possible to the soil surface through the planted wheat field and the contents of the net scanned for larvae. This method was followed with success.
0
5
10
15
20
25
30
35
11 61 111 161 211 261 311
Me
an #
mo
ths
pe
r d
ay /T
em
p (°
C)
Douglas
Moth numbers
Mean temperature
26/5/126/7/12
22/6/128/6/12 31/8/12
17/8/123/8/12
21/7/12 12/10/1214/9/1228/9/12 23/11/1226/10/12 21/12/12
7/12/129/11/12 1/2/1317/1/13
7/1/13
0
5
10
15
20
25
11 31 51 71 91 111 131 151 171 191
Mea
n #
mot
hs p
er d
ay/T
emp
(°C
)
Vaalharts
Moth numbers
Mean temperature
22/6/128/6/12 8/7/12 22/7/12 6/8/12 19/8/12 2/9/12 17/9/12 16/10/1211/5/12 28/5/12 28/9/12
Figure 2. Mean number of false armyworm moths caught per day (±STDEV) in four delta traps at the Douglas, Vaalharts and Viljoenskroon trap sites during 2012. The mean daily temperature for the periods is also indicated, while red arrows indicate possible moth flight peaks 3.2.1 Results
0
5
10
15
20
25
30
24 74 124 174 224 274
Me
an
# m
oth
s p
er
da
y/T
em
p (°C
)
Viljoenskroon
Moth numbers
Mean temperature
4/7/1221/6/12
7/6/1210/10/12
26/9/1215/8/1218/7/12
1/8/12 24/10/1212/9/12
29/8/125/12/12
21/11/127/11/12
16/1/1319/12/122/1/13

Twenty five (Fig. 3) durihave sprayabsent, did leaf miner a
Figure 3. Findicate the Severe feedsite during more than However, mlarvae could
Figure 4. G b
fields in the ng mid-Octo
yed for the lnot contain a
and aphid sp
Fields survey presence of
ding symptoFebruary 2010 m from
maize plantsd not be foun
Grass with febales of whea
Bull Hill, Vaober 2012. Oeaf miner aaphids, whilerays influenc
yed for the pf and absenc
ms were fou013 (Fig. 4).
the bales. s at the Dound (Fig. 5). D
eeding sympat straw at th
alharts and HOnly 32% of tand aphid coe those contace the false a
presence of fce of larvae r
und on grass However, oThe maize
uglas site weDamage to m
ptoms next tohe
Hartswater rthese fields control. Sweaining aphidsarmyworm in
false armyworespectively
s adjacent toonly a few feplants at there showing
maize seems
o Figure 5.
egions werecontained fa
eep-net sams, were also festation.
orm larvae d
o bales of weeding symptis site did n
g feeding sy, however, n
. Feeding sy
inspected folse armyworples from fiecontaining la
uring 2012.
heat straw atoms were fonot contain
ymptoms durot to be econ
ymptoms on
or the presenrm larvae. Melds where arvae. It se
Red and gre
at the Viljoenound on the any feedingring Februarnomically im
a maize leaf
nce of larvaeMany farmers
larvae wereems that the
een markers
nskroon trapsame grass
g symptoms.ry 2013, butportant.
f.
e s e e
s
p s . t
3.3 Moth identification, warning of farmers on presence of larvae, farmer reports on the presence of larvae and the start of a glasshouse colony. Confirmation of moth identity is important to make sure that the numbers presented in the graphs represent sound data. Since the aim of this project is to develop an early warning system for the farmers, it is important to keep information exchange channels between farmers and researchers open. Reports by farmers on damage are essential for keeping track on the seriousness of the problem. Glasshouse rearing of the pest will enable us to test alternative control options like biological control agents such as fungi, which could have great potential for control. 3.3.1 Results Moths caught in Delta traps at Bull Hill, Vaalharts and Hartswater was confirmed by the Biosystematics division of the ARC-Plant Protection Research Institute to be false armyworm, Leucania loreyi. After the larval surveys in October, two radio talks were presented (RSG Landbou and OFM Landbounuus), during which farmers were informed about the presence of larvae and the seriousness of the condition as well as when to control. Farmers were also asked to report the presence of larvae. Trap results were also presented at the annual Allgro Marketing conference at Magaliesburg on 14 March 2013. Since no outbreak of the pest occurred, not enough larvae could be collected to start a glasshouse colony. An attempt to collect moths to start a colony, also failed. 4 General Conclusion Since this it is the first year of data collection, not enough data are available to make any sound conclusions. Continuous data collection for another period of one year could reveal a better picture on the cyclic appearance of the moths. 5 Short term objectives 2013/14 The short term objectives for the 2013/2014 season are as follows: Continue with the collection of moths and climatic data at different sites. Scan fields at trap sites on regular basis for presence of larvae. Communicate presence of larvae with farmers. Collect larvae and establish colony in glasshouse.

GK 05/20: SEASONAL OCCURRENCE OF FALSE BOLLWORM LEUCANIA LOREYI IN THE NORTHERN CAPE IRRIGATION AREAS
PROGRESS REPORT MARCH 2013
Summary Number: GK05/20 Title: Seasonal occurrence of False Armyworm Leucania loreyi Duration: 2010 - 2016 Status: Continuation of existing project Project leader: Dr Goddy Prinsloo Five trap sites were chosen: Douglas, Bull Hill, Vaalharts, Hartswater and Viljoenskroon. Four Delta traps were used to monitor flight patterns of moths at each site. These traps each contains a female sex pheromone lure that attracts the male moths and a sticky card, which male moths could stick to. The traps were emptied, moths counted and the lures replaced at 2 week intervals. Temperatures were also recorded at each site, at hourly intervals, using an I-button data logger. Moths were caught throughout the year at all five trap sites and were confirmed to be false armyworm. Moth flight data and temperatures did not correlate and one possible population peak could be identified at the Douglas site. More data are, however, needed to show repeatable patterns. Twenty five fields in the Bull Hill, Vaalharts and Hartswater regions were surveyed for the presence of larvae during mid-October 2012. Only 32% of these fields contained false armyworm larvae. Many farmers had sprayed for leaf miner and aphid control. Sweep-net samples from most of the fields where larvae were absent did not contain aphids, while those containing aphids were also containing larvae. It seems that the leaf miner and aphid sprays, influence the false armyworm infestation. Severe feeding symptoms were found on grass adjacent to bales of wheat straw at the Viljoenskroon trap site during February 2013, while only a few on the same grass more than 10m away from the wheat straw. Maize plants on the field at this site were not showing any feeding symptoms. However, maize plants at the Douglas site were showing feeding symptoms, but larvae could not be found. Damage to maize seems, however, not to be economically important. Farmers were informed about the presence of larvae and that an outbreak seems not to happen during two radio talks. Since this it is the first year of data collection, not enough data are available to make any sound conclusions. Continuous data collection during the next year is necessary to reveal a better picture on the cyclic appearance of the moths and feeding symptoms.

GK 05/21: EARLY WARNING SYSTEM FOR THE CONTROL OF BARLEY YELLOW DWARF VIRUS TRANSMISSION TO WHEAT CROP UNDER IRRIGATION
PROGRESS REPORT APRIL 2013
1. Project details Number: GK 05/20 Title: Early warning system for Barley yellow dwarf virus transmission Duration: 2013 - 2015 Status: New project Project leader: Dr Goddy Prinsloo 2. Long-term objective Monitor aphid migration by using 12 m high suction trap Identification of aphid species Make information available to farmers via website Develop a forecasting system for farmers 3. Short term objectives 2013/2014 Building and installation of suction traps (April – June 2013) Search for cooperator to sort and identify aphids (April – June 2013) Monitor aphid numbers (July – March 2014) and put on website Monitor climatic data. Monitor the presence of virus infection on an unsprayed field Analyze data (Jan – March 2014) Abstract Farmers in the Bergville and Winterton area have for the past five years annually experienced problems with barley yellow dwarf virus (BYDV) on wheat. This preventative spraying has become a standard practice during the past 3-4 years. The first of these sprays are applied 10-14 days after wheat emergence. During 2012, at least 5 000 ha were influenced in this area, either through spraying or yield loss. Some farmers did not manage to spray during the first 14 days and their crop was heavily infected with the virus after aphid feeding. According to these farmers, they have lost between 25 and 30% (at least 2 t/ha) of their crop. A trial conducted in that area during 2012, showed that the thousand kernel mass of the cultivar Kariega differed by 33.5% between infected and clean heads at the end of the season, which compares with the yield loss that farmers experienced. It means that in this area, farmers could lose at least R6 000/ha if they don’t spray. The potential damage that this disease can cause in the KwaZulu-Natal irrigation areas, when wheat is not sprayed with insecticides, could therefore be up to R30 m. depending on the wheat price. Yield losses of this magnitude will have a major impact on wheat farmers in this area, as well as in other irrigation areas, especially if the rising production costs are taken into account. KwaZulu-Natal is probably the most severely infected area in the country, but BYDV infection is also known to regularly occur in the irrigation areas of Limpopo and Mpumalanga, where farmers also apply preventative spraying, while some symptoms have been observed in the Northern Cape irrigation areas during 2012. Continued use of insecticide sprays may over time result in the development of insecticide resistance in the aphids, which could cause major problems. It is, therefore, essential to minimize the insecticide sprays in this area. The erection of for suction traps will be completed before the end of June 2013. These traps are situated in the Groblersdal, Koedoeskop, Brits and Winterton areas. The project is run in collaboration with Potatoes

South Africa and the University of Pretoria. There are already 9 traps in operation in different areas where potatoes are produced in the country. Two of these areas are Douglas and Christiana, which is overlapping with wheat production under irrigation. We thus have an agreement with Potatoes South Africa, that we will share the data from the traps that is beneficial to both the wheat and potato industries.

GK 06/02: OPTIMISATION OF HERBICIDE EFFICACY PROGRESS REPORT APRIL 2012 TO MARCH 2013
1. Project Details Number: GK 06/02 Title: Optimisation of Herbicide Efficacy Duration: 1997 - 2014 Status: Continuation of existing project Project Leader: Ms Hestia Nienaber 2. Long-term Objective This project aims to provide technology to optimise the efficacy of herbicides. 3. Short Term Objectives To screen different herbicides with different adjuvants Technology transfer 4. Report on the objectives April 2012 – March 2013 The major small grain production areas of South Africa are the Free State and the Western Cape, although the Western Cape produces the greater part of small grains. Different water sources are used for the production of small grains throughout South Africa. For instance, the producers from the Swartland in the Western Cape mainly use borehole water, which has poor water quality and can be classified as hard and brackish water. A small portion of producers in the Swartland use canal water, which is generally seen as better quality water than borehole water. In the Rûens, the situation is turned around, with the majority of producers using good quality canal water and a small fraction of producers using poorer quality borehole water. When water of poor quality is used in spray mixtures, antagonism may occur. Antagonism is defined as an interaction of two or more chemicals, such that the effect when combined is less than the predicted effect based on the activity of each chemical applied separately. Herbicides, such as glyphosate, which are weak acids, are especially sensitive to water quality. The addition of an activator adjuvant such as ammonium sulphate (AMS) can overcome this antagonism. It must, however, be mentioned that not only water quality can cause antagonism, but also spray mixtures including different components such as herbicides, adjuvants and foliar feeds. No matter what caused the antagonism, antagonism in the spray mixture causes reduced weed control and unnecessary financial expenses since; the crop may need to be re-sprayed with the same or other herbicides for effective weed control; weed control is one of the largest input costs in small grain production, it is necessary to find ways to overcome antagonism, so that optimum weed control can be obtained. The main objective of this project is to seek solutions for overcoming the problem of antagonistic spray mixtures in South Africa. 16 experiments were conducted during the 2012/2013 season. Experiments were conducted on Axial®, Glygran®, Imazamaxx®, Roundup Turbo®, Roundup Power Max® and MCPA® to determine the effect of various adjuvants and buffers on the percentage weed control of these different herbicides. Experiments were also conducted to test a trial adjuvant for use with Roundup Power

Max® and to test different adjuvants with Mamba DMA. Experiments conducted are explained below; indicating the herbicide used, the type of experiment conducted and the amount of experiments done in the specific topic in brackets. Axial® – testing various adjuvants (2) Aixial® – testing salt antagonism (2) MCPA® & Glygran® - testing for antagonism (2) Imazamaxx® - testing three ammonium sulphates (2) Roundup Turbo® – mixing order (2) Roundup Power Max® – mixing order (2) Roundup Power Max® – testing a trial adjuvant (2) Mamba DMA – testing different adjuvants (2)
Results and discussion Objective 1: To screen different herbicides with different adjuvants Axial® is an emulsifiable concentrate herbicide for the selective post-emergence control of annual grasses in wheat and barley in the Western and Southern Cape and in dryland and irrigated areas of the summer rainfall region. Its active ingredient is pinoxaden (46 g/ℓ). Axial® is classified as a Group A herbicide (HRAC mode of action poster, 2008). Four experiments were conducted with Axial® to 1) determine the effect of several adjuvants on the herbicide efficacy and 2) to determine if Axial® is sensitive to water quality. The results are indicated in Table 1-2. Table 1. Testing the effect of several adjuvants on the efficacy of Axial® (efficacy indicated as percentage control)
Herbicide Rate ( /40 mℓ) Adjuvant Rate ( /40 mℓ) % Control
Axial® 0.16 mℓ - - 68.13
Axial® 0.16 mℓ Villa 51 0.04 mℓ 89.84
Axial® 0.16 mℓ Enhance 0.10 mℓ 97.30
Axial® 0.16 mℓ Tronic 0.06 mℓ 100.00
Axial® 0.16 mℓ Wetcit 0.04 mℓ 100.00
Axial® 0.16 mℓ Imiboost 0.80 mℓ 100.00
Axial® 0.16 mℓ AMS 0.40 mℓ 100.00
Axial® 0.16 mℓ Silwet 0.02 mℓ 100.00
Axial® 0.16 mℓ Exit 0.037 mℓ 100.00
Axial® 0.16 mℓ Break-Thru 0.02 mℓ 100.00
Axial® 0.16 mℓ Tru-Shield 0.02 mℓ 100.00
Axial® 0.16 mℓ Reverseal 10 0.10 mℓ 100.00
Axial® 0.16 mℓ Li-700 0.08 mℓ 100.00
Axial® 0.16 mℓ Complement 0.10 mℓ 100.00 LSD0.05 = 7.509
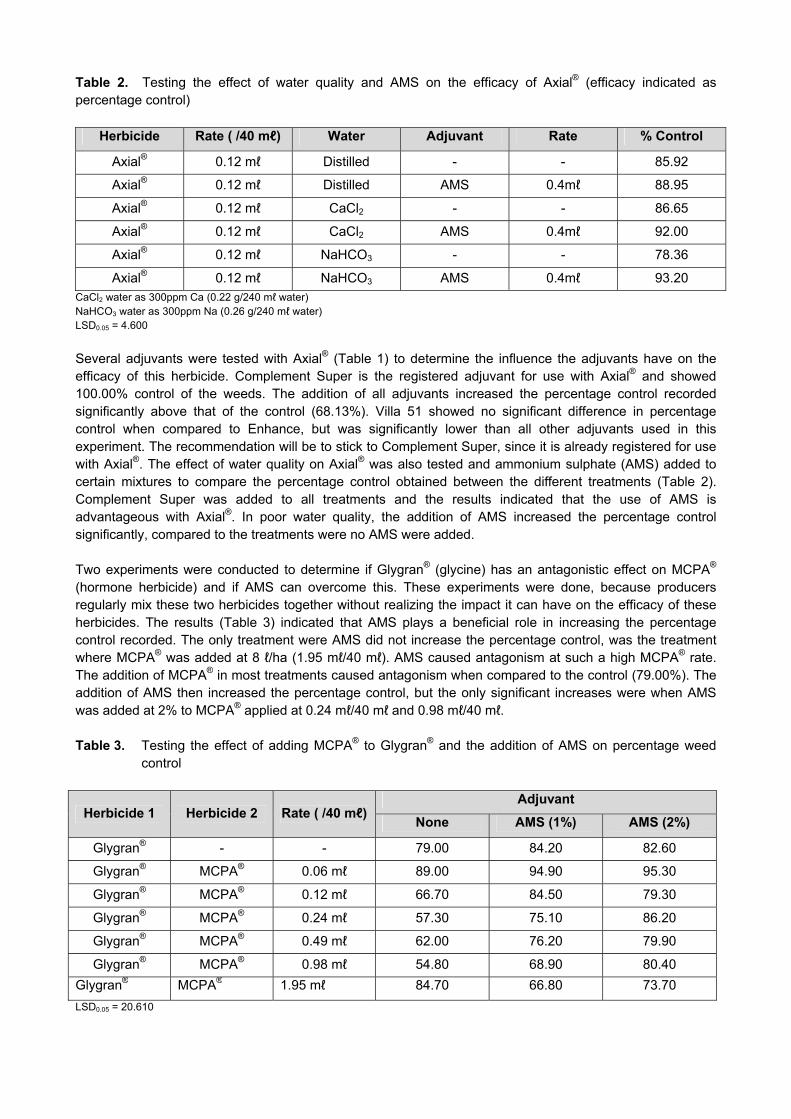
Table 2. Testing the effect of water quality and AMS on the efficacy of Axial® (efficacy indicated as percentage control)
Herbicide Rate ( /40 mℓ) Water Adjuvant Rate % Control
Axial® 0.12 mℓ Distilled - - 85.92
Axial® 0.12 mℓ Distilled AMS 0.4mℓ 88.95
Axial® 0.12 mℓ CaCl2 - - 86.65
Axial® 0.12 mℓ CaCl2 AMS 0.4mℓ 92.00
Axial® 0.12 mℓ NaHCO3 - - 78.36
Axial® 0.12 mℓ NaHCO3 AMS 0.4mℓ 93.20 CaCl2 water as 300ppm Ca (0.22 g/240 mℓ water) NaHCO3 water as 300ppm Na (0.26 g/240 mℓ water) LSD0.05 = 4.600
Several adjuvants were tested with Axial® (Table 1) to determine the influence the adjuvants have on the efficacy of this herbicide. Complement Super is the registered adjuvant for use with Axial® and showed 100.00% control of the weeds. The addition of all adjuvants increased the percentage control recorded significantly above that of the control (68.13%). Villa 51 showed no significant difference in percentage control when compared to Enhance, but was significantly lower than all other adjuvants used in this experiment. The recommendation will be to stick to Complement Super, since it is already registered for use with Axial®. The effect of water quality on Axial® was also tested and ammonium sulphate (AMS) added to certain mixtures to compare the percentage control obtained between the different treatments (Table 2). Complement Super was added to all treatments and the results indicated that the use of AMS is advantageous with Axial®. In poor water quality, the addition of AMS increased the percentage control significantly, compared to the treatments were no AMS were added. Two experiments were conducted to determine if Glygran® (glycine) has an antagonistic effect on MCPA® (hormone herbicide) and if AMS can overcome this. These experiments were done, because producers regularly mix these two herbicides together without realizing the impact it can have on the efficacy of these herbicides. The results (Table 3) indicated that AMS plays a beneficial role in increasing the percentage control recorded. The only treatment were AMS did not increase the percentage control, was the treatment where MCPA® was added at 8 ℓ/ha (1.95 mℓ/40 mℓ). AMS caused antagonism at such a high MCPA® rate. The addition of MCPA® in most treatments caused antagonism when compared to the control (79.00%). The addition of AMS then increased the percentage control, but the only significant increases were when AMS was added at 2% to MCPA® applied at 0.24 mℓ/40 mℓ and 0.98 mℓ/40 mℓ. Table 3. Testing the effect of adding MCPA® to Glygran® and the addition of AMS on percentage weed
control
Herbicide 1 Herbicide 2 Rate ( /40 mℓ) Adjuvant
None AMS (1%) AMS (2%)
Glygran® - - 79.00 84.20 82.60
Glygran® MCPA® 0.06 mℓ 89.00 94.90 95.30
Glygran® MCPA® 0.12 mℓ 66.70 84.50 79.30
Glygran® MCPA® 0.24 mℓ 57.30 75.10 86.20
Glygran® MCPA® 0.49 mℓ 62.00 76.20 79.90
Glygran® MCPA® 0.98 mℓ 54.80 68.90 80.40
Glygran® MCPA® 1.95 mℓ 84.70 66.80 73.70
LSD0.05 = 20.610
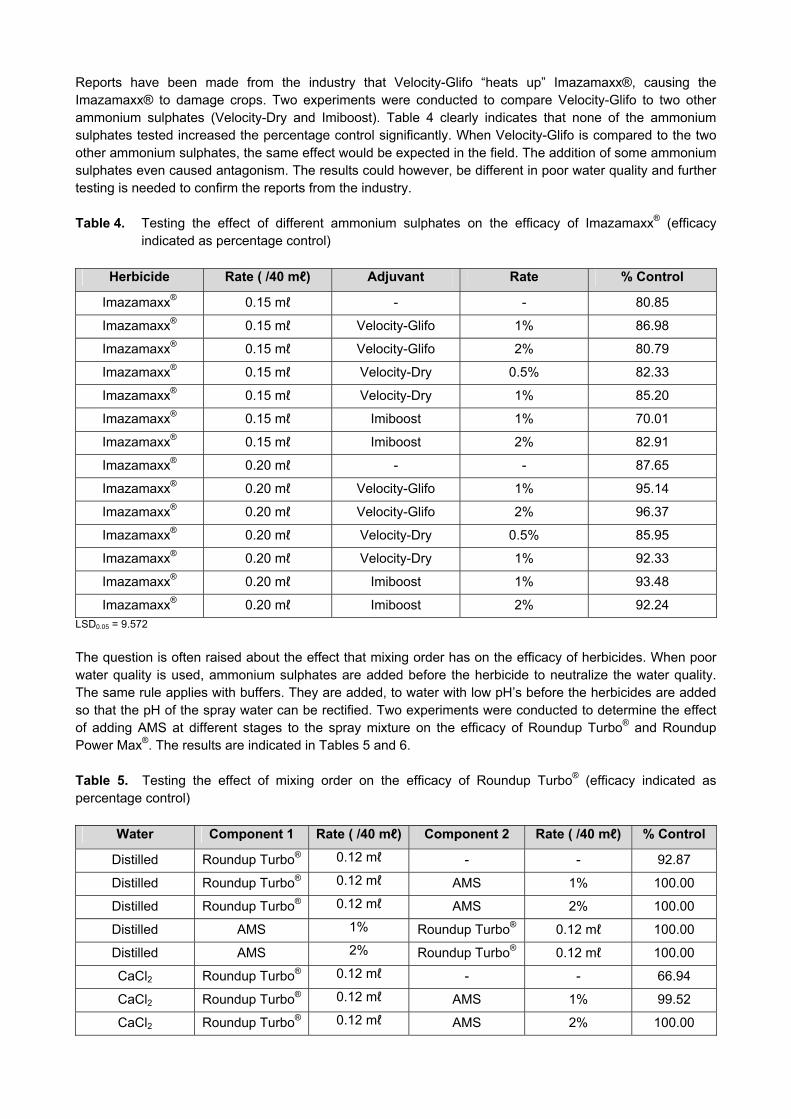
Reports have been made from the industry that Velocity-Glifo “heats up” Imazamaxx®, causing the Imazamaxx® to damage crops. Two experiments were conducted to compare Velocity-Glifo to two other ammonium sulphates (Velocity-Dry and Imiboost). Table 4 clearly indicates that none of the ammonium sulphates tested increased the percentage control significantly. When Velocity-Glifo is compared to the two other ammonium sulphates, the same effect would be expected in the field. The addition of some ammonium sulphates even caused antagonism. The results could however, be different in poor water quality and further testing is needed to confirm the reports from the industry. Table 4. Testing the effect of different ammonium sulphates on the efficacy of Imazamaxx® (efficacy
indicated as percentage control)
Herbicide Rate ( /40 mℓ) Adjuvant Rate % Control
Imazamaxx® 0.15 mℓ - - 80.85
Imazamaxx® 0.15 mℓ Velocity-Glifo 1% 86.98
Imazamaxx® 0.15 mℓ Velocity-Glifo 2% 80.79
Imazamaxx® 0.15 mℓ Velocity-Dry 0.5% 82.33
Imazamaxx® 0.15 mℓ Velocity-Dry 1% 85.20
Imazamaxx® 0.15 mℓ Imiboost 1% 70.01
Imazamaxx® 0.15 mℓ Imiboost 2% 82.91
Imazamaxx® 0.20 mℓ - - 87.65
Imazamaxx® 0.20 mℓ Velocity-Glifo 1% 95.14
Imazamaxx® 0.20 mℓ Velocity-Glifo 2% 96.37
Imazamaxx® 0.20 mℓ Velocity-Dry 0.5% 85.95
Imazamaxx® 0.20 mℓ Velocity-Dry 1% 92.33
Imazamaxx® 0.20 mℓ Imiboost 1% 93.48
Imazamaxx® 0.20 mℓ Imiboost 2% 92.24 LSD0.05 = 9.572
The question is often raised about the effect that mixing order has on the efficacy of herbicides. When poor water quality is used, ammonium sulphates are added before the herbicide to neutralize the water quality. The same rule applies with buffers. They are added, to water with low pH’s before the herbicides are added so that the pH of the spray water can be rectified. Two experiments were conducted to determine the effect of adding AMS at different stages to the spray mixture on the efficacy of Roundup Turbo® and Roundup Power Max®. The results are indicated in Tables 5 and 6. Table 5. Testing the effect of mixing order on the efficacy of Roundup Turbo® (efficacy indicated as percentage control)
Water Component 1 Rate ( /40 mℓ) Component 2 Rate ( /40 mℓ) % Control
Distilled Roundup Turbo® 0.12 mℓ - - 92.87
Distilled Roundup Turbo® 0.12 mℓ AMS 1% 100.00
Distilled Roundup Turbo® 0.12 mℓ AMS 2% 100.00
Distilled AMS 1% Roundup Turbo® 0.12 mℓ 100.00
Distilled AMS 2% Roundup Turbo® 0.12 mℓ 100.00
CaCl2 Roundup Turbo® 0.12 mℓ - - 66.94
CaCl2 Roundup Turbo® 0.12 mℓ AMS 1% 99.52
CaCl2 Roundup Turbo® 0.12 mℓ AMS 2% 100.00
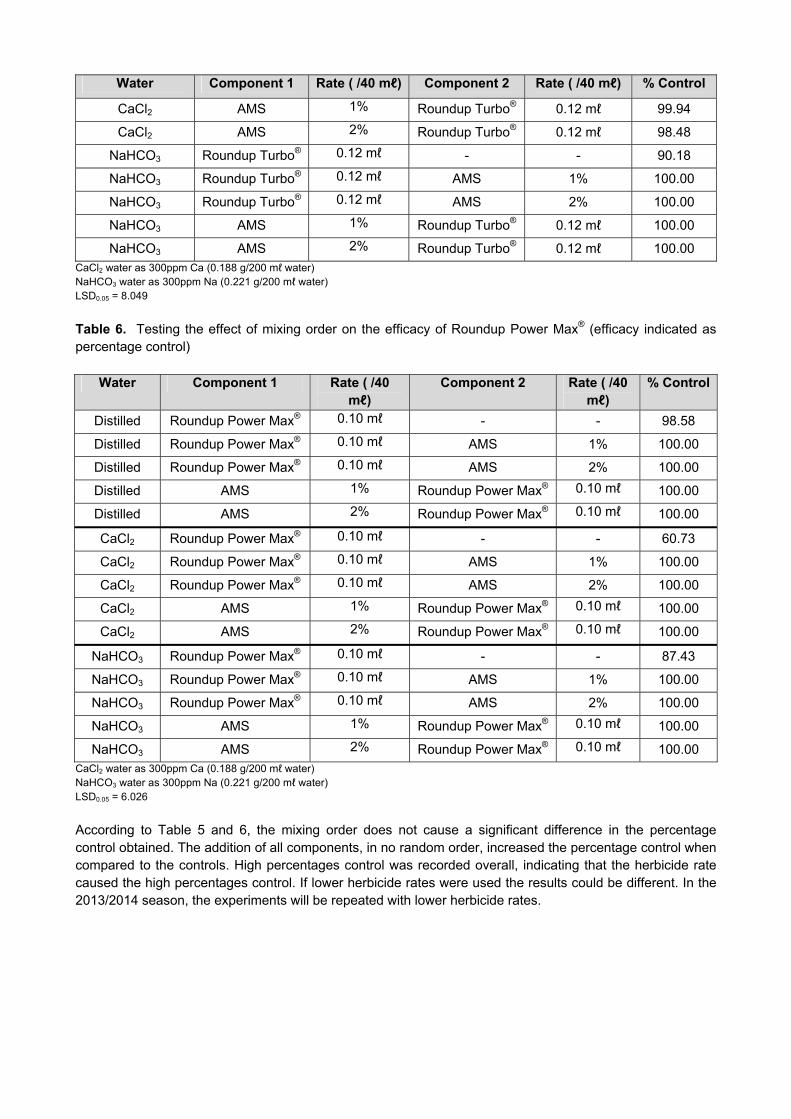
Water Component 1 Rate ( /40 mℓ) Component 2 Rate ( /40 mℓ) % Control
CaCl2 AMS 1% Roundup Turbo® 0.12 mℓ 99.94
CaCl2 AMS 2% Roundup Turbo® 0.12 mℓ 98.48
NaHCO3 Roundup Turbo® 0.12 mℓ - - 90.18
NaHCO3 Roundup Turbo® 0.12 mℓ AMS 1% 100.00
NaHCO3 Roundup Turbo® 0.12 mℓ AMS 2% 100.00
NaHCO3 AMS 1% Roundup Turbo® 0.12 mℓ 100.00
NaHCO3 AMS 2% Roundup Turbo® 0.12 mℓ 100.00 CaCl2 water as 300ppm Ca (0.188 g/200 mℓ water) NaHCO3 water as 300ppm Na (0.221 g/200 mℓ water) LSD0.05 = 8.049
Table 6. Testing the effect of mixing order on the efficacy of Roundup Power Max® (efficacy indicated as percentage control)
Water Component 1 Rate ( /40 mℓ)
Component 2 Rate ( /40 mℓ)
% Control
Distilled Roundup Power Max® 0.10 mℓ - - 98.58
Distilled Roundup Power Max® 0.10 mℓ AMS 1% 100.00
Distilled Roundup Power Max® 0.10 mℓ AMS 2% 100.00
Distilled AMS 1% Roundup Power Max® 0.10 mℓ 100.00
Distilled AMS 2% Roundup Power Max® 0.10 mℓ 100.00
CaCl2 Roundup Power Max® 0.10 mℓ - - 60.73
CaCl2 Roundup Power Max® 0.10 mℓ AMS 1% 100.00
CaCl2 Roundup Power Max® 0.10 mℓ AMS 2% 100.00
CaCl2 AMS 1% Roundup Power Max® 0.10 mℓ 100.00
CaCl2 AMS 2% Roundup Power Max® 0.10 mℓ 100.00
NaHCO3 Roundup Power Max® 0.10 mℓ - - 87.43
NaHCO3 Roundup Power Max® 0.10 mℓ AMS 1% 100.00
NaHCO3 Roundup Power Max® 0.10 mℓ AMS 2% 100.00
NaHCO3 AMS 1% Roundup Power Max® 0.10 mℓ 100.00
NaHCO3 AMS 2% Roundup Power Max® 0.10 mℓ 100.00 CaCl2 water as 300ppm Ca (0.188 g/200 mℓ water) NaHCO3 water as 300ppm Na (0.221 g/200 mℓ water) LSD0.05 = 6.026
According to Table 5 and 6, the mixing order does not cause a significant difference in the percentage control obtained. The addition of all components, in no random order, increased the percentage control when compared to the controls. High percentages control was recorded overall, indicating that the herbicide rate caused the high percentages control. If lower herbicide rates were used the results could be different. In the 2013/2014 season, the experiments will be repeated with lower herbicide rates.
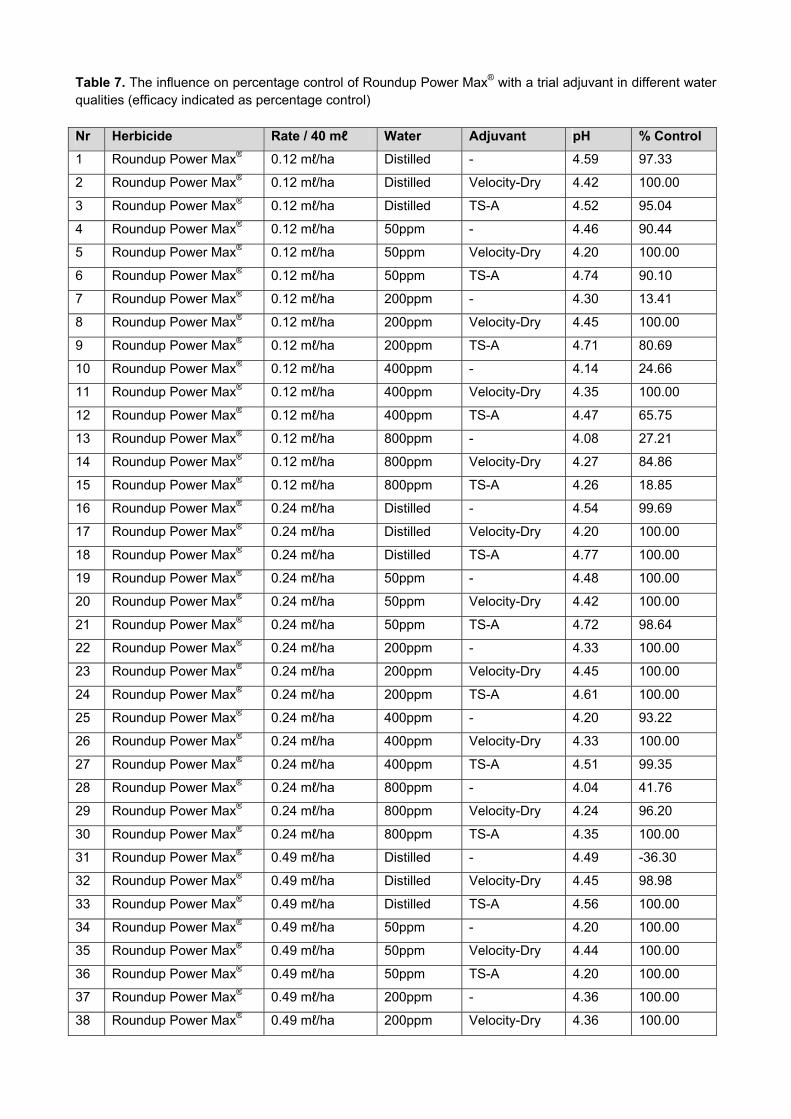
Table 7. The influence on percentage control of Roundup Power Max® with a trial adjuvant in different water qualities (efficacy indicated as percentage control) Nr Herbicide Rate / 40 mℓ Water Adjuvant pH % Control
1 Roundup Power Max® 0.12 mℓ/ha Distilled - 4.59 97.33
2 Roundup Power Max® 0.12 mℓ/ha Distilled Velocity-Dry 4.42 100.00
3 Roundup Power Max® 0.12 mℓ/ha Distilled TS-A 4.52 95.04
4 Roundup Power Max® 0.12 mℓ/ha 50ppm - 4.46 90.44
5 Roundup Power Max® 0.12 mℓ/ha 50ppm Velocity-Dry 4.20 100.00
6 Roundup Power Max® 0.12 mℓ/ha 50ppm TS-A 4.74 90.10
7 Roundup Power Max® 0.12 mℓ/ha 200ppm - 4.30 13.41
8 Roundup Power Max® 0.12 mℓ/ha 200ppm Velocity-Dry 4.45 100.00
9 Roundup Power Max® 0.12 mℓ/ha 200ppm TS-A 4.71 80.69
10 Roundup Power Max® 0.12 mℓ/ha 400ppm - 4.14 24.66
11 Roundup Power Max® 0.12 mℓ/ha 400ppm Velocity-Dry 4.35 100.00
12 Roundup Power Max® 0.12 mℓ/ha 400ppm TS-A 4.47 65.75
13 Roundup Power Max® 0.12 mℓ/ha 800ppm - 4.08 27.21
14 Roundup Power Max® 0.12 mℓ/ha 800ppm Velocity-Dry 4.27 84.86
15 Roundup Power Max® 0.12 mℓ/ha 800ppm TS-A 4.26 18.85
16 Roundup Power Max® 0.24 mℓ/ha Distilled - 4.54 99.69
17 Roundup Power Max® 0.24 mℓ/ha Distilled Velocity-Dry 4.20 100.00
18 Roundup Power Max® 0.24 mℓ/ha Distilled TS-A 4.77 100.00
19 Roundup Power Max® 0.24 mℓ/ha 50ppm - 4.48 100.00
20 Roundup Power Max® 0.24 mℓ/ha 50ppm Velocity-Dry 4.42 100.00
21 Roundup Power Max® 0.24 mℓ/ha 50ppm TS-A 4.72 98.64
22 Roundup Power Max® 0.24 mℓ/ha 200ppm - 4.33 100.00
23 Roundup Power Max® 0.24 mℓ/ha 200ppm Velocity-Dry 4.45 100.00
24 Roundup Power Max® 0.24 mℓ/ha 200ppm TS-A 4.61 100.00
25 Roundup Power Max® 0.24 mℓ/ha 400ppm - 4.20 93.22
26 Roundup Power Max® 0.24 mℓ/ha 400ppm Velocity-Dry 4.33 100.00
27 Roundup Power Max® 0.24 mℓ/ha 400ppm TS-A 4.51 99.35
28 Roundup Power Max® 0.24 mℓ/ha 800ppm - 4.04 41.76
29 Roundup Power Max® 0.24 mℓ/ha 800ppm Velocity-Dry 4.24 96.20
30 Roundup Power Max® 0.24 mℓ/ha 800ppm TS-A 4.35 100.00
31 Roundup Power Max® 0.49 mℓ/ha Distilled - 4.49 -36.30
32 Roundup Power Max® 0.49 mℓ/ha Distilled Velocity-Dry 4.45 98.98
33 Roundup Power Max® 0.49 mℓ/ha Distilled TS-A 4.56 100.00
34 Roundup Power Max® 0.49 mℓ/ha 50ppm - 4.20 100.00
35 Roundup Power Max® 0.49 mℓ/ha 50ppm Velocity-Dry 4.44 100.00
36 Roundup Power Max® 0.49 mℓ/ha 50ppm TS-A 4.20 100.00
37 Roundup Power Max® 0.49 mℓ/ha 200ppm - 4.36 100.00
38 Roundup Power Max® 0.49 mℓ/ha 200ppm Velocity-Dry 4.36 100.00

Nr Herbicide Rate / 40 mℓ Water Adjuvant pH % Control
39 Roundup Power Max® 0.49 mℓ/ha 200ppm TS-A 4.39 100.00
40 Roundup Power Max® 0.49 mℓ/ha 400ppm - 4.24 100.00
41 Roundup Power Max® 0.49 mℓ/ha 400ppm Velocity-Dry 4.30 100.00
42 Roundup Power Max® 0.49 mℓ/ha 400ppm TS-A 4.33 100.00
43 Roundup Power Max® 0.49 mℓ/ha 800ppm - 4.10 100.00
44 Roundup Power Max® 0.49 mℓ/ha 800ppm Velocity-Dry 4.21 100.00
45 Roundup Power Max® 0.49 mℓ/ha 800ppm TS-A 4.21 100.00
LSD0.05 = 18.386
Two experiments were conducted to determine the effect of a trial adjuvant on Roundup Power Max® efficacy (Table 7). The adjuvant was sprayed in comparison with Velocity-Dry (already registered ammonium sulphate) in five water qualities at three different Roundup Power Max® rates. The five different water qualities used were: distilled water, 200ppm Ca water, 200ppm Ca water, 400ppm Ca water and 800ppm Ca water. Roundup Power Max® was tested at 0.5 ℓ/ha, 1 ℓ/ha and 2 ℓ/ha. The pH’s of all treatments before spraying were also measured. From the results it was evident that there was no significant difference in the final pH before spraying between the different treatments. All pH’s fell within an acceptable range for glyphosate application (pH 4-6). When the adjuvants were compared with regards to percentage control, in general no adjuvant did significantly better than one another at the two highest Roundup Power Max® rates. Velocity-Dry would, according to the results, be the best adjuvant to use at 0.5 ℓ/ha Roundup Power Max®. Two experiments were also conducted to determine if Commodobuff can be used to replace AMS in mixtures with Mamba DMA, without losing any efficacy on percentage weed control (Table 8). Commodobuff was included in the trial at 0.1% and compared with AMS at 1%. A treatment, containing both Commodobuff and AMS, was also included in each water type used. Three water types were used (distilled, CaCl2 water and NaHCO3 water). From the experiment it was evident that antagonism occurs when Commodobuff (0.1%) is added to Mamba DMA in CaCl2 water (38.64%). Adding Velocity-Glifo (1%) to this mixture increased the percentage control recorded significantly to 91.58%. The Mamba DMA and Velocity-Glifo mixture also increased the percentage control significantly (84.75%), above that of the Mamba only treatment (in CaCl2 water – 41.63%). The same trend was observed when distilled water was used. The only difference is that although adding Commodobuff to the Mamba DMA did not cause antagonism (81.78%), it did not improve the percentage control recorded significantly above that of the control (71.16%). Again the same trend was observed in NaHCO3 water. The only difference is that the addition of Commodobuff increased the percentage control recorded significantly (69.87%) above that of the control (49.99%). The recommendation would thus be to rather use Velocity-Glifo with mixtures with Mamba DMA than Commodobuff, since Commodobuff tends to cause lower percentages control. Table 8. The influence on percentage control of Mamba DMA when adding different adjuvants in three water types (efficacy indicated as percentage control) Nr Herbicide Rate/40mℓ Water Adjuvant % Control
1 Mamba DMA 0.10mℓ Distilled - 71.16
2 Mamba DMA 0.10mℓ Distilled Commodobuff 81.78
3 Mamba DMA 0.10mℓ Distilled AMS 91.97
4 Mamba DMA 0.10mℓ Distilled Commodobuff & AMS 100.00
5 Mamba DMA 0.10mℓ CaCl2 - 41.63
6 Mamba DMA 0.10mℓ CaCl2 Commodobuff 38.64
7 Mamba DMA 0.10mℓ CaCl2 AMS 84.75
8 Mamba DMA 0.10mℓ CaCl2 Commodobuff & AMS 91.58
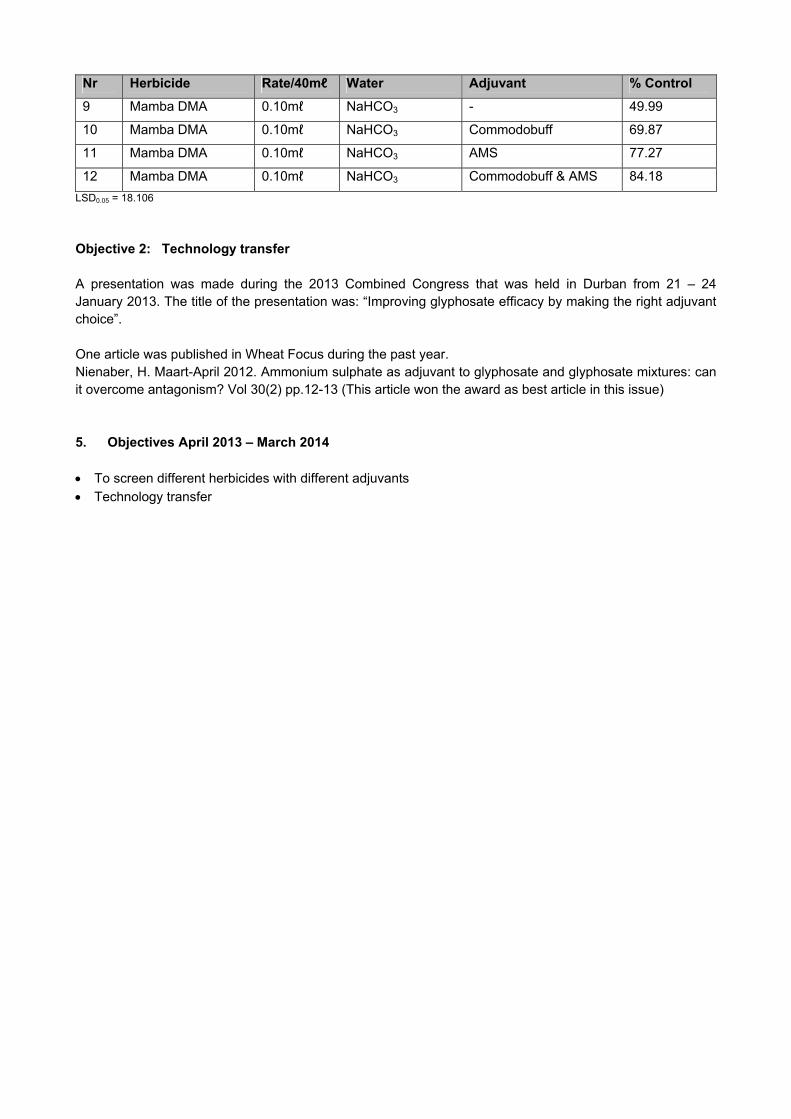
Nr Herbicide Rate/40mℓ Water Adjuvant % Control
9 Mamba DMA 0.10mℓ NaHCO3 - 49.99
10 Mamba DMA 0.10mℓ NaHCO3 Commodobuff 69.87
11 Mamba DMA 0.10mℓ NaHCO3 AMS 77.27
12 Mamba DMA 0.10mℓ NaHCO3 Commodobuff & AMS 84.18
LSD0.05 = 18.106
Objective 2: Technology transfer A presentation was made during the 2013 Combined Congress that was held in Durban from 21 – 24 January 2013. The title of the presentation was: “Improving glyphosate efficacy by making the right adjuvant choice”. One article was published in Wheat Focus during the past year. Nienaber, H. Maart-April 2012. Ammonium sulphate as adjuvant to glyphosate and glyphosate mixtures: can it overcome antagonism? Vol 30(2) pp.12-13 (This article won the award as best article in this issue) 5. Objectives April 2013 – March 2014 To screen different herbicides with different adjuvants Technology transfer
GK 06/02: OPTIMISATION OF HERBICIDE EFFICACY PROGRESS REPORT APRIL 2012 TO MARCH 2013
Summary Number: GK 06/02 Title: Optimisation of Herbicide Efficacy Duration: 1997 - 2014 Status: Continuation of existing project Project Leader: Ms Hestia Nienaber This project seeks solutions to overcome the problem of antagonistic spray mixtures in South Africa. Sixteen experiments were conducted during the 2012/2013 season. Experiments were conducted on Axial®, Glygran®, Imazamaxx®, Roundup Turbo®, Roundup Power Max® and MCPA® to determine the effect of various adjuvants and buffers on the percentage weed control of these different herbicides. Experiments were also conducted to test a trial adjuvant for use with Roundup Power Max® and to test different adjuvants with Mamba DMA. It was found that Axial® efficacy can be improved by adding ammonium sulphate to the spray mixture and also that Axial® must be used with the registered adjuvant (Complement Super). In experiments with mixtures of Glygran® and MCPA®, it was found that antagonism may occur, but that ammonium sulphate can be used in most instances to improve efficacy of these mixtures. Imazamaxx® was screened with three different ammonium sulphates to determine the best product to use, but the results indicated that all three products can be used with the same end result. Experiments were conducted with Roundup Turbo® and Roundup Power Max® to determine whether mixing order plays a vital role in the percentage control obtained. From the results it was evident that it did not matter which component got added first. Further studies on this are necessary. Since producers reported that buffers can replace ammonium sulphate in mixtures with glycines, it was decided to test this. The results indicated that ammonium sulphate must not be replaced by buffers under any circumstances. During the past year, technology was transferred through two ways. A presentation was made at the 2013 Combined Congress and one article was published in Wheat Focus. In the coming season (2013/2014) screening of different adjuvants with herbicides and technology transfer will continue.
GK 06/08: EVALUATION OF HERBICIDE RESISTANT WEEDS PROGRESS REPORT APRIL 2012 – MARCH 2013
1. Project details Number: GK 06/08 Title: Evaluation of herbicide resistant weeds Duration: End March 2014 Status: Continuation of existing project Project leader: Ms Hestia Nienaber 2. Objectives 2.1 Long-term objectives The long-term objectives of this project are as follows:
Evaluation of possible herbicide resistant weeds found to be problematic in small grain production in
South Africa. Map herbicide resistant ryegrass occurring in small grain production. 2.2 Short term objectives: 2012/2013
To screen ryegrass samples from the Western Cape for resistance to Axial (‘Den’). To use ARC-SGI as a screening facility to screen weeds for possible resistance to herbicides. To keep farmers and the industry informed about the latest research results through publications and
farmers’ days. 3. Report on the objectives: April 2012 – March 2013
Small grains are produced in every province in South Africa, but major areas of production are the Free State (irrigation and dryland wheat) and the Western Cape (dryland wheat), with the greater proportion of small grains being produced in the Western Cape. Wheat is also produced under irrigation and dryland conditions in the Eastern Cape, Gauteng, Mpumalanga and Limpopo. Wheat production under irrigation is practiced in KwaZulu-Natal, Northern Cape and the Northwest Province. Herbicide resistance is the inherent ability of a species to survive and reproduce, following exposure to a dose of herbicide normally lethal to its wild type. In a plant, resistance may be naturally occurring or induced by such techniques as genetic engineering or selection of variants produced by tissue culture or mutagenesis. Herbicide resistance can also be defined as “the evolved capacity of a previously herbicide-susceptible weed population to withstand a herbicide and complete its life cycle when the herbicide is used at its normal rate in an agricultural situation” (Valverde, 1991; Heap & LeBaron, 2001; Diggle, et al. 2003). Since (the first report of herbicide resistance) 1986, eight more weed species have been found to be herbicide resistant in South Africa. Wild oat (Avena fatua) is known to have multiple resistance and first evolved resistance in 1986 to two herbicide modes of action (ACCase inhibitors and ALS inhibitors). The first report of herbicide resistant ryegrass (Lolium spp.) was made in 1993. Multiple herbicide resistance to two herbicide modes of action (ACCase inhibitors and ALS inhibitors) was reported, but up till now herbicide resistance to glycines and bipyridyliums have also been confirmed. Wild radish (Raphanus raphanistrum) evolved resistance to ALS inhibitors in 1997.
This project seeks to find solutions for the better management of herbicide resistant weeds in South Africa. In the past, chemical companies and farmers used recommended herbicides from the sulfonylurea group for weed control in small grain production, but due to the increase in occurrence of herbicide resistant weeds, representatives of these companies cannot recommend the usage of these herbicides in areas with known herbicide resistance problems any more. Furthermore, this study evaluates herbicides with different modes of action groups, in order to investigate alternatives for the control of herbicide resistant weeds, although the availability of new mode of action herbicides is very infrequent. Several popular publications have been written over the years by weed scientists and university lectors to keep farmers informed and to come up with strategies that they could use if herbicide resistance is observed on their farms. Twelve experiments were conducted on herbicide resistance during the past year. All of these were conducted on ryegrass obtained from the Western Cape. The herbicides used for these experiments represented different modes of action groups; ‘Fops’ and SU’s, bipyridyliums, glycines and ‘Den’. During the past season, eight popular publications were published in SA Grain. Two radio talks were broadcasted on RSG Agriculture. In the coming season, screening of the samples for resistance to Axial (‘Den’) will be finished. Weed samples will be collected and screened with different herbicides for potential resistance. Outside samples, if any are received, will be screened at the SGI herbicide resistance screening facility. Material and methods Resistance experiments in the glasshouse Producers use herbicides from different mode of action groups to control weeds in crops. These herbicides include SU’s (for example Hussar®, Cossack®, Glean®, Brush-Off®, Colony®, Climax®, Monitor® and Hero®), ‘Dims’ (for example Focus Ultra® and Achieve®) and ‘Fops’ (for example Topik® and Puma Super®). Most recently Axial® (‘Den’) was added to this list of herbicides. The most popular herbicides for weed control in the Western Cape falls under the SU group. Producers routinely used SU herbicides year after year for control of broad-leaved weeds. This encouraged herbicide resistance against this mode of action, and it has now become a big problem. In this study, ryegrass from the Western Cape were screened for resistance to Axial® as it is a new herbicide on the market and the resistance status of this product is unknown. The methodologies used for preparing all experiments were the same. Plants were grown in 1.5 ℓ pots in a glasshouse with a temperature of 16oC/20oC (night/day). Plants were treated with pots packed in a completely randomised block design. Seedlings were thinned to four per pot after emergence. During the 4-5-leaf stage, herbicides were applied with a cabinet spray fitted with a flatfan nozzle that delivers 164 ℓ/ha at a constant pressure of 200 kPa. Different herbicide rates were applied with the recommended rates included as a check. The prescribed adjuvants were used with the different herbicides. No vermiculite was placed on the soil prior to application, to allow for maximum root and foliar absorption, resulting in optimum absorption and translocation of the herbicide by the plant. Following herbicide application, the pots were left outside the glasshouse for a while and then returned to the glasshouse, where it was watered daily to avoid any moisture stress. Evaluation was done by means of fresh weight mass 14 days after treatment. The shoots were harvested and weighed on a high decimal precision scale (Precisa 1600C No. 67368 SwissQuality). The treatments were replicated four times in all experiments and later during analysis some of the experiments were combined to make more replications. Data were analysed using Genstats (15th Edition, Rothamsted) and subjected to analysis of variance and significant differences determined between means at 5% level of Turkey Test probability.
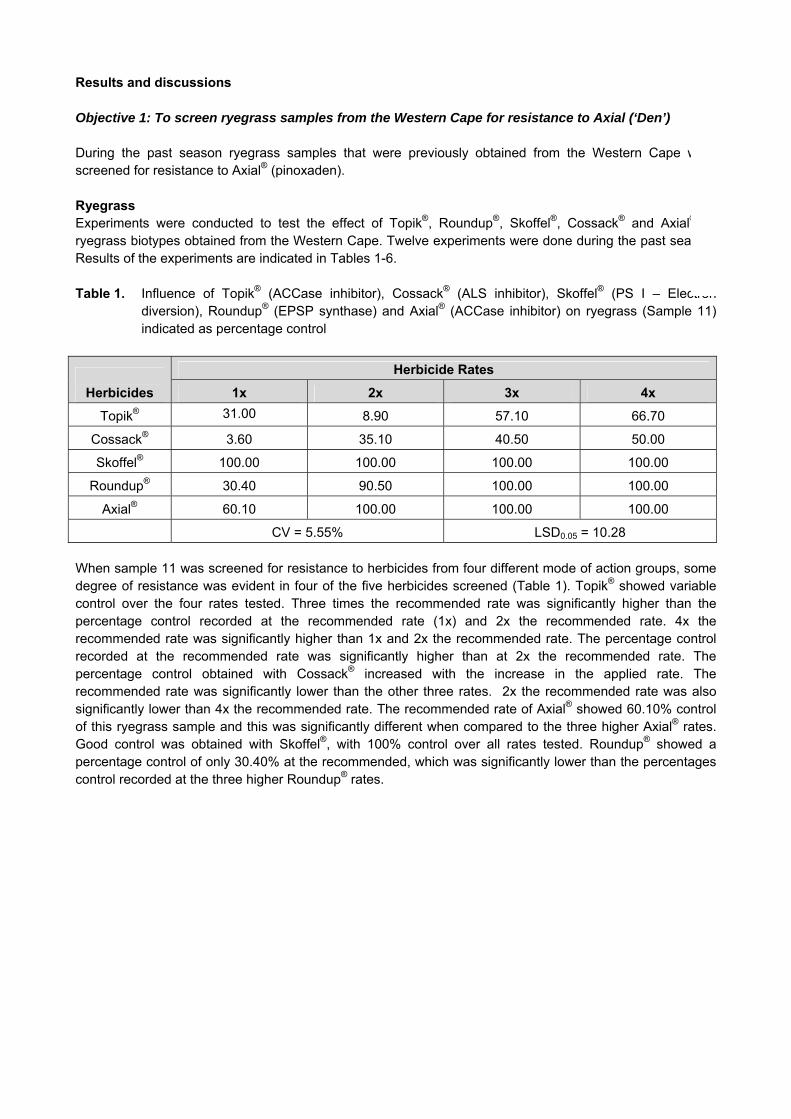
Results and discussions
Objective 1: To screen ryegrass samples from the Western Cape for resistance to Axial (‘Den’) During the past season ryegrass samples that were previously obtained from the Western Cape were screened for resistance to Axial® (pinoxaden). Ryegrass Experiments were conducted to test the effect of Topik®, Roundup®, Skoffel®, Cossack® and Axial® on ryegrass biotypes obtained from the Western Cape. Twelve experiments were done during the past season. Results of the experiments are indicated in Tables 1-6. Table 1. Influence of Topik® (ACCase inhibitor), Cossack® (ALS inhibitor), Skoffel® (PS I – Electron
diversion), Roundup® (EPSP synthase) and Axial® (ACCase inhibitor) on ryegrass (Sample 11) indicated as percentage control
Herbicides
Herbicide Rates
1x 2x 3x 4x
Topik® 31.00 8.90 57.10 66.70
Cossack® 3.60 35.10 40.50 50.00
Skoffel® 100.00 100.00 100.00 100.00
Roundup® 30.40 90.50 100.00 100.00
Axial® 60.10 100.00 100.00 100.00
CV = 5.55% LSD0.05 = 10.28 When sample 11 was screened for resistance to herbicides from four different mode of action groups, some degree of resistance was evident in four of the five herbicides screened (Table 1). Topik® showed variable control over the four rates tested. Three times the recommended rate was significantly higher than the percentage control recorded at the recommended rate (1x) and 2x the recommended rate. 4x the recommended rate was significantly higher than 1x and 2x the recommended rate. The percentage control recorded at the recommended rate was significantly higher than at 2x the recommended rate. The percentage control obtained with Cossack® increased with the increase in the applied rate. The recommended rate was significantly lower than the other three rates. 2x the recommended rate was also significantly lower than 4x the recommended rate. The recommended rate of Axial® showed 60.10% control of this ryegrass sample and this was significantly different when compared to the three higher Axial® rates. Good control was obtained with Skoffel®, with 100% control over all rates tested. Roundup® showed a percentage control of only 30.40% at the recommended, which was significantly lower than the percentages control recorded at the three higher Roundup® rates.

Table 2. Influence of Topik® (ACCase inhibitor), Cossack® (ALS inhibitor), Skoffel® (PS I – Electron diversion), Roundup® (EPSP synthase) and Axial® (ACCase inhibitor) on ryegrass (Sample 20) indicated as percentage control
Herbicides
Herbicide Rates
1x 2x 3x 4x
Topik® 75.90 76.50 82.90 74.80
Cossack® 78.10 73.90 77.20 80.50
Skoffel® 100.00 100.00 100.00 100.00
Roundup® 100.00 100.00 100.00 100.00
Axial® 83.70 100.00 100.00 100.00
CV = 10.8% LSD0.05 = 13.73 Sample 20 was also tested for resistance to herbicides from four different mode of action groups. The percentage control recorded for Topik® was very variable over the rates tested. No significant differences could be observed between the different applied rates. The percentage control recorded for Cossack® was also variable. No significant differences could be observed. The recommended Axial® rate was significantly lower than the three higher applied rates. Good control was obtained with Roundup® and Skoffel®, with no significant differences between the different rates tested. Table 3. Influence of Topik® (ACCase inhibitor), Cossack® (ALS inhibitor), Skoffel® (PS I – Electron diversion), Roundup® (EPSP synthase) and Axial® (ACCase inhibitor) on ryegrass (Sample 21) indicated as percentage control
Herbicides
Herbicide Rates
1x 2x 3x 4x
Topik® 67.50 47.90 66.60 70.60
Cossack® 82.00 89.80 86.50 92.50
Skoffel® 56.90 100.00 100.00 100.00
Roundup® 100.00 100.00 100.00 100.00
Axial® 45.80 100.00 100.00 100.00
CV = 25.0% LSD0.05 = 30.21 Sample 21 was also tested for resistance to herbicides from four different mode of action groups. The percentage control recorded for Topik® was again very variable over the rates tested. The percentage control recorded for Cossack® was also variable. No significant differences could be observed between the different applied rates. Roundup® showed 100% control over the different applied rates. The recommended rate of Skoffel® (56.90%) was significantly lower than the percentages control recorded at the three higher rates. The recommended rate of Axial® (45.80%) was significantly lower than the percentages control recorded at the three higher rates.
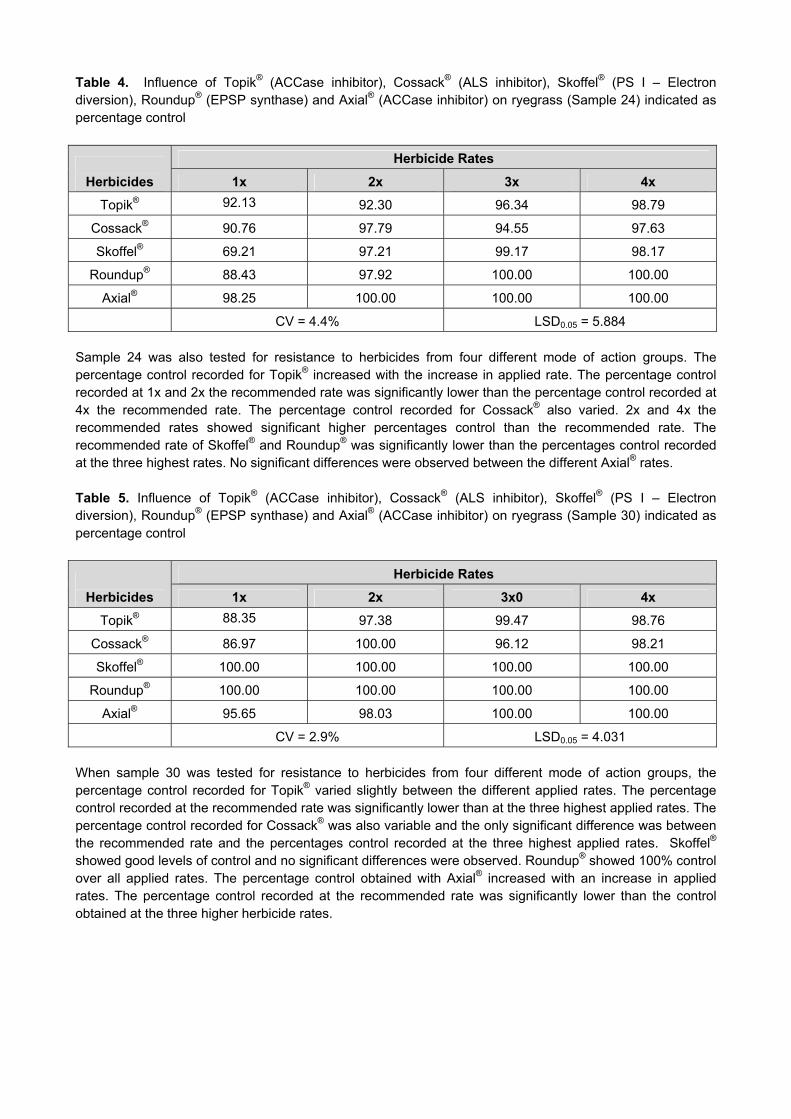
Table 4. Influence of Topik® (ACCase inhibitor), Cossack® (ALS inhibitor), Skoffel® (PS I – Electron diversion), Roundup® (EPSP synthase) and Axial® (ACCase inhibitor) on ryegrass (Sample 24) indicated as percentage control
Herbicides
Herbicide Rates
1x 2x 3x 4x
Topik® 92.13 92.30 96.34 98.79
Cossack® 90.76 97.79 94.55 97.63
Skoffel® 69.21 97.21 99.17 98.17
Roundup® 88.43 97.92 100.00 100.00
Axial® 98.25 100.00 100.00 100.00
CV = 4.4% LSD0.05 = 5.884 Sample 24 was also tested for resistance to herbicides from four different mode of action groups. The percentage control recorded for Topik® increased with the increase in applied rate. The percentage control recorded at 1x and 2x the recommended rate was significantly lower than the percentage control recorded at 4x the recommended rate. The percentage control recorded for Cossack® also varied. 2x and 4x the recommended rates showed significant higher percentages control than the recommended rate. The recommended rate of Skoffel® and Roundup® was significantly lower than the percentages control recorded at the three highest rates. No significant differences were observed between the different Axial® rates. Table 5. Influence of Topik® (ACCase inhibitor), Cossack® (ALS inhibitor), Skoffel® (PS I – Electron diversion), Roundup® (EPSP synthase) and Axial® (ACCase inhibitor) on ryegrass (Sample 30) indicated as percentage control
Herbicides
Herbicide Rates
1x 2x 3x0 4x
Topik® 88.35 97.38 99.47 98.76
Cossack® 86.97 100.00 96.12 98.21
Skoffel® 100.00 100.00 100.00 100.00
Roundup® 100.00 100.00 100.00 100.00
Axial® 95.65 98.03 100.00 100.00
CV = 2.9% LSD0.05 = 4.031 When sample 30 was tested for resistance to herbicides from four different mode of action groups, the percentage control recorded for Topik® varied slightly between the different applied rates. The percentage control recorded at the recommended rate was significantly lower than at the three highest applied rates. The percentage control recorded for Cossack® was also variable and the only significant difference was between the recommended rate and the percentages control recorded at the three highest applied rates. Skoffel® showed good levels of control and no significant differences were observed. Roundup® showed 100% control over all applied rates. The percentage control obtained with Axial® increased with an increase in applied rates. The percentage control recorded at the recommended rate was significantly lower than the control obtained at the three higher herbicide rates.
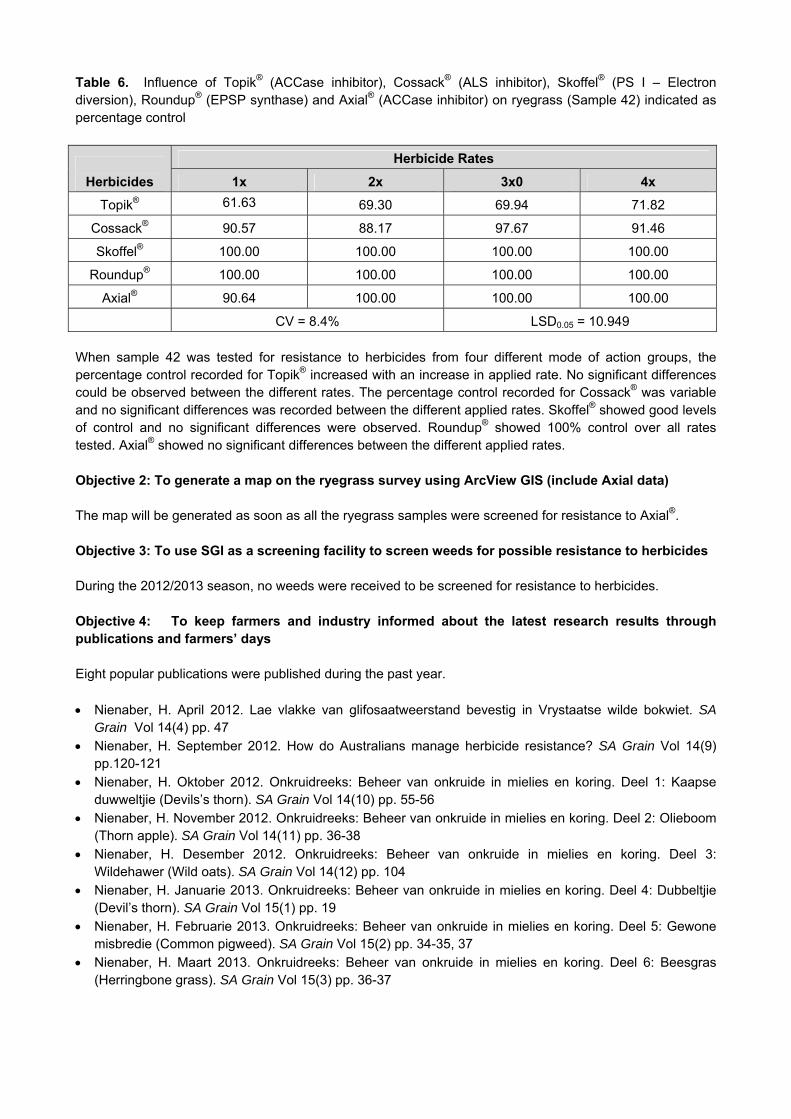
Table 6. Influence of Topik® (ACCase inhibitor), Cossack® (ALS inhibitor), Skoffel® (PS I – Electron diversion), Roundup® (EPSP synthase) and Axial® (ACCase inhibitor) on ryegrass (Sample 42) indicated as percentage control
Herbicides
Herbicide Rates
1x 2x 3x0 4x
Topik® 61.63 69.30 69.94 71.82
Cossack® 90.57 88.17 97.67 91.46
Skoffel® 100.00 100.00 100.00 100.00
Roundup® 100.00 100.00 100.00 100.00
Axial® 90.64 100.00 100.00 100.00
CV = 8.4% LSD0.05 = 10.949 When sample 42 was tested for resistance to herbicides from four different mode of action groups, the percentage control recorded for Topik® increased with an increase in applied rate. No significant differences could be observed between the different rates. The percentage control recorded for Cossack® was variable and no significant differences was recorded between the different applied rates. Skoffel® showed good levels of control and no significant differences were observed. Roundup® showed 100% control over all rates tested. Axial® showed no significant differences between the different applied rates. Objective 2: To generate a map on the ryegrass survey using ArcView GIS (include Axial data) The map will be generated as soon as all the ryegrass samples were screened for resistance to Axial®. Objective 3: To use SGI as a screening facility to screen weeds for possible resistance to herbicides During the 2012/2013 season, no weeds were received to be screened for resistance to herbicides. Objective 4: To keep farmers and industry informed about the latest research results through publications and farmers’ days Eight popular publications were published during the past year. Nienaber, H. April 2012. Lae vlakke van glifosaatweerstand bevestig in Vrystaatse wilde bokwiet. SA
Grain Vol 14(4) pp. 47 Nienaber, H. September 2012. How do Australians manage herbicide resistance? SA Grain Vol 14(9)
pp.120-121 Nienaber, H. Oktober 2012. Onkruidreeks: Beheer van onkruide in mielies en koring. Deel 1: Kaapse
duwweltjie (Devils’s thorn). SA Grain Vol 14(10) pp. 55-56 Nienaber, H. November 2012. Onkruidreeks: Beheer van onkruide in mielies en koring. Deel 2: Olieboom
(Thorn apple). SA Grain Vol 14(11) pp. 36-38 Nienaber, H. Desember 2012. Onkruidreeks: Beheer van onkruide in mielies en koring. Deel 3:
Wildehawer (Wild oats). SA Grain Vol 14(12) pp. 104 Nienaber, H. Januarie 2013. Onkruidreeks: Beheer van onkruide in mielies en koring. Deel 4: Dubbeltjie
(Devil’s thorn). SA Grain Vol 15(1) pp. 19 Nienaber, H. Februarie 2013. Onkruidreeks: Beheer van onkruide in mielies en koring. Deel 5: Gewone
misbredie (Common pigweed). SA Grain Vol 15(2) pp. 34-35, 37 Nienaber, H. Maart 2013. Onkruidreeks: Beheer van onkruide in mielies en koring. Deel 6: Beesgras
(Herringbone grass). SA Grain Vol 15(3) pp. 36-37

Two radio talks were broadcasted on RSG Agriculture during the past year. Nienaber, H. 25 Julie 2012. Onkruiddoder weerstandbiedendheid in die Vrystaat. RSG Landbou. Nienaber, H. 4 Maart 2013. Onkruiddoderweerstandbiedendheid in Kleingrane. RSG Landbou. 4. Objectives April 2013 – March 2014
To use SGI as a screening facility to screen weeds for possible resistance to herbicides To screen ryegrass samples from the Western Cape for resistance to Axial (‘Den’) To generate a map on the ryegrass survey using ArcView GIS (include Axial data) To keep farmers and the industry informed about the latest research results through publications and
farmers’ days
GK 06/08: EVALUATION OF HERBICIDE RESISTANT WEEDS PROGRESS REPORT APRIL 2012 TO MARCH 2013
Summary Number: GK 06/08 Title: Evaluation of Herbicide resistant weeds Duration: 1998 - 2014 Status: Continuation of existing project Project Leader: Ms Hestia Nienaber The main objective of this project is to seek for solutions to better management of herbicide resistant weeds in South Africa. Furthermore, this study evaluates herbicides with different modes of action groups in order to investigate alternatives for the control of herbicide resistant weeds, although the availability of new mode of action herbicides is very infrequent. During the past year (2012/2013), 12 experiments were conducted on herbicide resistance. These experiments were conducted on ryegrass obtained from the Western Cape. The herbicides used for these experiments represented different mode of action groups; ‘Fops’, ‘Den’, SU’s, bipyridyliums and glycines. During the study, it was found that all the samples tested have some degree of resistance to one or more of the herbicides tested. This is worrisome, as this indicate that new management strategies are urgently needed to control the spread of this resistance problem. Eight popular publications were published and two radio talks were broadcasted during the past year. In the coming season (2013/2014), results from the Axial (‘Den’) screening will be captured on ARCView GIS and a map of the resistant ryegrass will be compiled. Weed samples will be collected and screened with different herbicides for potential resistance. Outside samples, if any are received, will be screened at the SGI herbicide resistance screening facility.