05 a zero - scholar.sun.ac.za
TRANSCRIPT
SA Journal of Industrial Engineering 2005 Vol 16(2): 69 - 80
A ZERO SAMPLING PLAN FOR THE MODERATION OF EXAMINATION PAPERS
W. van Wijck1and T. Dirkse van Schalkwyk2
Department of Industrial Engineering
University of Stellenbosch, South Africa [email protected]; [email protected]
ABSTRACT
Quality assurance within local educational institutions has been under the spotlight in recent years. In particular these institutions are increasingly subjected to minimum standards specified by controlling bodies such as the Higher Education Quality Committee and others. The moderation of examination papers is an important quality assurance activity to ensure that an examination paper’s standard, content, span and marking are fair and reasonable. This paper describes a sampling plan to determine the number of answer books to be checked to confirm that individual marks were awarded correctly. The sampling procedure relates the confidence that marks awarded in a set of examination books meets a specified minimum standard to the number of books moderated.
OPSOMMING
Gehalteversekering binne plaaslike opvoedkundige instellings word toenemend onderwerp aan minimum standaarde soos neergelê deur die Kwaliteitskomitee vir Hoër Onderwys en ander. Die moderering van eksamenantwoordstelle is 'n belangrike gehalteversekeringsaktiwiteit wat verseker dat 'n eksamen se standaard, inhoud, bestek en nasien regverdig en redelik is. Die artikel beskryf ‘n steekproefplan vir die proses om individueel toegekende punte vir korrektheid na te gaan. Die voorgestelde prosedure gee die verband tussen die sekerheid dat die punte toegeken deur die eksaminator voldoen aan ‘n gespesifieerde minimum standaard en die aantal boeke wat gemodereer moet word (steekproefgrootte).
http://sajie.journals.ac.za

70
1. INTRODUCTION
Moderation within the context of the examination process in an academic institution is a quality assurance activity to establish whether:
• an examination paper is of the correct standard (level of difficulty) • an examination paper can be completed within the specified period of time • an examination paper covers the specified outcomes of a module • a memorandum for the examination paper exists and whether it is complete,
correct and unambiguous
individual marks were awarded accurately according to the memorandum (focus of this paper) • marks were totalled up correctly • marks were recorded and processed correctly • discrepancies do not exist between the categories: distinction, pass, re-evaluation
and fail
Each of the above objectives represents a quality characteristic of the examination process. It is therefore possible to do a classification of defects (see next section). To check whether individual marks were awarded accurately according to the memorandum is probably the most difficult, challenging and time consuming part of the process. It is impractical and uneconomical to expect a moderator to thoroughly check each individual answer book in the set. On the other hand it is necessary that a moderator will be able to pronounce a degree of confidence regarding this aspect of the examination process. Clearly the solution is to devise a sampling strategy and procedure that will balance these two conflicting objectives.
Current practice with regard to sampling plans for the moderation of individual mark allocation were found to be based mostly on rules of thumb. These are of course not widely published, but can be found among the information pages of educational institutions’ websites.[3][4]
This paper proposes a zero sampling plan that moderators can use to: • minimise the amount of inspection • declare with a specified confidence whether a specified minimum accuracy has
been met
Zero sampling plans are inspection plans where no defect is allowed in the inspection sample. Such plans are the most economical in terms of sample size. The derivation of the theory is based on assumptions that may or may not be realistic under all circumstances. The extent and implications of these assumptions are discussed in footnotes during the course of this article. The paper should therefore be seen as a departure point in the attempt to place the process of moderation on a more scientific footing.
http://sajie.journals.ac.za
71
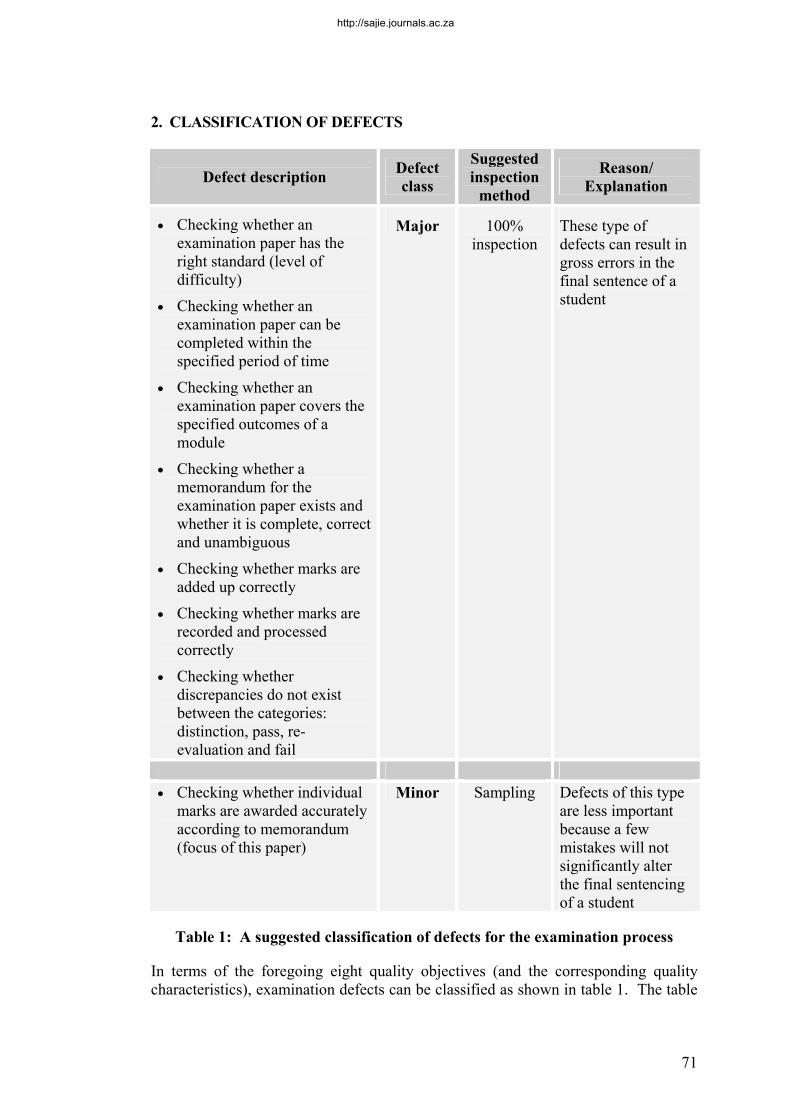
2. CLASSIFICATION OF DEFECTS
Defect description Defect class
Suggested inspection
method
Reason/ Explanation
• Checking whether an examination paper has the right standard (level of difficulty)
• Checking whether an examination paper can be completed within the specified period of time
• Checking whether an examination paper covers the specified outcomes of a module
• Checking whether a memorandum for the examination paper exists and whether it is complete, correct and unambiguous
• Checking whether marks are added up correctly
• Checking whether marks are recorded and processed correctly
• Checking whether discrepancies do not exist between the categories: distinction, pass, re-evaluation and fail
Major
100% inspection
These type of defects can result in gross errors in the final sentence of a student
• Checking whether individual
marks are awarded accurately according to memorandum (focus of this paper)
Minor Sampling Defects of this type are less important because a few mistakes will not significantly alter the final sentencing of a student
Table 1: A suggested classification of defects for the examination process
In terms of the foregoing eight quality objectives (and the corresponding quality characteristics), examination defects can be classified as shown in table 1. The table
http://sajie.journals.ac.za
72
is arranged into four columns and for each defect-class a preferred inspection strategy is suggested. The various defects are classified into one of two classes: major or minor. No defects are considered critical (this category is normally reserved for life-threatening situations) and no defect is considered to be so unimportant as to deserve the category of “incidental” defect.
Except for the 5th objective above (checking whether individual marks were awarded accurately according to memorandum) where non-conformances are classified as minor defects, all other defects are considered to be major defects. It is ironic that the most time consuming and difficult objective is the only one with defects falling into the minor category.
3. DEFINITION OF SYMBOLS USED IN THE DERIVATION OF THE FORMULAE
k The number of answer books that need to be moderated (sample size to be optimised)
n The total number of individual marks on the memorandum
p The proportion of errors made by an examiner (assumed to be an inherent characteristic of the examiner and the specific set of books that he/she examined and is constant within and between answer books)
p' The maximum proportion of defects allowed in any one answer book
x The number of incorrectly awarded marks in a particular answer book
xi The number of incorrectly awarded marks in the ith moderated book in the sample of size k
x' The maximum allowable incorrectly awarded marks in any one answer book
N The total number of students in the class (total number of examination books)
β 1 - β is the minimum confidence that the moderator must have that the specified maximum proportion of defects is not exceeded in any one of the examination books of the set
γ A parameter of the uniform distribution which is used as the probability density function to describe the error-probability of a particular department’s lecturers
4. DERIVATION OF THE THEORY FOR THE ZERO SAMPLING PLAN
Suppose an examiner has a probability p to make a mistake (“ instead of X” or “X instead of ”) for each mark that is awarded in a paper that counts out of n. We will assume that this failure probability is constant and fixed for the specific examiner and the set of books that must be evaluated. More specifically, we will assume that
http://sajie.journals.ac.za

73
this p is the same for each mark awarded in a specific book and also constant over all books in the set.1
Also suppose there are N examination books in the set and that a moderator chooses to check k of these for correctness. Sampling plans with an acceptance number of zero are the most economical in terms of sample size, and for this reason we will restrict our attention to plans of this type. We will therefore calculate the confidence level under the assumption that the moderator encountered no errors in the k books that were randomly chosen from the N to be moderated.
Given that the moderator did not find any errors by the examiner in the k books that were moderated, we now desire to know with what probability the remaining N - k books will each have a proportion of defects that is less than a certain pre-specified target of p'. The probability that an examiner with a defect-probability of p per individual mark will have made x1 errors in the first book that the moderator checked can be modelled with a binomial distribution as follows[1]:
11 )1()|(1
1xnx pp
xn
pxP −−⎟⎟⎠
⎞⎜⎜⎝
⎛= (1a)
And for the assumed case where x1 = 0;
nn pppn
pxP )1()1(0
)|0( 001 −=−⎟⎟
⎠
⎞⎜⎜⎝
⎛== − (1b)
Expanding on this, the probability that no errors were made in the entire sample of k books that were checked by the moderator (assuming independence between successive books2) is as follows:
[ ] nkknk pppxxxP )1()1()|0....( 21 −=−===== (2)
1 An implication of this assumption is that examiners do not tire or that fatigue does not affect the
accuracy of their marking. Inaccuracy of this assumption will be negligible for examiners that refrain from marking for extended periods of time. Another requirement of this assumption is that the examiner must be impartial with respect to the candidate being evaluated. This requirement can be enforced by not allowing the examiner to know which candidate they are evaluating until after the evaluation.
2 This assumption is questionable but probably not too unrealistic especially if an examiner follows the practice of marking one question throughout the set of examination papers and then moving on to the next. It can be argued that the requirement for randomness of the sample is met by the combination of moderators choosing which answer books to moderate randomly, and by specifying that examiners should mark the answer books one question at a time. In practice this means that the examiner must mark question 1 for all the students, then proceed to question 2 for all the students, etc. If the above two rules are obeyed it is assumed that the sample of individual marks chosen for moderation will be random.
http://sajie.journals.ac.za
74
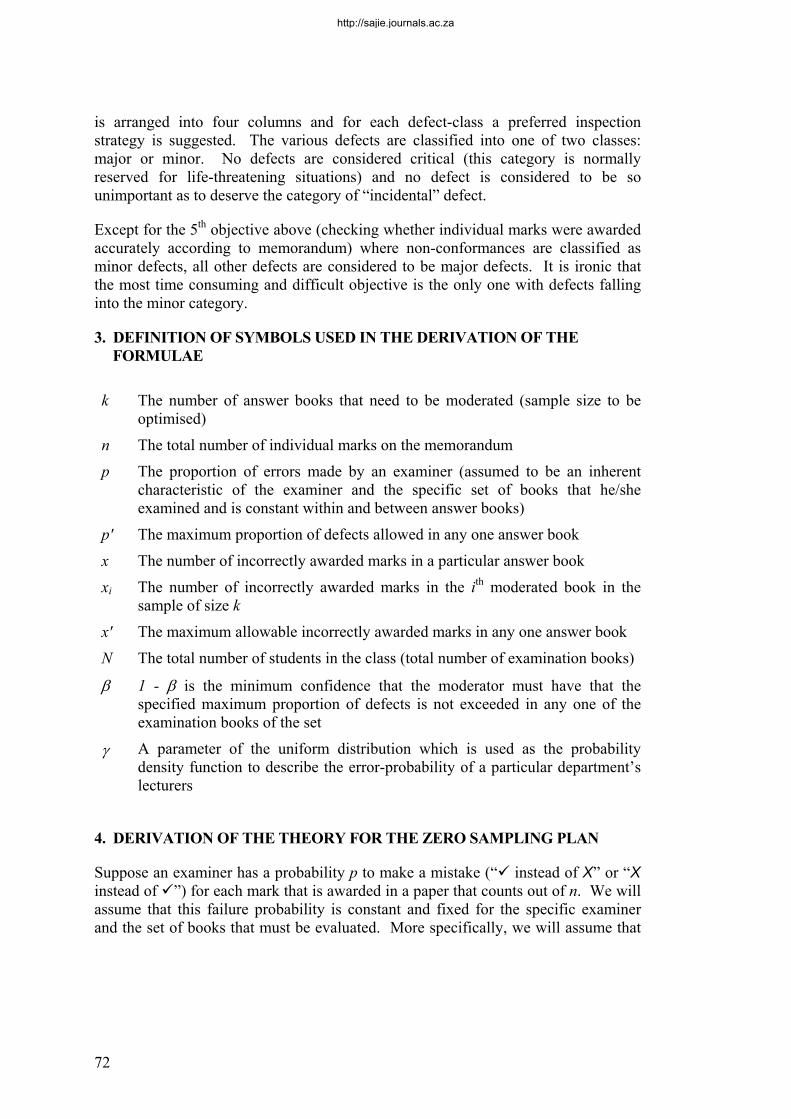
In terms of Bayesian statistics [2] the above is known as a likelihood (-function). We are however particularly interested in the posterior probability density function (p.d.f.) )0....|( 21 ==== kxxxpg . Using Bayes’ theorem[2] we can transform the above prior distribution into a posterior p.d.f. as follows:
)0....(
)|0....().()0....|(21
2121 ====
=========
k
kk xxxP
pxxxPpfxxxpg (3)
where f(p) is the assumed prior distribution of a group of examiners belonging to a particular department. To simplify the mathematics somewhat we will, for the purpose of this paper, assume that f(p) is a uniform distribution defined over the closed interval [0, γ].3 In symbols:
otherwise0
0if1)(
=
≤≤= γγ
ppf (4)
We can now find )0....( 21 ==== kxxxP by integration as follows:
)1()1(1
)1(1
)|0....().()0....(
1
0
210
21
+−−
=
−=
=========
+
∫∫
nk
dpp
dppxxxPpfxxxP
nk
nk
kk
γγ
γ
γ
γ
(5)
Equation 5 is important in its own right because, after the value of k has been determined using equation 10 below, this equation can be used to calculate the probability that the moderator will find errors in the sample of k books that he/she has moderated. Equation 5 can therefore be used to calculate for which fraction of cases the (zero) sampling plan will be able to furnish a confidence prediction. If the moderator did encounter one or more errors in the sample of k books, then the assumption of zero-errors will have been contradicted in which case confidence cannot be calculated4.
Finally if we substitute equations 4 and 5 into equation 3, we obtain the following posterior distribution:
γγ
≤≤−−
−+===== + ppnkxxxpg nk
nk
k 0for)1(1
)1)(1()0....|( 121 (6)
3 We have experimented with other distributions (e.g. normal) and have found that the end result is
extremely insensitive to the particular choice of distribution for f(p). 4 It is in this sense that non-zero sampling plans have an advantage since a confidence prediction will
be possible no matter how many errors the moderator encountered in the inspection sample.
http://sajie.journals.ac.za

75
We will next focus on the remaining N – k unchecked books. The probability that an examiner with error-probability p will have made x mistakes in any one of the remaining books can again be obtained using the binomial distribution as follows:
papersremaining)1()|( kNippxn
pxP xnx −∈∀−⎟⎟⎠
⎞⎜⎜⎝
⎛= − (7)
The probability that the proportion of defects in any one of the remaining N – k books will be x/n is therefore also given by equation 7 above. The probability that this proportion will be less than a pre-specified proportion p' can therefore be found as follows:
⎣ ⎦ '''or,''where)1('
0
npnpxpnxpp
xn xnx
x
x
≤=≤−⎟⎟⎠
⎞⎜⎜⎝
⎛ −
=∑ (8)
Following through on the assumption that mistakes on successive books are independent of one another, we can now obtain the probability that the quality criterion (proportion of errors, p') will be achieved in each one of the remaining books as follows:
⎣ ⎦ '''where)1('
0
npnpxppxn
kN
xnxx
x
≤=⎥⎥⎦
⎤
⎢⎢⎣
⎡−⎟⎟
⎠
⎞⎜⎜⎝
⎛−
−
=∑ (9)
Using the posterior distribution of equation 6, we can finally obtain the expected value of the former probability. This leaves us with a mathematical equation from which we can obtain the desired sample size k for the moderator. The final equation is:
⎣ ⎦ '''where11
)1()1(1)1(
10)(or
1)1()1(1
)1)(1(
'
001
'
00 1
npnpxdpp
pxn
pnk
dpppxnpnk
kNxx
x
nNnk
kN
xnxx
xnk
nk
≤=−=⎥⎥⎦
⎤
⎢⎢⎣
⎡⎟⎟⎠
⎞⎜⎜⎝
⎛−⎟⎟
⎠
⎞⎜⎜⎝
⎛−
−−+
−=⎥⎦
⎤⎢⎣
⎡−⎟⎟
⎠
⎞⎜⎜⎝
⎛−−
−+
−
=+
−
−
=+
∑∫
∑∫
βγ
βγ
γ
γ
In the above equation β is the probability that the criterion will not be met in at least one of the remaining books even though the moderator encountered no errors in the sample of k books that was moderated. 1 - β can therefore be regarded as the confidence that the prescribed accuracy was achieved by the examiner. The above equation can be solved for k using numerical integration. As stated before, this value of k can then be used in equation 5 to find the probability that the moderator will be able to make a confidence prediction during a particular moderation instance.
http://sajie.journals.ac.za
76
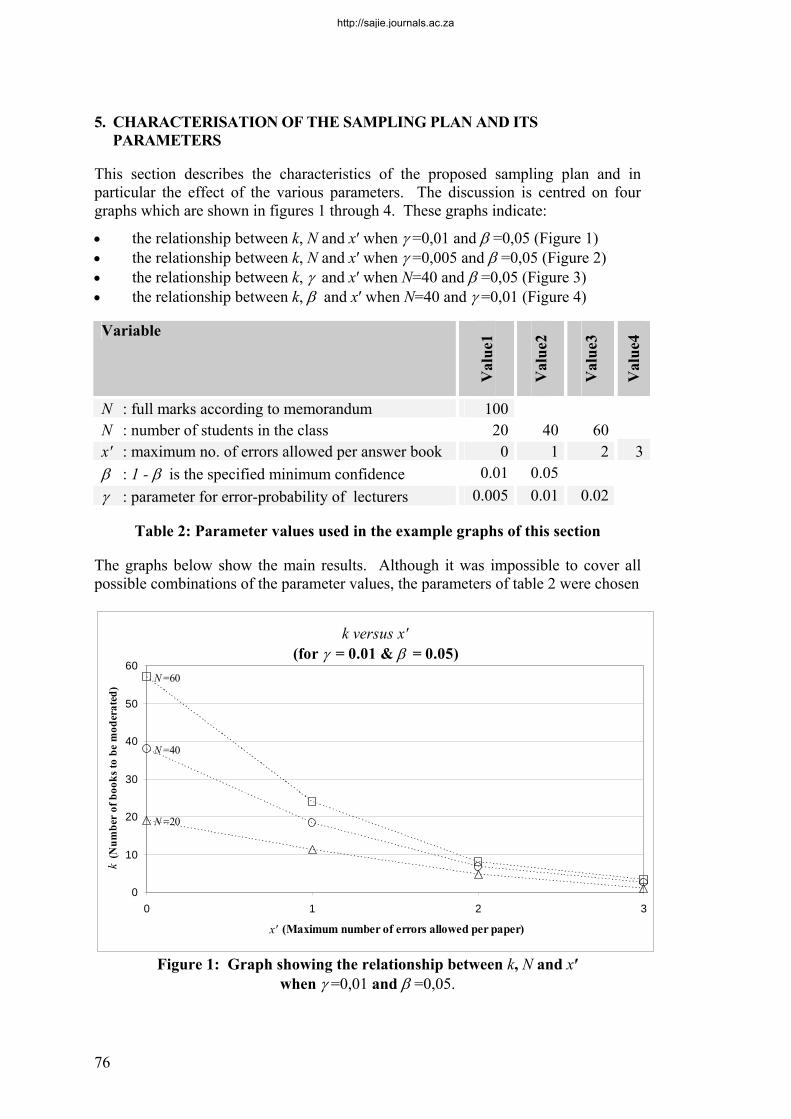
5. CHARACTERISATION OF THE SAMPLING PLAN AND ITS PARAMETERS This section describes the characteristics of the proposed sampling plan and in particular the effect of the various parameters. The discussion is centred on four graphs which are shown in figures 1 through 4. These graphs indicate:
• the relationship between k, N and x′ when γ =0,01 and β =0,05 (Figure 1) • the relationship between k, N and x′ when γ =0,005 and β =0,05 (Figure 2) • the relationship between k, γ and x′ when N=40 and β =0,05 (Figure 3) • the relationship between k, β and x′ when N=40 and γ =0,01 (Figure 4) Variable
Val
ue1
Val
ue2
Val
ue3
Val
ue4
N : full marks according to memorandum 100 N : number of students in the class 20 40 60 x' : maximum no. of errors allowed per answer book 0 1 2 3 β : 1 - β is the specified minimum confidence 0.01 0.05 γ : parameter for error-probability of lecturers 0.005 0.01 0.02
Table 2: Parameter values used in the example graphs of this section
The graphs below show the main results. Although it was impossible to cover all possible combinations of the parameter values, the parameters of table 2 were chosen
Figure 1: Graph showing the relationship between k, N and x′ when γ =0,01 and β =0,05.
k versus x'(for γ = 0.01 & β = 0.05)
N =20
N =40
N =60
0
10
20
30
40
50
60
0 1 2 3
x' (Maximum number of errors allowed per paper)
k (N
umbe
r of
boo
ks to
be
mod
erat
ed)
http://sajie.journals.ac.za

77
in such a way that moderators can at least use the graphs as a rough guide to choose the number of books that have to be moderated (k) for a fairly representative spectrum of possible situations.
The first observation from figures 1 and 2, and one that was expected, is that the moderator needs to check more books if the error allowance is smaller. If the error allowance is zero, the sample size approaches the batch size (k ≅ N).
k versus x'(for γ = 0.005 & β = 0.05)
N =20
N =40
N =60
0
10
20
30
40
50
60
0 1 2 3
x ' (Maximum number of errors allowed per paper)
k (N
umbe
r of
boo
ks to
be
mod
erat
ed)
Figure 2: Graph showing the relationship between k, N and x′ when γ = 0,005 and β = 0,05
Secondly it can be seen that larger samples are required for larger classes. It will also be noted that k is more dependent on N when the error allowance is small. When the error allowance reaches 3 errors per 100, the k values become almost constant and independent of N (k almost the same for N between 20 and 60).
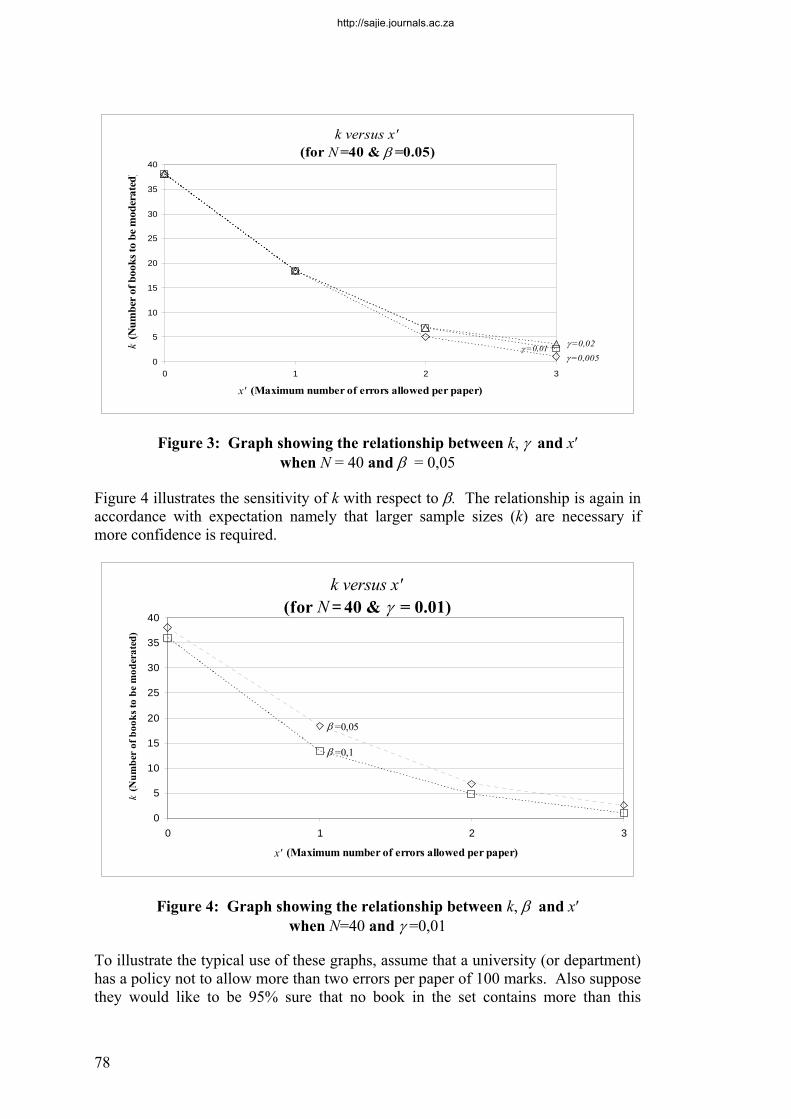
The first two graphs differ only in terms of the value of γ. It is clear from these two graphs that k is particularly insensitive to γ, for realistic choices of γ5. For example if x′ = 1 and N = 40 there is almost no difference in k if γ changes from 0,005 to 0,01. This observation is even more evident from figure 3 which shows that for small error allowances, k is almost unaffected by changes in γ (at least within the range γ = 0,005 to 0,02). However at higher error allowances γ’s effect on k becomes more pronounced. For example when the error allowance is 3%, the relative difference in k becomes significant even though the absolute difference remains small.
5 γ can be roughly estimated from the proportion of complaints (due to marking errors in class tests) received from candidates. From experience in terms of the proportion of student complaints received it would appear that γ is small (as in the example) for a typical (average) examiner. However further research is required to estimate a realistic range for the γ parameter.
http://sajie.journals.ac.za
78
k versus x'(for N =40 & β =0.05)
γ =0,005γ =0,01 γ =0,02
0
5
10
15
20
25
30
35
40
0 1 2 3
x' (Maximum number of errors allowed per paper)
k (N
umbe
r of
boo
ks to
be
mod
erat
ed)
Figure 3: Graph showing the relationship between k, γ and x′ when N = 40 and β = 0,05
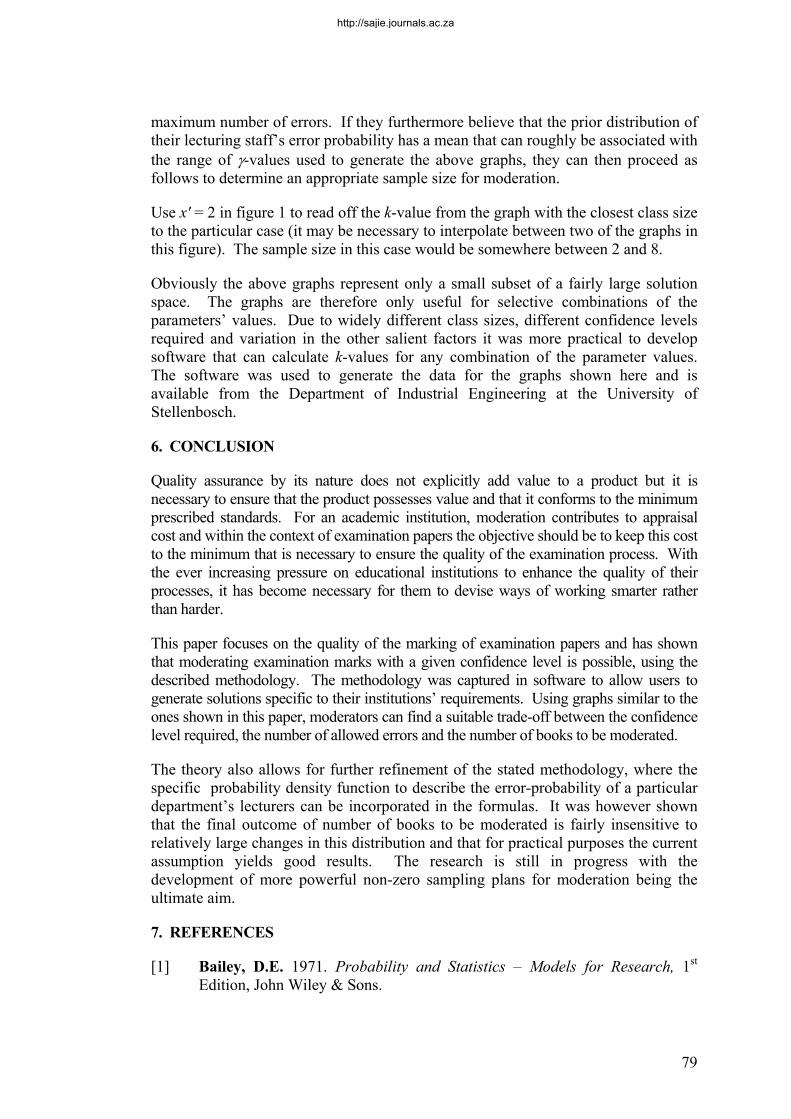
Figure 4 illustrates the sensitivity of k with respect to β. The relationship is again in accordance with expectation namely that larger sample sizes (k) are necessary if more confidence is required.
k versus x'(for N = 40 & γ = 0.01)
β =0,05
β =0,1
0
5
10
15
20
25
30
35
40
0 1 2 3
x' (Maximum number of errors allowed per paper)
k (N
umbe
r of
boo
ks to
be
mod
erat
ed)
Figure 4: Graph showing the relationship between k, β and x′ when N=40 and γ =0,01
To illustrate the typical use of these graphs, assume that a university (or department) has a policy not to allow more than two errors per paper of 100 marks. Also suppose they would like to be 95% sure that no book in the set contains more than this
http://sajie.journals.ac.za
79
maximum number of errors. If they furthermore believe that the prior distribution of their lecturing staff’s error probability has a mean that can roughly be associated with the range of γ-values used to generate the above graphs, they can then proceed as follows to determine an appropriate sample size for moderation.
Use x′ = 2 in figure 1 to read off the k-value from the graph with the closest class size to the particular case (it may be necessary to interpolate between two of the graphs in this figure). The sample size in this case would be somewhere between 2 and 8.
Obviously the above graphs represent only a small subset of a fairly large solution space. The graphs are therefore only useful for selective combinations of the parameters’ values. Due to widely different class sizes, different confidence levels required and variation in the other salient factors it was more practical to develop software that can calculate k-values for any combination of the parameter values. The software was used to generate the data for the graphs shown here and is available from the Department of Industrial Engineering at the University of Stellenbosch.
6. CONCLUSION
Quality assurance by its nature does not explicitly add value to a product but it is necessary to ensure that the product possesses value and that it conforms to the minimum prescribed standards. For an academic institution, moderation contributes to appraisal cost and within the context of examination papers the objective should be to keep this cost to the minimum that is necessary to ensure the quality of the examination process. With the ever increasing pressure on educational institutions to enhance the quality of their processes, it has become necessary for them to devise ways of working smarter rather than harder.
This paper focuses on the quality of the marking of examination papers and has shown that moderating examination marks with a given confidence level is possible, using the described methodology. The methodology was captured in software to allow users to generate solutions specific to their institutions’ requirements. Using graphs similar to the ones shown in this paper, moderators can find a suitable trade-off between the confidence level required, the number of allowed errors and the number of books to be moderated.
The theory also allows for further refinement of the stated methodology, where the specific probability density function to describe the error-probability of a particular department’s lecturers can be incorporated in the formulas. It was however shown that the final outcome of number of books to be moderated is fairly insensitive to relatively large changes in this distribution and that for practical purposes the current assumption yields good results. The research is still in progress with the development of more powerful non-zero sampling plans for moderation being the ultimate aim.
7. REFERENCES
[1] Bailey, D.E. 1971. Probability and Statistics – Models for Research, 1st Edition, John Wiley & Sons.
http://sajie.journals.ac.za

80
[2] Winston, W.L. 2004. Operations Research - Applications and Algorithms, 4th Edition, Duxbury.
[3] The University of Manchester. 2003. Exams Information for Teaching Staff, http://www.cs.man.ac.uk/Study_subweb/Ugrad/exams/stafffaq.php3
[4] National Qualifications Framework. 2004 Standardising Marking and Moderation, http://www.ocr.org.uk/OCR/WebSite/docroot/understand/smm.jsp
http://sajie.journals.ac.za