05 - step-by-step guide to calculating the 2013-14 ... · policy clinical estates ... tariff...
TRANSCRIPT
Gateway Ref: 18768
Payment by Results
Step-by-Step Guide: Calculating the 2013-14 National Tariff

0
DH INFORMATION READER BOX
Policy Clinical Estates HR / Workforce Commissioner Development IM & T Management Provider Development Finance Planning / Performance Improvement and Efficiency Social Care / Partnership Working
Document Purpose For Information
Gateway Reference 18768
Title Step-by-Step guide: Calculating the 2013-14 National Tariff
Author Department of Health Payment by Results team
Publication Date 28 February 2013
Target Audience PCT Cluster CEs, NHS Trust CEs, SHA Cluster CEs, Care Trust CEs, Foundation Trust CEs , Medical Directors, PCT Cluster Chairs, NHS Trust Board Chairs, Special HA CEs, Directors of Finance, Allied Health Professionals, Communications Leads
Circulation List GPs
Description This step-by-step guide is the 2013-14 version of a document issued in previous years which has proved useful in outlining the steps undertaken in calculating the national Payment by Results tariff.
Cross Ref Payment by Results Guidance for 2013-14
Superseded Docs Step-by-Step guide: Calculating the 2012-13 National Tariff
Action Required To note the contents
Timing N/A
Contact Details
Leeds LS2 7UE
Payment by Results team
Department of Health Quarry House Quarry Hill
For Recipient's Use
Gateway Ref: 18768

Contents
Section 1: Introduction...................................................................................4
Section 2: Overview of major structural changes .......................................5
Section 3: Principles of tariff calculation and price adjustments ..............6
Section 4: Admitted patient care tariff..........................................................8
Section 5: Outpatient procedure tariff ........................................................16
Section 6: Outpatient attendance tariff .......................................................17
Section 7: Accident & emergency tariff ......................................................21
Section 8: Other Mandatory Areas ..............................................................22
Section 9: Affordability and Tariff Adjustment ..........................................25
Section 10: Best practice tariffs ..................................................................26
Section 11: Annexes.....................................................................................35
Annex A: Converting FCE-level costs to spell-level ............................................. 35 Annex B: Calculation of trim points and excess bed days................................... 39 Annex C: Glossary of Terms ................................................................................... 40 Annex D: Tariff Calculation Flow Chart.................................................................. 41
Gateway Ref: 18768

Section 1: Introduction
1.1 The Department is committed to publishing a step-by-step guide to calculating the Payment by Results (PbR) national tariff each year1. This guide meets that commitment by describing the stages involved in calculating the individual mandatory tariffs.
1.2 2013-14 is the final year that the Department of Health will have responsibility for calculating the national tariff. In future years, Monitor and NHS Commissioning Board will take on this responsibility for producing the tariff.
1.3 The purpose of this guide is to describe the iterations of the tariff calculation lifecycle, ie how the Department has calculated the 2013-14 mandatory national tariff. This is summarised in the diagram at Annex D. This guide should not be confused with the “Payment by Results Guidance for 2013-14", which covers the operation of PbR.
1.4 Section two of the guide summarises the structural changes to the tariff in 2013-14 which have affected its calculation.
1.5 Section three lists the general principles which apply to tariff calculation and price adjustments.
1.6 Sections four to seven explain the key stages of tariff calculation. These include the adjustments that were applied to the prices generated in each area in response to feedback from the sense check and road test exercises.
1.7 The managed expansion to the scope of national tariffs and currencies has continued for 2013-14. While some of these areas have appeared in previous tariffs, this is the first year that they will be described in the Step-by-Step Guide. Section eight will cover these areas.
1.8 Section nine covers the application of affordability, tariff adjustment and CNST adjustments to the tariffs.
1.9 Section ten explains the calculation of best practice tariffs.
1.10 In the main, these tariffs are based on full-year 2010-11 reference costs (RC1011) and 2010-11 Hospital Episode Statistics (HES1011). In some instances supporting datasets, such as PLICS for example, are used to help inform the setting of prices.
1.11 This guide contains a number of examples to demonstrate specific calculations or adjustments. Any figures quoted are for illustrative purposes only and should not be considered true representations of actual data unless explicitly stated. In many cases, the HRG and treatment function codes used are fictitious.
1 Code of Conduct for Payment by Results, paragraph 3.1.3 Page 4 of 41
1.Introduction

Section 2: Overview of major structural changes
Admitted patient care (APC) and outpatient procedure (OPROC) tariff
2.1 In 2013-14, as in previous years, the scope of the APC tariff was expanded slightly. In the main though, the moderate increase in the number of HRGs was due to design changes.
2.2 The number of HRGs assigned a price in the OPROC tariff rose to 91 from 79. Again, this was the combined result of HRG design changes and a small expansion in scope.
2.3 Long stay payments – which are applied to all spells with a length of stay that exceeds the trim point set for the HRG – continue to be standardised across each HRG chapter. However, in 2013-14, within each chapter there will be two long stay payment rates – one for children-specific HRGs and one for all other HRGs.
2.4 It is worth noting that the policy of having a minimum floor of five days applied to all trim points remains in place
2.5 Figure 2.1 below illustrates the 2013-14 APC & OPROC tariff structure:
Figure 2.1: 2013-14 APC and OPROC tariff structure
Daycase Elective Non-Elective OP Procedure
1,23
3M
anda
tory
HRG
s
Combined EL/DC: 1,212 HRGs
Separate DC: 15 HRGs
Separate EL: 16 HRGs
Zero price: 5 HRGs
1,228 HRGs
Zero price: 5 HRGs
No price (paid at rate for
OPATT): 1,142 HRGs
91 HRGs
Zero price HRGs: LA08E, PB03Z, SB97Z, SC97Z and UZ01Z, across all settings. GA10D has no daycase tariff.
NOT TO SCALE
Outpatient attendance tariff
2.6 In 2013-14, the costs of diagnostic imaging undertaken in an outpatient setting have not been ‘rebundled’ into the outpatient attendance tariff. Separate tariffs for diagnostic imaging have been set.
Accident & Emergency tariff
2.7 The 2013-14 A&E tariff was no longer based on bandings and separate prices for all 11 HRGs were calculated.
Page 5 of 41 Section 2: Overview of Major Structural Changes

Section 3: Principles of tariff calculation and price adjustments
3.1 There are some general principles which underpin the calculation of the tariffs and have been developed over a number of years. These provide the starting point for both tariff calculation and price adjustments in each year.
Tariff calculation
3.2 Tariffs are based largely on underlying reference costs, with a three year time lag. Therefore, the 2013-14 tariff was based on 2010-11 reference costs. This time lag is necessary to ensure appropriate quality assurance and stakeholder engagement can be undertaken. This was a key recommendation from the 2006 Lawlor report2.
3.3 HES data are used as a basis for activity for APC tariffs, including mapping of costs from FCEs to spells. The HES data used are from the same financial year as the reference costs data.
3.4 The aggregation of costs to HRG or TFC level is done as early as possible in the tariff calculation process.
Price adjustments
3.5 Once tariffs have been calculated using the base reference costs and HES data, they are then subject to both manual and automatic price adjustments to remove anomalies and reflect stakeholder feedback.
3.6 Adjustments to the prices generated by the tariff calculation models are only made for good reasons. For example, to avoid pricing anomalies or perverse incentives and are mainly in response to feedback from clinicians and stakeholders.
3.7 Generally, price adjustments do not move away from the underlying costs used in calculation. In the instances where this occurs, it is only done with good reason such as strong clinical feedback.
3.8 Where the scope of the tariff does not change, adjustments should not alter the tariff quantum. Where this does occur, it is the result of specific policies such as the implementation of embedded efficiency savings (which are described in subsequent sections).
3.9 Some adjustments may result in amended prices that do not comply with rules applied during the initial calculation process.
2 www.dh.gov.uk/en/Managingyourorganisation/Financeandplanning/NHSFinancialReforms/DH_4137253 Page 6 of 41
3. Principles of tariff calculation and price adjustments
3.10 A breakdown of adjustments are detailed in subsequent sections. They cover adjustments made at two stages in the tariff calculation process:
Pro-active pricing adjustments – adjustments made by the PbR team prior to the formal sense check exercise. The aim of this stage is to adjust prices and relativities between HRGs where there were clear anomalies or perversities. The principles underpinning these adjustments were based on clinical feedback received in previous years.
Adjustments in response to consultation – adjustments implemented in response to stakeholder feedback from the sense check and road test exercises.
Page 7 of 41 3. Principles of tariff calculation and price adjustments
Section 4: Admitted patient care tariff
Tariff calculation
4.1 RC1011 data covering daycase (DC), elective inpatient (EL) and non-elective inpatient (NE) formed the basis of the tariff calculation.
4.2 All data relating to services supplied by non-NHS organisations and PMS+ providers were excluded. These providers operate under different cost bases and it would not have been appropriate to include their data when calculating the national averages.
4.3 Total inlier and excess bed day (EBD) costs were obtained for each provider/HRG/admission type combination as:
Total cost = Unit cost * Finished consultant episode (FCE) Volumes
4.4 NE data, split between short1 and non-short stay episodes in RC1011, were combined for the tariff calculation.
4.5 RC1011 data were collected at HRG level and reported using the relevant treatment function code (TFC). However, for the tariff calculation the RC1011 data was aggregated to remove the TFC.
Inclusion of Coronary Care Unit (CCU) data
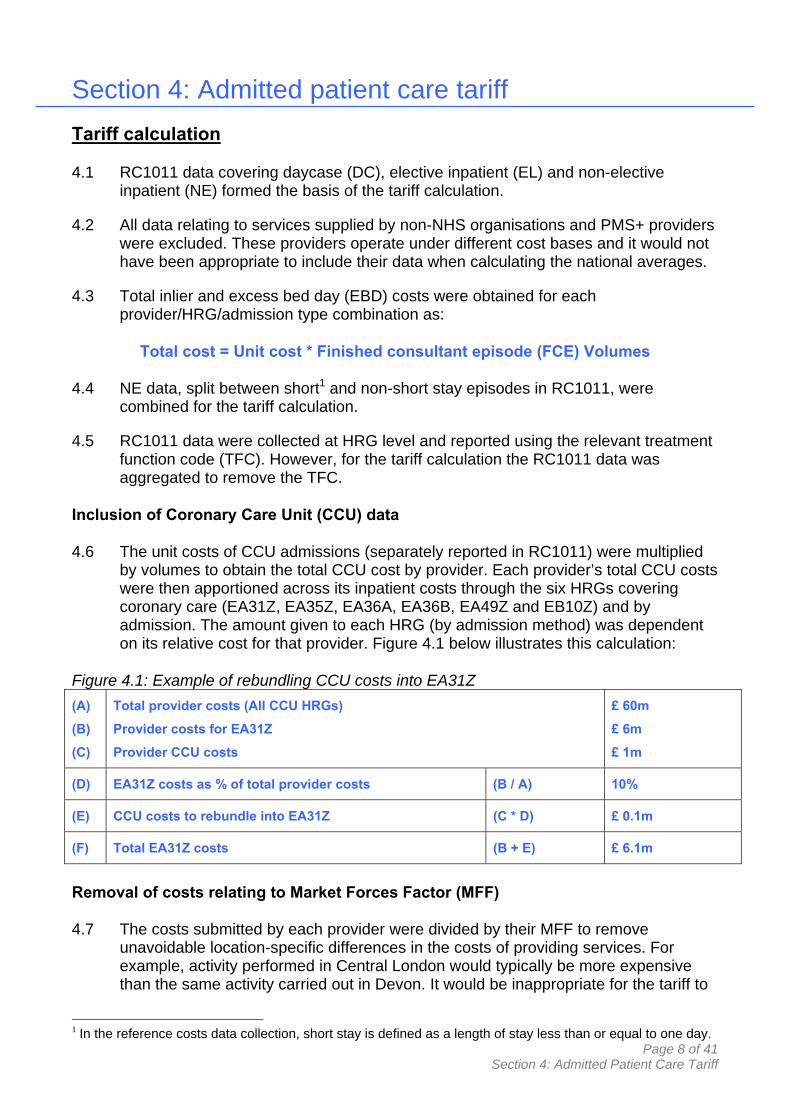
4.6 The unit costs of CCU admissions (separately reported in RC1011) were multiplied by volumes to obtain the total CCU cost by provider. Each provider’s total CCU costs were then apportioned across its inpatient costs through the six HRGs covering coronary care (EA31Z, EA35Z, EA36A, EA36B, EA49Z and EB10Z) and by admission. The amount given to each HRG (by admission method) was dependent on its relative cost for that provider. Figure 4.1 below illustrates this calculation:
Figure 4.1: Example of rebundling CCU costs into EA31Z
(A)
(B)
(C)
Total provider costs (All CCU HRGs)
Provider costs for EA31Z
Provider CCU costs
£ 60m
£ 6m
£ 1m
(D) EA31Z costs as % of total provider costs (B / A) 10%
(E) CCU costs to rebundle into EA31Z (C * D) £ 0.1m
(F) Total EA31Z costs (B + E) £ 6.1m
Removal of costs relating to Market Forces Factor (MFF)
4.7 The costs submitted by each provider were divided by their MFF to remove unavoidable location-specific differences in the costs of providing services. For example, activity performed in Central London would typically be more expensive than the same activity carried out in Devon. It would be inappropriate for the tariff to
1 In the reference costs data collection, short stay is defined as a length of stay less than or equal to one day. Page 8 of 41
Section 4: Admitted Patient Care Tariff

reflect these differences as organisations with high MFFs would report higher costs. Provider MFF is then re-applied at the payment stage (paragraph 4.9). More detail on calculation of provider level MFFs can be found in PbR and the market forces factor in 2013-14. Figure 4.2 illustrates how the MFF was removed.
Figure 4.2: Example of MFF removal
(A)
(B)
Provider YY01Y costs
Provider MFF (min = 1)
£ 50m
1.2500
(C) Provider YY01Y costs (Exc. MFF) (A / B) £ 40m
4.8 MFF figures for payment were set to a minimum of one.
4.9 As provider MFFs were removed from costs in tariff calculation, these differences need to be re-applied at the payment stage. Again, it would be inappropriate to pay all organisations the same prices when unavoidable location-specific differences exist. As such, a provider’s MFF is to be applied to the prices they receive, ie provider income = activity * tariff * MFF.
Data cleaning
4.10 Data cleaning was carried out conservatively to uphold the principle that the tariff reflects full reported costs as much as possible. However, there may be examples of organisations with reported costs so low that they were clearly erroneous and other costs so different from the mean that they were clearly unique cases, unrelated to the package of care that the HRG was intended to cover and the tariff was planned to fund.
4.11 For each HRG across the five categories (DC, EL, NE, EL EBDs and NE EBDs), provider level costs less than one twentieth of, or greater than twenty times, the national average were removed (illustrated in Figure 4.3).
Figure 4.3: Example of data cleaning
(A)
(B)
National average unit cost
Provider unit cost
£ 800
£ 10
(C) Provider unit cost as a % of national average unit cost (B / A) 1.25%
(D) Is provider unit cost < 1/20th or > 20 times national average?
(C) < 5% OR
(C) > 2000%
1.25% < 5%
So Remove
4.12 Further data cleaning was also performed on EBD activity data. The RC1011 data used for tariff calculation only covered activity within that financial year, ie between 1 April 2010 and 31 March 2011. If the number of EBDs reported were greater than the maximum possible in a single year, ie greater than 365 days, these bed days and their associated costs were removed.
4.13 From this point onwards, the costs and activity were aggregated solely by HRG and admission method (removing provider) and all adjustments made at HRG level.
Page 9 of 41 Section 4: Admitted Patient Care Tariff

.
.
Inclusion of costs in A&E leading to admission
4.14 Patients admitted via A&E generate both an A&E and non-elective payment. The A&E tariff is funded through all A&E attendances. Where attendances lead to an admission, the costs associated solely with admitting the patient were removed from the A&E costs and added to the non-elective payment tariff.
4.15 RC1011 separately identified those attendances leading to an admission from those that did not. Therefore, it was possible to calculate the total cost of admitting patients (in those attendances that lead to an admission) over and above those not leading to an admission and add it to the NE tariff. This figure was £68m (in 2010-11 prices), excluding MFF.
4.16 This cost was apportioned across NE HRGs in proportion to both:
the total NE cost of that HRG (excluding EBDs), and; the proportion of NE FCEs admitted via A&E (from HES1011)
Figure 4.4: Example of apportioning A&E costs (leading to admission)
(A) Total Cost of A&E leading to admissions £ 100m
(B) Proportion of NE admissions from A&E
YY01Y 24% YY02Y 15% YY03Y 20%
Total NE costs: (C) YY01Y £ 500m
YY02Y £ 400m YY03Y £ 100m
TOTAL £ 1,000m
(D) Costs of NE FCEs admitted from A&E:
YY01Y £ 120m (£ 500m* 24%) YY02Y YY03Y (C * B)
£ 60m (£ 400m* 15%) £ 20m (£ 100m* 20%)
TOTAL £ 200m
(E) Adjusted NE costs (inc. A&E leading to admission):
YY01Y (C) + (A * D ) £ 560m YY02Y YY03Y Σ(D)
£ 430m £ 110m
TOTAL £ 1,100m
(F) Check: Total cost of A&E leading to admission + NE cost
Σ(C) + (A) £ 1,100
NICE technology appraisals
4.17 NICE technology appraisals between the year of costs (2010-11) and payment (2013-14) are taken into account. However, for the 2013-14 tariff no adjustment was required.
Page 10 of 41 Section 4: Admitted Patient Care Tariff

.
FCE to spell cost conversion
4.18 At this stage, costs were mapped from episodes to spells. A full explanation and illustration of the methodology for generating spell-based costs can be found at Annex A.
4.19 Costs for any non-mandatory HRGs (out of scope of the 2013-14 tariff) were removed after this stage.
Combining daycase and elective admissions
4.20 At this stage, data associated with DC and EL admissions were combined.
Calculation of excess bed days (EBD) and long stay payment
4.21 In 2013-14, separate chapter level long stay payments for adults and children were introduced for the first time.
4.22 Adult and child EBD average costs (covering EL and NE admissions) were calculated at a chapter level:
Σ (EL FCE EBD total cost) + Σ (NE FCE EBD total cost) Σ (EL FCE EBD activity) + Σ (NE FCE EBD activity)
These averages are designed to represent the basic ‘hotel’ cost of keeping an adult or child patient in hospital and formed the basis of the long stay payment.
4.23 These chapter level long stay payments were then limited to a minimum of £100 and a maximum of £500. This policy was to ensure that providers were appropriately reimbursed for longer lengths of stay and that payments were not skewed by outliers. In 2013-14, it was not necessary to make this adjustment as no long stay payment calculation exceeded these boundaries.
Removal of costs associated with excess bed days
4.24 The costs of EBDs (the number of days in the length of stay above the long stay trim point) were then removed from the total spell cost for each HRG (by admission method). The number of spell-based EBDs by HRG was calculated using HES1011 data based on trim points calculated using the same data source (calculation of trim points is described in Annex B).
4.25 The number of spell-based EBDs for a given HRG/admission method was multiplied by the HRG EBD unit cost (calculated at paragraph 4.22) to give a total EBD cost. This total EBD cost by HRG/admission method was then subtracted from the total spell cost for the combination.
Figure 4.5: Example of removing EBD costs
(A) Total cost of spells for YY01Y £ 10,000
(B) Number of spell-based EBDs for YY01Y 10
(C) Adjusted HRG EBD average cost £ 100
Page 11 of 41 Section 4: Admitted Patient Care Tariff

(D) EBD total cost (B * C) £ 1,000
(E) Spell-based costs (Exc. EBD) (A – D) £ 9,000
Removal of costs associated with drugs and devices (D&D)
4.26 Costs associated with specific drugs and devices (outside of the scope of the 2013-14 tariff) were then removed. These costs were differentially apportioned across specific HRGs. As with RC1011, the MFF was removed from the exclusions at this stage. In order to improve the transparency of the calculation, a national MFF was used to deflate the figures. The national MFF was calculated as 8.4% for admitted patient care.
4.27 Some of the costs for drugs and devices could not be targeted to specific HRGs. Therefore, these were removed from all HRGs as a top-slice at a later stage (see paragraphs 4.34 - 4.37).
Limiting cost removal of EBD and D&D
4.28 A general guideline was applied that no more than 50% of the total cost of each spell-based HRG (by admission method) could be removed for both EBDs and D&D exclusions. This was to prevent a HRG, particularly those with low activity, being disproportionately affected. The prices affected by this guideline were then reviewed to check that this was suitable.
4.29 Where appropriate, those HRGs where more than 50% was removed, any amount above 50% was not removed from the HRG but applied across all HRGs as a top-slice at a later stage (see paragraphs 4.34 - 4.37).
Short Stay Emergency tariff (SSEM)
4.30 Certain HRGs attracted a reduced short stay emergency (SSEM) tariff for adult emergency spells with a length of stay less than 2 days. The level of the SSEM tariff was based on the average NE length of stay of the HRG (from HES1011).
4.31 The percentage reductions for each SSEM banding were not altered from the 2012-13 tariff and are shown in figure 4.6 below:
Figure 4.6: SSEM Bandings
Average length of stay of HRG
(days)
Band % of full NE tariff price
0-1 1 100%
2 2 70%
3-4 3 45%
>5 4 25%
Page 12 of 41 Section 4: Admitted Patient Care Tariff

4.32 Prior to this stage in the process, tariff calculation assumed that all NE spells attracted the full tariff. From this point on, however, it differentiated between SSEM and non-SSEM spells. As the SSEM tariff is a percentage of the main tariff, treating the short stay spells separately caused a reduction in the overall cost quantum of the tariff.
4.33 To counteract this, the NE tariff prices were inflated based on:
the proportion of non-elective spells that attract the short stay adjustments, and;
the short stay banding of the HRG.
Figure 4.7: Example of SSEM adjustments to NE prices
(A)
(B)
(C)
(D)
Non-elective tariff price of YY01Y (prior to SSEM)
Total non-elective spells for YY01Y
Total SSEM spells
SSEM tariff (band 2)
£ 5,000
100
10
70%
(E) Total costs (prior to SSEM) (A * B) £ 500,000
(F) Revised costs (spells not attracting SSEM) (A) * (B - C) £ 450,000
(G) Revised costs (spells attracting SSEM) (C) * (A * D) £ 35,000
(H) Total revised costs (F + G) £ 485,000
(I) Revised costs as % of total costs prior to SSEM (H / E) 97%
(J) Adjusted non-elective price (inc. SSEM) (A / I) £ 5,155
Top-slices
4.34 Next, a number of top-slices were collated and applied. A top-slice is a national level adjustment across all or a subset of HRGs for which the funds are removed proportional to the total cost of the service.
4.35 The top-slices were calculated as percentage adjustments to inlier unit costs:
Total costs – Top-sliced income Total costs
4.36 Top-slices were calculated for:
Specialised services – in order to fund the additional payments for specialist top-ups, an estimate was made of the costs to commissioners for this and removed from DC/EL and NE;
Injury Cost Recovery (ICR) Scheme2 – these costs are paid separately through the ICR scheme and so were removed (from NE only), and;
D&D exclusions – (from paragraph 4.26 - 4.27) applied to DC/EL and NE separately.
2 More information available at: http://transparency.dh.gov.uk/tag/nhs-icr/ Page 13 of 41
Section 4: Admitted Patient Care Tariff

4.37 The top-slices were then multiplied together to attain a single adjustment for DC/EL and NE prices. These adjustments were applied to total DC/EL and NE costs. Using revised costs, a unit cost for every HRG/admission type combination was calculated as:
Total costs (adjusted for top-slices) Total activity
Price adjustments
Trim point floor
4.38 A minimum trim point - first introduced for the 2011-12 tariff - remained in place. The trim point floor was set at five days, so any HRGs with a trim point of less than five days was set to this minimum level.
Change to HRG pricing structure
4.39 Following feedback and comparisons with the 2012-13 published tariff, several prices were either:
(a) combined, (b) uncombined across admission types, or; (c) set at a level agreed by the relevant stakeholders.
4.40 Where prices were uncombined, relativities from tariff calculation (prior to combination) were applied, whilst maintaining the overall quantum of cost within each HRG.
Price differences between related HRGs (relativities)
4.41 Percentage differences between the prices of related HRGs should reflect the cost differential between treatments of, for example, different complexities and co-morbidities. In some cases, the tariff calculation generated prices with counter-intuitive differentials.
4.42 The relativities were adjusted in one of the following ways:
applying the relativities from the 2012-13 tariff; applying the relativities of similar HRGs in the 2013-14 tariff, or; calculation of a combined (weighted) price (see below).
Weighted (combined) prices
4.43 In cases where it was not feasible or practical to apply existing relativities, perversities were removed by combining the costs and activity to calculate a single weighted cost for the affected HRG(s), as illustrated in figure 4.9 below.
Page 14 of 41 Section 4: Admitted Patient Care Tariff

Figure 4.9: Example of combined cost calculation
(A)
(B)
Original prices for HRGs to be combined:
AB05Z (Intermediate Pain Procedures)
AB06Z (Minor Pain Procedures)
Activity for HRGs to be combined:
AB05Z (Intermediate Pain Procedures)
AB06Z (Minor Pain Procedures)
£ 100
£ 300
1,500
1,000
(C) Total cost of HRGs to be combined Σ(A * B) £ 450,000
(D) Total activity of HRGs to be combined Σ(B) 2,500
(E) Combined price (C / D) £ 180
4.44 The combined prices were calculated by dividing the total costs for the relevant tariffs by the total activity for those tariffs. This ensured the cost neutrality of the adjustment.
4.45 The adjustment was applied to:
single HRGs across admission methods, and; a range of HRGs across a single admission method.
Fixed price adjustments
4.46 In some instances following clinical advice, the calculated price was replaced with a preferred alternative.
4.47 Prices were either:
a reversion to 2012-13 tariff prices; manually re-calculated eg to take into account 2011-12 reference costs
data, or; set at a level agreed by the relevant stakeholders.
Chapter-specific price adjustments
4.48 Following clinical feedback, including ongoing work with Expert Working Groups (EWGs), price changes were made in the following (sub) chapters:
AA - Nervous system C - Mouth, head, neck and ears F - Digestive system G - Hepatobiliary and pancreatic system H - Orthopaedics QZ and RC - Vascular and IR
Page 15 of 41 Section 4: Admitted Patient Care Tariff
Section 5: Outpatient procedure tariff
Tariff calculation
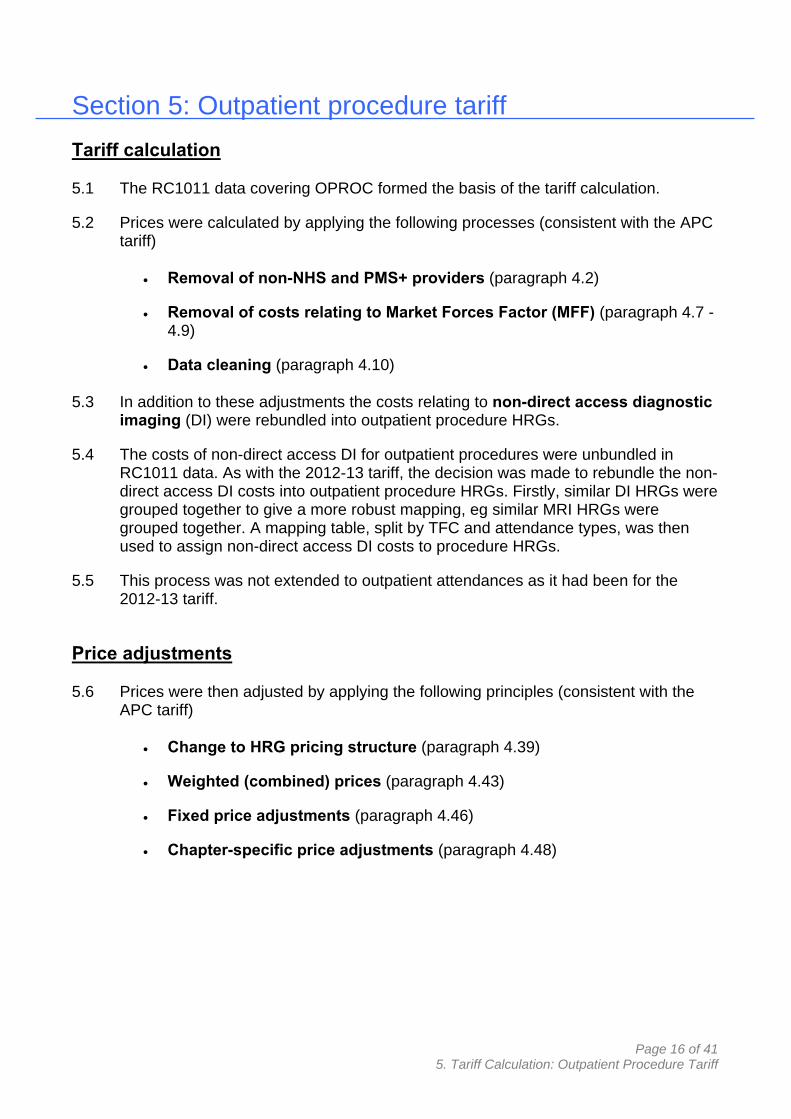
5.1 The RC1011 data covering OPROC formed the basis of the tariff calculation.
5.2 Prices were calculated by applying the following processes (consistent with the APC tariff)
Removal of non-NHS and PMS+ providers (paragraph 4.2)
Removal of costs relating to Market Forces Factor (MFF) (paragraph 4.7 -4.9)
Data cleaning (paragraph 4.10)
5.3 In addition to these adjustments the costs relating to non-direct access diagnostic imaging (DI) were rebundled into outpatient procedure HRGs.
5.4 The costs of non-direct access DI for outpatient procedures were unbundled in RC1011 data. As with the 2012-13 tariff, the decision was made to rebundle the non-direct access DI costs into outpatient procedure HRGs. Firstly, similar DI HRGs were grouped together to give a more robust mapping, eg similar MRI HRGs were grouped together. A mapping table, split by TFC and attendance types, was then used to assign non-direct access DI costs to procedure HRGs.
5.5 This process was not extended to outpatient attendances as it had been for the 2012-13 tariff.
Price adjustments
5.6 Prices were then adjusted by applying the following principles (consistent with the APC tariff)
Change to HRG pricing structure (paragraph 4.39)
Weighted (combined) prices (paragraph 4.43)
Fixed price adjustments (paragraph 4.46)
Chapter-specific price adjustments (paragraph 4.48)
Page 16 of 41 5. Tariff Calculation: Outpatient Procedure Tariff

Section 6: Outpatient attendance tariff
Tariff calculation
6.1 The starting point for the tariff calculation was the outpatient attendance (OPATT) data from RC1011. As with the APC & OPROC tariff, data relating to services supplied by PMS+ and non-NHS providers were excluded.
6.2 The RC1011 categories were mapped to the appropriate outpatient treatment. For each of the treatment functions codes (TFCs) with mandatory tariffs, four attendance tariffs were generated, covering consultant-led (CL), face-to-face (F2F) attendances:
First Attendance, Single Professional (FAS) First Attendance, Multi-Professional (FAM) Follow-Up Attendance, Single Professional (FUS) Follow-Up Attendance, Multi-Professional (FUM)
Group to Treatment Function Code (TFC)
6.3 RC1011 collected some data at sub TFC level e.g. TFC 110 (Trauma and Orthopaedics) was collected split by Trauma and Non-Trauma (110T and 110N respectively). In all such cases, the data were grouped together to TFC level.
Removal of costs relating to Market Forces Factor (MFF)
6.4 Each provider’s costs were divided by their MFF to remove any unavoidable location-specific costs (as per paragraphs 4.7 - 4.9).
Data cleaning
6.5 Further data cleaning was then performed to remove any obviously erroneous or inappropriate outliers (as per paragraph 4.10).
6.6 At this point, the costs and activity were aggregated solely by TFC (removing provider).
Removal of costs associated with drugs and devices (D&D)
6.7 Next, costs associated with certain high cost drugs and devices were removed from the tariff (as performed in paragraphs 4.26 - 4.27). As with the APC tariff, an amount that could not be targeted to specific TFCs was removed as a top-slice.
Limiting cost removal of drugs and devices
6.8 At the next stage, an upper threshold of 50% was set for the proportion of cost that could be removed from the total cost of an individual category by the effect of the drugs and devices exclusions (as performed in paragraph 0). The resulting tariffs affected by the threshold were then reviewed to check that this was appropriate.
Page 17 of 41 6. Tariff Calculation: Outpatient Attendance Tariff

.
.
6.9 As with the APC tariff, the exclusions were deflated by the national MFF. For outpatients this was calculated as 9.2%. This figure was different from that used in the APC tariff as it was derived solely from the data within the OPATT tariff.
Unbundled non-direct access diagnostic imaging costs
6.10 The costs for non-direct access diagnostic imaging (DI) for outpatient procedures were not rebundled into OPATT TFCs. This reflected a change of policy from previous year’s tariffs.
Rebundling of non-mandatory OPROC HRGs
6.11 For any HRGs not receiving a mandatory OPROC tariff, the associated costs and activity were rebundled into OPATT TFCs using a mapping to assign HRG activity and costs to first and follow-up TFCs. This process is illustrated in figure 6.2:
Figure 6.2: Example of rebundling non-mandatory OPROC HRGs
(A) Total costs to be rebundled from non-mandatory OPROC HRG (YY01Z) £ 10,000
(B) Total cost of TFCs (prior to rebundling)
AAA (First attendance, Single professional (FAS)) £ 6,000 AAA (First attendance, Multi-professional (FAM) £ 5,000
AAA (Follow-up, Single professional (FUS)) £ 4,000 AAA (Follow-up, Multi-professional (FUM)) £ 5,000 BBB (FAS) £ 6,000 BBB (FAM) £ 4,000 BBB (FUS) £ 15,000 BBB (FUM) £ 5,000
TOTAL £ 50,000
(C) YY01Z – TFC mapping
AAA (FAS) 15% AAA (FAM) 5% AAA (FUS) 10% AAA (FUM) 15% BBB (FAS) 25% BBB (FAM) 10% BBB (FUS) 10% BBB (FUM) 10%
TOTAL 100%
(D) Apportioned costs by (First attendance & Follow-up)
AAA (FAS) (A * C) £ 1,500 (10k * 15%) AAA (FAM) £ 500 (£10k * 5%) AAA (FAS) £ 1,000 (£10k * 10%) AAA (FAM) £ 1,500 (£10k * 15%) BBB (FAS) £ 2,500 (£10k * 25%) BBB (FAM) £ 1,000 (£10k * 10%) BBB (FUS) £ 1,000 (£10k * 10%) BBB (FUM) £ 1,000 (£10k * 10%)
TOTAL £ 10,000
(E) Rebundle apportioned costs into FCE costs
AAA (FAS) AAA (FAM)
£ 7,500 £ 5,500
Page 18 of 41 6. Tariff Calculation: Outpatient Attendance Tariff

.
AAA (FUS) AAA (FUM) BBB (FAS) BBB (FAM) BBB (FUS) BBB (FUM)
TOTAL
(B + D)
£ 5,000 £ 6,500 £ 8,500 £ 5,000 £ 16,000 £ 6,000
£ 60,000
Front-loading of first attendance costs
6.12 Front-loading of the first attendances was performed at this stage. For each TFC, 10% of all follow-up costs were moved into the corresponding first attendance costs. This policy decision was taken to discourage unnecessary follow-up attendances.
6.13 Based on expert clinical advice, front-loading was not applied to infectious diseases (TFC 350) and nephrology (TFC 361).
Figure 6.3: Example of front-loading
(A)
(B)
Total first attendance costs for AAA
Total follow-up attendance costs for AAA
£ 1,000
£ 500
(C) Adjusted first attendance costs for AAA (A) + (B / 10) £ 1,050
(D) Adjusted follow-up attendance costs for AAA (B) – (B / 10) £ 450
(E) Check (A + B) = (C + D) £ 1,500 = £ 1,500
Disproportionate and inappropriate front-loading
6.14 Disproportionate front-loading was deemed to occur where the adjustment resulted in an increase of more than 50% of the first attendance total price. In such cases, the change in the first attendance price was limited to 50%.
Price adjustments
Low volume combinations
6.15 Any TFC with first or follow-up activity of less than 50 had one price calculated which combined the two activity settings.
First and follow-up adjustments
6.16 Follow-up attendance prices must not be greater than the equivalent first attendance price. Where this occurred, combined prices were calculated.
Page 19 of 41 6. Tariff Calculation: Outpatient Attendance Tariff

Multi-professional adjustments
6.17 A rule was applied that a multi-professional TFC should not be more than double the price of its single professional counterpart. Where this occurred, the price was limited to twice that of the single professional price.
6.18 Similarly, a multi-professional price should never be less than the price of its single-professional counterpart. In instances where the multi-professional price was the lower of the two, a combined price was calculated for both attendance types.
Paediatric-Adult relativities
6.19 This next stage involved comparing each paediatric TFC with its adult counterpart. Where the paediatric TFC price was less than the adult, combined weighted prices were calculated.
Change to TFC pricing structure
6.20 Following consideration of the previous steps, some prices were adjusted to account for either (a) under-reporting in RC1011 or (b) significant changes between RC1011 and RC1112 (Reference Costs 2011-12).
Page 20 of 41 6. Tariff Calculation: Outpatient Attendance Tariff
Section 7: Accident & emergency tariff
Tariff calculation
7.1 The starting point for the tariff calculation was the A&E data from RC1011. As with the other tariffs, data relating to services supplied by PMS+ and non-NHS providers were excluded, along with that covering NHS walk-in centres.
Removal of costs relating to Market Forces Factor (MFF)
7.2 Each provider’s costs were divided by their MFF to remove any unavoidable location-specific differences (as per paragraphs 4.7 - 4.9).
Data cleaning
7.3 Further data cleaning was then performed to remove any obviously erroneous or inappropriate outliers (as per paragraph 4.10).
7.4 At this point, the costs and activity were aggregated solely by HRG (removing provider).
Data re-coding
7.5 Attendance data recorded as “dead on arrival” (VBDOA) in RC1011, were recoded as VB09Z. Data reported by PCTs, or as non-24hr A&E services or minor injury services were recoded as VB11Z.
Removing costs of attendances leading to admissions
7.6 The A&E tariff is funded at the rate for an attendance that does not lead to an admission, with the cost of admitting the patient funded within the non-elective payment. RC1011 separately identified those attendances leading to admission from those that do not.
7.7 For patients admitted from an A&E setting, the costs of the admission were added into the non-elective tariff (see paragraph 4.14) with the costs of the attendance remaining in the A&E tariff. These costs were calculated as:
HRG unit cost of attendance * Number of attendances not leading to admission leading to admission
7.8 This was added to the total cost of attendances not leading to admission, which created the initial quantum of the A&E tariff (as per paragraph 7.6).
Page 21 of 41 7. Tariff Calculation: Accident & Emergency Tariff
Section 8: Other Mandatory Areas
Direct access and outpatient diagnostic imaging services
8.1 The RC1011 data covering unbundled diagnostic imaging HRGs for direct access and outpatient diagnostic imaging services formed the basis of the tariff calculation.
8.2 Prices were calculated by applying the following processes (consistent with the APC tariff).
Removal of non-NHS and PMS+ providers (paragraph 4.2)
Removal of costs relating to Market Forces Factor (MFF) (paragraph 4.7 -4.9)
Data cleaning (paragraph 4.10)
Chemotherapy delivery and External beam radiotherapy
8.3 The RC1011 data covering unbundled chemotherapy and radiotherapy HRGs formed the basis of the tariff calculation.
8.4 Prices were calculated by applying the following processes (consistent with the APC tariff.
Removal of non-NHS and PMS+ providers (paragraph 4.2)
Removal of costs relating to Market Forces Factor (MFF) (paragraph 4.7 -4.9)
Data cleaning (paragraph 4.10) – In addition, this included removing any organisations who had reported data against chemotherapy and radiotherapy HRGs when it is not possible for them to provide this type of care.
8.5 The chemotherapy and radiotherapy HRGs then underwent separate pricing adjustments.
Chemotherapy
No price for ‘procure chemotherapy drugs for regimens’ HRGs (SB01Z -SB10Z, SB16Z).
The costs for SB97Z were apportioned across priced HRGs. SB97Z was then assigned a mandatory zero price.
Prices were weighted as follows:
Page 22 of 41 8. Tariff Calculation: Other Mandatory Areas
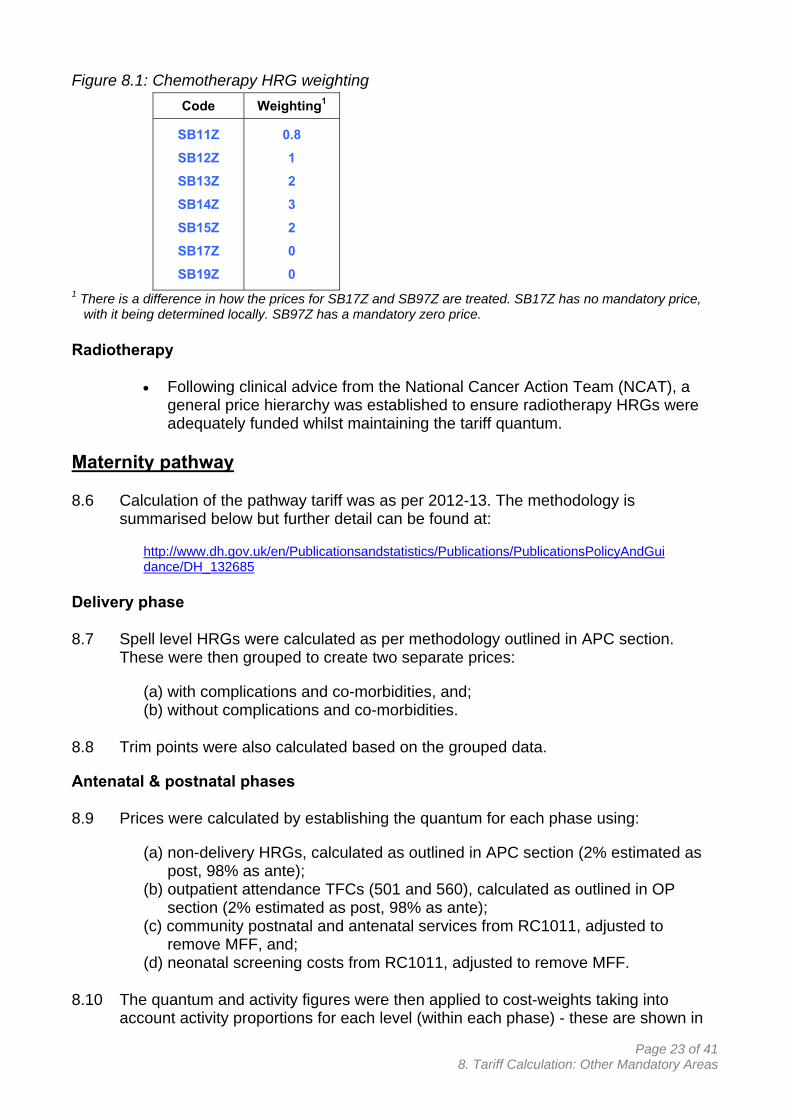
Figure 8.1: Chemotherapy HRG weighting
Code Weighting1
SB11Z
SB12Z
SB13Z
SB14Z
SB15Z
SB17Z
SB19Z
0.8
1
2
3
2
0
0 1 There is a difference in how the prices for SB17Z and SB97Z are treated. SB17Z has no mandatory price,
with it being determined locally. SB97Z has a mandatory zero price.
Radiotherapy
Following clinical advice from the National Cancer Action Team (NCAT), a general price hierarchy was established to ensure radiotherapy HRGs were adequately funded whilst maintaining the tariff quantum.
Maternity pathway
8.6 Calculation of the pathway tariff was as per 2012-13. The methodology is summarised below but further detail can be found at:
http://www.dh.gov.uk/en/Publicationsandstatistics/Publications/PublicationsPolicyAndGui dance/DH_132685
Delivery phase
8.7 Spell level HRGs were calculated as per methodology outlined in APC section. These were then grouped to create two separate prices:
(a) with complications and co-morbidities, and; (b) without complications and co-morbidities.
8.8 Trim points were also calculated based on the grouped data.
Antenatal & postnatal phases
8.9 Prices were calculated by establishing the quantum for each phase using:
(a) non-delivery HRGs, calculated as outlined in APC section (2% estimated as post, 98% as ante);
(b) outpatient attendance TFCs (501 and 560), calculated as outlined in OP section (2% estimated as post, 98% as ante);
(c) community postnatal and antenatal services from RC1011, adjusted to remove MFF, and;
(d) neonatal screening costs from RC1011, adjusted to remove MFF.
8.10 The quantum and activity figures were then applied to cost-weights taking into account activity proportions for each level (within each phase) - these are shown in
Page 23 of 41 8. Tariff Calculation: Other Mandatory Areas
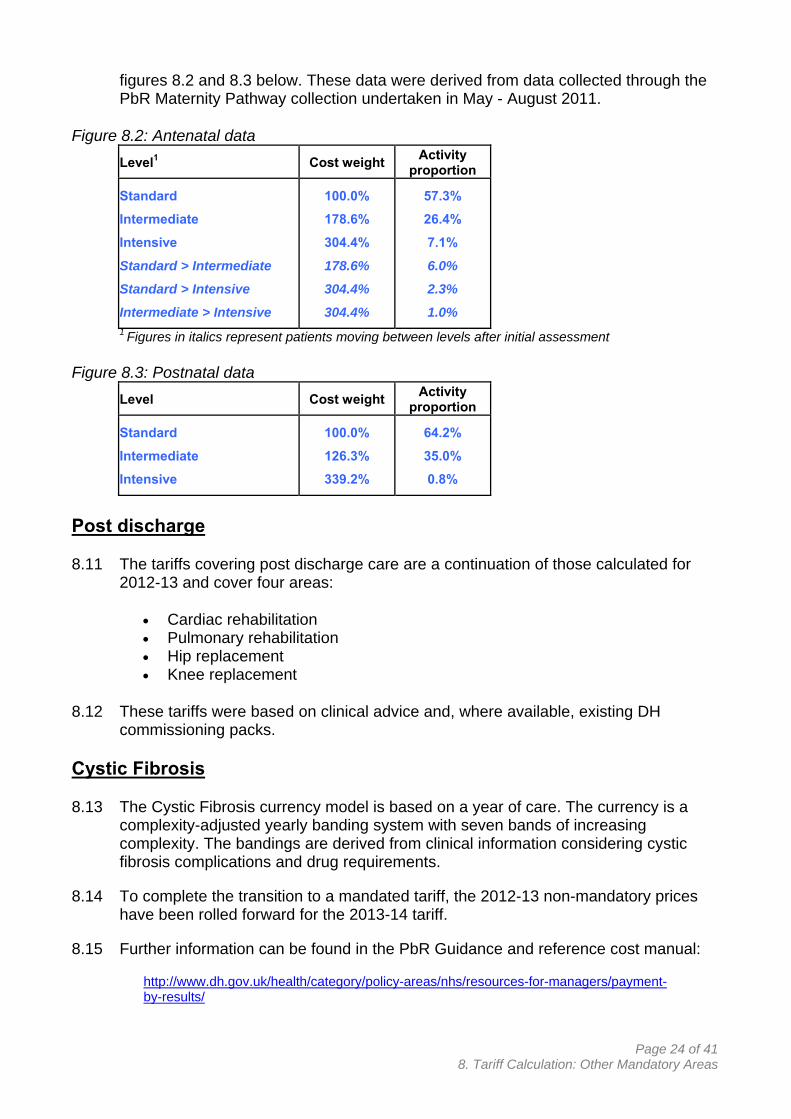
figures 8.2 and 8.3 below. These data were derived from data collected through the PbR Maternity Pathway collection undertaken in May - August 2011.
Figure 8.2: Antenatal data
Level1 Cost weight Activity
proportion
Standard 100.0% 57.3%
Intermediate 178.6% 26.4%
Intensive 304.4% 7.1%
Standard > Intermediate 178.6% 6.0%
Standard > Intensive 304.4% 2.3%
Intermediate > Intensive 304.4% 1.0% 1 Figures in italics represent patients moving between levels after initial assessment
Figure 8.3: Postnatal data
Level Cost weight Activity
proportion
Standard 100.0% 64.2%
Intermediate 126.3% 35.0%
Intensive 339.2% 0.8%
Post discharge
8.11 The tariffs covering post discharge care are a continuation of those calculated for 2012-13 and cover four areas:
Cardiac rehabilitation Pulmonary rehabilitation Hip replacement Knee replacement
8.12 These tariffs were based on clinical advice and, where available, existing DH commissioning packs.
Cystic Fibrosis
8.13 The Cystic Fibrosis currency model is based on a year of care. The currency is a complexity-adjusted yearly banding system with seven bands of increasing complexity. The bandings are derived from clinical information considering cystic fibrosis complications and drug requirements.
8.14 To complete the transition to a mandated tariff, the 2012-13 non-mandatory prices have been rolled forward for the 2013-14 tariff.
8.15 Further information can be found in the PbR Guidance and reference cost manual:
http://www.dh.gov.uk/health/category/policy-areas/nhs/resources-for-managers/payment-by-results/
Page 24 of 41 8. Tariff Calculation: Other Mandatory Areas

Section 9: Affordability, CNST and Tariff Adjustments
9.1 The net price adjustment for 2013-14 was -1.3%. In addition, tariffs were increased (on average) by an additional 0.2% in recognition of changes in underlying costs faced by providers. The change in tariff prices was therefore -1.1%.
9.2 The -1.1% change consisted of:
(a) applying the following affordability adjustments
Figure 9.1: Differential factors by point of delivery
Point of delivery
Affordability adjustment
Recognised change in underlying costs
APC
OPATT
A&E
-1.2%
-2.8%
-7.1%
-0.3%
1.3%
1.8%
Total -1.9% 0.2%
(b) bringing 2010-11 unit costs into 2013-14 prices by applying the following price adjustments
Figure 9.2: Tariff adjustment figures 2011-12 2012-13 2013-14
Pay and price inflation National efficiency requirement
2.5% -4.0%
2.2% -4.0%
2.7% -4.0%
Net price adjustment -1.5% -1.8% -1.3%
Efficiency embedded within tariff +0.4% +0.3% 0.0%
Price adjustment used for tariff calculation -1.1% -1.5% -1.3%
(c) reflecting targeted increases in CNST (Clinical Negligence Scheme for Trusts) premiums between 2010-11 and 2013-14. This was calculated at sub-chapter level (dependent on the specialty) and apportioned across all relevant HRGs as a percentage uplift1. The net national figures are shown below.
Figure 9.3: National targeted CNST figures Year £ (m) Tariff Quantum
2011-12
2012-13
2013-14
69
63
7
0.3%
0.3%
0.02%
1 For maternity services, the CNST adjustment was applied to the delivery element of the pathway. For A&E services, the adjustment was made across all HRGs excluding VB10Z and VB11Z.
Page 25 of 41 10. Tariff Calculation: Best Practice Tariffs

Section 10: Best practice tariffs
10.1 The best practice tariff (BPT) package for 2013-14 is shown in the table below. This provides a summary of the new BPTs and the revisions to those introduced since 2010-11.
Figure 10.1: Summary of best practice tariffs BPT 2010-11 2011-12 2012-13 2013-14
Acute stroke care Introduced Increased price differential
Further increase in price differential
Split of some HRGs to differentiate between patients with and without complications
Adult renal dialysis Vascular access for haemodialysis
Home therapies incentivised
Maintained
Cataracts Introduced and maintained Status changed to non-mandatory
Daycase procedures
Gall bladder removal
12 further procedures added
Two further procedures added, breast surgery procedures amended and revision to some day case rates
One further procedure added, hernia and breast surgery procedures amended
Diabetic ketoacidosis and hypoglycaemia
Introduced
Early inflammatory arthritis
Introduced
Endoscopy procedures
Introduced
Fragility hip fracture
Introduced Increased price differential
Further increase in price differential and expansion of best practice characteristics
Maintained
Interventional radiology
Two procedures introduced
Five further procedures added
Maintained
Major trauma care Introduced and maintained
Outpatient procedures
Three procedures introduced
Flexibility to encourage see and treat hysteroscopy
Paediatric diabetes
Activity based structure (non-mandatory)
Year of outpatient care structure (mandatory)
Maintained
Paediatric epilepsy Introduced
Parkinson’s disease
Introduced
Page 26 of 41 10. Tariff Calculation: Best Practice Tariffs

BPT 2010-11 2011-12 2012-13 2013-14
Pleural effusions Introduced
Primary total hip and knee replacements
Introduced and maintained Tariff at HRG level and change to calculation
Same day emergency care
12 clinical scenarios introduced
Seven new clinical scenarios introduced
Transient ischaemic attack
Introduced and maintained
10.2 The methodology behind the calculation of the 2013-14 BPTs was broadly consistent with that used in previous years. Where a BPT was based on reference costs, the price was updated to reflect the RC1011 data.
10.3 Any alterations or different methods of calculating the tariffs are explained below under the relevant BPT headings.
Existing best practice tariffs
Acute stroke care
10.4 The acute stroke care BPT continued in the same form in 2013-14 with the following revision:
HRGs AA22A & AA22B and AA23A & AA23B were split to differentiate between patients with and without complications and co-morbidities
10.5 In 2013-14, the differential between best practice and standard care remained the same as that in 2012-13 at £1,425. The differential has been achieved by lowering the base tariff by the increased additional payments. Therefore, the payment level of the BPT was not changed, but payment for spells not meeting best practice was reduced.
Figure 10.2: Acute stroke care differential between base tariff and best practice tariff Financial year Differential 2010-11 £475 2011-12 £950 2012-13 £1,425 2013-14 £1,425
Cataracts
10.6 There was no change to the calculation of the BPT for cataracts in 2013-14.
10.7 The BPT was calculated by summing the tariff prices, excluding MFF, for each of the APC and OPATT events along the recommended pathway.
Page 27 of 41 10. Tariff Calculation: Best Practice Tariffs

Fragility hip fracture
10.8 The fragility hip fracture BPT continued in the same form in 2013-14.
10.9 In 2013-14, the differential between best practice and standard care remained the same as that in 2012-13 at £1,335. The differential has been achieved by lowering the base tariff by the increased additional payments. Therefore, the payment level of the BPT was not changed, but payment for spells not meeting best practice was reduced.
Figure 8.3: Fragility hip fracture differential between base tariff and best practice tariff Financial year Differential 2010-11 £445 2011-12 £890 2012-13 £1,335 2013-14 £1,335
Daycase procedures
10.10 The daycase procedure BPTs continued in the same form in 2013-14 with the following revisions:
Tympanoplasty for all ages (CZ10U, CZ10V & CZ10Y) was added to the list of procedures;
FZ18A is no longer part of the hernia repair BPT, based on clinical concern over the suitability of patients ‘with major complications and co-morbidities’ for day surgery, and;
Breast surgery BPTs have been simplified by removing the differentiation between with and without axillary surgery for excision of breast and mastectomy.
10.11 Tariff prices for new and existing procedures were calculated using prices from APC tariff calculation. This was a two-staged process.
10.12 The first stage was to calculate the total cost quantum across daycase and elective admissions assuming a shift to the best practice level of daycase rates. The second stage was to set separate prices for daycase and elective admissions to meet the following constraints:
Total cost quantum equals that in the first stage; Daycase prices are higher than elective prices by a given differential, and; Daycase prices are less than or equal to the combined daycase/elective tariff
price based on actual daycase rates.
10.13 The best practice daycase rates used for tariff calculation were as follows:
Page 28 of 41 10. Tariff Calculation: Best Practice Tariffs

Figure 10.4: Daycase BPTs for 2013-14
Procedure BADS 2
rate (4th edition)
Tariff calculation rate
Current rates (2010-11 HES)
Comment
Breast surgery
Excision of breast
Excision/biopsy of breast tissue including wire guided
Wide local excision
95%
75%
75% (weighted average)
53% (weighted average)
Simple mastectomy 30% 15% 3% Differs from BADS rate given the very low current day case rate
Sentinel lymph node biopsy
80% 80% 39%
Axillary clearance 80% 40% 8% Differs from BADS rate given the very low current day case rate
Ear, nose and throat Tympanoplasty (including myringoplasty; mastoidectomy; ossiculoplasty; and stapedectomy)
80% 50% 30%
Tonsillectomy
Children
Adults
70% 80%
70% 80%
34% 34%
Septoplasty 60% 60% 43%
General surgery Cholecystectomy 60% 60% 34%
Repair of range of hernia (umbilical, inguinal, recurrent inguinal and femoral)
90% 90% 65% Rates are a weighted average of the individual hernia repair procedures
Gynaecology Operations to manage female incontinence
60% 45% 35% Differs from BADS rate based on clinical advice
Orthopaedic surgery
Arthroscopic subacromial decompression
80% (75%) n/a 54% The figures in parentheses in the BADS rate column are the 75th percentile day case rates from HES 2009-10
Bunion operations with or without internal fixation and soft tissue correction
85% (72%) n/a 58%
Dupuytren's fasciectomy 95% (90%) n/a 80%
Urology Endoscopic resection of prostate (TUR)
15% 15% 2%
Resection of prostate by laser
75% 60% 16% Differs from BADS rate based on clinical advice
2 British Association of Day Surgery (BADS) Page 29 of 41
10. Tariff Calculation: Best Practice Tariffs
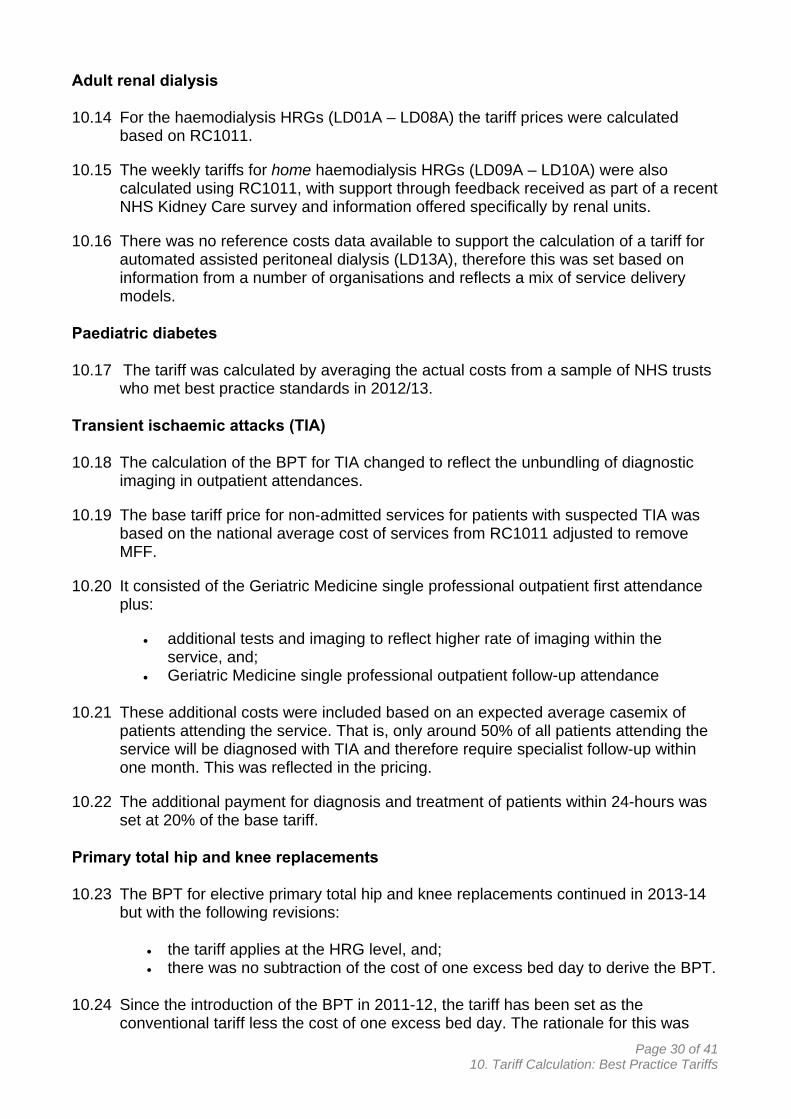
Adult renal dialysis
10.14 For the haemodialysis HRGs (LD01A – LD08A) the tariff prices were calculated based on RC1011.
10.15 The weekly tariffs for home haemodialysis HRGs (LD09A – LD10A) were also calculated using RC1011, with support through feedback received as part of a recent NHS Kidney Care survey and information offered specifically by renal units.
10.16 There was no reference costs data available to support the calculation of a tariff for automated assisted peritoneal dialysis (LD13A), therefore this was set based on information from a number of organisations and reflects a mix of service delivery models.
Paediatric diabetes
10.17 The tariff was calculated by averaging the actual costs from a sample of NHS trusts who met best practice standards in 2012/13.
Transient ischaemic attacks (TIA)
10.18 The calculation of the BPT for TIA changed to reflect the unbundling of diagnostic imaging in outpatient attendances.
10.19 The base tariff price for non-admitted services for patients with suspected TIA was based on the national average cost of services from RC1011 adjusted to remove MFF.
10.20 It consisted of the Geriatric Medicine single professional outpatient first attendance plus:
additional tests and imaging to reflect higher rate of imaging within the service, and;
Geriatric Medicine single professional outpatient follow-up attendance
10.21 These additional costs were included based on an expected average casemix of patients attending the service. That is, only around 50% of all patients attending the service will be diagnosed with TIA and therefore require specialist follow-up within one month. This was reflected in the pricing.
10.22 The additional payment for diagnosis and treatment of patients within 24-hours was set at 20% of the base tariff.
Primary total hip and knee replacements
10.23 The BPT for elective primary total hip and knee replacements continued in 2013-14 but with the following revisions:
the tariff applies at the HRG level, and; there was no subtraction of the cost of one excess bed day to derive the BPT.
10.24 Since the introduction of the BPT in 2011-12, the tariff has been set as the conventional tariff less the cost of one excess bed day. The rationale for this was
Page 30 of 41 10. Tariff Calculation: Best Practice Tariffs

that an optimal pathway costs less because of the reduction in length of stay. With the conventional tariff a function of the variation in clinical practice, its level is higher than if all providers were delivering optimal pathways.
10.25 The average length of stay in 2010-11, the year on which the 2013-14 tariff is set, was broadly in line with that expected following enhanced recovery. It was therefore no longer appropriate to adjust the conventional tariff in setting the BPT.
Interventional radiology (IR)
10.26 There was one change to the BPT for 2013-14. Angioplasty and stenting procedures also apply to the new HRG:
RC41Z - Major Vascular Interventional Radiology Procedures
10.27 The price level of the BPTs are broadly in line with that for 2012-13. These were based on a dedicated costing exercise conducted with a number of providers as well as information from other sources.
10.28 These BPTs mean that the IR procedures are reimbursed at a higher rate than they would have been otherwise; though we recognise that they may not fully reimburse the costs. It was not possible to fulfil the intention to conduct a more comprehensive costing exercise. Furthermore, data on IR procedures from PLICS was not of robust quality to inform and refine the BPTs in 2013-14 as intended.
10.29 Where the estimated costs of the IR activity justified a higher tariff than the other activity within an HRG, the conventional tariff was reduced to ensure that commissioners are not paying more overall.
10.30 The BPTs for abdominal EVAR and the UFE BPT are now based on reference costs. The specific HRGs for these BPTs were included in the 2010-11 reference cost grouper for the first time.
Procedures in outpatients
10.31 The calculation of the diagnostic procedures in outpatients was consistent with the methodology used in calculating daycases. For hysteroscopic sterilisation, the pricing approach was neutral, providing a tariff that adequately reimburses the costs.
10.32 The rate used for tariff calculation, the achievable rate and an estimate of the current rate are detailed in the table below.
Page 31 of 41 10. Tariff Calculation: Best Practice Tariffs

Figure 10.5: Achievable and estimated outpatient rates for diagnostic hysteroscopy and cystoscopy
Procedure Rate for 2013-14 tariff calculation
Achievable outpatient rate3
Estimated4
outpatient rate
Diagnostic Hysteroscopy 60%5 80% 39% Diagnostic Cystoscopy 50% 50% 11%
Same day emergency care
10.33 Calculation of the same day emergency care tariff followed similar principles to those for incentivising daycase procedures. Prices were calculated based on the following principles:
The difference between the same day and non-same day BPT prices was the level of one excess bed day, ie the long stay payment for that HRG with the same day price being higher.
Prices were based on the conventional non-elective prices. Where the short stay emergency adjustment had been applied to the HRGs, this was removed (and the impact of the adjustment reversed).
Where possible, both same day and non-same day BPT prices were less than the conventional non-elective price.
The target rate for shifting activity was set at the 75th percentile of current activity rates (based on HES1011). These are shown below:
Figure 10.6: Same day emergency target rates Clinical scenario 75th percentile
rate Current national average rate
Abdominal pain 40% 35%
Acute headache 43% 36%
Anaemia 16% 12%
Appendicular fractures not requiring immediate fixation
39% 31%
Asthma 30% 24%
Bladder outflow obstruction 30% 23%
Cellulitis 35% 26%
Chest pain 50% 45%
Community acquired pneumonia 12% 10%
Deep vein thrombosis 75% 55%
3 Based on expert clinical advice to supplement evidence for diagnostic hysteroscopy available at Gulumser C, Narvekar N, Pathak M, Palmer E, Parker S, Saridogan E. See-and-treat outpatient hysteroscopy: an analysis of 1109 examinations. Reprod Biomed Online. 2010 Mar;20(3):423-9), and 09/10 HES data highlighting a number of providers achieving high OP rates.4 Estimates based on 2010-11 Reference cost activity data and HES 2010-11 spell level data. 5 Based on clinical opinion staged move starting with 60% moving to 80% over time in order to allow providers transition time.
Page 32 of 41 10. Tariff Calculation: Best Practice Tariffs

Clinical scenario 75th percentile rate
Current national average rate
Deliberate self harm 56% 49%
Epileptic seizure 35% 29%
Falls including syncope and collapse 41% 35%
Low risk pubic rami 13% 10%
Lower respiratory tract infections without chronic obstructive pulmonary disease
49% 41%
Minor head injury 64% 56%
Pulmonary embolism 18% 13%
Renal/ureteric stones 45% 34%
Supraventricular tachycardias (SVT) including atrial fibrillation (AF)
34% 29%
New best practice tariffs for 2013-14
Diabetic ketoacidosis and hypoglycaemia
10.34 The BPT was calculated based on RC1011. The pricing approach was designed to provide a cost of not achieving best practice. Only spells that meet best practice will attract the full conventional tariff, otherwise only 85% of the tariff is payable. Best practice will not cost commissioners more and expenditure will reduce where best practice is not met.
Early inflammatory arthritis
10.35 The BPT was calculated as that described for ‘Diabetic ketoacidosis and hypoglycaemia’. For spells not meeting best practice, 95% of the conventional tariff is payable.
Endoscopy Procedures
10.36 Again, the BPT was calculated as that described for ‘Diabetic ketoacidosis and hypoglycaemia’. For spells not meeting best practice, 95% of the conventional tariff is payable.
Paediatric Epilepsy
10.37 The BPT price per attendance was calculated based on information provided by NHS provider organisations reflecting the proposed criteria.
Parkinson’s Disease
10.38 The BPT pathway price was calculated based on information provided by NHS provider organisations, Parkinson’s UK and Neurological Commissioning Support. The pathway tariff was designed to adequately reimburse the costs of best practice.
Page 33 of 41 10. Tariff Calculation: Best Practice Tariffs

Pleural Effusions
10.39 The calculation of the BPT was based on that used for other BPTs, where the aim is to shift activity between settings: ordinary admissions to day case; inpatient procedures to outpatients; and same day management of emergency conditions.
10.40 The methodology created two prices: one which over-reimburses the day case and the other which under-reimburses the non-elective admission. The average provider breaks even against cost if it shifts activity in line with expectations otherwise it incurs a deficit.
10.41 The methodology is set out below:
(a) Calculate the total cost of the average provider achieving best practice; (b) Divide (a) by the total number of patients to obtain an average cost of
achieving best practice; (c) Create two prices such that the price for DZ06 is above that for DZ16 and
overall, this equates to the average cost of achieving best practice.
Page 34 of 41 10. Tariff Calculation: Best Practice Tariffs

Section 11: Annexes
Annex A: Converting FCE-level costs to spell-level
11.1 An inpatient spell consists of one or more FCEs. As with FCEs, a spell is defined by a single HRG.
Data preparation
11.2 A subset of FCEs covered by the tariff was obtained from the HES1011 dataset. This tariff subset was obtained by taking the entire dataset and excluding the following:
Treatment function codes: - 264 (Paediatric Cystic Fibrosis) - 318 (Intermediate Care) - 319 (Respite Care) - 343 (Adult Cystic Fibrosis) - 424 (Well Babies) - 700 (Learning Difficulties) - 710 (Adult Mental Illness) - 711 (Child and Adolescent Psychiatry) - 712 (Forensic Psychiatry) - 713 (Psychotherapy) - 715 (Old Age Psychiatry) - 720 (Eating Disorders) - 721 (Addiction Services) - 722 (Liaison Psychiatry) - 723 (Psychiatric Intensive Care) - 724 (Perinatal Psychiatry)
Balloon Assisted Enteroscopy Pelvic Reconstructions Soft tissue sarcoma activity Intracranial telemetry activity Private Patients (Administrative Category 02) Episodes funded by National Specialist Commissioning Group (NSCG) Regular Day / Night Attenders Spells that started in 2011-11, but were not completed in 2010-11 (even if
one or more of the contributing FCEs were concluded prior to 2011-12) Episodes flagged for exclusion by data providers (via "=" in the
commissioning serial number)
11.3 The data were then grouped at an FCE and spell-level using the appropriate reference cost grouper. FCE HRGs were from the RC1011 grouper. Spell HRGs were generally from the RC1011 grouper, but in some instances other grouper outputs were required to reflect changes between RC1011 and LP1314 (Local Payment grouper 2013-14) HRG design.
Page 35 of 41 11. Annexes

Conversion to spell level costs
11.4 The aim of “spell conversion” is to calculate total spell level costs (including EBD) by HRG and admission. The costs of spell-based EBD are then removed to create inlier spell unit costs (see paragraph 4.24).
11.5 Using HES1011, a matrix was produced which mapped FCE-based HRGs (by admission method) to the spell-based HRGs, ie mapping each FCE to the spell in which it occurred. A spell can be comprised of a single FCE of the same HRG or from multiple FCEs across different HRGs. In most cases, the spell HRG will be the same as one of the constituent FCE HRGs. In some instances, however, a FCE level HRG combination could map to a completely different spell HRG.
Figure 11.1: Summary of spell conversion
FCE Movement of SPELL SPELL UNIT Costs COST
FCE 1: AA01A [£500]
SPELL 1: AA01A £500
FCE 2: AA01A [£500]
FCE 3: AA01A [£500]
FCE 4: BB02B [£750]
FCE 5: CC03C [£400]
FCE 6: DD04D [£275]
FCE 7: EE05E [£250]
SPELL 2: AA01A £1,000
SPELL 3: BB02B £1,150
SPELL 4: CC03C £525
AA01A:
(£500 + £1000) = £750 2
CC03C:
£525 = £525 1
BB02B:
£1,150 = £1,150 1
11.6 Total spell costs were produced by mapping (“spell converting”) FCE inlier and EBD costs separately.
11.7 For the conversion of inlier costs, adjusted RC1011 national averages were applied to the FCE to spell mapping and aggregated by spell HRG.
11.8 Conversion of FCE-based EBD costs was done by applying adjusted RC1011 national average EBD costs to the number of FCE EBDs for each FCE/spell combination within the mapping. FCE EBDs were derived from applying RC1011 trim points to HES1011. This ensures that consistent LoS activity is used when bundling FCE EBD costs and unbundling spell EBD costs, and takes into account any differences in activity and LoS between RC and HES.
11.9 The removal (or “unbundling”) of spell-based EBD was done by calculating the number of spell EBDs derived from applying tariff (spell) trim points to HES1011 (calculation of spell trim points in described in Annex B). The number of spell-based
Page 36 of 41 11. Annexes
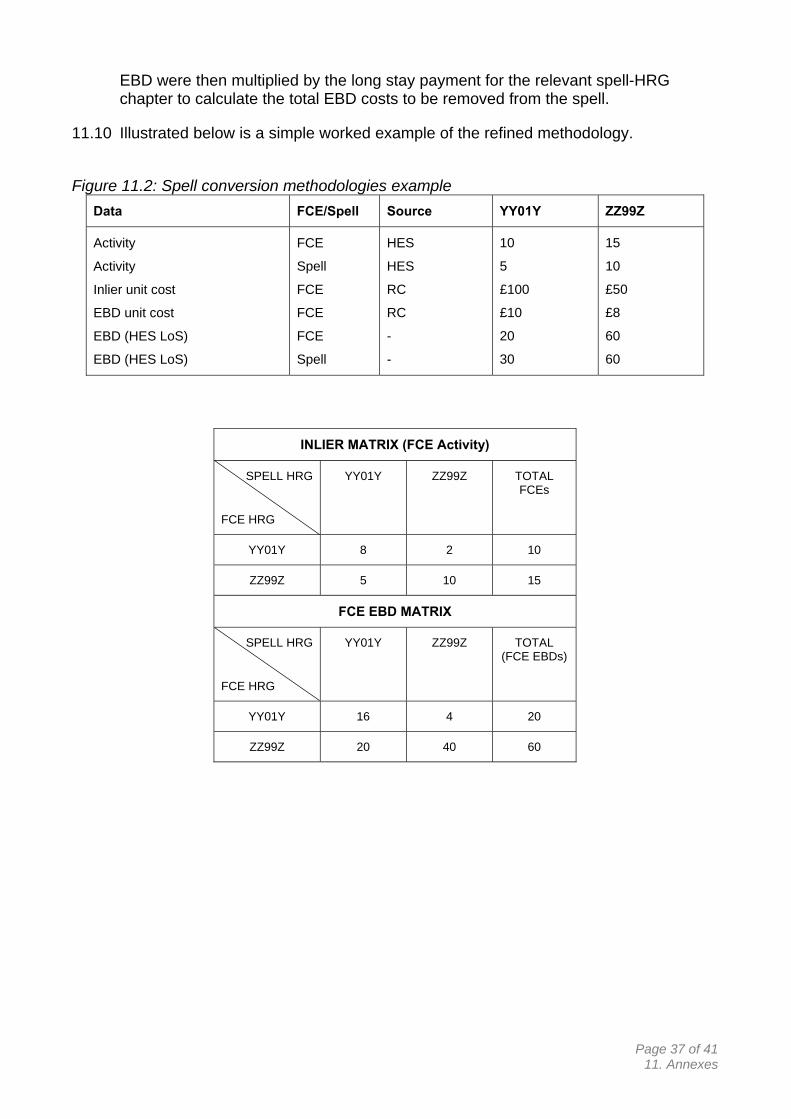
EBD were then multiplied by the long stay payment for the relevant spell-HRG chapter to calculate the total EBD costs to be removed from the spell.
11.10 Illustrated below is a simple worked example of the refined methodology.
Figure 11.2: Spell conversion methodologies example
Data FCE/Spell Source YY01Y ZZ99Z
Activity
Activity
Inlier unit cost
EBD unit cost
EBD (HES LoS)
EBD (HES LoS)
FCE
Spell
FCE
FCE
FCE
Spell
HES
HES
RC
RC
-
-
10
5
£100
£10
20
30
15
10
£50
£8
60
60
INLIER MATRIX (FCE Activity)
SPELL HRG
FCE HRG
YY01Y ZZ99Z TOTAL FCEs
YY01Y 8 2 10
ZZ99Z 5 10 15
FCE EBD MATRIX
SPELL HRG
FCE HRG
YY01Y ZZ99Z TOTAL (FCE EBDs)
YY01Y 16 4 20
ZZ99Z 20 40 60
Page 37 of 41 11. Annexes

METHODOLOGY USED
RC FCE-level unit costs:
YY01Y Inlier = £100
YY01Y EBD = £10
ZZ99Z Inlier = £50
ZZ99Z EBD = £8
Calculate total cost of inlier FCEs (using inlier matrix):
Inlier mapping x Inlier unit cost
YY01Y to YY01Y = 8 x £100 = £800
YY01Y to ZZ99Z = 5 x £50 = £250
TOTAL YY01Y = £1,050
YY01Y to ZZ99Z = 2 x £100 = £200
ZZ99Z to ZZ99Z = 10 x £50 = £500
TOTAL ZZ99Z = £700
Calculate total cost of FCE EBDs (using EBD matrix):
EBD mapping x EBD unit cost
YY01Y to YY01Y = 16 x £10 = £160
YY01Y to ZZ99Z = 20 x £8 = £160
TOTAL YY01Y = £320
YY01Y to ZZ99Z = 4 x £10 = £40
ZZ99Z to ZZ99Z = 40 x £8 = £320
TOTAL ZZ99Z = £360
Calculate spell total cost:
(Total cost of Inlier) + (Total cost of EBD)
YY01Y = £1,050 + £320 = £1,370
ZZ99Z = £700 + £360 = £1,060
Calculate spell inlier total cost:
Total cost – (Spell EBDs x EBD unit cost)
YY01Y = £1,370 – (30 x £10) = £1,070
ZZ99Z = £1,060 – (60 x £8) = £580
Calculate spell inlier unit cost:
Inlier total cost / Spell activity
YY01Y = £1,070 / 5 = £214
ZZ99Z = £580 / 10 = £58
Page 38 of 41 11. Annexes

Annex B: Calculation of trim points and excess bed days
11.11 The first stage was to calculate the long stay trim points, beyond which EBDs are counted. Lengths of stay (LoS) for all spells summed from the episode-based tariff subset were obtained from the HES1011.
11.12 Spell LoS were limited to a start date of 1st April 2009, ie a maximum of two years, so that spells with extreme LoS did not distort the calculation.
11.13 For each spell HRG / admission method combination, the distribution of spell durations was obtained. To be consistent with the tariff structure, separate upper trim points were calculated for EL and NE activity. DC were included in the calculation of the EL trim points.
11.14 The trim point for each combination is defined as:
Upper Quartile + (1.5 * Inter Quartile Range)
11.15 The methodology used in calculating the location of quartiles for each spell HRG / admission method combination in tariff calculation was:
(x / 4) * (n+1)
where x was the quartile (ie 1 for the lower quartile, 3 for the upper), and n was the number of elements in the dataset.
11.16 Having generated the trim points, the number of EBDs for each HRG and admission method was calculated. This was derived in the same way as for the trim point calculation, however LoS were limited to 1st April 2010. This was done to ensure that the calculation of EBDs is consistent with the collection of RC1011 data.
11.17 Where the trim point was lower than the adjusted LoS, EBDs were calculated by subtracting the trim point from the adjusted LoS. The EBDs were then aggregated to obtain a total number of spell-based EBDs for each admission method / HRG combination.
Figure 11.3: Example of excess bed days calculation
(A)
(B)
Trim point for YY01Y
Adjusted spell lengths of stay:
Spell 1
Spell 2
Spell 3
15 Days
20 Days
13 Days
18 Days
(C) Number of EBDs:
Spell 1
Spell 2
Spell 3
(B - A)
5 Days
-2 Days (thus 0)
3 Days
(D) Total EBDs Σ(C) 8 Days
Page 39 of 41 11. Annexes

Annex C: Glossary of Terms
A&E Accident & Emergency APC Admitted Patient Care BADS British Association of Day Surgery BPT Best Practice Tariff CC Complications & Co-morbidities CCU Coronary Care Unit CL Consultant-led (Outpatient Attendance) CNST Clinical Negligence Scheme for Trusts CT Computerised Tomography D&D Drugs & Devices DC Daycase DI Diagnostic Imaging EBD Excess Bed Days EL Elective FCE Finished Consultant Episode HES1011 Hospital Episode Statistics (2010-11) HRG Healthcare Resource Group ICR Injury Cost Recovery (Scheme) IP Inpatient IR Interventional Radiology LoS Length of Stay LP1314 Local Payment grouper (2013-14) MFF Market Forces Factor MRI Magnetic Resonance Imaging NCL Non-consultant-led (Outpatient Attendance) NE Non-Elective NICE National Institute for Health and Clinical Excellence NSCG National Specialist Commissioning Group OPATT Outpatient Attendance OPROC Outpatient Procedure PbR Payment by Results PCT Primary Care Trust PLICS Patient Level Information and Costing Systems PMS+ Personal Medical Services Providers RC1011 Reference Costs (2010-11 Return) RC1112 Reference Costs (2011-12 Return) SSEM Short Stay Emergency Tariff TFC Treatment Function Code TIA Transient Ischaemic Attacks UC Unit Cost
Page 40 of 41 11. Annexes

‐
‐
Annex D: Tariff Calculation Flow Chart
APC UNIT COSTS
OPROC UNIT COSTS
OPATT UNIT COSTS
A&E UNIT COSTS
Outpatient Procedures
Outpatient Attendances
Accident & Emergency
2010‐11 REFERENCE COSTS 2010‐11
REFERENCE COSTS (for tariff) Filtered, Cleaned, MFF‐Adjusted
Additional Costs Included
Spell Conversion
Combine DC & EL
Remove EBDs D&D, Top‐slices
Adjustments to reflect tariff structure
Additional Costs Included
Remove D&D, Top‐slices
Rebundle Non‐Mandatory OPROC
Front‐Load First Attendances
Removal of Costs Leading to Admission
Best Practice Tariffs
Other Tariffs
Various inputs – see section 10 for full
details
17 Best Practice Tariffs
Chemotherapy delivery and External beam radiotherapy
Direct access and Outpatient diagnostic
imaging services
Maternity pathway
Rehabilitation post discharge
Cystic fibrosis
Admitted Patient Care
2010‐11 HES
Affordability, CNST and
INITIAL 2013 14 TARIFF PRICES
Tariff Adjustment NOTE: this chart summarises the tariff calculation process and does not reflect each individual model, nor the order in which adjustments take place Pricing Adjustments:
Pro‐active, Sense‐Check, 11. Annexes
Page 41 of 41 FINAL 2013 14 TARIFF PRICES and Road Test