08 visualisation seminar ver0.2
TRANSCRIPT

21/04/16
1
9GoldenRulesofDataVisualisa2on
Dr.BrianMacNamee
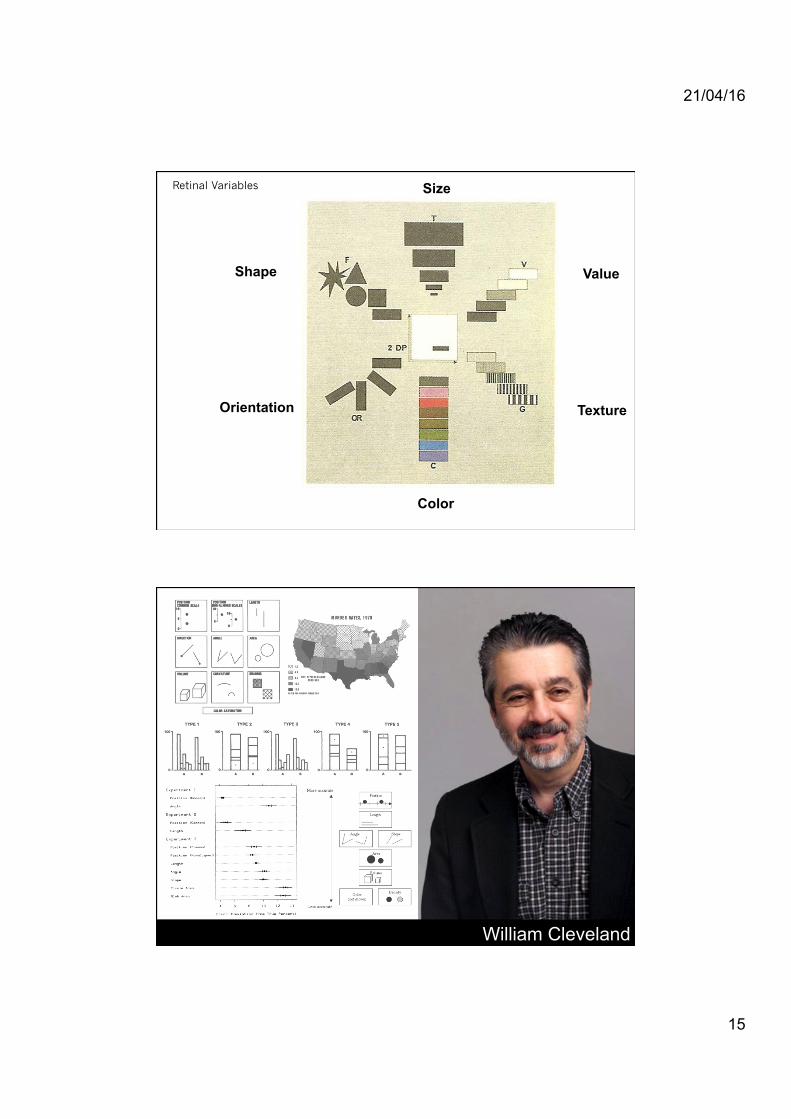
Retinal Variables
The Semiology of Graphics: Diagrams, Networks, Maps Jacques Bertin (1967)
Orientation
Color
Shape
Texture
Value
Size
Matplotlib Visualisation Gallery http://matplotlib.org/gallery.html

21/04/16
2
NASA/Goddard Space Flight Center and the Advanced Visualization Laboratory at the National Center for Supercomputing Applications, B. Robertson, L. Hernquist
Peopleareverygoodatpa9erndetec2on1
Focusonthetaskathand2
Understandvisualpercep2on3
Priori2zefunc2onoverform4
Showallthedataandonlythedata5
Thinkcarefullyaboutcolour6
Thinkaboutthestoryyourdataistelling7
Knowyouraudience8
Trytocombinechartsandnumbers9

21/04/16
3
PeopleAreVeryGoodatPa9ern
Detec2on
1

21/04/16
4
WhichTreeIsBiggestOnThisSlide?

21/04/16
5
A
B
C
D
WhichTreeIsBiggestOnThisSlide?
WhichTreeIsBiggestOnThisSlide?

21/04/16
6
WhichTreeIsBiggestOnThisSlide?
21/04/1612Show Me The Numbers, Stephen Few

21/04/16
7
21/04/1614Show Me The Numbers, Stephen Few

21/04/16
8
FocusOnTheTaskAtHand
2

21/04/16
9
http://www.youtube.com/watch?v=vJG698U2Mvo

21/04/16
10
“If you're going underground, why
do you need bother about geography? … Connections are
the thing”
Harry Beck

21/04/16
11
LondonUndergroundMap
Data Exploration
versus
Data Presentation

21/04/16
12
UnderstandVisualPercep2on
3
http://www.statista.com/chart/3199/the-most-successful-teams-in-the-six-nations/
1,098

21/04/16
13
France' England' Wales' Ireland' Italy' Scotland'
1,098
Points Scored
2,061&1,899& 1,833&
1,688&
1,183& 1,098&
England& France& Ireland& Wales& Italy& Scotland&

21/04/16
14
Datavisualisa9onisaboutmappingdatadimensionstovisualencodings
Team Points
England 2,061
France 1,899
Ireland 1,833
Wales 1,688
Italy 1,183
Scotland 1,098
England'
France'
Ireland'
Wales'
Italy'
Scotland'
France'
Wales'
Scotland'
England'
Ireland'
Italy'
2,061&1,899& 1,833&
1,688&
1,183& 1,098&
England& France& Ireland& Wales& Italy& Scotland&
Jacques Bertin (1918 - 2010)
21/04/16
15
Retinal Variables
The Semiology of Graphics: Diagrams, Networks, Maps Jacques Bertin (1967)
Orientation
Color
Shape
Texture
Value
Size
William Cleveland

21/04/16
16
Position
Length
Angle
Area
Colour Density
Interpretation Accuracy
Pattern
WhichSegmentIsBiggest?

21/04/16
17
WhichSegmentIsBiggest?

21/04/16
18
21.6%
28.8%
3.6%
29.7%
15.3%
1.0%
WhichSegmentIsBiggest?
Priori2zeFunc2onOverForm
4

21/04/16
19
David McCandless

21/04/16
20
WhatcolourisassociatedwithfamilyinAsianculture?
Stephen Few

21/04/16
21
WhatcolourisassociatedwithfamilyinAsianculture?

21/04/16
22

21/04/16
23
“Be clear first and clever second. If you have to throw one of those out,
throw out clever.”
Jason Fried
“Be clear first and clever second. If you have to throw one of those out,
throw out clever.”
Jason Fried
Or: If your solution is not based on
bar charts and line charts, think carefully!

21/04/16
24
ShowAllTheDataAndOnlyTheData
5

21/04/16
25

21/04/16
26
Edward Tufte
data-ink ratio = data-ink
total ink used to print chart

21/04/16
27
-
100,000
200,000
300,000
400,000
500,000
600,000
Independents FineGael FineFail SinnFein Labour
VotesbyPoli2calParty2014LocalElec2on
Independents
FineGael
FineFail
SinnFein
Labour
Removethecolourfromthebackground
-
100,000
200,000
300,000
400,000
500,000
600,000
Independents FineGael FineFail SinnFein Labour
VotesbyPoli2calParty2014LocalElec2on
Independents
FineGael
FineFail
SinnFein
Labour

21/04/16
28
Removethecolourfromthechartbackground
-
100,000
200,000
300,000
400,000
500,000
600,000
Independents FineGael FineFail SinnFein Labour
VotesbyPoli2calParty2014LocalElec2on
Independents
FineGael
FineFail
SinnFein
Labour
Removethelegend
-
100,000
200,000
300,000
400,000
500,000
600,000
Independents FineGael FineFail SinnFein Labour
VotesbyPoli2calParty2014LocalElec2on

21/04/16
29
Changetoabetter monochrome colour palette
-
100,000
200,000
300,000
400,000
500,000
600,000
Independents FineGael FineFail SinnFein Labour
VotesbyPoli2calParty2014LocalElec2on
Removethegridlines
-
100,000
200,000
300,000
400,000
500,000
600,000
Independents FineGael FineFail SinnFein Labour
VotesbyPoli2calParty2014LocalElec2on

21/04/16
30
Removethever2calaxisbutaddindatalabels
479,267
404,173427,644
256,314
121,898
Independents FineGael FineFail SinnFein Labour
VotesbyPoli2calParty2014LocalElec2on
Removethechartborder
479,267
404,173427,644
256,314
121,898
Independents FineGael FineFail SinnFein Labour
VotesbyPoli2calParty2014LocalElec2on

21/04/16
31
479,267
404,173427,644
256,314
121,898
Independents FineGael FineFail SinnFein Labour
VotesbyPoli2calParty2014LocalElec2on
Wehaveimprovedthedata-ink ratio and in doing so have vastly improved our visualisation
479,267
404,173 427,644
256,314
121,898
Independents FineGael FineFail SinnFein Labour
VotesbyPoli2calParty2014LocalElec2on
-100,000200,000300,000400,000500,000600,000
VotesbyPoli2calParty2014LocalElec2on
Independents
FineGael
FineFail
SinnFein
Labour

21/04/16
32
* Andrew Freedman, NOAA: 2012 Hottest & 2nd-Most Extreme Year On Record, Climate Centralhttp://www.climatecentral.org/news/noaa-2012-was-warmest-and-second-most-extreme-year-on-record-15436
* Sophie J. Engle, How to Lie with Data Visualization (in R) http://sjengle.cs.usfca.edu/talks/how-to-lie-with-data-visualization-in-r
* Sophie J. Engle, How to Lie with Data Visualization (in R) http://sjengle.cs.usfca.edu/talks/how-to-lie-with-data-visualization-in-r
http://www.climatecentral.org/news/noaa-2012-was-warmest-and-second-most-extreme-year-on-record-15436

21/04/16
33
ThinkCarefullyAboutColour
6
For more great illusion examples take a look at: http://web.mit.edu/persci/gaz/

21/04/16
34
Available here: http://www.lottolab.org/Visual%20Demos/Demo%2015.html

21/04/16
35
Available here: http://www.lottolab.org/Visual%20Demos/Demo%2015.html
Available here: http://www.lottolab.org/Visual%20Demos/Demo%2015.html

21/04/16
36
21/04/16 71

21/04/16
37

21/04/16
38
Cynthia Brewer
“[The RGB cube] is not the least bit perceptually scaled. In some parts of the cube a tiny step gives you a huge perceptual difference. In other parts it all looks the same.”

21/04/16
39
Edward Tufte
“... avoiding catastrophe becomes the first principle in bringing color to information: above all, do no harm.”

21/04/16
40

21/04/16
41

21/04/16
42
When using colour with numeric data use
monochromatic palettes
When using colour with categorical data use colour blindness safe palletes
Use colour palettes from ColorBrewer (www.colorbrewer2.org)
ThinkAboutTheStoryYourData
IsTelling
7

21/04/16
43
Florence Nightingale

21/04/16
44
Charles Joseph Minard

21/04/16
45
Jonathan Corum

21/04/16
46
KnowYourAudience
8W
eb T
raffi
c
Day

21/04/16
47
26# 27# 28#
23#20#
15# 16#
Monday# Tuesday# Wednesday# Thursday# Friday# Saturday# Sunday#
Web
$Traffic$
Day$
Julie Steele
"How do the people I'm presenting the data to absorb information the best?"

21/04/16
48
TrytoCombineChartsandNumbers
9
x1 y1 10 8.04 8 6.95
13 7.58 9 8.81
11 8.33 14 9.96 6 7.24 4 4.26
12 10.84 7 4.82 5 5.68
x2 y2 10 9.14 8 8.14
13 8.74 9 8.77
11 9.26 14 8.10 6 6.13 4 3.1
12 9.13 7 7.26 5 4.74
x3 y3 10 7.46 8 6.77
13 12.74 9 7.11
11 7.81 14 8.84 6 6.08 4 5.39
12 8.15 7 6.42 5 5.73
x4 y4 8 6.58 8 5.76 8 7.71 8 8.84 8 8.47 8 7.04 8 5.25
19 12.5 8 5.56 8 7.91 8 6.89

21/04/16
49
x1 y1 10 8.04 8 6.95
13 7.58 9 8.81
11 8.33 14 9.96 6 7.24 4 4.26
12 10.84 7 4.82 5 5.68
x2 y2 10 9.14 8 8.14
13 8.74 9 8.77
11 9.26 14 8.10 6 6.13 4 3.1
12 9.13 7 7.26 5 4.74
x3 y3 10 7.46 8 6.77
13 12.74 9 7.11
11 7.81 14 8.84 6 6.08 4 5.39
12 8.15 7 6.42 5 5.73
x4 y4 8 6.58 8 5.76 8 7.71 8 8.84 8 8.47 8 7.04 8 5.25
19 12.5 8 5.56 8 7.91 8 6.89
Foursetsofdatawiththesamecorrela9oncoefficientof0.816

21/04/16
50
"a computer should make both
calculations and graphs"
Frank Anscombe (1918 - 2001)
Peopleareverygoodatpa9erndetec2on1
Focusonthetaskathand2
Understandvisualpercep2on3
Priori2zefunc2onoverform4
Showallthedataandonlythedata5
Thinkcarefullyaboutcolour6
Thinkaboutthestoryyourdataistelling7
Knowyouraudience8
Trytocombinechartsandnumbers9

21/04/16
51
Data Visualization Using Immersive Virtual Reality Tools Cioc, Alexandru; Djorgovski, S. G.; Donalek, C.; Lawler, E.; Sauer, F.; Longo, G.

21/04/16
52
Jacques Bertin
Edward Tufte
Cynthia Brewer
Stephen Few

21/04/16
53
Cleveland
Mackinley
David McCandless
Steele/Illinsky

21/04/16
54
References
§ LondonUndergroundMap,HarryBeckwww.vam.ac.uk/vasta9c/microsites/1331_modernism/highlights_19.html
§ ColoursinCultures,DavidMcCandlesswww.informa9onisbeau9ful.net/visualiza9ons/colours-in-cultures/
§ OurIrresis9bleFascina9onwithAllThingsCircular,StephenFewwww.perceptualedge.com/ar9cles/visual_business_intelligence/our_fascina9on_with_all_things_circular.pdf
§ WhatAboutColorBlindness?,MaureenStonewww.stonesc.com/wordpress/2010/05/what-about-color-blindness/
§ Graphicalpercep9on:Theory,experimenta9on,andapplica9ontothedevelopmentofgraphicalmethods,WSCleveland,RMcGill,JournaloftheAmericanSta9s9calAssocia9onwww.researchgate.net/publica9on/229099907_Graphical_percep9on_Theory_experimenta9on_and_applica9on_to_the_development_of_graphical_methods
UseToolsThatMakeItEasyToDoThingsRight
9

21/04/16
55
Jock MacKinlay
USINGVISUALENCODINGSEFFECTIVELY

21/04/16
56
UsingVisualEncodingsEffec2vely§ Thesearesomethingsyoushouldthinkabouttohelpchoosingappropriatevisualencodings
– Usethemosteasilyinterpretedencodingforthemostimportantvariable
– Respectnaturalordering– Ensuresufficientdis9nctvalues– Choosedefaultsoverinnova9veformats– Takeaccountofreaders’context
HansRosling(Legend!)§ NowthatwehavetalkedaboutencodingstakealookatthisscreenshotfromHansRoslinganddiscusstheencodingsused
– Howmanydatadimensionsarevisuallyencoded?– Howisimportanceorderingused?
The tool and data that Rosling uses is available at: www.gapminder.org

21/04/16
57
MakingDataCompelling
Year Temp 1895 50.54 1896 52.12 1897 51.58 1898 51.46 1899 51.10 1900 52.86 1901 51.94 1902 51.70

21/04/16
58
Jacques Bertin
http://www.statista.com/chart/3199/the-most-successful-teams-in-the-six-nations/