}0)qv(io^ - research repository | victoria university...
TRANSCRIPT
V V J S / / |
\J\}0)Qv(iO^
CLOSED RE-E-VE NOT FOR LO vN
F00T8CRAY INSTITUTE OF TECHN0LC4Y L ! B : I . R Y
GALL m. RESERVE THESIS 547.30871 ILE
ACC'N m . 6/1128302d •>^/v

THE APPLICATION OF DIRECT ELECTROANALYTICAL TECHNIQUES
TO THE ANALYSIS OF
ORGANIC SPECIES IN INDUSTRIAL AND BIOLOGICAL SAMPLES
A thesis submitted as partial fulfilment of the
requirements for the degree of Master of Applied Science
Footscray Institute of Technology
By
PETER JOSEPH ILES
B.App.Sc. A.R.A.C.I.
Department of Chemistry and Biology Footscray Institute of Technology
August^ 1985
- I -
This thesis contains no material which has been
accepted for the award of any degree or diploma in any
tertiary educational institution, and to the best of my
knowledge, no work published or written by another person
or persons Is included except where due reference is made
in the text.
p. J. lies
- 1 1 -
ACKNOWLEPGEMENTS
To my supervisors sincere thanks. Dr. Ian Hamilton for his
skilful advice and criticism in the presentation of this manuscript. For
enlightening discussions of electrochemical theory, exemplary enthusiasm
for problem solving, friendship and encouragement. Dr. Nat Ho for helpful
discussions of organic and clinical chemistry and continual friendship
and encouragement throughout the work.
To the staff of the Chemistry Department, Footscray Institute of
Technology, thanks for their support and friendship over the many years of
part-time work.
To Jean McConachy a special thank you for the patient and
careful typing of this manuscript and assistance in the production of
conference poster papers on the results of this work.
Many thanks to Dr. R.W. Cattrall, La Trobe University, for the
provision of ion-selective electrode membrane samples and his encouragement
throughout the work.
To the members of the Analytical Research Group at La Trobe
University, thanks for the many critical discussions and suggestions. In
particular to Dr. Terry Cardwell for his continual encouragement.
To Sigma Pharmaceuticals, thanks for the samples of cough
mixtures and the assayed sample of aminophyl1ine injection solution.

- I N
TO the Royal Childrens' Hospital, Melbourne, thanks for the
provision of clinical samples.
And most importantly, my deepest thanks to my wife Margaret,
who, through her constant support, encouragement and sacrifice, made it
possible for me to complete the task.
- I V -
ABSTRACT
This thesis has reviewed the electroanalytical chemistry of
organic compounds. The theory and practical limitations of direct
electrochemical techniques, used for the analysis of research, Industrial
and biological samples, have been introduced.
The hydrodynamic techniques of Pulsed Rotation Amperometry
(PRA) and Flow Injection Analysis (FIA) with amperometric detection have
been applied to the analysis of quinol and quinone in aqueous solution
and tetrahydrofuran. PRA has been used to determine quinol residues in
ion-selective electrode membranes manufactured by evaporation of
tetrahydrofuran. A photochemical reaction product of quinone has been
detected as an interferent in quinone analysis and has been detected in
the electrode membranes.
PRA, at carbon paste electrodes, has been applied to the
analysis of theophylline in cough mixtures and intravenous Injections.
The precision of these analyses has been found to be dependent on the
geometry of the rotating electrode tip.
A statistical analysis of theophylline therapy has determined
the required precision for safe and effective prescription of the drug
based on the analytical results. An investigation of the applicability
of FIA with amperometric detection to the direct determination of
theophylline in saliva and blood samples has been carried out. The
results of this Investigation have been compared to alternative techniques
with respect to sensitivity, selectivity, precision, speed and the cost
of analysis.
- V -
CONTENTS
Page
DECLARATION I
ACKNOWLEDGEMENTS il
ABSTRACT iv
CONTENTS V
1. Introduction
1.1 Organic Electrochemistry 2
1.2 The Scope of Organic Electroanalytical Chemistry 3
1.3 Electroanalytical Methods 4
1.3.1 Potentlometry 7
1.3.2 Voltammetry 8
1.3.3 DC Voltammetry 8
1.3.4 Limitations of DC Voltammetry 12
1.4 Electronic Discrimination of Charging Current 13
1.4.1 Tast Voltammetry 13
1.4.2 Differential Pulse Voltammetry 14
1.4.3 AC Voltammetry 16
1.5 Hydrodynamic Methods 17
1.5.1 Rotating Electrode Systems 18
1.5.2 Pulsed Rotation Amperometry 20
1.5.3 Flow Injection Analysis 22
1.5.4 Amperometry in Flowing Streams 25
1.6 Electrode Materials 26
-v i -
2. Experimental 30
2.1 Materials 31
2.1.1 Water 31
2.1.2 Inorganic Reagents 31
2.1.3 Organic Reagents 32
2.1 .4 Alumina 33
2.1.5 Nitrogen 33
2.1.6 Glassware 33
2.2 Instrumentation 33
2.2.1 Voltammetry 33
2.2.2 Pulsed Rotation Amperometry 34
2.2.3 U.V. Spectrophotometry 34
2.2.4 Infrared Spectroscopy 34
2.2.5 Flow Injection Analysis 35
2.2.6 Potentlometry 39
2.2.7 Computing 39
2.3 Electrodes 42
2.3.1 Reference Electrodes 42
2.3.2 Counter Electrodes 42
2.3.3 Working Electrodes 42
2.4 Preparation of Electrodes 43
2.4.1 Reference Electrodes 43
2.4.2 Counter Electrodes 43
2.4.3 Working Electrodes 43
2.4.3.1 Glassy Carbon 43
2.4.3.2 Carbon Paste 43
2.4.4 Survey of Electrode Smoothing Materials 44
2.4.5 Survey Conclusions 48
2.4.6 Beckman Rotating Carbon Paste Electrode 49
V I I -
2.5 Synthesis of Quinone Photodimer 49
2.6 Purification of Tetrahydrofuran 50
2.7 Analytical Procedures for Quinol in THF 51
2.7.1 Pulsed Rotation Amperometry 51
2.7.2 Flow Injection Analysis 51
2.7.3 U.V, Spectrophotometry 52
2.8 Analytical Procedures for Quinone in THF 52
2.8.1 Pulsed Rotation Amperometry 52
2.8.2 Flow Injection Analysis 53
2.8.3 U.V. Spectrophotometry 53
2.9 Analytical Procedures for Quinol and Quinone in
Ion Selective Electrode Polymer Membranes 53
2.9.1 Preparation of Fresh Membranes 53
2.9.2 Sample Treatment 54
2.9.3 Pulsed Rotation Amperometry 54
2.9.4 U.V. Spectrophotometry 56
2.10 Analytical Procedures for Theophylline by P.R.A. 56
2.10.1 Nuellin Cough Syrup 57
2.10.2 Elixophyllin Cough Syrup 57
2.10.3 Aminophyl1ine Injection 57
3. The Electroanalytical Determination of Quinol and Quinone In Tetrahydrofuran and Ion Selective Electrode Polymer Membranes 59
3.1 Introduction 60
3.2 Quinol and Quinone in THF 61
3.2.1 Voltammetric Behaviour in the Presence of THF 61
3.2.2 Survey of Voltammetric Analysis Techniques 63
3.2.2.1 Rotating Glassy Carbon Electrode 63
3.2.2.2 THF and Carbon Paste 68
- V I I I -
3.2.2,3 Rotating Carbon Paste Electrode 68
3.2.3 PRA of Quinol 73
3.2.4 Quinol in THF by RRA. 74
3.2.5 Quinol in THF by FIA 80
3.2.5.1 Detection Potential 82
3.2.5.2 FIA Behaviour of Quinol 82
3.2.5.3 Comparison with UV Spectrophotometry 85
3.2.5.4 THF samples 86
3.2.6 Quinone in THF 86
3.2.6.1 Quinone FIA 87
3.2.6.2 THF Samples 88
3.2.6.3 PRA of Quinone in THF Samples 91
3.3 Quinol and Quinone in Ion Selective Electrode Polymer
Membranes 93
3.3.1 Sample Matrix 93
3.3.2 The Behaviour of Quinol in THF/PVC/Aliquat 336/ Phosphate Buffer 94
3.3.3 Quinol in Electrode Membranes 96
3.3.4 The Behaviour of Quinone in THF/PVC/Aliquat 336/ Phosphate Buffer 99
3.3.5 Quinone in Electrode Membranes 100
3.3.6 Identification of Interferent 102
3.3.7 The Fate of Quinol in Membranes 103
4. The Electroanalytical Determination of Theophylline in Pharmaceutical Samples 108
4.1 Introduction 109
4.2 Voltammetry of Theophylline at Carbon Paste Electrode 112
4.3.1 Hydrodynamic Voltammetry of Theophylline at Rotating Carbon Paste Disc in Phosphate Buffer 114
4.3.2 The PRA Determination of Theophylline 114
- IX-
4.3.3 Optimization of PRA Conditions for Theophylline 117
4.3.4 The Determination of Theophylline in Pharmaceuticals 122
4.3.5 Cough Syrups 124
4.3.5.1 Nuellin Syrup 124
4.3.5.2 Elixophyllin 126
4.3.5.3 Intravenous Injection Solution 129
4.3.6 Conclusion 131
5. Investigation of a Direct Electroanalytical Technique for the Determination of Theophylline In Clinical Samples 133
5.1 Introduction - Statistical Analysis 134
5.1.1 The Theophylline Therapeutic Range 134
5.1.2 The Standard Deviation of Therapeutic Range 135
5.1.3 Calculation of Required Number of Measurements 136
5.2 Introduction - Direct Electrochemical Analysis of Theophylline 140
5.2.1 Voltammetry in Saliva 141
5.3 Investigation of FIA Optimum Conditions for Theophylline Determination 143
5.3.1 Cathodic Cleaning of FIA Glassy Carbon Electrode 143
5.3.1.1 Investigation of Solvent Composition on the Deposition of Theophylline Oxidation Products Under Hydrodynamic Conditions 147
5.3.1.2 The Effect of 20^ Methanol 80^ Phosphate Buffer 147
5.3.1.3 The Effect of Methanol/Acetonitrile/ Phosphate Buffer Solvent 148
5.3.1.4 G0% Methanol/Phosphate Buffer Solvent 149
5.3.2 Methanol Electrode Cleaning Between Measurements 152
5.3.2.1 Electrode Cleaning by Soaking in
Methanol 155
- X -
5.3.2.2 Mechanical and Methanol Cleaning 156
5.3.2.3 FIA with Methanol Cleaning Injections 158
5.3.2.4 FIA with Potassium Hydroxide Injections 159
5.3.3 Summary of Cleaning Procedures for FIA of Theophyl1Ine 161
5.4 Conclusion 162
REFERENCES 164
APPENDIX 1 1 8 ^
APPENDIX 2 I8fe
APPENDIX 3 187
APPENDIX 4 18S

1
CHAPTER 1
Introduction
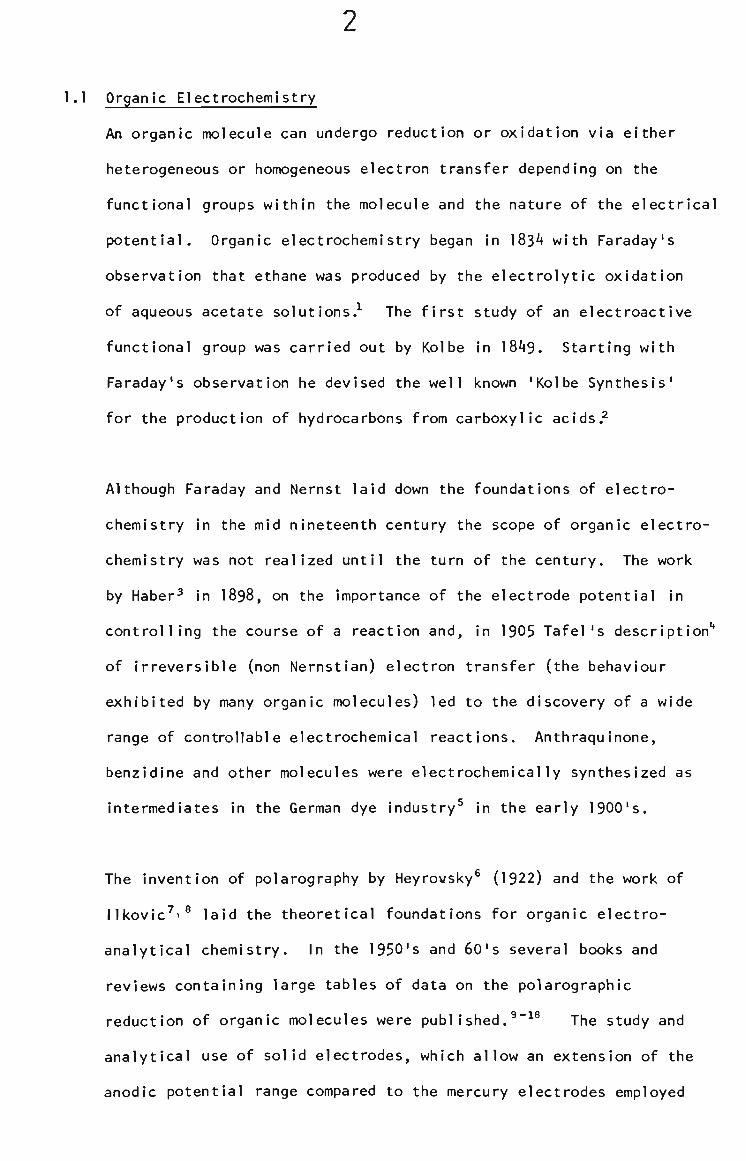
1.1 Organic Electrochemistry
An organic molecule can undergo reduction or oxidation via either
heterogeneous or homogeneous electron transfer depending on the
functional groups within the molecule and the nature of the electrical
potential. Organic electrochemistry began in 1834 with Faraday's
observation that ethane was produced by the electrolytic oxidation
of aqueous acetate solutions.^ The first study of an electroactive
functional group was carried out by Kolbe in 1849. Starting with
Faraday's observation he devised the well known 'Kolbe Synthesis'
for the production of hydrocarbons from carboxyl ic acids.^
Although Faraday and Nernst laid down the foundations of electro
chemistry in the mid nineteenth century the scope of organic electro
chemistry was not realized until the turn of the century. The work
by Haber^ in I898, on the importance of the electrode potential in
controlling the course of a reaction and, in 1905 Tafel's description**
of irreversible (non Nernstian) electron transfer (the behaviour
exhibited by many organic molecules) led to the discovery of a wide
range of controllable electrochemical reactions. Anthraqulnone,
benzidine and other molecules were electrochemically synthesized as
intermediates in the German dye industry^ in the early 1900's.
The invention of polarography by Heyrovsky^ (1922) and the work of
llkovic^i® laid the theoretical foundations for organic electro
analytical chemistry. In the 1950's and 60's several books and
reviews containing large tables of data on the polarographic
reduction of organic molecules were published.^"^^ The study and
analytical use of solid electrodes, which allow an extension of the
anodic potential range compared to the mercury electrodes employed
in polarography, led to similar tables being published for
oxidations in the late 1960's.^®-^°
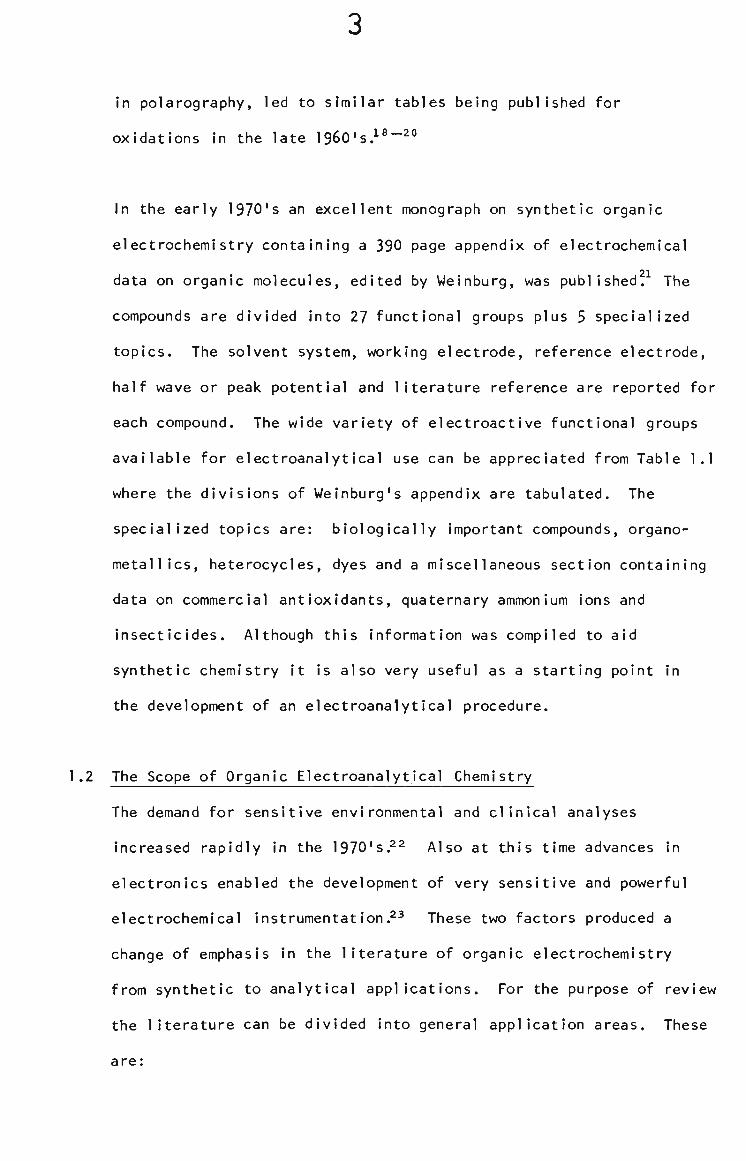
In the early 1970's an excellent monograph on synthetic organic
electrochemistry containing a 390 page appendix of electrochemical
21
data on organic molecules, edited by Weinburg, was published. The
compounds are divided into 27 functional groups plus 5 specialized
topics. The solvent system, working electrode, reference electrode,
half wave or peak potential and literature reference are reported for
each compound. The wide variety of electroactive functional groups
available for electroanalytical use can be appreciated from Table 1.1
where the divisions of Weinburg's appendix are tabulated. The
specialized topics are: biologically important compounds, organo-
metallics, heterocycles, dyes and a miscellaneous section containing
data on commercial antioxidants, quaternary ammonium ions and
insecticides. Although this information was compiled to aid
synthetic chemistry it is also very useful as a starting point in
the development of an electroanalytical procedure.
1.2 The Scope of Organic Electroanalytical Chemistry
The demand for sensitive environmental and clinical analyses
increased rapidly in the 1970's.^^ Also at this time advances in
electronics enabled the development of very sensitive and powerful
electrochemical instrumentation.^^ These two factors produced a
change of emphasis in the literature of organic electrochemistry
from synthetic to analytical applications. For the purpose of review
the literature can be divided into general application areas. These
are:
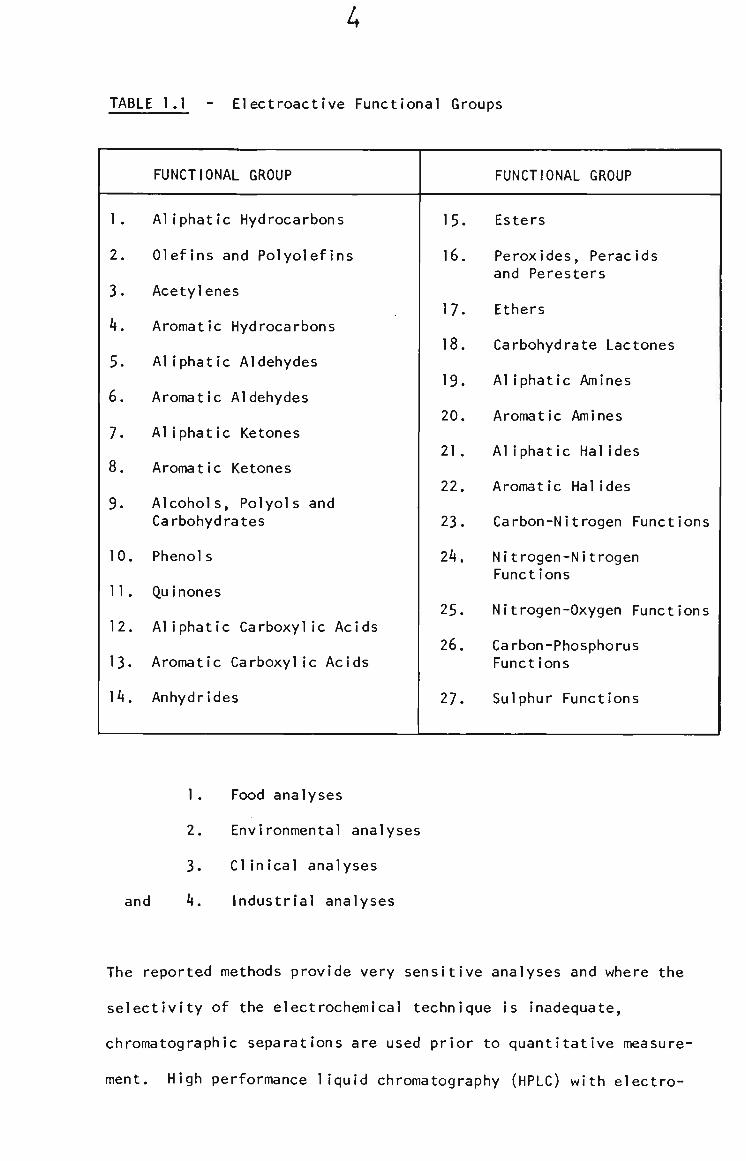
TABLE 1.1 - Electroactive Functional Groups
FUNCTIONAL GROUP
1.
2.
3.
4.
5.
6.
7.
8.
9.
10.
11.
12.
13.
14.
Aliphatic Hydrocarbons
Olefins and Polyolefins
Acetylenes
Aromatic Hydrocarbons
Aliphatic Aldehydes
Aromatic Aldehydes
Aliphatic Ketones
Aromatic Ketones
Alcohols, Polyols and Carbohydrates
Phenols
Qui nones
Aliphatic Carboxylic Acids
Aromatic Carboxylic Acids
Anhydrides
FUNCTIONAL GROUP
15.
16.
17.
18.
19.
20.
21.
22.
23.
24.
25.
26.
27.
Esters
Peroxides, Peracids and Peresters
Ethers
Carbohydrate Lactones
Aliphatic Amines
Aromatic Amines
Aliphatic Hal ides
Aromatic Hal ides
Carbon-Nitrogen Functions
Ni trogen-Nitrogen Functions
Nitrogen-Oxygen Functions
Carbon-Phosphorus Functions
Sulphur Functions
and
1. Food analyses
2. Environmental analyses
3. CIinical analyses
4. Industrial analyses
The reported methods provide very sensitive analyses and where the
selectivity of the electrochemical technique is inadequate,
chromatographic separations are used prior to quantitative measure
ment. High performance liquid chromatography (HPLC) with electro-
chemical detection Is the most popular and successful technique since
it allows the use of small sample volumes, provides good
separations with high sensitivity and Is amenable to automation where
large sample throughputs are required.
Electrochemical analysis of foodstuffs for the determination of
aflatoxins,^** food dyes,^^"^^ drug res I dues,^^''^^ stabilizers and
antioxidants,^^"^^ pesticide res I dues,^^"^^ vi tamins ""** and
contaminants'*^ have been reported.
Environmental samples have been analyzed electrochemically for
aromatic amine carcinogens,'*'*"'* anthraquinones,**® hydrazinesj**^"^^
Isocyanates,^^ pesticides,^^"^^ phenol Ics^^~^® and surfactants.^^
Clinical chemistry requires analyses of both endogenous and exogenous
species in the complex matrices of body fluids and tissues. Most
methods reported for clinical use employ HPLC with electrochemical
detection. Procedures for acetaminophen and related compounds,^""^^
antibiotics,^^"" benzodiazepines,^®"^^ bile acids,^^"^^ catechol
amines,'®"®^ chloramphenicol,®® cytochrome,®' nitroimidazoles,®®
NADH,®^-^° opiates,"-^^ purines,^'*-^® oxal ic acid,^' steroids and
hormones,^®-!"'" thioamides,^°'*-i°5 thiol s,i°®-^^° tryptophans,!^!-!^^
uric acid,^^'*-^^® vitamins3^'®°»^^' and methylxanthines^^®-^^' have
been reported.
Of the industrial analyses reported, pharmaceutical products form
the largest single group. Unlike clinical analyses of drugs
pharmaceutical analyses are not complicated by biological matrices
and therefore electrochemical selectivity has been utilized in direct
measurement procedures for many products.
Where mixtures of compounds, with similar redox potentials, are pres
ent in samples, HPLC Is used to achieve the necessary separations.
Procedures for antibiotics,®®"®^ anaesthetics,^^""^^^ alkaloids,^®'^^^
butazones,^^® barbiturates,^^**"^^^ benzodiazepines,^^®"^®^
cacodylates,""-® chorhexidlne,-"-®® contraceptives,^®"*"^®® contaminants^®^
folic acid,i'*° meptazinol,^**^ opiates, **2- '*® peroxides, '*'*
phenothiazines,^'*®"^'*® phenolic stimulants,^®°~^®^ organic ha 1 ides,^®^
thioamides,^®® tinidazole,^®'* tricyclic antidepressants^'*' and
vitamins®®'^®®-^®® have been reported.
Other industrial analyses include butylated hydroxy toluene in
transformer oils,^®' forensic analysis of explosives,^®®~^®° mineral
flotation agents, ® """"® nitrohumic acids prepared from the oxidation
of coal""-®® and surfactant analysis.®®
To take advantage of the large scope of organic electrochemistry in
the development of sensitive analytical techniques, it is necessary
to understand the basic principles of electroanalytical chemistry and
the experimental modifications which aid the selectivity and/or
sensitivity of organic analyses.
1.3 Electroanalytical Methods
Organic electroanalytical chemistry has two distinct fields,
potentlometry and voltammetry. In potentlometry the developed
potential difference between a sensing electrode and a reference is
measured with the system at equilibrium. In voltammetry the current
7
flow at the sensing electrode Is measured while the system is
perturbed from equilibrium by changes in the applied potential.
1.3.1 Potentlometry
Organic species are potentiometrically determined by means
of an electrode selective towards the analyte. These electrodes
are either an enzyme coated ion-selective electrode^®' or a
membrane electrode selective to the analyte^.^**""®'"®'"® The
potential developed is related to the concentration of
the analyte and is described by the following form of the
Nernst equation.^'®
RT E = Constant + —=• In a.. Equation 1
nF OA
where a-. = activity of the organic analyte
and E = the potential difference measured
n = charge of species causing developed potential
A limitation of organic potentlometry is that usually the
analyte must be an ion to respond at the liquid membrane or be
amenable to enzymatic reaction. An advantage for physiological
analyses is that the electrodes respond only to the activity of
the free species rather than total species concentration. In
a biological matrix it is the activity of the free species
that is physiologically relevant.
Since no net current flows through the system,measurements are
made with a high impedance ml 11Ivoltmeter. The technique is
reasonably sensitive giving a log linear calibration usually
from 10"^ to 10"® molar concentrations.
8
1.3.2 Voltammetry
Voltammetry may be divided Into two forms; firstly polarography^®
where a dropping mercury electrode is employed as the working
electrode and secondly, solid electrode voltammetry where various
conducting materials are used as working electrodes. Materials
such as platinum, gold, carbon paste, glassy carbon and pyrolytic
graphite are employed. Although polarography Is useful for many
organic analytes it has a limited anodic range due to the easy
oxidation of the mercury electrode. On the other hand the solid
electrodes have a wide anodic range which Is usually limited by
oxidation of the solvent and therefore enables the application
of many organic oxidations to analysis.^® In this thesis, all
voltammetric measurements were made at solid electrodes.
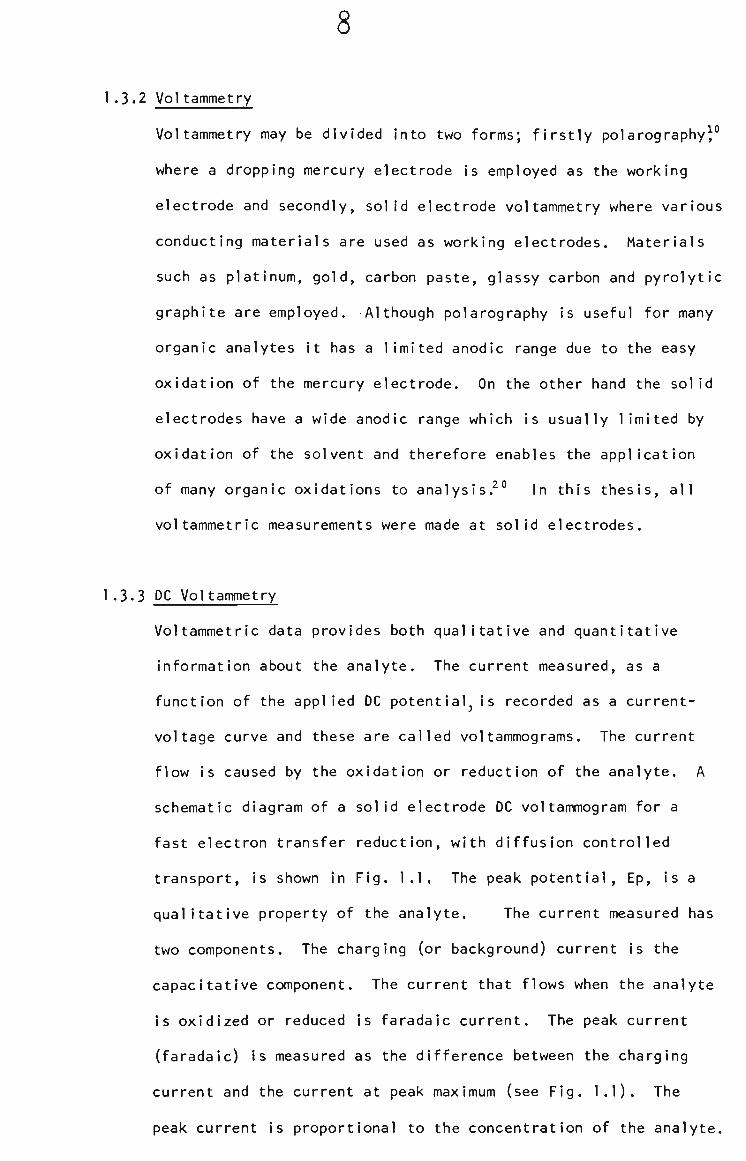
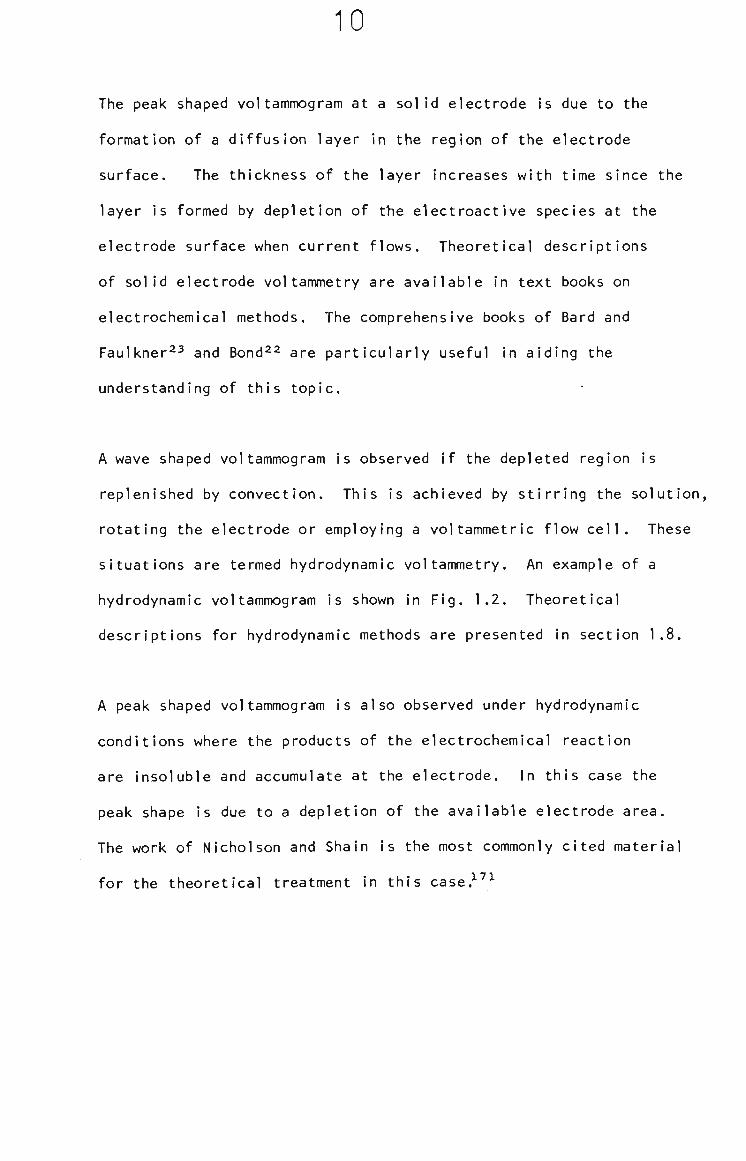
1.3.3 DC Voltammetry
Voltammetric data provides both qualitative and quantitative
information about the analyte. The current measured, as a
function of the applied DC potential is recorded as a current-
voltage curve and these are called voltammograms. The current
flow is caused by the oxidation or reduction of the analyte. A
schematic diagram of a solid electrode DC voltammogram for a
fast electron transfer reduction, with diffusion controlled
transport, is shown in Fig. 1.1, The peak potential, Ep, is a
qualitative property of the analyte. The current measured has
two components. The charging (or background) current is the
capacitative component. The current that flows when the analyte
is oxidized or reduced is faradaic current. The peak current
(faradaic) is measured as the difference between the charging
current and the current at peak maximum (see Fig. 1.1). The
peak current Is proportional to the concentration of the analyte.
'"'Q- 1»1 " SCHEMATIC DIAGRAM OF SOLID ELECTRODE VOLTAMMOGRAM
FOR DIFFUSION CONTROLLED MASS TRANSPORT
o o Q
o <
APPLIED POTENTIAL
10
The peak shaped voltammogram at a solid electrode is due to the
formation of a diffusion layer in the region of the electrode
surface. The thickness of the layer increases with time since the
layer is formed by depletion of the electroactive species at the
electrode surface when current flows. Theoretical descriptions
of solid electrode voltammetry are available In text books on
electrochemical methods. The comprehensive books of Bard and
Faulkner^^ and Bond^^ are particularly useful in aiding the
understanding of this topic.
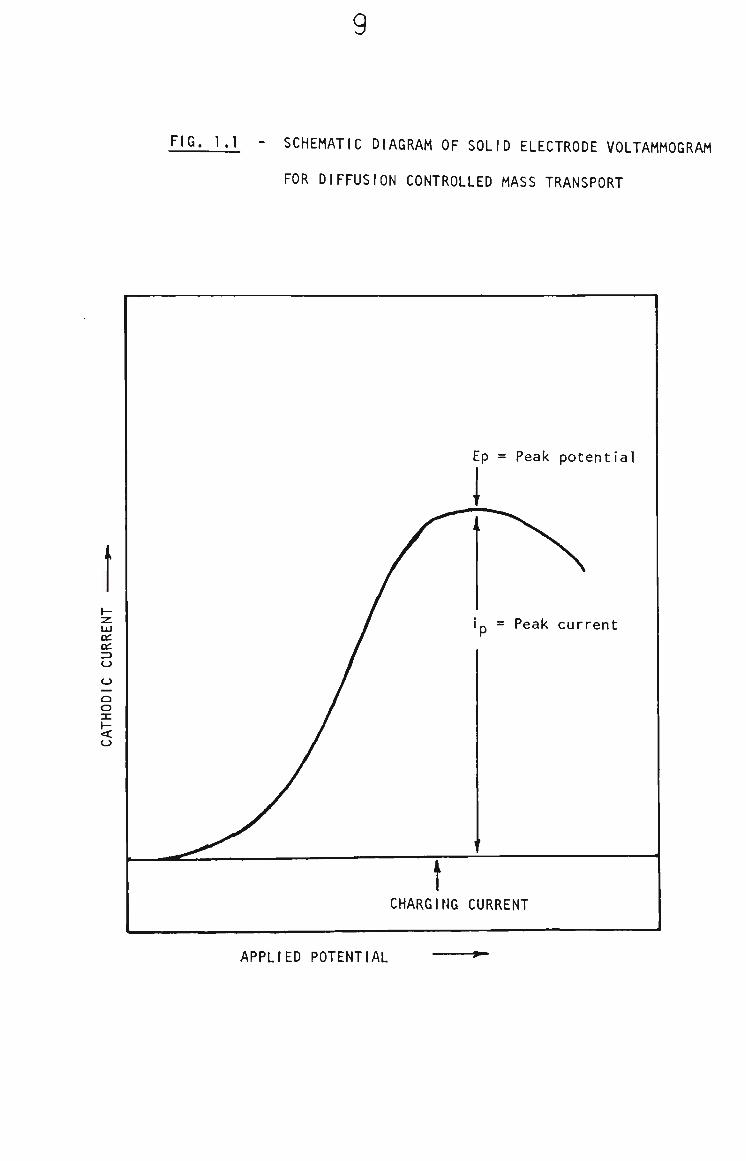
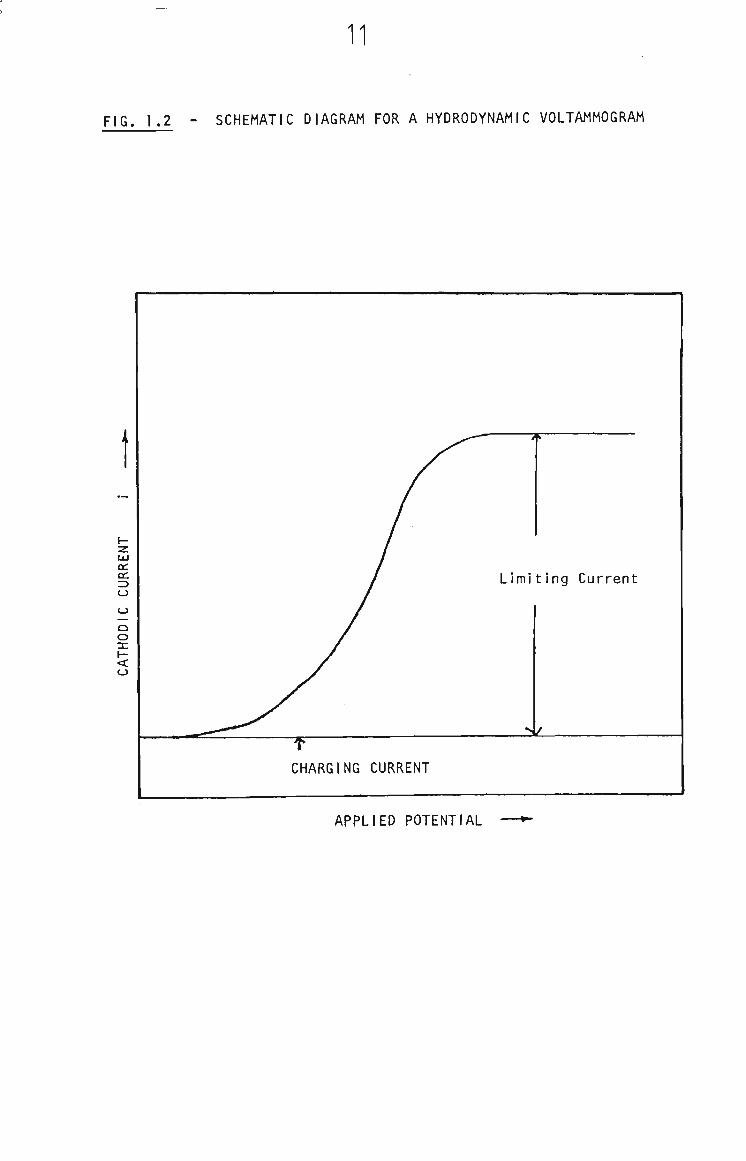
A wave shaped voltammogram is observed If the depleted region Is
replenished by convection. This Is achieved by stirring the solution,
rotating the electrode or employing a voltammetric flow cell. These
situations are termed hydrodynamic voltammetry. An example of a
hydrodynamic voltammogram is shown in Fig. 1.2. Theoretical
descriptions for hydrodynamic methods are presented in section 1.8.
A peak shaped voltammogram Is also observed under hydrodynamic
conditions where the products of the electrochemical reaction
are insoluble and accumulate at the electrode. In this case the
peak shape Is due to a depletion of the available electrode area.
The work of Nicholson and Shain Is the most commonly cited material
for the theoretical treatment in this case. '''-
11
FIG. 1.2 - SCHEMATIC DIAGRAM FOR A HYDRODYNAMIC VOLTAMMOGRAM
LU CC CC ID O
o o o
<
Limiting Current
>/
CHARGING CURRENT
APPLIED POTENTIAL
12
1.3.4 Limitations of DC Voltammetry
In DC voltammetric methods, where the analyte concentration is low
(ca 10"®M) and consequently the faradaic current is small, the
charging current becomes significant. In this situation it becomes
difficult to distinguish between the large capacitative current and
very small faradaic current and therefore the detection limit of DC
methods is set by this characteristic^'^
Modern voltammetric techniques overcome the limitation of the charging
current by electronic^ concentration at the electrode,or hydrodynamic
means and therefore have lower detection limits. Most of the
electronic techniques were developed for polarography but are
applicable to voltammetry at solid electrodes. There are a variety
of electronic modifications to the basic voltammetric experiment
but the two most widely used are pulse techniques and A.C. methods.
The other methods include square wave polarography,^'® radio
frequency polarography,^'** chronopotentiometry,^'®~^'® controlled
current techniques^""-'-'® and charge step polarography.•'•®°~-'-®-
Stripping voltammetry discriminates between charging and faradaic
currents by maximizing the faradaic signal via concentration of
either reduced or oxidized species on or in the electrode. Pre-
electrolysis at a potential in the transport limited region accum
ulates the analyte and subsequent stripping of the accumulated
material by either an anodic or cathodic voltammetric scan Is used
for quantitation. Anodic stripping Is a very sensitive technique
for metals and concentrations as low as 10"^°M silver have been
determined.^®^ Cathodic stripping is more applicable to organic
analytes and inorganic anions, with 10"^°M levels of steroids being
13
detectable.^®®
Hydrodynamic techniques utilize changes in the rate of transport of
the electroactive species to the electrode.^®**
Only those methods used In the following chapters will be discussed,
The electronic methods are tast, differential pulse and AC
voltammetry. The hydrodynamic techniques employed were pulsed
rotation amperometry and flow Injection analysis with amperometric
detect Ion.
1.4 Electronic Discrimination of Charging Current
1.4.1 Tast Voltammetry
Electronic modifications of the basic DC voltammetric experiment
employed to enhance sensitivity In electroanalysis have been
primarily developed for polarography. The tast modification
Is a current sampling technique utilizing the different time
domain behaviour of the charging and faradaic currents during
the life of a mercury drop. Since the charging current decrea
ses steadily with time and the faradaic current increases as
the size of the drop grows, then sampling the current towards
the end of the drop life maximizes the ratio of the faradaic
to charging current and therefore increases the sensitivity
of the analytical method. Tast polarography has a detection
limit of ca. 10~®M, an order of magnitude over conventional
DC polarography.^^^
At a solid electrode the faradaic current decays with time
u
since the electrode area remains constant. The rate of
decay is slower than that of the charging current.^®®
Therefore it is possible to use a tast type modification to
increase sensitivity in this situation although the improve
ment will not be as substantial as that in tast polarography.
1.4.2 Differential Pulse Voltammetry
The differential pulse modification is another sensitivity
enhancing technique primarily developed for polarography but
1 ft 7
is still quite useful for solid electrode voltammetry. In
this technique a small amplitude pulse (ca. 10 to 100 mV) is
applied, in addition to the linear DC potential ramp, at set
time intervals and the current is sampled prior to and
towards the end of the pulse. The difference in these two
currents is plotted as a function of the DC potential. In
polarography the pulse Is applied just prior to the end of
the drop life to maximize the faradaic to charging current
ratio. A plot of applied potential versus time (Fig. 1.3)
demonstrates this.^®®
The resultant voltammogram is peak shaped rather than wave
shaped and has the advantage of easier quantitation especially
for multi-component analyses since the peaks occur along a
common baseline rather than the additive result of DC waves.
High sensitivity is achieved by reducing the charging current
contribution. Concentrations as low as 10"® may be
determined.'-®® The peak height and width are dependent
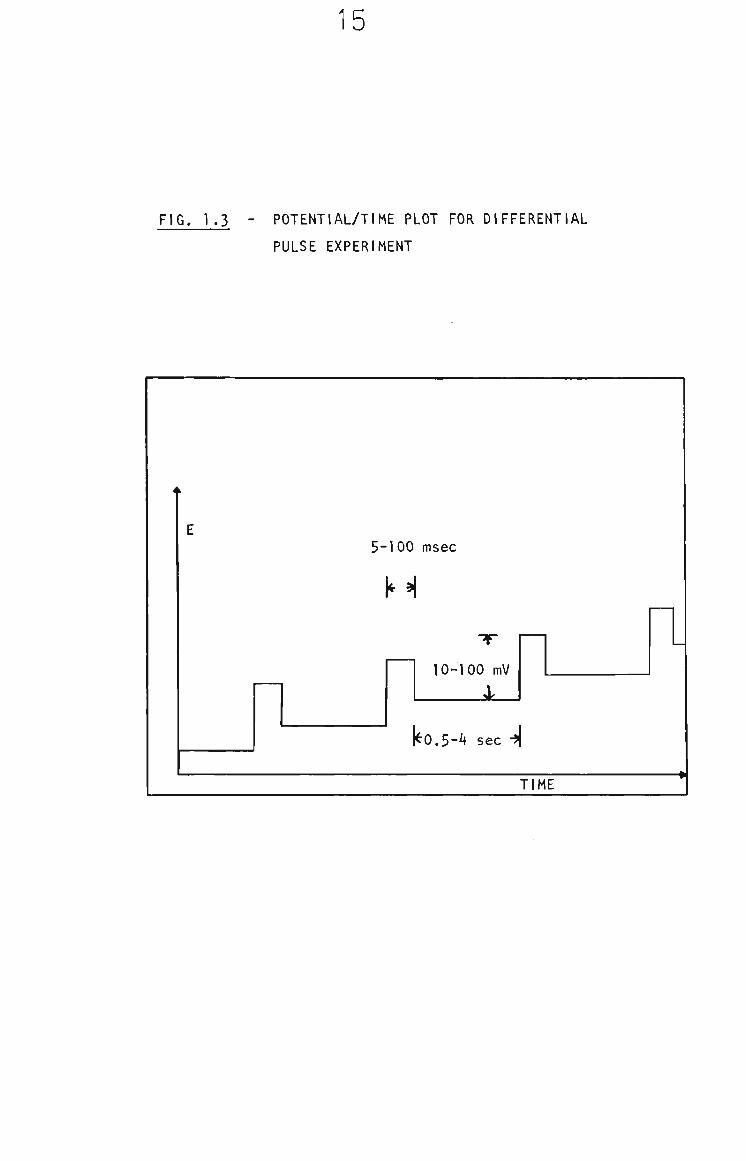
15
FIG. 1.3 - POTENTIAL/TIME PLOT FOR DIFFERENTIAL
PULSE EXPERIMENT
5-100 msec
KH
10-100 mV
4i_
ko.5-4 sec -l
TIME
16
on the size of the pulse used. Large pulses give
large but broad peaks whereas small pulses provide narrower
but smaller peaks. Therefore selectivity may be enhanced by
the use of small pulses, provided sensitivity is not a
problem.!®®
Further increases in sensitivity may be achieved by coupling
the differential pulse technique with stripping analysis^®!
or rotating electrodes.^®^
An important point to consider at these very low concentrations
is the choice of solvents and supporting electrolytes. Impurity
levels in these materials will be significant in certain
circumstances and great care must be exercised in their choice.
Contamination from electrolytes may be reduced by lowering
their concentrations from the customary 0.1-l.OM to
0.01-O.OOlM. The lower limit is fixed by the maximum cell
resistance that can be tolerated.^^®
1.4.3 AC Voltammetry
Alternating current (AC) voltammetry encompasses a wide variety
of periodic voltage waveforms applied to the electrochemical
cell. The waveform may be sinusoidal, square wave, triangular
or amplitude modulated. The most commonly used In analytical
work is the sinusoidal waveform. Voltammograms are generated
by superimposing a small amplitude sinusoidal alternating
potential onto the usual potential ramp used in DC voltammetry
and then filtering out the DC current component to record a
plot of alternating current versus the DC potential .!®'* Norm-
17
ally the first harmonic is used but higher harmonics may be
utilized,!®®
The AC potential is of fixed frequency and of an amplitude
usually in the range 10 to 50 millivolts. The AC current
measured is of the same frequency as the AC potential. The
AC current contains both faradaic and charging components
and provides a peak shaped vol tammog ram.!®® The peak
potential is closely related to the half wave potential and
is characteristic of the electroactive species and the medium.
The peak current is generally a linear function of concen
tration and is the basic parameter In analysis.
AC voltammetry also has the advantage of providing discrimin
ation against charging current by utilizing a phase sensitive
detector. It can be shown that if AC measurements are made at
a phase angle of 0° or 180° relative to the applied AC voltage
then the charging current component will be zero and the
measured signal will consist solely of ± ^Jl of the faradaic
current for a reversible electrode process,^®® This is an ideal
situation and in practice resistance effects lead to some
charging current but significant discrimination is still achieved
If three electrode, IR drop compensation voltammetric instrument
ation is employed.!®® Detection limits using this technique
approach 10"'M.!®'
1.5 Hydrodynamic Methods
Electrochemical hydrodynamic methods are divided into two categories;
18
firstly where the electrode is rotated to achieve convectlve mass
transport and secondly where the electrode is stationary and mass
transport is achieved by employing a flowing stream. Both techniques
exhibit good sensitivity due to the faradaic currents being trans
port limited rather than diffusion limited.
1.5.1 Rotating Electrode Systems
For rotated disc electrodes and a reversible electrode
process, the following equation for the limiting current was
derived by Levich.!^^
I. = 0.62 nFAD 2/3 . ^-^A ^-V^ c L o <:
where I. = Limiting current to = Angular velocity of the disc V = Kinematic viscosity CQ" = Bulk concentration
Do = Diffusion coefficient
A = Area of disc
and all other symbols are as previously used. The limiting
current, I,, is a linear function of concentration and
proportional to the square root of the rotation rate.
Therefore increases In rotation rate improve the sensitivity.
The Levich equation holds for laminar flow and has lower and
upper limits of rotation rate. At low rotation rates the
hydrodynamic boundary layer becomes large and contribution
from diffusion becomes significant. This can lead to peak
shaped rather than wave shaped voltammograms (as discussed
earlier) when the scan rate Is fast compared to rotation rate.
Typically values of N > 100 rpm are employed to avoid this
condition.!®® The upper limit of rotation rate is set by
19
the start of turbulent flow. Theoretically the condition
for non turbulent flow is u < 2 x 10® v/r^ where r = radius
of the disc electrode. In practice. Imperfect disc surfaces,
bends or eccentricities in the rotating shaft and the cell
design lower the upper limit of rotation rate. Also vortex
formation around the electrode may occur. Generally rotation
rates up to 10,000 rpm can be employed,!®®
Bruckenstein and Miller developed a technique called
sinusoidal hydrodynamic modulation, which overcomes charging
current limitations by utilising the change in current flow
arising from the modulation of the electrode's rotation rate.^°°
The modulation amplitude, Aui, is usually about 1% of to and
the amplitude, Al, of the resultant modulated current is
recorded. If the system follows the Levich equation then Al
i s gIven by:
,. /Aa)\
where 1 , = the current for w
Al is free from factors that do not depend on the mass
transfer rate and therefore the technique discriminates between
the analyte current and (1) charging current, (2) currents due
to the oxidation or reduction of the electrode or of adsorbed
species. Also Al Is relatively insensitive to anodic and
20
cathodic background current enabling an extension of the
working potential range normally limited by electrolysis of
the solvent or supporting electrolyte. The technique Is useful
for the determination of sub-micromolar concentrations with
rotating electrodes and for studies In the presence of surface
compl icat ions.^°!
1.5.2 Pulsed Rotation Amperometry
Blaedel and Yim investigated the ferrIcyanIde-ferrocyanIde
system by pulsed rotation voltammetry (PRV) at a glassy
carbon disc. PRV is a square wave version of hydrodynamically
modulated voltammetry employing large amplitude Aw. They
report very low background currents enabling a detection
limit of 10"®M ferrIcyanIde?°2
Both pulsed rotation voltammetry and sinusoidal hydrodynamic
modulation require more complicated Instrumentation than
conventional voltammetry. For the quantitative analysis of
a known system only the magnitude of Ai In the transport limited
region of potential Is necessary. Therefore a simple
amperometric technique employing manual changing of the rotation
rate by a factor of ten (10) was developed for some of the
analytical measurements reported in this thesis. The technique
Is called pulsed rotation amperometry (PRA). The conditions for
the technique are set out In Chapter 2. Where the products of
the electrochemical reactions are solvent soluble, triplicate
measurements of Ai may be made in 15 s . Where the products
of reactions are insoluble measurement time is limited by
renewal of clean electrode surfaces.
21
Pulsed rotation amperometry has all the discriminating
advantages of hydrodynamically modulated voltammetry and
provides analytical data more economically since measurement
times are small and conventional instrumentation is used.
Detection limits are comparable with differential pulse
polarography but PRA has distinct advantages. Since the
technique is insensitive to solvent oxidation and reduction,
analytes electroactive in this potential region can be
determined accurately. Secondly, with differential pulse
polarography In certain sample matrices.it is difficult to
estimate the background current accurately which leads to
quantitative errors. For instance, Archer et al.,
report three different techniques for background estimation
in the differential pulse polarographic determination of
tertiary-butylhydroquinone in edible oils. Only one
of these techniques provided acceptable accuracy.^^ With
a PRA determination the background currents are eliminated
when Ai is measured.
In the following chapters the sensitivity of PRA is
demonstrated by sub parts per million concentrations of
quinol and quinone being determined In small samples of
ion selective electrode polymer membranes. The PRA
determination of theophylline in pharmaceutical products
provides an example of measurements made in the potential
region where water oxidation is significant.
22
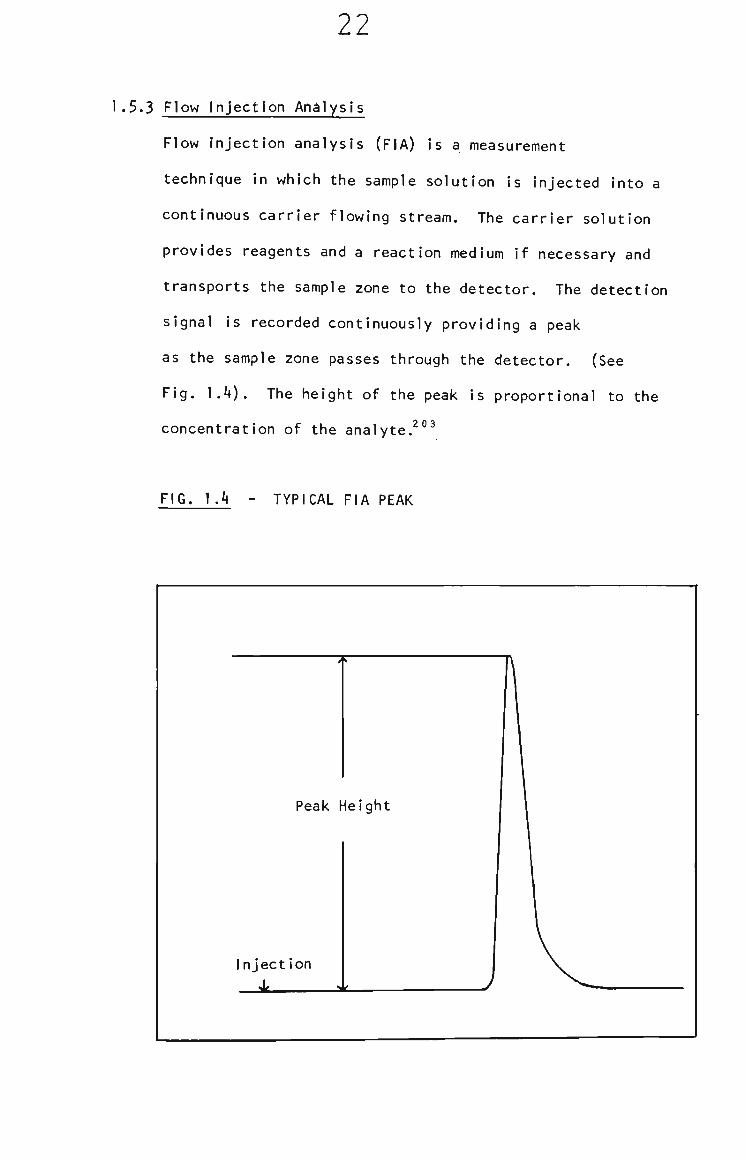
1.5.3 Flow Injection Analysis
Flow Injection analysis (FIA) Is a measurement
technique in which the sample solution is injected Into a
continuous carrier flowing stream. The carrier solution
provides reagents and a reaction medium If necessary and
transports the sample zone to the detector. The detection
signal is recorded continuously providing a peak
as the sample zone passes through the detector. (See
Fig. 1.4). The height of the peak is proportional to the
concentration of the analyte.^°®
FIG. 1.4 - TYPICAL FIA PEAK
t
Peak \
In ject ion
k
ie ight
J
ft
> ^
23
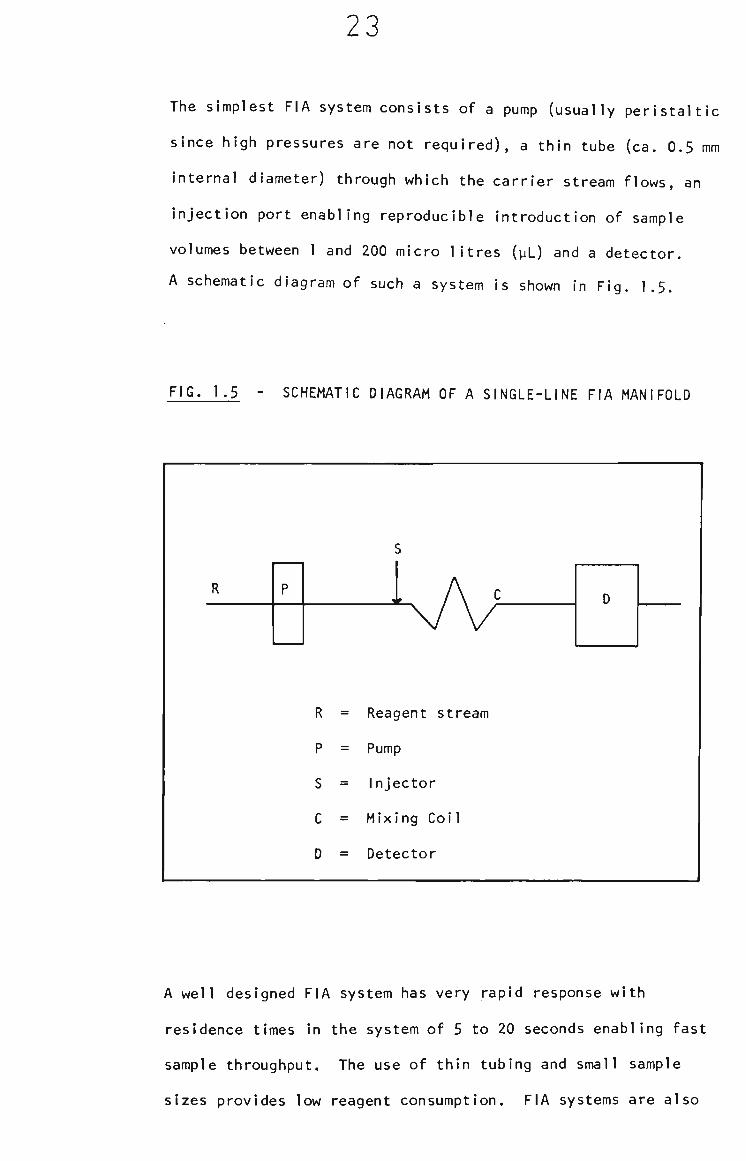
The simplest FIA system consists of a pump (usually peristaltic
since high pressures are not required), a thin tube (ca. 0.5 mm
internal diameter) through which the carrier stream flows, an
injection port enabling reproducible introduction of sample
volumes between 1 and 200 micro litres (yL) and a detector.
A schematic diagram of such a system is shown in Fig. 1.5.
FIG. 1.5 - SCHEMATIC DIAGRAM OF A SINGLE-LINE FIA MANIFOLD
R
P
S
C
D
=
=
=
=
^
Reagent stream
Pump
Injector
Mixing Coil
Detector
A well designed FIA system has very rapid response with
residence times in the system of 5 to 20 seconds enabling fast
sample throughput. The use of thin tubing and small sample
sizes provides low reagent consumption. FIA systems are also
2A
very amenable to automation and therefore the technique has
considerable economic advantages over conventional analysis
., I 2 0 It-methods.
FIA Is a very versatile technique since a variety of
detectors may be employed. FIA analysis employing UV-VIS
spectrophotometry, atomic adsorption spectroscopy, ion
O A c
selective electrodes and amperometry have been reported.
By adjustment of Injection volume, flow line length and diam
eter and flow rate, conditions suitable for many different 2. 0 6
chemistries may be obtained. The major parameter altered
by these adjustments Is the dispersion of the sample zone in 2 0 7
the carrier stream. The dispersion, D, is defined as
D = C° H° Const.' max H Const."
where C° = original concentration of injected solution
Q^^^ = maximum concentration of injected solution
at the detector.
H° = signal due to C
max, H = FIA peak height (signal due to C )
For a linear signal-concentration relationship, const.' =
const." and the ratio of the signals describes the dispersion
of the system. The extent of dispersion is a measure of the
dilution of the sample solution. For convenience dispersion
has been classified into three categories.
1. Limited dispersion where D = 1 to 3
0 MoHjuni dispersion where D = 3 to 10
25
3. Large dispersion where D > 10. °®
It follows that to achieve maximum sensitivity limited
dispersion must be employed. This is achieved by larger
injection volumes and short line lengths between injector and
detector.^®® Limited dispersion is used for rapid potentiometric
measurements such as pH where no reaction is required.
Spectrophotometric analyses requiring chromophore production
by reaction in the stream usually require medium dispersion.
This is achieved by either using smaller sample sizes, longer
lines incorporating mixing coils or a combination of both.
Large dispersion is employed in FIA titrations and is achieved
by more extreme conditions than those employed for medium
dispersion.
1.5.4 Amperometry in Flowing Streams
Amperometric measurements in flowing streams have two main
applications. Electrochemical detection is employed In high
pressure liquid chromatography (HPLC) and flow injection
analysis (FIA). Both techniques provide very high sensitivity
and require a small sample size. HPLC offers powerful
separations but analysis time is limited by the retention time
of the analyte. FIA offers rapid sample throughput and low
reagent consumption where electrochemical selectivity is
sufficient for the particular analysis.
25
There are four main electrochemical flow cell designs which
may be employed for detection In either HPLC or FIA. These
are thin-layer, wall-jet, polarographic and tubular
detectors?"^ ^^^ Wall-jet cells utilize increased mass
transfer to increase sensitivity by impinging the solution
through a jet nozzle onto the electrode at ninety degrees
215
to the surface. Polarographic detectors provide a wider
cathodic range than the solid electrode materials such as 213
platinum, gold and carbon, used in thin-layer, wall-jet
and tubular cells. Since small sample volumes are used
sensitivity for detectors is usually reported in amounts
detected rather than concentrations. Picogram levels of
catecholamines have been detected with HPLC Incorporating
electrochemical detection.
For FIA,wall-jet detectors are recommended .!® In this technique
the emphasis is on rapid sample throughput and therefore FIA
requires detectors with quick wash times. The wall-jet design
not only provides increased mass transfer in the measurement
of the analyte but also very effective cleaning of the electrode
between sample injections.
The FIA results reported in this thesis demonstrate the
application of limited dispersion for amperometric measurement
of quinol and quinone in tetrahydrofuran.
1.6 Electrode Materials
There are a variety of electrode materials available for voltammetric
and amperometric measurements. This allows the choice of a suitable
27
material for a particular analyte, matrix or measurement technique.
Polarography employs a dropping mercury electrode providing a clean
surface for each drop and a wide cathodic range (limited by the
production of hydrogen). Mercury suffers the disadvantage of easy
oxidation and therefore has limited anodic applications. Many
organic analytes of Interest are anodlcally electroactive and In
these cases solid electrode materials such as carbon, gold and
platinum provide an extension of the anodic range (limited by the
oxidation of water in most cases*).
Carbon paste and glassy carbon were employed for the work reported
in this thesis. The use of glassy carbon in electroanalytical
applications has been reviewed by Van Der Linden and Dieker. "''' They
report on the material production, its structure, the chemical and
electrochemical aspects of the electrode/solution interface,
voltammetric applications including stripping techniques, Its use in
flow through detectors, the chemical modification of Its surface
and its pretreatment before use.
To obtain reproducible results with glassy carbon, pre-treatment of
the electrode surface is necessary. There<sre a large number of
reported techniques, most of which are directed at the particular
application of the work but in all cases the initial treatment
involves polishing the surface. Various abrasives are used but
the final surface is generally produced by polishing with alumina or
chromium(lll) oxide suspensions of particle size around 0.3 um. This
* See 'Pulsed Rotation Amperometry, 1.8.2.
28
produces a mirror finish and the surface Is virtually free from
functional groups. If the surface has to be kept free of oxygen
containing groups^it must be washed after polishing in acids which
have no oxidizing properties such as 50^ HCl and the potential
must be kept negative with respect to the SCE. When the solution
contains strong oxidizing agents and/or the potential Is made
positive, carbonyl and even carboxyl groups can be formed. Cathodic
scanning leads to the reduction of these functions to possibly
hydroxyl groups. Electrochemical treatment cannot remove the
oxygen functions which are only removed by repollshing the surface.
Products or reactants adsorbed on the surface can often be removed
by rinsing in organic solvents and/or wiping with a wet tissue.
Where carboxyl groups are present It is possible to form permanent
chemical bonds with nitrogen functions. It is also possible to
Irreversibly damage the material under anodic conditions with high
current densities such as 20 mAmps per cm^.
Electrochemical pre-treatment has been used to increase electrode
response and therefore analytical sensitivity. One of the simplest
2 18 2 19
and most successful techniques is that reported by Engstrom »
where the electrode is pre-anodized at •t-1.75 V versus Ag/AgCl for
5 minutes followed by pre-cathodization for 10 seconds at -1.20 V.
This treatment produces a marked enhancement in sensitivity and
selectivity (via shifts in peak potential) in flow through detectors
for several electrochemically irreversible oxidations at untreated
glassy carbon. The treatment provides reproducible current levels
over a whole day's continuous use.
29
Baldwin and Ravichandran Investigated the electrochemical pre
treatment of carbon paste electrodes using Engstrom's technique.^^®
They found that similar behaviour was observed but the enhanced
sensitivity and shifts in peak potentials were not as long lived
for carbon paste as they were for glassy carbon. In particular when
carbon paste was treated and used in flow through detectors the
enhanced sensitivity continuously decreased with time. This
resulted in a return to current levels near that of the untreated
carbon paste within 30 minutes.
The decrease in sensitivity with time was shown not to be due to the
shift In peak potential (via cyclic voltammetry of untreated and
treated electrodes) and was attributed to a change In the surface
activation properties of the carbon paste.
30
Chapter 2
Experimental
31
2.1 Materials
2.1.1 Water
All solutions for analytical measurements were prepared from
water distilled in glass which was passed through a Millipore
"Mini Q" watermelon i zing system prior to use. The purified
water had a resistance of greater than 1 x lO' ohms.
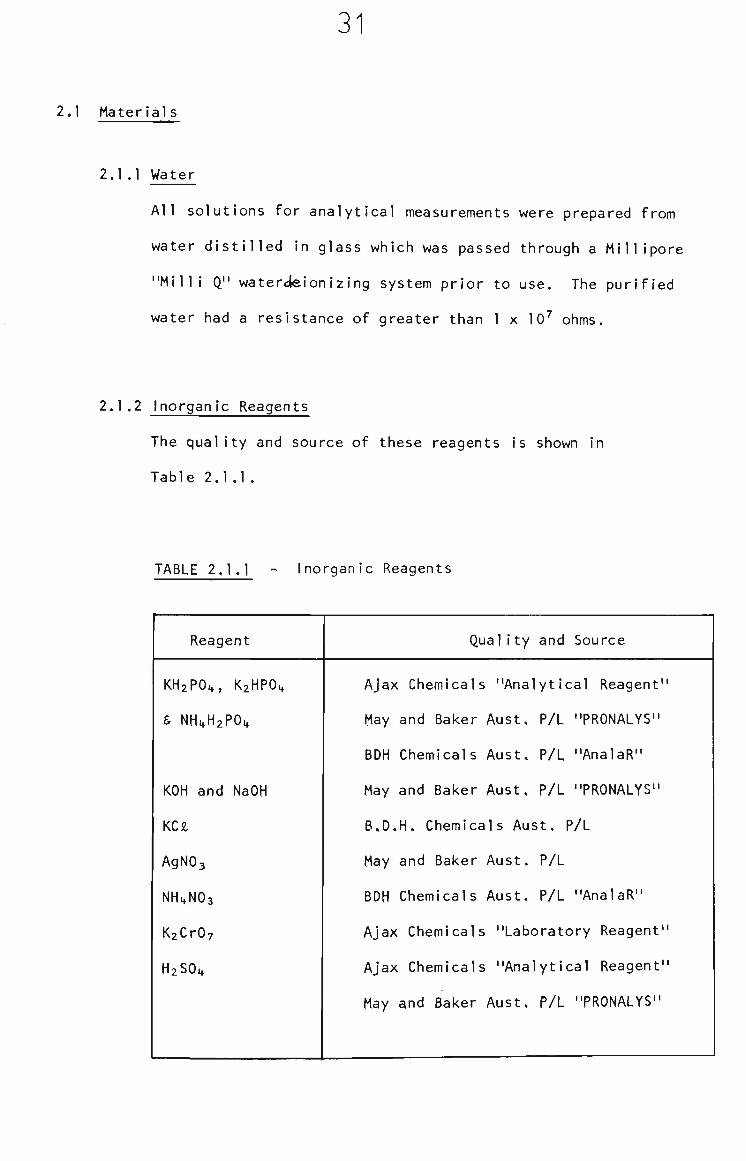
2.1.2 Inorganic Reagents
The quality and source of these reagents is shown in
Table 2.1.1.
TABLE 2.1.1 Inorganic Reagents
Reagent
KHzPO^, KzHPOi,
& NH«»H2P04
KOH and NaOH
KCil
AgNOg
NHi^NOa
KzCrOy
HaSO.*
Quality and Source
AJax Chemicals "Analytical Reagent"
May and Baker Aust. P/L "PRONALYS"
BDH Chemicals Aust. P/L "AnalaR"
May and Baker Aust. P/L "PRONALYS"
B.D.H. Chemicals Aust. P/L
May and Baker Aust, P/L
BDH Chemicals Aust. P/L "AnalaR"
Ajax Chemicals "Laboratory Reagent"
Ajax Chemicals "Analytical Reagent"
May and Baker Aust, P/L "PRONALYS"
32
2.1.3 Organic Reagents
Pure samples of theophylline, theobromine, caffeine and
3-methylxanthine were provided by the Royal Childrens Hospital,
Melbourne and the Victorian College of Pharmacy. These
materials were stored at less than 0°C and used without further
purification.
Acetonitrile, methanol, hexane and tetrahydrofuran (THF) were
obtained from B.D.H. Chemicals Australia Pty. Ltd. and were all
"AnalaR" analytical reagent grade.
Quinol and Quinone were obtained from Merck and were "Purls"
analytical reagent grade.
Ethylenediamine was obtained from B.D.H. Chemicals Australia Pty.
Ltd. Laboratory reagent grade material was used without further
purification.
Aliquat 336 was provided by R.W. Cattrall, Department of
Inorganic and Analytical Chemistry, La Trobe University,
Bundoora, and was used without further purification.
Samples of powdered polyvinylchlorlde (PVC) were obtained from
l,C.I. Australia Pty. Ltd. and used without further purification.
Infra-red spectroscopy was used to confirm the identity of the
material.
33
2.1.4 Alumina
Two grades of alumina were used, Merck Alumina "For Column
Chromatography" Activity It lA was used for the removal of
stabilizer from THF. The alumina was activated by heating to
300°C, under reduced pressure (ca. 10-20 mm/Hg), for 3 hours.
Polishing alumina was used for the preparation of glassy carbon
surfaces and it was provided with the Metrohm EA 276 glassy
carbon electrode*
2.1.5 Nitrogen
High purity grade nitrogen, for deoxygenating analytical
solutions prior to electrochemical measurement, was obtained
from Commonwealth Industrial Gases, Preston,
2.1 .6 Glassware
All glass apparatus used for analytical solutions was cleaned In
chromic acid solutions. The glassware was rinsed several
times with tap water, followed by several rinsings with distilled
water and finally rinsed three times with high purity distilled
and cl<?ionized water. This procedure is especially necessary when
working at the sub-parts per million level of analytes.
2.2 Instrumentation
2.2.1 Voltammetry
Direct current (DC), alternating current (AC) and differential
pulse (DP) voltammetry was performed with a Metrohm E506
* Prepared as outlined in A.I. Vogel,, "A Textbook of Inorganic Analysis"^ 3rd. Edition, 1961, Longman, London.
2L
Polarecord and a Metrohm E506 Polarography stand. Cyclic
voltammetry was performed with a potentlostat constructed at
Footscray Institute of Technology, a Utah Instruments Model 1509
sweep generator and a Watenabe X-Y recorder.
2.2.2 Pulsed Rotation Amperometry (PRA)
A Beckman rotating electrode assembly, capable of rotation rates
between 0.1 and 100 revolutions per second (r.p.s,), was
employed for PRA. The system incorporates a manual control
switch on the drive motor to change the rotation rate by a factor
of ten (10). This enables currents to be recorded at two
rotation rates and their difference (At) to be measured.
Detection potentials were maintained by the Metrohm E505
Polarecord and the currents recorded with the E505 in the
current-time mode of the instrument. With water soluble
reaction products, triplicate measurements of Al were obtained
in 15 seconds with manual changing of rotation rate.
Measurement time is limited by resurfacing of electrodes where
reaction products accumulate at the surface.
2.2.3 U.V. Spectrophotometry
All UV spectrophotometric measurements were recorded on a Varian
DMS90 Spectrophotometer, 1 cm quartz cells were employed for all
measurements.
2.2.4 Infrared Spectroscopy
I n f r a r e d spectra were recorded w i t h a Perkln-Elmer g r a t i n g
spect rometer . Model PE IR 720.

35
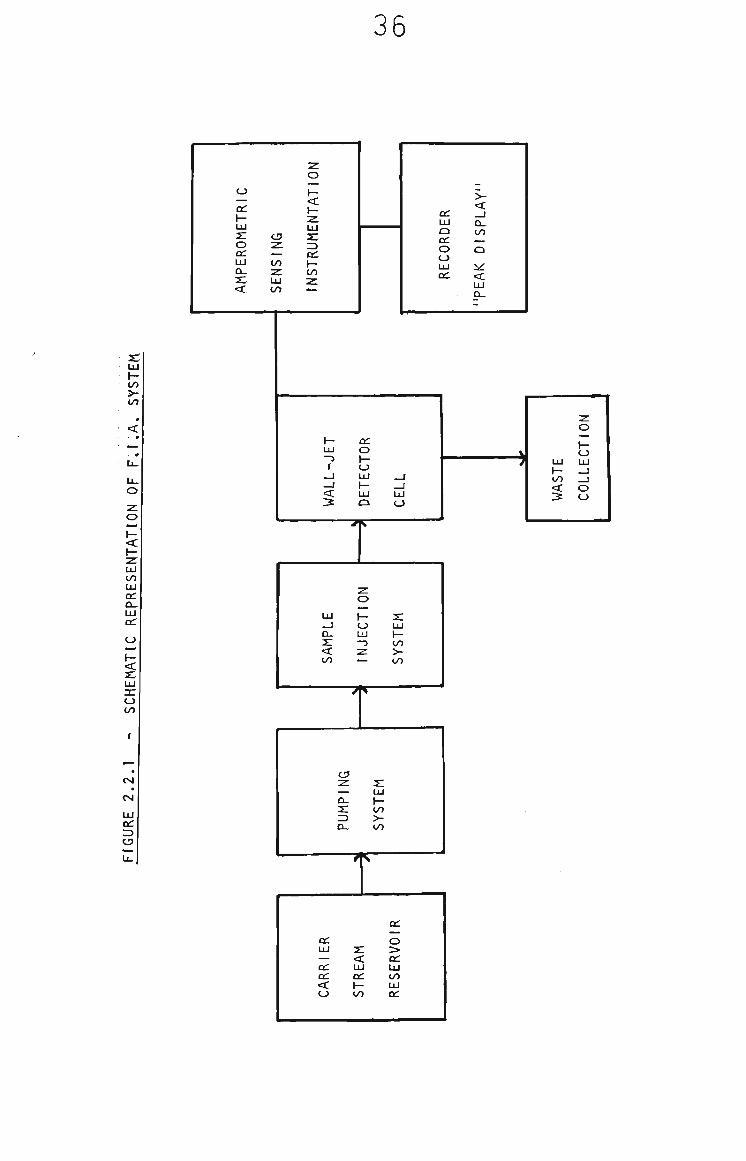
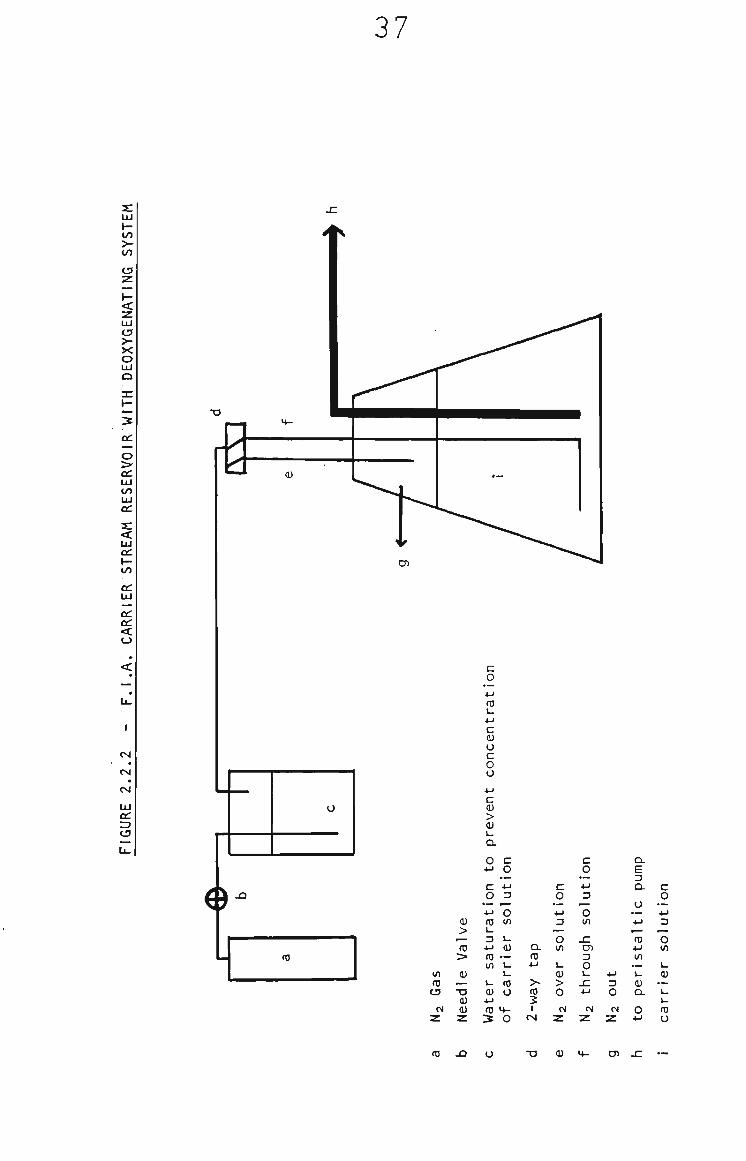
2.2.5 Flow Injection Analysis
A single line flow injection analysis (FIA) system with an
electrochemical detector was constructed and used for all FIA
measurements reported, A schematic diagram of the system is
shown In Fig, 2.2,1. The reservoir, pump and sample injection
parts of the system were modular to enable easy conversion from
perstaltic pumping with loop injection to gas pressure pumping
with septum injection.
FIA measurements for the determination of theophylline and
quinol employed the carrier stream^ reservoir shown in
Fig. 2.2.2, a Gilson "minipuls" peristaltic pump and a Pye
sample loop injector, modified for small liquid samples. The
Pye injector has an internal volume of 70 yL and was fitted with
a 20 yL sample loop so that 90 yL of sample is injected into the
carrier stream. The FIA tubing between injector and detector
was 0.5 mm Internal diameter teflon and kept at a minimum
length (10 cm) to minimize dispersion of the sample bolus in
the carrier stream and therefore maximize the sensitivity of
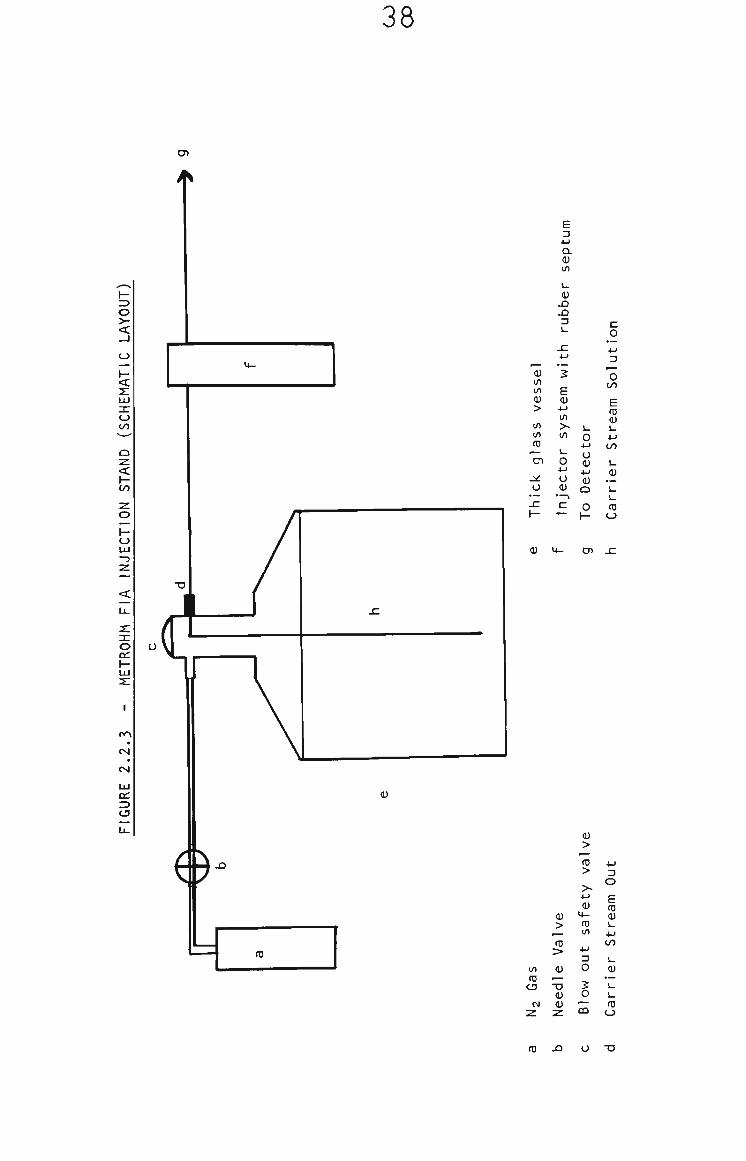
the response. FIA measurements for the determination of
quinone were performed with the Metrohm FIA Injection Stand,
Gas pressure pumping and septum injection (10 yL sample size)
were used, as is shown in Fig. 2.2.3% The minimum line length
between injector and detector was 20 cm due to the geometry
of the Metrohm system.
The electrochemical detector employed was a SGE wall-jet
electrochemical cell incorporating a glassy carbon working
electrode, a Ag/AgCJl saturated KCJl reference electrode
36
o ^ CL
\-UJ T. o CC
u^ Q . X . <
o z . *-to z LU CO
o H B _
1 -< 1 -2 1 UJ
:r r> Q i 1 -co 3 ^
I -to >-
o z: o
<
to LU CC
CC
o
o CO
eg
<si
ui CC
o
< a: —I LU Q_ Q I / ) CC — O Q t j LU i ^
I - tc LU O •? • -( O
- J LU -J t-< LU
3: O
LU O
O LU LU I - _ J t o _ J
< o 3t o
—I Q_ 2 :
< i / j
t j LU
-> ^ —
LU 1 -to i -tO
C3 z z: — LU n- h-2 : CO ^ >-o - 0 0
CC LU
<
o > CC LU CO LU
37
to
13
C3 >-X o LU
CC
o CC
in CO LU CC
2 : <c LU
«: I -to CC LU
o: <
eg
CM
eg
CC
0
<tl I/)
ro t 3
CM Z
<u > ro > (U
.— • 0
(U z
c 0
+J
<z L. 4-1
c 0) 0 c 0 0
+J
c (U > <u L. D .
0 4->
c 0
.— 4-1 <0 L. 3 4-* nj U1
L.
4-> TO
:s
c 0
4-) 3
— 0 in
i-(U
.— i_ i-(0 0
M-0
Q . TO 4-1
>-03
2 1 CNJ
c 0 •_ 4-1 D
*»-0 in
\-i) > 0
OJ Z
c 0
4-1 0
— 0 in
-C en 3 0 i -
-C *-)
01
z
4->
a 0
a z
a. E
Q .
0
4->
.^ (0 4J
(/) •— 1_
<u a. 0 4-)
c 0 ' — •M 3
^ 0 in
L. 4) •— L .
L .
OJ 0
CD (U a> x: —
38
en
o <
<
o to
z < h-to
I -o
CO
eg
LU CC
Q) in in
> in in
03
CT
o
<u
E 4-> Q. <U in
L .
<u
3
E 0)
4-> in >-(/) i_ O
4->
o 0)
en
c o 4-> :3
l_ o 4-)
o (U 4-1 (U o
o CO
E 03 0) u 4-) CO
I -0)
•— L.
03 O
H)
o IZ
in 01
CD
eg z
(U > 03 > (U — •o (U (1) z
0) >
r—
03 >
>« 4-> (U
«4-03 in
4-> 3 O
i U
.— CQ
^-> 3 o F 01 (U L. 4-) CO
L. (U • >_ L-03
O
39
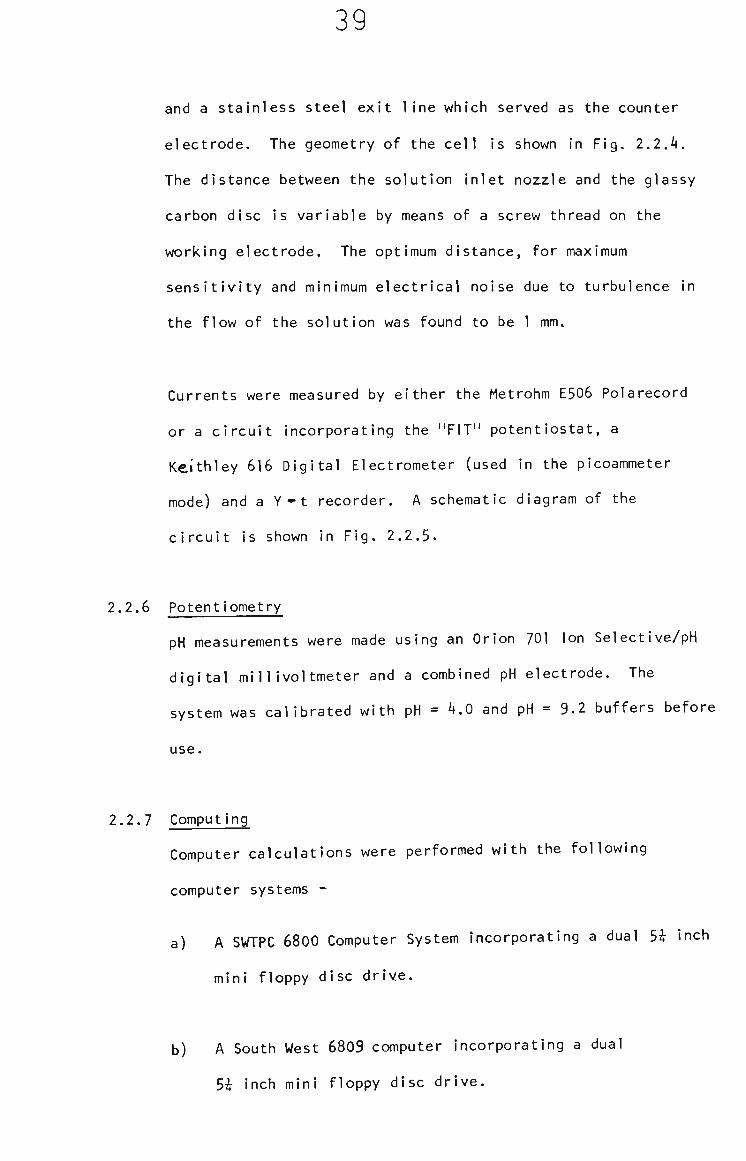
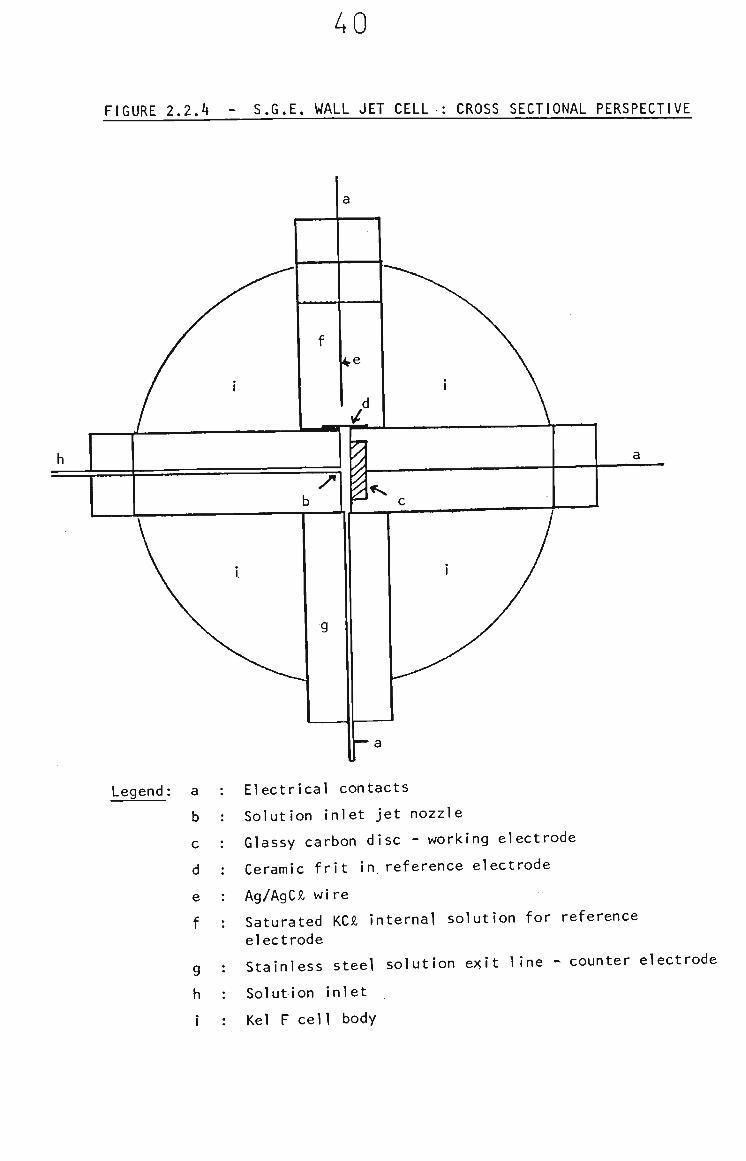
and a stainless steel exit line which served as the counter
electrode. The geometry of the cell is shown in Fig. 2.2.4.
The distance between the solution inlet nozzle and the glassy
carbon disc is variable by means of a screw thread on the
working electrode. The optimum distance, for maximum
sensitivity and minimum electrical noise due to turbulence In
the flow of the solution was found to be 1 mm.
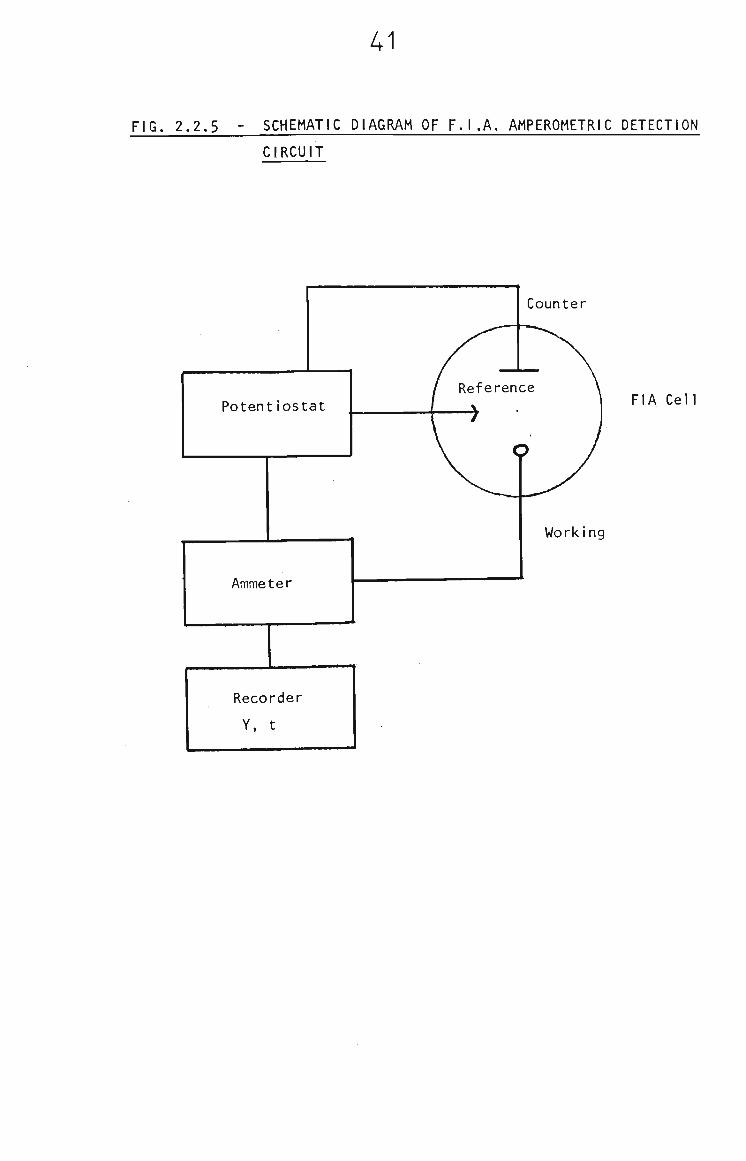
Currents were measured by either the Metrohm E506 Polarecord
or a circuit incorporating the "FIT" potentiostat, a
Keithley 616 Digital Electrometer (used in the picoammeter
mode) and a Y-t recorder, A schematic diagram of the
circuit is shown in Fig. 2.2.5.
2.2.6 Potentlometry
pH measurements were made using an Orion 701 Ion Selectlve/pH
digital mi 11ivoltmeter and a combined pH electrode. The
system was calibrated with pH = 4.0 and pH = 9.2 buffers before
use.
2.2.7 Computing
Computer calculations were performed with the following
computer systems -
a) A SWTPC 6800 Computer System incorporating a dual 5i inch
mini floppy disc drive.
b) A South West 6809 computer incorporating a dual
Si; inch mini floppy disc drive.
AO
FIGURE 2.2.4 - S.G.E, WALL JET CELL : CROSS SECTIONAL PERSPECTIVE
Legend: a
b
c
d
e
f
g
h
Electrical contacts
Solution inlet jet nozzle
Glassy carbon disc - working electrode
Ceramic frit in reference electrode
Ag/AgCJl wire
Saturated KCJl internal solution for reference
electrode
Stainless steel solution e> it line - counter electrode
Solution inlet
Kel F cell body
41
FIG. 2,2,5 - SCHEMATIC DIAGRAM OF F,I.A, AMPEROMETRIC DETECTION
CIRCUIT
Potentiostat
Ammeter
Recorder
Y, t
Counter
FIA Cell
Working
42
c) An Apple l l / e computer system inco rpo ra t i ng a 5 i Inch
min i f l oppy d isc d r i v e .
A l l programs were w r i t t e n in BASIC and are set out in
appendices I to I I I .
2.3 Elect rodes
2.3.1 Reference Electrodes
Reference electrodes employed in voltammetry and PRA were
Ag/AgCA saturated KCl. In some instances a 10^ KNO3 salt
bridge was employed; in these cases reference Is made in the
text. The junctions employed were all sintered glass frits.
In flow injection analysis an Ag/AgCA saturated KCii, reference
supplied with the SGE flow cell was employed. This
electrode has a ceramic frit junction.
2.3.2 Counter Electrodes
In voltammetry and PRA, platinum wire electrodes were
employed. In flow injection analysis the stainless steel
solution exit line was employed as the counter electrode,
2.3.3 Working Electrodes
In voltammetry both the Metrohm EA276 glassy carbon and the
Metrohm EA267 carbon paste electrodes were employed. In PRA
both glassy carbon and carbon paste electrode materials were
employed. These electrodes are supplied as screw-on tips
to the Beckmann rotating electrode apparatus. In flow
injection analysis only the glassy carbon electrode supplied
43
with the S.G.E. wall jet detector was employed. The soft
nature of carbon paste makes it unsuitable in wall jet
detectors
2.4 Preparation of Electrodes
2.4.1 Reference Electrodes
All reference electrodes were thoroughly rinsed with high
purity water and blotted dry with a tissue before use.
2.4.2 Counter Electrodes
Platinum wire electrodes were cleaned in chromic acid, rinsed
thoroughly with high purity water and blotted dry with a tissue
before use..
2.4.3 Working Electrodes
2.4.3.1 Glassy Carbon Electrodes (G.C.E.)
These electrodes were polished with a waterValumina paste
(provided with the Metrohm EA276 Glassy Carbon Electrode) on
a horizontal smooth surface until a mirror finish was
obtained and no scratches were visible on the electrode
surface. The electrodes were rinsed thoroughly with high
purity water before use,
2.4.3.2 Carbon Paste Electrodes (C.P.E.)
The technical literature for the Metrohm EA267 Carbon Paste
Electrode suggests soxjothing off the carbon paste surface on
fine filter paper to give a reproducible electrode surface
area. Using Whatman No, 1 filter paper, this technique gave
only fair results, enabling relative standard deviations
44
(RSD) of 4 to S% to be achieved in voltammetric analysis.
Using Whatman 'Benchkote' protective paper It was found
that reproducibility (RSD) of 2% could be achieved. This
material consists of fine paper coated on one side with a
polyethylene film. The carbon paste was extruded out of the
electrode (for Metrohm EA267) barrel to a distance of 2 mm
and this material was wiped off onto the paper side of the
'Benchkote'. This gives a clean yet roughened surface which
is then wiped on the polyethylene side to produce a very
smooth, clean surface.
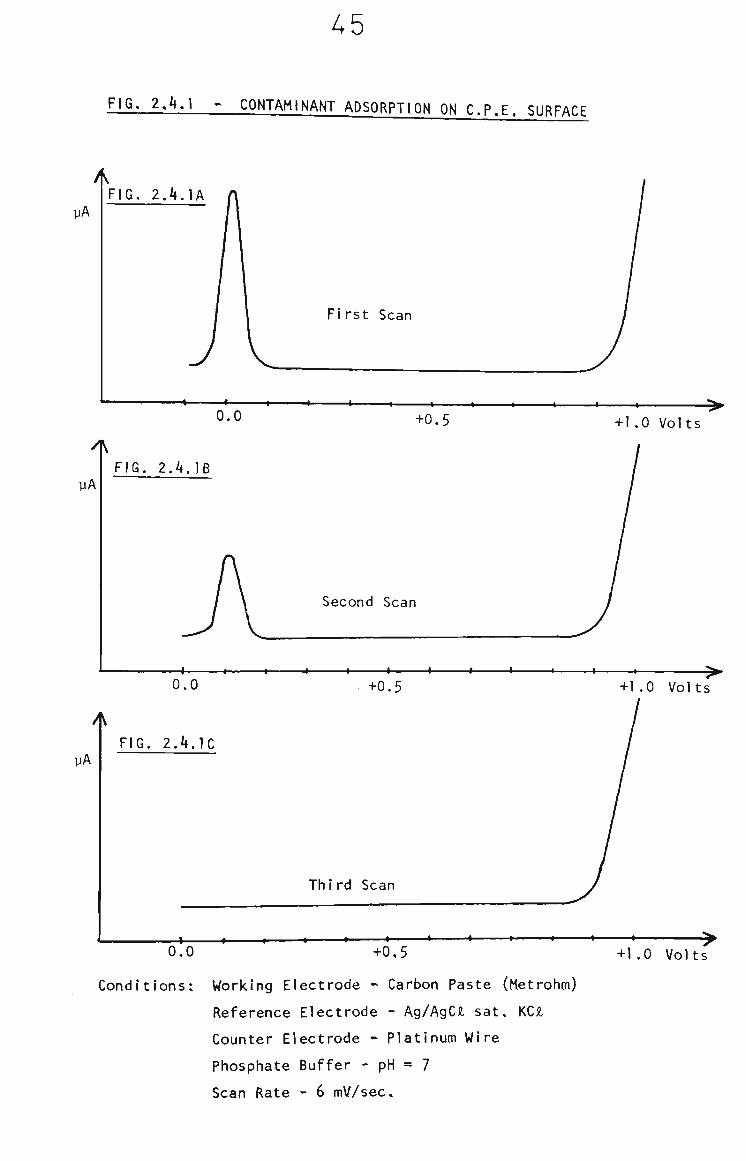
It was observed that In some cases surface contamination
could occur. This resulted in a sharp peak being recorded
on voltammograms as shown in Fig. 2.4,1A. This peak was
verified as adsorption of an electroactive surface
contaminant by repetitive voltammetric scans. After one
or two scans, on the same surface, the peak disappears
from the voltammograms. This Indicates that the
contaminant was adsorbed onto the surface, prior to insertion
into the solution, and is removed by the oxidative scan.
The effect is demonstrated in Fig. 2.4.lA, B & C.
2.4.4 Survey of electrode smoothing materials
A survey of various smoothing materials was carried out to
locate the source of the adsorbing species. In each experiment
new carbon paste surfaces were prepared and voltammograms
recorded from 0.0\f to -l .5V versus a Ag/AgCA saturated KCl
electrode. The results of the survey are presented In
Table 2.4.1. All materials were obtained from unopened packages
unless otherwise stated.
A5
FIG. 2.4.1 > CONTAMINANT ADSORPTION ON C.P.E. SURFACE
yA FIG. 2.4.lA
First Scan
0.0 I I I — « — — t I I 1 ^
+0.5 +1,0 Volts
yA FIG. 2.4.18
Second Scan
< I 1 1 I 1 1 I 1 •-
UA
0.0
FIG. 2.4.1C
-t-0.5
Third Scan
+1.0 Volts
\ t r — » I « » » « » « ' ^
0.0 -1-0,5 -H.O Volts
Conditions: Working Electrode - Carbon Paste (Metrohm)
Reference Electrode - Ag/AgCi sat, KCJl
Counter Electrode - Platinum Wire
Phosphate Buffer - pH = 7
Scan Rate - 6 mV/sec.

46
TABLE 2.4.1 - A Survey of Smoothing Materials for Carbon Paste
Electrode (CPE) Surfaces
Smoothing Material
Whatman No. 1 Fl1ter Paper
Paper Chosen at random
Filter Paper from an old opened packet
Whatman No. 40 Ashless FiIter Paper
Whatman No. 42 Ashless Filter Paper
Whatman No. 43 Ashless Filter Paper (Old opened packet)
Whatman No. 54 Hardened Filter Paper
Whatman No. 541 Hardened Ashless Filter Paper
Whatman No. 542 Hardened Ashless Filter Paper
Toyo No. 1 Filter Paper
M.N. Duren Nr. I640m Filter Paper
Comment on Voltammogram
Adsorption peak observed at - 0,l IV
Adsorption peak observed at +0.1IV
Adsorption peak observed at +0,18V
Adsorption peak observed at +0.18V
Adsorption peak observed at +0.18V
Adsorption peak observed at +0.1IV
Adsorption peak observed at +0.1IV
Adsorption peak observed at +0.1IV
Adsorption peak observed at +0.1IV
Adsorption peak observed at +0,1IV
Suitability for CPE Preparation
Unsuitable
Unsuitable
Unsui table
Unsuitable
Unsui table
Unsuitalbe
Unsuitable
Unsuitable
Unsuitable
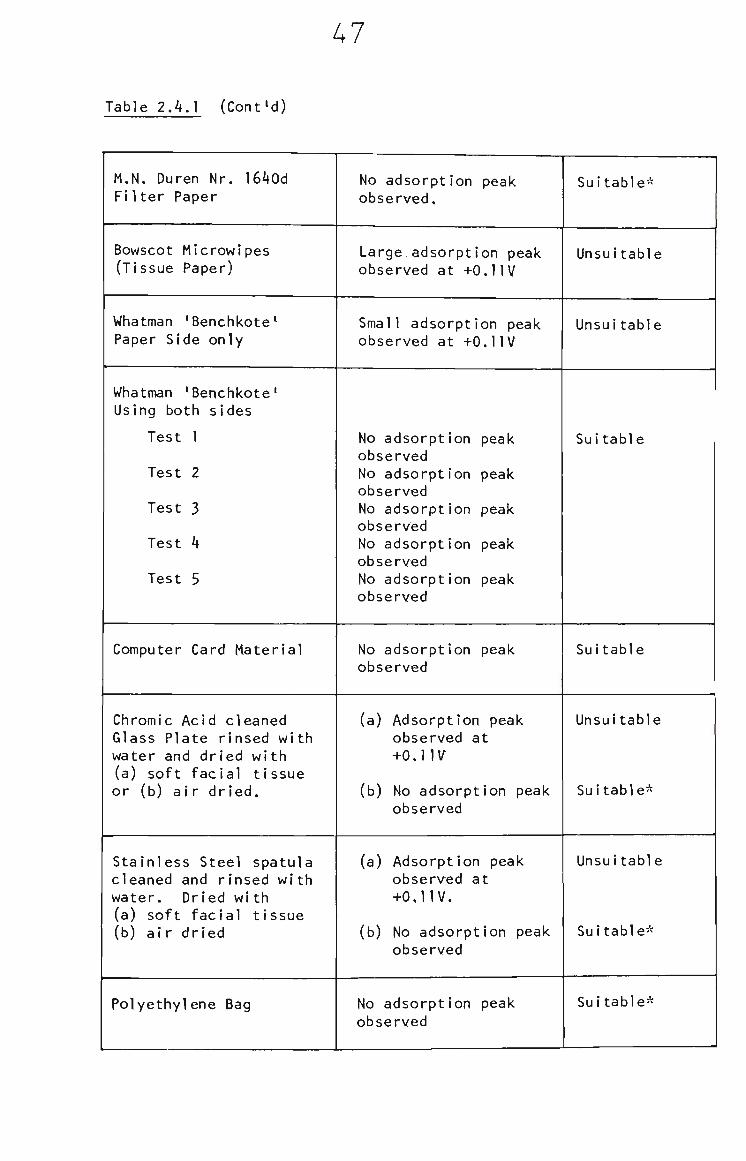
Table 2.4.1 (Cont'd)
47
M.N. Duren Nr. I640d Filter Paper
Bowscot Microwipes (Tissue Paper)
Whatman 'Benchkote^ Paper Side only
Whatman 'Benchkote' Using both sides
Test 1
Test 2
Test 3
Test 4
Test 5
Computer Card Material
Chromic Acid cleaned Glass Plate rinsed with water and dried with (a) soft facial tissue or (b) air dried.
Stainless Steel spatula cleaned and rinsed with water. Dried with (a) soft facial tissue (b) air dried
Polyethylene Bag
No adsorption peak observed.
Large adsorption peak observed at +0.1IV
Small adsorption peak observed at +0.1IV
No adsorption peak observed No adsorption peak observed No adsorption peak observed No adsorption peak observed No adsorption peak observed
No adsorption peak observed
(a) Adsorption peak observed at
+o,nv^
(b) No adsorption peak observed
(a) Adsorption peak observed at +0,1IV,
(b) No adsorption peak observed
No adsorption peak observed
Suitable*
Unsuitable
Unsui table
Suitable
Suitable
Unsuitable
Suitable-
Unsuitable
Suitable*
Suitable*
48
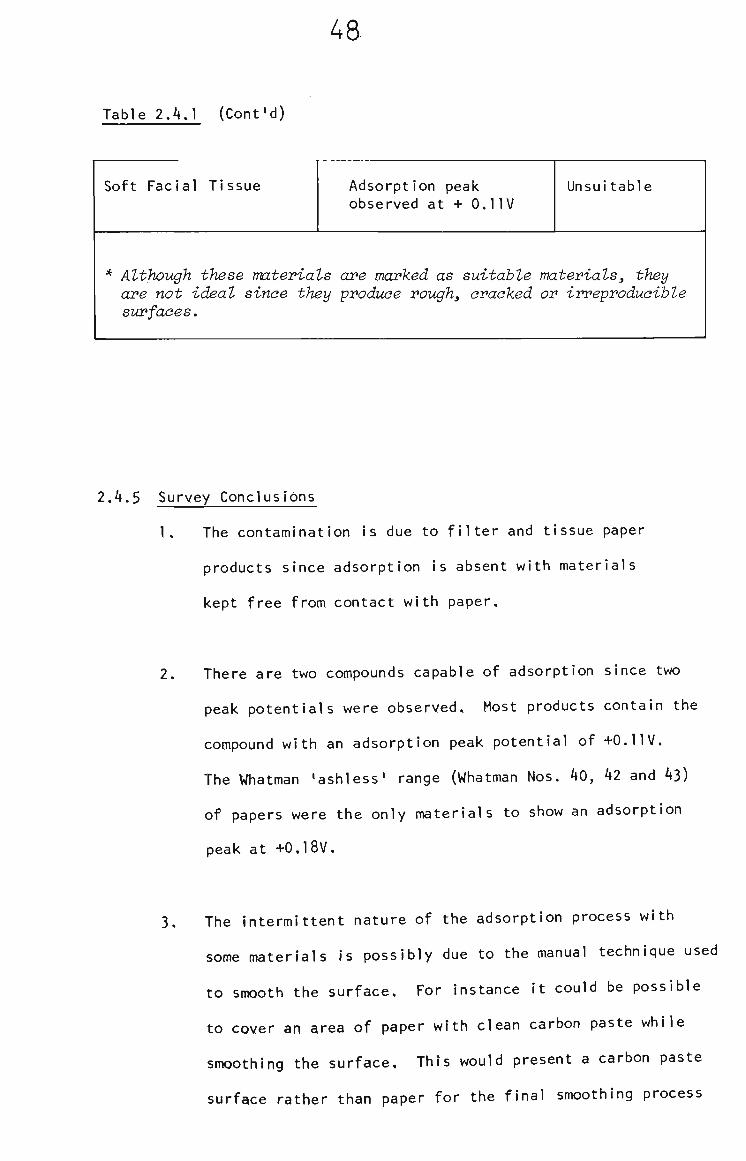
Table 2.4.1 (Cont'd)
Soft Facial Tissue Adsorption peak observed at + 0.1IV
Unsuitable
* Although these materials are marked as suitable materials, they are not ideal since they produce rough, cracked or irreproducible surfaces.
2.4.5 Survey Conclusions
\. The contamination is due to filter and tissue paper
products since adsorption is absent with materials
kept free from contact with paper,
2. There are two compounds capable of adsorption since two
peak potentials were observed. Most products contain the
compound with an adsorption peak potential of +0.1IV,
The Whatman 'ashless* range (Whatman Nos, 40, 42 and 43)
of papers were the only materials to show an adsorption
peak at +0.18V.
3, The intermittent nature of the adsorption process with
some materials is possibly due to the manual technique used
to smooth the surface. For instance it could be possible
to cover an area of paper with clean carbon paste while
smoothing the surface. This would present a carbon paste
surface rather than paper for the final smoothing process
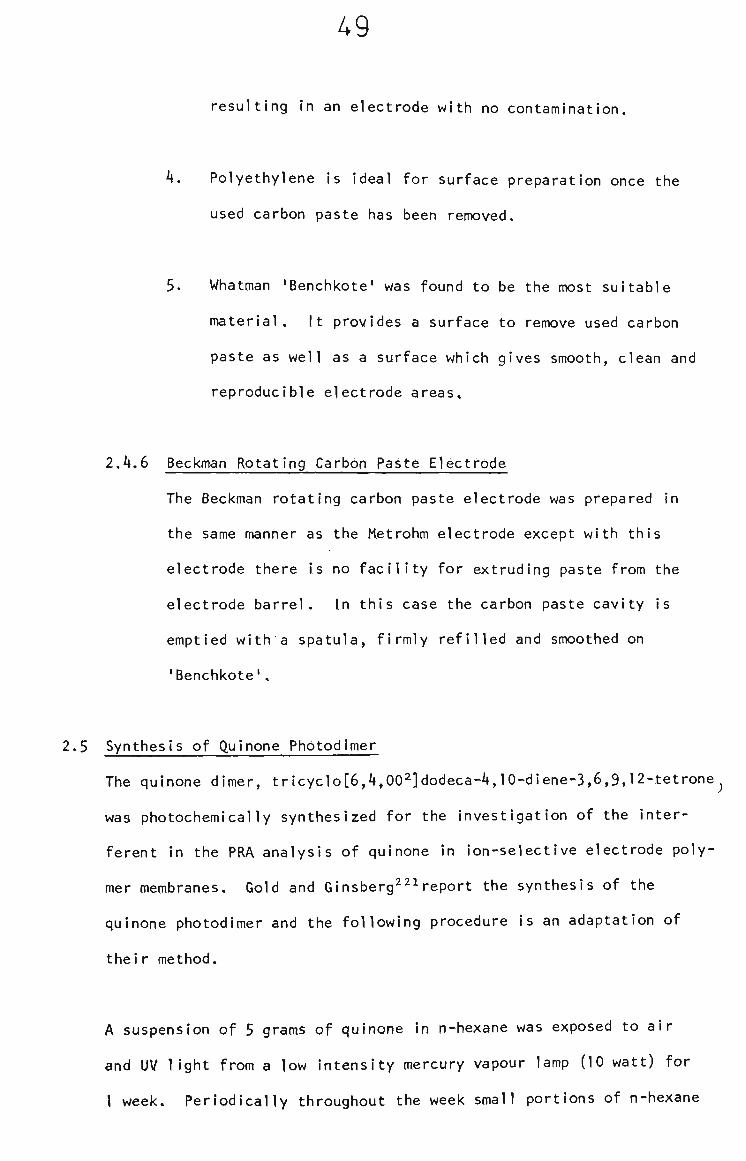
49
resulting in an electrode with no contamination.
4. Polyethylene is ideal for surface preparation once the
used carbon paste has been removed.
5. Whatman 'Benchkote' was found to be the most suitable
material. It provides a surface to remove used carbon
paste as well as a surface which gives smooth, clean and
reproducible electrode areas.
2.4.6 Beckman Rotating Carbon Paste Electrode
The Beckman rotating carbon paste electrode was prepared in
the same manner as the Metrohm electrode except with this
electrode there is no facility for extruding paste from the
electrode barrel. In this case the carbon paste cavity is
emptied with a spatula, firmly refilled and smoothed on
'Benchkote'.
2.5 Synthesis of Quinone Photodimer
The quinone dimer, tricyclo[6,4,00^]dodeca-4,l0-diene-3,6,9,l2-tetrone^
was photochemically synthesized for the investigation of the inter
ferent in the PRA analysis of quinone in ion-selective electrode poly
mer membranes. Gold and Ginsberg^^!report the synthesis of the
quinone photodimer and the following procedure is an adaptation of
their method.
A suspension of 5 grams of quinone in n-hexane was exposed to air
and UV light from a low intensity mercury vapour lamp (10 watt) for
I week. Periodically throughout the week small portions of n-hexane
50
were added to the suspension to replace that lost by evaporation. The
reaction mixture was filtered and the solid residue washed with
dlethylether. Quinone is quite soluble in ether whereas the dimer
is not. Therefore the ether washing was continued until the
filtrate was colorless and only deep purple-red colored crystals of
the dimer remained. The reaction yielded only S% dimer but this was
sufficient for the interference study.
The identity of the product was confirmed by melting point, solubility
tests, infra-red and UV spectroscopy and comparison with the data
reported by Gold and Ginsberg,
2.6 purification of Tetrahydrofuran
To investigate the effect of the presence of tetrahydrofuran (THF) on
the electrochemistry of quinol and quinone samples of pure, quinold
free, THF were required. Since unstabilized THF Is expensive
and forms dangerous peroxides it was decided to remove the stabilizer
from small quantities of THF as necessary in the course of the
investigation. This provides safe quantities which are free of
peroxides.
About 50 ml of quinol stabilized THF is allowed to percolate through
a dry activated alumina chromatography column (4 cm in diameter x
12 cm in length). The first 5 ml eluted is discarded and the next 25 ml
is collected. The purification of the THF was confirmed by UV
spectroscopy.
51
2.7 Analytical Procedures for Quinol In THF
2.7.1 Pulsed Rotation Amperometry (PRA)
THF samples (1.0 ml) were diluted one hundred-fold in pH = 7
phosphate buffer (O.IM KzHPO.* and O.IM KHzPOi* and adjusted
to pH = 7.0 with either KOH or HJpO^) and 30,0 ml was used as
the test solution.
The PRA cell consisted of a rotating glassy carbon disc, a
Ag/AgC£ saturated KCJl reference and a platinum counter
electrode. The PRA step height, Ai, was measured in triplicate
by changing the rotation rate between 2 and 20 rps and
employing a DC detection potential of O.36 Volts.
Quantitation was achieved by standard additions of 5 yg/ml
quinol in phosphate buffer containing l^ purified THF. Ai
was determined in triplicate after each addition.
2.7.2 Flow Injection Analysis
The test solution was prepared by one hundred-fold dilution of
the THF samples (1,0 ml) in pH = 7 phosphate buffer.
A carrier stream flowing at 1 ml/minute and consisting of pH = 7
phosphate buffer which contained \% purified THF was employed.
The DC detection potential was +0.6 volts versus an Ag/AgCJl
saturated KCJl reference electrode. Three, 90 yL, volumes of
the test solution were Injected and each corresponding peak
height measured. Quantitation was achieved by comparison with
a calibration graph. The calibration data were recorded Just
prior to sample injection and identical conditions were employed.
52
Peristaltic pumping and the loop injector were employed in
these determinations,
2.7.3 U.V. Spectrophotometry
The test solution was prepared by dilution of the THF samples
(l.O ml) one hundred-fold in pH = 7 phosphate buffer.
The absorbance of the test solution is measured at 288 nm
versus a reference cell containing U purified THF in pH = 7
phosphate buffer. 1 cm path length quartz cells were employed.
Quantitation was achieved by comparison with a calibration
graph. The calibration data were obtained by measurement
of the absorbance of quinol standard solutions prepared from
pH = 7 phosphate buffer containing 1^ purified THF,
2.8 Analytical Procedures for Quinone in THF
All test solutions were prepared by dilution of THF one hundred-fold
in pH = 7 phosphate buffer.
2.8.1 Pulsed Rotation Amperometry
Quinone was determined by the same procedure as for quinol
except that a detection potential of -0.15 Volts versus
the Ag/AgCJl saturated KCJl reference was employed. The
standard additions standard solution was 10 yg/ml quinone.
53
2.8.2 Flow Injection Analysis
Quinone was determined by the same procedure as for
quinol except that a detection potential of -0.15 Volts
versus the Ag/AgCJl saturated KCJl reference was employed,
Also the test solution was introduced into the carrier
stream by 10 yL syringe via the injection port of the
Metrohm FIA stand. The Metrohm gas pressure pump was
employed.
2.8.3 U.V. Spectrophotometry
Quinone was determined by the same procedure as for quinol
except that absorbances were measured at 243 nm.
2.9 Analytical Procedures for Quinol and Quinone In ton selective
Electrode Polymer Membranes
2.9.1 Preparation of Fresh Membranes
Powdered PVC (0,35 g) and Aliquat 336 (0.65 g) were blended
together in a minimum (3~5 ml) of quinol stabilized THF until
a clear homogeneous and viscous solution was obtained. The
solution was then poured onto a glass plate with a
glass restraining ring. The THF was allowed to evaporate
slowly through a filter paper cover placed over the ring to
avoid contact with the mixture. After 2 days the polymer
membrane was peeled off the glass plate and cut into segments
for analysis.

54
2.9.2 Sample Treatment
All membrane samples (10 to 20 mg) were dissolved in purified
THF and made up to 25.0 ml. Aliquots of these solutions were
diluted in the analysis medium just prior to measurement.
2.9.3 Pulsed Rotation Amperometry
a) Recovery of Quinol from Sample Matrix
To test the recovery of quinol from the membranes a known
solution containing 10 yg/ml quinol, 0.35 mg/ml PVC and
0.65 mg/ml Aliquat 336 in 25,0 ml purified THF was employed
Quinol was determined by standard additions under the
following conditions.
Test solution: 20.0 ml pH = 7 phosphate buffer plus
0.5 ml of known THF solution.
PRA conditions: Rotating Glassy Carbon Disc at a
detection potential of +0,36 V versus
an Ag/AgCA saturated KCJl reference.
Platinum counter electrode,
Ai determined by changing rotation rate
between 5 and 50 r,p,s,
b) Analysis of Membranes for Quinol
The test solutions were 20.0 ml of pH = 7 phosphate buffer
to which 2»0 ml of THF sample solution was added,
Quinol was determined by standard additions. The
standard solution was 5 yg/ml quinol in phosphate buffer
(pH = 7) containing 3% purified THF.
55
A rotating glassy carbon disc at a detection potential
of +0.36 Volts versus an Ag/AgCJl saturated KCJl reference
and platinum counter electrode were used, AI was measured
by changing the rotation rate between 9 and 90 r.p.s.
Sample blanks were also determined by the same procedure.
c) Recovery of Quinone from Sample Matrix
A known solution containing 10 yg/ml quinone , 0,35 mg/ml
PVC and 0,65 mg/ml Aliquat 336 in purified THF was
investigated. The following conditions were employed.
Test solution: 20.0 ml pH = 7 phosphate buffer plus
0.5 ml of known THF solution.
PRA conditions: Rotating Glassy Carbon Disc at a
detection potential of -0.15 Volts versus
an Ag/AgCJl saturated KCJl reference. A
platinum counter electrode. Ai was
determined by changing the rotation rate
between 9 and 90 r.p.s.
d) Analysis of Membranes for Quinone
The test solutions were 20.0 ml of pH = 7 phosphate
buffer plus 0.5 ml of the THF sample solution. Quinone
was determined by standard additions. The standard
solution was 5 yg/ml quinone In phosphate buffer (pH = 7)
containing 2.5^ purified THF.
56
A rotating glassy carbon disc at a detection potential
of --0.15 Volts versus an Ag/AgCJl saturated KCJl reference
and a platinum counter electrode were employed. Ai was
measured by changing the rotation rate between 9 and 90
r.p.s.
Sample blanks were also determined by the same procedure.
2.9.4 U.V. Spectrophotometry
Small aliquots of the THF sample solution (0,5 ml) were
diluted tenfold in purified THF. Absorbance measurements of
these solutions were taken at 288 nm for quinol and 243 nm for
quinone. The reference cell contained a purified THF solution
of PVC and Aliquat 336 in a ratio equivalent to the test
solution.
Quantitation was achieved by comparison with calibration
graphs. The calibration data w<2(? recorded employing identical
conditions to the test solutions.
2.10 Analytical Procedures for Theophyl1ine Determination by P.R.A.
Theophylline was determined in three pharmaceutical products by
pulsed rotation amperometry.
57
2.10.1 NuelI In Cough Syrup
Samples of the syrup were diluted one hundred-fold in pH = 7
phosphate buffer and then 5,0 ml of this solution was added to
40.0 ml of buffer in the PR/\.ce|l. Duplicate measurements of
the step height, Ai, were recorded using a new carbon paste
surface for each measurement»
Quantitation was achieved by standard additions. The standard
solution was lOl yg/ml theophylline in phosphate buffer (pH = 7).
The following PRA conditions were employed.
A rotating bevelled tip carbon paste electrode at a DC detect
ion potential of 1.16 Volts versus an Ag/AgCJl saturated KCJl/10%
KNO3 salt bridge reference and a platinum counter electrode
were used. The step height Ai was produced by firstly applying
the detection potential to the carbon paste electrode rotating
at 5 r.p.s. and then exactly 20 seconds later changing the
rotation rate to 50 r.p.s.
2.10.2 ElixophylI in Cough Syfup
Samples of the syrup were diluted two hundred-fold in pH = 7
phosphate buffer. This solution was analyzed by the same
procedure as for Nuellin Syrup.
2.10.3 Aminophyl1ine Injection
Sigma Pharmaceuticals Pty. Ltd. provided an analyzed quality
control sample of an intravenous aminophyl1ine injection. The
sample was labelled as follows, "SIGMA-AMINOPHYLLINE B.P.
0.25 g in 10 ml for I.V. ( B ) AMUO-^' and SIgma's assay value was
58
21.3 mg/ml theophylline by UV spectrophotometry.
One (1.0) ml of the sample was diluted to 200 ml with pH = 7
phosphate buffer and 5.0 ml of this solution was added to
40.0 ml of buffer in the PRA cell. Duplicate measurements
of the step height, Ai, were recorded using a new carbon paste
surface for each measurement.
Quantitation was achieved by standard additions. The standard
solution was 101 yg/ml theophylline in phosphate buffer
(pH = 7).
The PRA conditions were as follows. A rotating bevelled tip
carbon paste electrode at a DC detection potential of +1.10
Volts versus an Ag/AgCJl saturated KCJl/lO^ KNO3 salt bridge
reference and a platinum counter electrode were employed.
The step height, Ai, was produced as in section 2.10.1.
59
CHAPTER 3
The Electroanalytical Determination
of
Quinol and Quinone in Tetrahydrofuran
and
Ion-Selective Electrode Polymer Membranes
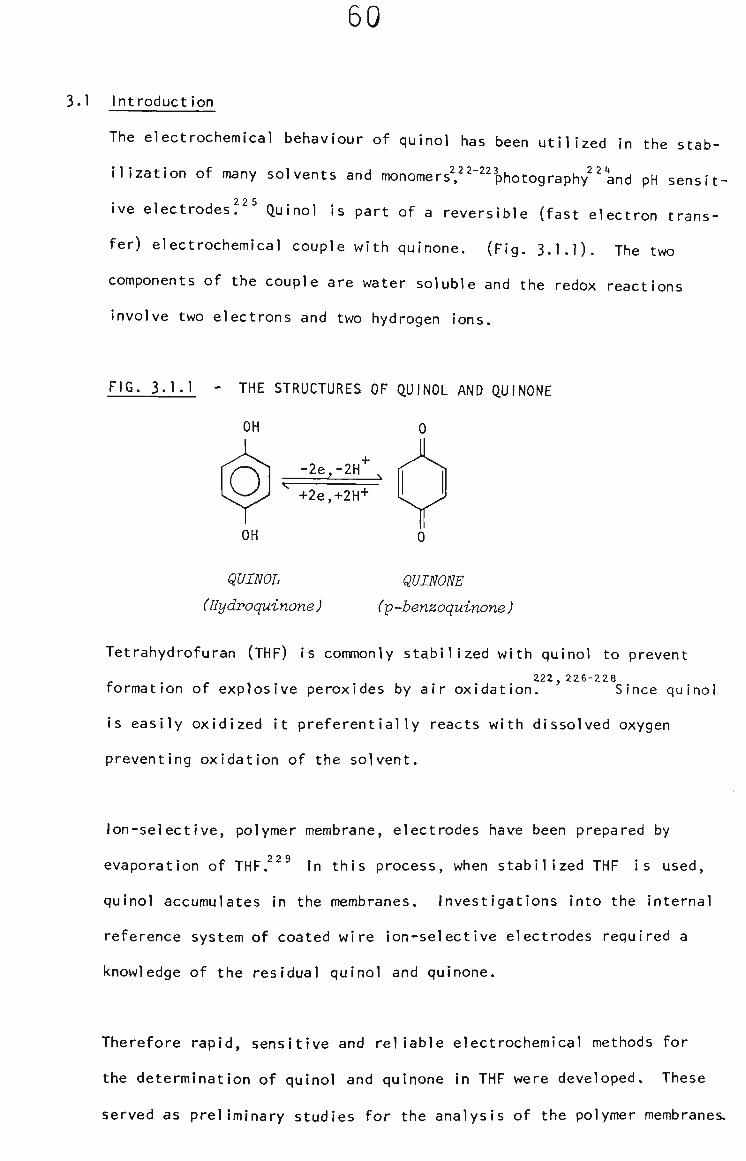
60
3.1 Introduction
The electrochemical behaviour of quinol has been utilized in the stab
ilization of many solvents and monomers^,"'^^^hotography^^ and pH sensit
ive electrodes?^^ Quinol is part of a reversible (fast electron trans
fer) electrochemical couple with quinone. (Fig. 3.1.1). The two
components of the couple are water soluble and the redox reactions
Involve two electrons and two hydrogen ions.
FIG. 3.1.1 - THE STRUCTURES OF QUINOL AND QUINONE
-2e,-2H"^ ,
+2e,+2H+
QUINOL QUINONE
(Hydroquinone) (p-benzoquinone)
Tetrahydrofuran (THF) is commonly stabilized with quinol to prevent
222,226-228
formation of explosive peroxides by air oxidation. Since quinol
is easily oxidized it preferentially reacts with dissolved oxygen
preventing oxidation of the solvent.
Ion-selective, polymer membrane, electrodes have been prepared by
evaporation of THF.^^® In this process, when stabilized THF is used,
quinol accumulates in the membranes. Investigations into the internal
reference system of coated wire ion-selective electrodes required a
knowledge of the residual quinol and quinone.
Therefore rapid, sensitive and reliable electrochemical methods for
the determination of quinol and quinone In THF were developed. These
served as preliminary studies for the analysis of the polymer membranes.
61
Modern electrochemical instrumentation and the range of electrode
materials available enable the analyst to select from a wide variety
of techniques. The following techniques were investigated at glassy
carbon and carbon paste electrodes.
Voltammetry: DC, AC and Differential Pulse
Amperometry: Flow Injection Analysis (FIA) and Pulsed
Rotation Amperometry (PRA)
The amperometric methods are faster than voltammetry and provide
easier quantitation of the current signals. FIA uses small sample
volumes. PRA provides the best sensitivity without loss in precision
and is particularly useful for organic analytes In complex media.
3.2 Quinol and Quinone in Tetrahydrofuran
3.2.1 Voltammetric Behaviour in the Presence of THF
The effect of THF on the voltammetric behaviour of quinol and
quinone in pH 7 phosphate buffer medium was investigated with
cyclic voltammetry at a rotating glassy carbon disc electrode.
Hydrodynamic conditions were employed so that the results would
be applicable to PRA and FIA.
The concentration of THF and analytes used represent diluting
stabilized THF one hundred-fold in buffer. The manufacturers
label states that quinol is present at O.U.
Several voltammograms of quinol in buffer were recorded. The
solution was adjusted to 1^ THF by the addition of purified THF
and the voltammograms recorded again. (See Fig. 3.2.1). The
wave height for quinol was reduced In magnitude by 4^ in the
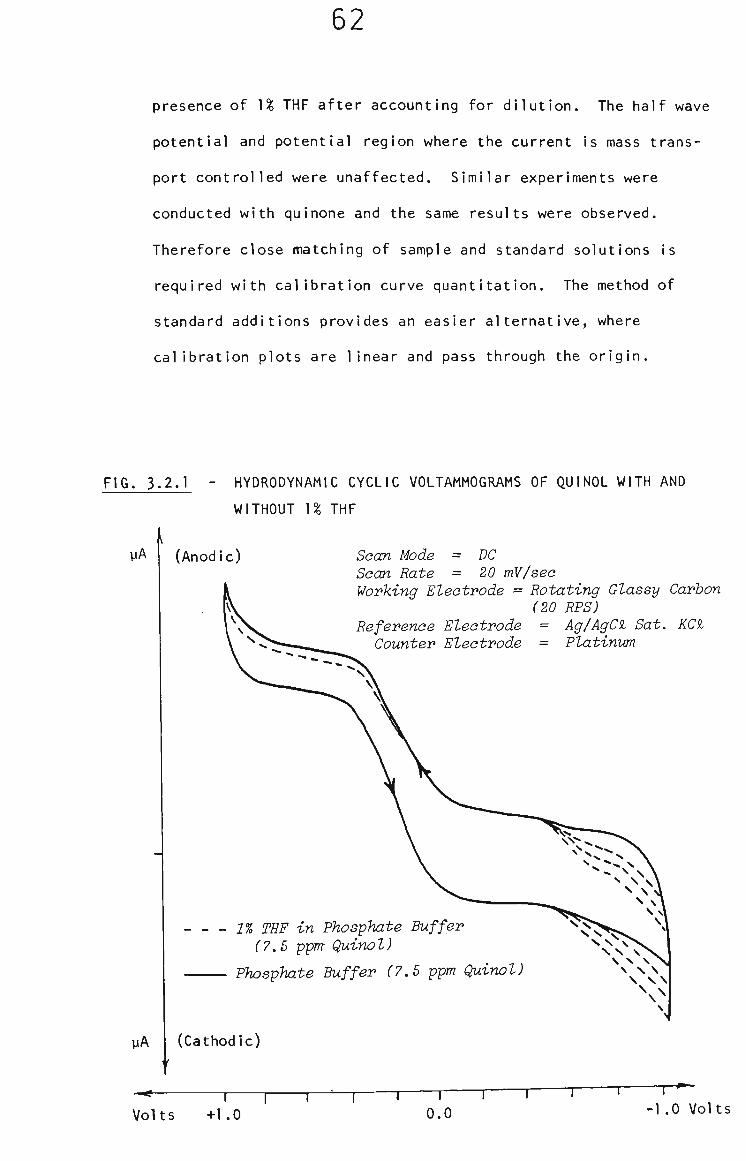
62
presence of \% THF after accounting for dilution. The half wave
potential and potential region where the current Is mass trans
port controlled were unaffected. Similar experiments were
conducted with quinone and the same results were observed.
Therefore close matching of sample and standard solutions is
required with calibration curve quantitation. The method of
standard additions provides an easier alternative, where
calibration plots are linear and pass through the origin.
FIG. 3.2.1 - HYDRODYNAMIC CYCLIC VOLTAMMOGRAMS OF QUINOL WITH AND
WITHOUT U THF
yA (Anodic) Scan Mode = DC Scan Rate = 20 mV/sec Working Electrode = Rotating Glassy Carbon
(20 RPS) Reference Electrode = Ag/AgCl Sat. KCl
Counter Electrode = Platinum
yA
- 1% THF in Phosphate Buffer (7.5 ppm Quinol)
Phosphate Buffer (7.5 ppm Quinol)
(Cathodic)
-= 1 ^ r Volts +1.0
T T"—1 r 0.0
T r - ^ -1.0 Volts
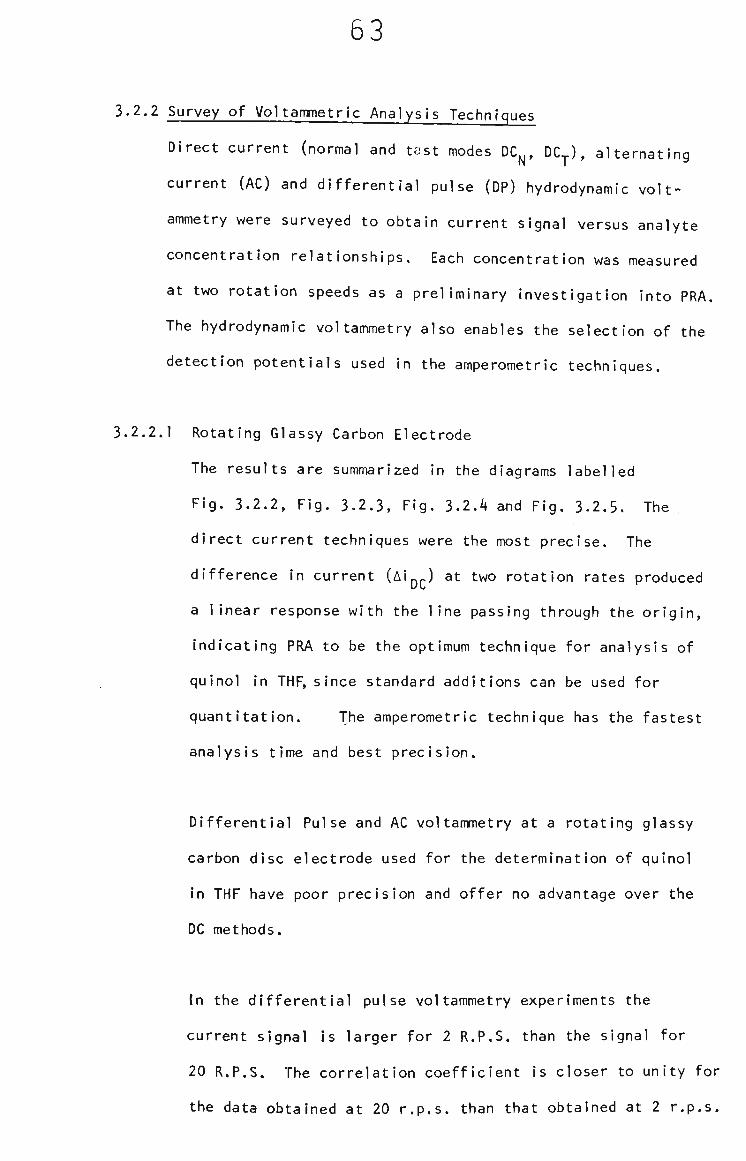
53
3.2.2 Survey of Voltammetric Analysis Techniques
Direct current (normal and tast modes DC^, DC.^), alternating
current (AC) and differential pulse (DP) hydrodynamic volt
ammetry were surveyed to obtain current signal versus analyte
concentration relationships. Each concentration was measured
at two rotation speeds as a preliminary investigation into PRA.
The hydrodynamic voltammetry also enables the selection of the
detection potentials used in the amperometric techniques.
3.2.2.1 Rotating Glassy Carbon Electrode
The results are summarized In the diagrams labelled
Fig. 3.2.2, Fig. 3.2.3, Fig. 3.2.4 and Fig. 3.2.5. The .
direct current techniques were the most precise. The
difference in current (Alp-) at two rotation rates produced
a linear response with the line passing through the origin,
indicating PRA to be the optimum technique for analysis of
quinol in THF, since standard additions can be used for
quantitation. The amperometric technique has the fastest
analysis time and best precision.
Differential Pulse and AC voltammetry at a rotating glassy
carbon disc electrode used for the determination of quinol
in THF have poor precision and offer no advantage over the
DC methods.
In the differential pulse voltammetry experiments the
current signal is larger for 2 R.P.S. than the signal for
20 R.P.S, The correlation coefficient is closer to unity for
the data obtained at 20 r.p,s. than that obtained at 2 r.p.s.
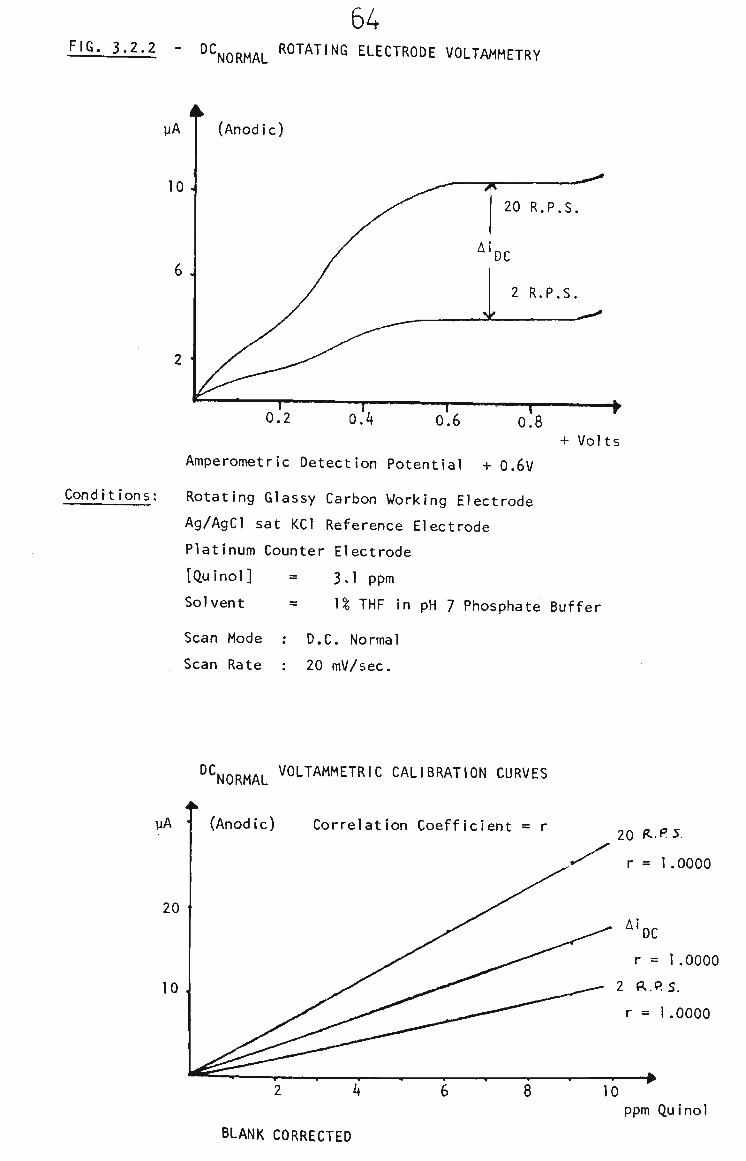
FIG. 3 . 2 . 2 - DC
64 NORMAL f^OTATING ELECTRODE VOLTAMMETRY
Cond i t ions :
+ Volts
Amperometric Detection Potential + 0.6V
Rotating Glassy Carbon Working Electrode
Ag/AgCl sat KCl Reference Electrode
Platinum Counter Electrode
[Quinol] = 3.1 ppm
Solvent = n THF in pH 7 Phosphate Buffer
Scan Mode
Scan Rate
D.C. Normal
20 mV/sec.
yA '
20
10
°SoRMAL VOLTAMMETRIC CALIBRATION CURVES
(Anodic) Correlation Coefficient = r
BLANK CORRECTED
20 f^f^
r = 1.0000
ppm Quinol
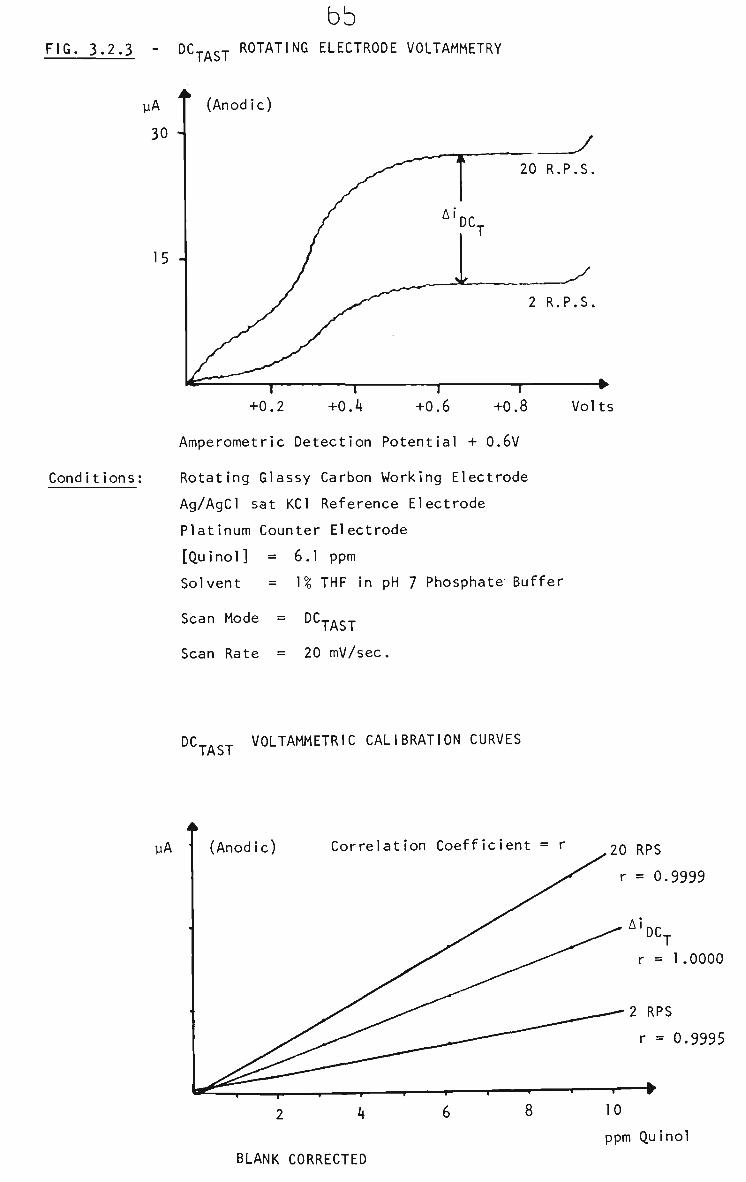
bb FIG. 3.2.3 - DCp^gy ROTATING ELECTRODE VOLTAMMETRY
yA
30
(Anodic)
Condi tions;
15 -
+0.2 +0.4 +0.6 +0.8 Volts
Amperometric Detection Potential + 0.6V
Rotating Glassy Carbon Working Electrode
Ag/AgCl sat KCl Reference Electrode
Platinum Counter Electrode
[Quinol] = 6.1 ppm
Solvent = U THF in pH 7 Phosphate Buffer
Scan Mode = DCj.--
Scan Rate = 20 mV/sec.
OC-.-^ VOLTAMMETRIC CALIBRATION CURVES
yA Correlation Coefficient = r ^20 RPS
r = 0.9999
T i l '
Ai DC,
_
10
ppm
r = 1.
I RPS
r = 0
F
Qui no
0000
.9995
I BLANK CORRECTED
66 FIG. 3.2.4 - DIFFERENTIAL PULSE ROTATING ELECTRODE VOLTAMMETRY
2 RPS
Volts
Conditions: Rotating Glassy Carbon Working Electrode
Ag/AgCl sat KCl Reference Electrode
Platinum Counter Electrode
[Quinol] = 3.6 ppm
Solvent = U THF - pH 7 Phosphate Buffer
Scan Mode = Differential Pulse - +20 mV Pulse
Scan Rate = 20 mV/sec.
DIFFERENTIAL PULSE VOLTAMMETRIC CALIBRATION CURVES
Correlation Coefficient = r 2 RPS r = 0.9801
20 RPS r = 0.9999
ppm Quinol
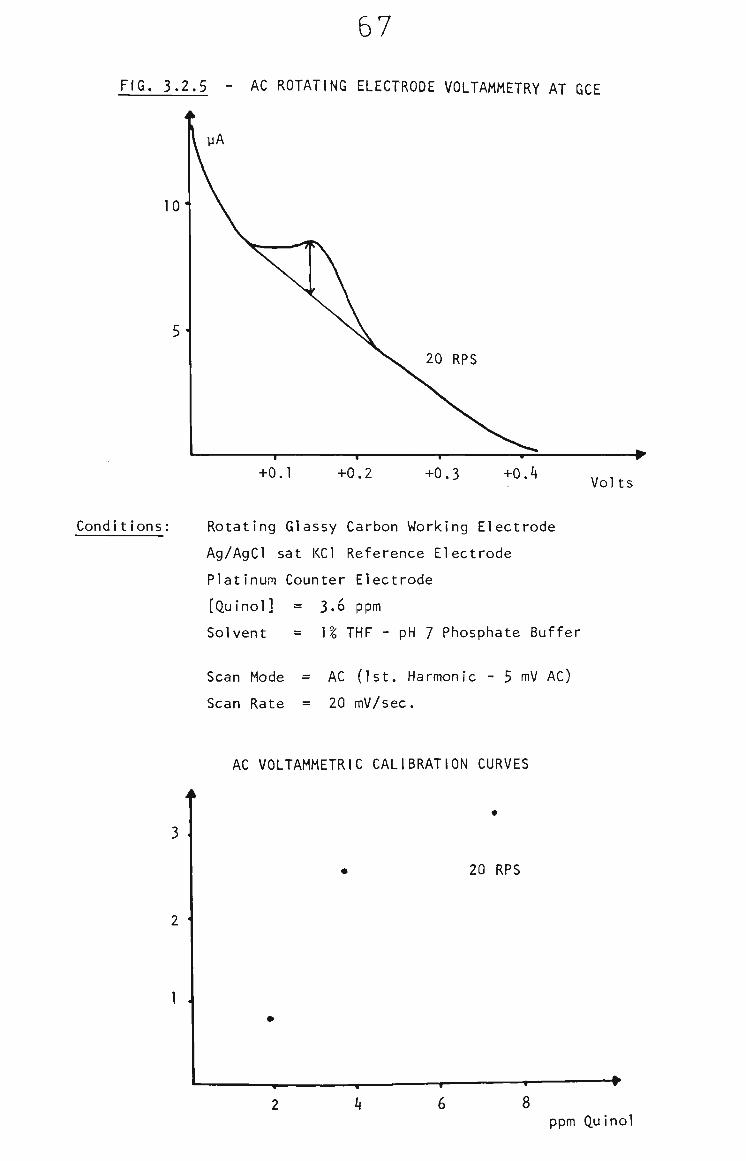
67
FIG. 3.2.5 - AC ROTATING ELECTRODE VOLTAMMETRY AT GCE
10-
+0.1 +0.2 +0.3 +0.4 Volts
Conditions; Rotating Glassy Carbon Working Electrode
Ag/AgCl sat KCl Reference Electrode
Platinum Counter Electrode
[Quinol] = 3.6 ppm
Solvent = U THF - pH 7 Phosphate Buffer
Scan Mode = AC (1st. Harmonic - 5 mV AC)
Scan Rate = 20 mV/sec.
AC VOLTAMMETRIC CALIBRATION CURVES
20 RPS
I .
-r-
6 8 ppm Quinol
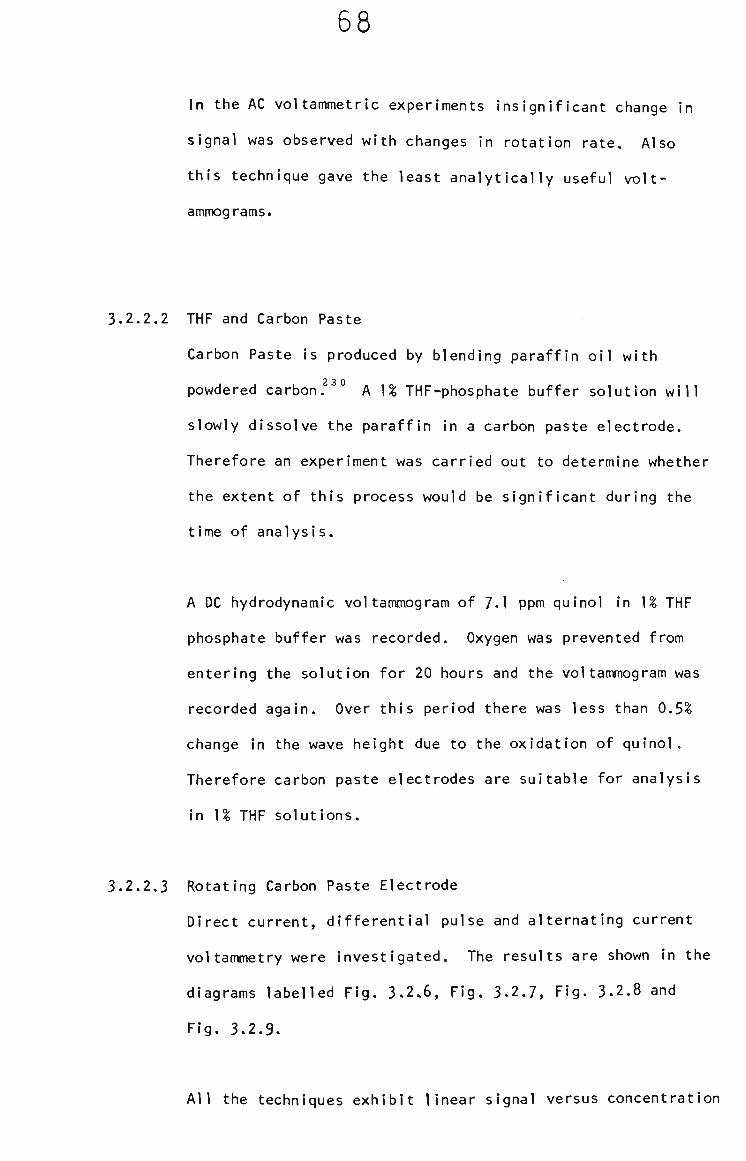
58
In the AC voltammetric experiments insignificant change in
signal was observed with changes in rotation rate. Also
this technique gave the least analytically useful volt-
ammog rams.
3.2.2.2 THF and Carbon Paste
Carbon Paste is produced by blending paraffin oil with
powdered carbon. A \% THF-phosphate buffer solution will
slowly dissolve the paraffin in a carbon paste electrode.
Therefore an experiment was carried out to determine whether
the extent of this process would be significant during the
time of analysis.
A DC hydrodynamic voltammogram of 7.1 ppm quinol In \% THF
phosphate buffer was recorded. Oxygen was prevented from
entering the solution for 20 hours and the voltammogram was
recorded again. Over this period there was less than 0.5%
change in the wave height due to the oxidation of quinol.
Therefore carbon paste electrodes are suitable for analysis
in 1% THF solutions.
3.2.2.3 Rotating Carbon Paste Electrode
Direct current, differential pulse and alternating current
voltammetry were Investigated. The results are shown in the
diagrams labelled Fig. 3.2.6, Fig. 3.2.7, Fig. 3.2.8 and
Fig. 3.2.9.
All the techniques exhibit linear signal versus concentration
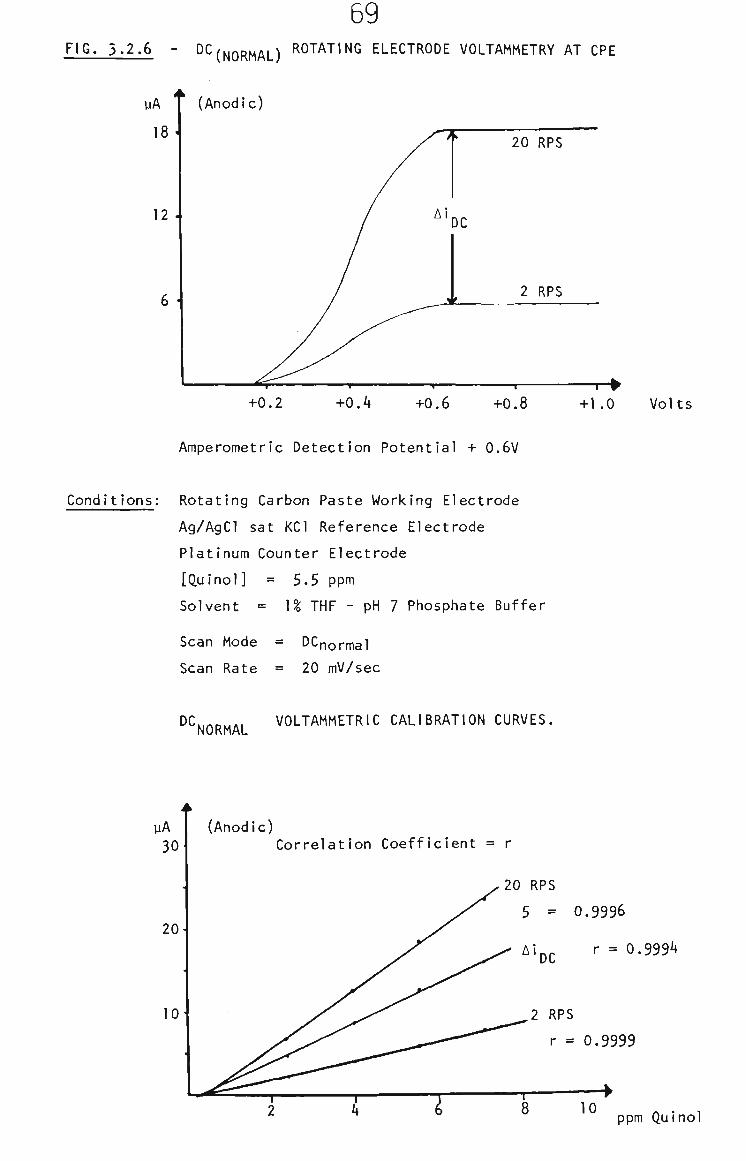
59 FIG. 3.2.6 - DC( Q[ , L) ROTATING ELECTRODE VOLTAMMETRY AT CPE
+0.2 +0.4 +0.6 +0.8 +1.0 Volts
Amperometric Detection Potential + 0.6V
Conditions: Rotating Carbon Paste Working Electrode
Ag/AgCl sat KCl Reference Electrode
Platinum Counter Electrode
[Quinol] = 5.5 ppm
Solvent = ]% THF - pH 7 Phosphate Buffer
Scan Mode = DCpormal
Scan Rate = 20 mV/sec
DC„„„^„, VOLTAMMETRIC CALIBRATION CURVES. NORMAL
yA 30 i
20-
10'
(Anodic) Correlation Coefficient = r
20 RPS
5 = 0.9996
Aipj. r = 0.9994
2 RPS
r = 0.9999
10 ppm Quinol

70 FIG. 3.2.7 - DC..^^5^j ROTATING ELECTRODE VOLTAMMETRY AT CPE
+0.2 +0.4 +0.6 +0.8 +1 .0 Volts
AMPEROMETRIC DETECTION POTENTIAL = +0.6V
Conditions: Rotating Carbon Paste Working Electrode
Ag/AgCl sat KCl Reference Electrode
Platinum Counter Electrode
[Quinol] = 5.5 ppm
Solvent = ]% THF - pH 7 Phosphate Buffer
Scan Mode = DC/_.-_v
Scan Rate = 20 mV/sec.
DC.j. g.j. VOLTAMMETRIC CALIBRATION CURVES
yA
20
(Anodic) Correlation Coefficient = r
10
20 RPS
r = 0.9995
^'DC •• " °-^^^^
2 RPS
r = 0.9999
ppm Quinol
71 ^J^' 3-2.8 - DIFFERENTIAL PULSE ROTATING ELECTRODE VOLAMMETRY
AT CPE
yA
1 .
(Anodic)
20 RPS
0.2 0.4 0.6 0.8 Volts
AMPEROMETRIC DETECTION POTENTIAL + 0.36V
Conditions: Rotating Carbon Paste Electrode
Ag/AgCl sat KCl Reference Electrode
Platinum Counter Electrode
[Quinol] = 2,4 ppm
Solvent = U THF - pH 7 Phosphate Buffer
Scan Mode = Differential Pulse (DP) - (+40 mV Pulse)
Scan Rate = 20 mV/sec.
DIFFERENTIAL PULSE VOLTAMMETRIC CALIBRATION CURVES
Correlation Coefficient = r
20 RPS
r = 0.9983
2 RPS r = 0.9990
Aipp r = 0.9868
ppm Quinol
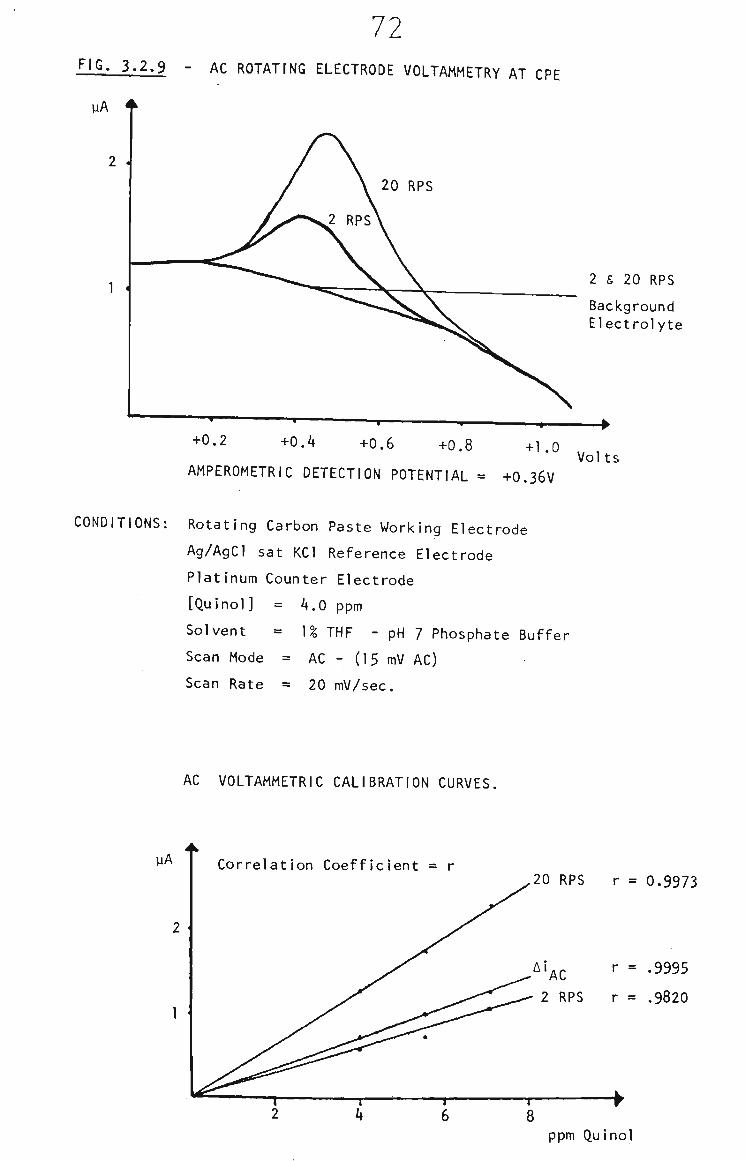
72 ' 'Q- 3.2.9 - AC ROTATING ELECTRODE VOLTAMMETRY AT CPE
yA
2 4
2 & 20 RPS
Background Electrolyte
AMPEROMETRIC DETECTION POTENTIAL = +O.36V Volts
CONDITIONS; Rotating Carbon Paste Working Electrode
Ag/AgCl sat KCl Reference Electrode
Platinum Counter Electrode
[Quinol] = 4 . 0 ppm
Solvent = U THF - pH 7 Phosphate Buffer
Scan Mode = AC - (15 mV AC)
Scan Rate = 20 mV/sec.
AC VOLTAMMETRIC CALIBRATION CURVES.
yA Correlation Coefficient = r 20 RPS r = 0.9973
Ai (. r = .9995
2 RPS r = .9820
ppm Quinol
73
plots. As was observed at the glassy carbon electrode, the
direct current techniques gave the best correlation. The AC
and Differential Pulse techniques were greatly improved at
carbon paste with the peak current increasing with rotation
rate which was not observed at glassy carbon. This behaviour
highlights the different catalytic properties of the two
carbon surfaces. The good AC results Indicate a high exchange
current density (i.e., fast kinetics) for quinol at carbon
paste and that at glassy carbon the kinetics are slow.
The difference current, Ai, gave linear plots passing through
the origin indicating PRA to be the optimum technique for
quinol analysis. Therefore PRA was investigated for the
determination of quinol in \% THF-phosphate buffer at both
carbon paste and glassy carbon electrodes.
3.2.3 PRA of Quinol
The PRA analysis of quinol was investigated at the CPE and the
GCE using DC (for both electrodes)^ AC and OP (for CPE only)
detection modes at the detection potentials determined by the
voltammetry in section 3.2.2.3. Typical amperometric results for
each detection mode are shown in Fig. 3.2.10 and Fig. 3.2.11.
Least squares analysis and correlation data are presented in
Table 3.2.1. The DC techniques at both electrodes offer the best
precision. Correlation coefficients are optimum with the glassy
carbon electrode while carbon paste offers the highest sensitivity.
Employing the maximum rotation rates, provided by the rotating
electrode assembly (10 •*• 100 RPS), the PRA detection limit for
quinol was found to be 0.4 ± 0.1 parts per billion (ng/ml). The
increase In sensitivity was found to be In agreement with the
74
Levich equation since the current Increased as a function of
the square root of the rotation rate.
To minimize the chance of an unknown compound in the sample matrix
interfering in the analysis of real samples, a detection potential
of +0.36 V was investigated. The results are presented in
Table 3.2.2.
Although this potential is not in the region where the current
is limited by transport, it is positive enough to control the
current and good PRA results were obtained. This practice must be
exercized with caution because processes that affect the kinetics
of the reaction, such as adsorption, will alter the PRA results.
Voltammetry provides a means of checking for such processes and
sample voltammograms must be recorded and inspected before using
PRA for quantitation. Where non transport limited detection
potentials were used in the following analyses, sample voltamm
ograms were checked for such behaviour prior to PRA analysis.
PRA with DC detection is rapid, precise, sensitive and as
selective as other electrochemical methods. Since calibration
curves pass through the origin, standard additions may be used
for quantitation.
3.2.4 Quinol in THF by PRA
Two bottles of AR grade, BDH, Tetrahydrofuran were chosen as
samples and their quinol level determined by PRA and UV spectro
photometry, A glassy carbon disc and a potential of +O.36 V
were employed.
The results are shown In Table 3.2.3.
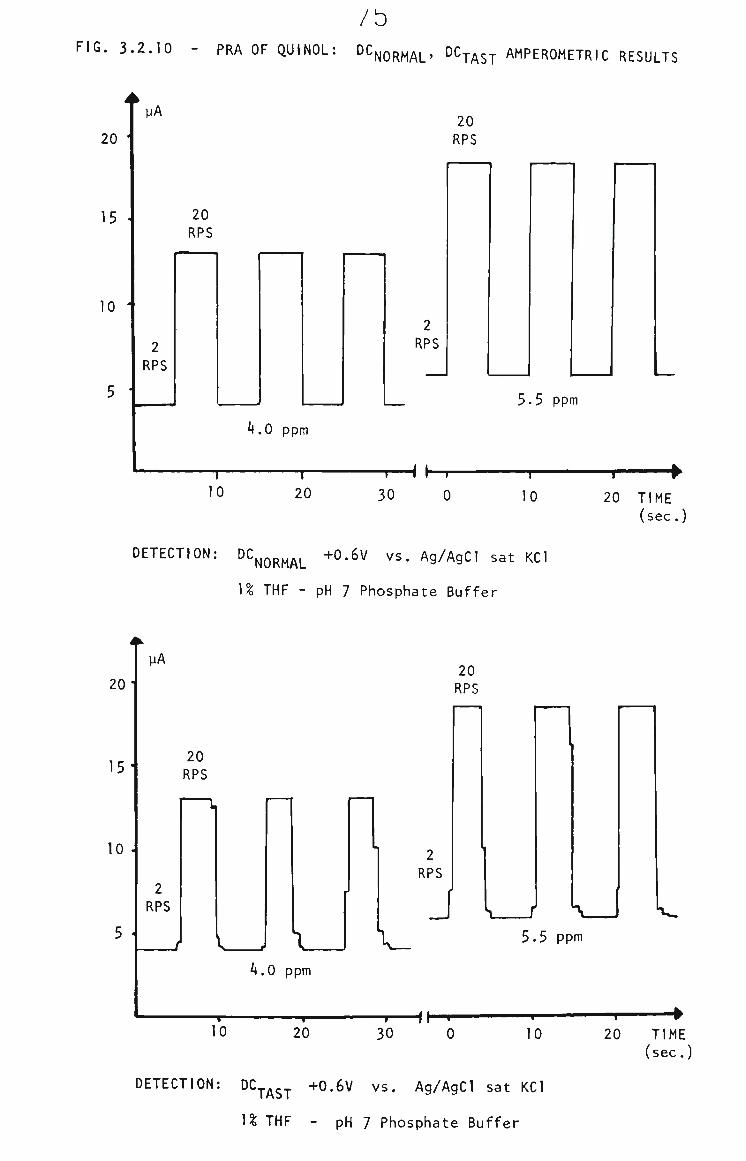
/b FIG. 3.2.10 - PRA OF QUINOL: DC^OR^AL' DC-pAST AMPEROMETRIC RESULTS
20 •
15
10 '
yA
20 RPS
2 RPS
4.0 ppm
10 "T-20
20 RPS
2 RPS
—r-
30
-<•- -r 0
5.5 ppm
—T"
10 20 TIME (sec.)
DETECTION: DC NORMAL """ ' ^ ^ - A9/A9CI sat KCl
U THF - pH 7 Phosphate Buffer
20
15-
10 .
5 -
yA
20 RPS
2 RPS
4.0 ppm
10 —r-20
20 RPS
2 RPS
J \ _
—r-30
"fh
5.5 ppm
1 r
1
\
10 20 TIME (sec.)
DETECTION: DCj.^^^ +0.6V vs. Ag/AgCl sat KCl
U THF - pH 7 Phosphate Buffer
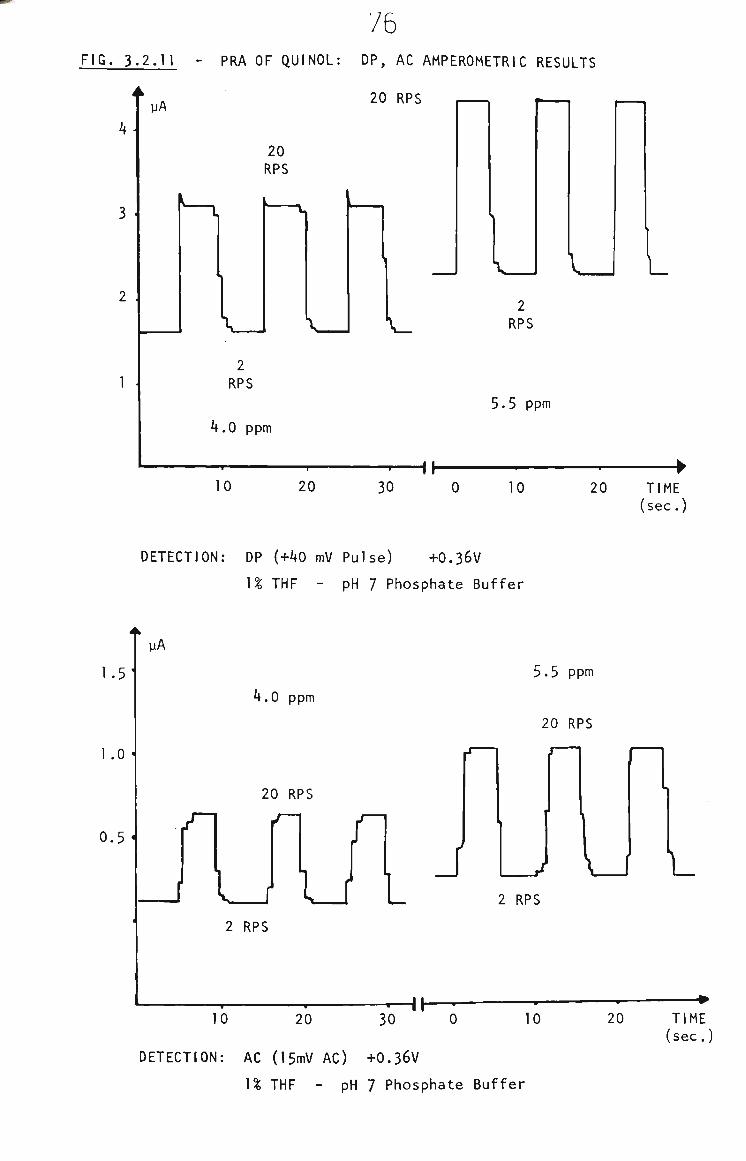
76 FIG. 3.
4-
3
2 .
I
2.11 - PRA OF QUINOL:
yA
20 RPS
..
2 RPS
DP, AC AMPEROMETRIC
20 RPS
i
RESULTS
2 \__ RPS
5.5 ppm
4.0 ppm
10 I
20 ih
30 10
L
20 TIME (sec.)
DETECTION: DP (+40 mV Pulse) +O.36V
U THF - pH 7 Phosphate Buffer
1.5'
1.0
0.5
yA
4.0 ppm
20 RPS
/ U U L J
5.5 ppm
20 RPS
2 RPS
2 RPS
10 20 30 Hh
DETECTION: AC (l5mV AC) +O.36V
U THF - pH 7 Phosphate Buffer
\ _
20 TIME (sec.)
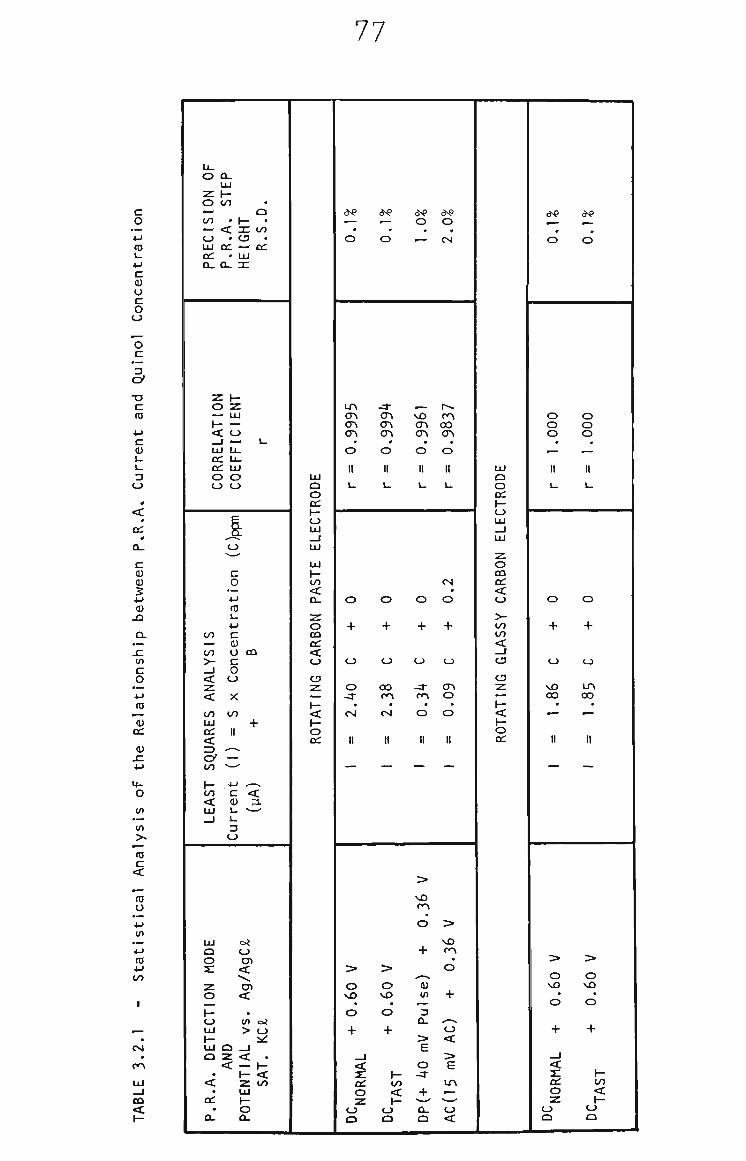
77
c o
1 . 4-» C Q) O c o o
o
c/ -o c 0)
c (D L. L. 13
O
0)
5 4-) 0)
J2
C
o 03
o
in
03 C <
03 U
OJ 4->
CM
CQ
<
U -O Q .
LU Z h-o <o — Q CO • h - • — < i : t o O • t 3 •
lU oc — oc CC • LU D_ Q_ :n^
Z H-o z ^ LU 1 < o _ J " L-LU U -OC Ll_ a : U I
o o o o
E w-— o ' ' c o 4-1 03 L. 4-<
CO c — O CO O CQ > - C _ I O
< o •z. < X CO t o LU + CC II < =D — -
<=/ — CO
H - > J - - ^ to c < < <u : i UJ J_ ^ - ^ _ i i -
D t J
LU o?
a o O O) 2 : <
^ z en 0 <
K 0 tn o? LU > 0
» - >^ UJ Q _ l 0 Z < .
< — 1-1- <
< z CO LU
CC H 0
Q . 0 .
UJ 0 0 CC
\-0 LU _ I LU
LU y-IT)
< O -
z 0 0 0 oc < 0
0 z h^ < 1 -0 a :
( j « w—
. 0
LTV CTv <T\ <T\
• 0
II i -
0
+
0
0 -:r
• <v|
II
—
> 0 v O
• 0
+ _ J
^ ^ ac 0 z
CJ 0
dvP
.— . 0
.:r <r> <n <r\
# 0
II L-
0
+
0
CO CO
. C4
II
"—
> 0 v O
• 0
+
y-t o
< h-0 a
e-e 0 .
w—
w—
vO cr\ (T\
m
0
II I -
0
+
0
-^ ra m
0
II
~"
> vO r r \
0
+ ,.— (1>
in
— 3 Q-
> E
0 -:r
+ Q . o
d ^ 0
V
CM
r>. p ^
c» cr»
* 0
II
u
CM
. 0
+
t J
cr> 0
. 0
II
—
> v O m
. 0
+ ^ • • • ^
0
< > E LTV F - . .
^ . 0
<
LU CX 0
0 LU _ I LU
•z. 0 ca ex: <c 0
>-t o t o
< _r C3
t 3 Z
— H < 1 -0 0::
d *
# 0
0 0 0
. ^— II
u
0
+
0
vO 0 0
• .r—
II
> 0 vO
• 0
+ —1
< n CC 0 z
0 0
( e
» 0
0 0 0
, .— II i_
0
+
0
LA CO
. .—
II
—
> 0 VO
• 0
+
1 -t o
< h-t J Q
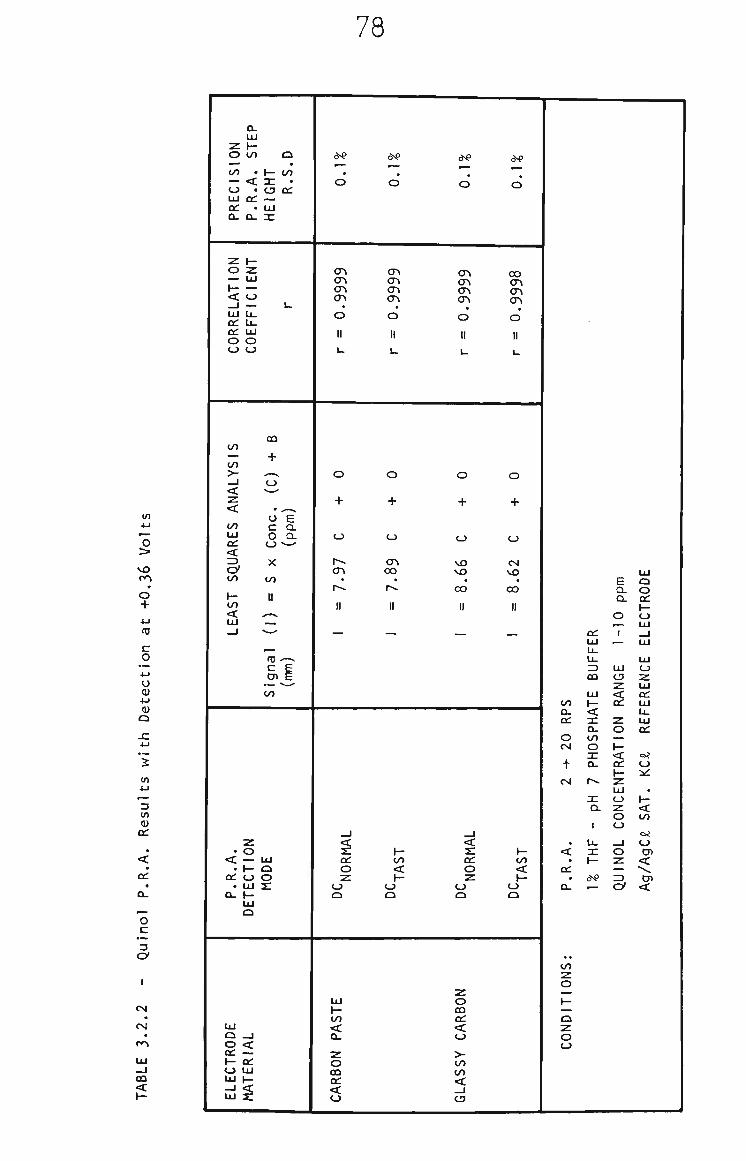
78
z I -o to
CO — < I O . t 3 DC LU OS — CC . UJ Q- Q- 3 1
O o O O
Z I -O 2 — LU I < O _ I — LU U -CC U -CC LU O O O O
crv
o
II
CTv
o
II L-
CTv
en «
o II 1-
oo en
o > v O
O
+ 03
C
o o
4-1
Q
2
in
3 UI 0)
oc:
< CC
a.
O c
Cf
I
CM
og
an <
t o
t o >-- J < z < CO LU CC
< <y t o
y-t o
<
•I -
O E C Q . O O L
O — -
t o
O
+
en
o
+
o
c»
o
+
CO
II
03 ^-^ c E W E
CO
o
+
CM vO
OO
II
• o < — LU
• I - Q 0 £ O O
. UJ 2 : Q- » -
LU O
OC O
t /1
< OC o
to
< o o
o o
o o o
t o O-dC
o CM
+ CM
< CC
CC LU U.
CQ
LU I -< n: a. to o a: O-
3 :
Q .
I
a^
E Q Q. O Q . CC
( -O O — LU
I _ J
C3 z < CC
< CC
o z UJ ct:
UJ CC
o t -z < O CO o _l o o 01 z < — 'v, I D XJ> Of <
O < CC — J - OC O l U UJ » -- J <
UJ I -co
< Q-
O OQ OC <
o OQ OC < o >-to to < - J
to z o
o o
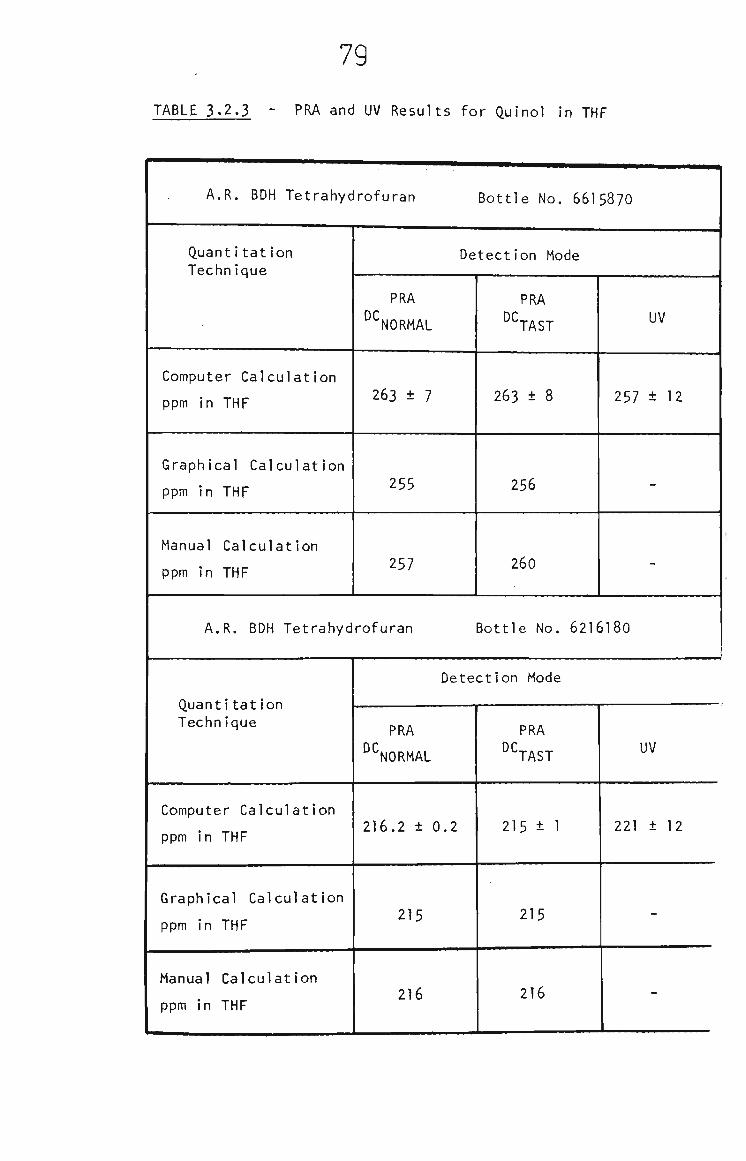
79
TABLE 3.2.3 - PRA and UV Results for Quinol in THF
A.R. BDH Tetrahydrofuran Bottle No. 66I587O
Quantitation Technique
Computer Calculation
ppm in THF
Graphical Calculation
ppm in THF
Manual Calculation
ppm in THF
Detection Mode
PRA DC NORMAL
263 ± 7
255
257
PRA
^^AST
263 ± 8
256
260
UV
257 ± 12
-
A.R. BDH Tetrahydrofuran Bottle No. 62I6I8O
Quantitation Technique
Computer Calculation
ppm In THF
Graphical Calculation
ppm in THF
Manual Calculation
ppm in THF
Detection Mode
PRA or ^NORMAL
216.2 ± 0.2
215
216
PRA
^SAST
215 ± 1
215
216
UV
221 ± 1 2
-
-
80
Quantitation was achieved by standard additions and computer
calculation of results. As a check on the validity of the
calculation program, the quinol levels were determined graph
ically and by a calculation described in the Metrohm E506
Polarecord manual, (see Appendix 4).
Good agreement was obtained between PRA and UV spectroph
otometry. All the calculation techniques investigated are
valid means of quantitation.
The difference In results between the two samples corresponds
to the time of exposure to air, with the sample containing
216 ppm being opened a few weeks prior to the other.
The difference in precision observed for the PRA results of the
two samples was coincidental. The RSD for PRA analyses of quinol
was found to be <3% in all samples whereas the RSD for the UV
technique was found to be 5%.
3.2.5 Quinol in THF by FIA
FIA offers advantage over conventional analysis techniques due
to its speed, small sample volumes and low reagent consumption . ^
Where fast, accurate, inexpensive and reliable determinations of
stabilizer in THF are required, FIA is an ideal technique. There
fore a FIA method with electrochemical detection was developed and
its results compared with UV spectrophotometry. This required
Investigating and optimizing the following parameters:
(a) the detection potential,
(b) the dependence of FIA peak height on concentration
of quinol,
(c) the sensitivity of the FIA system.
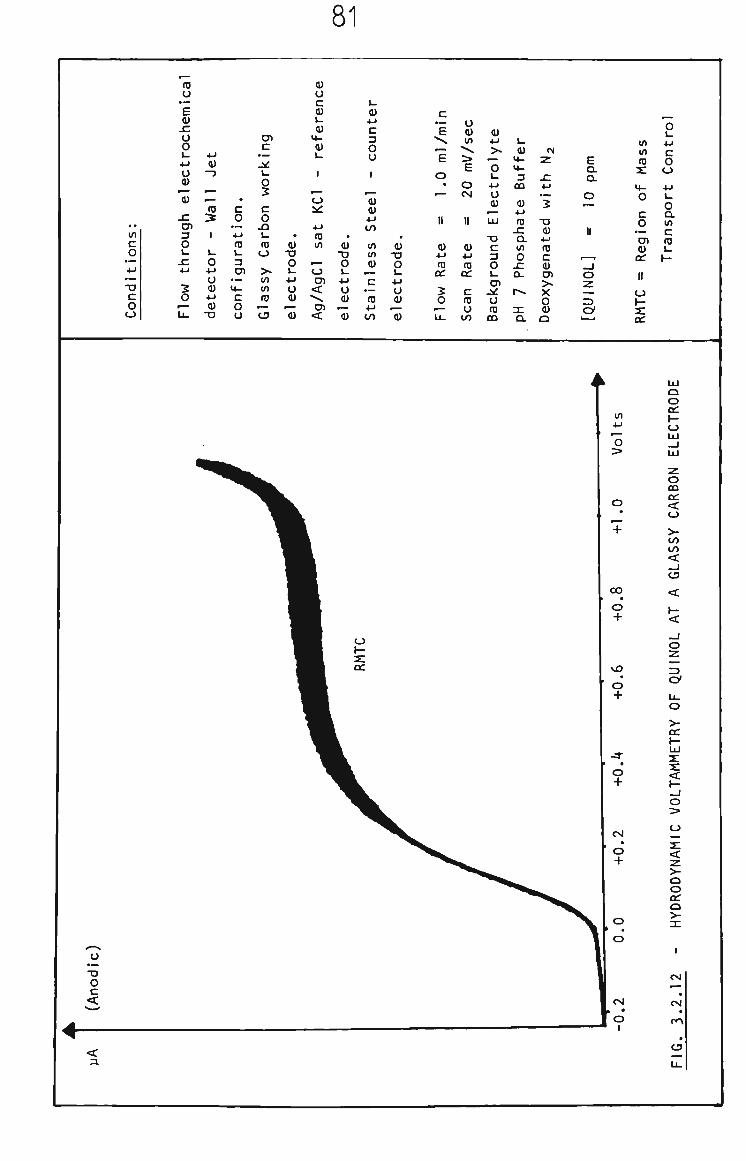
81
-o c o o
ro o .— E 0)
j r
o
ectr
o
^ 0)
.n CJ> 3 O v_
J = 4-1
2 o ^ ™
U -
Je
t ^-' ro ^
1
i -
o 4-"
o (1)
4-1
(U - D
c o
" • "
4-1
ro L. 3 D l
•-" V4-
C
o O
cn
wo
rk in
c o
Si u ro o
>-(/) in
ro — C3
« (U
T3
o L-4->
o <u — <u
0) o c (U I -0)
M -
»— o
4-1
ro in
.— o O)
< • ^
D l <
. 0)
• D
O U +J
u (U — (0
1 -0)
4-1
c 3 o o
.— <0 (U
4-1 CO
in in 0)
r—
C •— ro 4-) CO
. Q)
• D
o u 4-1
o <u
p —
d)
c
' i "^ 1 o
• ^-
II
(U •M ro
CC
5 O —
LL.
o (U in
> E
O CM
II
Hi 4-)
ro CC
c ro o
t o
V 4->
roly
4-1
o (H
L U
-o c 3 o 1 .
CTl .^ o ro
OQ
u
uff
e
OQ
0) 4.>
ro sz Q . in o
x: O-
r^ 3 1 CL
01
2
4-1
•^ 2
- D <U
4-1
ro c 0) O l > X o (1)
Q
ppm
o
II
1
o •z.
r j o;
o u
in 4-1 in c ro O
c o
03
o
u O CL m c ro L.
in 4-1
"o >
o
"+
u -a o c <
Q O CC \-t J
o OQ CC <
>-CO t o
< C3
U. O
>-OC
< I -_ i o
>-o o CC o >-X
CM
CM
CO
< 3.
CJ
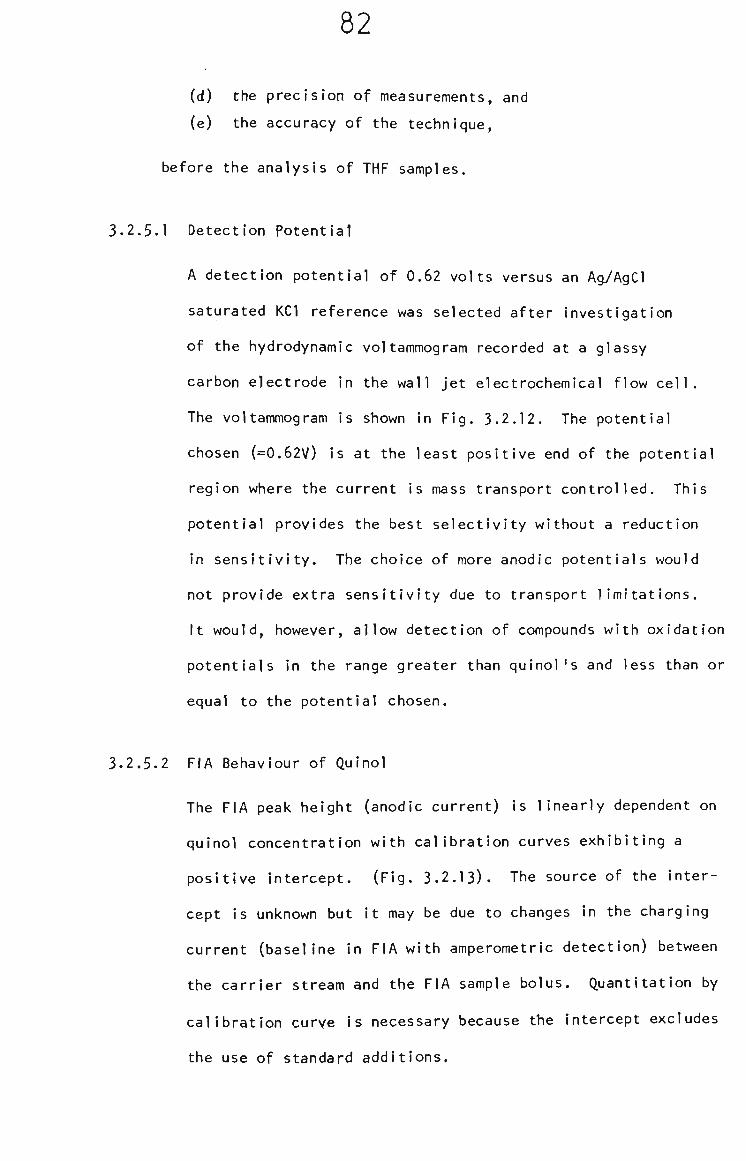
82
(d) the precision of measurements, and
(e) the accuracy of the technique,
before the analysis of THF samples.
3.2.5.1 Detection Potential
A detection potential of 0.62 volts versus an Ag/AgCl
saturated KCl reference was selected after Investigation
of the hydrodynamic voltammogram recorded at a glassy
carbon electrode In the wall jet electrochemical flow cell.
The voltammogram is shown in Fig. 3.2.12. The potential
chosen (=0.62V) is at the least positive end of the potential
region where the current is mass transport controlled. This
potential provides the best selectivity without a reduction
in sensitivity. The choice of more anodic potentials would
not provide extra sensitivity due to transport limitations.
It would, however, allow detection of compounds with oxidation
potentials in the range greater than quinol's and less than or
equal to the potential chosen.
3.2.5.2 FIA Behaviour of Quinol
The FIA peak height (anodic current) is linearly dependent on
quinol concentration with calibration curves exhibiting a
positive intercept. (Fig. 3.2.13). The source of the Inter
cept is unknown but it may be due to changes in the charging
current (baseline in FIA with amperometric detection) between
the carrier stream and the FIA sample bolus. Quantitation by
calibration curve is necessary because the intercept excludes
the use of standard additions.
83 FIG. 3.2.13 - FIA PEAK HEIGHT vs. QUINOL CONCENTRATION
0.5
0.4
0.3
0.2
0.1
yA
10-20 ppm Range
Correlation Coefficient r = 0.99998
12 18 ppm Quinol
I-IO ppm Range
10 ppm Quinol
0.1-I.0 ppm Range
Correlation Coefficient r = 0.99923
0.2 0.6 1.0 1.4 1.8 ppm Quinol
FIA Conditions; Flow Rate 1.0 ml/min - pH Phosphate Buffer
Detection Potential + 0.62V vs Ag/AgCl sat KCl
Glassy Carbon Electrode - Wall Jet
Buffer Deaerated with Nitrogen
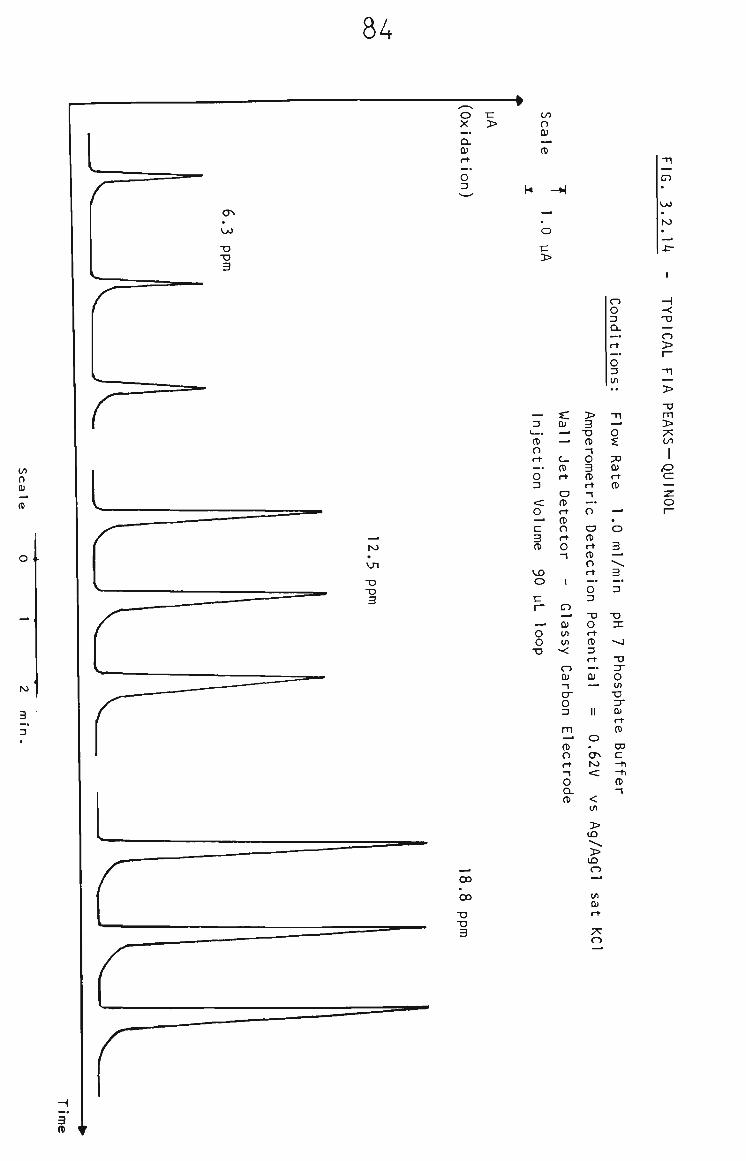
84
in 0 0)
M
3 3
O X
Q.
O 3
>
ro
•o T3 3
OO
cx>
x> -a 3
to O Q>
(D
-c
— 3 1—•
a o i-y
—• O 3
< o —. c 3 0)
U3 O
• c r-
-^ o o
• D
s: Ol —» —» c_ <B rt
O (B rt (C O rt O -J
1
CD -^ 0) in tn ^ o Ol -\ o-o 3
m —' (T> O rt -5
o D. fD
> 3 • o CK -\ O 3 (D rt -I
—. O
O CD rt
O rt
o" 3
-u o rt (T> 3 rt — QJ —-
II
O . ON ro <
VS
Ag/AgCl
sat
KC
o o 3 Q. —• rt .—• O 3 tn
• '
-n O s 33 0) rt (0
—* . O
3
^» 3_
3
•o 3 :
-^ -a 3" o in -a 3" 0)
(T>
CO c - h - t i
a -J
H -< -o — o > r— -n -.->
m > 7^ to
1 ( O c: — z o r-
i I
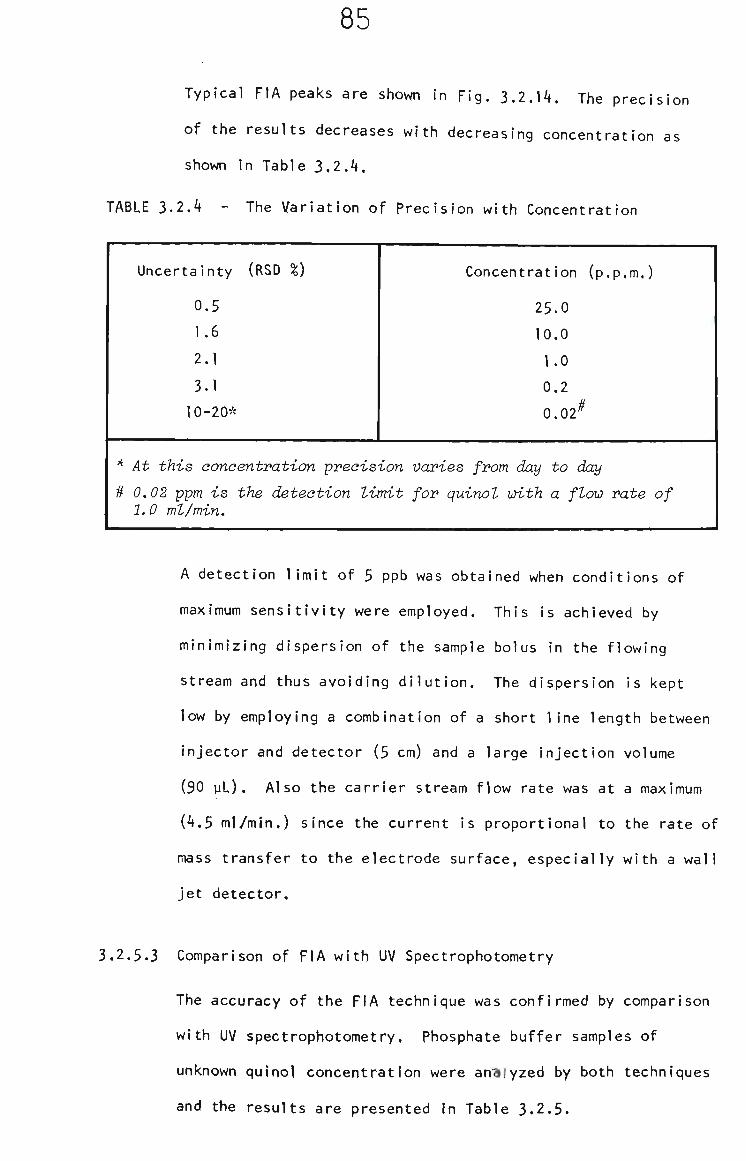
85
Typical FIA peaks are shown in Fig. 3.2.14, The precision
of the results decreases with decreasing concentration as
shown in Table 3.2.4.
TABLE 3.2.4 - The Variation of precision with Concentrat ion
Uncertainty (RSD %)
0.5
1.6
2.1
3.1
10-20*
Concentration (p.p.m.)
25.0
10.0
1.0
0,2
0,02^
* At this concentration precision varies from day to day
# 0.02 ppm is the detection Ivmlt for quinol with a flow rate of 1. 0 ml/min.
A detection limit of 5 ppb was obtained when conditions of
maximum sensitivity were employed. This is achieved by
minimizing dispersion of the sample bolus in the flowing
stream and thus avoiding dilution. The dispersion is kept
low by employing a combination of a short line length between
injector and detector (5 cm) and a large injection volume
(90 yL). Also the carrier stream flow rate was at a maximum
(4.5 ml/min.) since the current is proportional to the rate of
mass transfer to the electrode surface, especially with a wall
Jet detector.
3.2.5.3 Comparison of FIA with UV Spectrophotometry
The accuracy of the FIA technique was confirmed by comparison
with UV spectrophotometry. Phosphate buffer samples of
unknown quinol concentration were analyzed by both techniques
and the results are presented In Table 3.2.5.
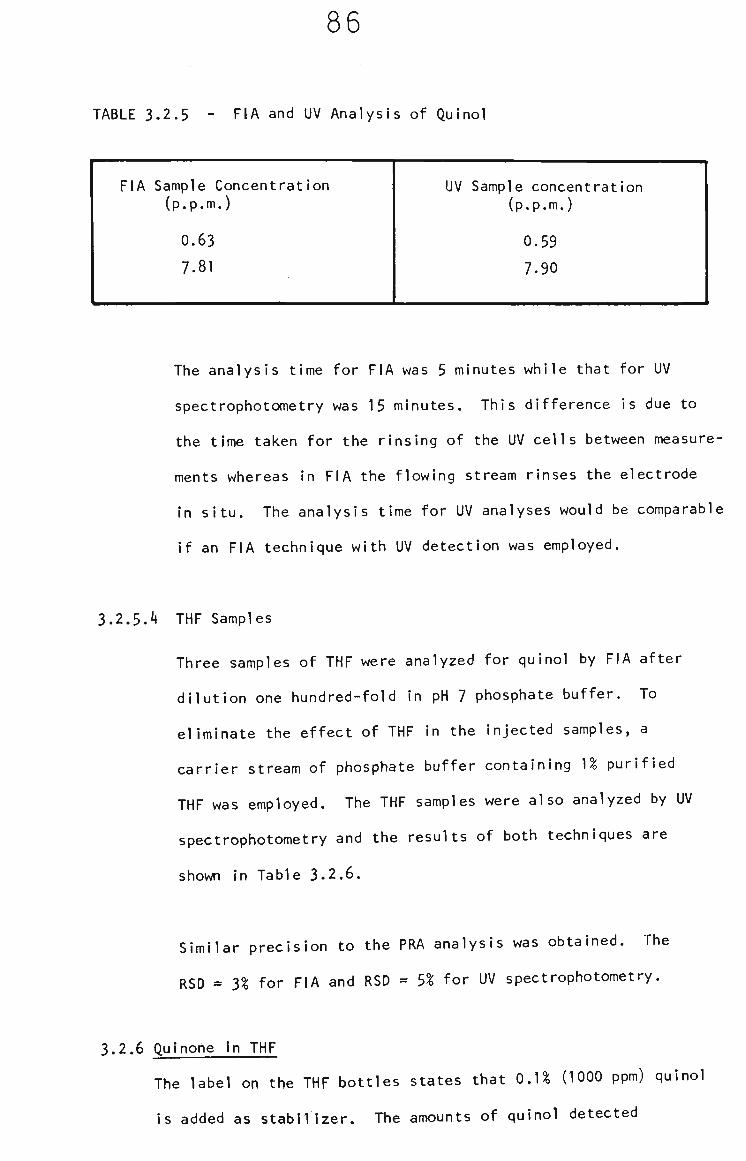
86
TABLE 3.2.5 - FIA and UV Analysis of Quinol
FIA Sample Concentration (p.p.m.)
0.63
7.81
UV Sample concentration (p.p.m.)
0.59
7.90
The analysis time for FIA was 5 minutes while that for UV
spectrophotometry was 15 minutes. This difference Is due to
the time taken for the rinsing of the UV cells between measure
ments whereas in FIA the flowing stream rinses the electrode
in situ. The analysis time for UV analyses would be comparable
if an FIA technique with UV detection was employed.
3.2.5.4 THF Samples
Three samples of THF were analyzed for quinol by FIA after
dilution one hundred-fold in pH 7 phosphate buffer. To
eliminate the effect of THF in the injected samples, a
carrier stream of phosphate buffer containing U purified
THF was employed. The THF samples were also analyzed by UV
spectrophotometry and the results of both techniques are
shown In Table 3.2,6.
Similar precision to the PRA analysis was obtained. The
RSD = 3% for FIA and RSD = 5% for UV spectrophotometry.
3.2.6 Quinone In THF
The label on the THF bottles states that O.U (1000 ppm) quinol
is added as stabilizer. The amounts of quinol detected

87
TABLE 3.2.6 - FIA and UV Results for Quinol in THF
THF Sample
A
6
C
FIA [Quinol] p.p., .
281 ± 5
265 ± 6
210 ± 6
A = Unopened bottle of THF.
B = Bottle opened for 1 week.
C = Bottle opened for 3 weeks.
UV [Quinol] p.p.m.
290 + 13
261 ± 12
215 ± 12
(ca. 200-300 ppm) in the THF samples suggest that comparable
levels of quinone would be present. Although quinone levels in
THF are not important in preventing the oxidation of THF, the
analysis of ISE membranes required the detection of quinone in the
presence of THF. Therefore quinone was determined in THF by FIA
and PRA to test the suitability of the techniques for the analysis
of the electrode membranes.
3.2.6.1 Quinone FIA
Hydrodynamic voltammetry at a glassy carbon disc incorporated
in a wall jet detector cell, was used to determine the FIA
detection potential. In pH 7 phosphate buffer, a plateau
region, where the current is mass transport controlled, was
observed between -0.15 and -O.6O volts. In )% THF-phosphate
buffer the region was between -0.15 and -0.25 volts. To
maximize the selectivity, -0.15 volts was chosen for detection.
The decrease In the potential range of the plateau region with
88
THF present is due to the reduction of either unknown
impurities in THF or THF itself.
Reproducible detection of cathodic currents in FIA requires
stringent control over oxygen penetration into the system.^^^
Preliminary experiments, in which oxygen could enter the FIA
system, yielded RSD's between 10 and 30^ at sub-ppm levels
of quinone. Therefore two different pumping and reservoir
arrangements, both with stringent control of oxygen
penetration, were compared to determine the optimum precision
achievable in quinone FIA. Typical FIA peaks and calibration
graph for both arrangements are shown in Fig. 3.2.15 and
Fig. 3.2.16.
The Metrohm gas pressure arrangement gave the most precise
results (peak height RSD = 3%) compared to the peristaltic
system (peak height RSD = 5%). Although the Metrohm system
offers slightly better precision it is limited to short term
uninterrupted use because it delivers a constant flow for
only about 30 minutes at 2 ml/min. The peristaltic system
offers the advantage of constant flow for a few hours at
comparable flow rates.
3.2.6.2 THF Samples
A sample of stabilized THF was diluted one hundred-fold in
pH 7 phosphate buffer and analyzed using the Metrohm FIA
assembly. A carrier stream of l^ purified THF in phosphate
buffer was employed. Quantitation was achieved by calibration
graph and the result was compared with a UV spectrophotometric
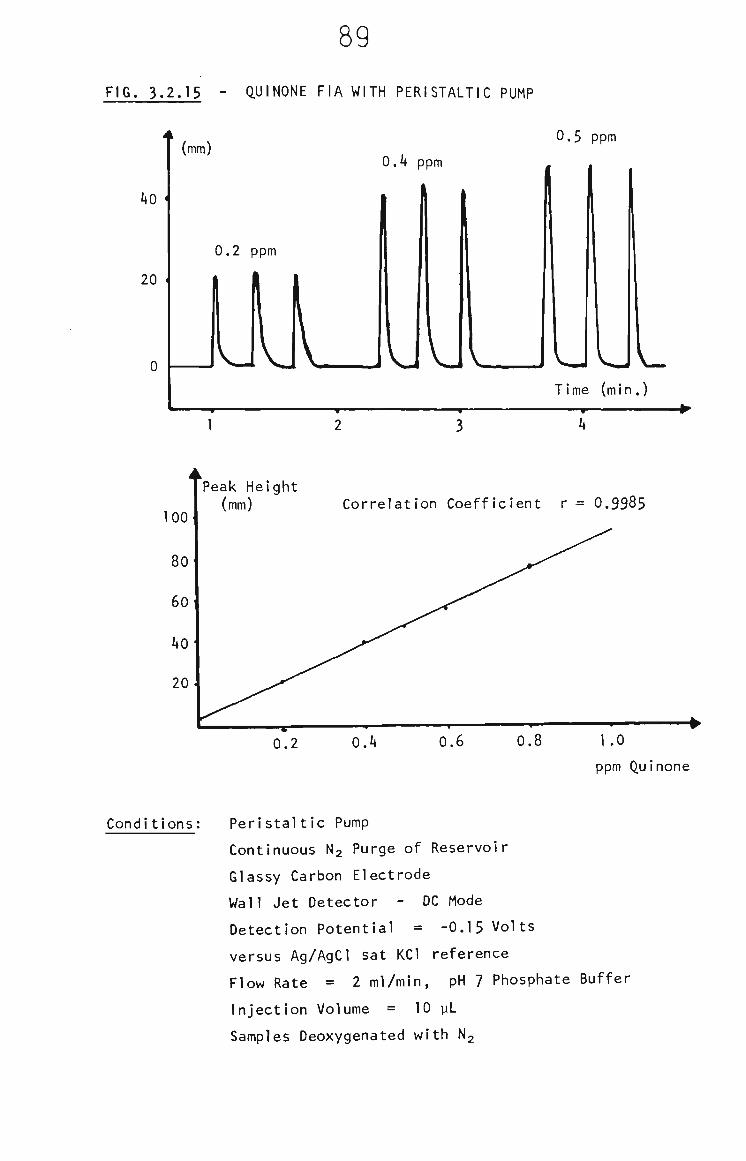
89
FIG. 3.2.15 - QUINONE FIA WITH PERISTALTIC PUMP
0.5 ppm
40 '
20
100
Peak Height (mm) Correlation Coefficient r = 0.9985
ppm Quinone
Conditions: Peristaltic Pump
Continuous N2 Purge of Reservoir
Glassy Carbon Electrode
Wall Jet Detector - DC Mode
Detection Potential = -0.15 Volts
versus Ag/AgCl sat KCl reference
Flow Rate = 2 ml/min, pH 7 Phosphate Buffer
Injection Volume = 10 yL
Samples Deoxygenated with N2

90
FIG. 3.2.16 - QUINONE FIA WITH METROHM GAS PRESSURE PUMP
(mm) 30
20 .
10
T 30
20 .
10 •
3 4 Time (min.)
Peak Height (mm)
CORRELATION COEFFICIENT r = 0.9991
0.2 0.4 0.6 0.8 1.0
ppm Quinone
CONDITIONS: Metrohm Gas Pressure Pump
Glassy Carbon Electrode
Wall Jet Detector - DC Mode
Detection Potential = -0.15 Volts
Versus Ag/AgCl sat KCl Reference
Flow Rate = 2 ml/min pH 7 Phosphate Buffer
Injection Volume = 10 yL
Samples Deoxygenated with N2
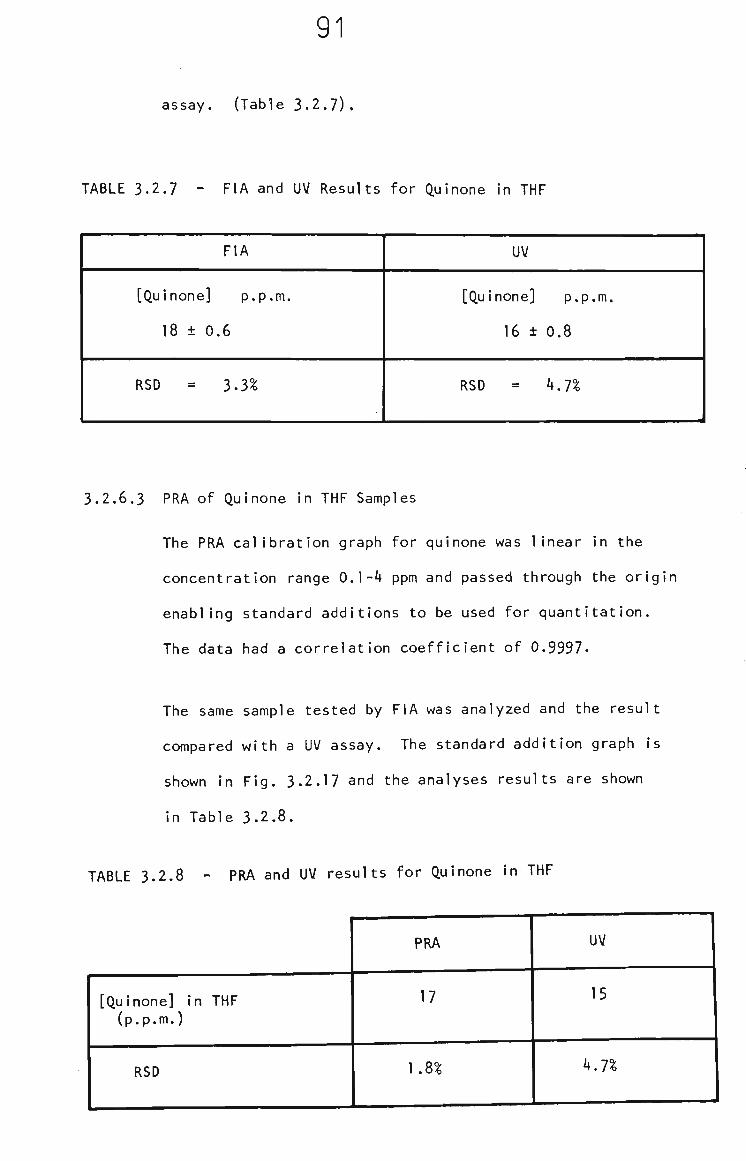
91
assay. (Table 3.2.7).
TABLE 3.2.7 - FIA and UV Results for Quinone in THF
FIA
[Quinone] p.p.m.
18 ± 0.6
RSD = 3.3^
UV
[Quinone] p.p.m.
16 ± 0.8
RSD = h.1%
3.2.6.3 PRA of Quinone in THF Samples
The PRA calibration graph for quinone was linear in the
concentration range 0.1-4 ppm and passed through the origin
enabling standard additions to be used for quantitation.
The data had a correlation coefficient of 0.9997.
The same sample tested by FIA was analyzed and the result
compared with a UV assay. The standard addition graph Is
shown in Fig. 3.2.17 and the analyses results are shown
in Table 3-2.8.
TABLE 3.2.8 - PRA and UV results for Quinone in THF
[Quinone] in THF (p.p.m.)
RSD
PRA
17
1.8^
UV
15
h.n
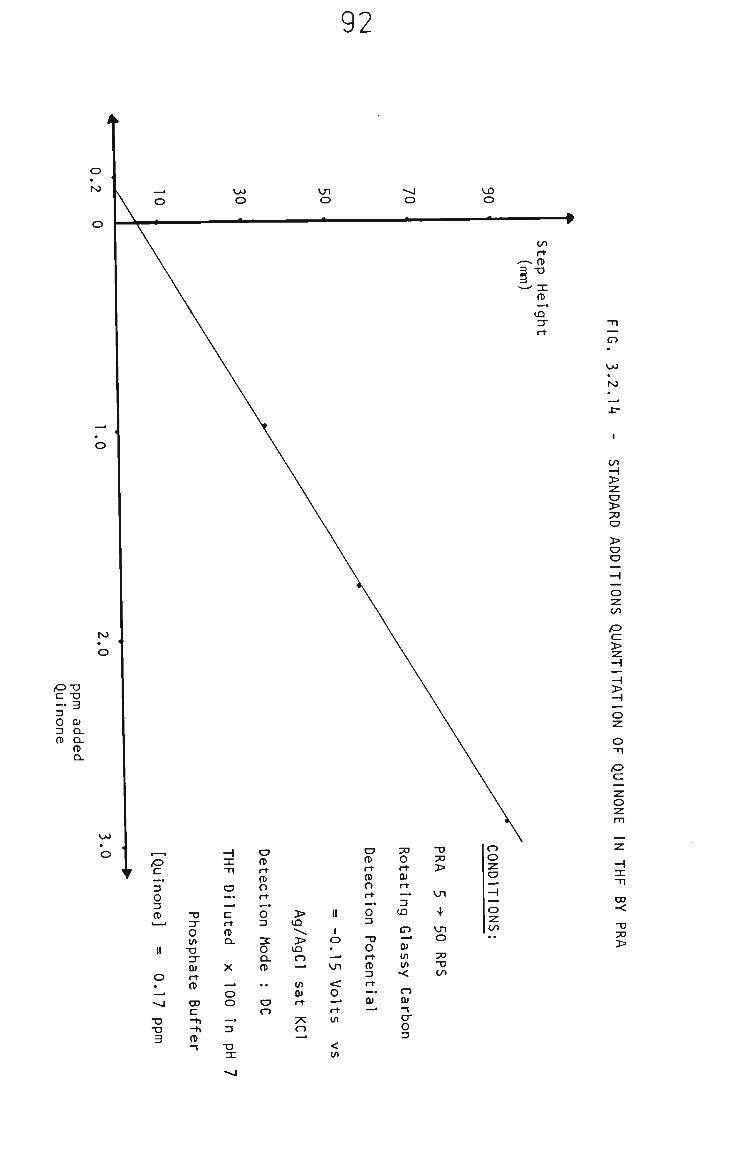
92
VJJ
ro
to > z o > o > o
-1 o z to
<o
>
> H O z o -n
Qui none
•
M
O
_ d
««J
•D -D 3
TJ 3" o (n "O 3 -Q) rt (D
00 C - h - h (0 -J
H DC
-n Dilu
rt (D CL
X .Mrf
o o
—. 3
T3 3 :
o (0 rt fl) :
CtiO
3
IS o o. (D
.. o o
> (O •^ > U3 O —* in QJ rt
T : o
11
1
o . —* vn
< o -^ rt in
< in
o ete c
tioi
^ TJ O rt 0> 3 rt — •
CU —*
•73 O rt CU t
ing
tr> • ^
Q) tn in •< o OJ - I O"
o 3
-a 7}
>
VJl O
7} ~o C/>
COND ITION: V J
CO
-<
>
93
Both electrochemical techniques proved to be more precise
than the UV technique yet they gave a slightly higher level of
quinone. When purified THF was spiked with known amounts
of quinone and the techniques were compared agreement was
achieved. This indicated that a small amount of electroactive
interferent was present in the quinol stabilized THF samples.
3.3 Quinol and Quinone in Ion Selective Electrode Polymer Membranes
Since PRA is rapid, precise, sensitive and is particularly useful
where results are complicated by adsorption or interference from slow
electron transfer processes, it was decided to test the utility of
PRA for the analysis of quinol and quinone in the polymer membrane.
The membranes are prepared by dissolution of the components In THF and
subsequent slow evaporation to form a polymer film on the metal contact
of the electrode.^^^ in this study chloride sensitive membranes
fabricated from 35^ w/w polyvinylchlorlde (PVC) and 65^ w/w Aliquat 336
were investigated.
3.3.1 Sample Matrix
The PRA analysis of the membranes required the release of the
analytes from the PVC/Aliquat 336 matrix into a buffered solution,
Since THF is an excellent solvent for the membrane material, is
electro-inactive under the conditions of the PRA determination of
quinol and quinone, and reasonably miscible with pH 7 phosphate
buffer, THF was used to effect this release.
It was found that dissolution of quinol or quinone, PVC and
Aliquat 336 In purified THF and subsequent addition to phosphate

94
buffer (up to 3% v/v THF) yielded complete recovery of the
quinol or quinone upon PRA analysis using standard additions for
quantitation. A glassy carbon electrode was used rather than
carbon paste to avoid problems arising from the higher percentage
of THF in the test solutions.
The analysis of quinol in electrode membrane samples by PRA
proved suitable, being fast, simple and exhibiting good agreement
with a UV spectrophotometrIc analysis.
The analysis of quinone in membranes by PRA was found to be
unreliable, the results being consistently higher by PRA than
for the UV spectrophotometric analysis. This discrepancy was
found to be due to an interferent arising from the photochemical
reaction of quinone to produce a photodimer. The dimer was
found to be electroactive under the conditions of PRA analysis
and to have a UV absorption wavelength maximum of 222 nm, 21 nm
lower than that of quinone at 243 nm. Therefore the PRA
measurement included a contribution from the dimer whereas the
dimer's different UV absorption behaviour enabled a selective
UV analysis of quinone.
3.3.2 The Behaviour of Quinol in THF/PVC/AlIquat 3367Phosphate Buffer
Hydrodynamic voltammetry was used to investigate the effects of
PVC and Aliquat 336 on the PRA analysis of quinol. Both
materials were found to be electro-inactive in the applicable
potential range. To test the recovery of the THF sample
dissolution technique^a THF solution, of known quinol
concentration and containing PVC and AlIquat 336 In a ratio
equivalent to an electrode membrane, was analyzed by PRA,
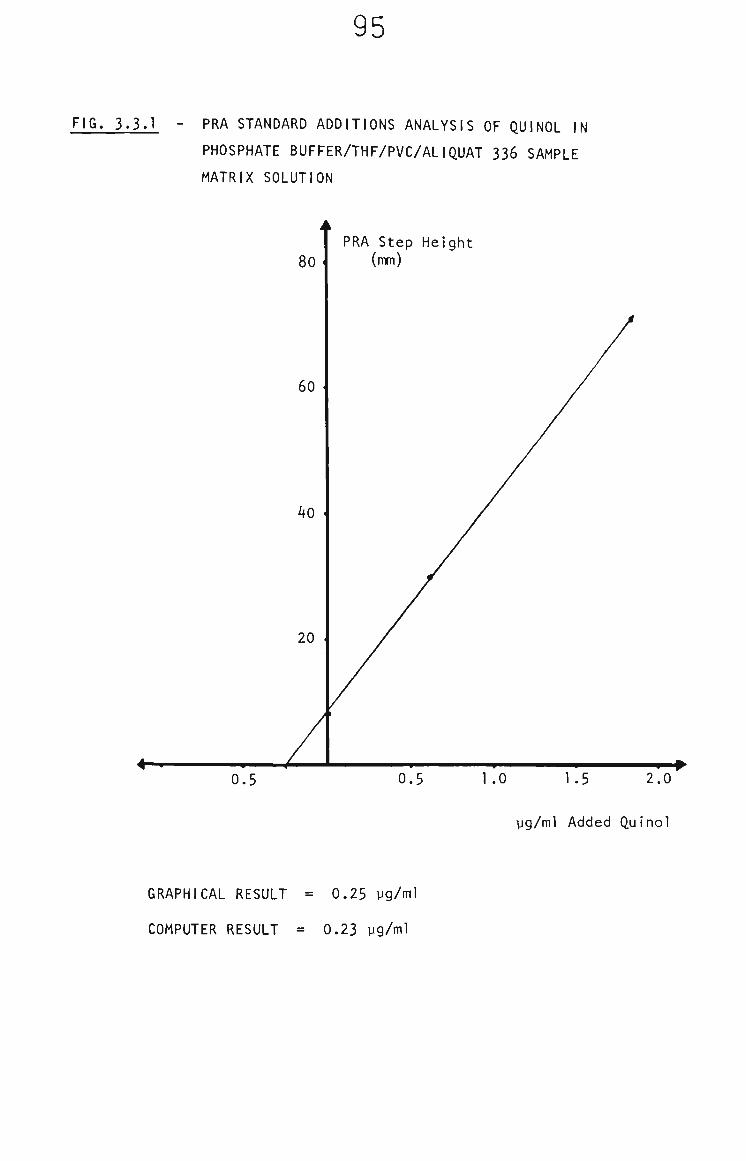
95
FIG. 3.3.1 - PRA STANDARD ADDITIONS ANALYSIS OF QUINOL IN
PHOSPHATE BUFFER/THF/PVC/ALIQUAT 336 SAMPLE
MATRIX SOLUTION
PRA Step Height (mm)
yg/ml Added Quinol
GRAPHICAL RESULT = 0.25 yg/ml
COMPUTER RESULT = 0.23 yg/ml
96
The graphical standard addition result is shown in Fig. 3.3.1.
After dilution of the THF in phosphate buffer the known quinol
concentration was 0,24 yg/ml. The standard addition results of
0.23 ± O.Ol yg/ml by computer least squares calculation and
0.25 yg/ml by graphical means indicate complete recovery of
quinol from the sample matrix. Therefore PRA was used to
determine quinol in electrode samples.
3.3.3 Quinol in Electrode Membranes
Two sample types of electrode membrane were analyzed. Firstly
membranes that were freshly prepared from quinol stabilized THF
and secondly, membranes that had been exposed to air and natural
light for a few months prior to analysis were tested.
The rotation rates were changed between 3 and 90 RPS and 2.0 ml
of THF solution (10-15 mg of sample/25 ml) was added to 20,0 ml
of phosphate buffer (i.e., 3% THF). Also a detection potential
of + 0.304 V versus a Ag/AgCl sat. KCl reference was employed to
minimize the possibility of an Interferent being detected.
Sample blanks prepared from purified THF, PVC and Aliquat 336
were tested under the conditions of membrane analysis. No
signal was detected.
Standard additions were used for quantitation and the results
were compared with a UV spectrophotometric assay. Fig. 3.3.2 and
Fig. 3.3,3 show the standard additions graphs and experimental
conditions for the "fresh" and "old" membranes respectively.
Table 3.3.1 shows the comparison of PRA and UV analysis results.

97
FIG. 3.3.2 - PRA STANDARD ADDITIONS ANALYSIS OF QUINOL IN
"FRESH" POLYMER MEMBRANE
yg/ml Added Quinol
GRAPHICAL RESULT = 0.08 yg/ml
COMPUTER RESULT = O.O78 yg/ml

98
FlG. 3.3.3 - PRA STANDARD ADDITIONS ANALYSIS OF QUINOL
IN "OLD" POLYMER MEMBRANE
(Anodic)
GRAPHICAL RESULT = 0.024 yg/ml
COMPUTER RESULT = 0.024 yg/ml
yg/ml Added Quinol
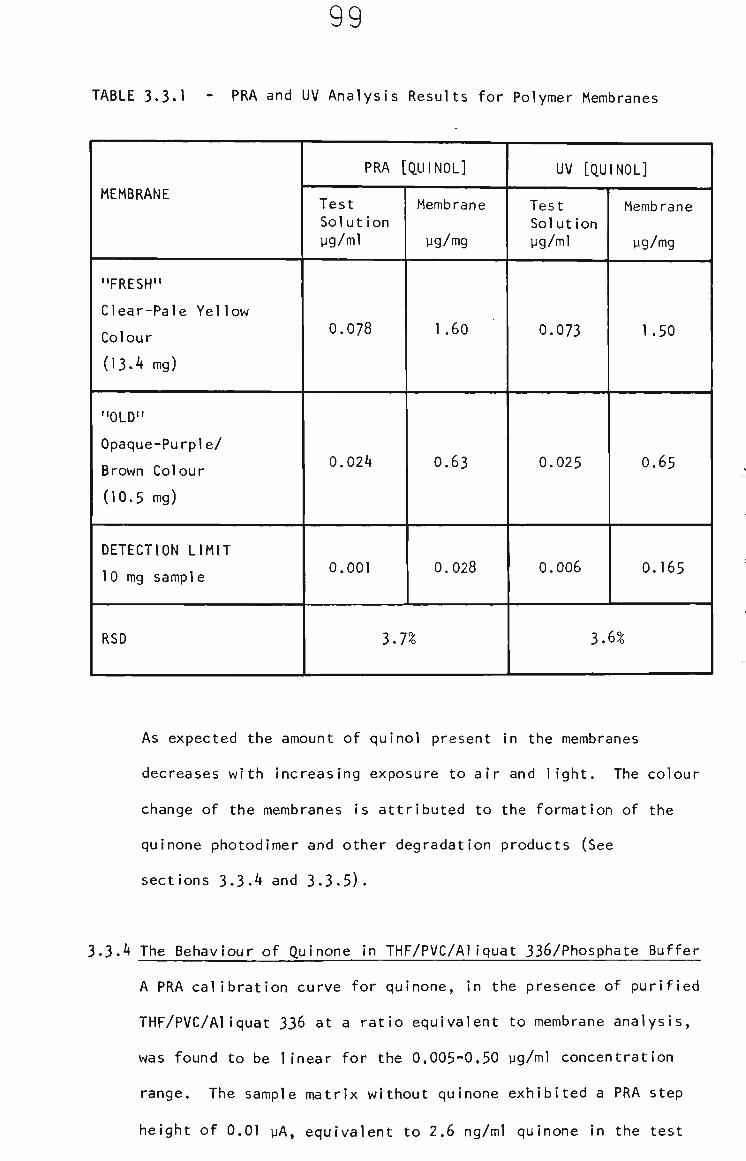
99
TABLE 3.3.1 - PRA and UV Analysis Results for Polymer Membranes
MEMBRANE
"FRESH"
Clear-Pale Yellow
Colour
(13.4 mg)
"OLD"
Opaque-Purple/
Brown Colour
(10.5 mg)
DETECTION LIMIT
10 mg sample
RSD
PRA [QUINOL]
Test Solution yg/ml
0.078
0.024
0.001
Membrane
yg/mg
1.60
0.63
0.028
3.7^
UV [QUINOL]
Test Solution yg/ml
0.073
0.025
0.006
Membrane
yg/mg
1.50
0.65
0.165
3.6^
As expected the amount of quinol present in the membranes
decreases with increasing exposure to air and light. The colour
change of the membranes is attributed to the formation of the
quinone photodimer and other degradation products (See
sections 3.3.4 and 3-3.5).
3-3.4 The Behaviour of Quinone in THF/PVC/Aliquat 336/Phosphate Buffer
A PRA calibration curve for quinone, in the presence of purified
THF/PVC/Aliquat 336 at a ratio equivalent to membrane analysis,
was found to be linear for the 0.005-0.50 yg/ml concentration
range. The sample matrix without quinone exhibited a PRA step
height of 0.01 yA, equivalent to 2.6 ng/ml quinone In the test
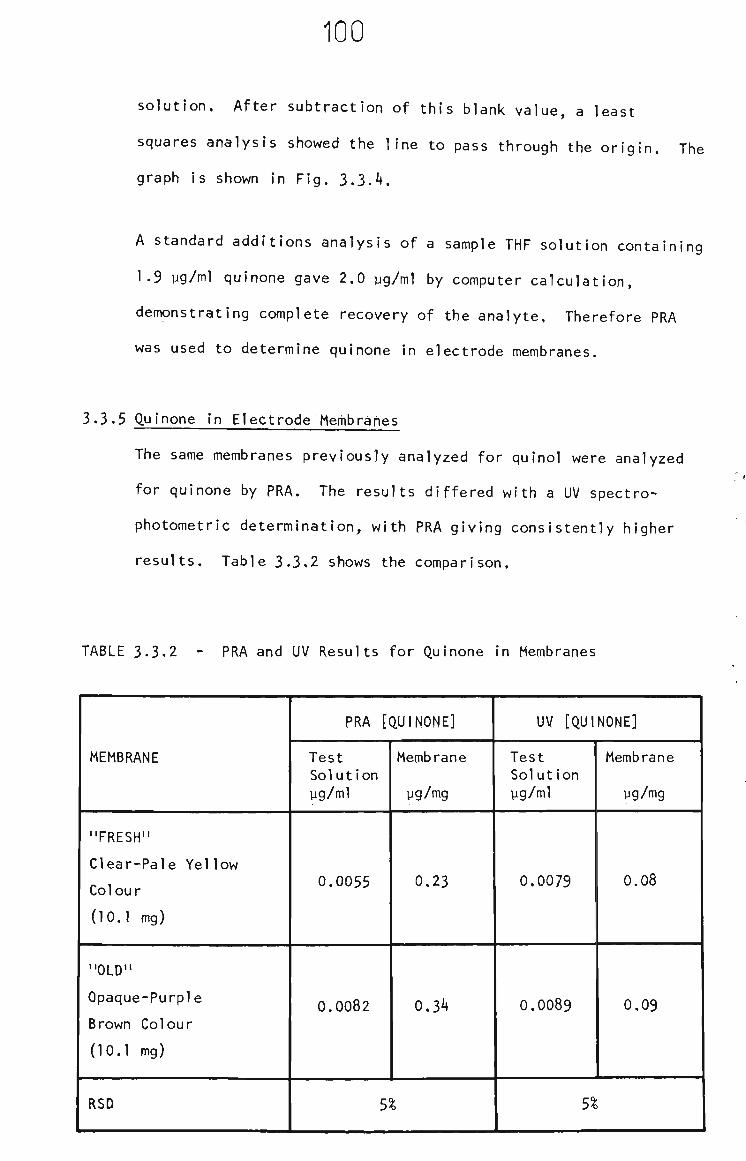
100
solution. After subtraction of this blank value, a least
squares analysis showed the line to pass through the origin. The
graph is shown in Fig. 3.3.4,
A standard additions analysis of a sample THF solution containing
1.9 yg/ml quinone gave 2,0 yg/ml by computer calculation,
demonstrating complete recovery of the analyte. Therefore PRA
was used to determine quinone in electrode membranes.
3.3-5 Quinone in Electrode Membranes
The same membranes previously analyzed for quinol were analyzed
for quinone by PRA. The results differed with a UV spectro-
photometric determination, with PRA giving consistently higher
results. Table 3.3.2 shows the comparison.
TABLE 3.3.2 - PRA and UV Results for Quinone in Membranes
MEMBRANE
"FRESH"
Clear-Pale Yellow
Colour
(10.1 mg)
"OLD"
Opaque-Purple
Brown Colour
(10.1 mg)
RSD
PRA [QUINONE]
Test Solution yg/ml
0.0055
0.0082
Membrane
yg/mg
0,23
0.34
S%
UV [QUINONE]
Test Solution yg/ml
0.0079
0,0089
Membrane
yg/mg
0.08
0,09
S% ]
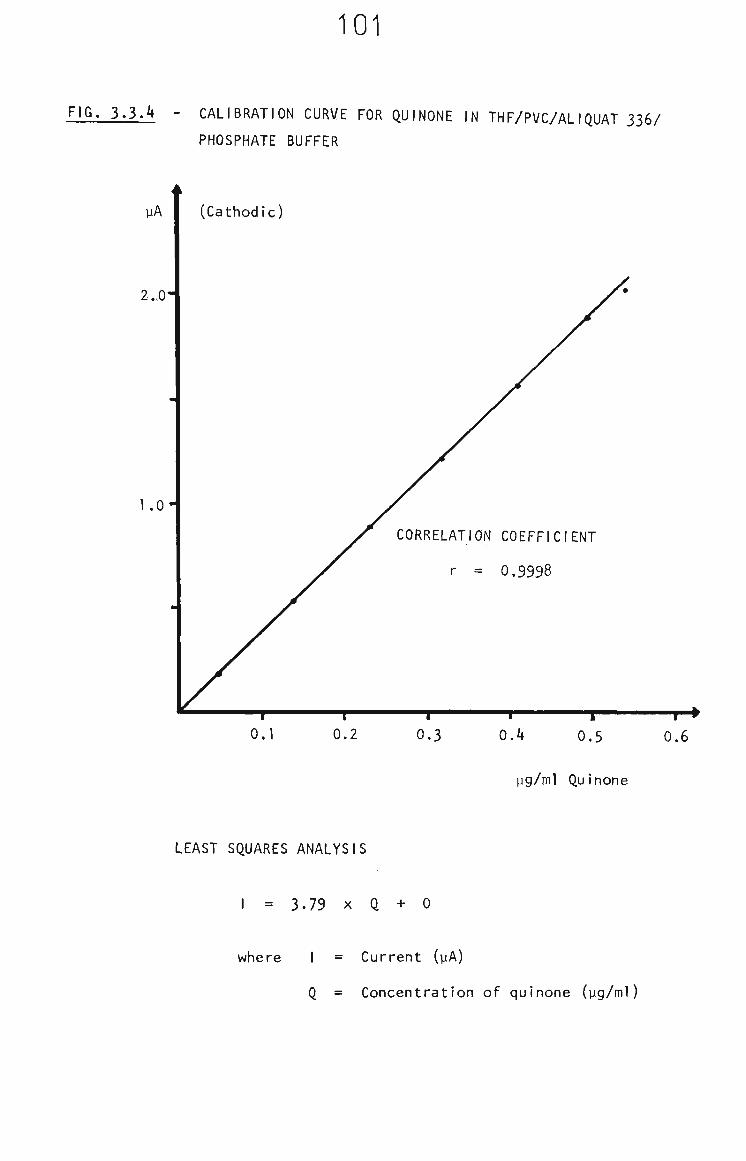
101
FIG. 3.3.4 - CALIBRATION CURVE FOR QUINONE IN THF/PVC/ALIQUAT 336/
PHOSPHATE BUFFER
yA
2.,0-
1.0"
CORRELATION COEFFICIENT
r = 0,9998
nr" 0.3 0.6 0.1
I
0.2 0.4 I
0.5
yg/ml Quinone
LEAST SQUARES ANALYSIS
I = 3.79 X Q + 0
where I = Current (yA)
Q = Concentration of quinone (yg/ml)
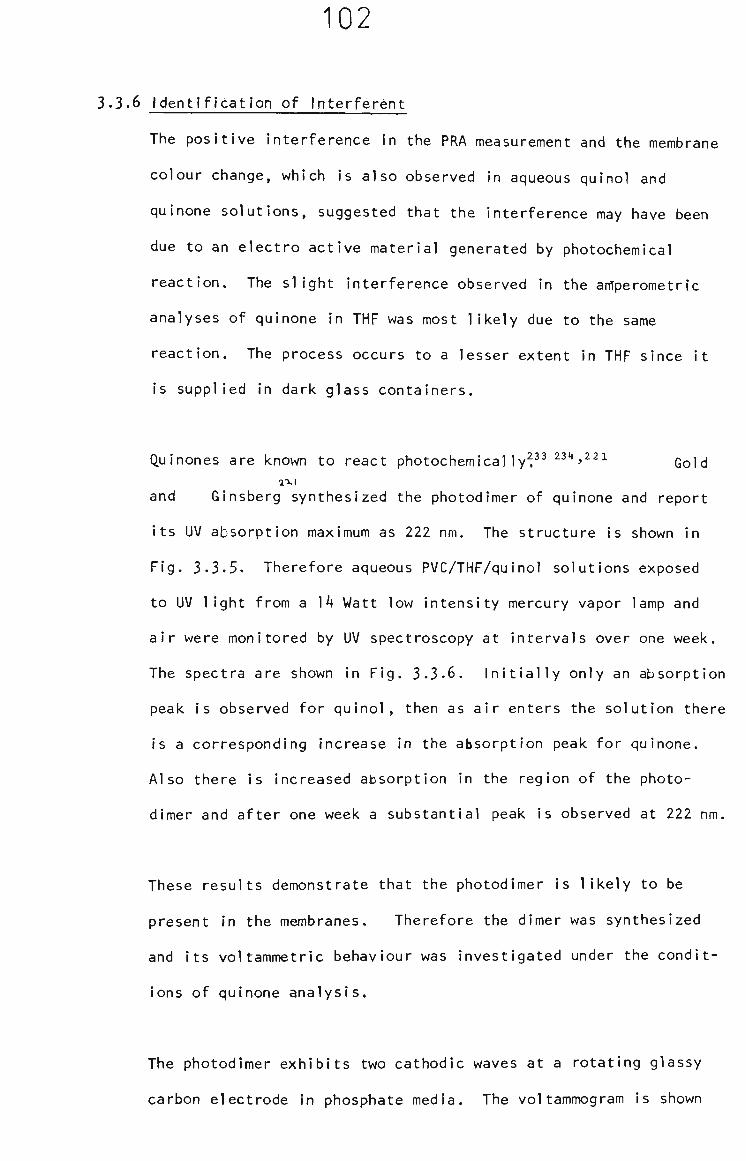
102
3.3.6 Identification of Interferent
The positive interference In the PRA measurement and the membrane
colour change, which is also observed in aqueous quinol and
quinone solutions, suggested that the interference may have been
due to an electro active material generated by photochemical
reaction. The slight interference observed in the antperometric
analyses of quinone In THF was most likely due to the same
reaction. The process occurs to a lesser extent in THF since it
is supplied in dark glass containers.
Quinones are known to react photochemical Iy"^ 234,221 ^ ^ j ^
and Ginsberg synthesized the photodimer of quinone and report
its UV absorption maximum as 222 nm. The structure is shown in
Fig. 3.3.5. Therefore aqueous PVC/THF/quinol solutions exposed
to UV light from a 14 Watt low intensity mercury vapor lamp and
air were monitored by UV spectroscopy at intervals over one week.
The spectra are shown In Fig. 3-3.6. Initially only an absorption
peak is observed for quinol, then as air enters the solution there
is a corresponding increase in the absorption peak for quinone.
Also there is increased absorption In the region of the photo
dimer and after one week a substantial peak is observed at 222 nm.
These results demonstrate that the photodimer is likely to be
present in the membranes. Therefore the dimer was synthesized
and its voltammetric behaviour was investigated under the condit
ions of quinone analysis.
The photodimer exhibits two cathodic waves at a rotating glassy
carbon electrode in phosphate media. The voltammogram is shown
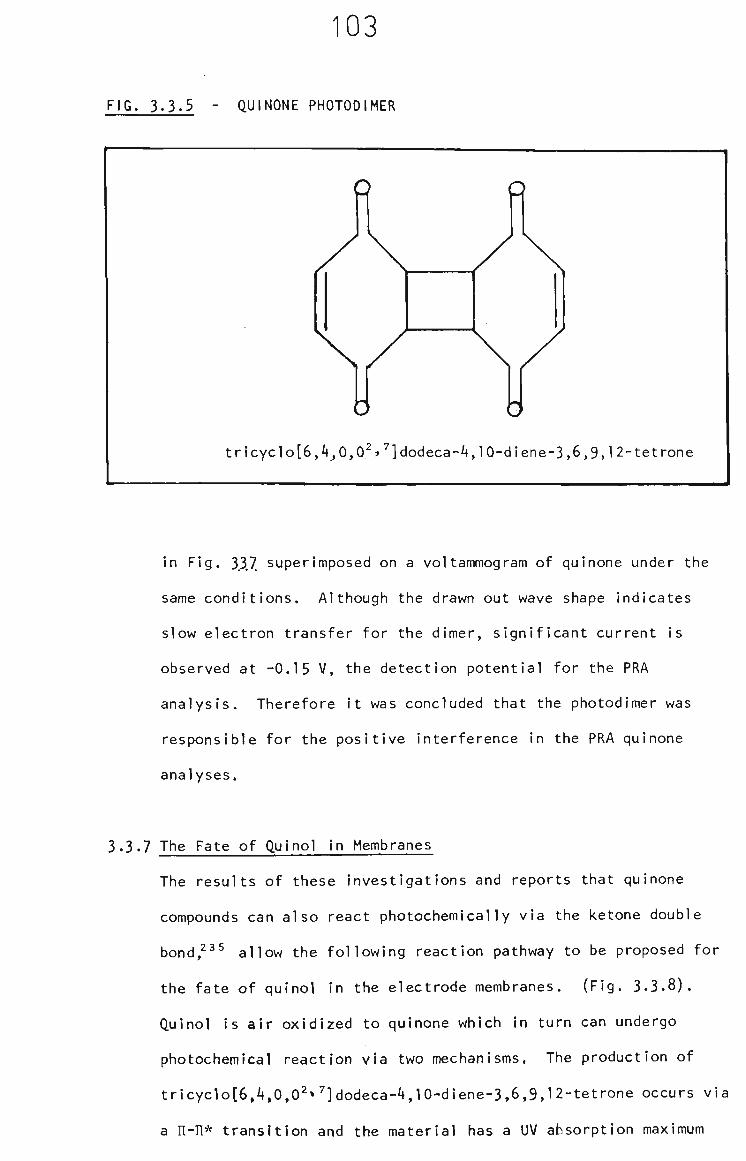
103
FIG. 3.3.5 - QUINONE PHOTODIMER
in Fig. 3.3.7 superimposed on a voltammogram of quinone under the
same conditions. Although the drawn out wave shape indicates
slow electron transfer for the dimer, significant current is
observed at -0.15 V, the detection potential for the PRA
analysis. Therefore it was concluded that the photodimer was
responsible for the positive interference in the PRA quinone
analyses.
3.3.7 The Fate of Quinol in Membranes
The results of these investigations and reports that quinone
compounds can also react photochemical Iy via the ketone double
bond,^^^ allow the following reaction pathway to be proposed for
the fate of quinol in the electrode membranes. (Fig. 3.3.8).
Quinol is air oxidized to quinone which in turn can undergo
photochemical reaction via two mechanisms. The production of
tricyclo[6,4,0,0^»^]dodeca-4,10-diene-3,6,9,12-tetrone occurs via
a n-n* transition and the material has a UV absorption maximum
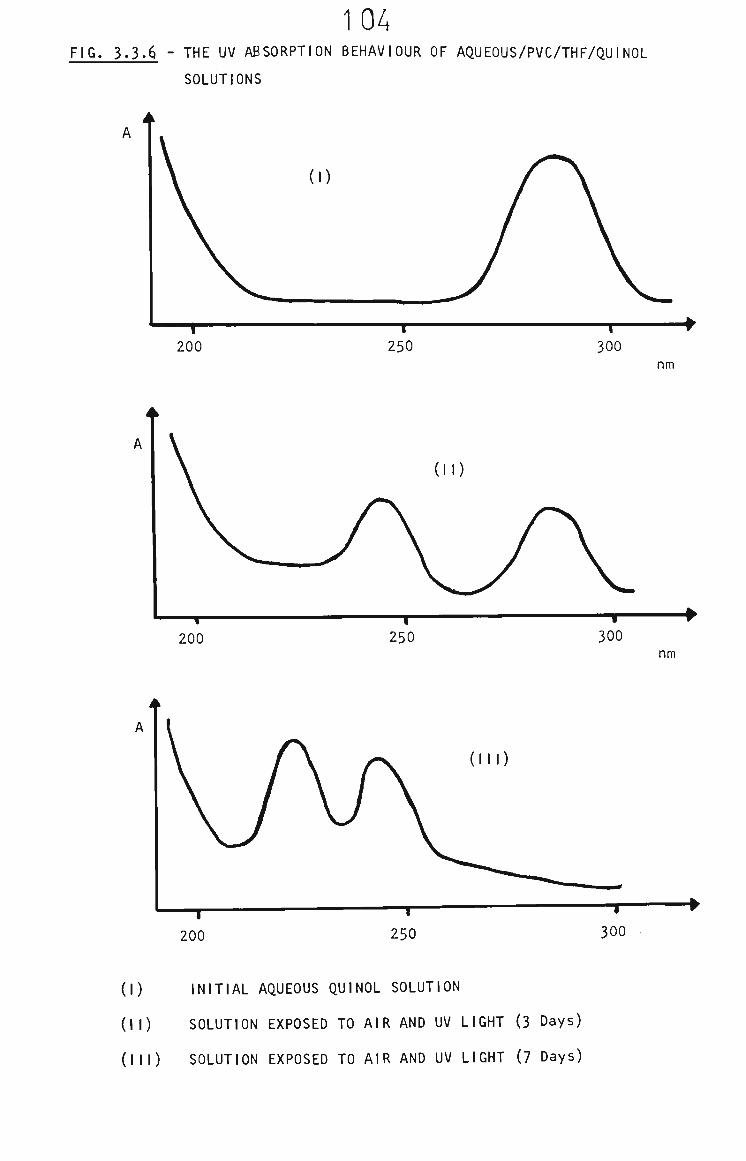
104 FIG. 3.3.6 - THE UV ABSORPTION BEHAVIOUR OF AQUEOUS/PVC/THF/QUINOL
SOLUTIONS
(I)
—r-200
250 I
300
nm
1
200 1
250 300 nm
—r 200
— r -250
— f -
300
(I) INITIAL AQUEOUS QUINOL SOLUTION
(II) SOLUTION EXPOSED TO AIR AND UV LIGHT (3 Days)
(III) SOLUTION EXPOSED TO AIR AND UV LIGHT (7 Days)

105
at 222 nm corresponding to an a, 3 unsaturated ketone without
further conjugation,^^^ The other photochemical reaction proceeds
via a n-IlA transition at the carbonyl group resulting In an a,
e unsaturated ketone with an extra double bond in conjugation.
Such a molecule would have an absorption maximum in the region
of quinone's maximum,^^^ Therefore, from the results of the UV
measurements, the n-TI transition is proposed as the major
photochemical pathway. The product of the n-TI- transition
can undergo further addition, via either transition, to result
in a mixture of high molecular weight materials and It is possible
that these would be present In the electrode membranes.
In conclusion it has been demonstrated that quinol, quinone
and electroactive photochemical reaction products are all
present In the membranes. The presence of these electrochemical
couples will contribute to the internal reference potential of
coated wire ion selective electrodes. The change in membrane
composition with exposure to air and light will contribute to
changes in the electrode's internal reference potential since
the potential Is dependent on the concentrations of the oxidized
and reduced forms of the couples.^^^
Future research could be undertaken to elucidate the complete
electrochemistry of the quinone photodimer.
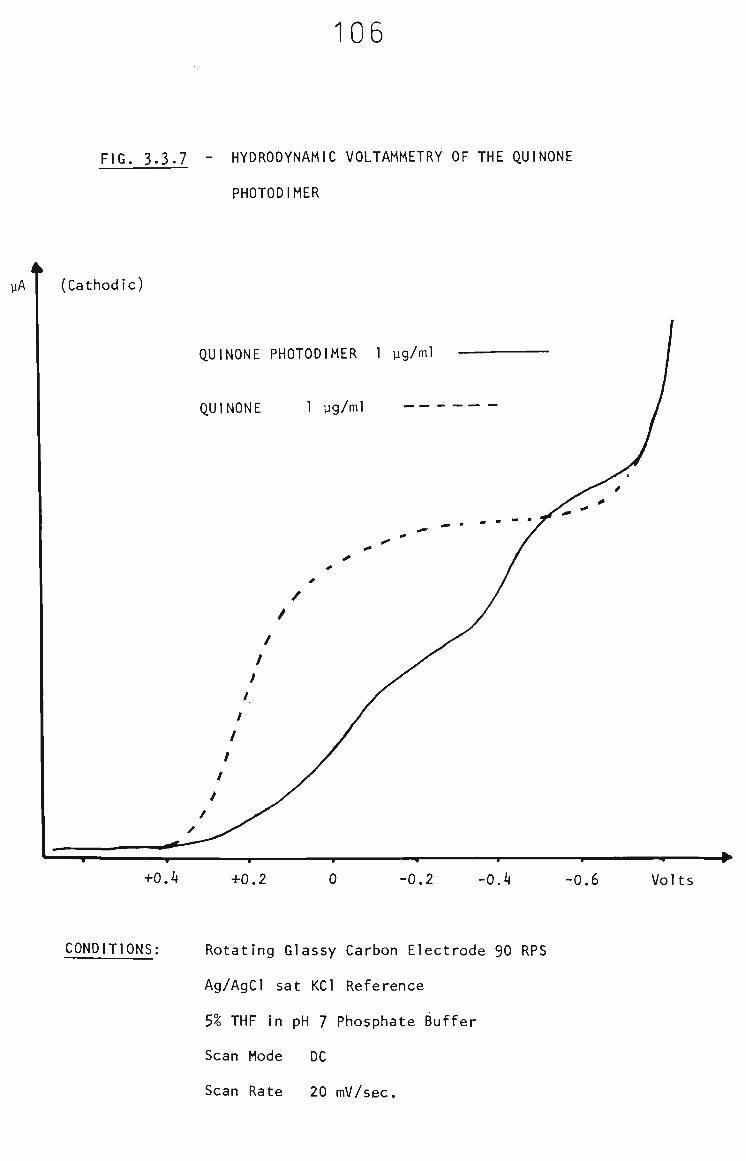
106
FIG. 3.3.7 - HYDRODYNAMIC VOLTAMMETRY OF THE QUINONE
PHOTODIMER
yA (Cathodic)
QUINONE PHOTODIMER I yg/ml
QUINONE 1 yg/ml
Volts
CONDITIONS: Rotating Glassy Carbon Electrode 90 RPS
Ag/AgCl sat KCl Reference
5% THF in pH 7 Phosphate Buffer
Scan Mode DC
Scan Rate 20 mV/sec.
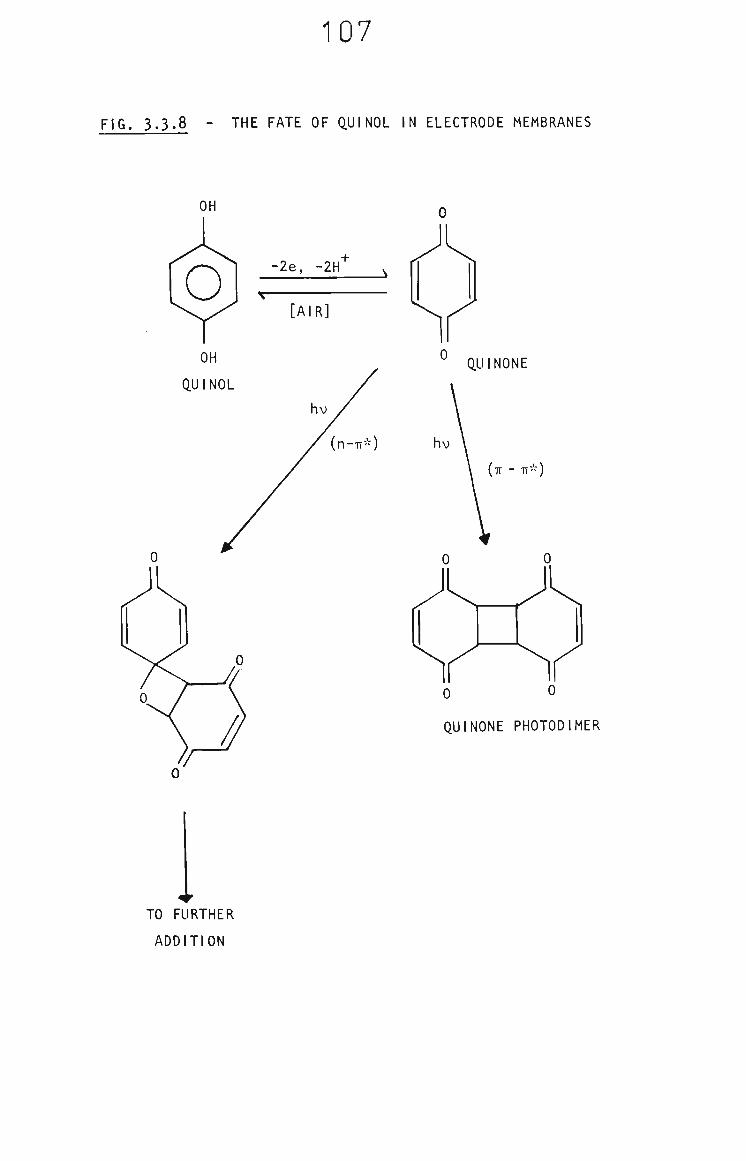
107
FIG. 3.3.8 - THE FATE OF QUINOL IN ELECTRODE MEMBRANES
•2e, -2H
[AIR]
(n-TT'O
QUINONE
(IT - -n*)
0 0
QUINONE PHOTODIMER
TO FURTHER
ADDITION
108
CHAPTER ^
The Electroanalytical Determination
of
Theophylline
in
Pharmaceutical Samples
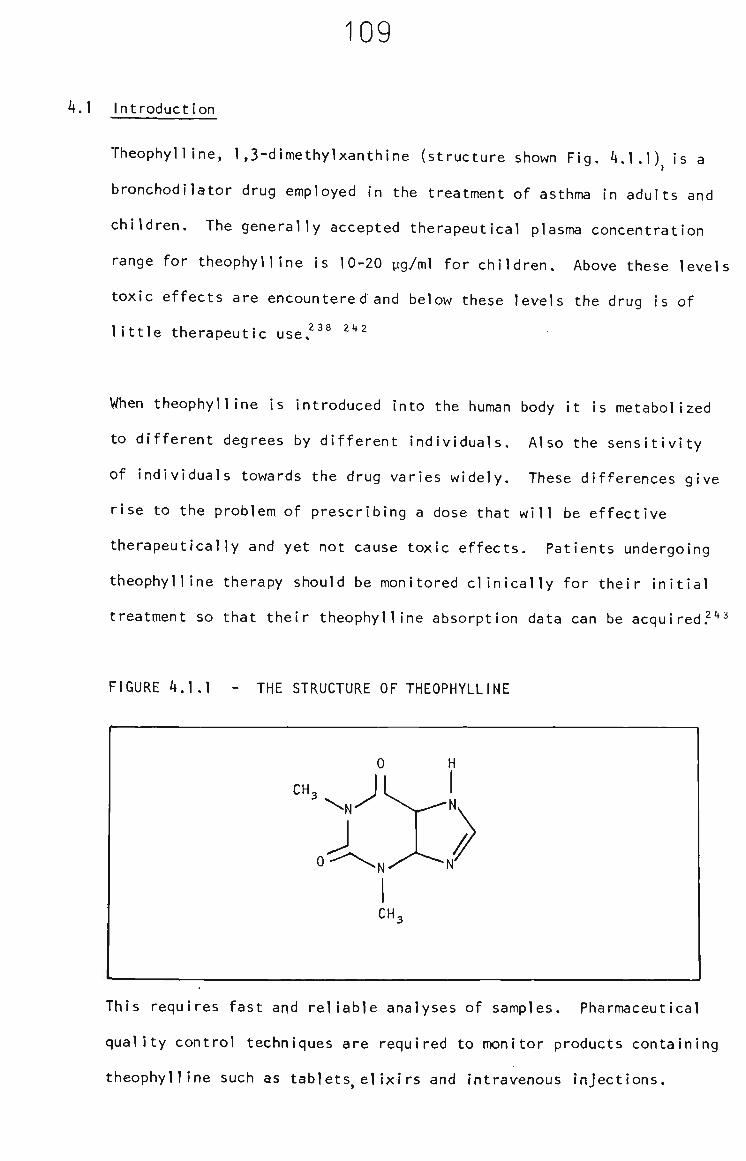
109
4.1 IntroductI on
Theophylline, 1,3-dimethylxanthine (structure shown Fig. 4.1.1) is a
bronchodllator drug employed in the treatment of asthma in adults and
children. The generally accepted therapeutical plasma concentration
range for theophylline is 10-20 yg/ml for children. Above these levels
toxic effects are encountered and below these levels the drug is of
little therapeutic use.^'' " ^
When theophylline is introduced into the human body it is metabolized
to different degrees by different individuals. Also the sensitivity
of individuals towards the drug varies widely. These differences give
rise to the problem of prescribing a dose that will be effective
therapeutically and yet not cause toxic effects. Patients undergoing
theophylline therapy should be monitored clinically for their Initial
treatment so that their theophylline absorption data can be acqui red. '*
FIGURE 4,1.1 - THE STRUCTURE OF THEOPHYLLINE
0
CH3
H
: >
This requires fast and reliable analyses of samples. Pharmaceutical
quality control techniques are required to monitor products containing
theophylline such as tablets, elixirs and intravenous injections.

110
The reported methods for theophylline vary in analysis time, expense,
sensitivity and selectivity. For the purpose of this work the methods
can be divided Into electrochemical techniques and other techniques.
The non-electrochemical techniques Include the following. Ultraviolet
(U.V.) spectrophotometry ,'*'*" '* gas chromatography^"^^'^^ gas chromato-
graphy/mass spectrometry^^^ radioimmunoassay"'*"^^^ f Iuorimetry^""^^^ and
high performance I I quid chromatography (H.P.L.C.) with U.V. detection!^"^^^
The electrochemical techniques are a direct voltammetric procedure,
2 72
reported by Munson and Abdine and a H.P.L.C. technique using electro
chemical detection reported by Lewis and Johnson.^^^
The electrochemistry of theophylline and the methylxanthines, in
2 7 u 2 7 6
general, was first studied by Dryhurst in the early I970's.
The oxidation of the xanthines was studied at pyrolytic graphite
electrodes with conventional direct current voltammetry. Using infra
red (I.R.), U.V. and mass spectroscopy, fast scan cyclic volt
ammetry and polarography, Dryhurst postulated mechanisms for these
oxidations and compared them to biological oxidations. The primary
electrode processes in the oxidation of theophylline at pyrolytic 276-277
graphite is shown in Fig. 4.1.2 After the initial removal of an
electron to produce a free radical the reaction proceeds via two
pathways to produce a dimer and 1,3*dimethyluricacid-4,5-diol.
The 4,5 diol is unstable undergoing secondary reaction to eventually
produce a parabanic acid, dimethyl urea and carbon dioxide. Dryhurst
reports the oxidation of theophylline to be first order with respect
to hydrogen ions signifying the need for buffered analyte solutions.
Two anodic waves are observed at pyrolytic graphite electrodes. The
first wave Is attributed, by Dryhurst, to the adsorption of
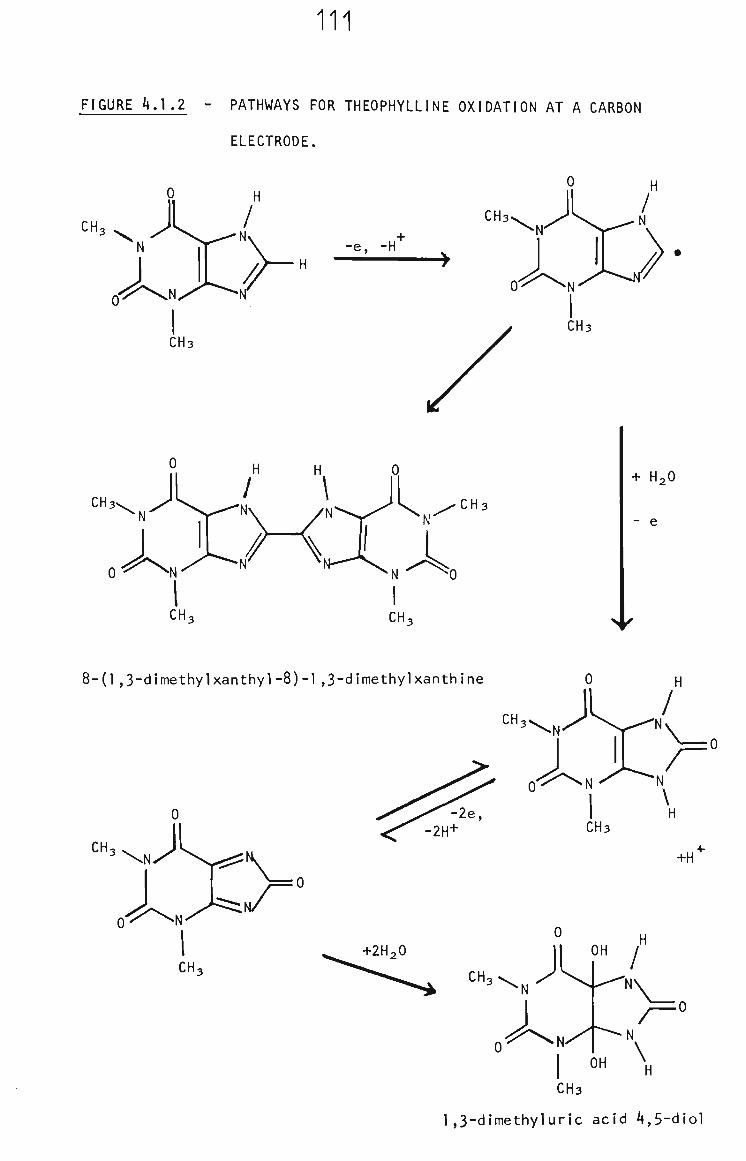
111
FIGURE 4.1.2 - PATHWAYS FOR THEOPHYLLINE OXIDATION AT A CARBON
ELECTRODE.
CH,
0 H
""KI^\<—Nv -y X
CHs
CH 3 \ CHs
+ H2O
8-(l,3-dimethylxanthyl-8)-l,3-dimethylxanthine
CH:
0 H
/
CH, \ N
J 0 ^ ^ N
xX •N ^ N
CH3
X +H
CH, +2H2O OH
CH,
J /
OH \
CH3
1,3-dimethyluric acid 4,5-diol
112
8-(l,3-dimethylxanthyl-8)-1,3-dimethylxanthine, the second wave being
due to the faradiac process. Munson and Abdine^''^ report the use of a
carbon paste electrode (CPE) for the differential pulse voltammetric
analysis of theophylline in plasma. They do not report an adsorption
wave with this electrode. Therefore the voltammetric oxidation of
theophylline at a CPE was investigated.
4.2 Voltammetry of Theophylline at the Carbon Paste Electrode
At the CPE In pH = 7 phosphate buffer, theophylIine exhibits an anodic
peak at +1.1 Volts versus an Ag/AgCJl saturated KCl/]0% KNO3 reference
electrode. This potential corresponds to the faradaic wave observed
by Dryhurst after correction for different reference electrodes.
Successive anodic voltammograms (as shown in Fig. 4.2.1) on the same
surface show a decrease in peak height. This is due to the dimeric
oxidation product accumulating and diminishing the available electrode
surface area. Dryhurst has isolated the dimer and shown that it
is very insoluble in aqueous solution and It accumulates at the
electrode surface.
When fresh carbon paste surfaces are used for each voltammogram
constant peak heights are observed for each concentration. Also using
this technique the peak height is linearly proportional to the
theophylline concentration. The calibration graph for the differential
pulse voltammetric data has a large positive intercept. The correl
ation coefficient was found to be 0.9999 and a least squares analysis
yielded the following equation:
I = (4.16 ± 0.03) X Cj. + 0.40 ± 0.02
where I - Peak height in y Amps
and Cy = Theophylline Concentration (moles/litre x 10~^)
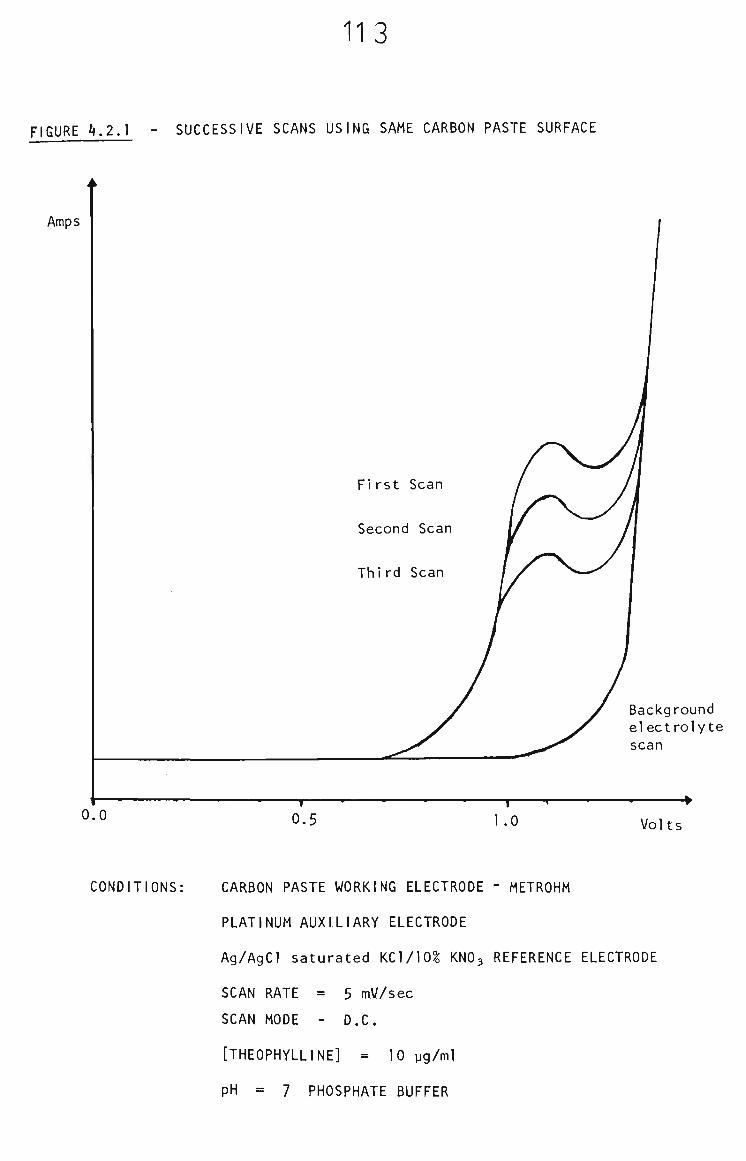
113
FIGURE 4.2.1 SUCCESSIVE SCANS USING SAME CARBON PASTE SURFACE
Amps
0.0 0.5 — I —
1.0
Background electrolyte scan
Volts
CONDITIONS: CARBON PASTE WORKING ELECTRODE - METROHM
PLATINUM AUXILIARY ELECTRODE
Ag/AgCl saturated KCl/10^ KNO3 REFERENCE ELECTRODE
SCAN RATE = 5 mV/sec
SCAN MODE - D.C.
[THEOPHYLLINE] = 10 yg/ml
pH = 7 PHOSPHATE BUFFER
114
Phosphate buffer solutions containing theophylline were analysed with
a relative standard deviation (RSD) of 3.5%.
4.3.1 Hydrodynamic Voltammetry of Theophylline at Rotating Carbon Paste
Disc Electrodes In Phosphate Buffer
Hydrodynamic voltammetry was used to determine the best region
of applied potential for PRA. Fig. 4.3.1 shows voltammograms at
two rotation rates for theophylline In phosphate buffer. The
peak potential was found to be +1.06 V versus an Ag/AgC£ sat.
KC£/10^ KNO3 reference. A peak is observed in these hydrodynamic
voltammograms because of product accumulation at the electrode
surface. This potential was considered to be the start of
the region where the faradaic current from theophylline oxidation
is mass transport controlled and not potential dependent.
Therefore the potentials used for PRA detection were more
positive than +1.06 V.
4.3.2 The Pulsed Rotation Amperometric Determination of Theophylline
An analytical procedure, using pulsed rotation amperometry (PRA)
at a carbon paste disc electrode^was developed to determine
theophylline in various materials. Calibration curves are
linear and pass through the origin enabling the use of standard
additions for quantitation, (See Figure 4.3.2). The results
compare well with U.V. spectrophotometry.
PRA offers advantages over conventional voltammetric techniques
as it provides good discrimination between mass-transport
dependent and potential dependent components of current. It is
particularly useful where background currents are high and
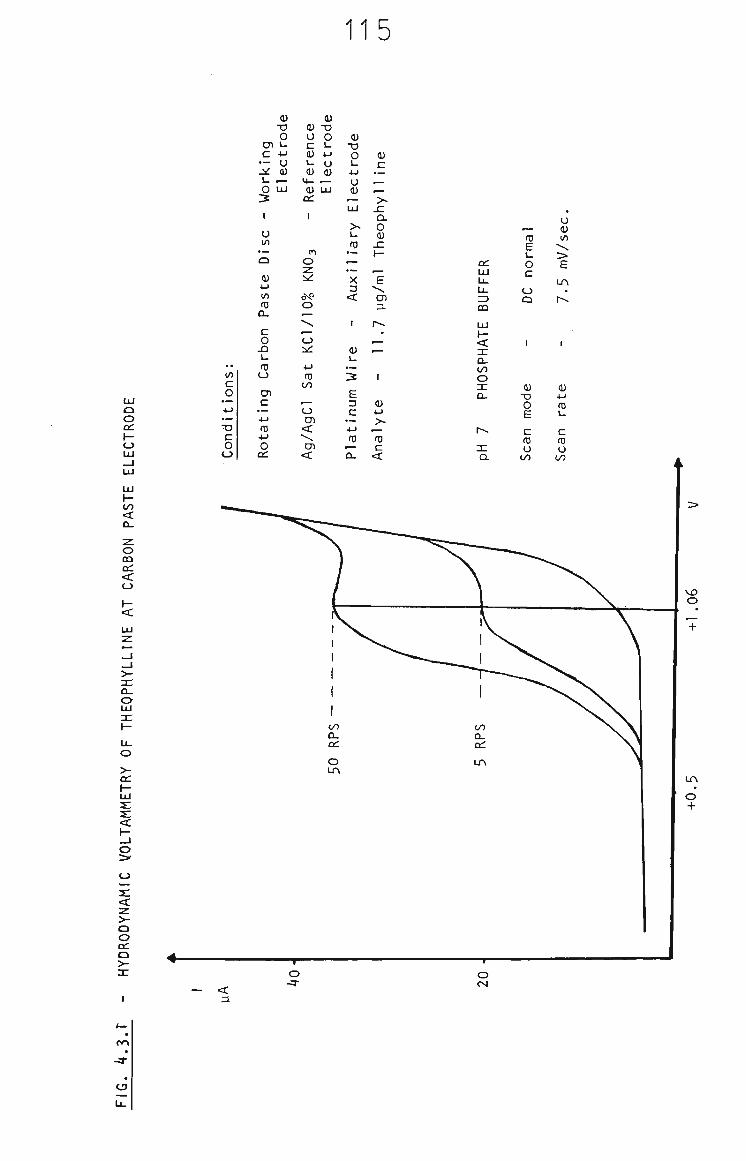
115
LU O O CC y-
LU _a LU
LU H to <
o OQ CC
<c o
•• in c o •"— 4-> — • o c o o
O) c
— J^ \-o 3 1
o in •^ Q
(U 4-* in ro a. c o JU u ro CJ
en c
•— 4-'
ro +-> O
OC
0) -D
o 1-4-) o (U
w—
LU
(U o c (U 1-(U
u-<u CC
1
< o z ifi
d e o -
f ^
o i«i
4->
ro to
•— <_) en
< \ CTl
<
(U -u o u 4-)
o (U
.-~ LU
0) • D O t_ 4.1
o 0)
LU
)_ ro • M
•^
X 3
<
,
<U l_
. . . rs E 3 C
• ^
+J ro a.
0) c
. ^
. ^
op
hy
(U .c 1-
1 >. en 3 .
r^ .
^_ ,
1
<u 4-1 > .
ro c
<
OQ
ro E \-O c
CJ Q
U <U in
> E
a. to o 3 : Q-
r-v
I E Q.
0) X I 0 E
c ro u
l O
03 4-1
ro i_
c ro o
OO
o LU
>-OC
lU
g o
< z >-o OC o >-X
-fl
ea
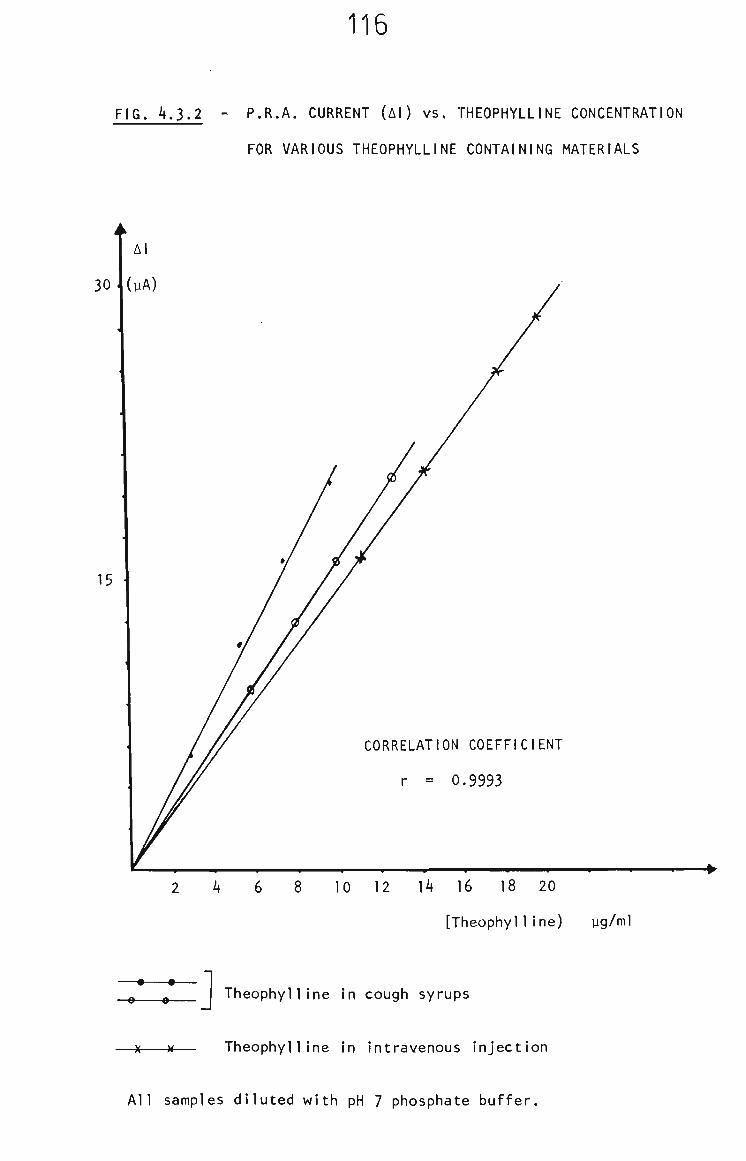
116
FIG. 4.3.2 - P.R.A. CURRENT (Al) vs. THEOPHYLLINE CONCENTRATION
FOR VARIOUS THEOPHYLLINE CONTAINING MATERIALS
CORRELATION COEFFICIENT
r = 0.9993
2 4 6 8 10 12 14 16 18 20
[Theophylline) yg/ml
: = ] -H )(-
Theophylline in cough syrups
Theophylline in intravenous injection
All samples diluted with pH 7 phosphate buffer.
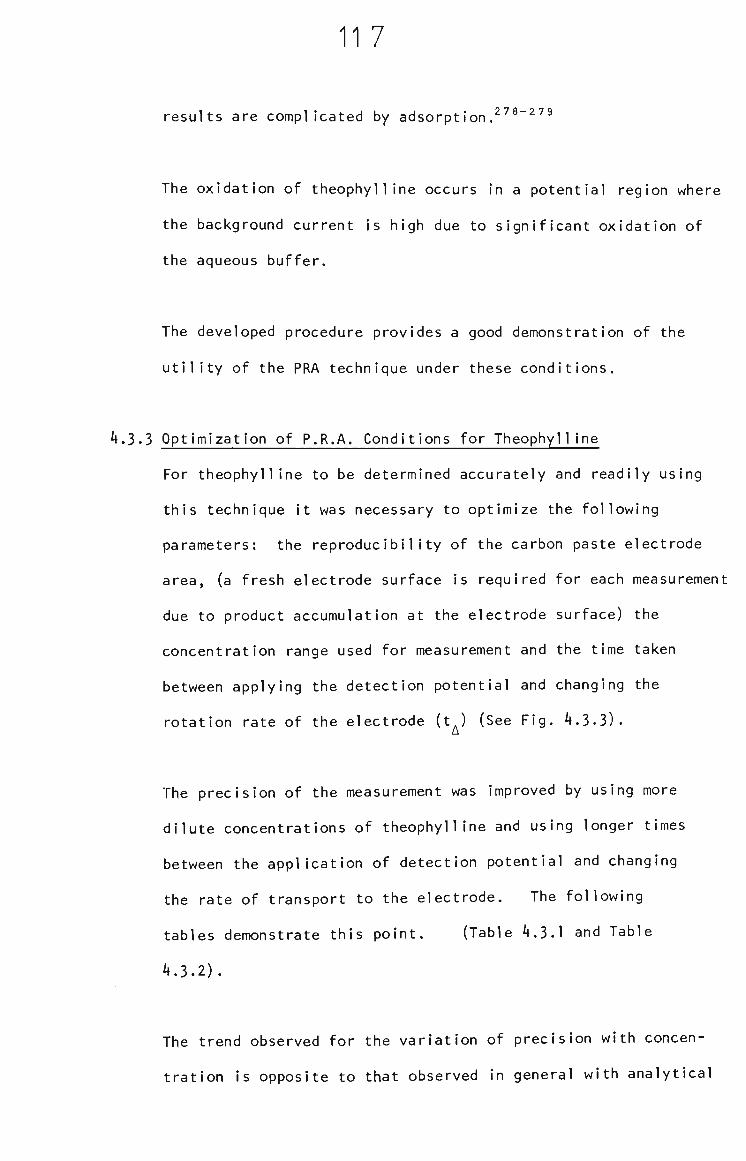
11 7
results are complicated by adsorption 278-279
The oxidation of theophylline occurs in a potential region where
the background current is high due to significant oxidation of
the aqueous buffer.
The developed procedure provides a good demonstration of the
utility of the PRA technique under these conditions.
4.3.3 Optimization of P.R.A. Conditions for Theophylline
For theophylline to be determined accurately and readily using
this technique It was necessary to optimize the following
parameters: the reproducibility of the carbon paste electrode
area, (a fresh electrode surface is required for each measurement
due to product accumulation at the electrode surface) the
concentration range used for measurement and the time taken
between applying the detection potential and changing the
rotation rate of the electrode (t^) (See Fig. 4.3.3).
The precision of the measurement was improved by using more
dilute concentrations of theophylline and using longer times
between the application of detection potential and changing
the rate of transport to the electrode. The following
tables demonstrate this point. (Table 4.3.1 and Table
4.3.2).
The trend observed for the variation of precision with concen
tration is opposite to that observed in general with analytical
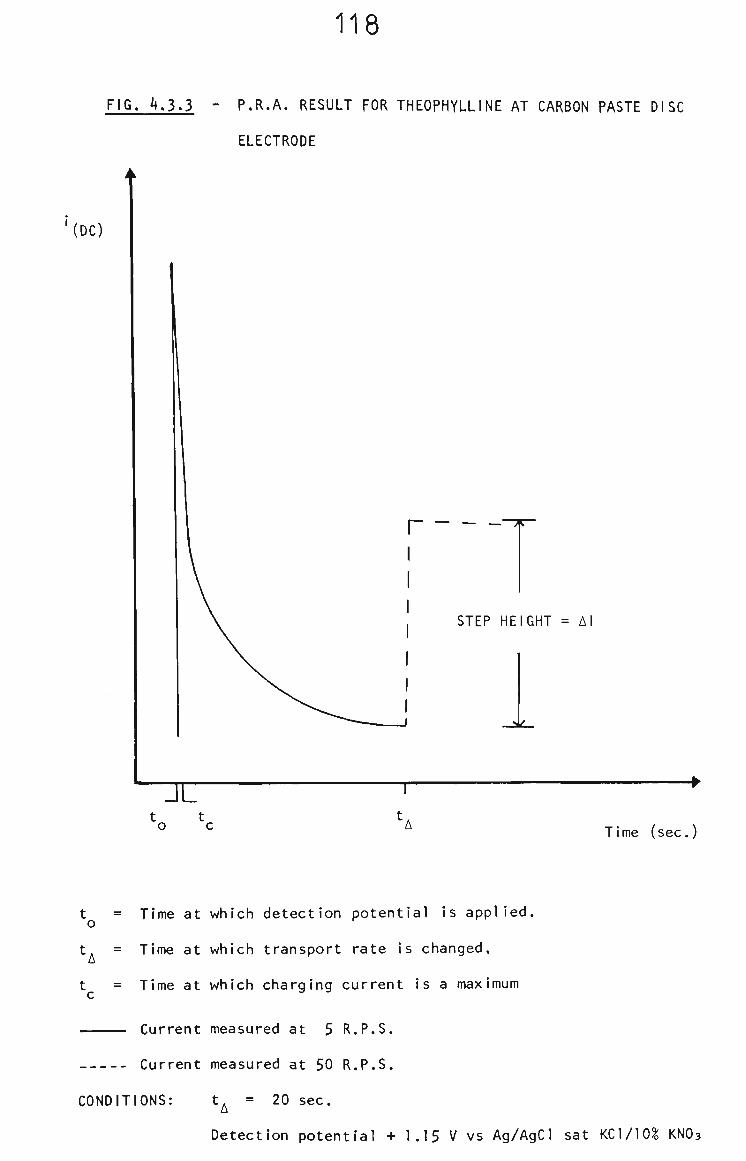
118
FIG. 4.3.3 - P.R.A. RESULT FOR THEOPHYLLINE AT CARBON PASTE DISC
ELECTRODE
(DC)
t t o c
STEP HEIGHT = AI
Time (sec.)
t = Time at which detection potential is applied,
t = Time at which transport rate Is changed,
t = Time at which charging current is a maximum
Current measured at 5 R.P.S.
Current measured at 50 R.P.S.
CONDITIONS: t^ = 20 sec.
Detection potential + 1.15 V vs Ag/AgCl sat KCl/10% KNO3
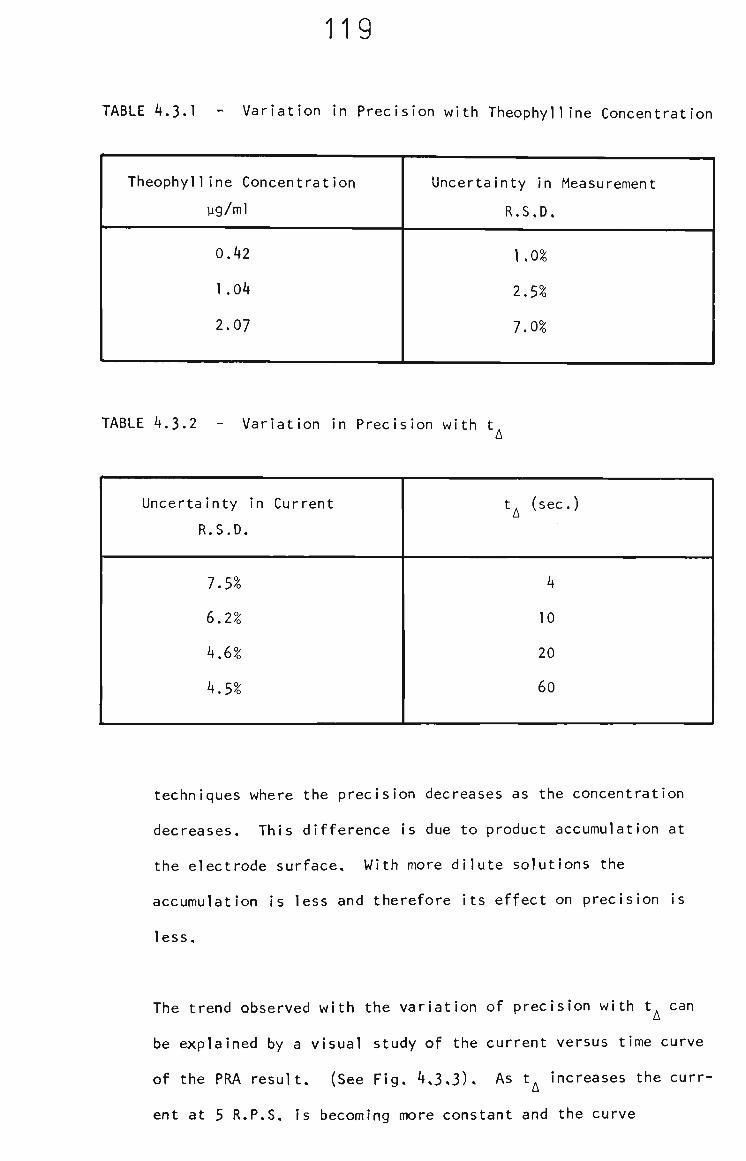
119
TABLE 4.3.1 - Variation in Precision with Theophylline Concentration
Theophylline Concentration
yg/ml
0,42
1.04
2.07
Uncertainty in Measurement
R.S.D.
1.0^
2.5^
7.0^
TABLE 4.3.2 - Variation in Precision with t,
Uncertainty in Current
R.S.D.
7.5^
6.2^
4.6 0
4.5°
t^ (sec.)
4
10
20
60
techniques where the precision decreases as the concentration
decreases. This difference is due to product accumulation at
the electrode surface. With more dilute solutions the
accumulation is less and therefore its effect on precision is
less.
The trend observed with the variation of precision with t can
be explained by a visual study of the current versus time curve
of the PRA result. (See Fig. 4,3.3). As t increases the curr
ent at 5 R.P.S. is becoming more constant and the curve
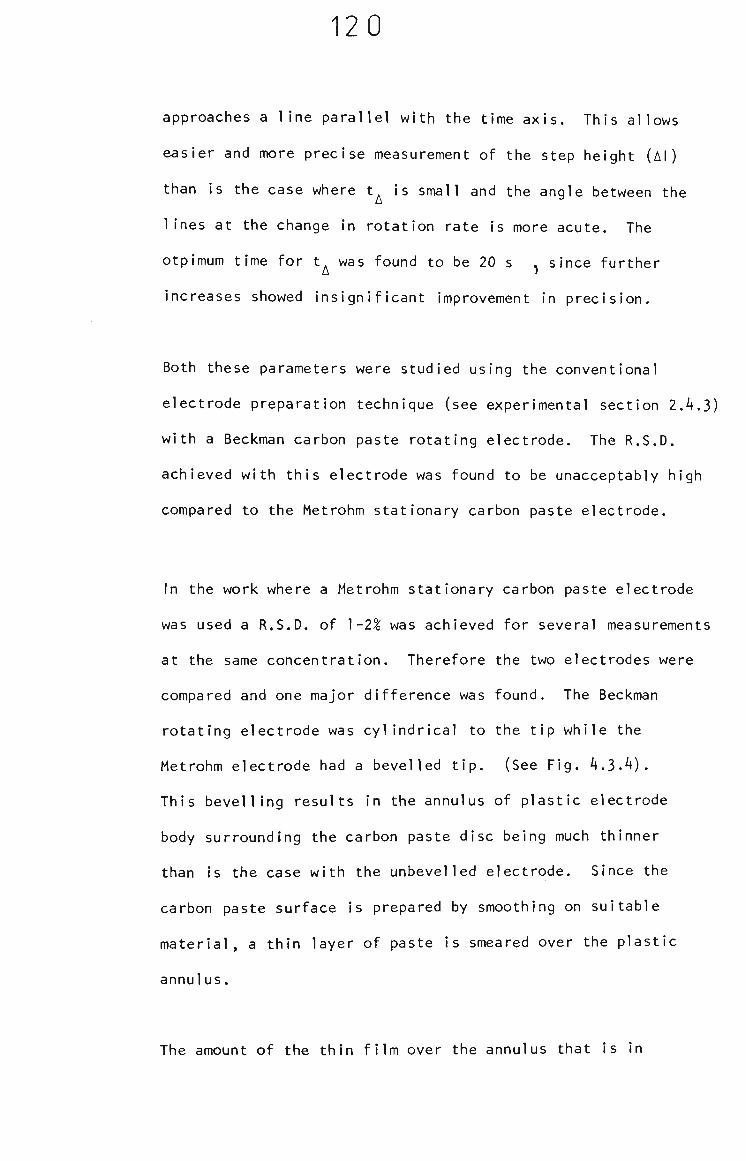
120
approaches a line parallel with the time axis. This allows
easier and more precise measurement of the step height (Al)
than Is the case where t is small and the angle between the
lines at the change In rotation rate is more acute. The
otpimum time for t was found to be 20 s ^ since further
increases showed insignificant Improvement in precision.
Both these parameters were studied using the conventional
electrode preparation technique (see experimental section 2.4.3)
with a Beckman carbon paste rotating electrode. The R.S.D.
achieved with this electrode was found to be unacceptably high
compared to the Metrohm stationary carbon paste electrode.
In the work where a Metrohm stationary carbon paste electrode
was used a R.S.D. of 1-2^ was achieved for several measurements
at the same concentration. Therefore the two electrodes were
compared and one major difference was found. The Beckman
rotating electrode was cylindrical to the tip while the
Metrohm electrode had a bevelled tip. (See Fig. 4.3-4).
This bevelling results in the annulus of plastic electrode
body surrounding the carbon paste disc being much thinner
than is the case with the unbevelled electrode. Since the
carbon paste surface is prepared by smoothing on suitable
material, a thin layer of paste is smeared over the plastic
annulus.
The amount of the thin film over the annulus that is in
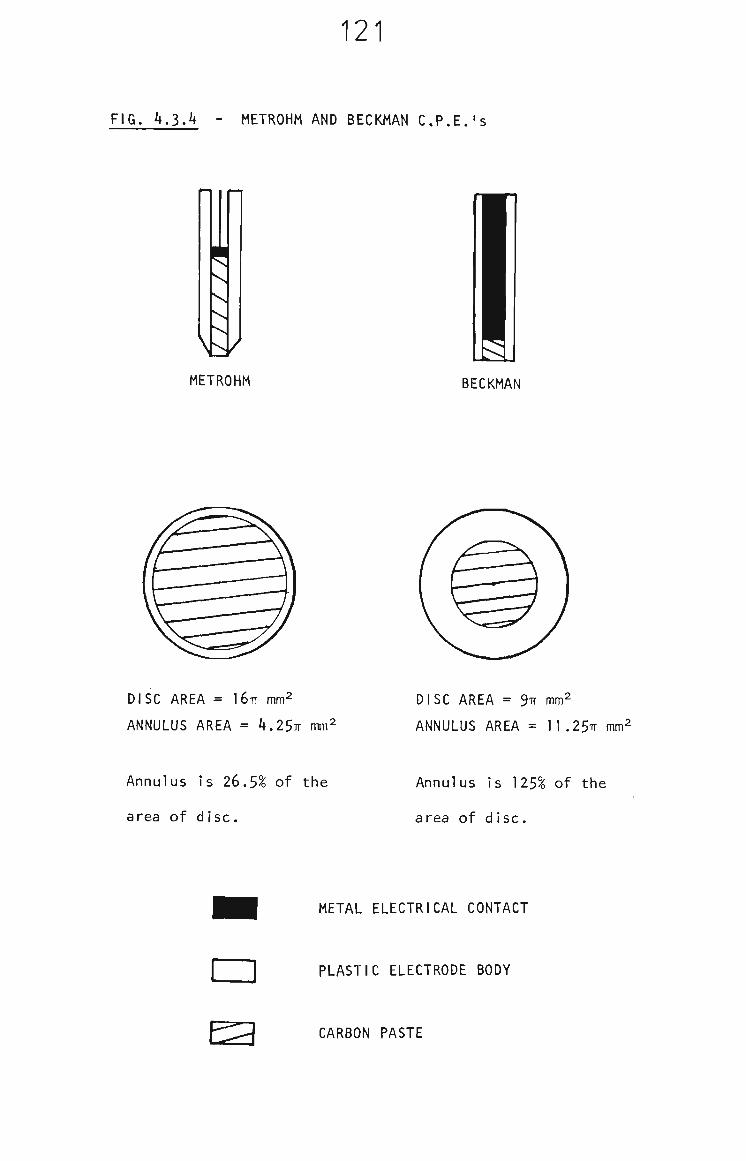
121
FIG. 4.3.4 - METROHM AND BECKMAN C.P.E.'s
METROHM BECKMAN
DISC AREA = 1671 mm^
ANNULUS AREA = 4.25Tr mm^
DISC AREA = 3-n mm^
ANNULUS AREA = II .25Tr mm^
Annulus Is 26.5^ of the
area of disc.
Annulus Is 125^ of the
area of disc.
METAL ELECTRICAL CONTACT
CD PLASTIC ELECTRODE BODY
^ CARBON PASTE
122
electrical contact with the carbon paste disc Is variable and
hence the overall electrode area is variable. For a constant
electrode area from run to run the annulus must be kept at a
minimum. It was found that for the Beckman electrode the area
of the annulus was 125^ of the area of its carbon paste disc.
Therefore the Beckman electrode was machined to give a bevelled
tip with an annulus similar to the Metrohm electrode. When this
new electrode geometry was evaluated the precision was found to
be 1,5^ R.S,D, for several measurements at one concentration and
between 2 and 3% R.S.D, for a 3 additions standard addition
analysis. This is comparable with that found for voltammetric
determination of theophylline at the Metrohm stationary carbon
paste disc.
Also this degree of precision was found over a wider concentrat
ion range than was initially indicated by the results of the
variation in precision with concentration experiment (Table 4.3.1),
The analyses can be carried out In solutions ranging in
concentration from 0.1 yg/ml to 30 yg/ml theophylline without
reducing the precision. At concentrations above 30 yg/ml the
R.S.D. increases due to more severe fouling of the electrode
surface. Also curvature of the calibration plot is observed.
4.3.4 The Determination of Theophylline in Pharmaceuticals
Theophylline was determined In a range of pharmaceutical products
by PRA. Each product was investigated by hydrodynamic voltamm
etry to detect the presence of any electroactive interferent.
Of the products studied, only those that contained gulaiphenin
(See Fig. 4.3.5 for the structure) showed any interference.

123
FIG. 4.3.5 - THE STRUCTURE OF GUIAIPHENIN
OCH,
O-CH2-CH-CH2-OH
I OH
GUIAIPHENIN 3-(2-methoxyphenoxy)-propane-l ,2 d i o l
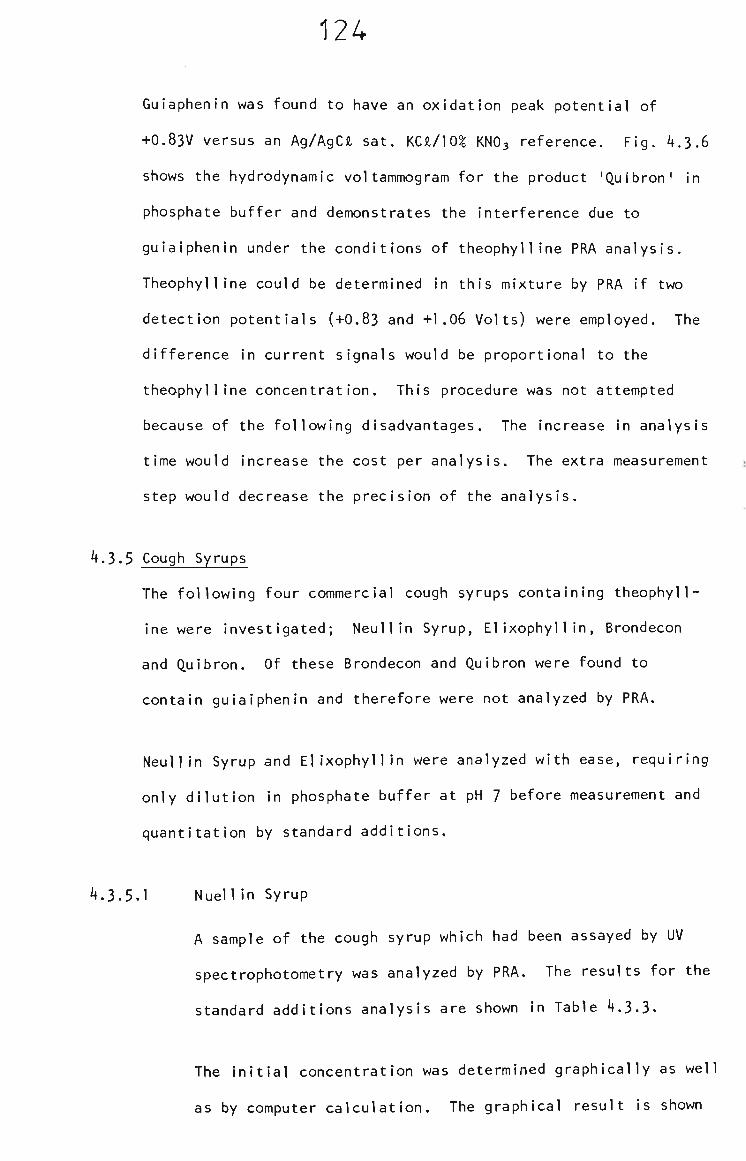
124
Gulaphenin was found to have an oxidation peak potential of
+0.83V versus an Ag/AgC)l sat, KC£/10^ KNO3 reference. Fig. 4.3.6
shows the hydrodynamic voltammogram for the product 'Quibron' In
phosphate buffer and demonstrates the Interference due to
gulaiphenin under the conditions of theophylline PRA analysis.
Theophylline could be determined in this mixture by PRA if two
detection potentials (+O.83 and +I.06 Volts) were employed. The
difference In current signals would be proportional to the
theophylline concentration. This procedure was not attempted
because of the following disadvantages. The increase in analysis
time would increase the cost per analysis. The extra measurement
step would decrease the precision of the analysis.
4.3.5 Cough Syrups
The following four commercial cough syrups containing theophyll
ine were investigated; Neullln Syrup, Elixophyllin, Brondecon
and Quibron. Of these Brondecon and Quibron were found to
contain gulaiphenin and therefore were not analyzed by PRA.
Neullln Syrup and Elixophyllin were analyzed with ease, requiring
only dilution in phosphate buffer at pH 7 before measurement and
quantitation by standard additions.
4.3.5-1 Nuell in Syrup
A sample of the cough syrup which had been assayed by UV
spectrophotometry was analyzed by PRA. The results for the
standard additions analysis are shown in Table 4.3-3-
The initial concentration was determined graphically as well
as by computer calculation. The graphical result Is shown
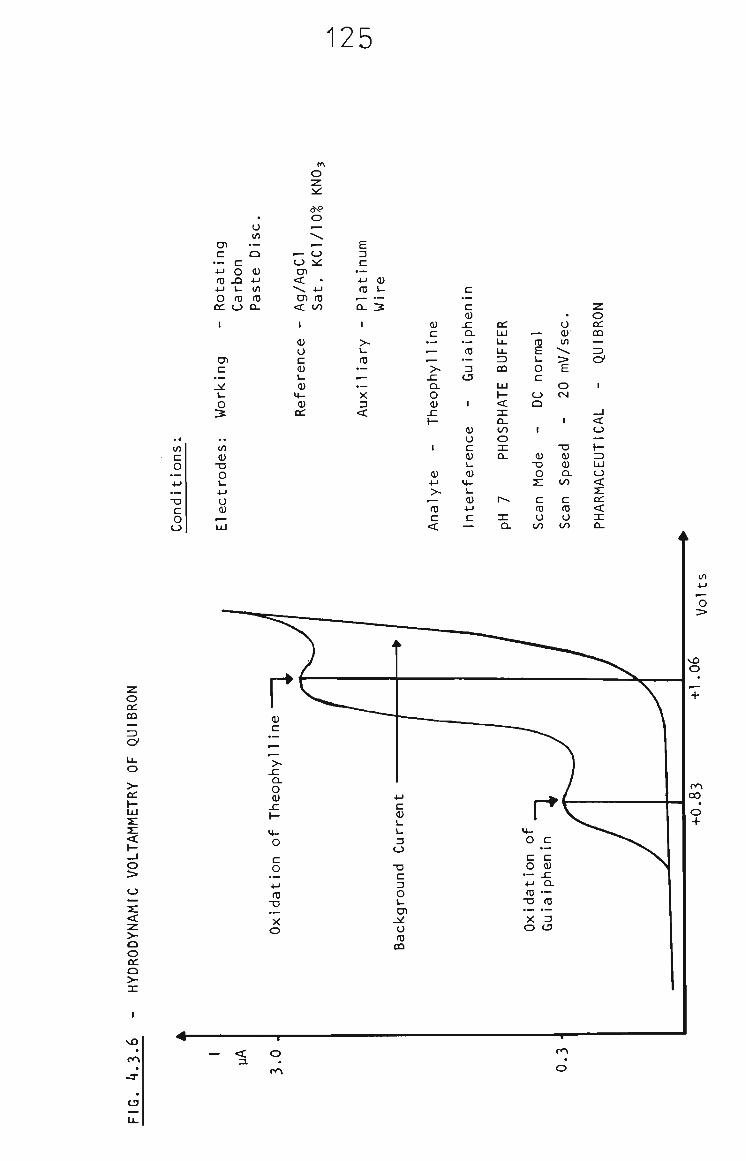
125
a .
in
c o 4-»
• o c o o
D) c
.^ 4-»
ro 4-) O
OC
1
O l
c .^ .^ u o :s
•• in (U
"O O L. 4-)
o (U
Hj
c o J 3 L.
ro o
. o in
•^ o 0) 4-> in
ro Q -
1 —
O O)
< \
O )
< 1
(U o c (U 1_ 0)
M-(U
CC
tn
o z i ^
d * O • —
*v. ^-o ^
. 4-1
ro to
E 3 C
.— 4-<
ro f —
Q-
>-i_
ro •— v.—
•— X 3
<
<U >_
•— 3
0)
.— ~
.— >•
SI CL
o (U .c 1-
1
0) 4->
>~ .— ro c
<
c •—
phen
•— ro
•— 3
O
1
0)
o c 0) u (1)
l+-
\-<u 4->
c —
CC LU LL.
U . Z ) OQ
LU H <
SPH
o 3 :
a.
r^ 3 :
a.
ro E u O c o o
1
03 -e» O
SL
C
ro o 0 0
o in
^ s
> E
O CM
1
"O (U (U Q .
to
c ro o
to
BRON
— Z) cy
1
CAL
^ 1-z> LU O
< s: a: < 3 : Q-
o CC OQ
>-CC y-LU •Si SL <
o
>-o o OC o >-
o >
vO O
OO
o +
I
vO
CO < 3.
O
CO
—f—
O
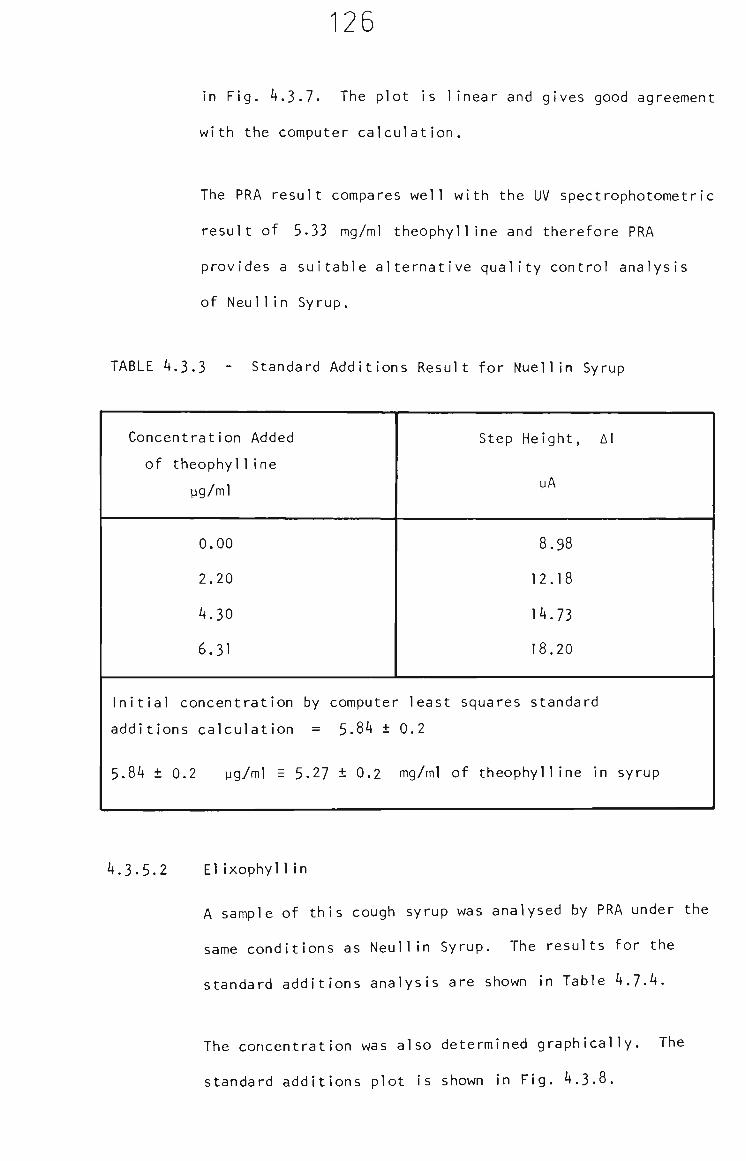
126
in Fig. 4.3.7- The plot is linear and gives good agreement
with the computer calculation.
The PRA result compares well with the UV spectrophotometric
result of 5-33 mg/ml theophylline and therefore PRA
provides a suitable alternative quality control analysis
of Neul1i n Syrup.
TABLE 4.3.3 - Standard Additions Result for Nuellin Syrup
Concentration Added
of theophyl1ine
yg/ml
0.00
2.20
4.30
6.31
Step Height, Al
yA
8.98
12.18
14.73
18.20
Initial concentration by computer least squares standard
additions calculation = 5-84 ± 0.2
5.84 ± 0.2 yg/ml = 5-27 ± 0.2 mg/ml of theophylline In syrup
4.3-5.2 Elixophyllin
A sample of this cough syrup was analysed by PRA under the
same conditions as Neul1 in Syrup. The results for the
standard additions analysis are shown in Table 4.7-4.
The concentration was also determined graphically. The
standard additions plot is shown in Fig. 4.3-8.
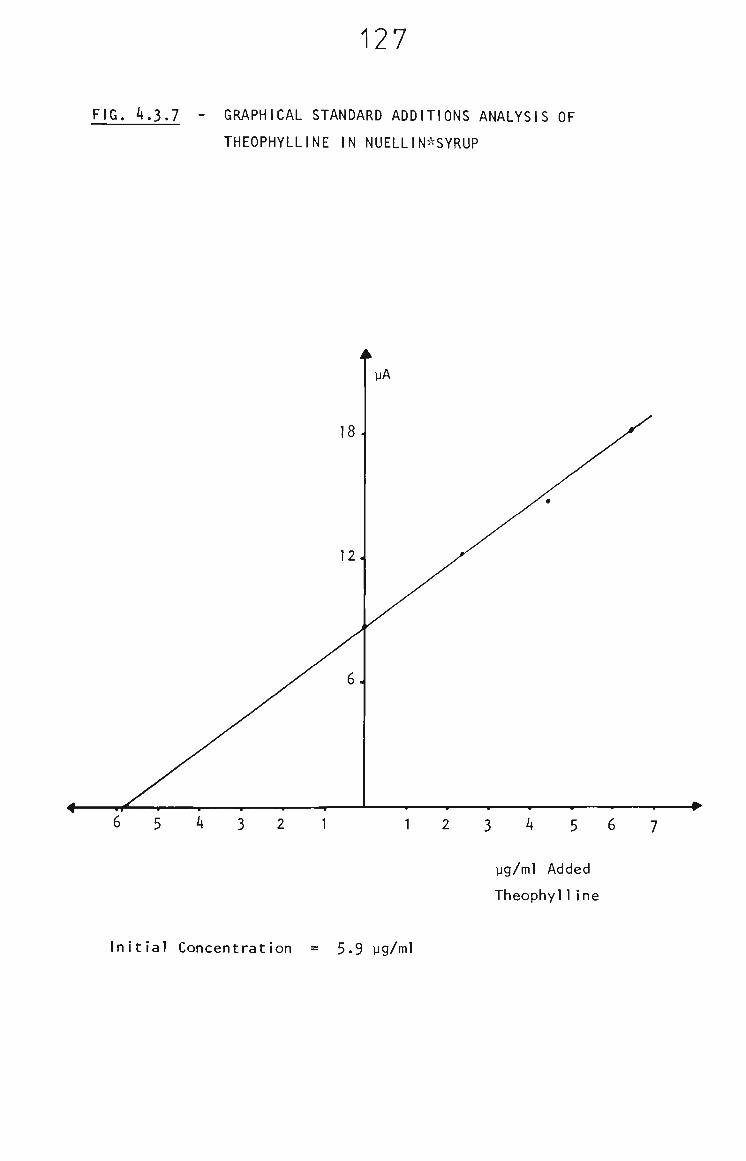
127
FIG. 4.3.7 - GRAPHICAL STANDARD ADDITIONS ANALYSIS OF
THEOPHYLLINE IN NUELLI N'^SYRUP
6 5 4 3 2 1 1 2 3 4 5 6 7
yg/ml Added
TheophylIIne
Initial Concentration = 5.9 yg/ml
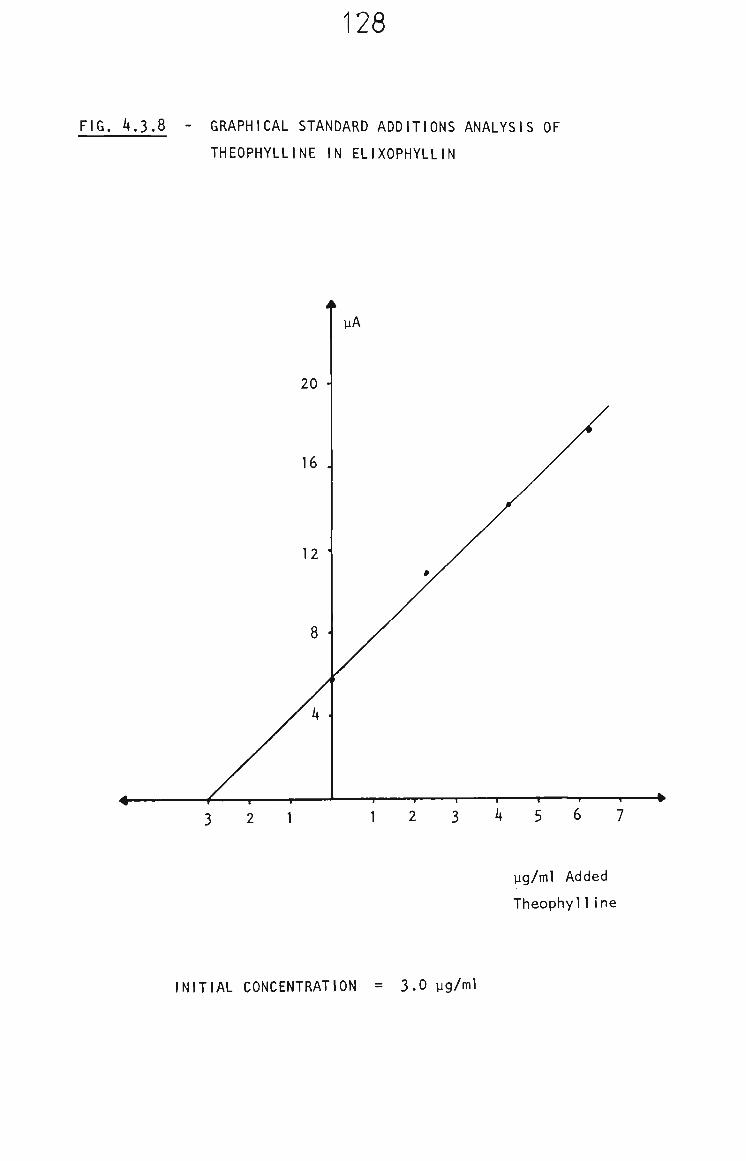
128
FIG. 4.3.8 - GRAPHICAL STANDARD ADDITIONS ANALYSIS OF
THEOPHYLLINE IN ELIXOPHYLLIN
3 2 1
yg/ml Added
Theophyl1ine
INITIAL CONCENTRATION = 3.0 yg/ml
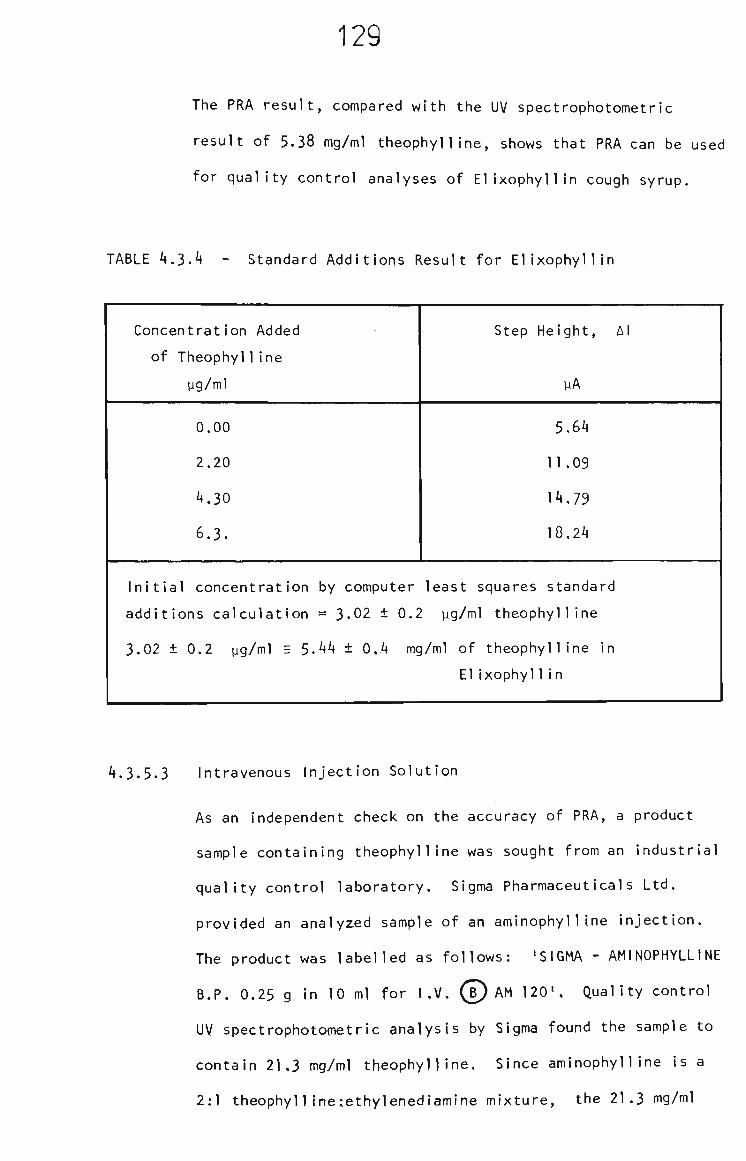
129
The PRA result, compared with the UV spectrophotometric
result of 5.38 mg/ml theophylline, shows that PRA can be used
for quality control analyses of Elixophyllin cough syrup.
TABLE 4.3.4 - Standard Additions Result for Elixophyllin
Concentration Added
of Theophyl1ine
yg/ml
0.00
2.20
4.30
6.3.
Step Height, Al
yA
5.64
11.09
14,79
10.24
Initial concentration by computer least squares standard
additions calculation = 3-02 ± 0.2 yg/ml theophylline
3.02 ± 0.2 yg/ml E 5-44 ± 0.4 mg/ml of theophylline in
ElixophylI In
4.3.5.3 Intravenous Injection Solution
As an independent check on the accuracy of PRA, a product
sample containing theophylline was sought from an industrial
quality control laboratory, Sigma Pharmaceuticals Ltd.
provided an analyzed sample of an aminophyl1ine injection.
The product was labelled as follows: 'SIGMA - AMINOPHYLLINE
B.P, 0,25 g in 10 ml for I.V, ( B ) AM 120', Quality control
UV spectrophotometric analysis by Sigma found the sample to
contain 21,3 mg/ml theophylline. Since aminophylIine is a
2:1 theophyl1Ine:ethylenediamine mixture, the 21.3 mg/ml

130
assay result is equivalent to 24.9 mg/ml aminophyl1ine.
Hydrodynamic voltammetry was used to test for the presence
of electroactive interferents in the sample. Theophylline
was the only electroactive compound observed in the volt
ammograms. Ethylenediamine is possibly electroactive but
under the conditions of the PRA analysis it is more difficult
to oxidize than theophylline and therefore presents no
interference.
The aminophylIIne was diluted with pH 7 phosphate buffer
and determined by PRA. The results for the standard
additions analysis are shown in Table 4.3.5.
TABLE 4.3.5 - Standard Additions Result for Aminophyl1ine I.V.
Injections
Concentration Added
TheophylIine
yg/ml
0.00
2.20
6,31
8,25
Step Height, Al
yA
15.96
19-09
23-71
37.29
Initial concentration by computer least squares standard additions
calculation = 11.8 ± 0.2 yg/ml theophylline,
11.8 ± 0.2 yg/ml = 21.2 ± 0.4 mg/ml Theophylline in AminophylIine
Injection
131
The concentration was also determined graphically. The
result is shown in Fig. 4.3,9.
The PRA result of 21.2 mg/ml theophylline agrees very well
with the independent assay of 21.3 mg/ml. This demonstrates
that PRA can also be applied to quality control analyses of
aminophylIine injections.
4.3.6 Conclusion
The pulsed rotation amperometric determination of theophylline
provides a fast, reliable and accurate quality control
procedure for a variety of pharmaceutical products. Analysis
time is in the order of 15 minutes per sample using computer
calculation of results. The relative standard deviation of the
analyses is 3% and the results all agree with UV spectro
photometric determinations.
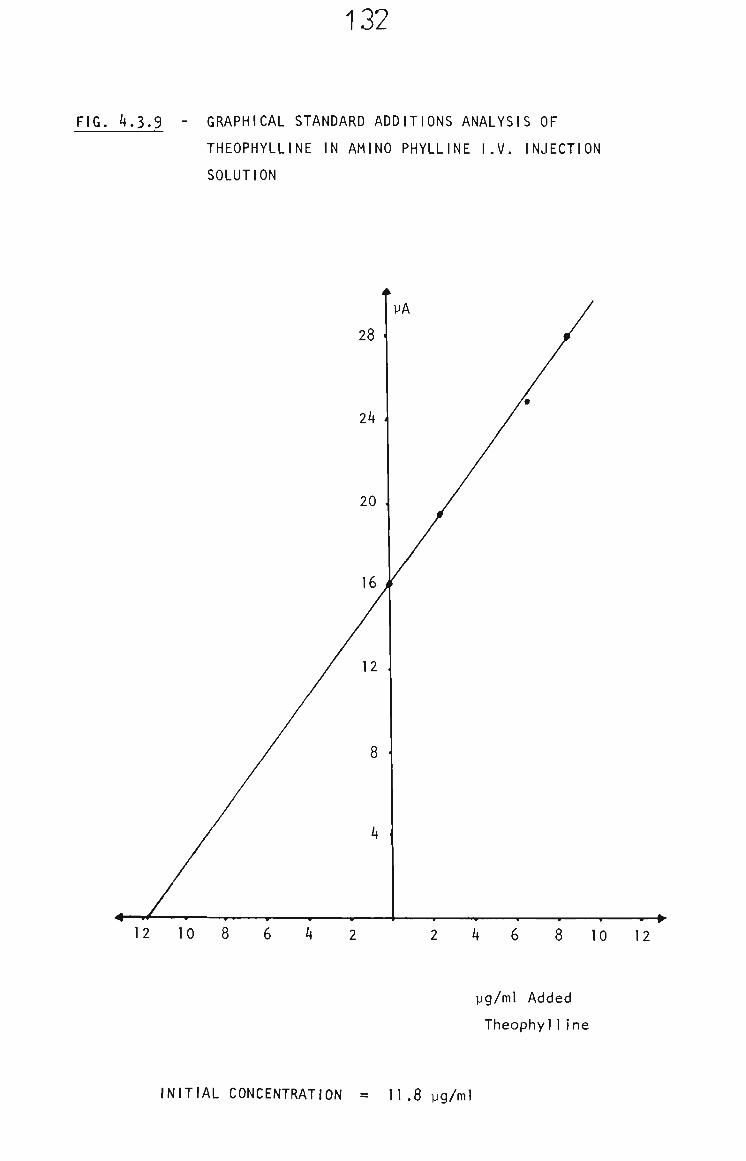
132
FIG. 4.3.9 - GRAPHICAL STANDARD ADDITIONS ANALYSIS OF
THEOPHYLLINE IN AMINO PHYLLINE I.V. INJECTION
SOLUTION
12 10 8 6 4 2 2 4 6 8 10 12
yg/ml Added
Theophyl1Ine
INITIAL CONCENTRATION = 11.8 yg/ml
133
CHAPTER 5
Investigation of a Direct Electroanalytical
Technique for the Determination of
Theophylline in Clinical Samples

134
5.1 Introduction - Statistical Analysis
The development of an analytical method requires awareness of the
accuracy and precision needed for effective use to be made of the
analytical data. Statistical investigation provides a means of
determining allowable tolerances in analytical results. The
tolerances aid the development of a protocol with respect to
1) the number of measurements required per sample, 2) the sampling
techniques and 3) the pretreatment procedures.
A statistical analysis of theophylline therapy was carried out prior
to the investigation of direct electrochemical techniques for the
monitoring of theophylline serum levels. The statistical analysis
determined how many measurements per sample are required so that safe
and effective prescription, based on the analytical data, may be
achieved with a certainty of 95^.
5.1.1 The TheophylIine Therapeutic Range
The generally accepted theophylline therapeutic range for the
treatment of asthma symptoms Is 10-20 yg/ml in serum. This
level, determined initially by Jenne and co-workers,^^^
is based on clinical trials relating to the effect and toxicity
of theophylline. The results of these trials are based on a
statistically small population (7 patients) but were proved
correct by subsequent workers,^^^"^'*^ Although the population
is small, Jenne et al. results are used In this analysis
because they also conducted a clinical trial to prove the
validity of adjusting theophylline doses using a single
measurement of theophylline serum concentration. This provided
a means of verifying the results of this statistical analysis.

135
Since the population is small, only an approximate estimate
is achieved by this analysis but the procedures used provide
a technique that would give more accurate results when based
on a statistically reliable population size.
5.1.2 The Standard Deviation of Therapeutic Range
The therapeutic range of 10-20 yg/ml is assumed to be of normal
distribution and as such has a mean, x, and a variation
associated with it equal to Ks, where K is a tolerance and
confidence limit factor and s is the standard deviat ion.^®°
i.e., THERAPEUTIC RANGE = x ± Ks
The factor K is such that the probability is P that a
certain proportion, F, of the distribution will be included
between x ± Ks, where x and s are estimates of the mean and
standard deviation computed from a sample population N.
Since the range is known and the distribution Is assumed
symmetrical then the range can be expressed as,
15 ± 5 yg/ml = 10-20 yg/ml
Using this expression for the range, the product Ks is 5.
I . e . Ks = 5
K is dependent on the number of the population, N, the
fraction, F, and probability, P, (or certainty) and these
dependents are known, so the appropriate value of K, for this
case, can be determined and therefore so can s be determined.
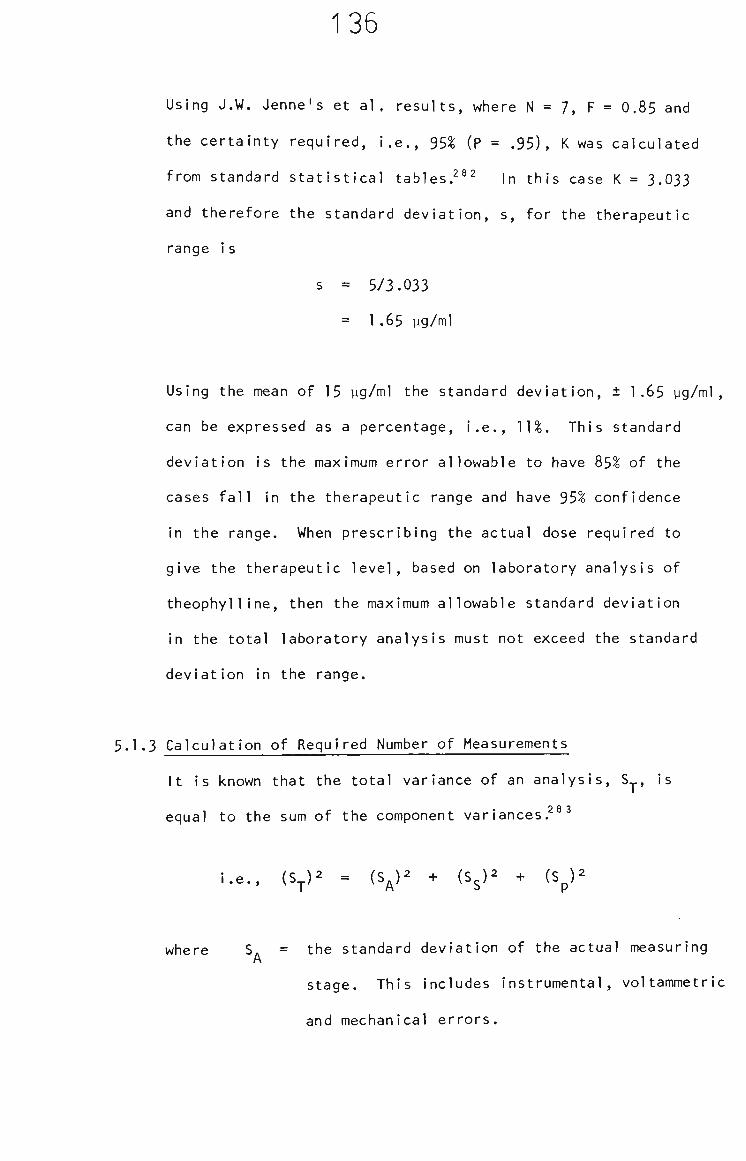
136
Using J.W. Jenne's et al. results, where N = 7, F = 0.85 and
the certainty required, i,e,, 95% (P = ,95), K was calculated
from standard statistical tables,^®^ In this case K = 3.033
and therefore the standard deviation, s, for the therapeutic
range i s
s = 5/3.033
= I.65 yg/ml
Using the mean of 15 yg/ml the standard deviation, ± 1.65 yg/ml,
can be expressed as a percentage, i.e., ]]%. This standard
deviation is the maximum error allowable to have 85% of the
cases fall In the therapeutic range and have 95% confidence
In the range. When prescribing the actual dose required to
give the therapeutic level, based on laboratory analysis of
theophylline, then the maximum allowable standard deviation
in the total laboratory analysis must not exceed the standard
deviation in the range.
5.1.3 Calculation of Required Number of Measurements
It is known that the total variance of an analysis, S_, Is
equal to the sum of the component var iances.^^
i.e., {S^)^ = (S^)2 + (Sg)^ + (Sp)2
where S. = the standard deviation of the actual measuring rt
stage. This includes instrumental, voltammetric
and mechanical errors.
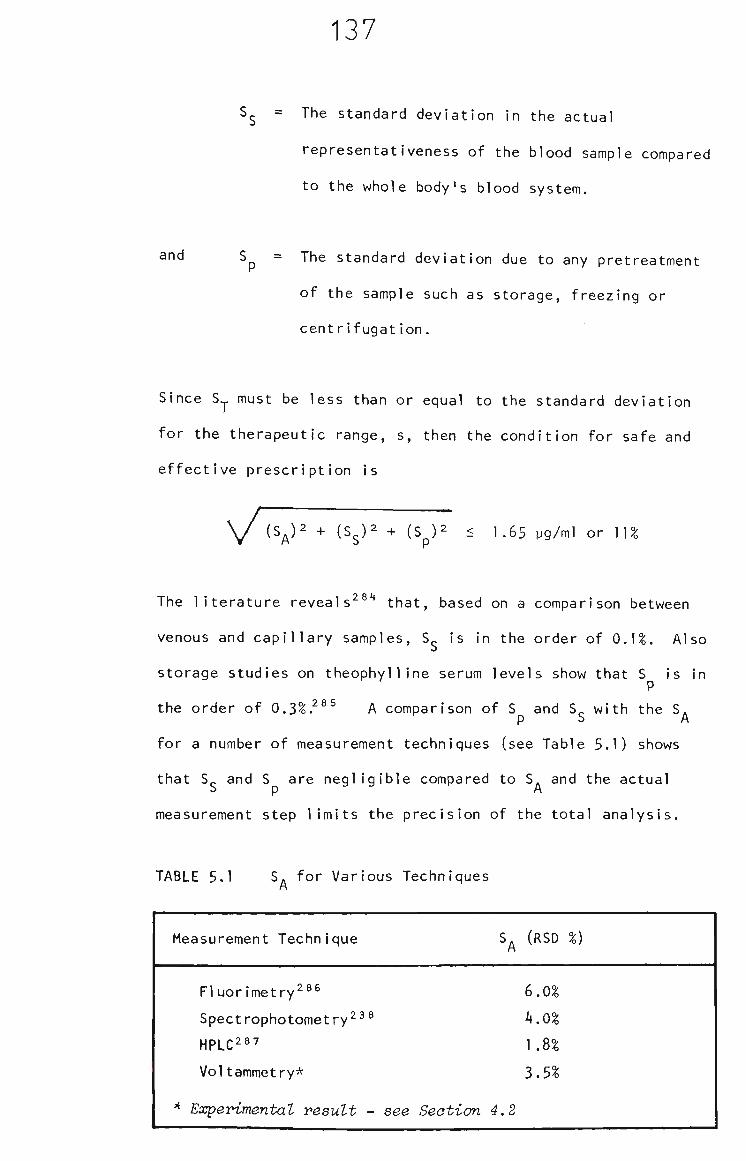
137
^S ~ ^^^ standard deviation in the actual
representativeness of the blood sample compared
to the whole body's blood system.
S = The standard deviation due to any pretreatment
of the sample such as storage, freezing or
centrifugation.
Since S.|. must be less than or equal to the standard deviation
for the therapeutic range, s, then the condition for safe and
effective prescription is
and
v" (S^)2 + (s^)2 + (S )2 < 1.65 yg/ml or 11%
The literature reveals " that, based on a comparison between
venous and capillary samples, S_ is in the order of 0.]%. Also
storage studies on theophylline serum levels show that S is in P
the order of 0.3%. ^ A comparison of S and S_ with the S. P ^ M
for a number of measurement techniques (see Table 5.1) shows
that S- and S are negligible compared to S and the actual
measurement step limits the precision of the total analysis.
TABLE 5.1 S. for Various Techniques
Measurement Technique
Fluorimetry^^^
Spectrophotometry^^^ HPLC^87
Voltammetry*
* Experimental result - see Section
h
4.2
(RSD %)
6.0%
4.0%
1.8%
3.5%
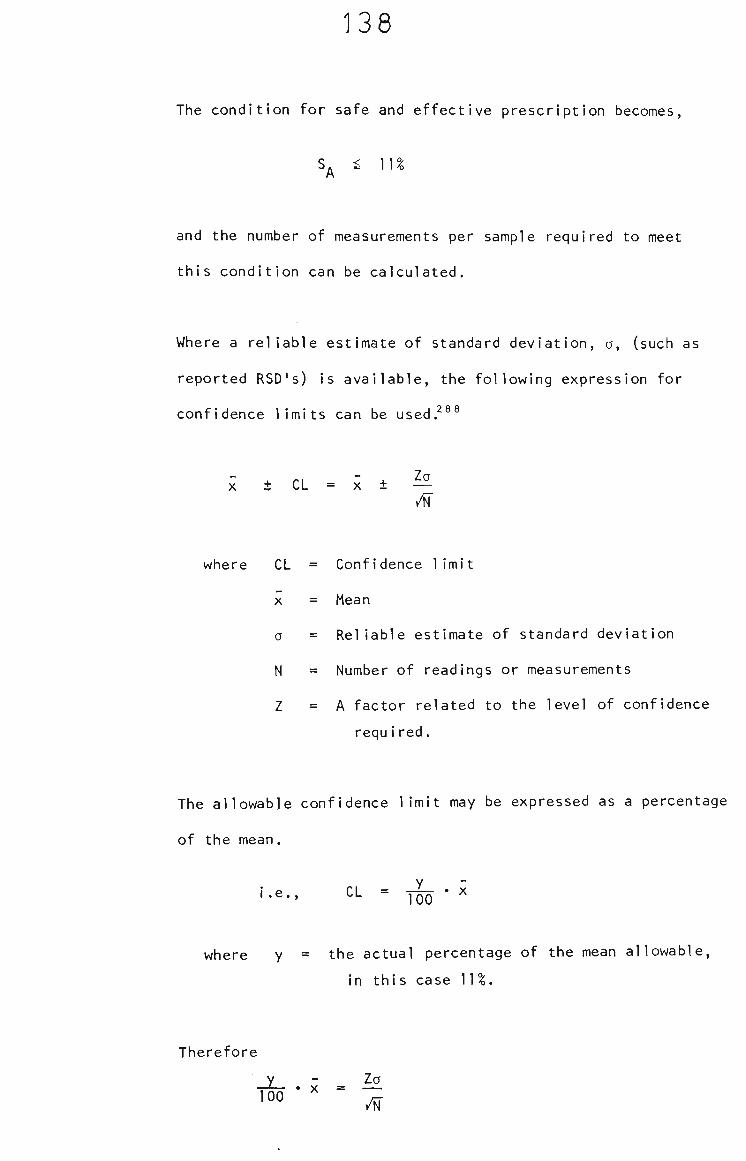
138
The condition for safe and effective prescription becomes,
S, s n:
and the number of measurements per sample required to meet
this condition can be calculated.
Where a reliable estimate of standard deviation, a, (such as
reported RSD's) is available, the following expression for
confidence limits can be used.^^®
± CL = X ± ^
/n
where CL = Confidence 1imit
X = Mean
a = Reliable estimate of standard deviation
N = Number of readings or measurements
Z = A factor related to the level of confidence
requ ired.
The allowable confidence limit may be expressed as a percentage
of the mean.
i.e., CL = T L • X 100
v^here y = the actual percentage of the mean allowable,
in this case 11%.
Therefore
10 ^00 "" ' ^
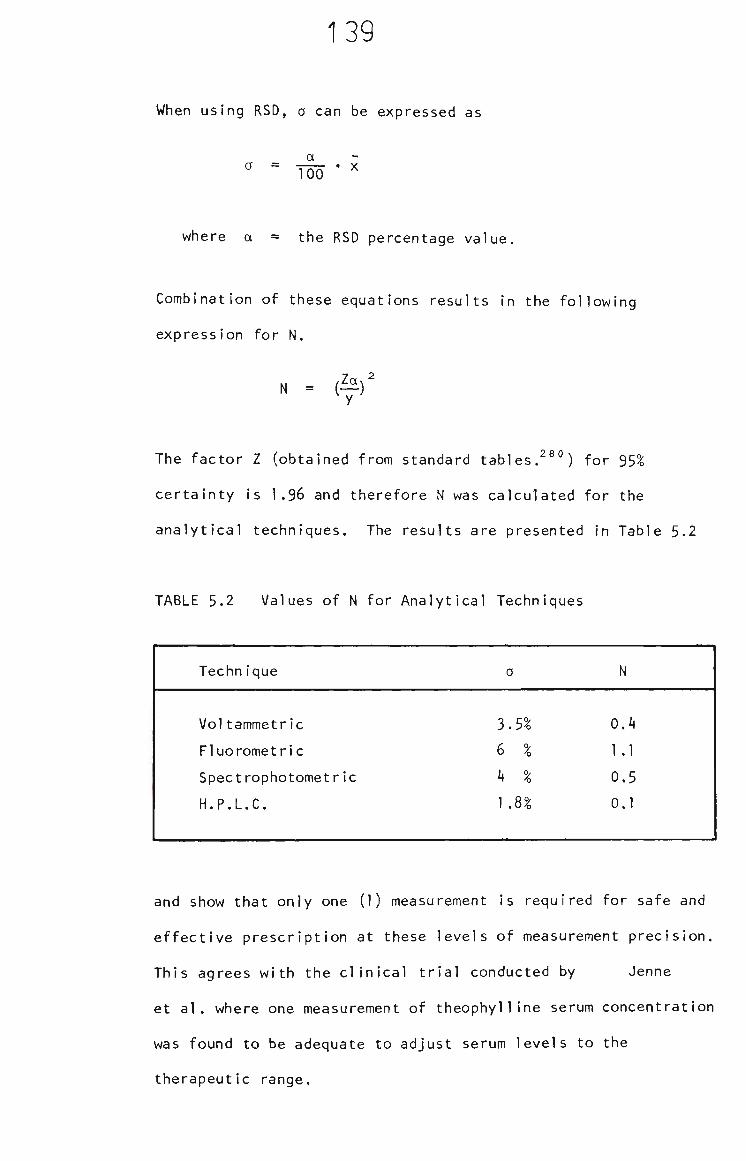
139
When using RSD, a can be expressed as
a
^ = Too •
where a = the RSD percentage value.
Combination of these equations results In the following
expression for N.
N = (^)' y
The factor Z (obtained from standard tables.^®") for 95%
certainty is 1,96 and therefore N was calculated for the
analytical techniques. The results are presented in Table 5.2
TABLE 5.2 Values of N for Analytical Techniques
TechnI que
Voltammetric
Fluorometric
Spect rophotomet
H.P.L.C.
ric
a
3.5%
6 %
4 %
1.8%
N
0.4
1,1
0.5
0,1
and show that only one (1) measurement is required for safe and
effective prescription at these levels of measurement precision.
This agrees with the clinical trial conducted by Jenne
et al. where one measurement of theophylline serum concentration
was found to be adequate to adjust serum levels to the
therapeutic range.
14 0
5.2 Introduction - Direct Electrochemical Analysis of Theophylline
Munson and Abdine reported^''^ the direct determination of
theophylline in plasma by oxidation at the stationary carbon paste
electrode using differential pulse voltammetry. The theophylline
metabolite 3-methylxanthine significantly interferes in the analysis
of samples from patients who have undergone prolonged theophylline
therapy. Therefore they state that the method is unsuitable for
routine clinical application but may be of use in overdose cases.
In cases of asthma in neonates Munson and Abdine's method would be
applicable for the initial monitoring of theophylline absorption,
since 3-methylxanthine would be absent from the samples. The
electrochemical method would provide faster results than the
conventional, large sample batch, radioimmuno-assay techn iques,^^**"^^^
which require a few hours to obtain results; but not as selectively
as HPLC. ^ " ''" The method would require modification to account for
the smaller sample sizes (ca. 100 yL) and the lower therapeutic
range (1-10 yg/ml).
Non invasive methods, based on saliva levels of theophylline have
been reported.
The saliva and serum concentrations are of the same order of
magnitude and therefore within the detection capabilities of the
electrochemical methods.
To apply a direct electrochemical technique to the initial
monitoring of theophylline in neonates the methods must be rapid,
be capable of using small sample volumes of serum or saliva, be
141
sensitive enough to detect the lowest concentration in the
therapeutic range, be used under selective conditions, meet the
reliability criterion set out in the statistical analysis of
theophylline therapy and compare well with other analytical
techniques.
Of the direct electroanalytical techniques available for this
investigation, Flow Injection Analysis with electrochemical detection
was the most favourable since It is rapid, sensitive, requires small
sample volumes, is as selective as other direct electroanalytical
methods and is precise.^^^
Therefore the voltammetric behaviour of theophylline In a saliva
matrix was studied in an attempt to utilize a non invasive method
and the optimum FIA conditions for theophylline determination were
investigated.
5.2.1 Voltammetry in Saliva
Saliva diluted twofold in pH = 7 phosphate buffer exhibits
a large anodic peak in the region of theophylline oxidation
(see Fig. 5.1) at a carbon paste electrode. Comparison of the
magnitude of the saliva peak with that of a 10 yg/ml theophylline
peak is also shown in Fig. 5.1. The result clearly demonstrates
that the electroactive component in saliva makes the determin
ation of theophylline in this medium impossible by a direct
electrochemical technique.
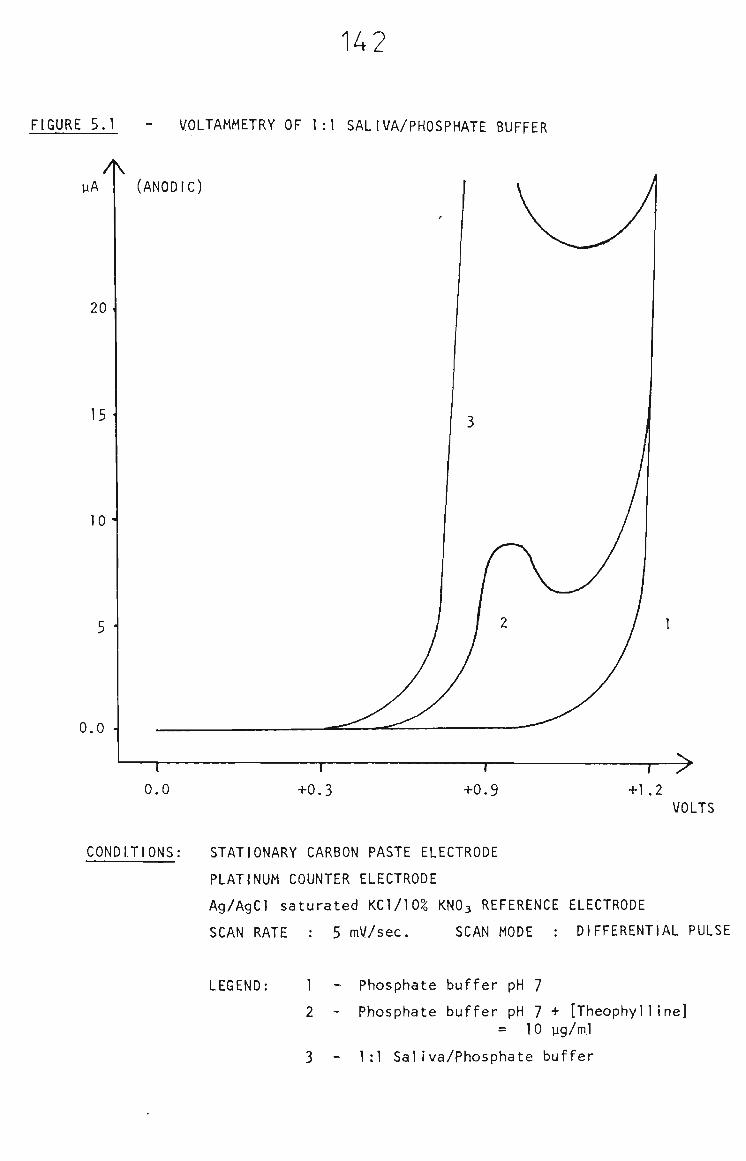
FIGURE 5.1
142
VOLTAMMETRY OF 1:1 SALIVA/PHOSPHATE BUFFER
A yA
20
15
(ANODIC)
10
0.0 •
—r-0.0 +0.3 +0.9
>
+1.2 VOLTS
CONDITIONS; STATIONARY CARBON PASTE ELECTRODE
PLATINUM COUNTER ELECTRODE
Ag/AgCl saturated KCl/10% KNO3 REFERENCE ELECTRODE
SCAN RATE : 5 mV/sec. SCAN MODE : DIFFERENTIAL PULSE
LEGEND: 1
2
3
Phosphate buffer pH 7
Phosphate buffer pH 7 + [Theophylline] = 10 yg/ml
1:1 Saliva/Phosphate buffer
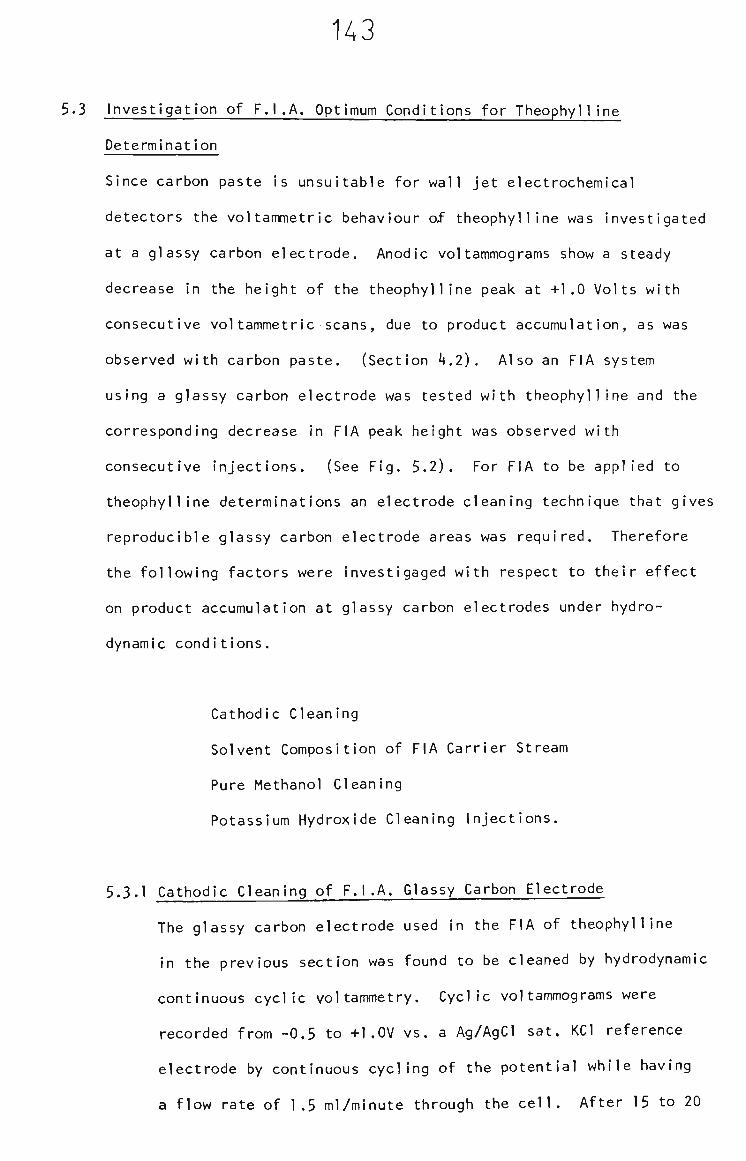
143
5.3 Investigation of F.I.A. Optimum Conditions for Theophylline
Determination
Since carbon paste Is unsuitable for wall jet electrochemical
detectors the voltammetric behaviour of theophylline was investigated
at a glassy carbon electrode. Anodic voltammograms show a steady
decrease in the height of the theophylline peak at +1.0 Volts with
consecutive voltammetric scans, due to product accumulation, as was
observed with carbon paste, (Section 4.2). Also an FIA system
using a glassy carbon electrode was tested with theophylline and the
corresponding decrease in FIA peak height was observed with
consecutive injections. (See Fig. 5.2). For FIA to be applied to
theophylline determinations an electrode cleaning technique that gives
reproducible glassy carbon electrode areas was required. Therefore
the following factors were investigaged with respect to their effect
on product accumulation at glassy carbon electrodes under hydro-
dynamic conditions.
Cathodic Cleaning
Solvent Composition of FIA Carrier Stream
Pure Methanol Cleaning
Potassium Hydroxide Cleaning Injections.
5.3.1 Cathodic Cleaning of F.I.A. Glassy Carbon Electrode
The glassy carbon electrode used in the FIA of theophylline
in the previous section was found to be cleaned by hydrodynamic
continuous cyclic voltammetry. Cyclic voltammograms were
recorded from -0.5 to +1,0V vs, a Ag/AgCl sat, KCl reference
electrode by continuous cycling of the potential while having
a flow rate of 1,5 ml/minute through the cell. After 15 to 20
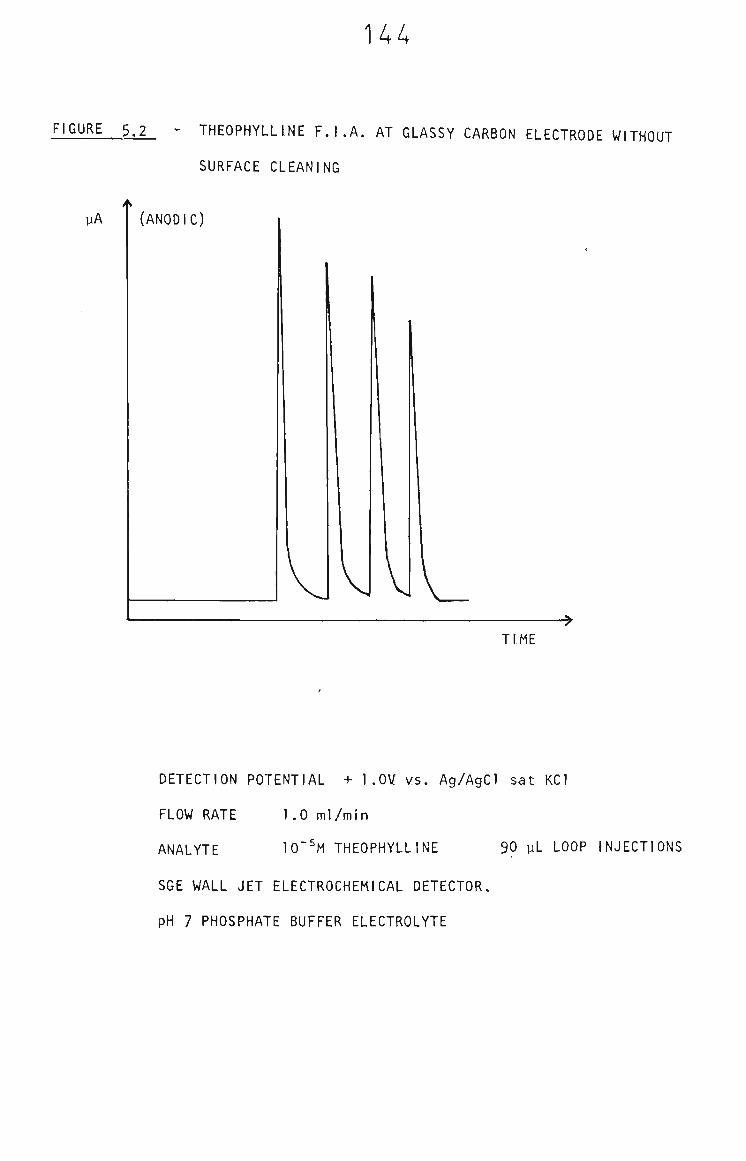
U4
'GU' E 5,2 - THEOPHYLLINE F.I.A. AT GLASSY CARBON ELECTRODE WITHOUT
SURFACE CLEANING
yA (ANODIC)
TIME
DETECTION POTENTIAL + 1.OV vs. Ag/AgCl sat KCl
FLOW RATE 1.0 ml/min
ANALYTE 10~^M THEOPHYLLINE 90 yL LOOP INJECTIONS
SGE WALL JET ELECTROCHEMICAL DETECTOR.
pH 7 PHOSPHATE BUFFER ELECTROLYTE
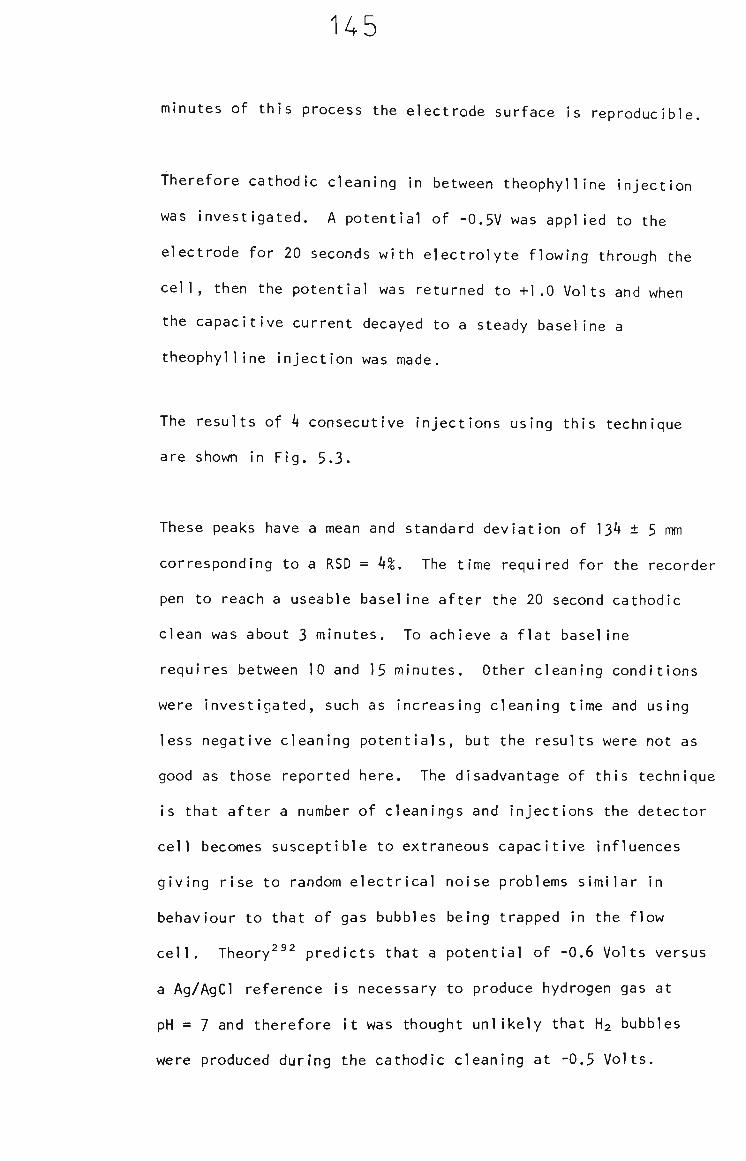
145
minutes of this process the electrode surface is reproducible.
Therefore cathodic cleaning in between theophylline Injection
was investigated. A potential of -0.5V was applied to the
electrode for 20 seconds with electrolyte flowing through the
cell, then the potential was returned to +1.0 Volts and when
the capacltive current decayed to a steady baseline a
theophylline injection was made.
The results of 4 consecutive injections using this technique
are shown In Fig. 5.3.
These peaks have a mean and standard deviation of 134 ± 5 mm
corresponding to a RSD = 4%. The time required for the recorder
pen to reach a useable baseline after the 20 second cathodic
clean was about 3 minutes. To achieve a flat baseline
requires between 10 and 15 minutes. Other cleaning conditions
were Investigated, such as increasing cleaning time and using
less negative cleaning potentials, but the results were not as
good as those reported here. The disadvantage of this technique
is that after a number of cleanings and injections the detector
cell becomes susceptible to extraneous capacitive influences
giving rise to random electrical noise problems similar In
behaviour to that of gas bubbles being trapped in the flow
cell. Theory^^^ predicts that a potential of -0.6 Volts versus
a Ag/AgCl reference is necessary to produce hydrogen gas at
pH = 7 and therefore it was thought unlikely that H2 bubbles
were produced during the cathodic cleaning at -0,5 Volts.
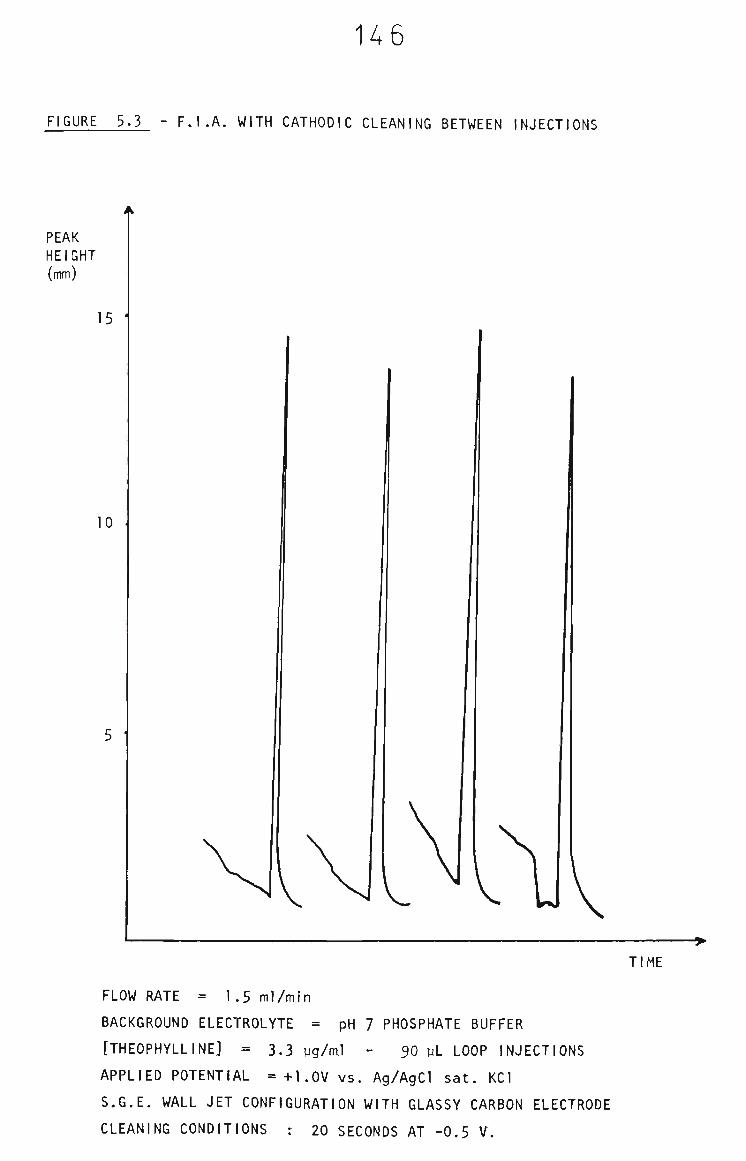
U6
FIGURE 5.3 - F.I.A. WITH CATHODIC CLEANING BETWEEN INJECTIONS
PEAK HEIGHT (rrni)
15 *
10
5 '
TIME
FLOW RATE = 1.5 ml/min
BACKGROUND ELECTROLYTE = pH 7 PHOSPHATE BUFFER
[THEOPHYLLINE] = 3.3 yg/ml - 90 yL LOOP INJECTIONS
APPLIED POTENTIAL = + l . O V v s . Ag/AgCl sat. KCl
S.G.E. WALL JET CONFIGURATION WITH GLASSY CARBON ELECTRODE
CLEANING CONDITIONS t 20 SECONDS AT -0.5 V.
147
These random noise problems introduce unacceptable uncertainty
into the technique and therefore other cleaning procedures were
investigated.
5.3.1.1 The Investigation of Solvent Composition on the Deposition
of Theophylline Oxidation Products Under Hydrodynamic
Condi tions
For convenience this investigation was carried out using a
rotating glassy carbon electrode rather than the electro
chemical flow eel 1,
5.3.1.2 The effect of 20% methanol 80% phosphate buffer
The Influence of 20% methanol on the solubility of the
oxidation products was Investigated by the following
procedure. Three consecutive rotating electrode differential
pulse voltammograms of theophylline in 20% Methanol 80%
Phosphate were run and the peak heights recorded. The
electrode was left at the solution open circuit potential
and with a rotation rate of 20 r.p.s. for 10 minutes and
three more consecutive voltammograms were run. The results
of these experiments are shown in Table 5.3.
These results indicate that the oxidation products are
slightly soluble in this solvent composition but even under
hydrodynamic conditions the electrode area is still reducing
with consecutive sweeps. Therefore this solvent composition
is unsuitable for FIA of theophylline.
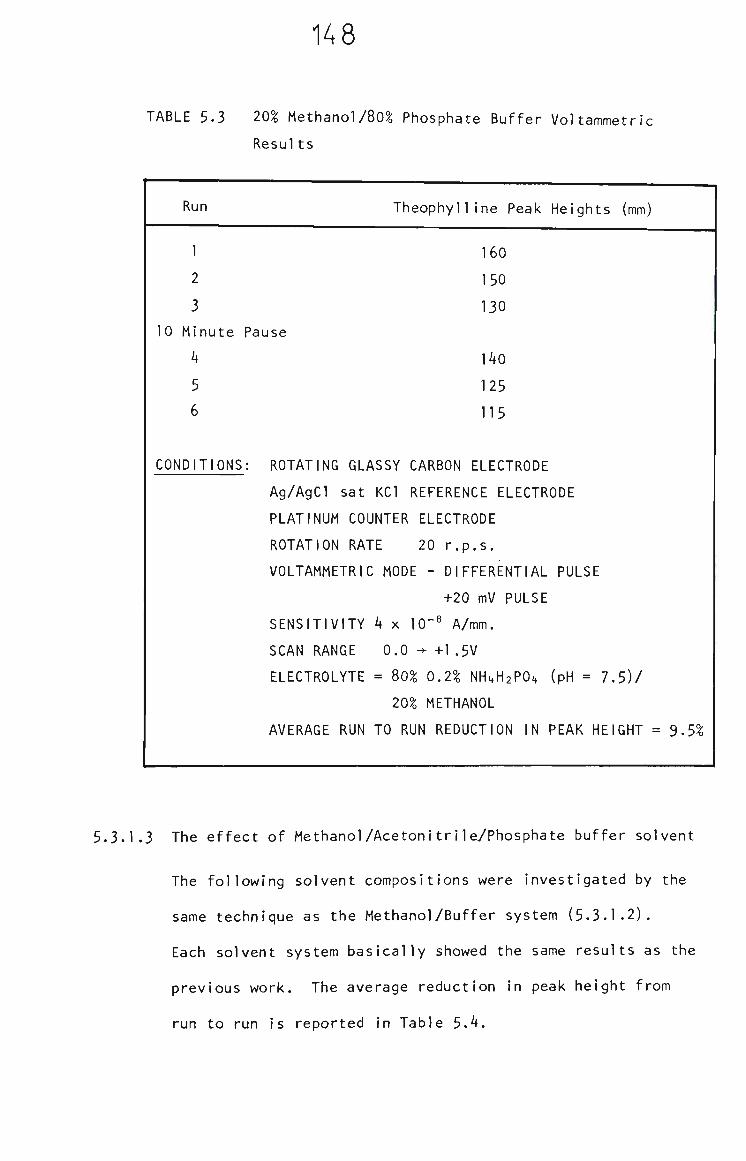
148
TABLE 5-3 20% Methanol780% Phosphate Buffer Voltammetric
Results
Run
1
2
3
10 Minute Pa
4
5
6
CONDITIONS:
Theophylline Peak Heights (mm)
160
150
130
use
140
125
115
ROTATING GLASSY CARBON ELECTRODE
Ag/AgCl sat KCl REFERENCE ELECTRODE
PLATINUM COUNTER ELECTRODE
ROTATION RATE 20 r.p.s.
VOLTAMMETRIC MODE - DIFFERENTIAL PULSE
+20 mV PULSE
SENSITIVITY 4 x lO"^ A/mm.
SCAN RANGE 0.0 ^ +1 .5V
ELECTROLYTE = 80% 0.2% NH4H2P0^ (pH = 7.5)/
20% METHANOL
AVERAGE RUN TO RUN REDUCTION IN PEAK HEIGHT = 9.5%
5.3.1.3 The effect of Methanol/AcetonitrIle/Phosphate buffer solvent
The following solvent compositions were investigated by the
same technique as the Methanol/Buffer system (5-3-1-2).
Each solvent system basically showed the same results as the
previous work. The average reduction in peak height from
run to run is reported in Table 5.4,
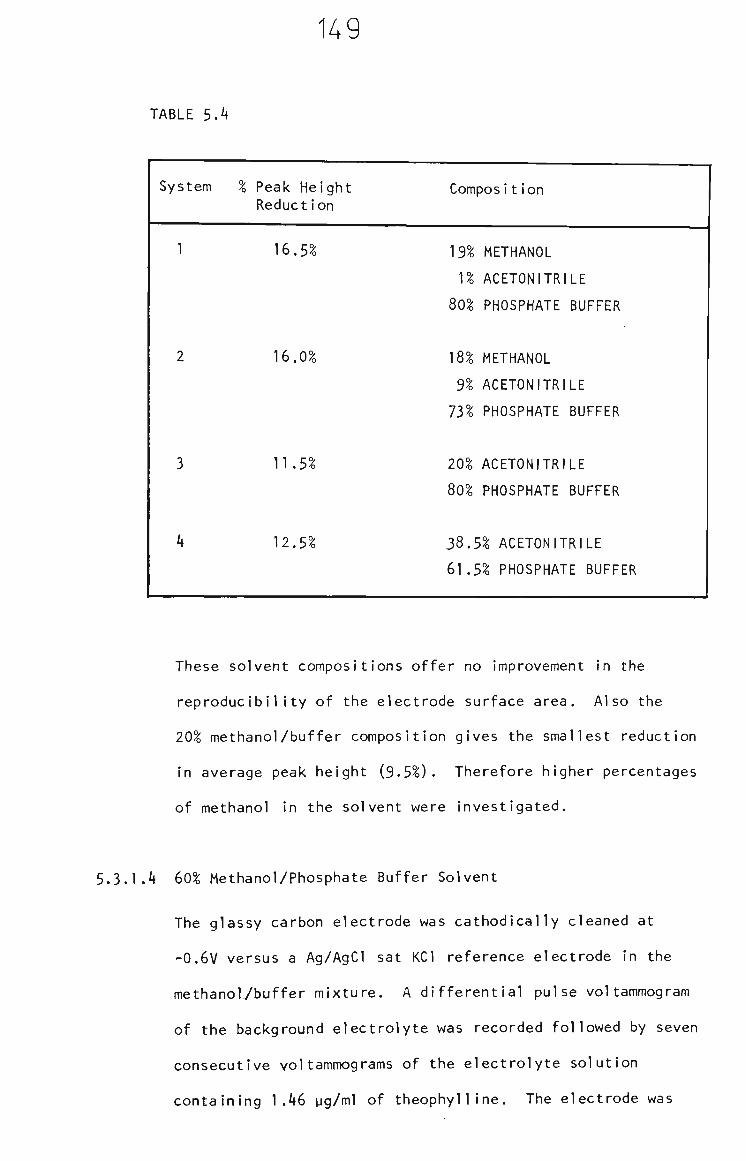
149
TABLE 5.4
System
1
2
3
4
% Peak Height Reduction
16.5%
16.0%
n.5%
12.5%
Composition
19% METHANOL
1% ACETONITRILE
80% PHOSPHATE BUFFER
18% METHANOL
9% ACETONITRILE
73% PHOSPHATE BUFFER
20% ACETONITRILE
80% PHOSPHATE BUFFER
38.5% ACETONITRILE
61 .5% PHOSPHATE BUFFER
These solvent compositions offer no improvement in the
reproducibility of the electrode surface area. Also the
20% methanol/buffer composition gives the smallest reduction
in average peak height (9-5%). Therefore higher percentages
of methanol In the solvent were investigated.
5.3.1.4 60% Methanol/Phosphate Buffer Solvent
The glassy carbon electrode was cathodically cleaned at
-0.6V versus a Ag/AgCl sat KCl reference electrode in the
methanol/buffer mixture. A differential pulse voltammogram
of the background electrolyte was recorded followed by seven
consecutive voltammograms of the electrolyte solution
containing 1.46 yg/ml of theophylline. The electrode was

150
allowed to stand without rotation in the solution for 2 hours
and then another voltammogram was recorded. These results
are shown in Table 5.5.
TABLE 5.5 Peak Heights for Theophylline in 60% Methanol
Phosphate Buffer
Concentration
BACKGROUND ELECTROLYTE
1.46 yg/ml TheophylIIne
I.46 yg/ml
Consecutive Voltammet Run Number
0
1
2
3
4
5
6
7
8
ric Peak Height mm
0
52
45
44
41
41
41
41
53
These results show that after cathodic cleaning the available
electrode area is large as was observed for the other solvent
systems, then it decreases as oxidation products are
deposited. But in this case after 4 runs the rate of
deposition equals the rate of cleaning and therefore the
recorded peak heights become constant. Run number 8 shows
that as the cleaning rate increases past the deposition rate
the available electrode area Increases,
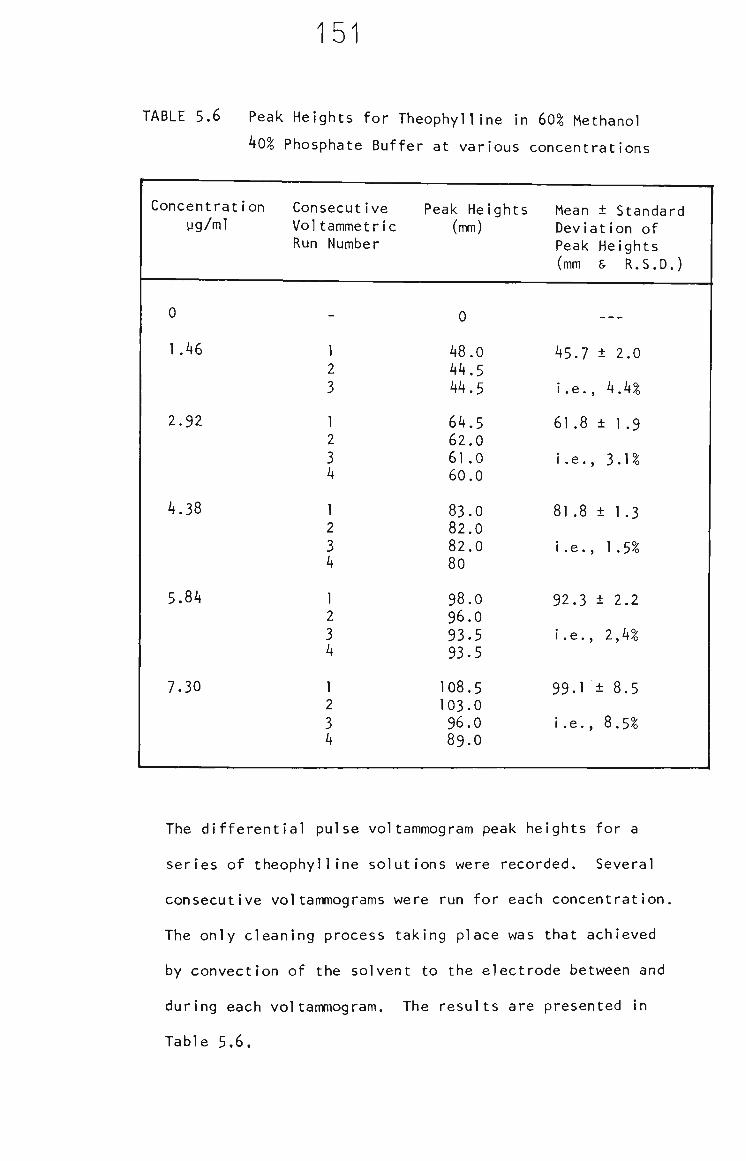
151
TABLE 5.6 Peak Heights for Theophylline in 60% Methanol
40% Phosphate Buffer at various concentrations
Concentration yg/ml
0
1.46
2.92
4.38
5.84
7-30
Consecutive Voltammetric Run Number
-
1 2 3
I 2 3 4
I 2 3 4
I 2 3 4
1 2 3 4
Peak Heights (mm)
0
48.0 44.5 44.5
64.5 62.0 61.0 60.0
83.0 82.0 82.0 80
98.0 96.0 93.5 93-5
108.5 103.0 96.0 89.0
Mean ± Standard Deviation of Peak Heights (mm & R.S.D.)
45.7 ± 2.0
i.e., 4.4%
61.8 ± I .9
i.e., 3.1%
81.8 ± 1.3
I .e., I .5%
92.3 ± 2.2
i.e., 2,4%
99-1 ± 8.5
I.e., 8.5%
The differential pulse voltammogram peak heights for a
series of theophylline solutions were recorded. Several
consecutive voltammograms were run for each concentration.
The only cleaning process taking place was that achieved
by convection of the solvent to the electrode between and
during each voltammogram. The results are presented in
Table 5.6.
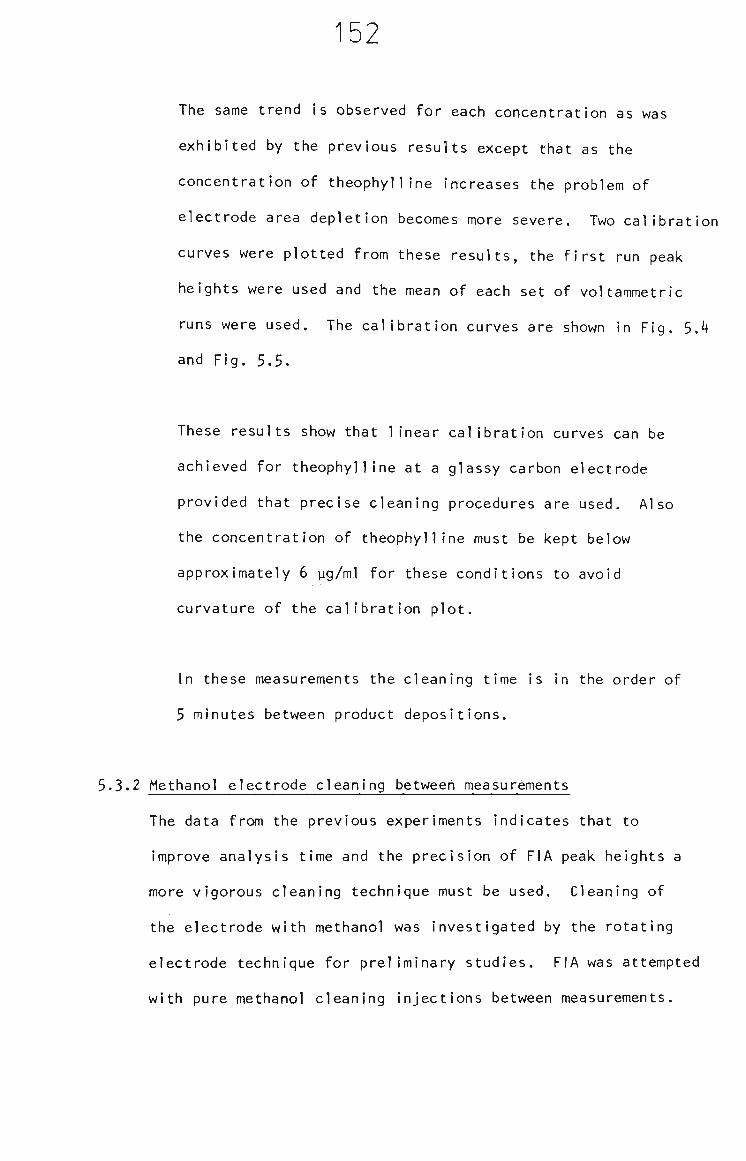
152
The same trend is observed for each concentration as was
exhibited by the previous results except that as the
concentration of theophylline increases the problem of
electrode area depletion becomes more severe. Two calibration
curves were plotted from these results, the first run peak
heights were used and the mean of each set of voltammetric
runs were used. The calibration curves are shown in Fig, 5.4
and Fig. 5.5.
These results show that linear calibration curves can be
achieved for theophylline at a glassy carbon electrode
provided that precise cleaning procedures are used. Also
the concentration of theophylline must be kept below
approximately 6 yg/ml for these conditions to avoid
curvature of the calibration plot.
In these measurements the cleaning time is in the order of
5 minutes between product depositions.
5.3.2 Methanol electrode cleaning between measurements
The data from the previous experiments indicates that to
Improve analysis time and the precision of FIA peak heights a
more vigorous cleaning technique must be used. Cleaning of
the electrode with methanol was investigated by the rotating
electrode technique for preliminary studies. FIA was attempted
with pure methanol cleaning injections between measurements.
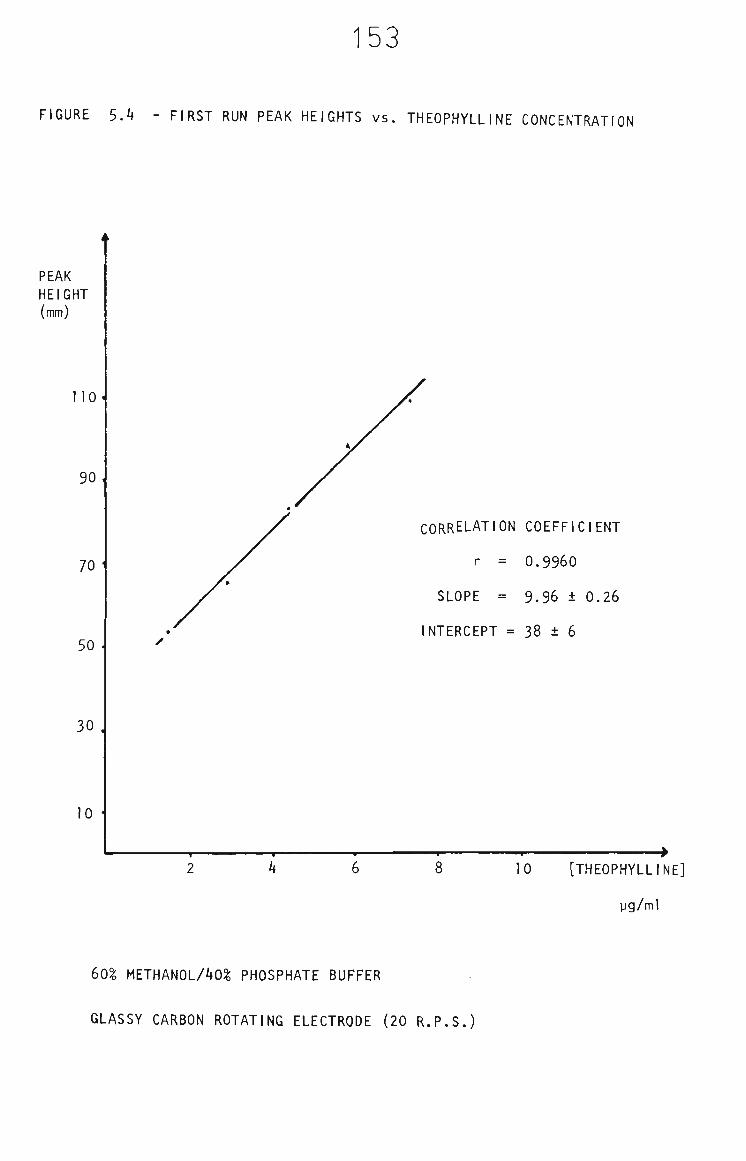
153
FIGURE 5-4 - FIRST RUN PEAK HEIGHTS vs. THEOPHYLLINE CONCENTRATl ON
PEAK HEIGHT (mm)
110-
90,
70 '
50
30.
10 •
CORRELATION COEFFICIENT
r = 0.9960
SLOPE = 9.96 ± 0.26
INTERCEPT = 38 ± 6
10 [THEOPHYLLINE]
yg/ml
60% METHANOL/40% PHOSPHATE BUFFER
GLASSY CARBON ROTATING ELECTRODE (20 R,P,S,)
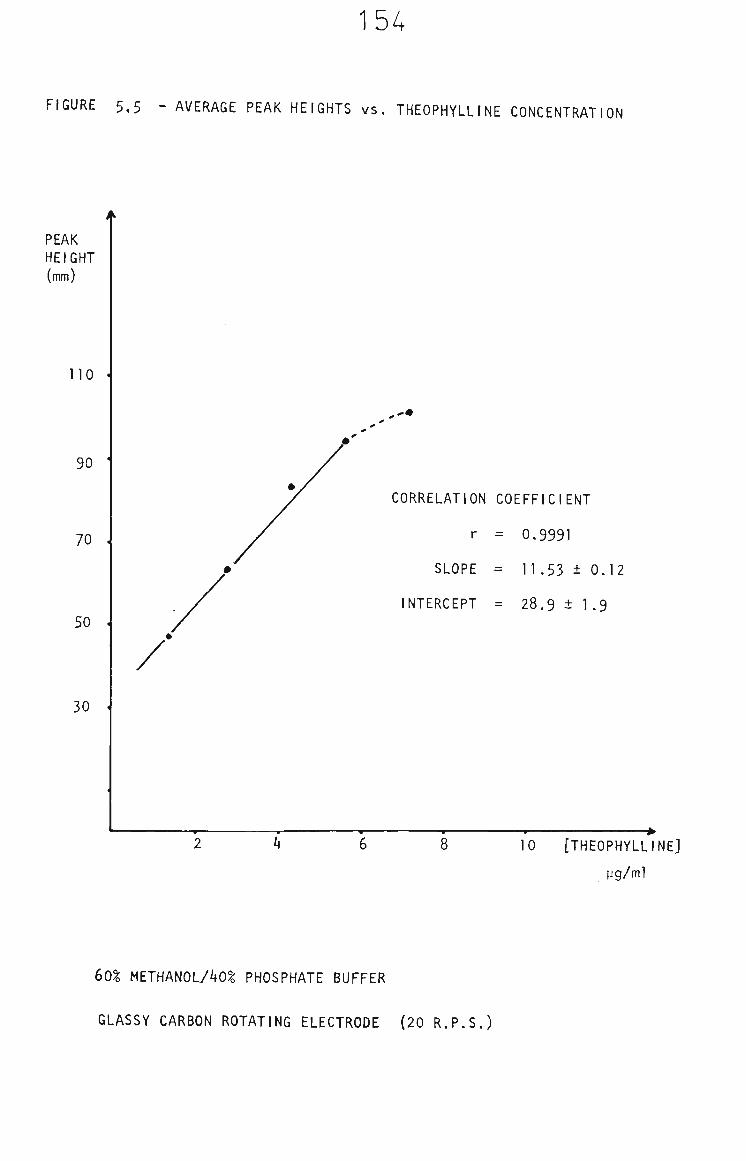
15A
FIGURE 5,5 - AVERAGE PEAK HEIGHTS vs, THEOPHYLLINE CONCENTRATl ON
PEAK HEIGHT (mm)
10
90
70 .
50 .
30
.-•
CORRELATION COEFFICIENT
r = 0.9991
SLOPE = 11.53 ± 0.12
INTERCEPT = 28.9 ± 1.9
10 [THEOPHYLLINE]
yg/ml
60% METHANOL/40% PHOSPHATE BUFFER
GLASSY CARBON ROTATING ELECTRODE (20 R.P.S.)
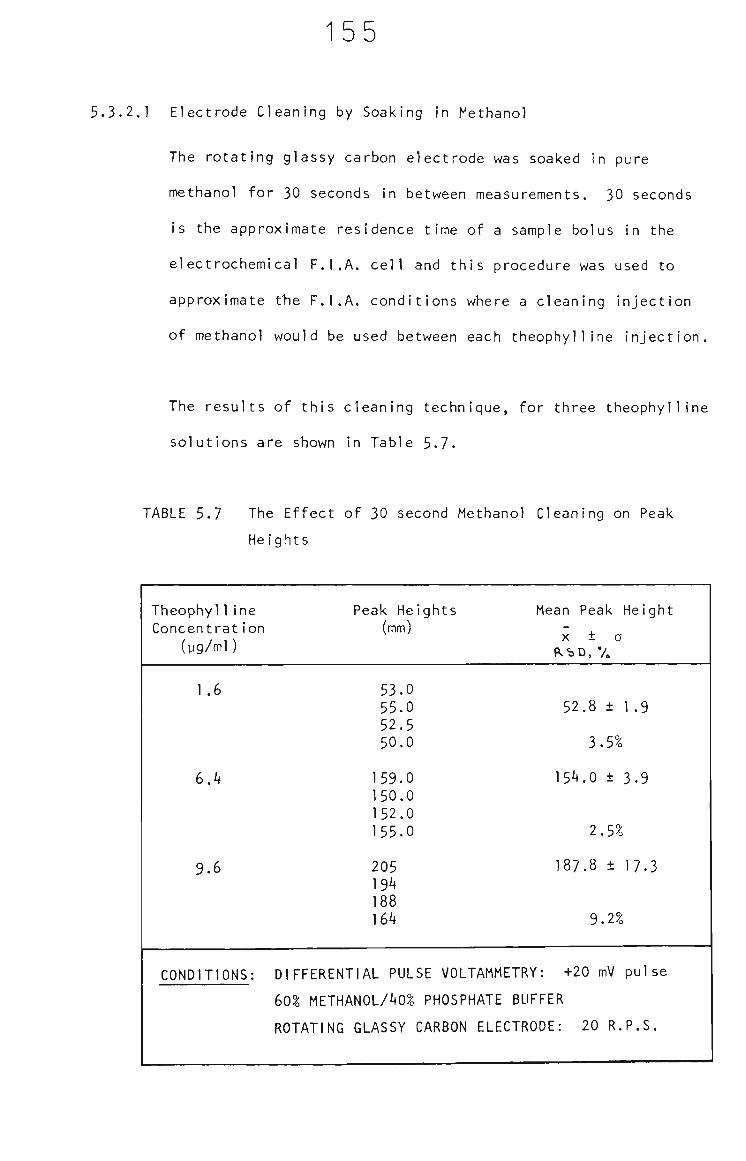
155
5-3-2.1 Electrode Cleaning by Soaking in Methanol
The rotating glassy carbon electrode was soaked in pure
methanol for 30 seconds In between measurements. 30 seconds
is the approximate residence time of a sample bolus in the
electrochemical F.I.A. cell and this procedure was used to
approximate the F.I,A, conditions where a cleaning injection
of methanol would be used between each theophylline injection.
The results of this cleaning technique, for three theophylline
solutions are shown in Table 5-7-
TABLE 5-7 The Effect of 30 second Methanol Cleaning on Peak
Heights
Theophyl1ine Concentrat ion
(yg/ml)
Peak Heights (mm)
Mean Peak Height
x ± a
1.6
6.4
9.6
53.0 55.0 52.5 50.0
159-0 150.0 152.0 155.0
205 194 188 164
52.8 ± 1.9
3-5%
154.0 ± 3-9
2.5%
187.8 ± 17-3
9.2%
CONDITIONS: DIFFERENTIAL PULSE VOLTAMMETRY: +20 mV pulse
60% METHANOL/40% PHOSPHATE BUFFER
ROTATING GLASSY CARBON ELECTRODE: 20 R.P.S,

156
This technique exhibits no improvement in precision or
linearity. The obvious curvature at higher concentrations
suggests that the cleaning system is still not vigorous enough
and therefore wiping the electrode with a methanol soaked
tissue was investigated.
5.3.2.2 Mechanical and Methanol Cleaning
The rotating glassy carbon electrode was wiped thoroughly with
a tissue soaked in pure methanol between measurements. The
results for a series of theophylline solutions are shown in
Table 5.8.
TABLE 5.8 The Effect of Methanol soaked tissue cleaning on
Peak Heights
Theophylline Peak Heights Concentration (mm)
(yg/ml)
0.57
1.13
1.70
2.27
5.02
CONDITIONS:
125.5 121.0 122.0
192.0 185.0 185.5
164.0 162.0 165.0
125.0 125.5 128.5
109.0 111.0 114.0
DIFFERENTIAL PULSE
Mean Peak Heights X ± CT (mm) (yA)
(RSD %)
122.8 ± 2.4 mm 5 0.74 yA
1.9%
187.5 ± 3.9 mm E 1.13 yA
2.1%
I63.7 ± 1.5 mm = 1.64 yA
0.9%
126.3 ± 1.9 mm E 1.90 yA
1.5%
111.3 ± 2.5 mm E 2.78 yA
2.3%
VOLTAMMETRY: +40 mV pulse
ROTATING GLASSY CARBON
PHOSPHATE BUFFER
ELECTRODE: 20 R.P.S.
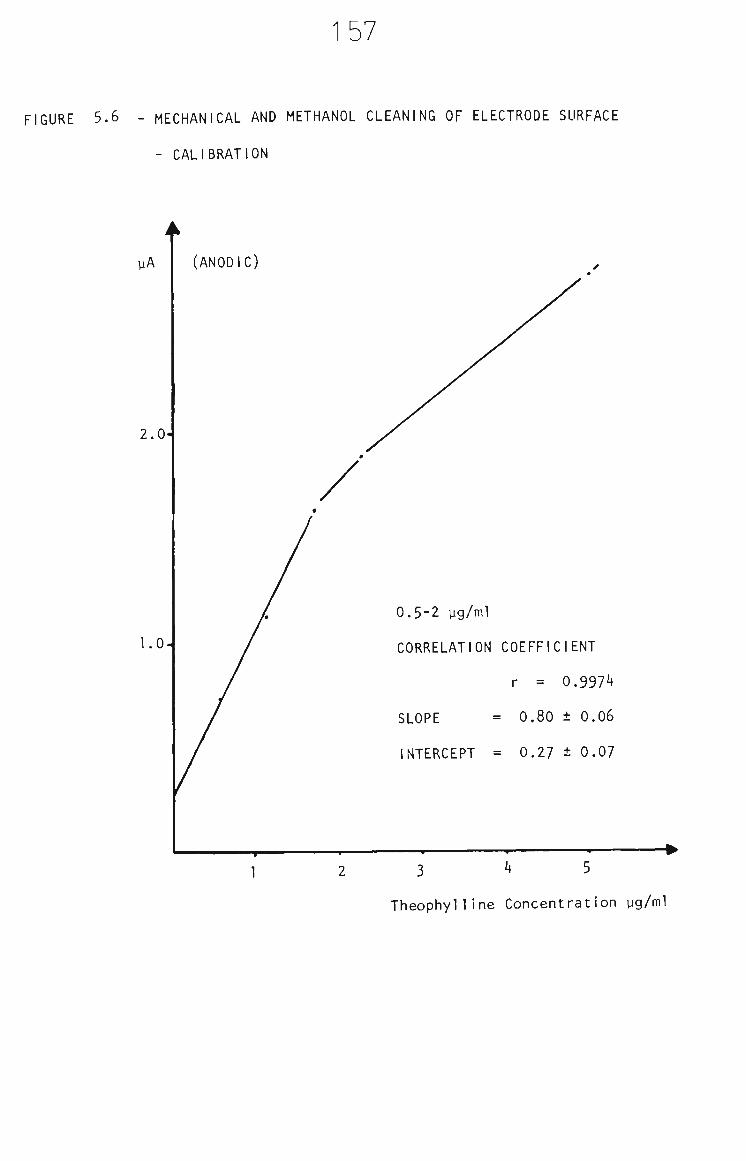
157
FIGURE 5.6 - MECHANICAL AND METHANOL CLEANING OF ELECTRODE SURFACE
- CALIBRATION
yA
2.0
1.0-
(ANODIC)
0.5-2 yg/ml
CORRELATION COEFFICIENT
r = 0.9974
SLOPE = 0.80 ± 0.06
INTERCEPT = 0.27 ± 0.07
3 4 5
Theophylline Concentration yg/ml

158
Fig. 5.6 shows a plot of mean peak height versus
theophylline concentration for this cleaning technique. In
this case the plot Is linear up to ~2 yg/ml theophylline,
which is lower than observed for the other cleaning
techniques.
5.3.2.3 F.I.A. with methanol cleaning injections
Since the best precision (RSD < 2% for each concentration)
was achieved with the combination of methanol and mechanical
action, methanol cleaning injections in the FIA system were
investigated. To optimize cleaning and minimize precipitation
problems (due to methanol/buffer interaction) in the FIA
solvent line, a solvent composition of 60% methanol/40%
phosphate buffer was used. The results for 4 Injections of
theophylline separated by 4 methanol injections are shown in
Table 5.9.
TABLE 5.9 F.I.A. Peak Heights with Methanol Cleaning Injections
Injection No, Peak Hei (mm)
1 73.0 2 72.5 3 73.0 4 74.0
[THEOPHYLLINE] = 4.2 yg/ml
FLOW RATE = 1.0 ml/min
gh t
) ) ) )
DETECTION POTENTIAL = +1.OV versus
DETECTION MODE = D.C.
Ag/AgCI
X ± a R.S.D,
73.1 ± 0.6
0.8%
sat KCl
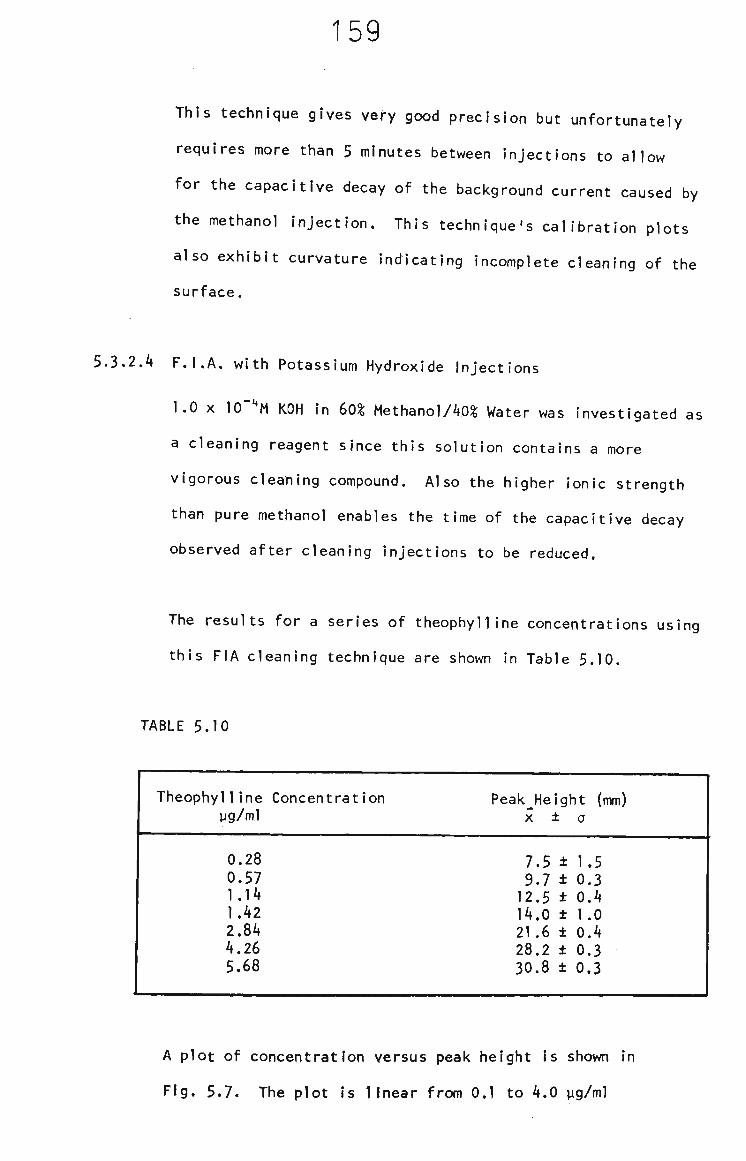
159
This technique gives very good precision but unfortunately
requires more than 5 minutes between injections to allow
for the capacltive decay of the background current caused by
the methanol injection. This technique's calibration plots
also exhibit curvature indicating incomplete cleaning of the
surface.
5.3.2.4 F.I.A. with Potassium Hydroxide Injections
1.0 X lO' M KOH in 60% Methanol/40% Water was investigated as
a cleaning reagent since this solution contains a more
vigorous cleaning compound. Also the higher ionic strength
than pure methanol enables the time of the capacltive decay
observed after cleaning injections to be reduced.
The results for a series of theophylline concentrations using
this FIA cleaning technique are shown in Table 5.10.
TABLE 5.10
Theophyl1ine yg/ml
0.28 0.57 1.14 1.42 2.84 4.26 5.68
Concentration Peak Height (mm) X ± 0
7.5 ± 1.5 9.7 ± 0.3 12.5 ± 0.4 14.0 ± 1.0 21.6 ± 0.4 28.2 ± 0.3 30.8 ± 0.3
A plot of concentration versus peak height Is shown in
Fig. 5.7. The plot Is linear from 0.1 to 4.0 yg/ml
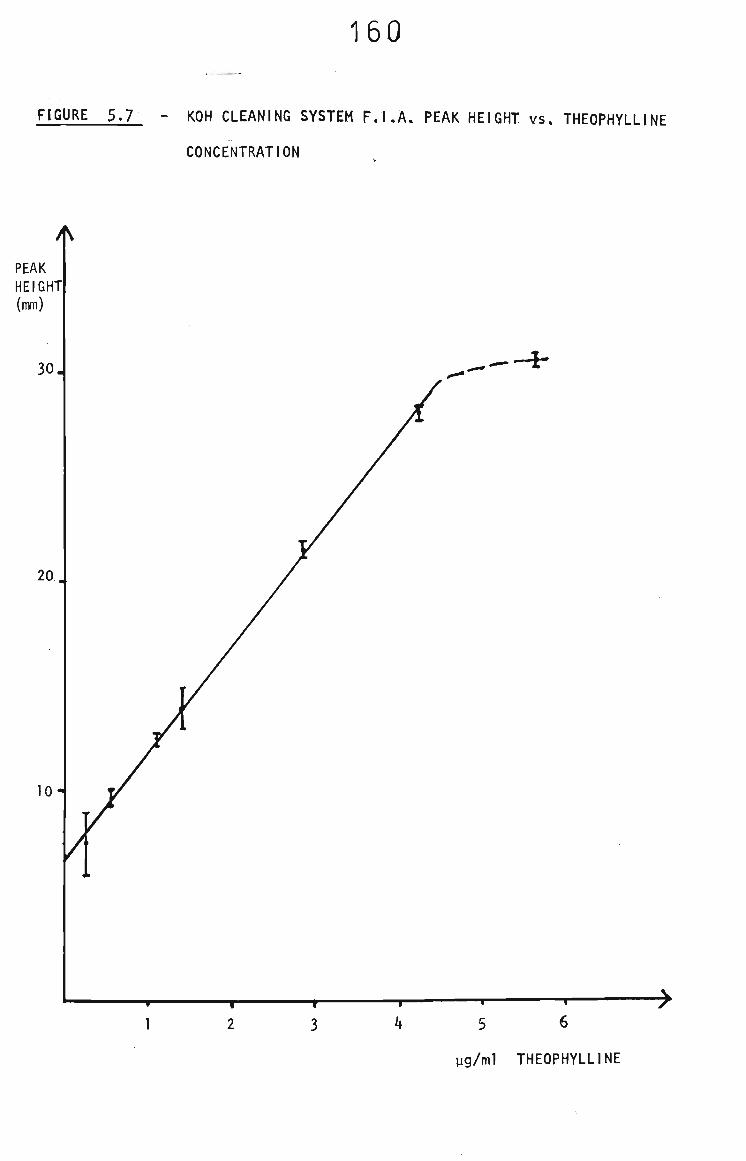
160
FIGURE 5.7 - KOH CLEANING SYSTEM F.l.A. PEAK HEIGHT vs, THEOPHYLLINE
CONCENTRATION
PEAK HEIGHT] (mm)
30.
20,
10-
_^Hh
T-
5 -r
6
yg/ml THEOPHYLLINE
161
theophylline and fits the following least squares analysis
equation;
I = 5.2 ± 0.1 X C + 6.5 ± 0.3
where I = peak Height (mm)
C = Concentration (yg/ml)
The correlation coefficient Is 0.3932.
These results were the best obtained for any of the cleaning
techniques Investigated. About 3 minutes is required to
obtain a useable base line after each KOH injection.
Sample measurements need to be made directly after
calibration since the electrodes response Is dependent on
the experimental history of the electrode surface,
5.3.3 Summary of Cleaning procedures for F.I.A. of Theophylline
1. Cathodic cleaning provides precise results (RSD = 4%) in an
acceptable time (3 minutes per theophylline injection) but
suffers the uncertainty of random noise problems.
2. The optimum solvent composition was found to be 60% methanol
and 40% pH = 7 phosphate buffer (prepared from HHttHzPOit to
aid solubility In methanol). Linear calibrations with
acceptable precision are possible but require greater than
5 minutes per measurement.
162
3. Methanol cleaning Injections provide precise results
(RSD £ \%) but the technique requires greater than 5 minutes
per measurement and exhibits curved calibrations.
4. Potassium Hydroxide cleaning injections, combined with the
optimum solvent, provide the best technique for theophylline
FIA. The results are precise (RSD < 2%) and rapid (3 minutes
per measurement resulting In a total analysis time of about
15 minutes). Calibrations are linear In a useable concent
ration range and the technique Is selective enough to be used
for initial neonatal monitoring or overdose cases.
5.4 Conclusion
A protocol for the direct determination of theophylline In serum by
FIA was not developed since the method would not significantly out
perform (with respect to speed, precision, sensitivity, selectivity
and cost) the alternative analytical techniques. HPLC Is the most
favourable and versatile method for theophylline since it requires
small sample volumes, it has good precision (RSD = 2%), is relatively
fast (analysis time 20-30 min.) and offers the advantage of separating
theophylline from Interferents. The only drawback of HPLC compared
to the other techniques Is the expense of the equipment.
The spectrophotometric and fluorimetrlc methods are fast (10-20
minutes) and precise enough to permit the use of one measurement per
sample, (RSD = 4% and 6% respectively). Both techniques may be
adapted to account for small sample sizes. Since these techniques are
direct procedures they have the disadvantage of a high number of
possible Interferents and cannot be used In all circumstances. The

163
cost of Instrumentation for these techniques Is comparable to the
cost of electrochemical Instrumentation.
The results of this investigation provide a good example of the
limitations of direct electroanalytical techniques for organic
compounds. Although the methods are rapid (120 Injections per hour
for quinol FIA), precise (RSD = 0.1% PRA for quinol) and sensitive
(0.4 ppb quinol detection limit by PRA), they are limited to
situations where the electrochemical selectivity is adequate.
Insoluble products which accumulate at the electrode surface are
produced with many organic analytes and this condition necessitates
either the preparation of new surfaces (such as with carbon paste)
or cleaning techniques such as those reported here for glassy carbon
electrodes. These procedures lengthen analysis time (and therefore
the cost per analysis) and Introduce more uncertainty in the measure
ments by increasing the number of steps in the analytical method.
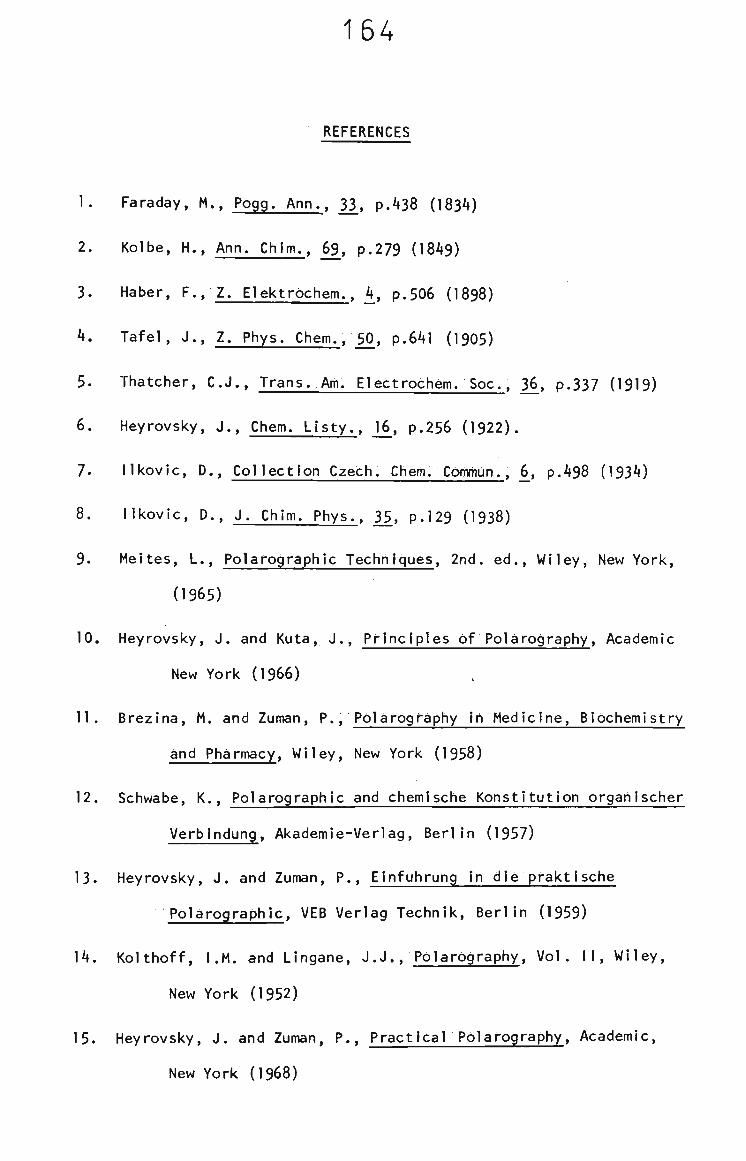
164
REFERENCES
1. Faraday, M., Pogg. Ann.. 33., p.438 (1834)
2. Kolbe, H., Ann. Chim., 63, p.279 (1843)
3. Haber, F., Z. Elektrbchem.. 4 , p.506 (I898)
4. Tafel, J., Z. Phys. Chem.. 50. p.641 (1905)
5. Thatcher, C.J., Trans. Am. Electrochem. Soc, 36. p.337 (1919)
6. Heyrovsky, J., Chem. LI sty.. J^, p.256 (1922).
7. Ilkovic, D., Collection Czech. Chem. CbmmOn., 6, p.438 (1334)
8. Ilkovic, D., J. Chim. Phys., 35, p.129 (1938)
9. Meites, L., Polarographic Techniques, 2nd. ed., Wiley, New York,
(1965)
10. Heyrovsky, J. and Kuta, J., Principles of Polarography, Academic
New York (I966)
11. Brezina, M. and Zuman, P., Polarography In Medicine, Biochemistry
and Pharmacy, Wiley, New York (1958)
12. Schwabe, K., Polarographic and chemische Kohstitutlon organischer
Verblndung, Akademie-Verlag, Berlin (1957)
13. Heyrovsky, J. and Zuman, P., EInfuhrung in die praktische
Polarographic, VEB Verlag Technik, Berlin (1959)
14. Kolthoff, I.M. and Lingane, J.J.. Polarography, Vol. II, Wiley,
New York (1952)
15. Heyrovsky, J. and Zuman, P., Practical Polarography, Academic,
New York (I368)
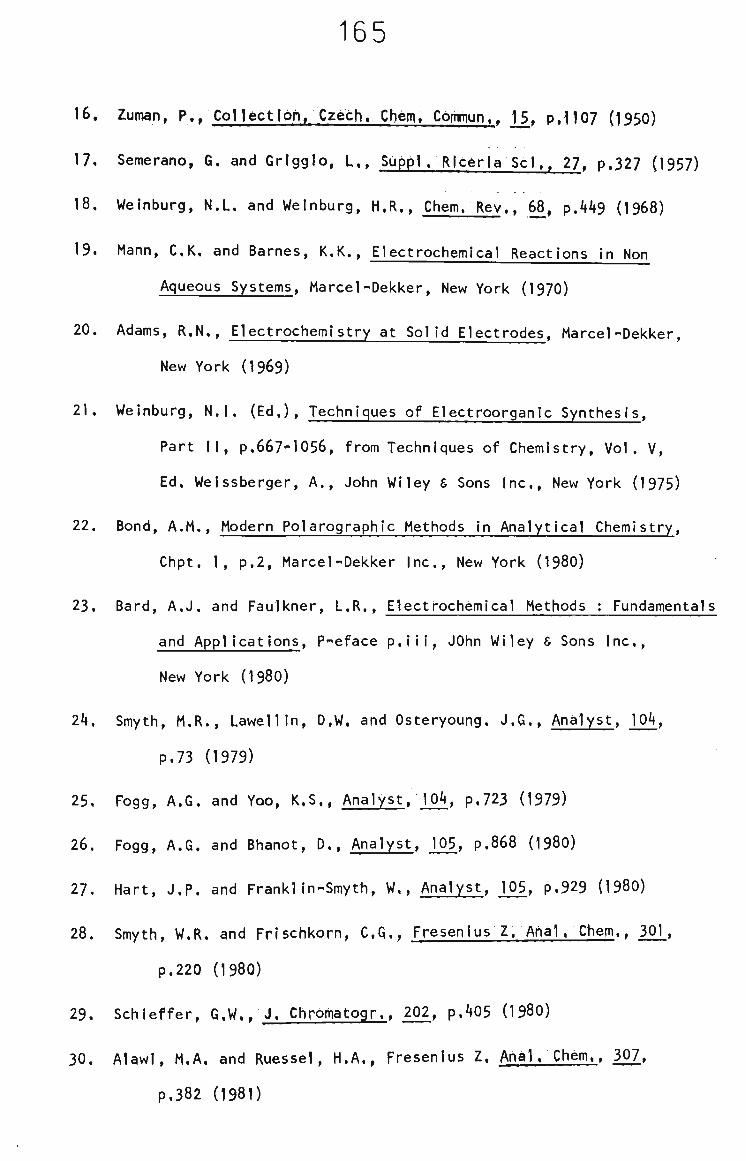
165
16. Zuman, P., Collect Ion/Czech. Chem. Cornfiiun.. _B, p.1107 (1950)
17. Semerano, G. and Grlgglo, L., Suppl. Rlc6rla Scl.. 27. p.327 (1957)
18. Weinburg, N.L. and Weinburg, H.R., Chem. Rev.. 68, p.449 (1968)
19. Mann, C.K. and Barnes, K.K., Electrochemical Reactions in Non
Aqueous Systems, Marcel-Dekker, New York (1970)
20. Adams, R.N., Electrochemistry at Solid Electrodes. Marcel-Dekker,
New York (1969)
21. Weinburg, N.l. (Ed.), Techniques of Electroorganlc Synthesis,
Part II, p.667-1056, from Techniques of Chemistry, Vol. V,
Ed. Weissberger, A., John Wiley & Sons Inc., New York (1975)
22. Bond, A.M., Modern Polarographic Methods in Analytical Chemistry,
Chpt, 1, p.2, Marcel-Dekker Inc., New York (1980)
23. Bard, A.J. and Faulkner, L.R., Electrochemical Methods ; Fundamentals
and Appl Icatlons, P-'eface p.iii, JOhn Wiley 6 Sons Inc.,
New York (1980)
24. Smyth, M.R., Lawellln, D.W. and Osteryoung. J.G., Analyst, 104,
P,73 (1979)
25. Fogg, A.G. and Yoo, K.S., Analyst, 104, p.723 (1979)
26. Fogg, A.G. and Bhanot, D,, Analyst, 105, p.868 (1980)
27. Hart, J.P. and FranklIn-Smyth, W,, Analyst, 105, p.929 (1980)
28. Smyth, W.R. and Frischkorn, C.G,; Fresenlus Z. Anal. Chem., 301,
p.220 (1980)
29. Schleffer, G.W,. J. Chromatogr., 202, p.405 (1380)
30. Alawl, M,A, and Ruessel, H,A., Fresenlus Z, Anal. Chem., 30_7,
p.382 (1381)

166
31. King, W.P., Joseph, K.T. and Kissinger, P.T., J. Assoc. Off. Anal. ' • • • * < • • • • • • • • • • • W ^ i ^ - W 1 ^ —
Chem., 63, p.137 (1380)
32. Archer, V.S. and Thuryaudom Tommanee, N., Talanta, 29(11A), p.905
(1982)
33. Ott, D.E., J. Assoc. Off. Anal. Chem.. , p.1465 (1978)
34. Mayer, W,J. and Greenburg, M.S., J. Chromatogr., 208, p.295 (1981)
35. Buchberger, W. and Wlnsauer, K,, Mikrochlm. Acta., 2 , p.257 (1980)
36. Batley, G.E. and Afgan, B,K., J. Electroanal. Chem. Interfacial
Electrochem., 125, p.437 (1981)
37. Stillman, R. and Ma, T.S., Mikrochim. Acta, ]_, p.641 (1974)
38. Pachla, L.A. and Kissinger, P.T., Anal. Chem., 48, p.364 (1376)
33. Takamara, K. and Watanabe, F.. Anal. Biochem., 74(2), p.512 (1976)
40. Pachla, L.A, and Kissinger, P.T., Methods in Enzymology, ^ ,
p.15 (1979)
41. Rueckemann, H., Z. Lebensm.-Unters. Forsch, 171, p.446 (I98O)
42. Brunt, K., Bruins, C.H.P. and Ooornbos, D.A.. Anal. Chim. Acta, |25,
p,85 (1981)
43. Pachla, L.A. and Kissinger, P.T., Anal. Chim. Acta, 88_, p.385
(1977)
44. Adams, R,N,, Mefford, I., Keller, R.W., Sternson, L.A. and Yllo, M.S.,
Anal, Chem,, 49, P.683 (1977)
45. Armentrout, D.N. and Cutle, S.S., J. Chromatogr, ScI., j8^, p.370
(1980)
46. Purnell, C, and Warwick, C , Analyst, I05. p.861 (1980)
47. Rappaport, R,, Jin, A.L. and Xu, X.B., J. Chromatogr., 24^, p.145 (I982)
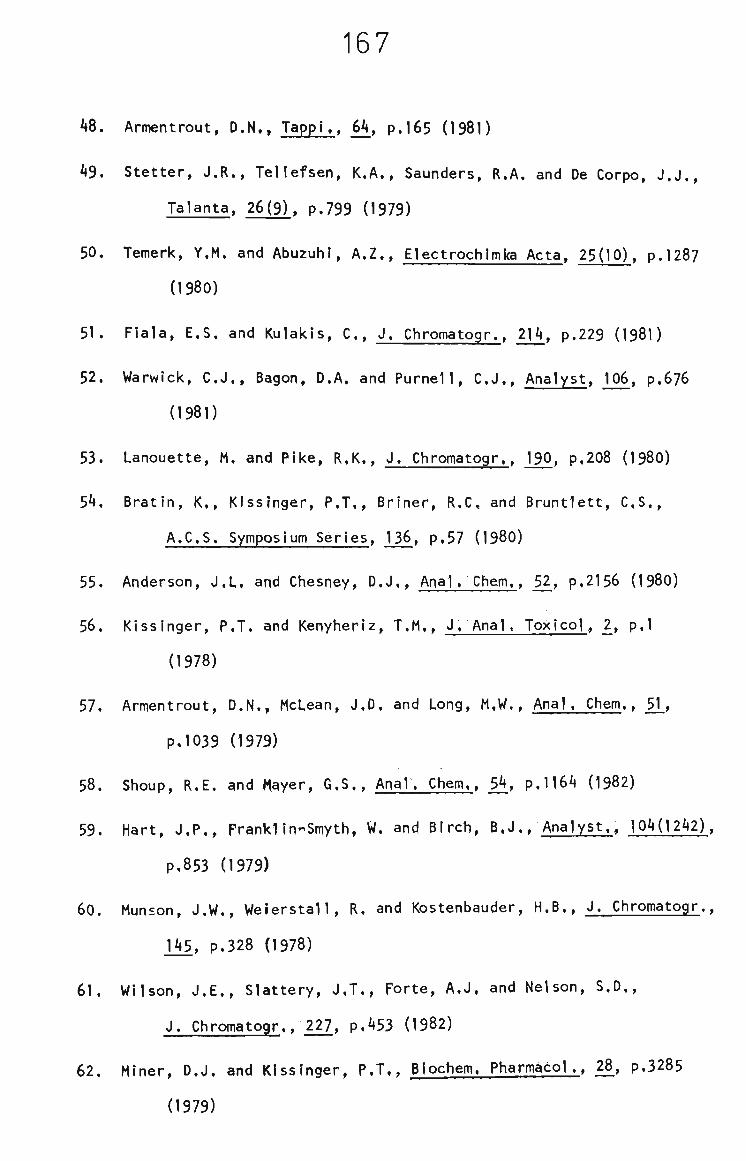
167
48. Armentrout, D.N., TappI,, 64, p.165 (1981)
49. Stetter, J,R., Tellefsen, K.A,, Saunders, R.A. and De Corpo, J.J.,
Talanta, 26(3), p.799 (1979)
50. Temerk, Y.M, and Abuzuhl, A.Z., Electrochlmle Acta. 25(10), p.1287
(1980)
51. Flala, E.S. and Kulakis, C , J. Chromatogr.. 214, p.229 (1981)
52. Warwick, C.J., Bagon, D.A. and Purnell, C.J., Analyst, 106, p.676
(1981)
53. Lanouette, M, and Pike, R.K., J. Chromatogr., 190, p.208 (I98O)
54. Bratin, K., Kissinger, P.T., Briner, R.C, and Bruntlett, C.S.,
A.C.S. Symposium Series, 136, p.57 (1380)
55. Anderson, J.L. and Chesney, D.J., Anal. Chem., _52_, p,2156 (1380)
56. Kissinger, P.T. and Kenyheriz, T.M., J. Anal. Toxicol, 2 , p.l
(1378)
57. Armentrout, D.N., McLean, J.D. and Long, M.W., Anal. Chem., 51,
p,1039 (1979)
58. Shoup, R.E. and Mayer, G.S.. Anal. Chem., 54, p.1164 (1982)
53. Hart, J,P., Frankl In-Smyth, W. and Birch, B.J./Analyst.^ 104(1242),
P,853 (1373)
60. Munson, J.W,, Weierstall, R. and Kostenbauder, H.B., J, Chromatogr,,
145, p.328 (1378)
61. Wilson, J.E., Slattery, J.T., Forte, A.J. and Nelson, S.D,,
J, Chromatogr,, 227, p.453 (1982)
62. Miner, D.J. and Kissinger, P.T., Biochem. Pharmacol., 28, p.3285
(1979)
168
63. Chatten, U.G., Moskalyk, R.E., Ucock, R.A. and Huang, K.S.,
J . Pharm. Sc l . , 65(9) , p.1315 (1976)
64. Sternson, L.A. and Thomas, G,, Anal. Lett.. 10(2), p.99 (1977)
65. Ollif, C.J., J. Pharm. Scl.. 66(11). p.1564 (1377)
66. Brooks, M.A., Hackman, M.R. and Mazzo, D.J., j. Chromatogr., 210,
p.531 (1981)
67. Baldwin, R.P., Packett, D. and Woodcock, T.M., Anal. Chem., 53,
P,540 (1981)
68. Clifford, J.M., Methodol.Dev. Biochem., .5, p.203 (1976)
69. Kobllela, A.. Pharmazle., 31 (9). p.649 (1976)
70. Ellaithy, M.M., Volke, J. and Manousek, 0., Talanta, ?4(2), p.l37
(1977)
71. Kobiela, A., Pharmazle., 32(11), p.633 (1377)
72. Brooks, M.A., D'Arconte, L.M., Hackman, M.R. and De Silva, J.A.E.,
J. Anal, Toxicol., 1(4), p.173 (1977)
73. Lung, W., Hannisdal, M. and Grelbrokk, T. J. Chromatogr., 173, p.249
(1979)
74. Hanekamp, H.B,, Voogt, W.H., Bos, P. and Frei, R.W., J. Liq.
Chromatogr,, 3., p. 1205 (1980)
75. Hanekamp, H.B., Voogt, W.H., Frei, R.W. and Bos, P., Anal. Chem., 53,
p.1362 (1981)
76. Kemula, W. and Kutner, W., J, Chromatogr., 204, p.131 (1981)
77. Ikenoya, S,, Hiroshima, 0., Ohmae, M. and Kawabe, K., Chem. Pharm.
Bull., 28, p.2941 (1980)
78. Kissinger, P.T, and Shoup, R.E., Biochem. Med., 13, p.299 (1975)
169
79. RIggIn, R.M., Alcorn, R.l,. and Rau, L.P., C1 In. Chem., 22 , p.782
(1976)
80. Lane, R.F, and Hubbard, A.T., Anal. Chem., 48, p.1287 (1976)
81. Lane, R.F., Hubbard, A.T., Fukunaga, K. and Blanchard, R.J., Brain
Res., 114, p.346 (1976)
82. FIke, R.R, and Curran, D.J., Anal. Chem., 4^, p.1205 (1977)
83. Fenn, R.J., SIggIa, S, and Curran, D.J., Anal. Chem., 50, p.l067
(1978)
84. Hansson, C , Edholm, L.E., Agrud, P., Rorsman, H., Rosengren, A.M.
and Rosengren, E.. Clin. Chem. Acta, 88, p,4l9 (1378)
85. Moyer, T,P,, Jiang, N.S., Tyce, G.M. and Sheps, S.G., Clin. Chem.,
£5, p,256 (1373)
86. Syed Laik, A, . Pharm. Z t y . , 122(41), p . l8 l6 (1377)
87. H i l l , H,A, and Eddowes, M,v),, J . Am. Chem. Soc,, jOl (16), p.4461
(1373)
88. Brooks, M.A., J, Pharm, Scl., 65(1), p.l12 (1376)
89. Davis, G . C , Holland, K.L. and Kissinger, P.T..J. Liq. Chromatogr,,
i, p,663 (1973)
90. Kissinger, P,T., Bratin, K., Davis, G.C. and Pachla, L.A.,
J. Chromatogr. Scl., jj,, p.137 (1979)
91. Molnar, L, and Proksa, B., Anal. Chim. Acta., 97lil> P-1^9 (1978)
92. White, M.W,. J. Chromatogr., 178, p.223 (1379)
93. Wallace, J.E. and Shlmek, E.U, Anal. Chem./52, p.1328 (1380)
94. Dryhurst, G, and Pace, G.F.. J. Electrotherti. SOc. (Electrochem. Scl.).,
117(10), p.1259 (1970)
170
95. Elvlng, P.J.. Blolelectrbchetn. and Bloenergetlcs., 3., p.37 (1976)
96, Yao, T,, Wasa, T, and Musha, S., Bull. Chem. Soc. Japan, 50(11),
p.2917 (1977)
37, Mayer, W.J., McCarthy, J.P. and Greenberg, M.S., J. Chromatogr. Sci.,
17.» p.656 (1979)
98. Olson, C L , and Porterfield, R.l., Anal. Chim. Acta., , p.444
(1973)
99. Alary, J,, Cantin, D. and Coeur, A., Bui 1. Soc. Chim. Fr., Part 1,
P,649 (1977)
100. Shimada, K., Tanaka, M, and Nambara, T.. Anal, Lett., j3., p.l 123
(1380)
101. Clark, L.C, Duggan, C.A., Grooms, T.A., Hart, L.M. and Moore, M.E.,
Clin, Chem., 27, p.1378 (1381)
102. Hepler, B.R., Weber, S.G. and Purdy, W.C.. Anal. Chim. Acta., VV^f
p,263 (1380)
103. Hay, l,D,, Annesley, T.M., Jiang, N.S. and Gorman, C.A.,
J. Chromatogr,, 226, p.383 (1381)
104. Lehtlnen, M, and Halmekoski, J., Farm. Aikak., 85(2), p.35 (1376)
105. Smyth, W.F. and Davidson, I .E.. Anal. Chem./^_9, p.1195 (1977)
106. Manoutchehr, Y. and Blrke, R.L., Anal. Chem., .9, p.1380 (1977)
107. RabensteIn, D.L, and R. Saetre, Clln. Chem., 24, p.1l40 (1978)
108. RabensteIn, D.L. and Saetre, R., Anal. Biochem., 90, p.684 (1378)
109. Bergstrom, R.F., Kay, D.R. and Wagner, J.G., J., Chromatogr., 222,
p.445 (1981)
110. Perrett, D. and Dury, P-L.. J. Llg. Chromatogr., ^, p.97 (1982)
171
111. Kissinger, P.T., Bruntlett, C.S,, Davis, G.C, fellce, UJ.,
RIggIn, R.M, and Shoup, R.E., Clln. Chem.. 23. p.1449 (1977)
112. Koch, D.D. and Kissinger, P.T., J. Chromatogr. (Blomed. Applications).
164, p.4^1 (1379)
113. Krstulovic, A.M., Friedman, M.J., Sinclair, P.R. and Felice, J.,
Clin. Chem.. 27. p.1231 (I38I)
114, Pachla, L.A, and Kissinger, P.T., Clln. Chim. Acta.. 59, p.309
(1975)
115. Green, D.J. and Perlman, R.L., Clln. Chem., 26, p.796 (I98O)
116. Weinman, E.J., Sheplock, D., Sansom, S.C, Knight, T.F. and
Serekjlan, H.O., Kidney Int,, j^* P'83 (1981)
117. Tsao, C.S. and Saliml, S,L., J, Chromatogr., 224, p.477 (1981)
118. Munson, J,W. and Abdine, H., Talanta, , p.221 (1978)
119. Lewis, E.C and Johnson, D.C, CI In. Chem., £4, p.1711 (1978)
120. Milano, E,A., Waraszkiewicz, S.M, and Di Rubio, R,, J. Pharm. Scl.,
20, p,1215 (1981)
121. Milano, E,A.. Current Separations, 4^ p.17 (1982)
122. Smith, R.V. and Humphrey, D.W.. Anal. Lett., Jj^, p.601 (1981)
123. Fogg, A.G, and Ahmed, Y.Z., Anal. Chim. Acta., 94, p.453 (1977)
124. Zuman, P,, Romer, M. and Donaruma, L.G., Anal. Chim. Acta., 88,
p,261 (1977)
125. Wlenhold, K, and Sohr, H.. Z. Chem., Vl, P.420 (1977)
126. Oelschlaeger, H., Karek, E., Sengun, F.I. and Volke, J., Fresenlus
Z. Anal. Chem., 282, p.123 (1976)
172
127. Lund, W. and Ophelm, L,N., Ati^]. Chim. Acta.. 82. p.275-345 (1376)
128. Franklln-Smyth, W., Smyth, M.R., Groves, J.A. and Tan, S.B., Analyst.,
103, p.437 (1978)
129. Lund, W., Hannisdal, M. and Grelbrokk, T., J. Chromatogr.. 173,
p.249 (1979)
130. Hanekamp, H.B., J. Llg. Chromatogr., 3., p.1205 (1980)
131. Hanekamp, H.B., Voogt, W.H., Frei, R.W. and Bos, P., Anal. Chem., 53^,
p,1362 (1981)
132. Holak, W,, J. Assoc. Off. Anal, Chem., 6£, p.1015 (1977)
133. Jacobsen, E, and Glyseth, B., Talanta, 22, p.1001 (1975)
134. Ophlem, L.N., Anal. Chim. Acta., 89, p.225 (1977)
135. Chatten, L.G., Yadav, R.N., Binnington, S, and Moskalyk, R.E.,
Analyst., 102, p.323 (1977)
136. Chatten, L,G,, Yadav, R.N. and Madan, D.K., Pharm. Acta. Helv., 51,
p.381 (1377)
137. Yadav, R.N. and Teare, F.W., J. Pharm. Scl., 67, p.436 (1978)
138. Qazi, T.U., Bailey, D.J.W. and Ooggett, N.S., Pak. J. Sci. Ind. Res.,
24, p,71 (I98I;
133. Chakarova, P., Buderski, 0. and Khristova, S., Pharmazle., 32.,
p.468 (1377)
140. Jacobsen, E. and Bjornsen, M.W., Anal. Chim. Acta., 36, p.345 (1978)
141. Chan, H.K. and Fogg, A.G., Anal. Chim. Acta., Ill, p.281 (1979)
142. Peterson, R.G., Rumack, B.H., Sullivan, J.B, and Makowskl, A,
J. Chromatogr.. 188, p.420 (1980)
143. Smith, R.V, and Humphrey, D.W.. Anal. Lett., Ij, p.601 (I98I)
173
ll"!. Funk, M.O., Keller, M.G, and Uevison, G., Anal. Chem.. 52, p.771
(1980)
145. Kross, W., Pharm, Ztg.. 121. p.1831 (1976)
146. TJaden, U,R., Lankelma, J., Poppe, H. and Mausze, R.G., J. Chromatogr..
125, p.275 (1976)
147. Lankelma, J. and Poppe, H., J. Chromatogr.. 125, p.375 (1976)
148. Underberg, W.J.M., Ebskamp, A.J. and PI lien, J.M., Fresenlus Z. Anal,
Chem., 287, p.236 (1377)
143. Wallace, J.E., ShImek, E.L., Starchansky, S. and Harris, S.C,
Anal. Chem,, 53, p.360 (I38I)
150. Riggin, R.M., Rau, L.D., Alcorn, R.L. and Kissinger, P.T., Anal. Lett..
L P-791 (1974)
151. Karolczak, M., Drelling, R., Adams, R.N., Felice, L.J. and Kissinger,
P.T., Anal. Lett., 3, p.783 (1976)
152. Davidson, I.E. and Franklin-Smyth, W., Anal. Chem., _5L> P.2l27
(1979)
153. Davidson, I.E., Proc. Anal. Div. Chem. Soc., ]3_, p.229 (1976)
154. Slamnik, M., J. Pharm. Sci., 65, p.736 (1976)
155. Sodherhjelm, P. and Lindquist, J., Acta Pharm. Suec, 13, p.201
(1976)
156. Heiliger, F,, Current Separations, 2(3) p ^ 0^^*^)
157. Kimmerle, F.M. and Foley, L., Anal. Chem., 5i» P- ' (1979)
158. Bratin, K, Kissinger, P.T., Briner, R.C and Bruntlett, G.S.,
Anal. Chim. Acta., 130, p,295 (1981)
159. Bratin, K. and Briner, R.C, Current Separations, 2^(3),p5 (\<^$6)
174
160. Briner, R.C and Choucholy, S., Current Separations, jf, p.20 (1982)
161. Du Rietz, C , Soensk. Kemlsk. TIdskrift.. 6^, p.310 (1957)
162. Bond, A.M., Casey, A.T. and Thackeray, J.R., J. Electroanal, Chem..
48, p.71 (1973)
163. Green, J.B. and Manahan, S.E,, Anal. Chem., S\^, p.1126 (1979)
164. Pungor, E., Feher, Z., Nagy, G. and Toth, K., Anal. Proc., 19,
p.79 (1982)
165. Cosofret, V.V., Membrane Electrodes In Drug-'Substances Analysis,
Pergamon Press, New York, (1982)
166. PInkerton, T.C and Lawson, B.L., Clin. Chem., 28, p.1946 (1382)
167. Vadgama, P,, Enzyme Electrodes, Ch, 2 In Ion Selective Electrode
Methodology, Ed,, A.K, Covington, Vol. II, CR.C Press Inc.,
(1979)
168. Carmach, CD. and Preiser, H., Anal. Chem., 49, p.1577 (1977)
163, Campanella, L., De Angel is, G., Ferri, T. and GozzI, D., Analyst, 102,
p.723 (1377)
170. Bard, A.J. and Faulkner, L.R., Electrochemical Methods; Fundamentals
and ApplIcattons, p.73-74, John Wiley S Sons Inc., New York,
(1380)
171. Nicholson, R.S. and ShaIn, I.. Anal. Chem., 36., p.706 (1364)
172. Bard, A.J. and Faulkner, L.R., ElectfochemlcaT Methods; Fundamentals
and Applications, p.l83, John Wiley 6 Sons Inc., New York (I98O)
173. Barker, G.C and Jenkins, I.L., Analyst, 72, P.685 (1952)
174. Barker, G.C, Anal. Chim. Acta., J S, p.l 18 (1958)
175. Sand, H.J.S,, Phil. Mag., 1, p.^5 (1901)
175
176. Bos, P. and Van Dalen, £., J. Electroanal. Chem.. .^, p.165 (1373)
177. Adams, R.N., Rellley, C.N. and Furman, N.H., Anal. Chem,. ^ ,
P,1160 (1353)
178. IshibashI, M, and Fujlnaga, T., Anal. Chim. Acta.. J^, p.112 (I356)
179. Heyrovsky, J,, Chem. LI sty.. 35, p.155 (1941)
180. Barker, G.C In Transactions on the Symposium on Electrode Processes,
Ed. E, Yeager, Wiley, New York, p.325 (1961)
181. Delahay, P., Anal. Chem.. 3jt» P-^^^' (19^2)
182. Eisner, U. and Mank, H.B., J. Electroanal, Chem., 24, p.345 (1970)
183. Heritage, I.D. and Bond, A.M., Abstracts, p.62, Seventh Australian
Symposium on Analytical Chemistry, Adelaide, (I983), R.A.CI.
PublIcation.
184. Bruckenstein, S. and Miller, B,, J. Electrochem. Soc., 117, p.1032
(1970)
185. Bard, A.J. and Faulkner, L.R., Electrochemical Methods; fundamentals ' ' ' , • • • ! • • • • • • • • P l l « p > l « ^ W ^ < » B » W W » l f » 1 - ^ • ^ • • • • p I
and Appl icatlons, p,l86, John Wiley s Sons Ine, New York (1980)
186. Bond, A,M., Modern Polarographic Methods In Analytical Chemistry,
p,211-212, Marcel"Dekker Inc., New York, (I98O)
187. Morris, J.L. and Faulkner, L.R., Anal. Chem., 49, p.489 (1977)
188. Bard, A,J. and Faulkner, L.R.. Electrochemical Methods; Fundamentals
and Applications, p.200, John Wiley & Sons Inc., New York (I98O)
189. Christie, J.H, and Osheryoung, R.A., J. Electroanal. Chem., 49.,
p.301 (1974)
190. Metrohm E506 and E505 Manual, ^Instructions for Use", p.l08
Metrohm Ltd., CH''9100, Herlsau, Switzerland.
176
191. C h r i s t i e , J . H . , Osteryoung, R,A., Copeland, T.R, and Skogerboe, R.K.,
Anal. Chem,, 45, p.2171 (1973)
192. Myers, D.U., Osteryoung, R.A. and Osteryoung, J., Anal. Chem., ^ ,
p,2089 (1974)
193. Bard, A.J. and Faulkner, L.R., Electrochemical Methods; Fundamentals
and ApplIcatlons, p.196-197, John Wiley 6 Sons Inc., New York
(1980)
194. Bond, A.M., Modern Polarographic Methods In Analytical Chemistry,
p.288-291, Marcel-Dekker Inc., New York (1980)
195. Bond, A.M., Modern Polarographic Methods in Analytical Chemistry,
p,288-291, Marcel-'Dekker Inc., New York (1980)
196. Bond, A.M., Modern Polarographic Methods in Analytical Chemistry,
p,294-297, Marcel-Dekker Inc., New York (I98O)
197. Smith, D.E., CR.C. Crit. Rev. Anal. Chem., 2 , p.247 (1971)
198. Lurch, V.G., Physlochemlcal Hydrodynamics, Prentice-Hall,
Englewood Cliffs, N.Y., (1962)
199. Bard, A.J. and Faulkner, L.R., Electrochemical Methods; Fundamentals
and Applicatlons, p.295^298, John Wiley S Sons Inc., New York,
(1980)
200. Bruckenstein, S. and Miller, B., J. Electrochem. Soc, 117, p.1032
(1970)
201. Bard, A.J. and Faulkner, L.R., Electrochemical Methods: Fundamentals
and Applications, p,309-311, John Wiley 6 Sons Inc., New York,
(1980)
202. Blaedel, W,J, and YIm, Z., Anal. Chem., .52, p.564 (I98O)
177
203. Ruzlcka, J. and Hansen, E.H,, Flow Injection Analysis. Ch. 2
p.6-7, John Wiley and Sons, New York (1981)
204. Ruzlcka, J. and Hansen, E.H., Flow Injection Analysis, Ch. 1
John Wiley and Sons, New York (1981)
205. Ruzlcka, J. and Hansen, E.H., Flow Injection Analysis. Ch, 2,
p.116-122, John Wiley and Sons, New York (1981)
206. Ruzlcka, J, and Hansen, E.H., Flow Injection Analysis, Ch. 4,
John Wiley and Sons, New York (1981)
207. Ruzlcka, J. and Hansen, E.H., Flow Injection Analysis. Ch. 2
John Wiley and Sons, New York (1981)
208. Ruzlcka, J, and Hansen, E.H,, Flow Injection Analysis. Ch. 2,
p.16-17, John Wiley and Sons, New York (1981)
209. Shoup, R,E. (Ed.), Recent Reports on Liquid Chromatography/
Electrochemistry, Ch, 2, Bloanalytical Systems Inc., West
Lafayette, Indiana, (1982)
210. Ruzlcka, J, and Hansen, E.H,, Flow Injection Analysis, Ch. 5.4,
p,l22, John Wiley and Sons, New York (I98l)
211. Kissinger, P.T., Bruntlett, L.S., Bratin, K. and Rice, J.R.,
Proc. 9th Materials Research Symposium " Trace Organic Analysis'
U.S. National Bureau of Standards Special Publication, 519,
p.705-712 (1979)
212. Stullk, K. and Packakova, V., J. Chromatogr., 208, p.269-278
(1981)
213. F leet , B. and L i t t l e , C .J . , J . Chromatogr. S c l . , J[2> p.747-752
(1974)
214. Armentrout, D.N., McLean, J.D, and Long, M.W,, Anal, Chem., 51,
p.1039-1045 (1979)
178
215. Yamada, J. and Matsuda, H., J. Electroanal. Chem.. 44, p.18 (1973)
216. Westerlnk, B.H.C and Mulder, T.B.A,, J. Neurochem.. 36, p.1449-1462
(1981)
217. Van Der Linden, W,E. and Dicker, J.W., Anal. Chim. Acta.. 119,
p.l-24 (1980)
218. Engstrom, R.C., Anal. Chem.. , p.2310-2314 (1982)
219. Engstrom, R.C, Anal. Chem., 56, p.136-141 (1984)
220. Ravichandran, K. and Baldwin, R.P., Anal. Chim., 56, p.1744-1747
(1984)
221. Gold, E.H. and Ginsburg, D., J. Chem. Soc. (C). p.15-20 (I967)
222. The Merck Index. 10th Ed., p.699, Merck £ Co. (nc, Rahway, N.J.
(1983)
223. Roberts, J.D. and Caserlo, M.C., Basic Principles of Organic
Chemistry, p.l110, W,A. Benjamin Inc., New York (I965)
224, Roberts, J.D. and Caserlo, M.C,, Basic Principles of Organic
Chemistry, p.922-923, W.A. Benjamin Inc., New York (1965)
225. Vogel, A.I., A Text Book of Quantitative Inorganic Analysis, 3rd, Ed,
p.918-919, Longman, London (1969).
226, Rein, H, and Griegee, R,, Angew. Chem., £2, p.120 (1950)
227. Robertson, A., Nature (London), 2.62, p. 153 (1948)
228, Mural, S,, Sonoda, N, and Tsatsumi, S., Bull. Chem. Soc, Jpn., 36,
p,527 (1963)
229. Cattrall, R.W., Solid Contact Electrodes, In: Ch. 8 Ion Selective
Electrode Methodology, Ed. Covington, A.K,, CR.C Press Inc.
(1979)
179
230. Olson, C and Adams, R.N., Anal. Chim. Acta., 2i» p.582-589.
231. Ruzlcka, J. and Hansen, E.H., Flow Injection Analysis, Ch. 1,
John Wiley and Sons, New York, (1981)
232. Kissinger, P.T. Ed., An Introduction to Detectors for Liquid
Chromatography, 1st, Edition, p.7-15, BAS Press, West
Lafayette, (1981)
233. Peover, M.E., J. Chem. Soc, p.4540 (1962)
234. Bryce-Smlth, D. and Gilbert, A., J. Chem. Soc, p.2428 (1964)
235. Malcolm-Bruce, J., Photochemistry of (Quinones. Ch. 9, p.465-538
In: The Chemistry of Quinoid Compounds, Part 1, Ed. S. Ratal,
John Wiley and Sons Inc., London (1974)
236. Silverstein, R.M. and Bassler, G.C, Spectrophotometric Identification
of Organic Compounds, 2nd. Edition, p.155-161, John Wiley and
Sons Inc., Sydney (1967)
237. Cattrall, R,W, and Hamilton, l,C,, Ion Selective Electrode Rev., 6,
(2), p.125 (1984)
238. Jenne, J.W,, Wyze, E,, Rood, F.S, and MacDonald, F,M,, Clinical
Pharmaco., j3., p.349-60 (1972)
239. Wilson, A.F, and Phillips, J.J,, Ann. Rev. Pharmacol. Toxicol., Jl ,
p.541-61 (1978)
240. Uges, D.R.A., Pharmaceutisch WeekI ad., 112, p.1253-66 (1977)
241. Rosen, J.P., Danish, M., Ragni, M.L., Lopez Saccar, C , Yaffe, S.J.
and Leeks, H.I,, Pediatrics., 64, p.248 (1979)
242. Simons, F.E.R. and Simons, K.J., Am. J. Diseases of Children, 134,
p.39-42 (1980)
180
243. Hendles, L. and Weinberger, M., Am. J. Hospital Pharmacy.. 27,
p,49-53 (1980)
244. Shack, J.A. and Waseler, S.H., J. Pharmacol. Exp. Therap,, 97,
p,283 (1949)
245. Jatlow, P., Clln. Chem,, 2JI_, p.1518 (1975)
246. Vaslllades, J, and Turner, T., Clln. Chim. Acta., 69, p.491 (1976)
247. Gupta, R.C. and Lundberg, G.D., Anal. Chem., 45, p.2403 (1373)
248. Boobis, S. and Gapta, R . C , Brit. J. Clln. Pharm., 9., p.277-279 (1980)
249. Johnson, G.F., Decktiaruk, W.A. and Solomon, H.M., ClIn. Chem., 21,
p.144 (1975)
250. Perrier, D, and Lear, E., Clin. Chem., ^ , p.898 (1976)
251. Lowry, J.D,, Williamson, L.J. and Ralsys, V.A.. J. Chromatogr., J_43.,
p.83-88 (1977)
252. Naish, P., Chambers, R.E. and Cooke, M.. Anals. of Clin. Biochem., j_6,
p.254-58 (1979)
253. Sheehan, M., Her te l , R,H. and Kel ly , C.T.. C l l n . Chem., 23, p.64
(1977)
254. Lesne, M. and Clerckx-Braun, F., J. de Pharmacje de Belglque., 34.,
p.353-9, (1979)
255. Borner, K,, Lichy, J. and Staib, A.H., Analytlsche. Chimie., 301,
p,112-113 (1980)
256. Borner, K., Lichy, J. and Stalb, A.H., Analytlsche. Chimie,, 301,
p.114 (1980)
257. Meola, J.M., Brown, H.R. and Swift, T., Clln. Chem., ^5, p.1835
(1979)
181
258. Meola, J.M., Brown, H.R, and Swift, T., ClIn. Chem., 26, p.53^
(1980)
259. SItar, D.S., Plafsky, K.M., Rango, R.E. and Ogllvte, R.I.,
Clinical Research., ^ , p.726A (1974)
260. Thompson, R.D., Nagasawa, H.T. and Jenne, J.W., J. Lab. Clin. Med.,
84, p.584 (197^)
261. Peat, M.A. and Jennlson, T.A., Anal. To?<lcb1ogy, 1, p.204 (1977)
262. Morgant, G. and Aymard, P., In; Drug Measurement and Drug Effects
in Laboratory Health Science, p.57, ^th. International Co-loquium
on Prospective Biology, Port a Mousson, France (1978),
Ed. Siest, G. et al.
263. Manno, B.R. and Hillman, B.C., J. Anal, Toxicol., 2, P.8l (1979)
264. Bond, L.W. and Thornton, D.L.. ClIn. Chem., 25, p.1186 (1979)
265. Schier, G.M., Clin. Chem., 2^, p.1191 (1979)
266. Farrish, H.H. and Wargln, W.A., ClIn. Chem., 26, p.524 (I98O)
267. Agdeppa, D.A. and LIpton, S.D., Clin. Chem., 26, p.788 (I98O)
268. Dolan, J,W., van der Wal, Sj., Bannister, S.J. and Snyder, L.R.,
Clin. Chem,, 26, p.871 (1980)
269. Bowman, D.B., Aravlnd, M.K., Kauffman, R.E. and Miceli, J.N.,
Clin. Chem., 26, p.1622 (I98O)
270. Weidner, N., McDonald, J.M., TIeber, V.L., Smith, CH., Kessler, C ,
Ladenson, J.H, and Dietzler, D.N., Am. J. Cl In. Path., _73,
p.79 (1980)
271. Qualtrone, A.J. and Putnam, R.S., Cl In. Chem., 27, p.129 (1981)
272. Munson, J.W. and Abdine, H., Talanta, 25, p.221 (1977)
273. Lewis, E.C and Johnson, D . C . Cl In. Chem., 24, p.1711 (1978)
182
274. Dryhurst, G, and Hansen, B., J. Electpoahal. Chem.. 30, p,407-416
(1971)
275. Dryhurst, G. and Hansen, B,, J. Electroanal. Chem.. 30,
p.417-426, (1971)
276. Dryhurst, G. and Hansen, B., J. Electroanal. Chem., ^2, p.405-414
(1971)
277. Dryhurst, C , Electrochemistry of Biological Molecules. New York,
Academic Press (1977)
278. Blaedel, W.J. and Engstrom, R . C , Anal. Chem., .50, p.476-79 (1978)
279. Blaedel, W.J. and Yim, Z., Anal, Chem,. ^2, p.564-66 (1980)
280. Henry, R.J, and Dryer, R.L., In: Standard Methods of Clinical
Chemistry, Vol. 4, p.203-238 (1963). Ed. Sellgson, D.,
Academic Press, New York,
281. Bowker, A.H,, In; Techniques of Statistical Analysis, p.97-llO
(1947). Eds. Eisenhart, C et al., McGraw-Hill, New York.
282. Bowker, A.H,, In; Techniques of Statistical Analysis, p.97-llO,
(1947), Eds. Eisenhart, C et al., McGraw-Hill, New York.
283. Skoog, D.A. and West, D.M,, Fundamentals of Analytical Chemistry,
2nd, Edition, p.55 (1973), Holt, Relnhart and Winston Inc.,
London,
284. Umstead, G.S. and Rosen, J.P., Clin. Chem., 2^(10), p.1837 (1979)
285. Jordan, G., M. Pharm. thesis I98O. The Victorian College of
Pharmacy, Royal Parade, Parkvllle, Melbourne, Australia.
286. Meola, J.M., Brown, H.R. and Swift, T.. Clln. Chem., £5(10), p.1835
(1979)
183
287. peat, M.A., Jennlson, T.A. and Chlnn, D.M., Anal. Toxicology, 1(5),
p.204 (1977)
288. Skoog, D.A. and West, P.M., Fundamentals of Analytical Chemistry,
2nd. Edition, p.55 (1973), Holt, Relnhart and Winston Inc.,
London.
289. Levy, C , Ellis, E.F. and Koysooka, R,, Pediatrics, 53, p.873 (1974)
290. Khanna, N.N., Bada, H.S. and Soman I, S.M.,'Pediatrics, 96, p. 494
(1980)
291. Ruzlcka, J. and Hansen, E.H., Flow Injection Analysis, John Wiley
and Sons, New York (1981).
292. Moore, W.J,, Physical Chemsltry, 5th Edition, p.520-548, Longman
Group Limited, London, 1972.
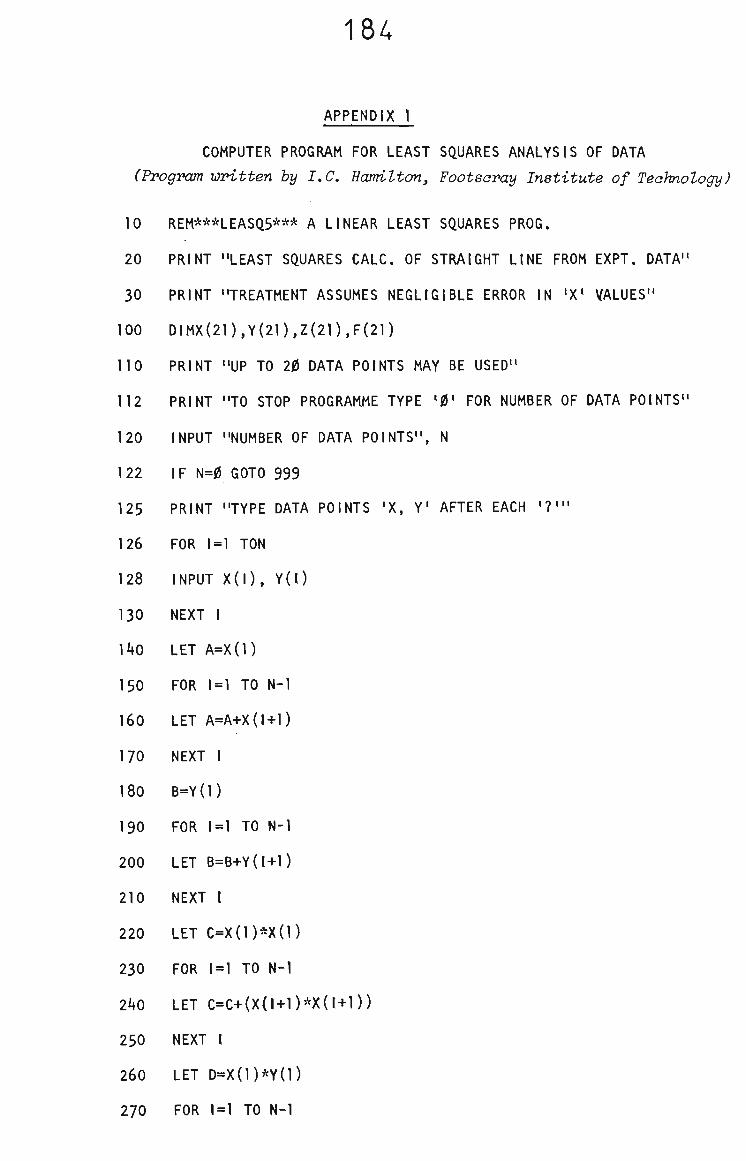
184
APPENDIX 1
COMPUTER PROGRAM FOR LEAST SQUARES ANALYSIS OF DATA
(Program written by I.C. Hamilton, Footscray Institute of Technology)
10 REM***LEASQ5*** A LINEAR LEAST SQUARES PROG.
20 PRINT "LEAST SQUARES CALC OF STRAIGHT LINE FROM EXPT. DATA"
30 PRINT "TREATMENT ASSUMES NEGLIGIBLE ERROR IN 'X' VALUES"
100 DIMX(21),Y(21),Z(21),F(21)
n o PRINT "UP TO 20 DATA POINTS MAY BE USED"
112 PRINT "TO STOP PROGRAMME TYPE '0' FOR NUMBER OF DATA POINTS"
120 INPUT "NUMBER OF DATA POINTS", N
122 IF N=0 GOTO 999
125 PRINT "TYPE DATA POINTS 'X, Y' AFTER EACH '?'"
126 FOR 1=1 TON
128 INPUT X(l), Y(l)
130 NEXT I
140 LET A=X(1)
150
160
170
180
190
200
210
220
230
240
250
260
270
FOR 1=1 TO N-1
LET A=A+X(I+1)
NEXT 1
B=Y(1)
FOR 1=1 TO N-1
LET B=B+Y(l+l)
NEXT 1
LET C=X(1)*X(1)
FOR 1=1 TO N-1
LET C=C+(X(l+l)*X(t+l))
NEXT I
LET D=X(1)*Y(1)
FOR 1=1 TO N-1
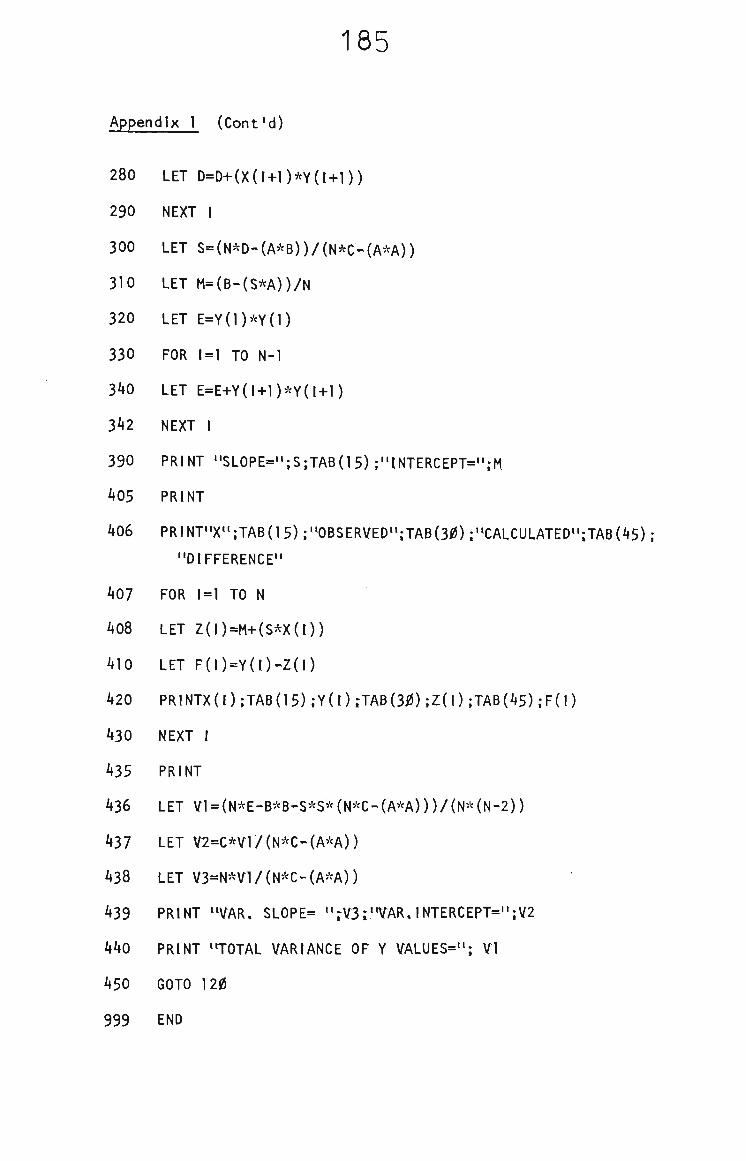
185
Appendix 1 (Cont'd)
280 LET D=D+(X(t+l)*Y(l+l))
290 NEXT I
300 LET S=(N*D-(A*B))/(NAC-(A*A))
310 LET M=(B-(S*A))/N
320 LET E=Y(1)*Y(1)
330 FOR 1=1 TO N-l
340 LET E=E+Y(l+1)*Y(I+1)
342 NEXT I
390 PRINT "SL0PE=";S;TAB(l5);"tNTERCEPT=";M
405 PRINT
406 PRINT"X";TAB(15);"OBSERVED";TAB(30);"CALCULATED";TAB(45);
"DIFFERENCE"
407 FOR 1=1 TO N
408 LET Z(l)=M+(S*X(t))
410 LET F(l)=Y(t)-Z(l)
420 PRINTX(0;TAB(15);Y(0;TAB(3JZS):Z(l);TAB(45)jF(l)
430 NEXT I
435 PRINT
436 LET Vl = (N*E-B*B-S'^S*(N*C-(A*A)))/(N'^(N-2))
437 LET V2=C*Vl/(N*C-(A'^A))
438 LET V3=N*V1/(N''^C-(A*A))
439 PRINT "VAR. SLOPE= "rV3r'VAR,INTERCEPT=";V2
440 PRINT "TOTAL VARIANCE OF Y VALUES="; Vl
450 GOTO 120
999 END
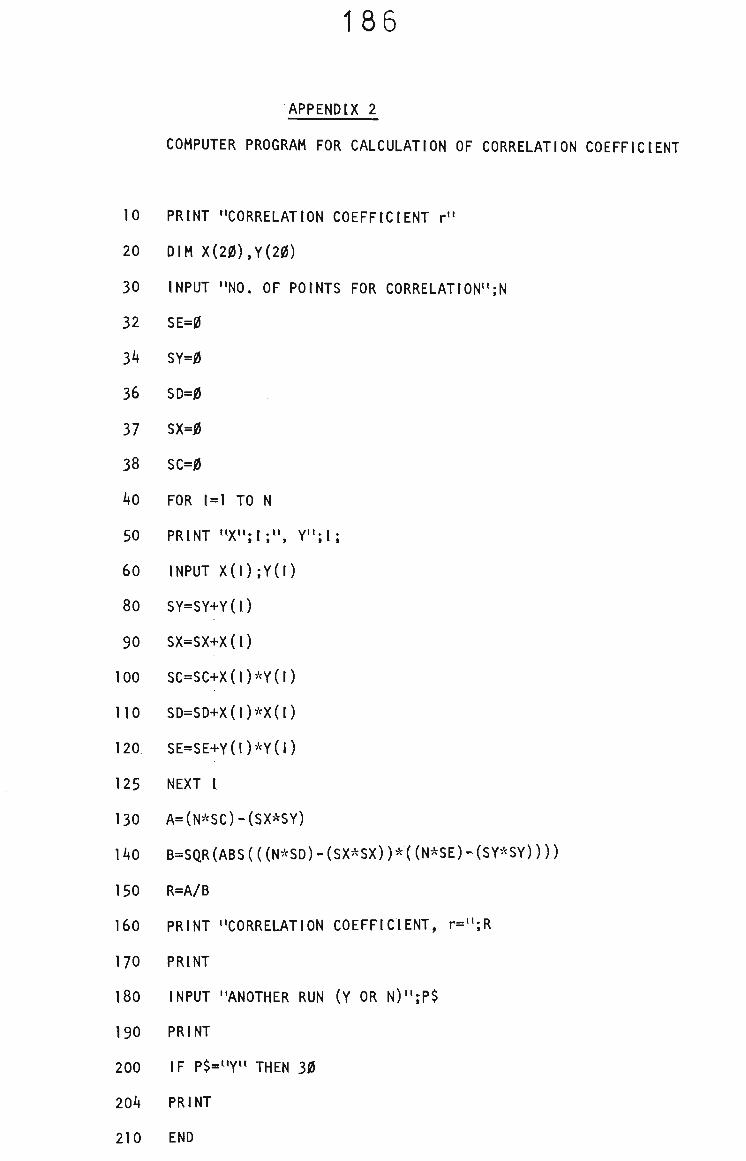
186
APPENDIX 2
COMPUTER PROGRAM FOR CALCULATION OF CORRELATION COEFFICIENT
10 PRINT "CORRELATION COEFFICIENT r"
20 DIM X(20),Y(20)
30 INPUT "NO. OF POINTS FOR CORRELATION":N
32 SE=0
34 SY=0
36 SD=0
37 SX=^
38 SC=0
40 FOR 1=1 TO N
50 PRINT "X";l;", Y";I;
60 INPUT X(I);Y(I)
80 SY=SY+Y(I)
90 SX=SX+X(I)
100 SC=SC+X(I)"Y(I)
no SD=SD+X(0*X(l)
120 SE=SE+Y(I)*Y(t)
125 NEXT I
130 A=(NASC)-(SX*SY)
140 B=SQR(ABS(((N*SD) -(SX^'^SX))*{ (N' SE) -(SY'^SY))))
150 R=A/B
160 PRINT "CORRELATION COEFFICIENT, r=";R
170 PRINT
180 INPUT "ANOTHER RUN (Y OR N)"jP$
190 PRINT
200 IF P$="Y" THEN 30
204 PRINT
210 END
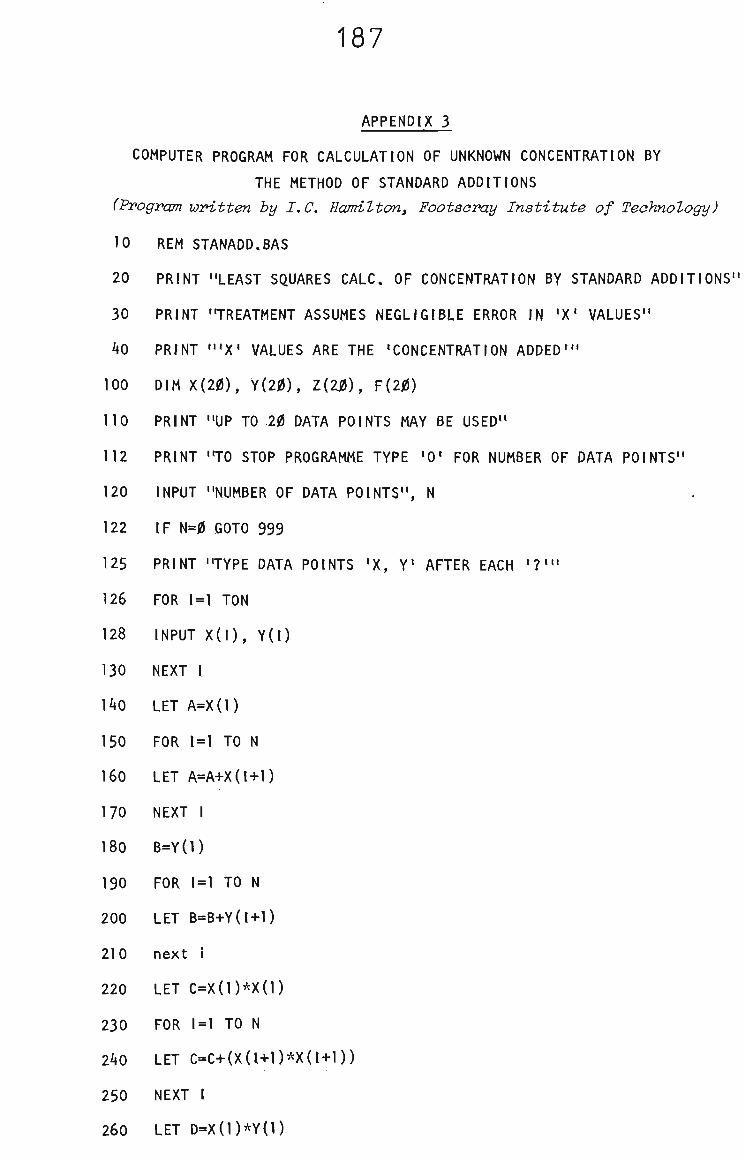
187
APPENDIX 3
COMPUTER PROGRAM FOR CALCULATION OF UNKNOWN CONCENTRATION BY
THE METHOD OF STANDARD ADDITIONS
(Program written by I.C. Hamilton, Footscray Institute of Technology)
10 REM STANADD.8AS
20 PRINT "LEAST SQUARES CALC OF CONCENTRATION BY STANDARD ADDITIONS"
30 PRINT "TREATMENT ASSUMES NEGLIGIBLE ERROR IN 'X' VALUES"
40 PRINT "'X' VALUES ARE THE 'CONCENTRATION ADDED'"
100 DIM X(20), Y(20), Z(20), F(20)
no PRINT "UP TO 20 DATA POINTS MAY BE USED"
112 PRINT "TO STOP PROGRAMME TYPE '0' FOR NUMBER OF DATA POINTS"
120 INPUT "NUMBER OF DATA POINTS", N
122 IF N=0 GOTO 999
125 PRINT "TYPE DATA POINTS 'X, Y' AFTER EACH '?'"
126 FOR 1=1 TON
128 INPUT X(l), Yd)
130 NEXT I
140 LET A=X(1)
150 FOR 1=1 TO N
160 LET A=A+X(I+1)
170 NEXT I
180 B=Y(1)
190 FOR 1=1 TO N
200 LET B=B+Y(I+1)
210 next i
220 LET C=X(1)*X(1)
230 FOR 1=1 TO N
240 LET C-C+(X(l+l)*X(I+1))
250 NEXT I
260 LET D=X(1)*Y(1)
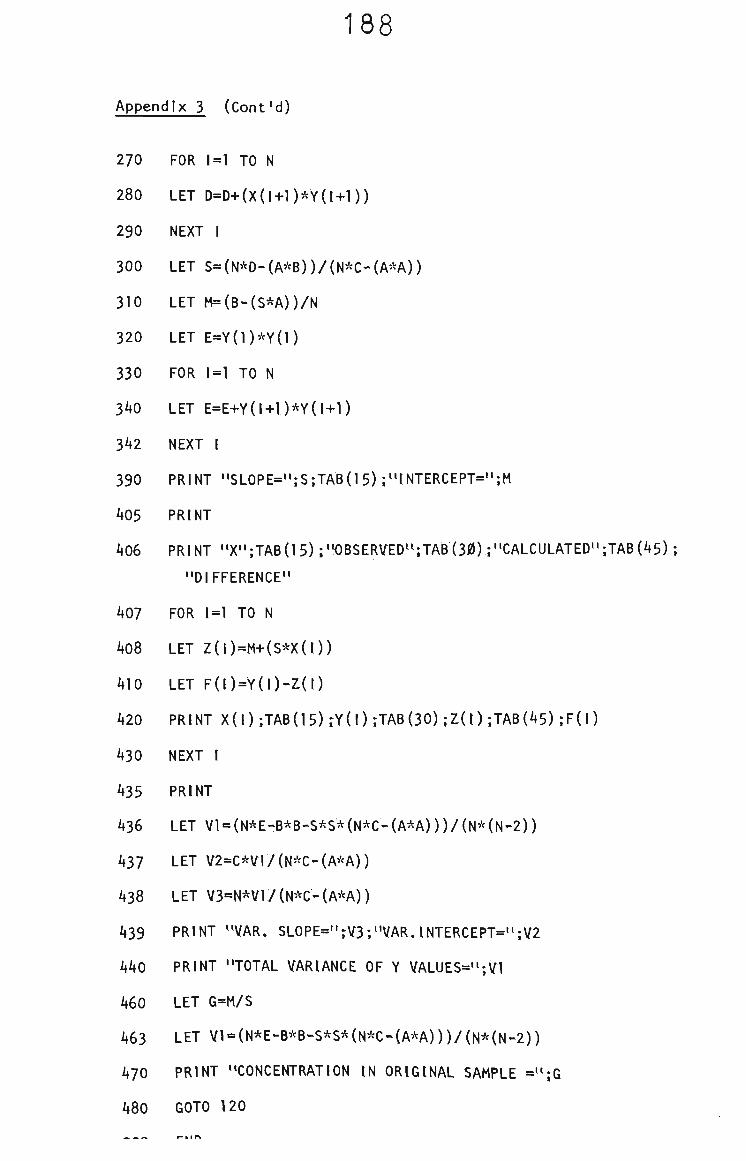
188
Appendix 3 (Cont'd)
270 FOR 1=1 TO N
280 LET D=D+(X(I+1)*Y(I+1))
290 NEXT I
300 LET S=(N*D-(A*B))/(N*C-(AAA))
310 LET M=(B-(S*A))/N
320 LET E=Y(1)*Y(1)
330 FOR 1=1 TO N
340 LET E=E+Y(I+1)*Y(I+1)
342 NEXT I
390 PRINT "SL0PE=";S;TAB(15);"tNTERCEPT=";M
405 PRINT
406 PRINT "X";TAB(15);"OBSERVED":TAB(30):"CALCULATED":TAB(45);
"DIFFERENCE"
407 FOR 1=1 TO N
408 LET Z(I)=M+(S*X(I))
410 LET F(I)=Y(I)-I(t)
420 PRINT X(l);TAB(15)rY(l)rTAB(30)iZ(t);TAB(45);F(l)
430 NEXT I
435 PRINT
436 LET Vl = (N*E-B*B-SASA(N*C-(A'^A)))/(N'^(N-2))
437 LET V2=C*Vl/(N*C-(A'^A))
438 LET V3=N*V1/(N*C-(A*A))
439 PRINT "VAR. SL0PE="rV3;"VAR.tNTERCEPT=";V2
440 PRINT "TOTAL VARIANCE OF Y VALUES=";V1
460 LET G=M/S
463 LET Vl=(N*E-B*B-S*S*(N*C-(A*A)))/(N*(N-2))
470 PRINT "CONCENTRATION IN ORIGINAL SAMPLE =";G
480 GOTO 120
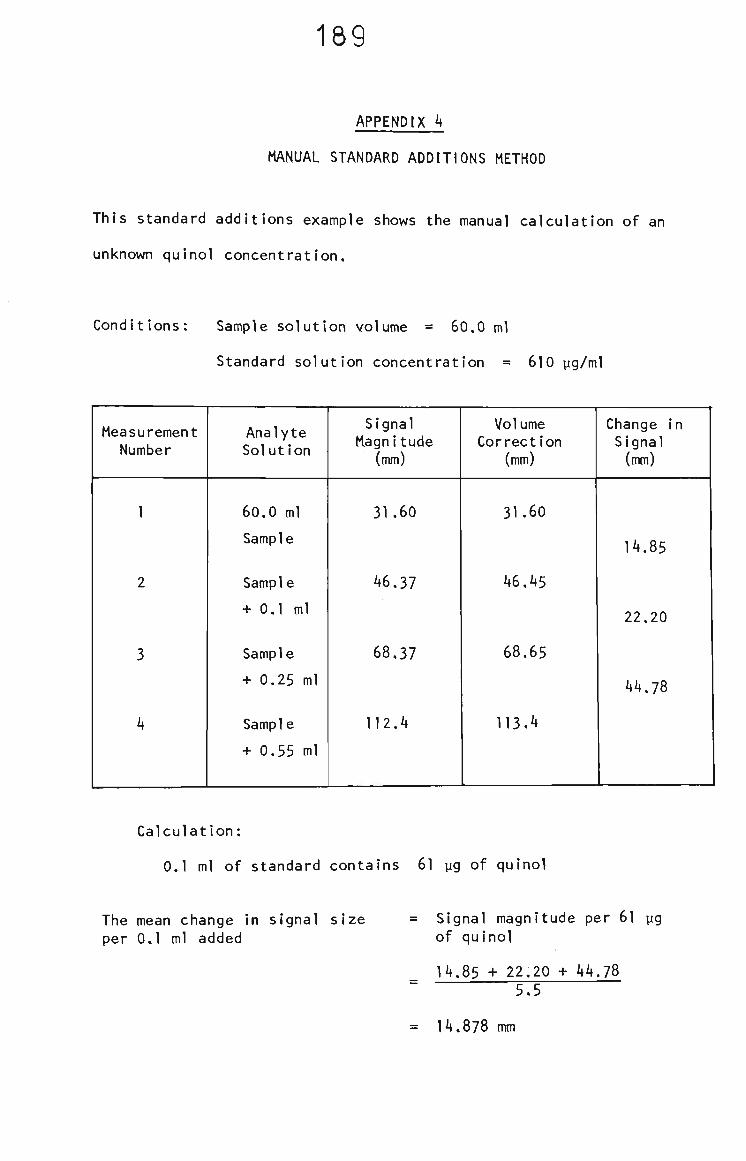
189
APPENDIX 4
MANUAL STANDARD ADDITIONS METHOD
This standard additions example shows the manual calculation of an
unknown quinol concentration.
Conditions: Sample solution volume = 60.0 ml
Standard solution concentration = 610 yg/ml
Measurement Number
1
2
3
4
Analyte Solution
60,0 ml
Sample
Sample
+ 0.1 ml
Sample
+ 0.25 ml
Sample
+ 0.55 ml
Signal Magnitude
(mm)
31.60
46,37
68,37
112,4
Volume Correction
(mm)
31.60
46,45
68,65
113.4
Change in Signal (mm)
14.85
22.20
44,78
Calculation:
0,1 ml of standard contains 61 yg of quinol
The mean change in signal size per 0.1 ml added
= Signal magnitude per 61 pg of quinol
14,85 + 2 2 , 2 0 + 4 4 . 7 8 5.5
= 14.878 mm
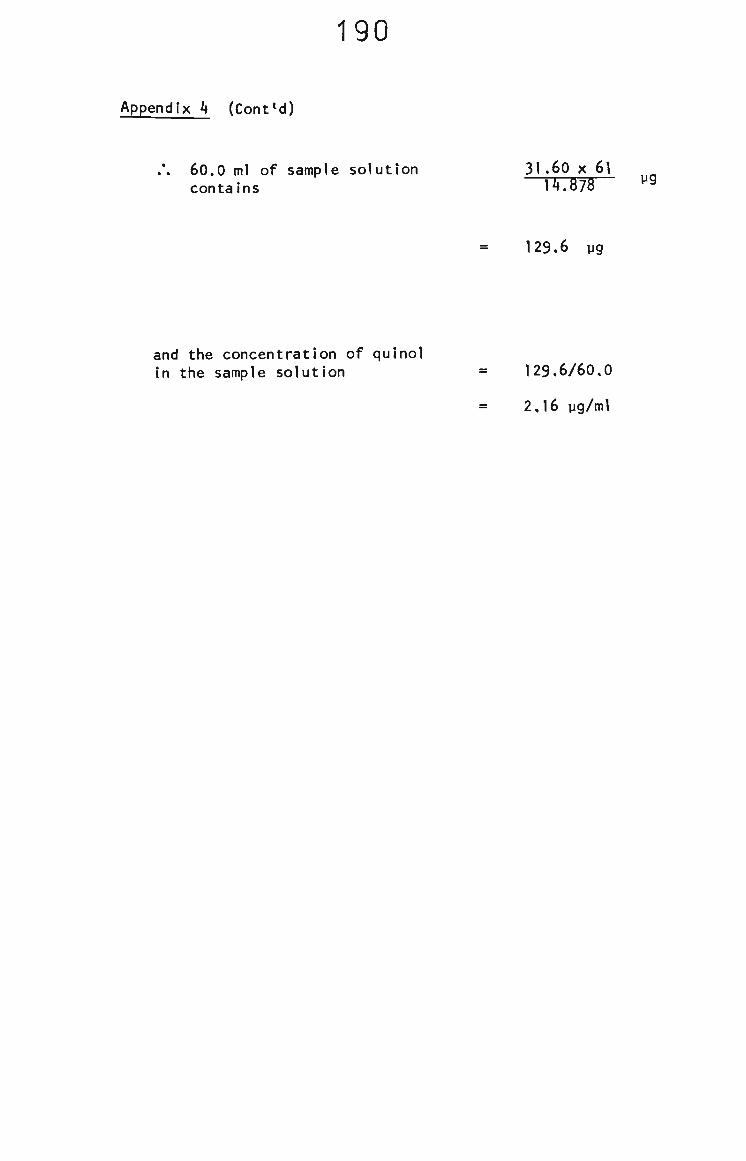
190
Appendix 4 (Cont'd)
.*. 60.0 ml of sample solution 31 .60 x 61 contains 14.878 ^^
129.6 yg
and the concentration of quinol in the sample solution = 129.6/60,0
2,16 yg/ml