1 ininspirehep.net/record/1194498/files/larg-99-005.pdf · 1. 1 in tro duction ... t con guration....
TRANSCRIPT
March 22, 1999
Description and Performances of the
Electrical Test Benches for Readout
Electrodes of the ATLAS EM Calorimeter
Fran�coise Astesan, Bernard Canton, Didier Lacour, Fran�cois RosselLPNHE-Paris Universit�es Paris 6 et 7 - IN2P3
Abstract
This note describes the di�erent benches proposed by the LPNHE-Parisgroup to test the electrical properties of ATLAS Liquid Argon calorime-ter electrodes. Two types of tests have been performed on electrode pre-prototypes since October 1997 to evaluate the benches performances. The�rst tests are done on at electrodes, and the latter ones on the same elec-trodes after bending. At the production step, at electrodes tests will bedone in the factories and bent electrodes tests in the laboratories. Examplesof results on benches performances (capacitances, resistances and leakagecurrent measurements) are presented in this note.
1

1 Introduction
Since August 1997, various pre-prototype1 electrodes of the Liquid Argonelectromagnetic calorimeter have been tested before and after bending. Thesetests have all been done in the laboratory. These pre-prototypes allowed totest the di�erent manufacturing steps and the tools used to control andqualify the product. During production, read-out electrodes quality controlis mandatory to :
� meet acceptance criteria at the production level in the factory, be-fore delivering electrodes. During the production, these tests on the at electrodes will be done in the factory.
� compare measurements before and after bending : This ensuresquality control of the product before assembling calorimeter modules.For example, potentially dangerous micro-�ssures could appear in re-sistive pads during bending, and can be detected because they modifyresistance values.
� keep track of the di�erent elements in the calorimeter. Inthis way, a data-base containing electrical test measurements of theelectrodes before and after bending will be built.
2 Description of the di�erent types of elec-
trodes
There are four types of electrodes depending on their position in the calorime-ter. Electrodes description can be found in [1]. Geometry and cell design aredi�erent for each type of electrode : therefore, speci�c con�guration benchesare used in each case. As an example, one type of electrode is presented on�gures 1 and 2.
2.1 Electrodes of the barrel calorimeter (electrodes A
and B)
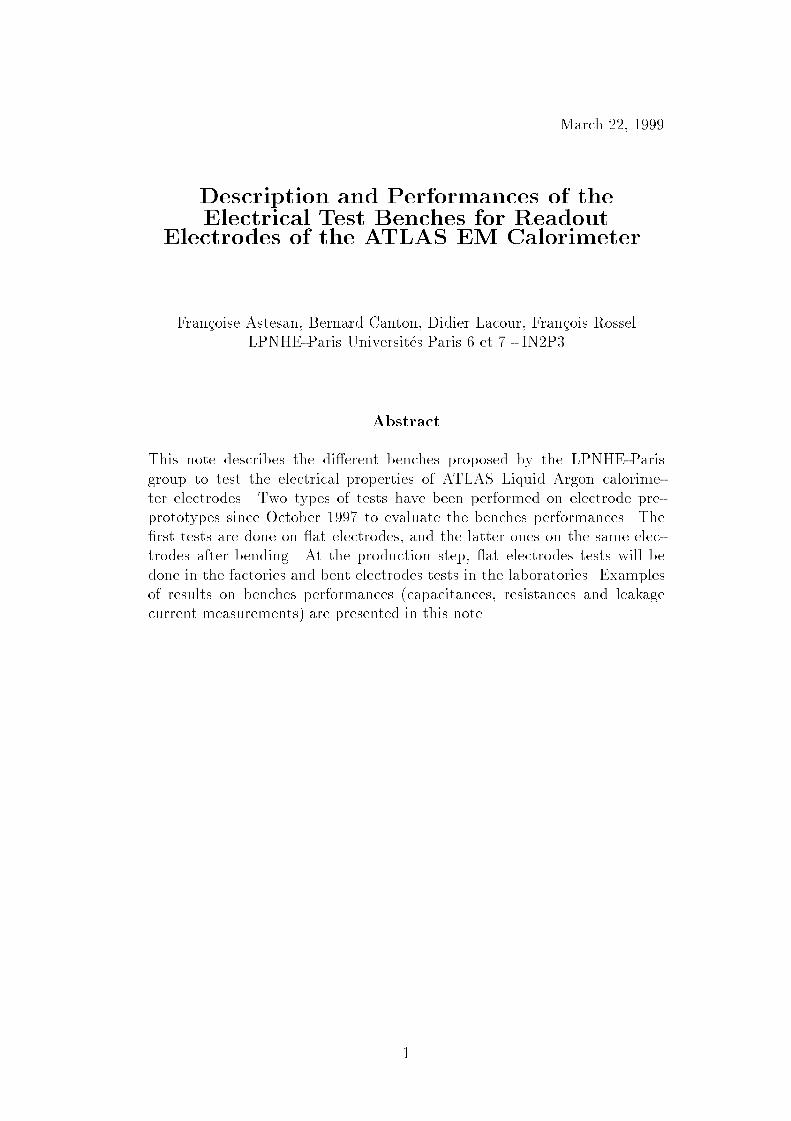
The type A electrode covers the � range [0-0.8] in the calorimeter. It includes303 signal cells (255 in sampling one, 32 in sampling two and 16 in samplingthree). Its dimensions are 1750 mm x 780 mm. It is shown on �gure 1 in atcon�guration, and on �gure 2 in bent con�guration.The second electrode (electrode B) covers the � range [0.8-1.45]. It includes231 signal cells (195 in sampling one, 25 in sampling two and 11 in samplingthree). Its dimensions are 1840 mm x 780 mm.
1The term "pre-prototype" is used for a product which is not intended to be used in the
calorimeter, but which allows to exercise di�erent steps at the production and to perform
electrical test benches.
2
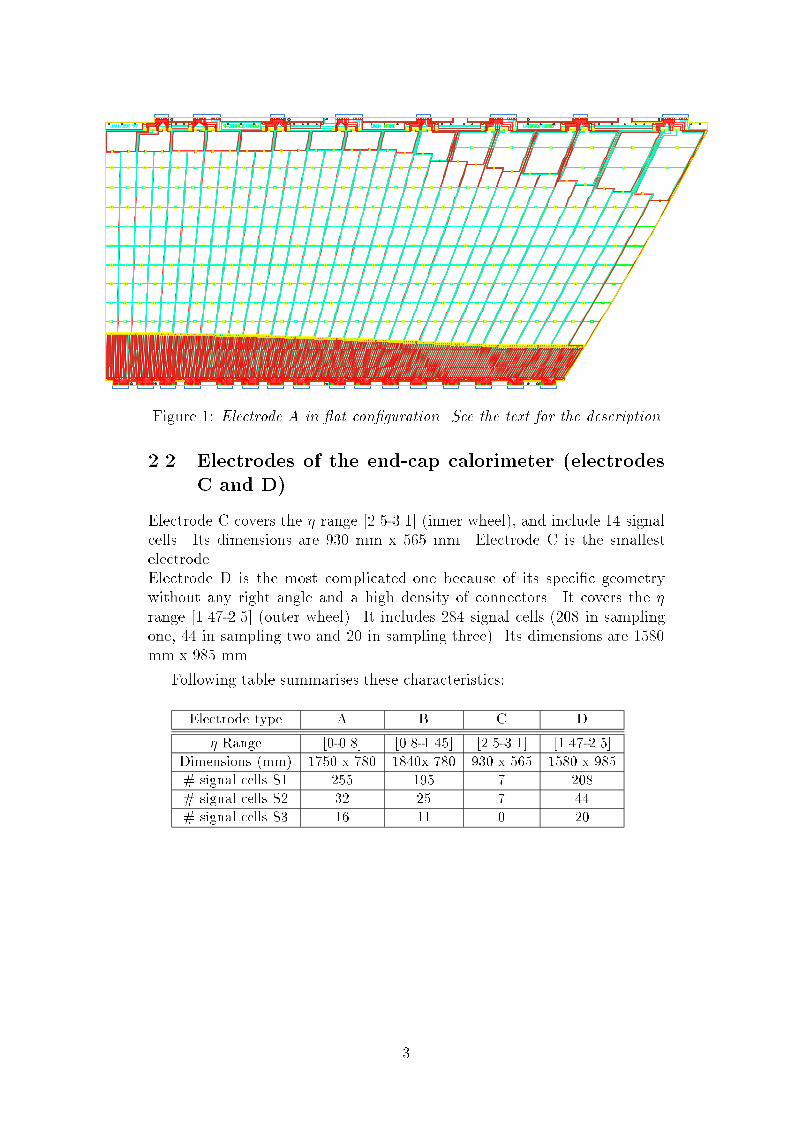
Figure 1: Electrode A in at con�guration. See the text for the description
2.2 Electrodes of the end-cap calorimeter (electrodes
C and D)
Electrode C covers the � range [2.5-3.1] (inner wheel), and include 14 signalcells. Its dimensions are 930 mm x 565 mm. Electrode C is the smallestelectrode.Electrode D is the most complicated one because of its speci�c geometrywithout any right angle and a high density of connectors. It covers the �
range [1.47-2.5] (outer wheel). It includes 284 signal cells (208 in samplingone, 44 in sampling two and 20 in sampling three). Its dimensions are 1580mm x 985 mm.
Following table summarises these characteristics:
Electrode type A B C D
� Range [0-0.8] [0.8-1.45] [2.5-3.1] [1.47-2.5]
Dimensions (mm) 1750 x 780 1840x 780 930 x 565 1580 x 985
# signal cells S1 255 195 7 208
# signal cells S2 32 25 7 44
# signal cells S3 16 11 0 20
3

Figure 2: Electrode A in bent con�guration. Di�erent elements are shown on
this picture : Output connector, reference hole, HV distribution, grounding
spring, spacer
4

3 Electrical test benches
These tests are required to know electrode quality before delivery (for atelectrodes), and before calorimeter module assembling (for bent electrodes).Results of these two tests allow to compare measurements before and afterbending, and to detect possible fabrication and handling damages. Thesetwo tests are presented in the following sections along with measurements on at electrodes showing benches performances.
3.1 General description
The principle of measurements is the same for at and bent electrodes. Twotypes of measurements are done : the low voltage test for resistances andcapacitances measurement, the high voltage test for the leakage current mea-surement.
All data are stored in a database to be analyzed in detail for the pre-production. For electrodes of the standard production, an on-line analyzergives a diagnostic for each electrode, and allows to reject or if possible torepair the faulty ones.
The following list presents di�erent benches available in di�erent testcon�gurations2 :
� 1. Flat electrode A (laboratory) : full test to validate fabrication pro-cess on prototype electrodes.
� 2. Flat electrode D (laboratory) : full test to validate fabrication pro-cess on prototype electrodes.
� 3. Bent electrode A (laboratory) : full test to validate fabricationprocess and quality of each electrode before assembling.
� 4. Bent electrode C and D (laboratory) : full test to validate fabricationprocess and the quality of each electrode before assembling.
� 5. Flat electrodes A/B (industry) : fast test to validate the productbefore leaving the industry.
� 6. Flat electrodes C/D (industry) : fast test to validate the productbefore leaving the industry.
2The High Voltage part of A/B and C/D tests in industry is done by INFN Milano
laboratory. Bent electrodes B tests are also done by INFN Milano laboratory [2]
5

Figure 3 shows the benches for at electrodes in the �nal con�guration(benches # 5 and # 6). The top level of the bench is the A/B electrode partand the bottom level is the C/D electrodes part. Bench # 4 (bent electrodeC) is presented on �gure 6.
Figure 3: Bench used in the companies to test the at electrodes : Top level of
the bench is the A/B electrode part and the bottom level is the C/D electrode
part.
3.2 Low voltage test : resistance and capacitance
3.2.1 Requirements
� Measurements of capacitances between signal layer and HV layer allowto detect any interruption in the inner Cu layer of the cell, in the signalfan-out and in the crimped connectors.
� Resistances measurements allow to check electrical continuity. Thesemeasurement are compared to the nominal resistivity value which is 1M per square. The acceptable range of the resistance is 100 K tofew M [3] [5].
3.2.2 Measurements
Measurements are done with probes contacting with the di�erent electrodecells. Probe extremities have an optimized shape at or convex to follow theelectrode shape and to get an optimal contact between probes and electrode.The applied force on the probes is about 10 Newtons. A schematic view of
6

these probes is presented on �gure 4. Mechanical alignment of these probesis a crucial point of the benches mechanical structure. This alignment isobtained after �ne tuning.The level one multiplexing is done directly on the mechanical support for32 channels (see �gure 7). A second multiplexer connects electronic wheremeasurements are done.
cables
flat probe
convex probe
mechanical support
bent electrode
Figure 4: Schematic view of the test probes used for RC measurement : on
this �gure a part of a bent electrode is tested. Two probes are shown with
cables, mechanical supports, at and convex probes
Figure 5 shows details of a bench for bent electrodes : test probes andmechanical supports can be seen on this picture. The high density of probesin sampling one makes the alignment tuning rather delicate.
Resistances are measured with an electro-meter, and capacitances aremeasured with a RLC bridge (see �gure 7). In a �rst step, resistanceswere measured with a RLC bridge for resistances value around 100 KOhms(UVGEM prototype used in RD3 tests). With present values between 200KOhms to 10 MOhms, the RLC bridge is not adequate due to its frequencymeasurement giving an impedance of the same order as the measured resis-tance. Therefore, we use the electro-meter with continuous measurement.
The silk screen resistances are located on the external faces of the elec-trodes. The measurements are done by selecting two probes with the multi-
7

plexer. A map of all resistance electronic addresses which have to be mea-sured is recorded in the computer. With this map, only one run with aLabview program is needed to test automatically all the resistances one byone.Following measurements are perfomed:
� C1 : Sampling 1 cell capacitance between HV layer and signal layer.
� C2 : Sampling 2 cell capacitance between HV layer and signal layer.
� C3 : Sampling 3 cell capacitance between HV layer and signal layer.
� R1 : Individual resistances connecting sampling 1 to sampling 2.
� R2 : Resistances in series from the front of the sampling 2 to the HTconnection.
� R3 : Resistances in series from the front of the sampling 3 to the HTconnection.
� R4 : Resistances in series from the front of the sampling 2 to the backof the sampling 2.
� R5 : Individual resistances in the sampling 3 (in parallel with otherresistances).
� R6 : Individual resistances connecting sampling 2 to sampling 3 (inparallel with other resistances).
� R7 : Isolation between contiguous cells (e.g. due to bad etching) onthe various layers
� R8 (bent electrode only) : Individual resistances in sampling 2
8
Figure 5: Details of one bench for the bent electrodes : Test probes and
mechanical supports can be seen on this picture
Figure 6: Bench for the bent electrodes C : Mechanical support keep the tested
electrode in shape
9

Capacitance measurements are done between the external and internallayer. For each capacitance, one probe and one output connector are used.As for resistances, a map of all capacitances to be measured is recorded, andall measurements of one electrode are done in the same run.
An electrode identi�er is read automatically using an optical pen, andstored in the data-base. This identi�er contains information such as thecompany, date of production, type of electrodes, batch number etc... Thisallows to keep track of each electrode tested.
A very detailed automatic test of prototype and pre-series electrodes iscomposed of 1500 measurements on A and D at or bent electrodes. Durationof this test is 30 minutes per electrode.In production con�guration, the test achieved in factories consist of 1000measurements for A/B and C/D at electrodes. The duration is 20 minutesper test.
Multiplexing 1°
Multiplexing 1°
Multiplexing 1°
Multiplexing 1°
Electrode
Multiplexing 2°
Coaxial cables (4 m)32 c
Cf
Rf
CR filtering
C or R Measurement
Coaxial cables (4m)
RLC brigde or
Electrometer
PC
Analyse
Probes
Figure 7: Capacitance and resistance measurement - The RC �lter was used
only for UVGEM prototypes
10
3.2.3 Capacitance measurement results
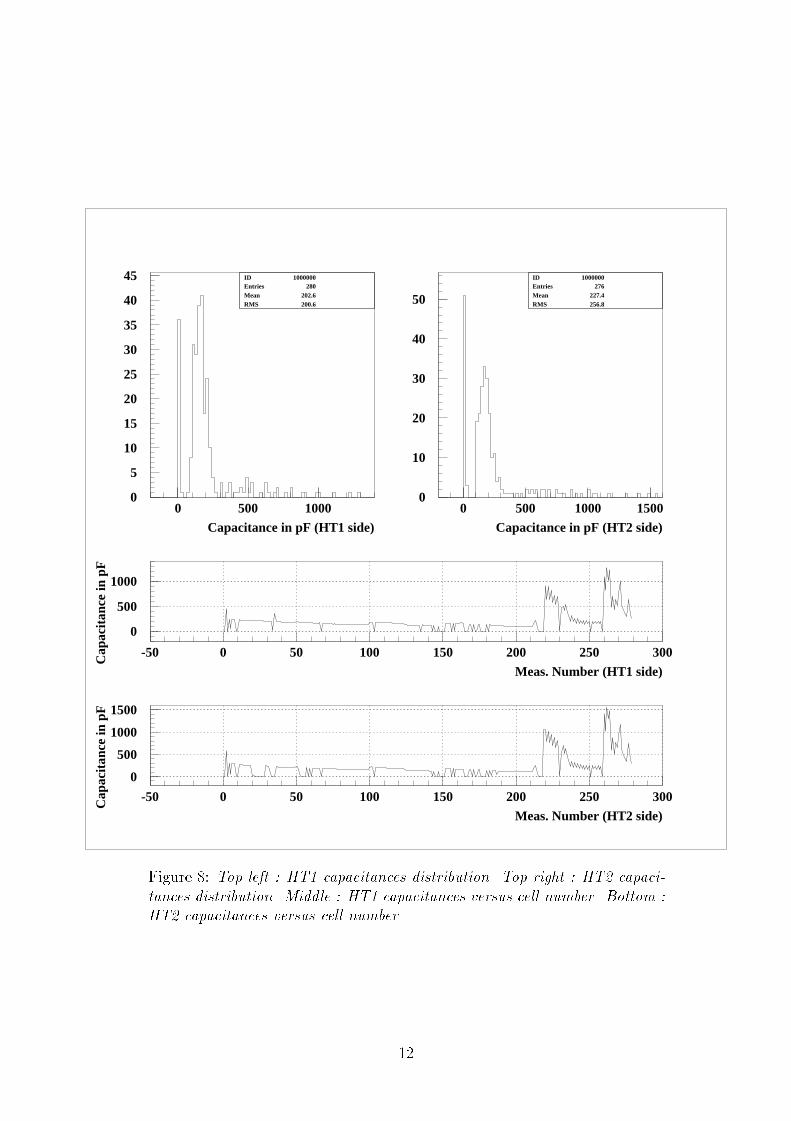
As an example, in �gure 8, we show the capacitances measured for one elec-trode of D type.
Mean values obtained are di�erent for each side : 203 pF for the HV1 sideand 227 pF for HV2 side. This feature is due to the di�erence of thicknessof the \dielectric" making up the capacitor on each side : while HV1 sidegoes over 25 �m of glue (plus 50 �m Kapton and other 15 �m glue), theHV2 has the capacitance over the glue within the double sided Cu-polyimidelaminate, 15 �m of glue.
The correlation between capacitances values measured on the HV1 andthe HV2 sides has been studied systematically. We obtain a mean value forthe ratio equal to 0.86 (obtained with a gaussian �t). From the thicknessesmentioned above we expect 0.89.
A few channels have a capacitance value equal to 0 pF. This is due toa broken connection. Capacitance distributions versus cell number of bothsides are shown on the bottom of �gure 8. The pattern of these distributionscomes from the cell surface variations. Broken connections are well seen andcan be associated with the faulty cell number. More results can be found in[4]
3.2.4 Resistance measurement results
Figure 9 shows the resistances distributions of one at electrode D measuredon both HV1 and HV2 faces. In the distributions versus cell numbers we seedi�erent values due to di�erent patterns on the various sections.
We see that the mean value of resistance is di�erent between the two facesHV1 and HV2. This is reproduced in all electrodes of both �rms. We suspectthis feature could be due to the fact that the serigraphic process starts onone face and thus we obtain an asymmetric number of drying steps betweenthe two faces. This problem is under investigation.
11
0
5
10
15
20
25
30
35
40
45
0 500 1000
IDEntriesMeanRMS
1000000 280
202.6 200.6
Capacitance in pF (HT1 side)
0
10
20
30
40
50
0 500 1000 1500
IDEntriesMeanRMS
1000000 276
227.4 256.8
Capacitance in pF (HT2 side)
0
500
1000
-50 0 50 100 150 200 250 300
Meas. Number (HT1 side)
Cap
acita
nce
in p
F
0
500
1000
1500
-50 0 50 100 150 200 250 300
Meas. Number (HT2 side)
Cap
acita
nce
in p
F
Figure 8: Top left : HT1 capacitances distribution. Top right : HT2 capaci-
tances distribution. Middle : HT1 capacitances versus cell number. Bottom :
HT2 capacitances versus cell number.
12

0
10
20
30
40
50
0 50 100 150 200
IDEntriesMeanRMS
1000000 657
52.83 37.86
Resistance in KOhms (HT1 side)
0
10
20
30
40
50
60
70
0 100 200 300
IDEntriesMeanRMS
1000000 630
84.90 57.99
Resistance in KOhms (HT2 side)
0
50
100
150
200
200 300 400 500 600 700 800 900 1000
Meas. Number (HT1 side)Res
ista
nce
in K
Ohm
s
0
100
200
300
200 300 400 500 600 700 800 900 1000
Meas. Number (HT2 side)Res
ista
nce
in K
Ohm
s
Figure 9: Top left : HT1 resistances distribution. Top right : HT2 resistancesdistribution. Middle : HT1 resistances versus cell number. Bottom : HT2
resistances versus cell number.
13
3.3 Leakage currents
3.3.1 Requirements
The H.V behavior is tested to detect any failure in the H.V insulation pro-vided by the dielectric which could degrade a fraction of the sensitive volumeof the calorimeter. The leakage current could contribute to the electronicnoise of the front-end electronic. Its value has to be limited.
3.3.2 Measurements
Using a High Voltage power supply CAEN system, 2000 Volts is applied be-tween the two HV layers and the signal layer, the cells of which are clampedto ground. The H.V. ramp-up is about 10 Volts/second. All tests are donein a room with controlled relative humidity below 40 % to reduce the risk ofsurface current leaking and sparking.The current value is measured using the current monitor of the HV system.The resolution is about 10 nA. The asymptotical decrease of the current ispresented on �gure 10. About 3000 measurements are recorded during onehour. The mean value of the 100 last measurements gives the leakage currentvalue (see bottom of �gure 10). In this example, the leakage current is equalto 14.9 nA.Figure 11 shows the current value evolution as a function of time when suc-cesively 1900, 1950 and 2000 Volts high voltage is applied for both sides.The top curve shows the evolution on HT1 side, the bottom curve shows theevolution on HT2 side. In this case, no ashes e�ect are recorded, and thehigh voltage behavior is correct.
14

0
20
40
60
80
100
120
140
160
180
200
500 750 1000 1250 1500 1750 2000 2250 2500 2750 3000
Time
curr
ent
14
14.5
15
15.5
16
16.5
17
2700 2750 2800 2850 2900 2950 3000
180.4 / 299P1 14.96 .5774E-01
Time
Cur
rent
Figure 10: Top : decrease of the current. Bottom : leakage current measure-
ment using the 100 last points of the previous distribution - A linear �t gives
the leakage current value.
15

0
1
2
3
4
5
6
7
0 500 1000 1500 2000 2500 3000
Time
Cur
rent
(m
icro
Am
pere
)
0
1
2
3
4
5
6
7
0 500 1000 1500 2000 2500 3000
Time
Cur
rent
(m
icro
Am
pere
)
Figure 11: Current versus Time for both side of one electrode when 1900,
1950 and 2000 volts are applied. The top curve shows the evolution on HT1
side, the bottom curve shows the evolution on HT2 side.
16

4 Conclusion
The set of tests presented in this note shows that the station is operativeand adequate to qualify electrodes. The di�erent types of benches allow avery detailled control and check of the electrodes to assure a good qualityof the product for the liquid argon calorimeter and a good knowledge of itscharacteristics.
References
[1] ATLAS collaboration : Liquid Argon Calorimeter : Technical De-
sign Report
[2] W. Bonivento, G. Costa, M. Mazzanti : The electrode test setup
developed in Milano : experience with RD3 and ATLAS pro-
totype
[3] W. Bonivento, G. Costa, M. Mazzanti : Impact of resistor quality
of the readout electrodes on e.m. calorimeter performance
[4] L. Herv�as et al : Summary of measurement on preseries elec-
trodes for the ATLAS EM Calorimeter
[5] W. Bonivento, D. Lacour : Acceptable Values of Resistances on
Electrodes of the ATLAS EM Calorimeter (note in preparation)
Acknowledgments
We would like to express our gratitude to P. Schwemling for his continuoushelp on this work and especially on the redactions of this note.We wish to thank all the people of the LPNHE working on this projectfor their contributions to conception, design and construction of the testbenches.Finally, we would like to thank the members of the \kapton" group whoshared their experiences with us.
17