1 1 industrial process sector hands on training workshop of the cge on nggi for nai parties to the...
TRANSCRIPT

1 1
INDUSTRIAL PROCESS SECTOR Hands on Training Workshop of the CGE on NGGI for NAI Parties to the UNFCCC,
Africa RegionPretoria, South Africa18-22 September 2006
GHANA CASE STUDY

2 2
OUTLINE- GHANA CASE STUDY
RE96GL APPROACH AND STEPS Country sources and subsource categories
identified Summary of Process Descriptions of source
categories and estimated missions Methodological Choices
Collection of AD IPCC Default and CS-EF
GPG 2000 approaches for selected source categories

3 3
OUTLINE-GHANA CASE STUDY
SECTION B Potential problems with the use of
Re96GL, effects, and suggested approaches regarding: AD and CBI Data Sources Lack of AD and EFs Institutional Arrangements

4 4
OUTLINE- GHANA CASE STUDY
SECTION C ESTIMATION AND
REPORTING -Using country source worksheets and other countries reported data to complete the electronic software
5 5
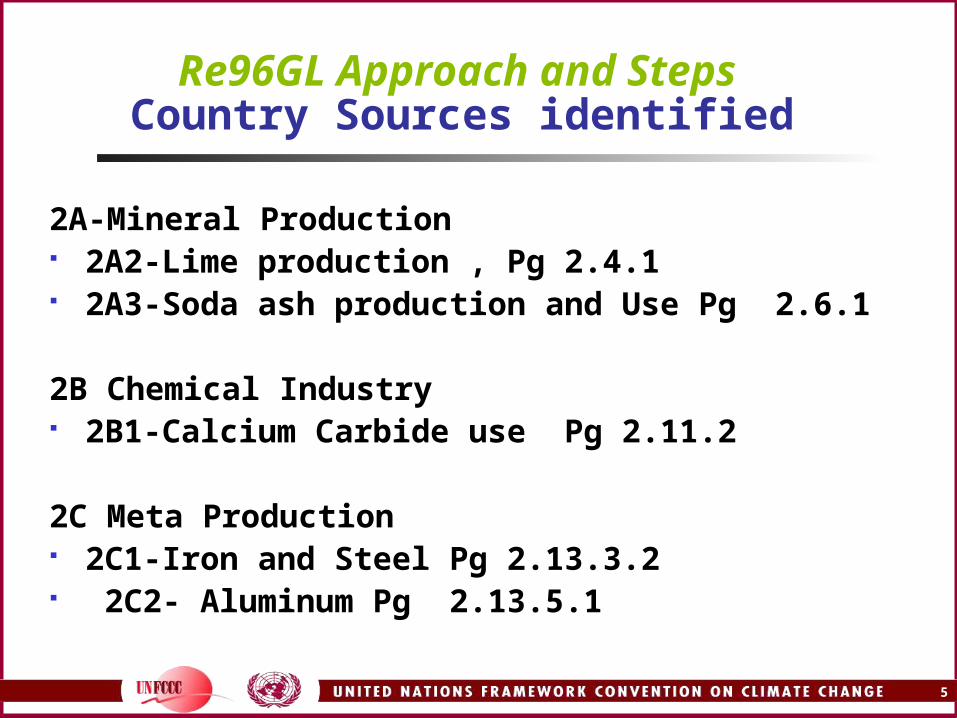
Re96GL Approach and Steps Country Sources identified
2A-Mineral Production 2A2-Lime production , Pg 2.4.1 2A3-Soda ash production and Use Pg 2.6.1
2B Chemical Industry 2B1-Calcium Carbide use Pg 2.11.2
2C Meta Production 2C1-Iron and Steel Pg 2.13.3.2 2C2- Aluminum Pg 2.13.5.1

6 6
Re96GL Approach and StepsChoice of Activity Data
Plant level measurements or direct emissions reports with documented methodologies
Where direct measurements are not available, estimations are based on calculation with plant-specific data
7 7
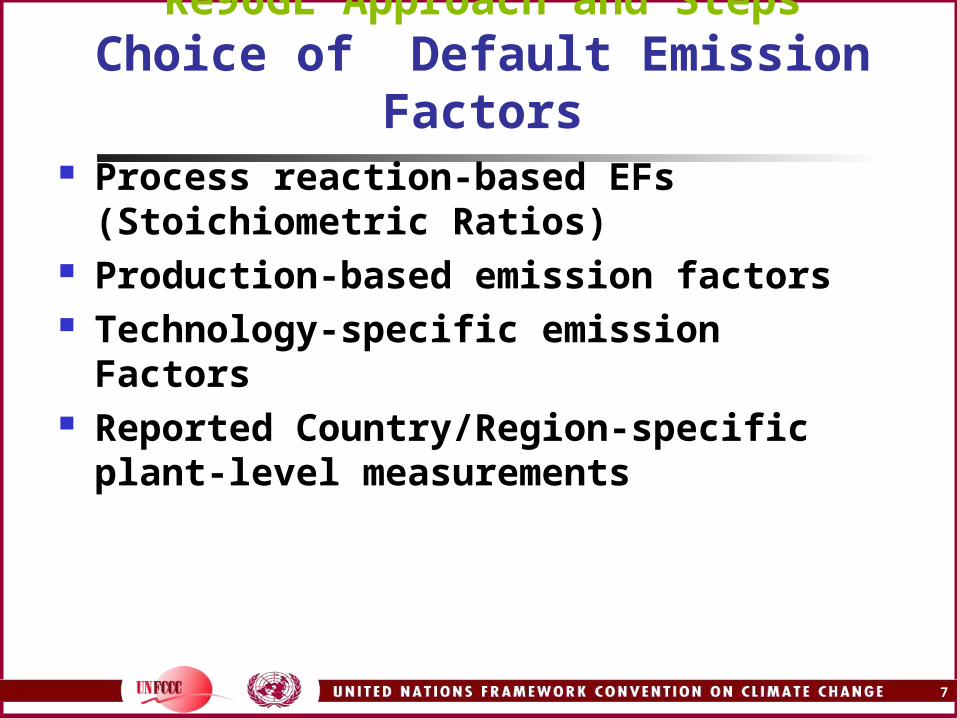
Re96GL Approach and StepsChoice of Default Emission Factors
Process reaction-based EFs (Stoichiometric Ratios)
Production-based emission factors Technology-specific emission
Factors Reported Country/Region-specific plant-level
measurements

8 8
Re96GL Approach and StepsSample Tiers by Sub-source Categories
2C5-Calcium Carbide Use in Steel Melting plants CO2) T1a -Consumption of Carbide in acetylene
production (tonne carbide) and EF (tone CO2/tonne carbide (Default)

9 9
Re96GL Approach and StepsTiers by Sub-source Categories
2C-Metal production (Iron and Steel) Tier 1a-consumption of reducing agent
(tonne) and EF (tonne C/tonne reducing agent)
Tier 1b-production of the metal (tonnes) and EF (tonne CO2/tonne metal)
10 10
Key source analysis and prioritization
Demonstrate Key source Analysis by Level using the Ghana Inventory Results
11 11
Country-Specific Methodology and
good practice plant-level EF and AD
The case of Aluminum production inventory in Ghana
12 12
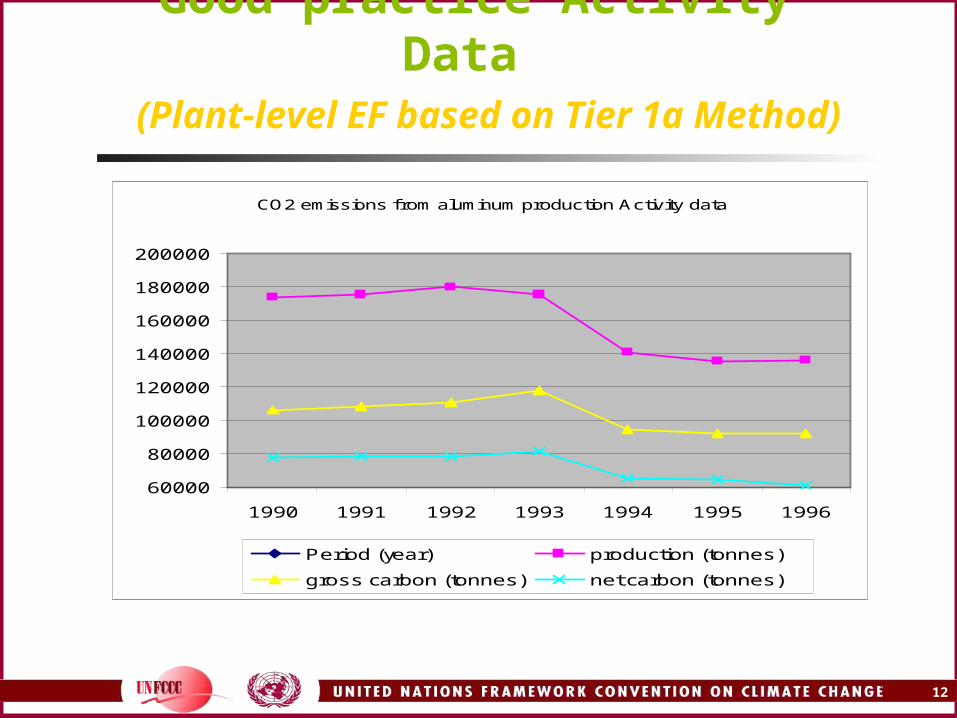
Good practice Activity Data (Plant-level EF based on Tier 1a Method)
CO2 emissions from aluminum production Activity data
60000
80000
100000
120000
140000
160000
180000
200000
1990 1991 1992 1993 1994 1995 1996
Period (year) production (tonnes)
gross carbon (tonnes) net carbon (tonnes)
13 13
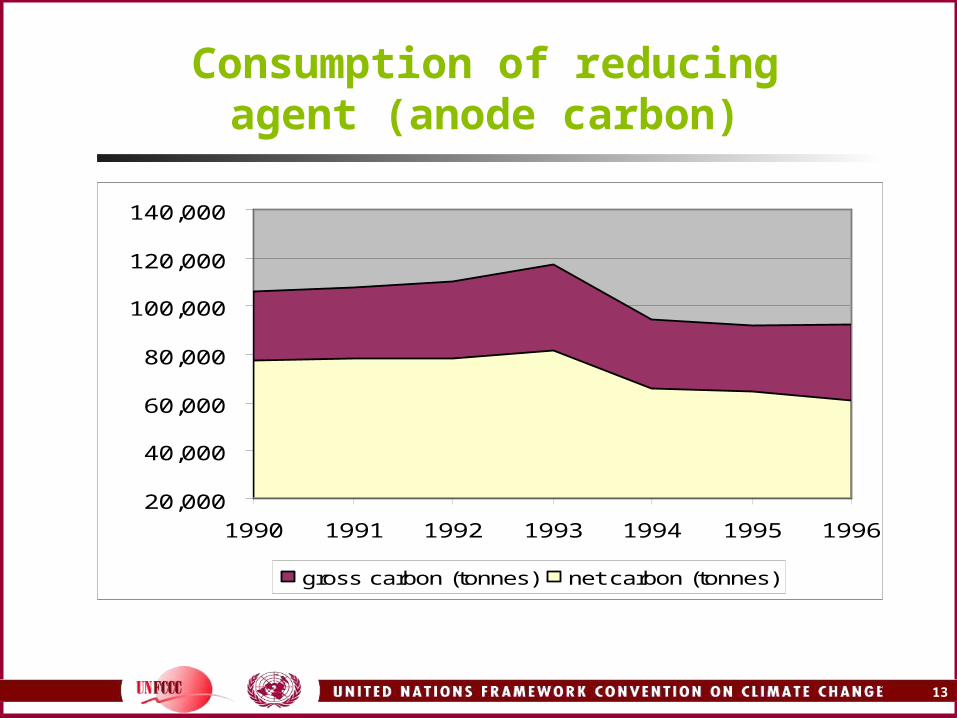
Consumption of reducing agent (anode carbon)
20,000
40,000
60,000
80,000
100,000
120,000
140,000
1990 1991 1992 1993 1994 1995 1996
gross carbon (tonnes) net carbon (tonnes)

14 14
Net carbon consumption
0.050
0.100
0.150
0.200
0.250
0.300
0.350
0.400
0.450
0.500
1990 1991 1992 1993 1994 1995 1996
production (megatonnes)
net carbon tonne/tonne al
3 per. Mov. Avg. (net carbon tonne/tonne al)

15 15
Comparability of good practice plant level and IPCC Default
Process Parameter
Country Specific (Plant level Tier 2) 7-year average
IPCC Default including baking emissions (5%)
Net Carbon consumption assuming 98% purity of anode carbon tonne C/tonne
0.445
Emission factor (tonne CO2/tonne Al.)
1.63
1.58
% Difference +3.5%

16 16
Emissions Estimation and Reporting
Use of IPCC Electronic Inventory Software
Hand-on using the various country data for different source categories

17 17
REPORTING TABLES
Long Summary and Short summary
(Reference : IPCC Inventory Software)

18 18
Emissions Estimation and Reporting-
Selected country reviews
Discussion of the identified problems with reporting and methodological choices of selected countries
identified in the IP sector of the INC
19 19
Lack of Activity Data and Emissions Factors encountered
in the use of Re96GL
GPG 2000 Tier1 good practice Options
Notes: Annex 2 - Table 2 gives the methodological choices and GHG estimation for Tier 1 methods based on national circumstances where EFs and certain types of ADs are not
available.)
20 20
GPG 2000 DECISION TREE APPROACH TO ESTIMATIONS
SAMPLE ILLUSTRATIONS
2.A.1Cement Production 2.C1 Iron and Steel 2.C.2 Aluminum productionHandbook Annex 3 Table 3 presents detailed
estimations of Emission factors of the source categories above based on the various GPG 2000 Tier level methods

21 21
UNCERTAINTY ESTIMATION
GPG 2000 OPTIONS Table 3.2 of GPG2000 illustrates the use of default factors in estimating uncertainties based on the various Tier level methods