1 a decision analysis model for supplier selection using fuzzy-ahp ims 2005, kunming, china july...
TRANSCRIPT
1
A Decision Analysis Model for Supplier Selection Using Fuzzy-AHP
IMS 2005, Kunming, ChinaJuly 1-10, 2005
Prof. Heung Suk Hwang,
Department of Business Management , Kainan University, Taiwan
Tel : +886-3-341-2500 ext. 6088 e-mail : [email protected]
Kainan University
2
Contents 1. Introduction
2. Conventional Suppliers Performance
Evaluation and Third Party Logistic
3. A Decision Analysis Model for Supplier Selection 3.1 Fuzzy-Fuzzy AHP Method
3.2 Evaluation for Supplier Selection (Example) 4. Summary and Conclusions
Kainan University
3
1. Introduction
☞ develop a supplier’s performance evaluation model for a thir 3rd party logistics (TPL) in supply chain management (SCM).
☞we use the solution methodology of analytic hierarchy process
(AHP, Fuzzy-AHP)
☞ Developed three-step decision analysis model which converts
the qualitative factors of suppliers into the quantitative
measures, reliability.
☞ Developed the computer program and successful
applications are shown in the field of supplier’s selection
problem.Dong-eui University, Korea
4
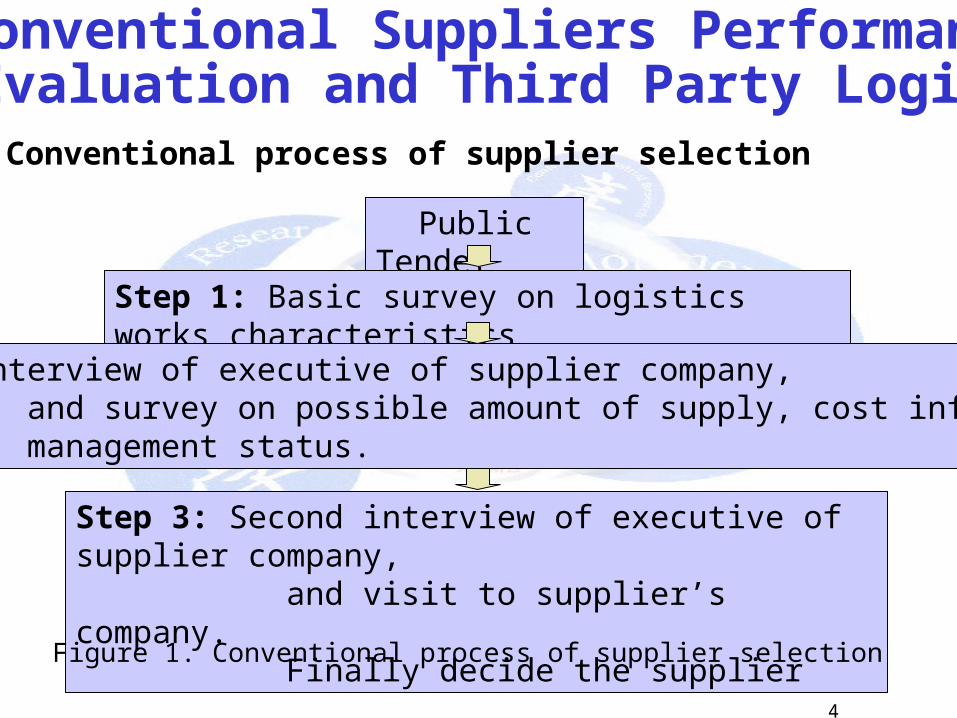
2. Conventional Suppliers Performance Evaluation and Third Party Logistic
Public Tender
Step 1: Basic survey on logistics works characteristics
Step 2: Interview of executive of supplier company, and survey on possible amount of supply, cost information, management status.
Step 3: Second interview of executive of supplier company, and visit to supplier’s company. Finally decide the supplier
Figure 1. Conventional process of supplier selection
☞ Conventional process of supplier selection
5
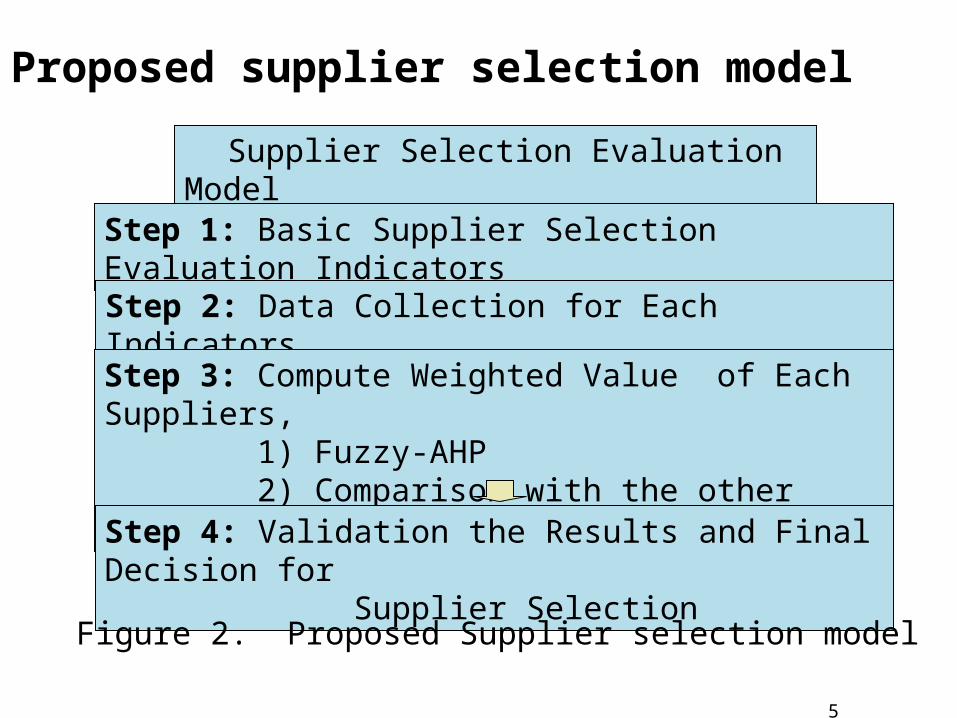
Supplier Selection Evaluation Model
Step 1: Basic Supplier Selection Evaluation Indicators
Step 2: Data Collection for Each Indicators
Step 3: Compute Weighted Value of Each Suppliers, 1) Fuzzy-AHP 2) Comparison with the other methods
Step 4: Validation the Results and Final Decision for Supplier Selection
☞ Proposed supplier selection model
Figure 2. Proposed Supplier selection model
6
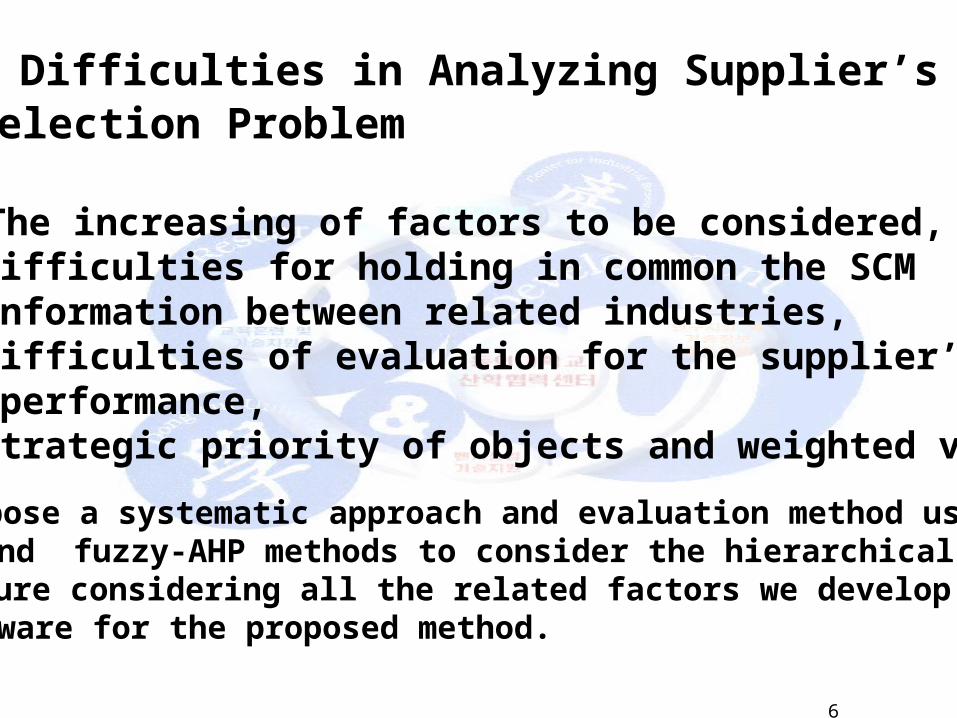
☞ The Difficulties in Analyzing Supplier’s Selection Problem
- The increasing of factors to be considered, - Difficulties for holding in common the SCM information between related industries, - Difficulties of evaluation for the supplier’s performance, - Strategic priority of objects and weighted values.
○ we propose a systematic approach and evaluation method using AHP and fuzzy-AHP methods to consider the hierarchical decision○ Structure considering all the related factors we develop computer software for the proposed method.
7Dong-eui University, Korea
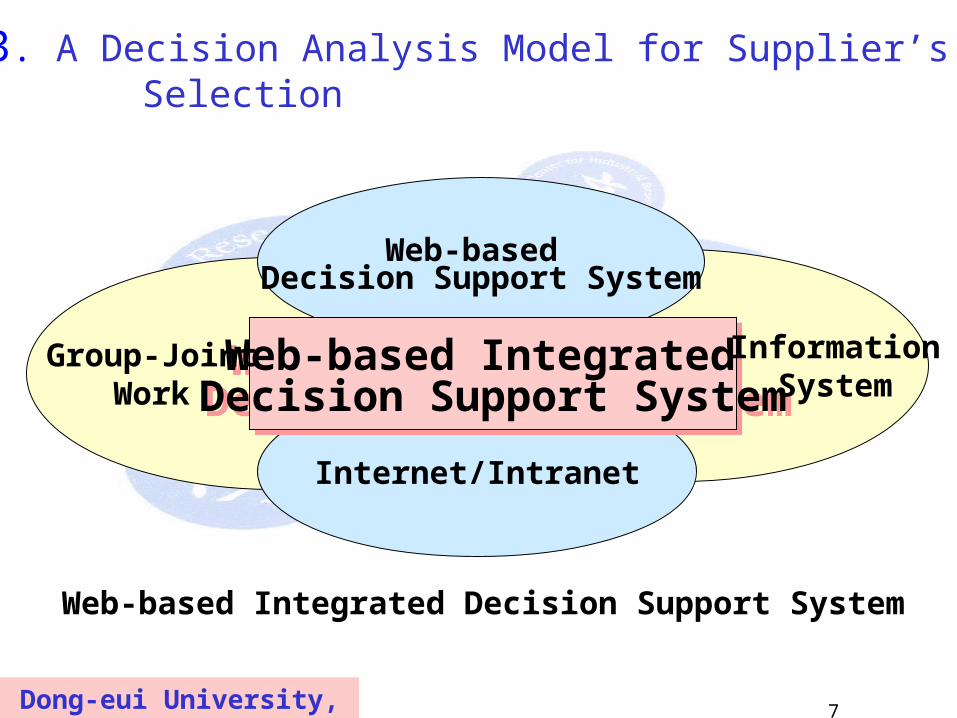
Web-based Decision Support System
Internet/Intranet
Web-based Integrated Decision Support SystemWeb-based Integrated
Decision Support SystemInformation
SystemGroup-Joint
Work
Web-based Integrated Decision Support System
3. A Decision Analysis Model for Supplier’s Selection
8
Fig 3. Web-based Integrated Decision Model
? 프로그램개발? 사용자위주의프로그램개발
- Web 기반의Netork
System확장성활용성- 개별
- 종합우선순위산출
단계1 : Stochastic Set-? 적정보급센터의소요보급센터의위치결정적정보급지원수준결정
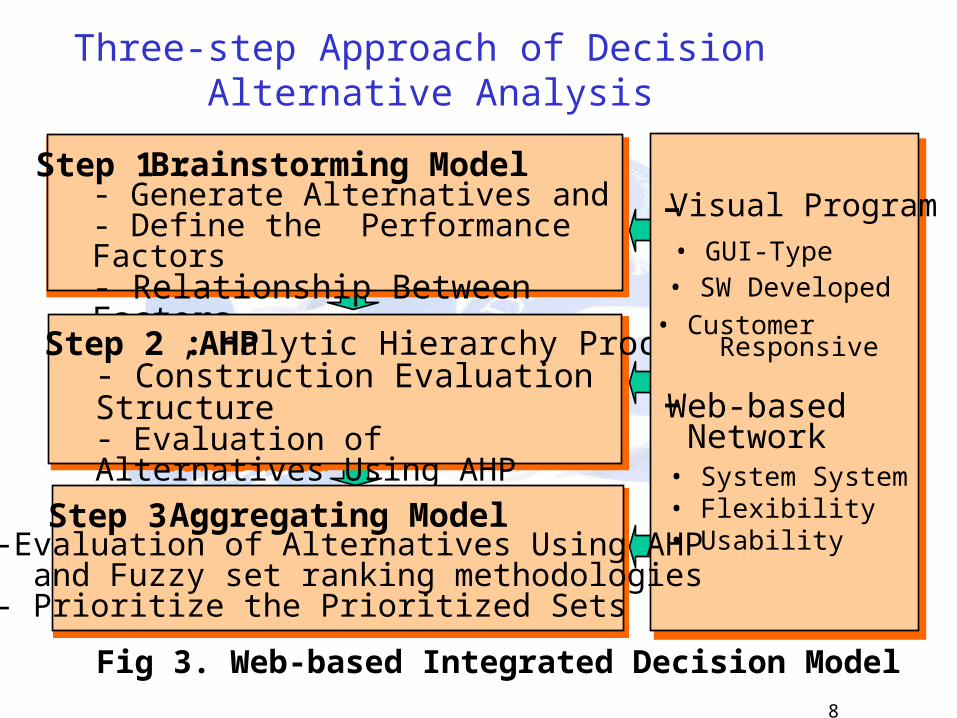
Step 1 :Brainstorming Model- Generate Alternatives and - Define the Performance Factors- Relationship Between Factors
단계2 : Secter-Clustering Model
보급지원영역활당Zone-Based
Step 2 :AHP,Analytic Hierarchy Process- Construction Evaluation Structure- Evaluation of Alternatives Using AHP and Fuzzy AHP methodologies
3 : GA-VRP Model
운송Mode의 선정
Step 3 : Aggregating Model
-시각화GYI-Type
프로그램개발사용자 위주의프로그램개발
-통합화
System
확장성,
활용성
-Visual Program• GUI-Type• SW Developed
• Customer Responsive
- Web-based Network• System System• Flexibility• Usability-Evaluation of Alternatives Using AHP
and Fuzzy set ranking methodologies- Prioritize the Prioritized Sets
Three-step Approach of Decision Alternative Analysis
9
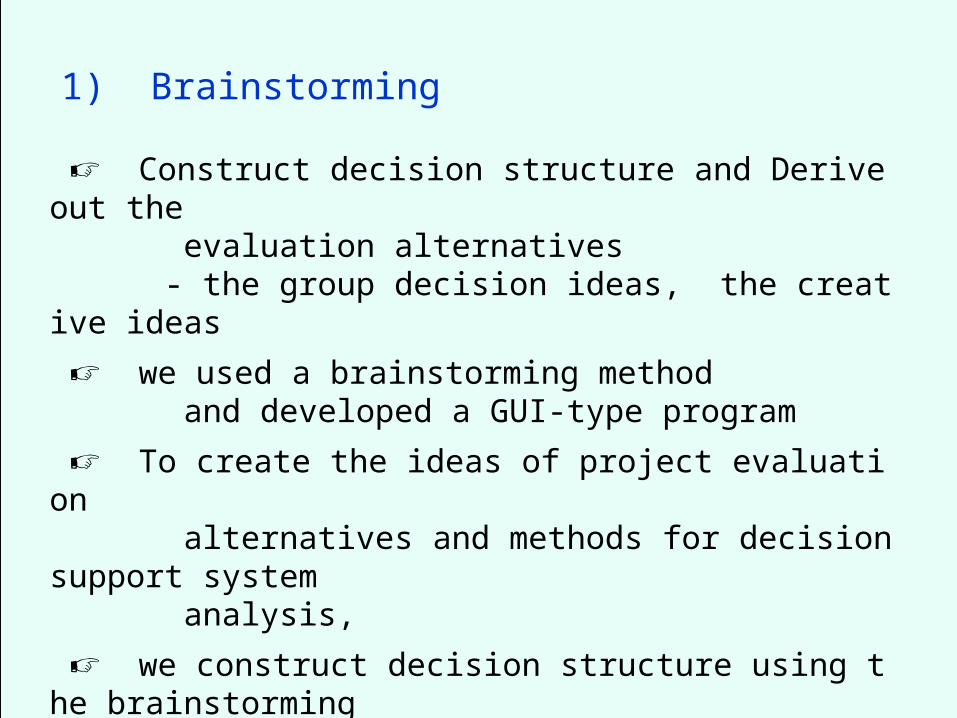
1) Brainstorming
☞ Construct decision structure and Derive out the evaluation alternatives - the group decision ideas, the creative ideas
☞ we used a brainstorming method and developed a GUI-type program
☞ To create the ideas of project evaluation alternatives and methods for decision support system analysis,
☞ we construct decision structure using the brainstorming file in the internet/intranet–based environment
10
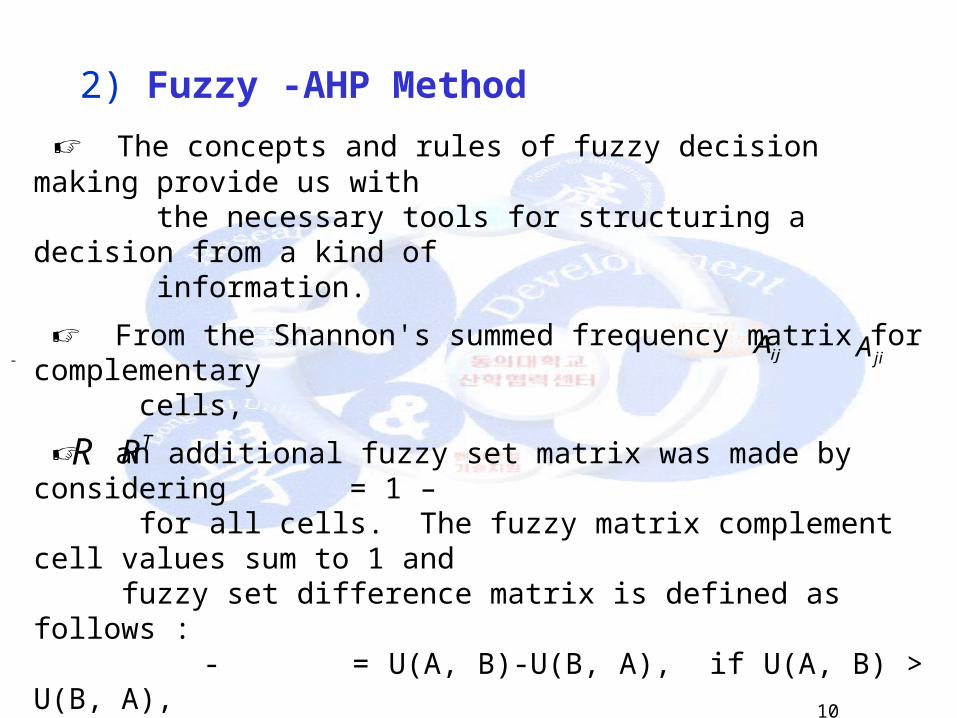
2) Fuzzy -AHP Method ☞ The concepts and rules of fuzzy decision making provide us with the necessary tools for structuring a decision from a kind of information.
☞ From the Shannon's summed frequency matrix for complementary cells,
☞ an additional fuzzy set matrix was made by considering = 1 – for all cells. The fuzzy matrix complement cell values sum to 1 and fuzzy set difference matrix is defined as follows : - = U(A, B)-U(B, A), if U(A, B) > U(B, A), = 0 otherwise where, for U(A, B) quantifies, A is preferable to B.
ijA jiA-
TRR
11
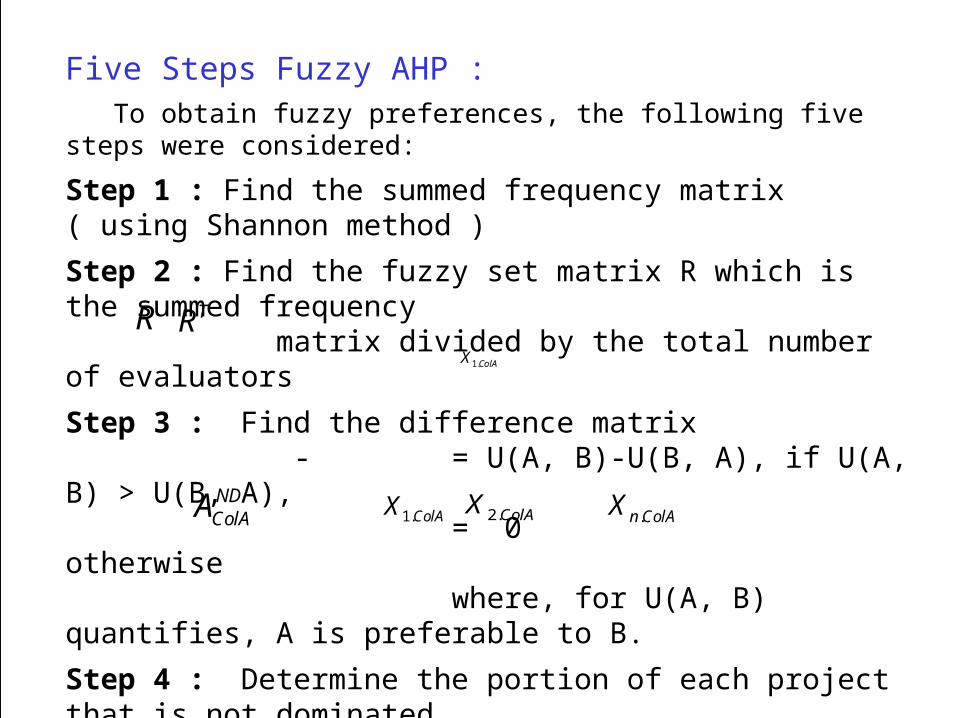
Five Steps Fuzzy AHP : To obtain fuzzy preferences, the following five steps were considered:
Step 1 : Find the summed frequency matrix ( using Shannon method )
Step 2 : Find the fuzzy set matrix R which is the summed frequency matrix divided by the total number of evaluators
Step 3 : Find the difference matrix - = U(A, B)-U(B, A), if U(A, B) > U(B, A), = 0 otherwise where, for U(A, B) quantifies, A is preferable to B.
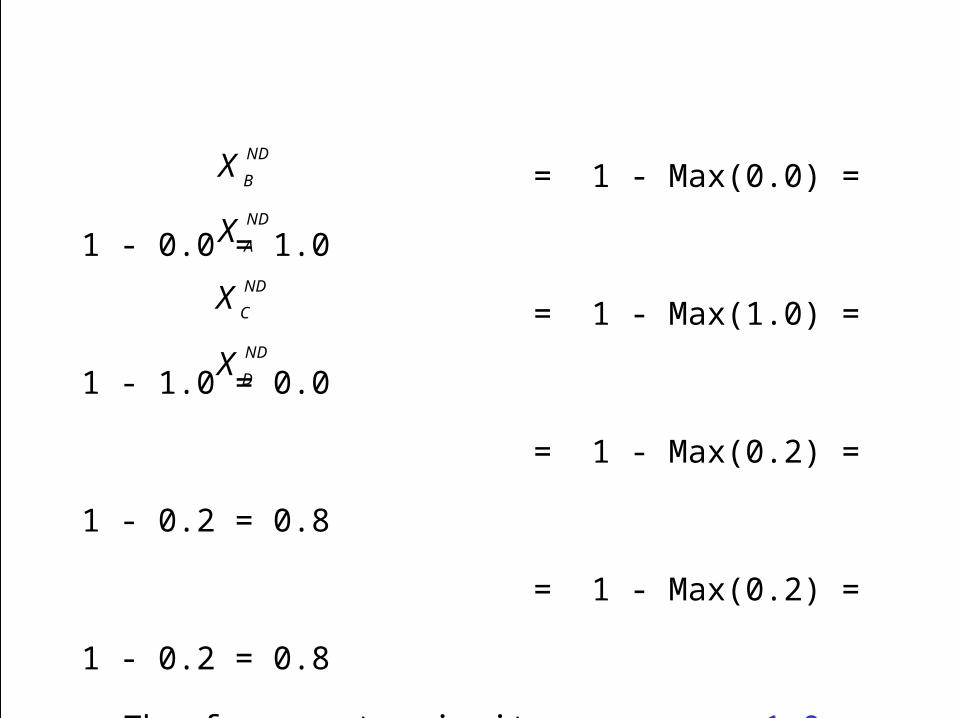
Step 4 : Determine the portion of each project that is not dominated as follows : = 1 - max( , , … , )
Step 5 : The priority of the fuzzy set is then the rank order of XND values with a decreasing order.
TRR
NDColAA
ColAX .1
1.ColAX 2.ColAX .n ColAX
12
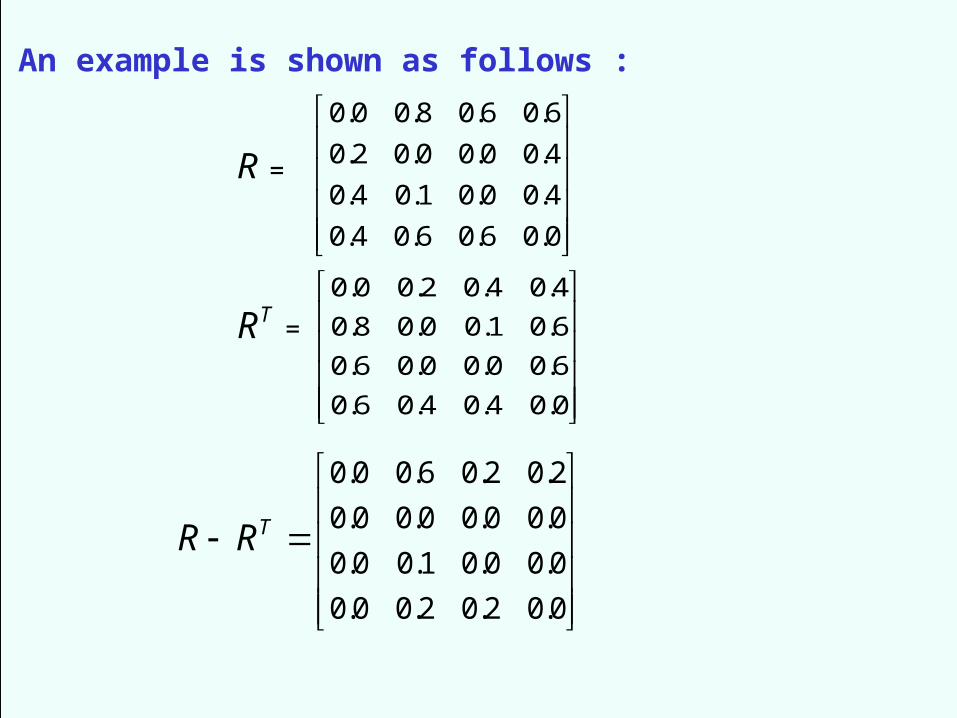
An example is shown as follows :
0.0 0.8 0.6 0.6
0.2 0.0 0.0 0.4
0.4 0.1 0.0 0.4
0.4 0.6 0.6 0.0
R =
0.04.04.06.0
6.00.00.06.0
6.01.00.08.0
4.04.02.00.0TR =
0.02.02.00.0
0.00.01.00.0
0.00.00.00.0
2.02.06.00.0
TRR
13
= 1 - Max(0.0) = 1 - 0.0 = 1.0
= 1 - Max(1.0) = 1 - 1.0 = 0.0
= 1 - Max(0.2) = 1 - 0.2 = 0.8
= 1 - Max(0.2) = 1 - 0.2 = 0.8
The fuzzy set priority score : 1.0 > 0.0 > 0.8 >
0.8
and the alternative priority : A > C > D > B.
ND
AX
ND
BX
ND
CX
ND
DX
146
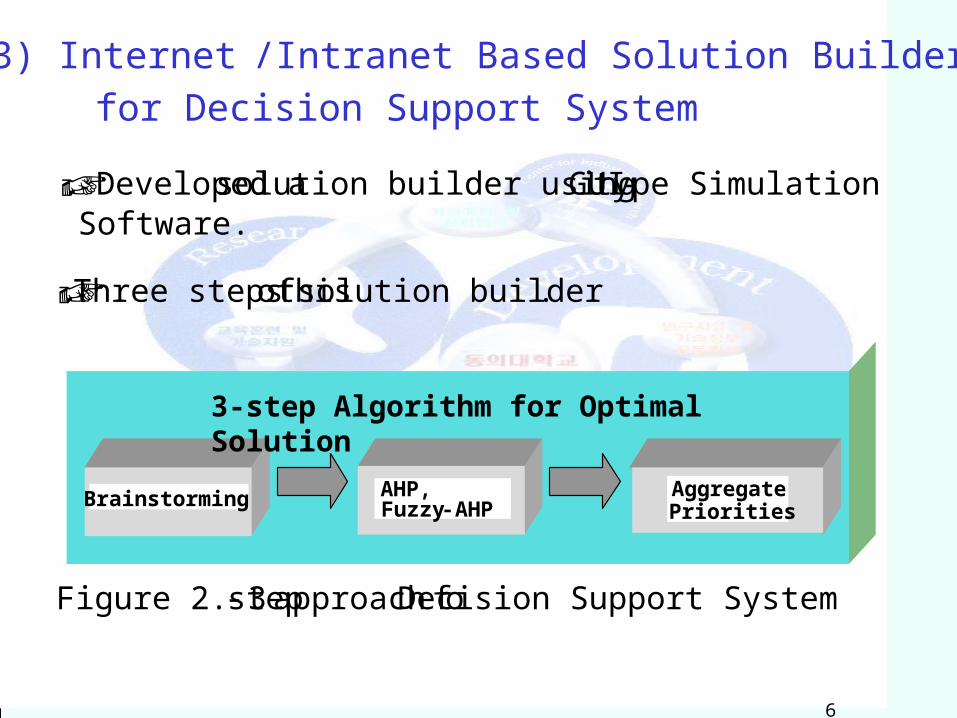
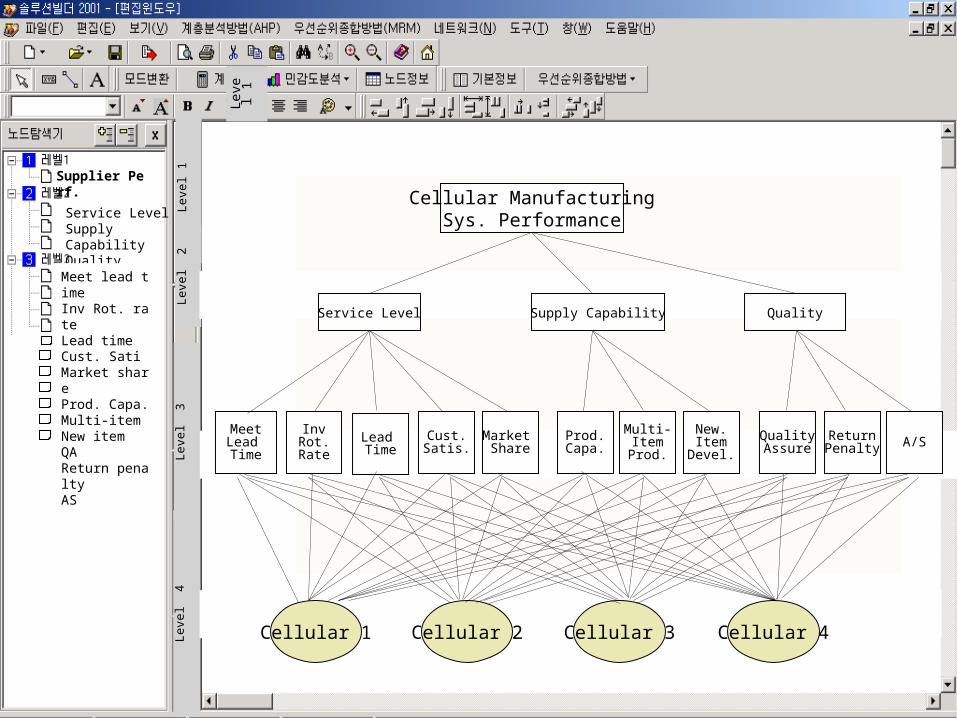
3) Internet /Intranet Based Solution Builderfor Decision Support System
-Brainstorming
-AHP, Fuzzy -AHP
AggregatePriorities-
3-step Algorithm for Optimal Solution
Brainstorming-
AHP, Fuzzy -AHP
AggregatePriorities
Figure 2. 3-step approach of Decision Support System
☞ Developed a solution builder usingGUI-type SimulationSoftware.
☞ Three steps of this solution builder.
15
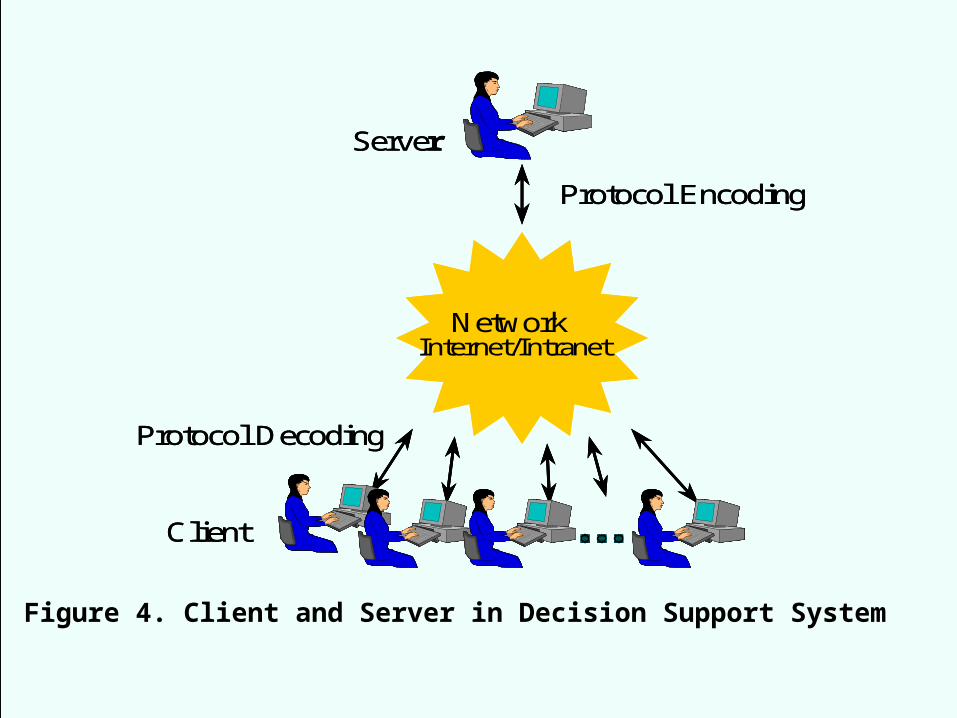
NetworkInternet/Intranet
Server
Protocol Encoding
Protocol Decoding
Client
NetworkInternet/Intranet
Server
Protocol Encoding
Protocol Decoding
Client
Figure 4. Client and Server in Decision Support System
166
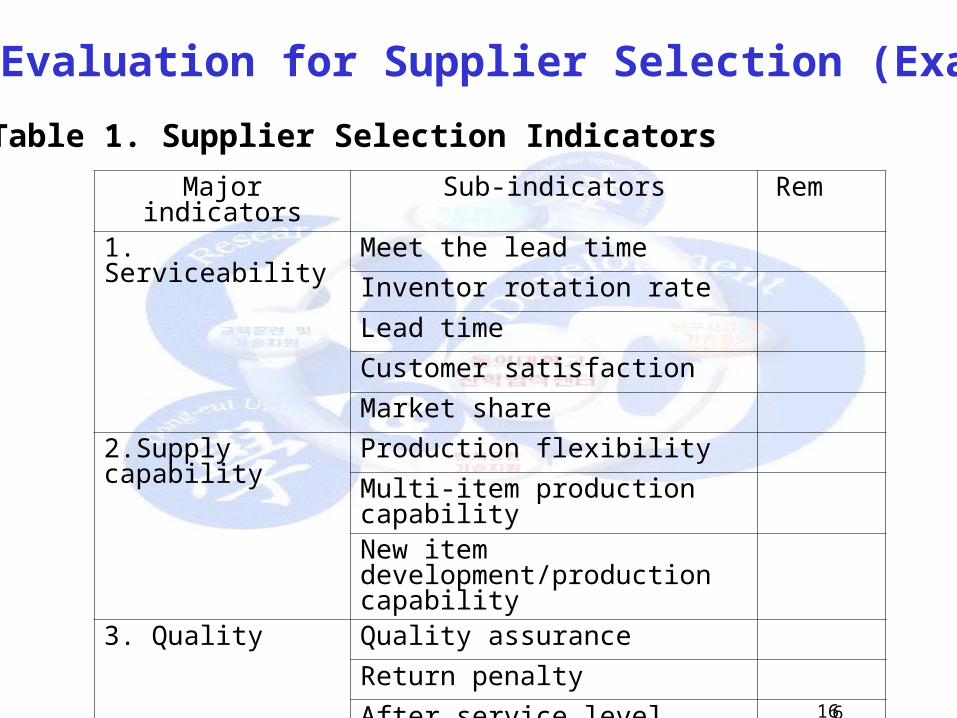
3.2 Evaluation for Supplier Selection (Example)
Major indicators Sub-indicators Rem
1. Serviceability Meet the lead time
Inventor rotation rate
Lead time
Customer satisfaction
Market share
2.Supply capability Production flexibility
Multi-item production capability
New item development/production capability
3. Quality Quality assurance
Return penalty
After service level
Table 1. Supplier Selection Indicators
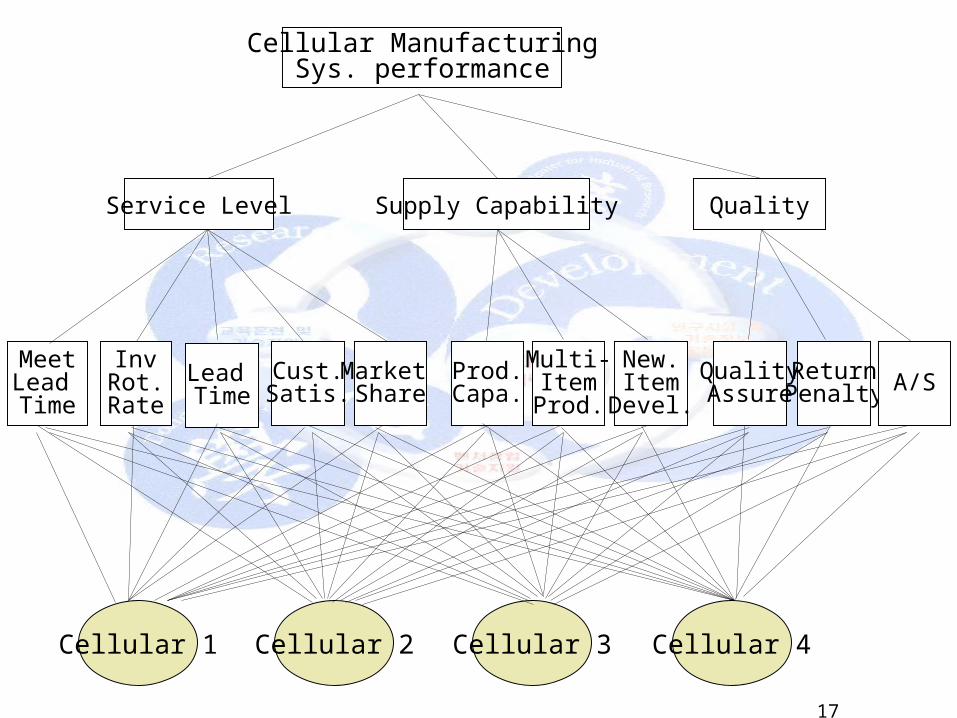
17
Cellular ManufacturingSys. performance
Service Level Supply Capability Quality
MeetLead Time
InvRot.Rate
Lead Time
Cust.Satis.
Market Share
Prod.Capa.
Multi-ItemProd.
New.Item
Devel.
QualityAssure
ReturnPenalty A/S
Cellular 1 Cellular 2 Cellular 3 Cellular 4
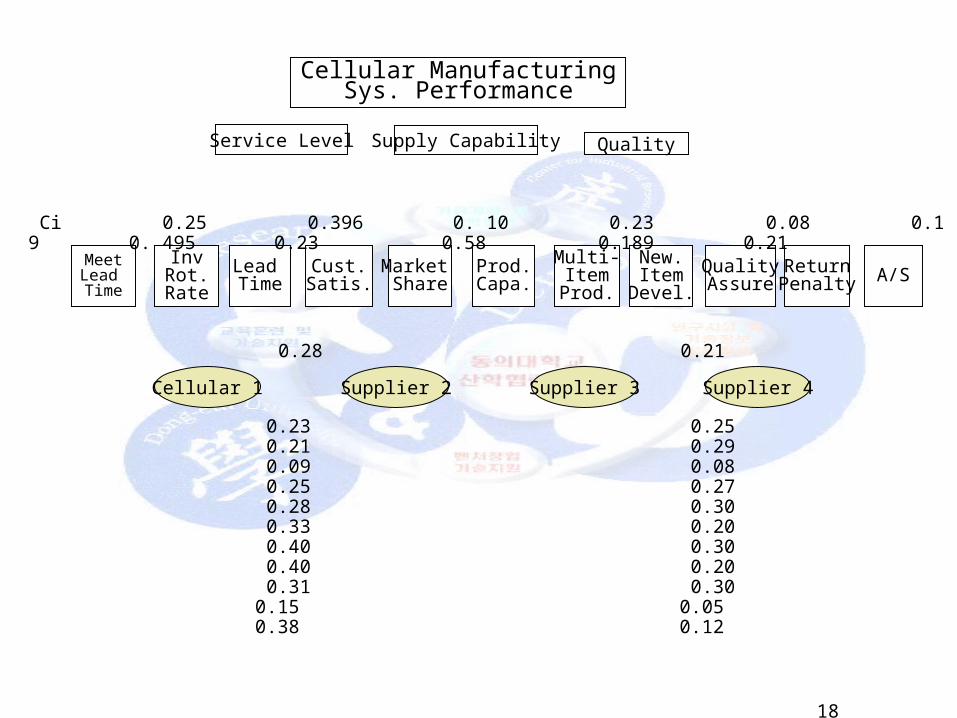
18
Service Level Supply Capability Quality
Cellular 1 Supplier 2 Supplier 3 Supplier 4
C1 0.26 0.23 0.25 0.26 C2 0.26 0.21 0.29 0.24C3 0.08 0.09 0.08 0.75 C4 0.22 0.25 0.27 0.28C5 0.19 0.28 0.30 0.23 C6 0.25 0.33 0.20 0.22 C7 0.20 0.40 0.30 0.10 C8 0.20 0.40 0.20 0.20C9 0.28 0.31 0.30 0.11C10 0.60 0.15 0.05 0.20 C11 0.19 0.38 0.12 0.31
D1 0.24 0.28 0.21 0.27
MeetLead Time
InvRot.Rate
Lead Time
Cust.Satis.
Market Share
Prod.Capa.
Multi-ItemProd.
New.Item
Devel.
QualityAssure
ReturnPenalty A/S
Ci 0.25 0.396 0. 10 0.23 0.08 0.19 0. 495 0.23 0.58 0.189 0.21
Cellular ManufacturingSys. Performance
19
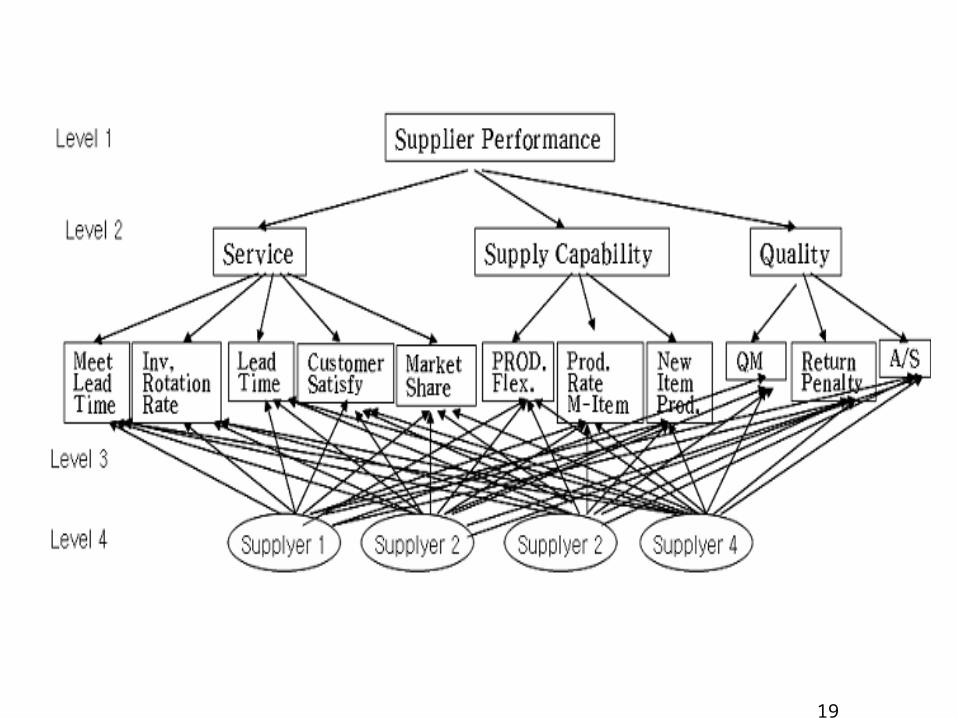
20
Lev
el
1
Lev
el 1Supplier Perf.
Lev
el 2
Cellular ManufacturingSys. Performance
Service Level Supply Capability Quality
MeetLead Time
InvRot.Rate
Lead Time
Cust.Satis.
Market Share
Prod.Capa.
Multi-ItemProd.
New.Item
Devel.
QualityAssure
ReturnPenalty A/S
Cellular 1 Cellular 2 Cellular 3 Cellular 4
Service LevelSupply CapabilityQuality
Meet lead timeInv Rot. rateLead timeCust. SatiMarket shareProd. Capa.Multi-itemNew itemQAReturn penaltyAS
Lev
el 3
Lev
el 4
21
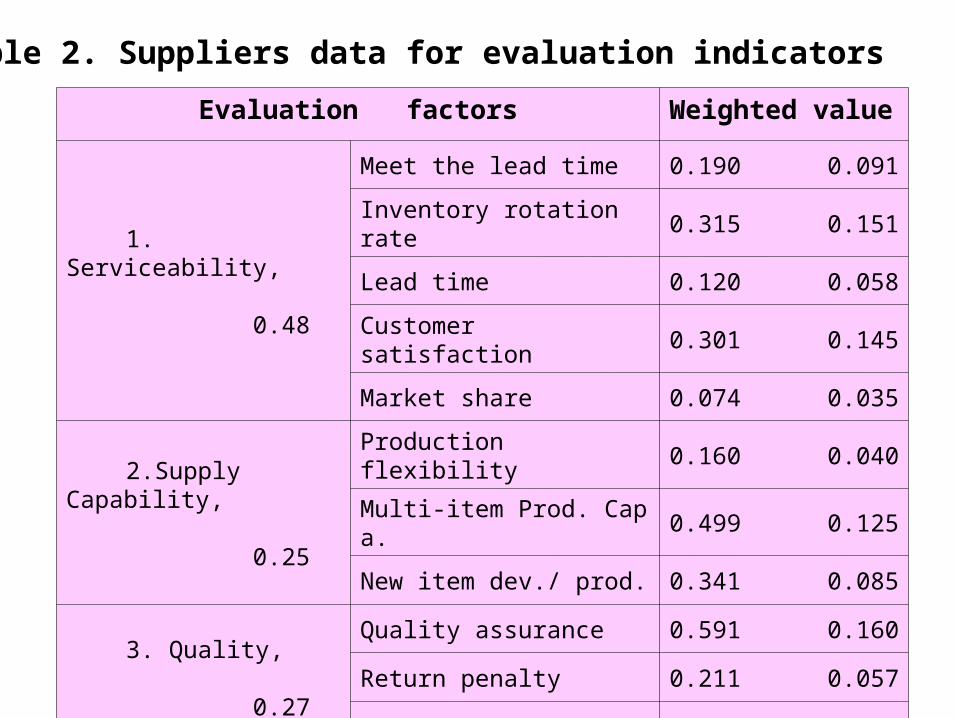
Evaluation factors Weighted value
1. Serviceability, 0.48
Meet the lead time 0.190 0.091
Inventory rotation rate 0.315 0.151
Lead time 0.120 0.058
Customer satisfaction 0.301 0.145
Market share 0.074 0.035
2.Supply Capability, 0.25
Production flexibility 0.160 0.040
Multi-item Prod. Capa. 0.499 0.125
New item dev./ prod. 0.341 0.085
3. Quality, 0.27
Quality assurance 0.591 0.160
Return penalty 0.211 0.057
A/S 0.198 0.053
Table 2. Suppliers data for evaluation indicators
22
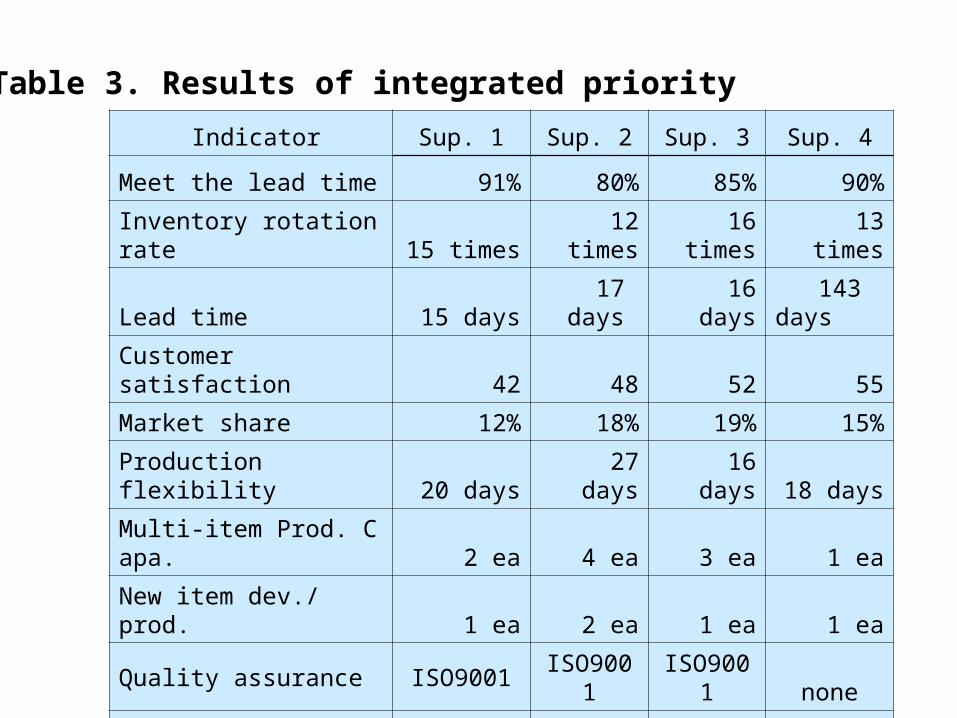
Table 3. Results of integrated priority
Indicator Sup. 1 Sup. 2 Sup. 3 Sup. 4
Meet the lead time 91% 80% 85% 90%
Inventory rotation rate 15 times 12 times 16 times 13 times
Lead time 15 days 17 days 16 days 143 days
Customer satisfaction 42 48 52 55
Market share 12% 18% 19% 15%
Production flexibility 20 days 27 days 16 days 18 days
Multi-item Prod. Capa. 2 ea 4 ea 3 ea 1 ea
New item dev./ prod. 1 ea 2 ea 1 ea 1 ea
Quality assurance ISO9001 ISO9001 ISO9001 none
Return penalty 12% 3% 1% 4%
A/S 3 days 6 days 2 days 5 days
23
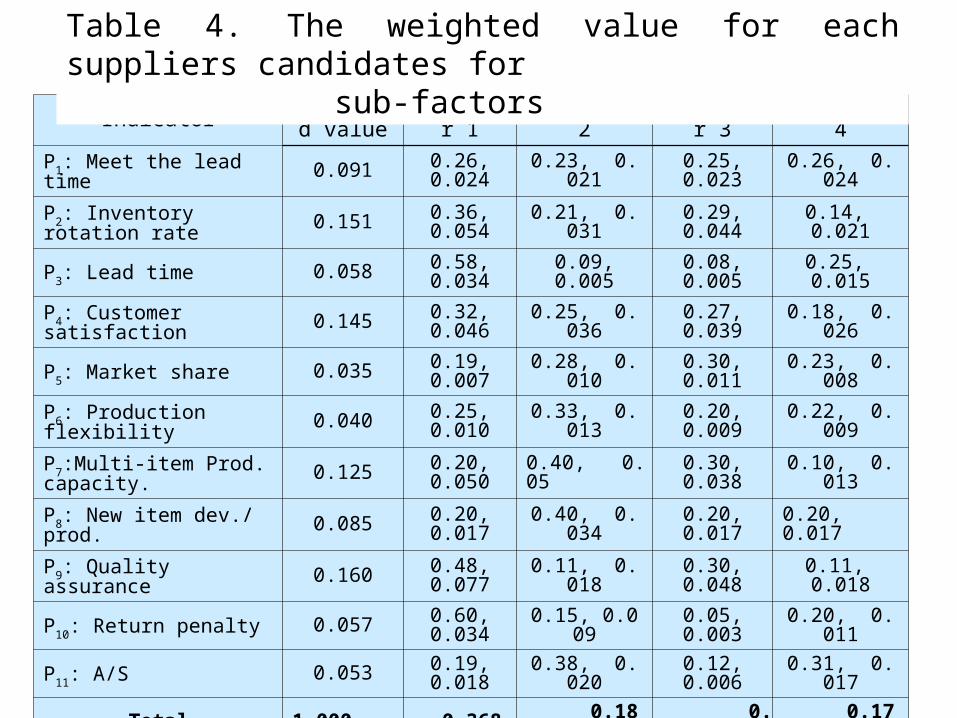
Indicator Weighted value Supplier 1 Supplier 2 Supplier 3 Supplier
4
P1: Meet the lead time 0.091 0.26, 0.024 0.23, 0.021 0.25, 0.023 0.26, 0.024
P2: Inventory rotation rate 0.151 0.36, 0.054 0.21, 0.031 0.29, 0.044 0.14, 0.021
P3: Lead time 0.058 0.58, 0.034 0.09, 0.005 0.08, 0.005 0.25, 0.015
P4: Customer satisfaction 0.145 0.32, 0.046 0.25, 0.036 0.27, 0.039 0.18, 0.026
P5: Market share 0.035 0.19, 0.007 0.28, 0.010 0.30, 0.011 0.23, 0.008
P6: Production flexibility 0.040 0.25, 0.010 0.33, 0.013 0.20, 0.009 0.22, 0.009
P7:Multi-item Prod. capacity.
0.125 0.20, 0.050 0.40, 0.05 0.30, 0.038 0.10, 0.013
P8: New item dev./ prod. 0.085 0.20, 0.017 0.40, 0.034 0.20, 0.017 0.20, 0.017
P9: Quality assurance 0.160 0.48, 0.077 0.11, 0.018 0.30, 0.048 0.11, 0.018
P10: Return penalty 0.057 0.60, 0.034 0.15, 0.009 0.05, 0.003 0.20, 0.011
P11: A/S 0.053 0.19, 0.018 0.38, 0.020 0.12, 0.006 0.31, 0.017
Total 1.000 0.368 0.180 0.243 0.179
Table 4. The weighted value for each suppliers candidates for sub-factors
24
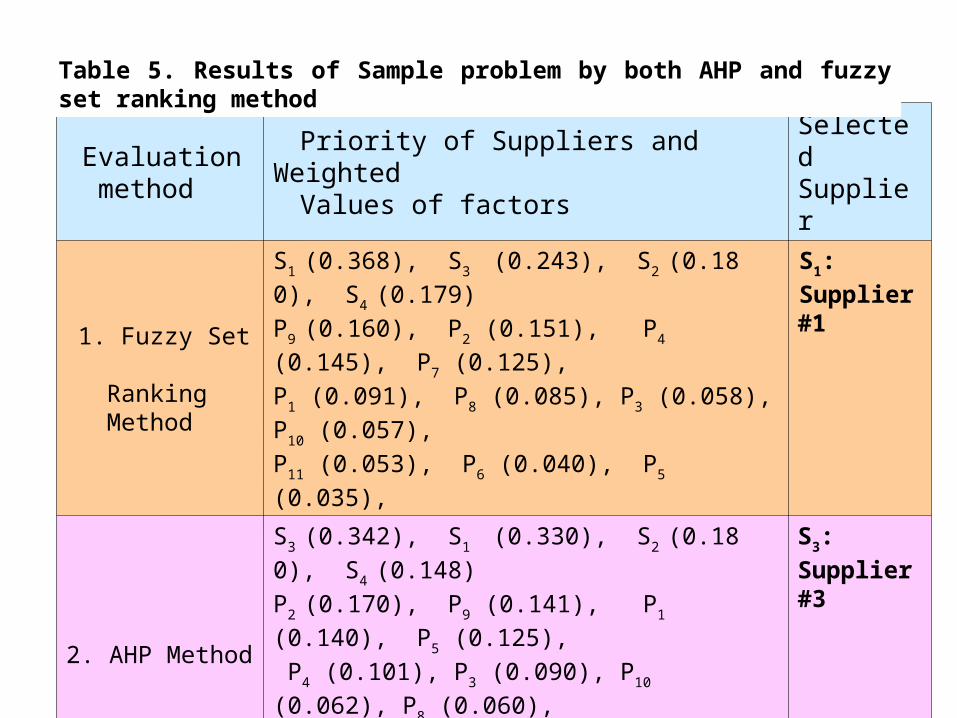
Evaluation method
Priority of Suppliers and Weighted Values of factors
SelectedSupplier
1. Fuzzy Set Ranking Method
S1 (0.368), S3 (0.243), S2 (0.180), S4 (0.179)
P9 (0.160), P2 (0.151), P4 (0.145), P7 (0.125),
P1 (0.091), P8 (0.085), P3 (0.058), P10 (0.057),
P11 (0.053), P6 (0.040), P5 (0.035),
S1:
Supplier #1
2. AHP Method
S3 (0.342), S1 (0.330), S2 (0.180), S4 (0.148)
P2 (0.170), P9 (0.141), P1 (0.140), P5 (0.125),
P4 (0.101), P3 (0.090), P10 (0.062), P8 (0.060),
P9 (0.041), P7 (0.040), P5 (0.030),
S3:
Supplier #3
Table 5. Results of Sample problem by both AHP and fuzzy set ranking method
25
4. CONCLUSION ☞ In this research, developed a three-step approach based on web-based supplier’s selection decision model using multi-structured decision support systems
☞ Those steps are : 1) brainstorming to define the alternatives and performance evaluation factors, 2) individual evaluation the alternatives using fuzzy-AHP, heuristic and fuzzy set reasoning methods, and 3) integration the individual evaluations using majority rule method.
☞ Developed a Supplier’s Selection Model
☞ For a simple and efficient computation, we developed a systematic and practical web-based program to calculate all the algorithms.
☞ The model was applied to a sample supplier’s selection problem in
Taoyuan area of Taiwan for a third party logistics considering the 11
evaluation factors and 4 supplier candidates.
26
☞ By the sample results of both AHP and fuzzy set reasoning method, it is known that the proposed model is a good method for the performance evaluation of multi-attribute and multiple goals.
☞ For the academic users, we would provide this software and user manual. ☞ For the problems of data collecting and its analysis in hierarchical decision structures, the DHP (Delphic Hierarchy Process) method can be used in future study.

27
Kainan University, Taiwan
Prof. Heung-Suk Hwnag
Thank You
Kainan University