1. basis of presenting consolidated 3. summary of significant accounting … · 2015-07-08 · 1....
TRANSCRIPT
1. Basis of presenting consolidated financial statements
The accompanying consolidated financial statements have been
prepared in accordance with the provisions set forth in the Japanese
Financial Instruments and Exchange Act and its related accounting
regulations and in accordance with accounting principles generally
accepted in Japan (“Japanese GAAP”), which differ in certain respects
from the application and disclosure requirements of accounting
principles generally accepted in the United States of America (“U.S.
GAAP”) and the International Financial Reporting Standards.
In preparing these consolidated financial statements, certain
reclassifications and presentational changes have been made to the
consolidated financial statements issued domestically in order to
present them in a form, which is more familiar to readers outside Japan.
In addition, certain reclassifications have been made in the consolidated
financial statements of the fiscal year ended March 31, 2014 to
conform to the classifications used in the fiscal year ended
December 31, 2014.
The consolidated financial statements are stated in Japanese yen,
the currency of the country in which Otsuka Holdings Co., Ltd. (the
“Company”), is incorporated and operates. The translations of Japanese
yen amounts into U.S. dollar amounts are included solely for the
convenience of readers outside Japan and have been made at the rate
of ¥120.55 to US$1, the approximate rate of exchange as of December
31, 2014. Such translations should not be construed as representations
that the Japanese yen amounts could be converted into U.S. dollars at
that or any other rate.
2. Change in consolidated fiscal year end
In order to make more timely and accurate disclosure of management
information about global activities by the Company and its consolidated
subsidiaries (together, the “Group”), whose overseas sales represent a
large percentage of total sales, by standardizing its fiscal year with its
overseas consolidated subsidiaries, the Company changed its fiscal year
end for consolidated financial statements from March 31 to December
31, following resolution regarding the partial amendments to the
Articles of Incorporation at the 6th Annual Shareholders Meeting held
on June 27, 2014. Consequently, the consolidated financial results in
the transitional period for FY2014 represent nine months (April 1, 2014
to December 31, 2014).
For the period of January 1, 2014 to March 31, 2014, profits or
losses of consolidated subsidiaries with a December 31 fiscal year end
have been adjusted within retained earnings. Furthermore, 23
consolidated domestic subsidiaries changed their fiscal year end from
March 31 to December 31.
3. Summary of significant accounting policies
(a) Basis for preparing consolidated financial statements
The consolidated financial statements as of December 31, 2014 include
the accounts of the Company and its 102 (95 as of March 31, 2014)
significant subsidiaries. Under the control or influence concept, those
companies in which the Company, directly or indirectly, is able to
exercise control over operations are fully consolidated, and those
companies over which the Group has the ability to exercise significant
influence are accounted for by the equity method.
Investments in one (one as of March 31, 2014) unconsolidated
subsidiary and 16 (16 as of March 31, 2014) affiliated companies are
accounted for by the equity method.
During the fiscal year ended December 31, 2014, Jasmine Comercio
de Produtos Alimenticios LTDA, FoodState, Inc., Higashiyama Film Co.,
Ltd. and one other company have been newly included in the scope of
consolidation as a result of the acquisition of their shares.
Nardobel Paticipacoes Ltda. and Bigarade Corporation have been
newly included in the scope of consolidation from the fiscal year ended
December 31, 2014 as they were newly established.
Otsuka Pharmaceutical Italy S.r.l. and one company have been newly
included in the scope of consolidation from the fiscal year ended
December 31, 2014 due to their increase in materiality.
Soma Beverage Company, LLC, which had been in the scope of
consolidation, was absorbed by Crystal Geyser Water Company, a
consolidated subsidiary.
Investments in the remaining unconsolidated subsidiaries and
affiliated companies are stated at cost. If the equity method of
accounting had been applied to the investments in these companies,
the effect on the accompanying consolidated financial statements
would not be material.
The excess of cost of investments in consolidated subsidiaries over
fair value of their net assets or the excess of net assets of consolidated
subsidiaries over purchase cost at the date of acquisition is amortized
on a straight-line basis over a period of five to 20 years.
All significant intercompany balances and transactions have been
eliminated in consolidation. All material unrealized profit included in assets
resulting from transactions within the Group has also been eliminated.
(b) Unification of accounting policies applied to foreign subsidiaries for the consolidated financial statements
In May 2006, the Accounting Standards Board of Japan (ASBJ) issued
ASBJ Practical Issues Task Force (PITF) No. 18, “Practical Solution on
Unification of Accounting Policies Applied to Foreign Subsidiaries for the
Consolidated Financial Statements.” PITF No. 18 prescribes:
(1) The accounting policies and procedures applied to a parent company
and its subsidiaries for similar transactions and events under similar
circumstances should in principle be unified for the preparation of
the consolidated financial statements.
Notes to Consolidated Financial StatementsOtsuka Holdings Co., Ltd. and its Consolidated Subsidiaries
Otsuka-people creating new products for better health worldwide
62

(2) Financial statements prepared by foreign subsidiaries in accordance
with either International Financial Reporting Standards or U.S. GAAP
may be used tentatively for the consolidation process.
(3) However, the following items should be adjusted in the
consolidation process so that net income is accounted for in
accordance with Japanese GAAP, unless they are not material:
1) Amortization of goodwill
2) Scheduled amortization of actuarial gain or loss of pensions that
has been directly recorded in equity
3) Expensing capitalized development costs of R&D
4) Cancellation of the fair value model of accounting for property,
plant and equipment and investment properties and
incorporation of the cost model of accounting
5) Exclusion of minority interests from net income, if contained
(c) Unification of accounting policies applied to foreign affiliated companies for the equity method
In March 2008, the ASBJ issued ASBJ Statement No. 16, “Accounting
Standard for Equity Method of Accounting for Investments.” The new
standard requires adjustments to be made to conform the affiliates’
accounting policies for similar transactions and events under similar
circumstances to those of the parent company when the affiliates’
financial statements are used in applying the equity method, unless it is
impracticable to determine adjustments. In addition, financial
statements prepared by foreign affiliated companies in accordance with
either International Financial Reporting Standards or U.S. GAAP may be
used tentatively in applying the equity method if the following items are
adjusted so that net income is accounted for in accordance with
Japanese GAAP, unless they are not material:
(1) Amortization of goodwill
(2) Scheduled amortization of actuarial gain or loss of pensions that
has been directly recorded in the equity
(3) Expensing capitalized development costs of R&D
(4) Cancellation of the fair value model of accounting for property,
plant and equipment and investment properties and
incorporation of the cost model of accounting
(5) Exclusion of minority interests from net income, if contained
(d) Business combinationsIn October 2003, the Business Accounting Council issued a Statement
of Opinion, “Accounting for Business Combinations,” and in December
2005, the ASBJ issued ASBJ Statement No. 7, “Accounting Standard
for Business Divestitures,” and ASBJ Guidance No. 10, “Guidance
for Accounting Standard for Business Combinations and
Business Divestitures.”
The accounting standard for business combinations allows companies
to apply the pooling of interests method of accounting only when
certain specific criteria are met such that the business combination is
essentially regarded as a uniting of interests.
For business combinations that do not meet the uniting-of-interests
criteria, the business combination is considered to be an acquisition and
the purchase method of accounting is required. This standard also
prescribes the accounting for combinations of entities under common
control and for joint ventures.
In December 2008, the ASBJ issued a revised accounting standard for
business combinations, ASBJ Statement No. 21, “Accounting Standard
for Business Combinations.” Major accounting changes under the
revised accounting standard are as follows:
(1) The revised standard requires accounting for business
combinations only by the purchase method. As a result, the
pooling of interests method of accounting is no longer allowed.
(2) The current accounting standard accounts for the research and
development costs to be charged to income as incurred. Under
the revised standard, in-process research and development (IP
R&D) acquired in the business combination is capitalized as an
intangible asset.
(3) The previous accounting standard provided for a bargain
purchase gain (negative goodwill) to be periodically amortized
over a period not exceeding 20 years. Under the revised
standard, the acquirer recognizes the bargain purchase gain in
profit or loss immediately on the acquisition date after
reassessing and confirming that all of the assets acquired and
all of the liabilities assumed have been identified after a review
of the procedures used in the purchase allocation.
The revised standard was applicable to business combinations
undertaken on or after April 1, 2010.
There were no material business combinations for the current
fiscal year.
(e) Cash equivalentsCash equivalents are short-term investments that are readily convertible
into cash and that are exposed to insignificant risk of changes in value.
Cash equivalents include time deposits and certificate of deposits, all of
which mature or become due within three months of the date of
acquisition.
(f) SecuritiesSecurities other than equity securities issued by subsidiaries and
affiliated companies are classified into held-to-maturity and available-
for-sale securities. Held-to-maturity securities are carried at amortized
cost. Marketable securities classified as available-for-sale securities are
carried at fair value with unrealized gains or losses, net of applicable
taxes, stated in a separate component of equity.
Nonmarketable securities classified as available-for-sale securities
are stated at cost as determined by the moving-average method.
For other-than-temporary declines in fair value, investment securities
are reduced to net realizable value and booked in income.
63
(g) InventoriesInventories are stated at the lower of cost, determined mainly by the
average method for finished products, work in process, and raw
materials and mainly by the first-in, first-out method for merchandise
and supplies, or net selling value.
(h) Property, plant and equipmentProperty, plant and equipment are stated at cost. Depreciation of
property, plant and equipment is calculated mainly by the straight-line
method over the estimated useful lives of the assets.
The range of useful lives is from two to 65 years for buildings and
structures and from two to 30 years for machinery and equipment.
(Changes in accounting policies that are difficult to
differentiate from changes in accounting estimates and
changes in accounting estimates)
(Change in the depreciation method and the useful life of
property, plant and equipment)
The Company and its consolidated domestic subsidiaries had previously
adopted mainly the declining-balance method while its consolidated
subsidiaries abroad adopted mainly the straight-line method for the
depreciation of property, plant and equipment. From the beginning of
the current fiscal year, the Company and its major consolidated
domestic subsidiaries have changed the depreciation method from the
declining-balance method to the straight-line method.
With the preparation of our “Second Medium-Term Management
Plan” starting from the current fiscal year, the Company seeks to
achieve “creative and sustainable growth as a total healthcare
company” in both the pharmaceutical and nutraceutical businesses by
2020, through accelerating the development of its businesses globally
and by further solidifying its already stable domestic income platform
supported mainly by its core brands in Japan. To this end, the Company
re-examined the respective method of depreciation for the Group’s
property, plant and equipment.
Based on the frequency of maintenance and replacement and the
general condition of the property, plant and equipment, the Company
did not find any rapid technical or economic obsolescence, leading to
the conclusion that those assets can be operated stably over the
remainder of their useful lives. Therefore, the Company changed the
respective depreciation method to the straight-line method with
expenses allocated equally over useful lives. Given the increasing
importance of its overseas operation with the global development of its
businesses, the objective was also to increase the degree of unification
of the Group’s global accounting treatments.
Furthermore, as a result of examining the actual usage status of
property, plant and equipment with the preparation of the “Second
Medium-Term Management Plan” and the change in depreciation
method, the Company’s major consolidated domestic subsidiaries
changed the useful life of some property, plant and equipment starting
from the beginning of the current fiscal year to better reflect their actual
economic condition based on their estimated useful life.
In comparison with the former calculation method, these changes
resulted in increases in the Company’s operating income and income
before income taxes and minority interests for the current fiscal year by
¥2,935 million (US$24,347 thousand) respectively.
The effects on segment performance are stated in Note 25
“Segment information.”
Lease assets are depreciated using the straight-line method over
the terms of their respective leases with a zero residual value.
(i) Intangible assetsIntangible assets are amortized mainly by the straight-line method over
their estimated useful lives.
(j) Impairment lossThe Group reviews its long-lived assets for impairment whenever events
or changes in circumstances indicate the carrying amount of an asset or
an asset group may not be recoverable. An impairment loss is recognized
if the carrying amount of an asset or an asset group exceeds the sum of
the undiscounted future cash flows expected to result from the
continued use and eventual disposition of the asset or the asset group.
The impairment loss is measured as the amount by which the carrying
amount of the asset exceeds its recoverable amount, which is the higher
of the discounted cash flows from continued use and eventual
disposition of the asset or the current net selling price at disposition.
(k) Retirement and pension plansThe majority of domestic consolidated subsidiaries have defined benefit
pension plans held by jointly founded Otsuka Pharmaceuticals corporate
pension fund (a type of fund in multi-employer plans) and defined
contributory pension plans. The defined benefit pension plans consist of
contributory funded corporate pension plans and lump-sum retirement
payments plans.
Certain foreign consolidated subsidiaries have contributory funded
or unfunded defined benefit pension plans, defined contributory pension
plans, or a combination of them.
In order to cover payments of retirement benefits to employees, the net
amount after deducting plan assets from retirement benefit obligations is
recognized as net defined benefit liability (net defined benefit asset, in the
event plan assets exceed retirement benefit obligations) based on the
estimated amount as of the current fiscal year end.
(1) Methods of attributing estimated retirement benefits to
accounting periods
When calculating retirement benefit obligations, the benefit
formula is used to attribute estimated benefits to the period
through the end of the current fiscal year.
(2) Recognition of actuarial gains and losses, prior service costs,
and transitional obligations
Actuarial gains and losses are amortized in the succeeding years
by the straight-line method over a certain number of years
equal to or less than the average remaining service period of
employees (5–20 years) at the time of occurrence.
64
Notes to Consolidated Financial StatementsOtsuka Holdings Co., Ltd. and its Consolidated Subsidiaries
Otsuka-people creating new products for better health worldwide
Prior service costs are amortized by the straight-line method over a
certain number of years equal to or less than the average remaining
service period of employees (5–23 years) at the time of occurrence.
Transitional obligations are amortized over 5 to 15 years.
(Adoption of Accounting Standard for Retirement Benefits)
On May 17, 2012, the ASBJ issued ASBJ Statement No. 26, “Accounting
Standard for Retirement Benefits” and ASBJ Guidance No. 25,
“Guidance on Accounting Standard for Retirement Benefits,” which
replaced the Accounting Standard for Retirement Benefits that had been
issued by the Business Accounting Council in 1998 with an effective
date of April 1, 2000, and the other related practical guidance, and
were followed by partial amendments from time to time through 2009.
(1) Under the revised accounting standard, actuarial gains and losses
and prior service costs that are yet to be recognized in profit or loss
are recognized within equity (accumulated other comprehensive
income), after adjusting for tax effects, and any resulting deficit or
surplus are recognized as a liability (liability for retirement benefits)
or asset (asset for retirement benefits).
(2) The revised accounting standard does not change how to recognize
actuarial gains and losses and prior service costs in profit or loss.
Those amounts would be recognized in profit or loss over a certain
period no longer than the expected average remaining service
period of the employees. However, actuarial gains and losses and
prior service costs that arose in the current period and have not yet
been recognized in profit or loss are included in other
comprehensive income and actuarial gains and losses and prior
service costs that were recognized in other comprehensive income
in prior periods and then recognized in profit or loss in the current
period shall be treated as reclassification adjustments.
(3) The revised accounting standard made certain amendments relating
to the method of attributing expected benefit to periods and relating
to the discount rate and expected future salary increases.
The Company applied the revised accounting standard for (1) and (2)
above effective from fiscal year ended March 31, 2014, and has applied
(3) above from fiscal year started April 1, 2014.
Accordingly, the methods for calculating retirement benefit
obligations and service costs have been revised in the following
respects: The method for attributing expected benefits to accounting
periods has been changed from the straight-line basis to the benefit
formula basis, and the method for determining the discount rate,
previously derived from relevant bonds with a maturity close to the
average remaining employment period, has been changed to a method
whereby discount rates are used whose term matches with the
respective projected timing of the retirement payments.
According to the transitional treatment provided in this accounting
standard, the effect of changing the method for calculating retirement
benefit obligations and service costs was recognized by adjusting
retained earnings at the beginning of the current fiscal year.
As a result, an ¥8,959 million (US$74,318 thousand) decrease in
net defined benefit asset, a ¥640 million (US$5,309 thousand) increase
in net defined benefit liability, and a ¥5,300 million (US$43,965
thousand) decrease in retained earnings were recognized in the current
fiscal year. The impact on operating income and income before income
taxes and minority interests for the current fiscal year is immaterial.
Net assets per share decreased by ¥9.81 for the current fiscal year,
and the impact on net income per share is immaterial.
Retirement benefits for directors and audit and supervisory board
members of certain domestic consolidated subsidiaries are recorded to
state the liability at the amount that would be required if all directors
and audit and supervisory board members retired at the consolidated
balance sheet date. These amounts are paid only after an approval of
the shareholders’ meeting in accordance with the Companies Act of
Japan (the “Companies Act”).
(l) Asset retirement obligationsIn March 2008, the ASBJ published the accounting standard for asset
retirement obligations, ASBJ Statement No. 18, “Accounting Standard
for Asset Retirement Obligations,” and ASBJ Guidance No. 21,
“Guidance on Accounting Standard for Asset Retirement Obligations.”
Under this accounting standard, an asset retirement obligation is
defined as a legal obligation imposed either by law or contract that
results from the acquisition, construction, development, and the normal
operation of property, plant and equipment and is associated with the
retirement of such property, plant and equipment. The asset retirement
obligation is recognized as the sum of the discounted cash flows
required for the future asset retirement and is recorded in the period in
which the obligation is incurred if a reasonable estimate can be made. If
a reasonable estimate of the asset retirement obligation cannot be
made in the period the asset retirement obligation is incurred, the
liability should be recognized when a reasonable estimate of the asset
retirement obligation can be made. Upon initial recognition of a liability
for an asset retirement obligation, an asset retirement cost is capitalized
by increasing the carrying amount of the related fixed asset by the
amount of the liability. The asset retirement cost is subsequently
allocated to expense through depreciation over the remaining useful life
of the asset. Over time, the liability is accreted to its present value each
period. Any subsequent revisions to the timing or the amount of the
original estimate of undiscounted cash flows are reflected as an
increase or a decrease in the carrying amount of the liability and the
capitalized amount of the related asset retirement cost.
(m) Stock optionsIn December 2005, the ASBJ issued ASBJ Statement No. 8, “Accounting
Standard for Stock Options,” and related guidance. The new standard
and guidance are applicable to stock options newly granted on and
after May 1, 2006. This standard requires companies to recognize
compensation expense for employee stock options based on the fair
value at the date of grant and over the vesting period as consideration
for receiving services. The standard also requires companies to account
for stock options granted to nonemployees based on the fair value of
either the stock option or the goods or services received. In the
consolidated balance sheet, the stock option is presented as a stock
acquisition right as a separate component of equity until exercised. The
65
standard covers equity-settled, share-based payment transactions, but
does not cover cash-settled, share-based payment transactions. In
addition, the standard allows unlisted companies to measure options at
their intrinsic value if they cannot reliably estimate fair value.
(n) Research and development expensesResearch and development expenses are charged to income
when incurred.
(o) LeasesIn March 2007, the ASBJ issued ASBJ Statement No. 13, “Accounting
Standard for Lease Transactions,” which revised the previous accounting
standard for lease transactions issued in June 1993. The revised
accounting standard for lease transactions is effective for fiscal years
beginning on or after April 1, 2008.
Under the previous accounting standard, finance leases that were
deemed to transfer ownership of the leased property to the lessee were
required to be capitalized. However, other finance leases were permitted
to be accounted for as operating lease transactions if certain “as if
capitalized” information was disclosed in the notes to the lessee’s
financial statements. The revised accounting standard requires that all
finance lease transactions be capitalized to recognize lease assets and
lease obligations in the balance sheet.
The Company applied the revised accounting standard effective April
1, 2008. In addition, the Company accounted for leases which existed at
the transition date and do not transfer ownership of the leased property
to the lessee as if such leased assets had been acquired at the transition
date at costs measured at the obligations under the finance leases.
This change had no effect on the consolidated results of
the Company.
(p) Income taxesThe provision for income taxes is calculated based on the pretax income
included in the consolidated statement of income. The asset and liability
approach is used to recognize deferred tax assets and liabilities for the
expected future tax consequences of temporary differences between the
carrying amounts and the tax bases of assets and liabilities. Deferred
tax assets and liabilities are calculated by applying currently enacted
income tax rates to the temporary differences.
(q) Foreign currency transactionsAll short-term and long-term monetary receivables and payables
denominated in foreign currencies are translated into Japanese yen at the
exchange rates as of the balance sheet date. The foreign exchange gains
and losses from translation are recognized in the consolidated statement
of income except when they are hedged by forward exchange contracts.
(r) Foreign currency translationThe balance sheet accounts of the consolidated foreign subsidiaries are
translated into Japanese yen at the current exchange rate as of the
balance sheet date except for shareholders’ equity, which is translated at
the historical rate. Revenue and expense accounts of consolidated
foreign subsidiaries are translated into yen at the average exchange rate.
Differences arising from such translation are shown as “Foreign
currency translation adjustments” under accumulated other
comprehensive income in a separate component of equity in the
consolidated balance sheet.
(s) Derivative financial instrumentsThe Group uses foreign currency forward contracts, foreign currency
option contracts, and interest rate swaps to reduce foreign currency
exchange and interest rate risks. The Group does not enter into
derivative transactions for trading or speculative purposes.
Derivative financial instruments and foreign currency transactions
are classified and accounted for as follows:
(1) All derivatives are recognized as either assets or liabilities and
measured at fair value, with gains or losses recognized in the
consolidated statement of income.
(2) For derivatives used for hedging purposes, if derivatives qualify
for hedge accounting because of high correlation and
effectiveness between the hedging instruments and the hedged
items, gains or losses on derivatives are deferred until the
related losses or gains on the hedged items are recognized.
If foreign currency forward contracts and foreign currency option
contracts qualify for hedge accounting and meet specific matching
criteria, assets and liabilities denominated in foreign currencies are
translated at the contract rates and no gains or losses on derivative
transactions are recognized.
Interest rate swaps, which qualify for hedge accounting and meet
specific matching criteria, are not remeasured at market value, but the
differential paid or received under the swap agreements is recognized
as and included in interest expense or income.
(t) Per share informationBasic net income per share is calculated by dividing net income
available to common shareholders by the weighted-average number of
common shares outstanding for the period.
Diluted net income per share reflects the potential dilution that
could occur if stock options were exercised into common stock. Diluted
net income per share of common stock assumes full exercise of
outstanding stock options at the beginning of the fiscal year (or at the
time of issuance).
Cash dividends per share presented in the accompanying
consolidated statement of income are dividends applicable to the
respective fiscal years, including dividends to be paid after the end of
the fiscal year.
(u) Accounting Changes and Error CorrectionsIn December 2009, the ASBJ issued ASBJ Statement No. 24, “Accounting
Standard for Accounting Changes and Error Corrections,” and ASBJ
Guidance No. 24, “Guidance on Accounting Standard for Accounting
Changes and Error Corrections.”
Accounting treatments under this standard and guidance are
as follows:
66

as of the acquisition date and that would have affected the
measurement of the amounts recognized as of that date. Such
adjustments shall be recognized as if the accounting for the
business combination had been completed at the acquisition date.
◎ In the consolidated statement of income, “income before minority
interest” under the current accounting standard will be changed
to “net income” under the revised accounting standard, and “net
income” under the current accounting standard will be changed
to “net income attributable to owners of the parent” under the
revised accounting standard.
(2) Scheduled effective date
Beginning of fiscal year ending December 2016
(3) Effect of applying the revised standards
The effect of applying the revised standards on consolidated
financial statements is not determined.
4. Additional information(Accounting treatment of Branded Prescription Drug Fee levied on sales)In the U.S., the Group is subject to the Patient Protection and Affordable
Care Act enacted in 2010 and as such obligated to pay a so-called
Branded Prescription Drug Fee (“BPD Fee”), which is imposed on entities
engaged in the business of manufacturing branded prescription drugs.
On July 28, 2014, the U.S. Internal Revenue Service issued final
regulations for the BPD Fee which require a BPD Fee to be recognized
for an expense at the time of sales, as opposed to the previous
regulations, which required the BPD Fee recognized for an expense in
the current fiscal year to be based on sales in the preceding fiscal year.
As a result, an additional expense of ¥8,762 million (US$72,684
thousand) for the BPD Fee, which is based on the net sales in the
current fiscal year, was recognized in selling, general and administrative
expenses, and accordingly, the same amount has led to a reduction in
operating income and income before income taxes and minority
interests.
The effects on segment performance are stated in Note 25
“Segment information.”
5. Short-term investmentsShort-term investments as of December 31, 2014 and March 31, 2014
consisted of the following:
(1) Changes in accounting policies
When a new accounting policy is applied with revision of
accounting standards, a new policy is applied retrospectively,
unless the revised accounting standards include specific
transitional provisions. When the revised accounting standards
include specific transitional provisions, an entity shall comply
with the specific transitional provisions.
(2) Changes in presentation
When the presentation of financial statements is changed,
prior-period financial statements are reclassified in accordance
with the new presentation.
(3) Changes in accounting estimates
A change in an accounting estimate is accounted for in the
period of the change if the change affects that period only and
is accounted for prospectively if the change affects both the
period of the change and future periods.
(4) Corrections of prior-period errors
When an error in prior-period financial statements is found,
those statements are restated.
(v) Accounting Standards to be adopted(Accounting Standards for Business Combination)
On September 13, 2013, the ASBJ issued following revised statements
and guidance:
- “Accounting Standard for Business Combinations” (ASBJ Statement
No. 21)
- “Accounting Standard for Consolidated Financial Statements” (ASBJ
Statement No. 22)
- “Accounting Standard for Business Divestitures” (ASBJ Statement No. 7)
- “Accounting Standard for Net Income Per Share” (ASBJ Statement
No. 2)
- “Guidance on Accounting Standards for Business Combinations and
Business Divestitures” (ASBJ Guidance No. 10)
- “Guidance on Accounting Standard for Net Income Per Share” (ASBJ
Guidance No. 4)
(1) Overview
◎ Under the revised accounting standard, any difference between
the fair value of the consideration received or paid and the
amount by which the minority interest is adjusted shall be
accounted for as capital surplus as long as the parent retains
control over its subsidiary. In the consolidated balance sheet,
“minority interest” under the current accounting standard will be
changed to “noncontrolling interest” under the revised
accounting standard.
◎ Under the revised accounting standard, acquisition-related costs
shall be accounted for as expenses in the periods in which the
costs are incurred.
◎ Under the revised accounting standard guidance, during the
measurement period, which shall not exceed one year from the
acquisition, the acquirer shall retrospectively adjust the provisional
amounts recognized at the acquisition date to reflect new
information obtained about facts and circumstances that existed
Millions of Yen Thousands of U.S. Dollars
2014.12 2014.3 2014.12
Time deposits ¥70,199 ¥97,279 $582,323
Total ¥70,199 ¥97,279 $582,323
Notes to Consolidated Financial StatementsOtsuka Holdings Co., Ltd. and its Consolidated Subsidiaries
Otsuka-people creating new products for better health worldwide
67
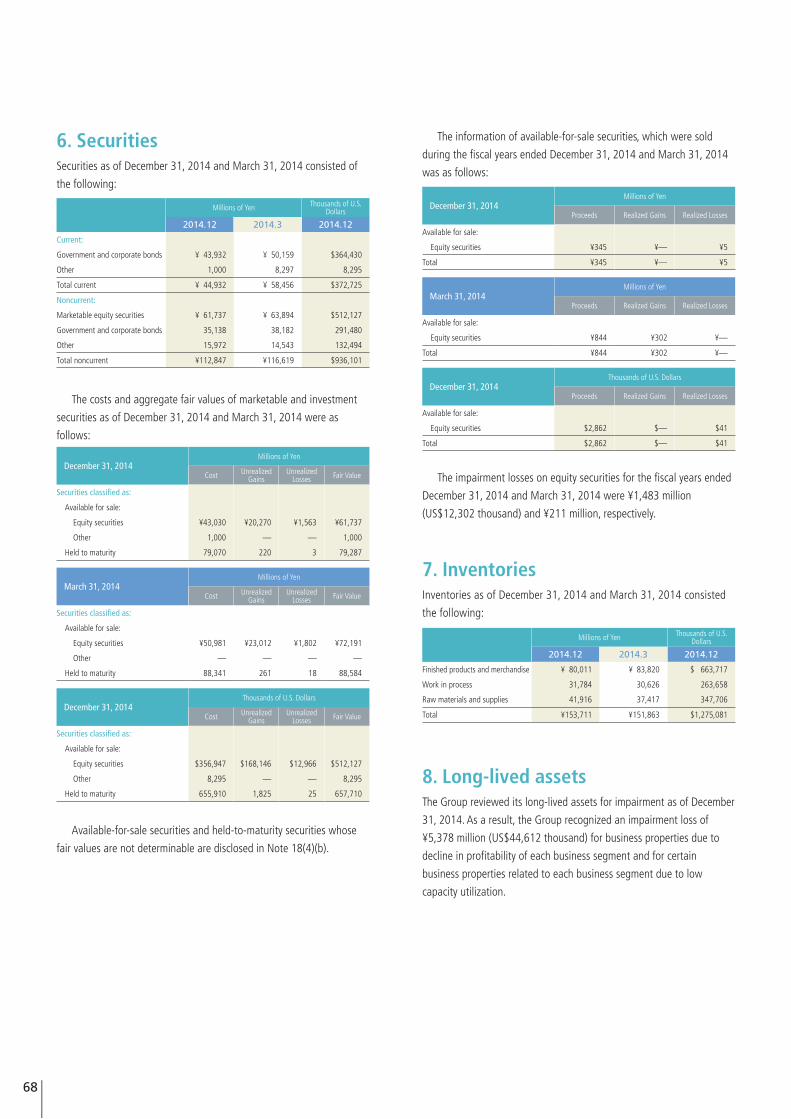
6. SecuritiesSecurities as of December 31, 2014 and March 31, 2014 consisted of
the following:
The costs and aggregate fair values of marketable and investment
securities as of December 31, 2014 and March 31, 2014 were as
follows:
Available-for-sale securities and held-to-maturity securities whose
fair values are not determinable are disclosed in Note 18(4)(b).
The information of available-for-sale securities, which were sold
during the fiscal years ended December 31, 2014 and March 31, 2014
was as follows:
The impairment losses on equity securities for the fiscal years ended
December 31, 2014 and March 31, 2014 were ¥1,483 million
(US$12,302 thousand) and ¥211 million, respectively.
7. InventoriesInventories as of December 31, 2014 and March 31, 2014 consisted
the following:
8. Long-lived assetsThe Group reviewed its long-lived assets for impairment as of December
31, 2014. As a result, the Group recognized an impairment loss of
¥5,378 million (US$44,612 thousand) for business properties due to
decline in profitability of each business segment and for certain
business properties related to each business segment due to low
capacity utilization.
December 31, 2014Millions of Yen
Proceeds Realized Gains Realized Losses
Available for sale:
Equity securities ¥345 ¥— ¥5
Total ¥345 ¥— ¥5
March 31, 2014Millions of Yen
Proceeds Realized Gains Realized Losses
Available for sale:
Equity securities ¥844 ¥302 ¥—
Total ¥844 ¥302 ¥—
December 31, 2014Thousands of U.S. Dollars
Proceeds Realized Gains Realized Losses
Available for sale:
Equity securities $2,862 $— $41
Total $2,862 $— $41
Millions of Yen Thousands of U.S. Dollars
2014.12 2014.3 2014.12
Current:
Government and corporate bonds ¥ 43,932 ¥ 50,159 $364,430
Other 1,000 8,297 8,295
Total current ¥ 44,932 ¥ 58,456 $372,725
Noncurrent:
Marketable equity securities ¥ 61,737 ¥ 63,894 $512,127
Government and corporate bonds 35,138 38,182 291,480
Other 15,972 14,543 132,494
Total noncurrent ¥112,847 ¥116,619 $936,101
March 31, 2014Millions of Yen
Cost Unrealized Gains
Unrealized Losses Fair Value
Securities classified as:
Available for sale:
Equity securities ¥50,981 ¥23,012 ¥1,802 ¥72,191
Other — — — —
Held to maturity 88,341 261 18 88,584
December 31, 2014Thousands of U.S. Dollars
Cost Unrealized Gains
Unrealized Losses Fair Value
Securities classified as:
Available for sale:
Equity securities $356,947 $168,146 $12,966 $512,127
Other 8,295 — — 8,295
Held to maturity 655,910 1,825 25 657,710
Millions of Yen Thousands of U.S. Dollars
2014.12 2014.3 2014.12
Finished products and merchandise ¥ 80,011 ¥ 83,820 $ 663,717
Work in process 31,784 30,626 263,658
Raw materials and supplies 41,916 37,417 347,706
Total ¥153,711 ¥151,863 $1,275,081
December 31, 2014Millions of Yen
Cost Unrealized Gains
Unrealized Losses Fair Value
Securities classified as:
Available for sale:
Equity securities ¥43,030 ¥20,270 ¥1,563 ¥61,737
Other 1,000 — — 1,000
Held to maturity 79,070 220 3 79,287
68

Long-term debt as of December 31, 2014 and March 31, 2014
consisted of the following:
Annual maturities of long-term debt as of December 31, 2014 were
as follows:
The carrying amounts of assets pledged as collateral for long-term
debt as of December 31, 2014 were as follows:
Impairment losses, which the Group recognized for the fiscal years
ended December 31, 2014 and March 31, 2014 were as follows:
The Group bases its grouping for assessing impairment losses on
its business segments. However, certain assets, such as idle assets,
are evaluated on an individual basis. The recoverable amounts in
each business segment were measured at their value in use with
discount rate, primarily 6.2%, or net selling price at disposition. The
recoverable amount of the impaired idle assets was measured at net
realizable value as determined based on the net selling price or on
real estate appraisals.
9. Short-term borrowings and long-term debt
Short-term borrowings as of December 31, 2014 and March 31, 2014
consisted of the following:
Pharmaceuticals:Millions of Yen Thousands of U.S.
Dollars
2014.12 2014.3 2014.12
Buildings and structures ¥1,179 ¥11 $ 9,780
Machinery and equipment 3,601 5 29,871
Other 116 17 963
Total ¥4,896 ¥33 $40,614
Nutraceuticals:Millions of Yen Thousands of U.S.
Dollars
2014.12 2014.3 2014.12
Intangible assets ¥ — ¥ 732 $ —
Buildings and structures 59 255 489
Machinery and equipment 111 1,811 921
Other 6 46 50
Total ¥176 ¥2,844 $1,460
Other:Millions of Yen Thousands of U.S.
Dollars
2014.12 2014.3 2014.12
Land ¥1 ¥8 $8
Total ¥1 ¥8 $8
Corporate:Millions of Yen Thousands of U.S.
Dollars
2014.12 2014.3 2014.12
Land ¥226 ¥55 $1,875
Total ¥226 ¥55 $1,875
Consumer products:Millions of Yen Thousands of U.S.
Dollars
2014.12 2014.3 2014.12
Buildings and structures ¥10 ¥126 $ 83
Machinery and equipment 44 300 365
Other 25 33 207
Total ¥79 ¥459 $655
Millions of Yen Thousands of U.S. Dollars
2014.12 2014.3 2014.12
Secured loans from banks and financial institutions
With a weighted-average interest rate of 1.5% (2014.3) ¥ — ¥ 164 $ —
Unsecured loans from banks and financial institutions
With a weighted-average interest rate of 1.2% (2014.12) and with a weighted-average interest rate of 1.3% (2014.3)
64,846 51,129 537,918
Total ¥64,846 ¥51,293 $537,918
Millions of Yen Thousands of U.S. Dollars
2014.12 2014.3 2014.12
Secured loans from banks and financial institutions
Due 2015 to 2022, with a weighted-average interest rate of 4.1% (2014.12) and due 2014 to 2022, with a weighted-average interest rate of 2.3% (2014.3)
¥ 2,158 ¥ 1,495 $ 17,901
Unsecured loans from banks and financial institutions
Due 2015 to 2021, with a weighted-average interest rate of 1.2% (2014.12) and due 2014 to 2021, with a weighted-average interest rate of 1.2% (2014.3)
25,426 14,920 210,917
Unsecured straight bonds by a consolidated subsidiary
Due 2015 to 2016, with a weighted-average interest rate of 0.8% (2014.12) and due 2014 to 2016, with a weighted-average interest rate of 0.8% (2014.3)
100 280 830
Unsecured lease liabilities 7,940 7,930 65,864
Total 35,624 24,625 295,512
Less-portion due within one year
Loans 5,332 2,133 42,231
Straight bonds 80 180 664
Lease liabilities 2,140 2,238 17,751
Long-term debt, less current portion ¥28,072 ¥20,074 $232,866
Fiscal years ending December 31 Millions of Yen Thousands of U.S. Dollars
2015 ¥ 7,552 $ 62,646
2016 5,458 45,276
2017 12,221 101,377
2018 5,486 45,508
2019 2,265 18,789
2020 and thereafter 2,642 21,916
Total ¥35,624 $295,512
Millions of Yen Thousands of U.S. Dollars
Cash and cash equivalents ¥ 1,284 $ 10,651
Receivables-trade accounts 1,148 9,523
Inventories 4,056 33,646
Other current assets 52 431
Property, plant and equipment - net of accumulated depreciation 10,432 86,527
Total ¥16,972 $140,788
Notes to Consolidated Financial StatementsOtsuka Holdings Co., Ltd. and its Consolidated Subsidiaries
Otsuka-people creating new products for better health worldwide
69

(3) Reconciliation between the liability (asset) recorded in the
consolidated balance sheet and the balances of defined benefit
obligation and plan assets as of December 31, 2014 and March 31,
2014 were as follows:
(4) The components of net periodic benefit costs for the fiscal years
ended December 31, 2014 and March 31, 2014 were as follows:
(5) Other comprehensive income before adjusting tax effects on defined
retirement benefit plans for the fiscal years ended December 31,
2014 and March 31, 2014 were as follows:
(6) Accumulated other comprehensive income before adjusting tax
effects on defined retirement benefit plans for the fiscal years ended
December 31, 2014 and March 31, 2014 were as follows:
10. Retirement and pension plansThe majority of domestic consolidated subsidiaries have defined benefit
pension plans held by jointly founded Otsuka Pharmaceuticals corporate
pension fund (a type of fund in multi-employer plans) and defined
contributory pension plans. The defined benefit pension plans consists
of contributory funded corporate pension plans and lump-sum
retirement payments plans.
Certain foreign consolidated subsidiaries have contributory funded
or unfunded defined benefit pension plans or defined contributory
pension plans, or a combination of them.
Defined benefit pension plan(1) The changes in defined benefit obligation for the fiscal years ended
December 31, 2014 and March 31, 2014 were as follows:
(2) The changes in plan assets for the fiscal years ended December 31,
2014 and March 31, 2014 were as follows:
Millions of Yen Thousands of U.S. Dollars
2014.12 2014.3 2014.12
Balance at beginning of fiscal year ¥198,159 ¥194,330 $1,643,791
Cumulative effect of changes in accounting policies 8,319 — 69,009
Balance after cumulative effect 206,478 194,330 1,712,800
Current service cost 5,504 7,462 45,657
Interest cost 2,955 3,616 24,513
Actuarial gains 14,696 (3,312) 121,908
Benefits paid (7,498) (8,633) (62,198)
Change in scope of consolidation 154 1,501 1,277
Foreign currency translation adjustment 2,966 2,962 24,604
Others 182 233 1,510
Balance at end of fiscal year ¥225,437 ¥198,159 $1,870,071
Millions of Yen Thousands of U.S. Dollars
2014.12 2014.3 2014.12
Balance at beginning of fiscal year ¥201,142 ¥171,107 $1,668,536
Expected return on plan assets 4,330 4,779 35,919
Actuarial gains 18,777 12,462 155,761
Contributions from the employer 13,034 17,467 108,121
Benefits paid (7,275) (7,729) (60,348)
Change in scope of consolidation — 1,232 —
Foreign currency translation adjustment 2,058 1,796 17,072
Others (65) 27 (539)
Balance at end of fiscal year ¥232,001 ¥201,141 $1,924,522
Millions of Yen Thousands of U.S. Dollars
2014.12 2014.3 2014.12
Service cost ¥ 5,504 ¥ 7,462 $ 45,657
Interest cost 2,955 3,616 24,513
Expected return on plan assets (4,330) (4,779) (35,919)
Amortization of prior service cost (2,905) (3,049) (24,098)
Recognized actuarial losses (2,270) 524 (18,830)
Amortization of transitional obligation 11 15 91
Extra retirement payments 244 240 2,024
Net periodic benefit costs ¥ (791) ¥ 4,029 $ (6,562)
Millions of Yen Thousands of U.S. Dollars
2014.12 2014.3 2014.12
Prior service cost ¥ 739 ¥— $ 6,130
Actuarial losses (2,272) — (18,847)
Transitional obligation 11 — 91
Total ¥(1,522) ¥— $(12,626)
Millions of Yen Thousands of U.S. Dollars
2014.12 2014.3 2014.12
Unrecognized prior service cost ¥ 9,488 ¥12,098 $ 78,706
Unrecognized actuarial losses 19,583 18,624 162,447
Unrecognized transitional obligation (33) (44) (274)
Total ¥29,038 ¥30,678 $240,879
Millions of Yen Thousands of U.S. Dollars
2014.12 2014.3 2014.12
Funded defined benefit obligation ¥222,260 ¥195,587 $1,843,716
Plan assets (232,001) (201,141) (1,924,522)
(9,741) (5,554) (80,806)
Unfunded defined benefit obligation 3,177 2,572 26,355
Net asset arising from defined benefit obligation (6,564) (2,982) (54,451)
Net defined benefit liability 10,922 8,131 90,601
Net defined benefit asset (17,486) (11,113) (145,052)
Net asset arising from defined benefit obligation ¥ (6,564) ¥ (2,982) $ (54,451)
70
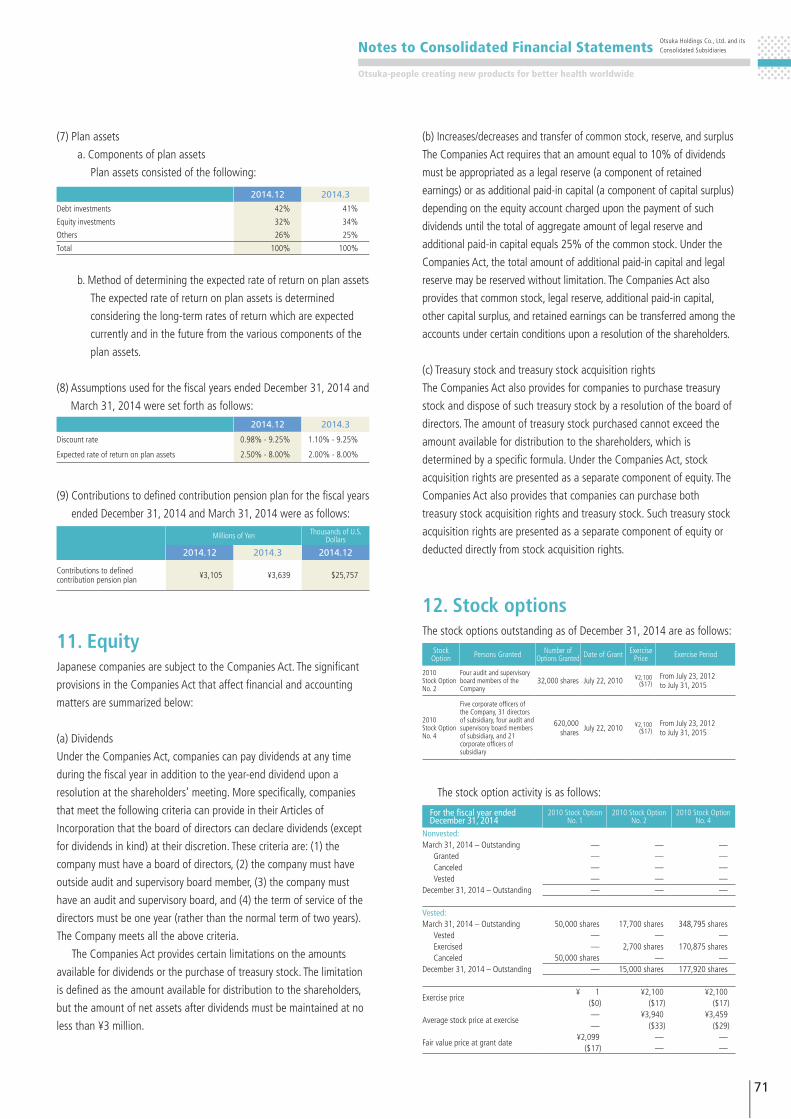
(7) Plan assets
a. Components of plan assets
Plan assets consisted of the following:
b. Method of determining the expected rate of return on plan assets
The expected rate of return on plan assets is determined
considering the long-term rates of return which are expected
currently and in the future from the various components of the
plan assets.
(8) Assumptions used for the fiscal years ended December 31, 2014 and
March 31, 2014 were set forth as follows:
(9) Contributions to defined contribution pension plan for the fiscal years
ended December 31, 2014 and March 31, 2014 were as follows:
11. EquityJapanese companies are subject to the Companies Act. The significant
provisions in the Companies Act that affect financial and accounting
matters are summarized below:
(a) Dividends
Under the Companies Act, companies can pay dividends at any time
during the fiscal year in addition to the year-end dividend upon a
resolution at the shareholders’ meeting. More specifically, companies
that meet the following criteria can provide in their Articles of
Incorporation that the board of directors can declare dividends (except
for dividends in kind) at their discretion. These criteria are: (1) the
company must have a board of directors, (2) the company must have
outside audit and supervisory board member, (3) the company must
have an audit and supervisory board, and (4) the term of service of the
directors must be one year (rather than the normal term of two years).
The Company meets all the above criteria.
The Companies Act provides certain limitations on the amounts
available for dividends or the purchase of treasury stock. The limitation
is defined as the amount available for distribution to the shareholders,
but the amount of net assets after dividends must be maintained at no
less than ¥3 million.
(b) Increases/decreases and transfer of common stock, reserve, and surplus
The Companies Act requires that an amount equal to 10% of dividends
must be appropriated as a legal reserve (a component of retained
earnings) or as additional paid-in capital (a component of capital surplus)
depending on the equity account charged upon the payment of such
dividends until the total of aggregate amount of legal reserve and
additional paid-in capital equals 25% of the common stock. Under the
Companies Act, the total amount of additional paid-in capital and legal
reserve may be reserved without limitation. The Companies Act also
provides that common stock, legal reserve, additional paid-in capital,
other capital surplus, and retained earnings can be transferred among the
accounts under certain conditions upon a resolution of the shareholders.
(c) Treasury stock and treasury stock acquisition rights
The Companies Act also provides for companies to purchase treasury
stock and dispose of such treasury stock by a resolution of the board of
directors. The amount of treasury stock purchased cannot exceed the
amount available for distribution to the shareholders, which is
determined by a specific formula. Under the Companies Act, stock
acquisition rights are presented as a separate component of equity. The
Companies Act also provides that companies can purchase both
treasury stock acquisition rights and treasury stock. Such treasury stock
acquisition rights are presented as a separate component of equity or
deducted directly from stock acquisition rights.
12. Stock optionsThe stock options outstanding as of December 31, 2014 are as follows:
The stock option activity is as follows:
2014.12 2014.3
Debt investments 42% 41%
Equity investments 32% 34%
Others 26% 25%
Total 100% 100%
2014.12 2014.3
Discount rate 0.98% - 9.25% 1.10% - 9.25%
Expected rate of return on plan assets 2.50% - 8.00% 2.00% - 8.00%
Millions of Yen Thousands of U.S. Dollars
2014.12 2014.3 2014.12
Contributions to defined contribution pension plan ¥3,105 ¥3,639 $25,757
Stock Option Persons Granted Number of
Options Granted Date of Grant Exercise Price Exercise Period
2010 Stock Option No. 2
Four audit and supervisory board members of the Company
32,000 shares July 22, 2010 ¥2,100 From July 23, 2012to July 31, 2015($17)
2010 Stock Option No. 4
Five corporate officers of the Company, 31 directorsof subsidiary, four audit andsupervisory board members of subsidiary, and 21corporate officers of subsidiary
620,000 shares
July 22, 2010 ¥2,100 From July 23, 2012to July 31, 2015($17)
For the fiscal year ended December 31, 2014
2010 Stock Option No. 1
2010 Stock Option No. 2
2010 Stock Option No. 4
Nonvested:March 31, 2014 – Outstanding — — —
Granted — — —Canceled — — —Vested — — —
December 31, 2014 – Outstanding — — —
Vested:March 31, 2014 – Outstanding 50,000 shares 17,700 shares 348,795 shares
Vested — — —Exercised — 2,700 shares 170,875 sharesCanceled 50,000 shares — —
December 31, 2014 – Outstanding — 15,000 shares 177,920 shares
Exercise price¥ 1 ¥2,100 ¥2,100
($0) ($17) ($17)
Average stock price at exercise— ¥3,940 ¥3,459— ($33) ($29)
Fair value price at grant date¥2,099 — —
($17) — —
Notes to Consolidated Financial StatementsOtsuka Holdings Co., Ltd. and its Consolidated Subsidiaries
Otsuka-people creating new products for better health worldwide
71

The assumptions used to measure the fair value of 2010 stock optionsAs the Company was a privately held company as of the grant date, the
fair value of options at grant date is equal to the intrinsic value of the
options at grant date.
The assumptions used to measure the number of vested stock optionsThe Company uses only the actual cancellations due to the difficulty in
determining reasonable estimates about the number of future
cancellations.
Information regarding intrinsic value:1) The total intrinsic value of the stock options for the fiscal years ended
December 31, 2014 and March 31, 2014 was ¥293 million
(US$2,431 thousand) and ¥516 million, respectively.
2) The total intrinsic value of the stock option rights on the exercise
date for the fiscal years ended December 31, 2014 and March 31,
2014 was ¥286 million (US$2,372 thousand) and ¥151 million,
respectively.
13. Income taxesThe Company and its domestic subsidiaries are subject to Japanese
national and local income taxes which, in aggregate, resulted in normal
effective statutory tax rates of approximately 35.6% and 38.0% for the
fiscal years ended December 31, 2014 and March 31, 2014 respectively.
Foreign consolidated subsidiaries are subject to income taxes in the
countries in which they operate.
The tax effects of significant temporary differences and tax loss
carryforwards, which resulted in deferred tax assets and liabilities, as of
December 31, 2014 and March 31, 2014 were as follows:
A reconciliation between the normal effective statutory tax rates and
the actual effective tax rates reflected in the accompanying consolidated
financial statement of income for the fiscal years ended December 31,
2014 and March 31, 2014 were as follows:
Change in presentation method
“Branded Prescription Drug Fee” which was included in “other” has
been separately disclosed due to the materiality of its amount. To
reflect this change, the amount in “Reconciliation between the statutory
tax rate and the actual effective tax rate” for last fiscal year has
been reclassified.
As a result, 1.5% in “Other” last fiscal year has been reclassified
to 0.7% in “Branded Prescription Drug Fee” and 0.8% in
“Other,” respectively.
As of December 31, 2014, certain consolidated subsidiaries had tax
loss carryforwards aggregating ¥28,556 million (US$236,881 thousand)
which are available to be offset against taxable income of such
subsidiaries in future fiscal years. These tax loss carryforwards, if not
utilized, will expire as follows:
14. Up-front licensing payments received
Net sales recognized as revenue from the up-front licensing payments
received for the fiscal years ended December 31, 2014 and March 31,
2014 were as follows:
2014.12 2014.3
Normal effective statutory tax rate 35.6% 38.0%
Tax credit for research and development expenses (8.6) (15.2)
Reduction of ending deferred tax balance due to change in statutory tax rate — 0.8
Expenses not deductible for income tax purposes 0.6 1.2
Valuation allowance 0.3 1.2
Difference in statutory tax rate of subsidiaries (0.4) 0.0
Equity in earnings of affiliated companies (0.3) (0.1)
Branded Prescription Drug Fee 2.5 0.7
Other – net 1.7 0.8
Actual effective tax rate 31.4% 27.4%
Millions of Yen Thousands of U.S. Dollars
2014.12 2014.3 2014.12
Up-front licensing payments received ¥20,368 ¥21,972 $168,959
Fiscal years ending December 31 Millions of Yen Thousands of U.S. Dollars
2015 ¥ 1,250 $ 10,369
2016 835 6,927
2017 2,002 16,607
2018 2,652 21,999
2019 and thereafter 21,817 180,979
Total ¥28,556 $236,881
Millions of Yen Thousands of U.S. Dollars
2014.12 2014.3 2014.12Deferred tax assets:
Net defined benefit liability ¥ 3,786 ¥ 2,745 $ 31,406Unrealized intercompany profits from inventories 18,362 24,570 152,319
Accrued expenses 8,997 12,329 74,633 Accrued enterprise tax 1,250 4,473 10,369 Tax loss carryforwards 28,556 29,451 236,881 Research and development expenses 44,896 34,943 372,426Loss on devaluation of investment securities 4,557 3,921 37,802 Loss on impairment of long-lived assets 5,314 3,920 44,081 Long-term unearned revenue 4,395 11,639 36,458 Other 11,015 9,170 91,373 Less valuation allowance (33,629) (30,976) (278,963)
Total deferred tax assets 97,499 106,185 808,785Deferred tax liabilities:
Unrealized gain on available-for-sale securities 7,096 7,542 58,864
Net defined benefit asset 6,240 3,964 51,763
Unrealized gain on full revaluation resulting from inclusion of consolidated subsidiaries
27,265 26,643 226,172
Revaluation of brands 3,963 4,245 32,874 Other 11,703 9,099 97,080
Total deferred tax liabilities 56,267 51,493 466,753Net deferred tax assets ¥41,232 ¥ 54,692 $342,032
72
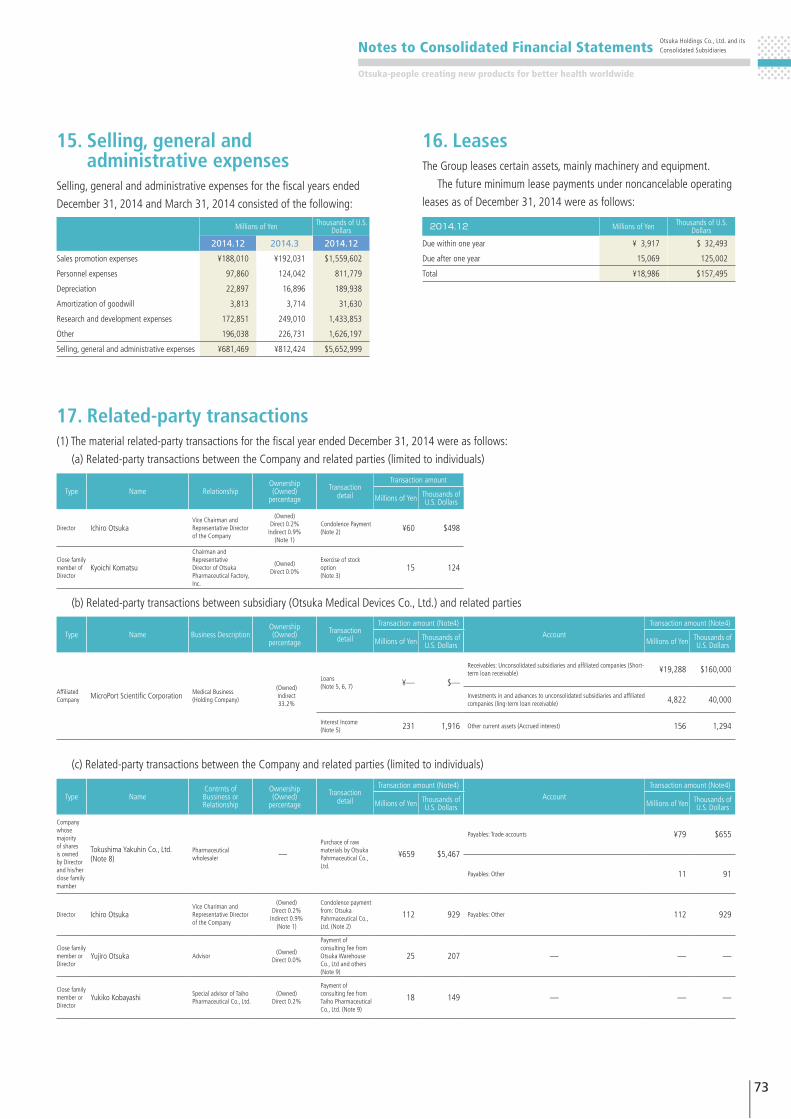
17. Related-party transactions(1) The material related-party transactions for the fiscal year ended December 31, 2014 were as follows:
(a) Related-party transactions between the Company and related parties (limited to individuals)
(b) Related-party transactions between subsidiary (Otsuka Medical Devices Co., Ltd.) and related parties
(c) Related-party transactions between the Company and related parties (limited to individuals)
15. Selling, general and administrative expenses
Selling, general and administrative expenses for the fiscal years ended
December 31, 2014 and March 31, 2014 consisted of the following:
16. LeasesThe Group leases certain assets, mainly machinery and equipment.
The future minimum lease payments under noncancelable operating
leases as of December 31, 2014 were as follows:
2014.12 Millions of Yen Thousands of U.S. Dollars
Due within one year ¥ 3,917 $ 32,493
Due after one year 15,069 125,002
Total ¥18,986 $157,495
Type Name Business DescriptionOwnership (Owned)
percentage
Transaction detail
Transaction amount (Note4)Account
Transaction amount (Note4)
Millions of Yen Thousands of U.S. Dollars Millions of Yen Thousands of
U.S. Dollars
Affiliated Company MicroPort Scientific Corporation Medical Business
(Holding Company)
(Owned)Indirect33.2%
Loans (Note 5, 6, 7) ¥— $—
Receivables: Unconsolidated subsidiaries and affiliated companies (Short-term loan receivable) ¥19,288 $160,000
Investments in and advances to unconsolidated subsidiaries and affiliated companies (ling-term loan receivable) 4,822 40,000
Interest Income (Note 5) 231 1,916 Other current assets (Accrued interest) 156 1,294
Type NameContrnts of Bussiness or Relationship
Ownership (Owned)
percentage
Transaction detail
Transaction amount (Note4)Account
Transaction amount (Note4)
Millions of Yen Thousands of U.S. Dollars Millions of Yen Thousands of
U.S. Dollars
Company whose majority of shares is owned by Director and his/her close family mamber
Tokushima Yakuhin Co., Ltd.(Note 8)
Pharmaceutical wholesaler —
Purchace of raw materials by Otsuka Pahrmaceutical Co., Ltd.
¥659 $5,467
Payables: Trade accounts ¥79 $655
Payables: Other 11 91
Director Ichiro OtsukaVice Chariman and Representative Director of the Company
(Owned)Direct 0.2%
Indirect 0.9%(Note 1)
Condolence payment from: Otsuka Pahrmaceutical Co., Ltd. (Note 2)
112 929 Payables: Other 112 929
Close family member or Director
Yujiro Otsuka Advisor(Owned)
Direct 0.0%
Payment of consulting fee from Otsuka Warehouse Co., Ltd and others (Note 9)
25 207 — — —
Close family member or Director
Yukiko Kobayashi Special advisor of Taiho Pharmaceutical Co., Ltd.
(Owned)Direct 0.2%
Payment of consulting fee from Taiho Pharmaceutical Co., Ltd. (Note 9)
18 149 — — —
Millions of Yen Thousands of U.S. Dollars
2014.12 2014.3 2014.12
Sales promotion expenses ¥188,010 ¥192,031 $1,559,602
Personnel expenses 97,860 124,042 811,779
Depreciation 22,897 16,896 189,938
Amortization of goodwill 3,813 3,714 31,630
Research and development expenses 172,851 249,010 1,433,853
Other 196,038 226,731 1,626,197
Selling, general and administrative expenses ¥681,469 ¥812,424 $5,652,999
Type Name RelationshipOwnership (Owned)
percentage
Transaction detail
Transaction amount
Millions of Yen Thousands of U.S. Dollars
Director Ichiro OtsukaVice Chairman and Representative Director of the Company
(Owned)Direct 0.2%
Indirect 0.9%(Note 1)
Condolence Payment(Note 2) ¥60 $498
Close family member of Director
Kyoichi Komatsu
Chairman and Representative Director of Otsuka Pharmaceutical Factory, Inc.
(Owned)Direct 0.0%
Exercise of stock option(Note 3)
15 124
Notes to Consolidated Financial StatementsOtsuka Holdings Co., Ltd. and its Consolidated Subsidiaries
Otsuka-people creating new products for better health worldwide
73
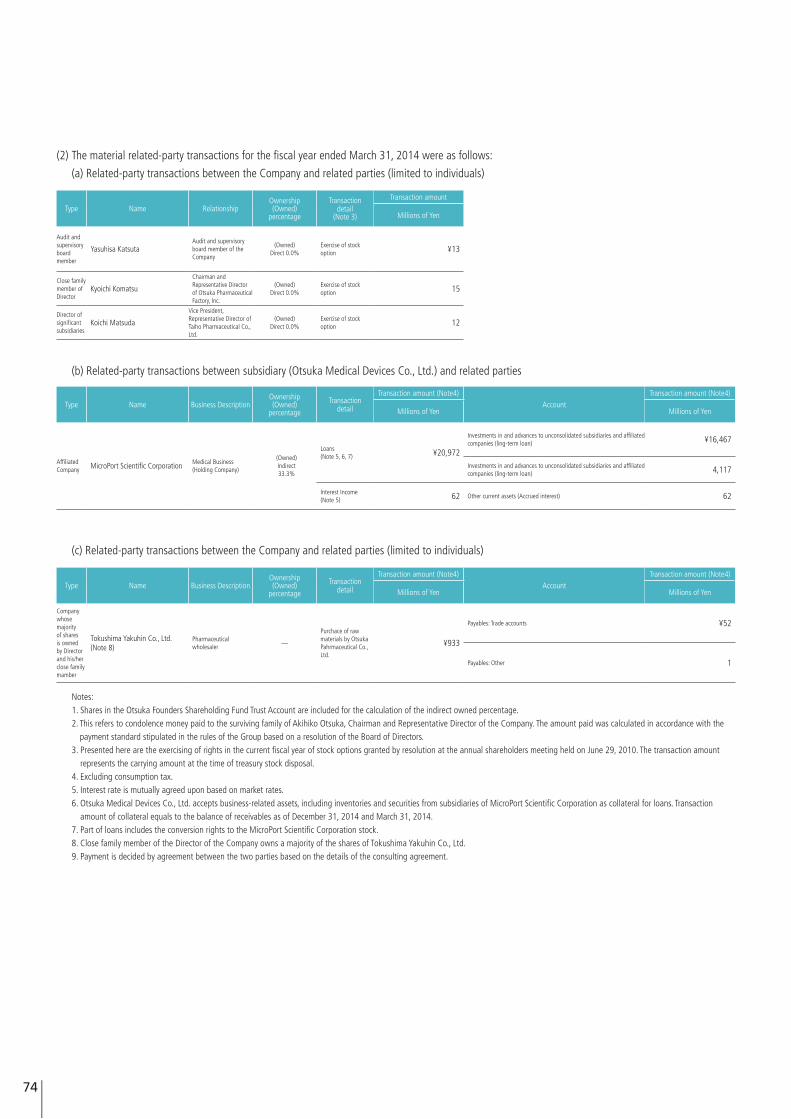
(2) The material related-party transactions for the fiscal year ended March 31, 2014 were as follows:
(a) Related-party transactions between the Company and related parties (limited to individuals)
(b) Related-party transactions between subsidiary (Otsuka Medical Devices Co., Ltd.) and related parties
(c) Related-party transactions between the Company and related parties (limited to individuals)
Type Name RelationshipOwnership (Owned)
percentage
Transaction detail
(Note 3)
Transaction amount
Millions of Yen
Audit and supervisory board member
Yasuhisa KatsutaAudit and supervisory board member of the Company
(Owned)Direct 0.0%
Exercise of stock option ¥13
Close family member of Director
Kyoichi Komatsu
Chairman and Representative Director of Otsuka Pharmaceutical Factory, Inc.
(Owned)Direct 0.0%
Exercise of stock option 15
Director of significant subsidiaries
Koichi Matsuda
Vice President, Representative Director of Taiho Pharmaceutical Co., Ltd.
(Owned)Direct 0.0%
Exercise of stock option 12
Type Name Business DescriptionOwnership (Owned)
percentage
Transaction detail
Transaction amount (Note4)Account
Transaction amount (Note4)
Millions of Yen Millions of Yen
Affiliated Company MicroPort Scientific Corporation Medical Business
(Holding Company)
(Owned)Indirect33.3%
Loans (Note 5, 6, 7) ¥20,972
Investments in and advances to unconsolidated subsidiaries and affiliated companies (ling-term loan) ¥16,467
Investments in and advances to unconsolidated subsidiaries and affiliated companies (ling-term loan) 4,117
Interest Income (Note 5) 62 Other current assets (Accrued interest) 62
Type Name Business DescriptionOwnership (Owned)
percentage
Transaction detail
Transaction amount (Note4)Account
Transaction amount (Note4)
Millions of Yen Millions of Yen
Company whose majority of shares is owned by Director and his/her close family mamber
Tokushima Yakuhin Co., Ltd.(Note 8)
Pharmaceutical wholesaler —
Purchace of raw materials by Otsuka Pahrmaceutical Co., Ltd.
¥933
Payables: Trade accounts ¥52
Payables: Other 1
Notes:1. Shares in the Otsuka Founders Shareholding Fund Trust Account are included for the calculation of the indirect owned percentage.2. This refers to condolence money paid to the surviving family of Akihiko Otsuka, Chairman and Representative Director of the Company. The amount paid was calculated in accordance with the
payment standard stipulated in the rules of the Group based on a resolution of the Board of Directors.3. Presented here are the exercising of rights in the current fiscal year of stock options granted by resolution at the annual shareholders meeting held on June 29, 2010. The transaction amount
represents the carrying amount at the time of treasury stock disposal.4. Excluding consumption tax.5. Interest rate is mutually agreed upon based on market rates.6. Otsuka Medical Devices Co., Ltd. accepts business-related assets, including inventories and securities from subsidiaries of MicroPort Scientific Corporation as collateral for loans. Transaction
amount of collateral equals to the balance of receivables as of December 31, 2014 and March 31, 2014.7. Part of loans includes the conversion rights to the MicroPort Scientific Corporation stock.8. Close family member of the Director of the Company owns a majority of the shares of Tokushima Yakuhin Co., Ltd.9. Payment is decided by agreement between the two parties based on the details of the consulting agreement.
74
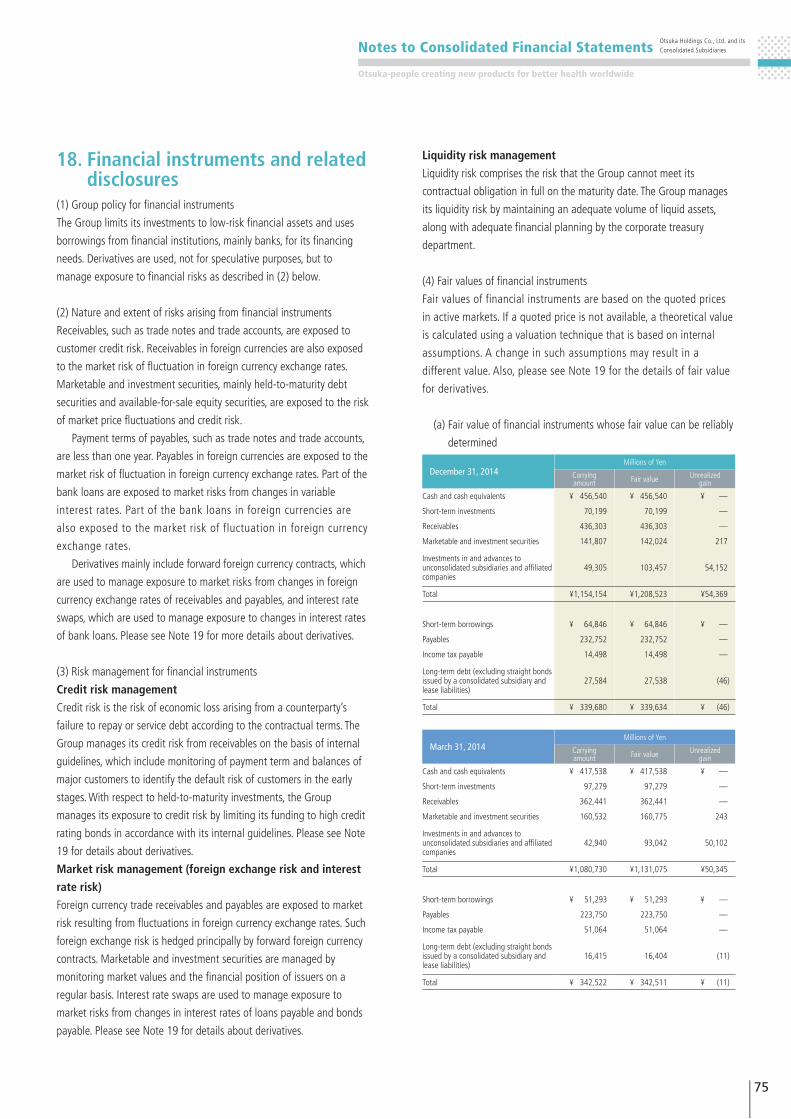
18. Financial instruments and related disclosures
(1) Group policy for financial instruments
The Group limits its investments to low-risk financial assets and uses
borrowings from financial institutions, mainly banks, for its financing
needs. Derivatives are used, not for speculative purposes, but to
manage exposure to financial risks as described in (2) below.
(2) Nature and extent of risks arising from financial instruments
Receivables, such as trade notes and trade accounts, are exposed to
customer credit risk. Receivables in foreign currencies are also exposed
to the market risk of fluctuation in foreign currency exchange rates.
Marketable and investment securities, mainly held-to-maturity debt
securities and available-for-sale equity securities, are exposed to the risk
of market price fluctuations and credit risk.
Payment terms of payables, such as trade notes and trade accounts,
are less than one year. Payables in foreign currencies are exposed to the
market risk of fluctuation in foreign currency exchange rates. Part of the
bank loans are exposed to market risks from changes in variable
interest rates. Part of the bank loans in foreign currencies are
also exposed to the market risk of fluctuation in foreign currency
exchange rates.
Derivatives mainly include forward foreign currency contracts, which
are used to manage exposure to market risks from changes in foreign
currency exchange rates of receivables and payables, and interest rate
swaps, which are used to manage exposure to changes in interest rates
of bank loans. Please see Note 19 for more details about derivatives.
(3) Risk management for financial instruments
Credit risk management
Credit risk is the risk of economic loss arising from a counterparty’s
failure to repay or service debt according to the contractual terms. The
Group manages its credit risk from receivables on the basis of internal
guidelines, which include monitoring of payment term and balances of
major customers to identify the default risk of customers in the early
stages. With respect to held-to-maturity investments, the Group
manages its exposure to credit risk by limiting its funding to high credit
rating bonds in accordance with its internal guidelines. Please see Note
19 for details about derivatives.
Market risk management (foreign exchange risk and interest
rate risk)
Foreign currency trade receivables and payables are exposed to market
risk resulting from fluctuations in foreign currency exchange rates. Such
foreign exchange risk is hedged principally by forward foreign currency
contracts. Marketable and investment securities are managed by
monitoring market values and the financial position of issuers on a
regular basis. Interest rate swaps are used to manage exposure to
market risks from changes in interest rates of loans payable and bonds
payable. Please see Note 19 for details about derivatives.
Liquidity risk management
Liquidity risk comprises the risk that the Group cannot meet its
contractual obligation in full on the maturity date. The Group manages
its liquidity risk by maintaining an adequate volume of liquid assets,
along with adequate financial planning by the corporate treasury
department.
(4) Fair values of financial instruments
Fair values of financial instruments are based on the quoted prices
in active markets. If a quoted price is not available, a theoretical value
is calculated using a valuation technique that is based on internal
assumptions. A change in such assumptions may result in a
different value. Also, please see Note 19 for the details of fair value
for derivatives.
(a) Fair value of financial instruments whose fair value can be reliably
determined
December 31, 2014Millions of Yen
Carryingamount Fair value Unrealized
gain
Cash and cash equivalents ¥ 456,540 ¥ 456,540 ¥ —
Short-term investments 70,199 70,199 —
Receivables 436,303 436,303 —
Marketable and investment securities 141,807 142,024 217
Investments in and advances to unconsolidated subsidiaries and affiliated companies
49,305 103,457 54,152
Total ¥1,154,154 ¥1,208,523 ¥54,369
Short-term borrowings ¥ 64,846 ¥ 64,846 ¥ —
Payables 232,752 232,752 —
Income tax payable 14,498 14,498 —
Long-term debt (excluding straight bonds issued by a consolidated subsidiary and lease liabilities)
27,584 27,538 (46)
Total ¥ 339,680 ¥ 339,634 ¥ (46)
March 31, 2014Millions of Yen
Carryingamount Fair value Unrealized
gain
Cash and cash equivalents ¥ 417,538 ¥ 417,538 ¥ —
Short-term investments 97,279 97,279 —
Receivables 362,441 362,441 —
Marketable and investment securities 160,532 160,775 243
Investments in and advances to unconsolidated subsidiaries and affiliated companies
42,940 93,042 50,102
Total ¥1,080,730 ¥1,131,075 ¥50,345
Short-term borrowings ¥ 51,293 ¥ 51,293 ¥ —
Payables 223,750 223,750 —
Income tax payable 51,064 51,064 —
Long-term debt (excluding straight bonds issued by a consolidated subsidiary and lease liabilities)
16,415 16,404 (11)
Total ¥ 342,522 ¥ 342,511 ¥ (11)
Notes to Consolidated Financial StatementsOtsuka Holdings Co., Ltd. and its Consolidated Subsidiaries
Otsuka-people creating new products for better health worldwide
75

Cash and cash equivalents, short-term investments,
and receivables
The carrying values of cash and cash equivalents, short-term
investments, and receivables approximate fair value because of their
short maturities.
Marketable and investment securities and investments
in and advances to unconsolidated subsidiaries and
affiliated companies
The fair values of marketable and investment securities are measured
at the quoted market price of the stock exchange for the equity
instruments and at the quoted price obtained from the financial
institution for certain debt instruments. The information regarding the
fair value for the marketable and investment securities by
classification is included in Note 6.
Payables, short-term borrowings, and income tax payable
The carrying values of payables, short-term borrowings, and income
tax payable approximate fair value because of their short maturities.
Long-term debt (including current portion of long-term debt)
The fair value of long-term debt is determined by discounting the
principal and interest payments at the refinancing rate.
Derivatives
The information of the fair value for derivatives is included in
Note 19.
(b) Financial instruments whose fair values cannot be reliably
determined
(c) Maturity analysis for financial assets and securities with
contractual maturities
Please see Note 9 for annual maturities of long-term debt,
obligations under finance leases and straight bonds.
19. DerivativesThe Group enters into foreign currency forward contracts to hedge
foreign exchange risk associated with certain assets and liabilities
denominated in foreign currencies. The Group also enters into foreign
currency option contracts (zero-cost options) to obtain U.S. dollars for
the payment of foreign currency payables. The Group also enters into
interest rate swap contracts to manage its interest rate exposures on
certain debts.
All derivative transactions are entered into hedge interest and
foreign currency exposures incorporated within actual demand of
the Group’s business. Accordingly, market risk in these derivatives is
basically offset by opposite movements in the value of hedged assets
or liabilities.
Because the counterparties to these derivatives are limited to major
international financial institutions, the Group does not anticipate any
losses arising from credit risk.
Derivative transactions entered into by the Group have been made
in accordance with internal policies, which regulate the authorization
and credit limit amount.
Millions of Yen Thousands of U.S. Dollars
Carrying amount
2014.12 2014.3 2014.12Investments in and advances to unconsolidated subsidiaries and affiliated companies
¥156,709 ¥149,882 $1,299,950
Investment securities 15,972 14,543 132,494
December 31, 2014
Millions of Yen
Due in oneyear or less
Due after oneyear through
five years
Due after five years through
10 years
Due after10 years
Cash and cash equivalents ¥ 456,540 ¥ — ¥ — ¥—
Short-term investments 70,199 — — —
Receivables 436,027 264 11 1
Marketable and investment securities:
Held-to-maturity securities 43,934 33,650 1,500 —
Available-for-sales securities 1,000 — — —
Total ¥1,007,700 ¥33,914 ¥1,511 ¥ 1
December 31, 2014
Thousands of U.S. Dollars
Due in oneyear or less
Due after oneyear through
five years
Due after five years through
10 years
Due after10 years
Cash and cash equivalents $3,787,142 $ — $ — $—
Short-term investments 582,323 — — —
Receivables 3,616,980 2,190 91 8
Marketable and investment securities:
Held-to-maturity securities 364,446 279,137 12,443 —
Available-for-sales securities 8,295 — — —
Total $8,359,186 $281,327 $12,534 $ 8
December 31, 2014Thousands of U.S. Dollars
Carryingamount Fair value Unrealized
gain
Cash and cash equivalents $3,787,142 $ 3,787,142 $ —
Short-term investments 582,323 582,323 —
Receivables 3,619,269 3,619,269 —
Marketable and investment securities 1,176,332 1,178,133 1,801
Investments in and advances to unconsolidated subsidiaries and affiliated companies
409,001 858,209 449,208
Total $9,574,067 $10,025,076 $451,009
Short-term borrowings $ 537,918 $ 537,918 $ —
Payables 1,930,750 1,930,750 —
Income tax payable 120,265 120,265 —
Long-term debt (excluding straight bonds issued by a consolidated subsidiary and lease liabilities)
228,818 228,436 (382)
Total $2,817,751 $ 2,817,369 $ (382)
76
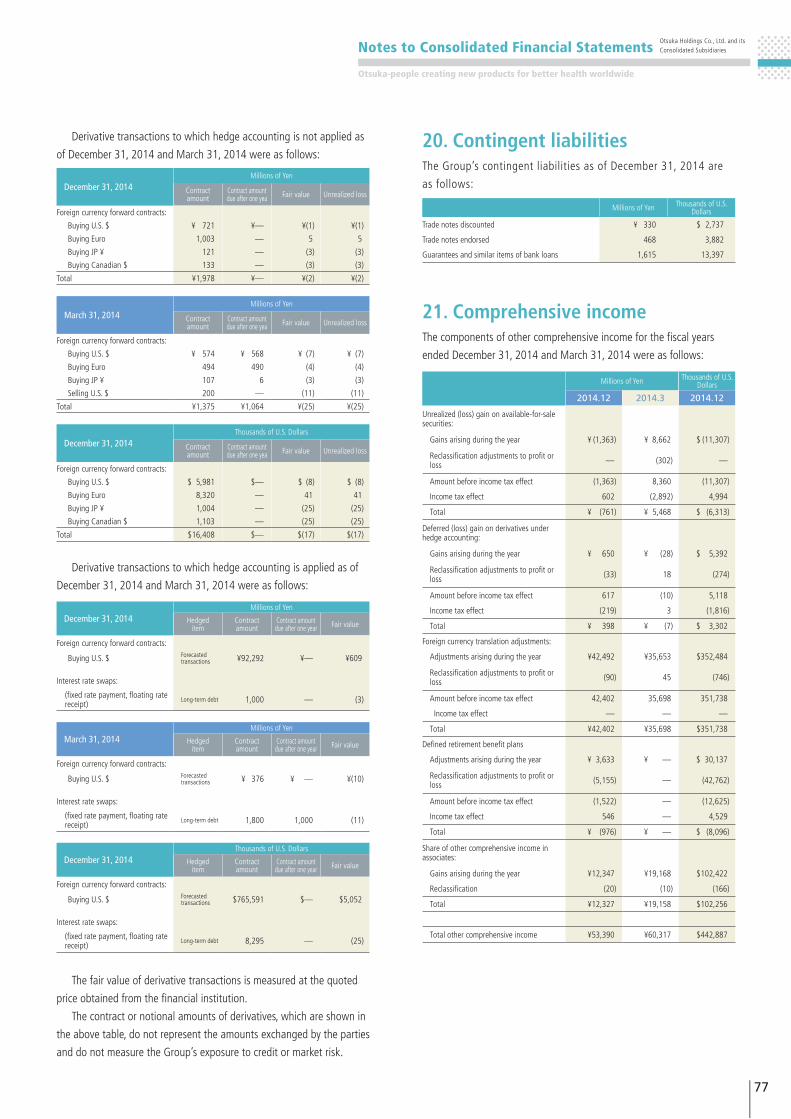
20. Contingent liabilitiesThe Group’s contingent liabilities as of December 31, 2014 are
as follows:
21. Comprehensive incomeThe components of other comprehensive income for the fiscal years
ended December 31, 2014 and March 31, 2014 were as follows:
Derivative transactions to which hedge accounting is not applied as
of December 31, 2014 and March 31, 2014 were as follows:
Derivative transactions to which hedge accounting is applied as of
December 31, 2014 and March 31, 2014 were as follows:
The fair value of derivative transactions is measured at the quoted
price obtained from the financial institution.
The contract or notional amounts of derivatives, which are shown in
the above table, do not represent the amounts exchanged by the parties
and do not measure the Group’s exposure to credit or market risk.
December 31, 2014Millions of Yen
Contract amount
Contract amount due after one yea Fair value Unrealized loss
Foreign currency forward contracts:
Buying U.S. $ ¥ 721 ¥— ¥(1) ¥(1)
Buying Euro 1,003 — 5 5
Buying JP ¥ 121 — (3) (3)
Buying Canadian $ 133 — (3) (3)
Total ¥1,978 ¥— ¥(2) ¥(2)
December 31, 2014Thousands of U.S. Dollars
Contract amount
Contract amount due after one yea Fair value Unrealized loss
Foreign currency forward contracts:
Buying U.S. $ $ 5,981 $— $ (8) $ (8)
Buying Euro 8,320 — 41 41
Buying JP ¥ 1,004 — (25) (25)
Buying Canadian $ 1,103 — (25) (25)
Total $16,408 $— $(17) $(17)
March 31, 2014Millions of Yen
Contract amount
Contract amount due after one yea Fair value Unrealized loss
Foreign currency forward contracts:
Buying U.S. $ ¥ 574 ¥ 568 ¥ (7) ¥ (7)
Buying Euro 494 490 (4) (4)
Buying JP ¥ 107 6 (3) (3)
Selling U.S. $ 200 — (11) (11)
Total ¥1,375 ¥1,064 ¥(25) ¥(25)
Millions of Yen Thousands of U.S. Dollars
Trade notes discounted ¥ 330 $ 2,737
Trade notes endorsed 468 3,882
Guarantees and similar items of bank loans 1,615 13,397
December 31, 2014Millions of Yen
Hedged item
Contract amount
Contract amount due after one year Fair value
Foreign currency forward contracts:
Buying U.S. $ Forecasted transactions ¥92,292 ¥— ¥609
Interest rate swaps:
(fixed rate payment, floating rate receipt)
Long-term debt 1,000 — (3)
March 31, 2014Millions of Yen
Hedged item
Contract amount
Contract amount due after one year Fair value
Foreign currency forward contracts:
Buying U.S. $ Forecasted transactions ¥ 376 ¥ — ¥(10)
Interest rate swaps:
(fixed rate payment, floating rate receipt)
Long-term debt 1,800 1,000 (11)
December 31, 2014Thousands of U.S. Dollars
Hedged item
Contract amount
Contract amount due after one year Fair value
Foreign currency forward contracts:
Buying U.S. $ Forecasted transactions $765,591 $— $5,052
Interest rate swaps:
(fixed rate payment, floating rate receipt)
Long-term debt 8,295 — (25)
Millions of Yen Thousands of U.S. Dollars
2014.12 2014.3 2014.12
Unrealized (loss) gain on available-for-sale securities:
Gains arising during the year ¥ (1,363) ¥ 8,662 $ (11,307)
Reclassification adjustments to profit or loss — (302) —
Amount before income tax effect (1,363) 8,360 (11,307)
Income tax effect 602 (2,892) 4,994
Total ¥ (761) ¥ 5,468 $ (6,313)
Deferred (loss) gain on derivatives under hedge accounting:
Gains arising during the year ¥ 650 ¥ (28) $ 5,392
Reclassification adjustments to profit or loss (33) 18 (274)
Amount before income tax effect 617 (10) 5,118
Income tax effect (219) 3 (1,816)
Total ¥ 398 ¥ (7) $ 3,302
Foreign currency translation adjustments:
Adjustments arising during the year ¥42,492 ¥35,653 $352,484
Reclassification adjustments to profit or loss (90) 45 (746)
Amount before income tax effect 42,402 35,698 351,738
Income tax effect — — —
Total ¥42,402 ¥35,698 $351,738
Defined retirement benefit plans
Adjustments arising during the year ¥ 3,633 ¥ — $ 30,137
Reclassification adjustments to profit or loss (5,155) — (42,762)
Amount before income tax effect (1,522) — (12,625)
Income tax effect 546 — 4,529
Total ¥ (976) ¥ — $ (8,096)
Share of other comprehensive income in associates:
Gains arising during the year ¥12,347 ¥19,168 $102,422
Reclassification (20) (10) (166)
Total ¥12,327 ¥19,158 $102,256
Total other comprehensive income ¥53,390 ¥60,317 $442,887
Notes to Consolidated Financial StatementsOtsuka Holdings Co., Ltd. and its Consolidated Subsidiaries
Otsuka-people creating new products for better health worldwide
77

23. Net income per share The reconciliation of the differences between basic and diluted net
income per share (EPS) for the fiscal years ended December 31, 2014
and March 31, 2014 was as follows:
24. Subsequent events• Acquisition of Avanir Pharmaceuticals, Inc.
On December 2, 2014, a consolidated subsidiary of the Company,
Otsuka Pharmaceutical Co., Ltd., agreed to make an all-cash tender
offer (the “Tender Offer”) followed by a merger for cash (the “Merger”)
with Avanir Pharmaceuticals, Inc. (“Avanir”), through Bigarade
Corporation, a wholly owned subsidiary of Otsuka America, Inc. Avanir
is a company engaged in the research and development, as well as
manufacturing and marketing, of pharmaceuticals.
In accordance with this agreement, the Tender Offer by Bigarade
Corporation and the subsequent Merger, resulting in Avanir as the
surviving company, were completed on January 13, 2015 (U.S. Eastern
Standard Time), resulting in Avanir becoming a consolidated subsidiary
of Otsuka Holdings.
(1) Overview of Business Combination
1) Name of company acquired and nature of business
Name of company acquired: Avanir Pharmaceuticals, Inc.
Nature of business: Research, development, manufacturing
and marketing of pharmaceuticals
2) Rationale for business combination
Avanir Pharmaceuticals, Inc. (“Avanir”) is a biopharmaceutical
venture company specializing in the area of central
nervous system (“CNS”) diseases. It was founded in 1988
in Southern California and now employs approximately
500 people. Avanir developed and launched NUEDEXTA®
22. Cash flow information(1) Details of assets and liabilities of the companies which the Company
newly consolidated by acquiring their shares
December 31, 2014Details of assets and liabilities and price and payments for the
acquisition of Jasmine Comercio de Produtos Alimenticios LTDA,
FoodState, Inc., Higashiyama Film Co., Ltd. and one other company are
as follows:
March 31, 2014Details of assets and liabilities and price and payments for the
acquisition of Claris Otsuka, Astex and one other company are
as follows:
(2) Nonmonetary transactions
There were no material nonmonetary transactions requiring
disclosure for the fiscal years ended December 31, 2014 and
March 31, 2014.
For the fiscal year ended December 31, 2014
Millions of Yen
Thousands of shares Yen U.S.
Dollars
Net incomeWeighted-
average sharesEPS
Basic EPS
Net income available to common shareholders ¥143,112 541,679 ¥264.20 $2.19
Effect of dilutive securities
Warrants — —
Stock options — 160
Diluted EPS
Net income for computation ¥143,112 541,839 ¥264.12 $2.19
For the fiscal year ended March 31, 2014
Millions of Yen
Thousands of shares Yen
Net incomeWeighted-
average sharesEPS
Basic EPS
Net income available to common shareholders ¥150,956 542,866 ¥278.07
Effect of dilutive securities
Warrants (245) —
Stock options — 193
Diluted EPS
Net income for computation ¥150,711 543,059 ¥277.52
Millions of Yen Thousands of U.S. Dollars
Current assets ¥10,820 $ 89,755
Noncurrent assets 6,925 57,445
Goodwill 22,815 189,258
Current liabilities (6,916) (57,370)
Long-term liabilities (1,410) (11,696)
Minority interests (553) (4,588)
Cost of purchase of investments in subsidiaries 31,681 262,804
Account payables included in the acquisition price (3,345) (27,748)
Cash and cash equivalents of newly consolidated companies (1,632) (13,538)
Purchase of investments in subsidiaries resulting in change in scope of consolidation ¥26,704 $221,518
Millions of Yen
Current assets ¥16,146
Noncurrent assets 74,754
Goodwill 32,654
Current liabilities (6,780)
Long-term liabilities (10,377)
Minority interests (6,860)
Cost of purchase of investments in subsidiaries 99,537
Cash and cash equivalents of newly consolidated companies (4,181)
Purchase of investments in subsidiaries resulting in change in scope of consolidation ¥95,356
78

(dextromethorphan hydrobromide/quinidine sulfate)
20 mg/10 mg capsules in the U.S. in February 2011 as
the world’s first and only approved treatment for the
pseudobulbar affect (PBA: Pseudobulbar affect). Avanir
markets NUEDEXTA in the U.S. through its own sales
organization of over 300 sales representatives, 150 of
whom were medical representatives hired to accelerate
the continued growth of NUEDEXTA for PBA.
The company’s pipeline includes programs in Alzheimer’s
disease, Parkinson’s disease, migraine, and other CNS
indications. The promising new chemical entity AVP-786, with
a target indication for behavioral disorders (agitation)
associated with Alzheimer’s disease, is being prepared to
enter Phase III clinical trials.
The acquisition of Avanir will bring Otsuka Pharmaceutical
Co., Ltd. (“Otsuka Pharmaceutical”) three distinct values: 1)
NUEDEXTA, created to treat the under-recognized neurologic
disease PBA; 2) the late-stage investigational compound
AVP-786 in clinical development to treat agitation associated
with Alzheimer’s disease; and 3) Avanir’s clinical development
and commercial expertise in neurologic diseases, which
complements Otsuka Pharmaceutical’s capabilities in
psychiatric diseases. These will accelerate Otsuka
Pharmaceutical’s existing expansion strategy in the
neurologic area, widening the overall CNS portfolio, inclusive
of the psychiatric and neurologic areas, supporting both
short- and medium-term growth.
This acquisition is consistent with the Group’s investment
philosophy: invest in companies and businesses with which
we can share a common management philosophy, human
resources, products and technology to enhance corporate
value, and invest with long-term perspective. The acquisition
is based on the Group’s central concepts of creativity and
proof through execution.
3) Date of business combination
January 13, 2015 (U.S. Eastern Standard Time)
4) Legal type of business combination
All-cash tender offer
5) Name of resulting entity
Avanir Pharmaceuticals, Inc.
6) Share of voting rights acquired
100%
7) Main rationale for selecting the acquiring entity
The acquisition company (Bigarade Corporation), a subsidiary
of the Company, has acquired all shares of Avanir
Pharmaceuticals, Inc. for cash.
(2) Total Acquisition Price and Breakdown
Acquisition price: US$3,507 million in cash
Direct costs related to the acquisition: US$20 million
(3) Amount of Goodwill Arising from the Acquisition, Amortization
Method and Period
1) Amount of goodwill
Since the calculation of purchase price allocation has
not been finalized, the amount of goodwill has not yet
been determined.
2) Amortization method and period
Not yet determined.
(4) Funding of acquisition cost
The Company entered into a bridge loan agreement with The
Bank of Tokyo-Mitsubishi UFJ, Ltd. (the “Loan”) in order to
finance the acquisition.
Below is the summary of the Loan as of March 27, 2015.
The Company plans to repay the above Loan using its own funds
as well as converting to long-term loan, and part of the Loan has
already been converted. Below is the summary of the borrowings
as of March 27, 2015.
• Appropriation of retained earnings
The following appropriation of retained earnings as of December 31,
2014 was approved at a meeting of the Company’s board of directors
held on February 13, 2015:
Lender The Bank of Tokyo-Mitsubishi UFJ, Ltd.
Amount of Loan initially provided US$3,540 million
Current Loan balance US$1,550 million
Interest rate Benchmark interest rate + spread
Effective date of Loan January 13, 2015
Maturity date December 7, 2015
Note: No collaterals, warranty or covenants have been provided on the above loan.
Lender The Bank of Tokyo-Mitsubishi UFJ, Ltd., Resona Bank, Limited., Sumitomo Mitsui Banking Corporation and Mizuho Bank, Ltd.
Amount of Loan initially provided ¥150,000 million
Current Loan balance ¥150,000 million
Interest rate Benchmark interest rate + spread
Effective date of Loan January 23, February 25, March 6 and March 20, 2015
Maturity date December 26, 2022
Note: No collaterals, warranty or covenants have been provided on the above loan.
Millions of Yen Thousands of U.S. Dollars
Year-end cash dividends, ¥40.0 (US$0.33) per share ¥21,672 $179,776
Notes to Consolidated Financial StatementsOtsuka Holdings Co., Ltd. and its Consolidated Subsidiaries
Otsuka-people creating new products for better health worldwide
79
The effect of these changes in comparison with the former
calculation method was as follows: “Pharmaceuticals” segment income
increased by ¥2,790 million (US$23,144 thousand), “Nutraceuticals”
segment income decreased by ¥263 million (US$2,182 thousand),
“Consumer products” segment income decreased by ¥1 million (US$8
thousand), “Others” segment income increased by ¥155 million
(US$1,286 thousand), and “Adjustments” increased by ¥254 million
(US$2,107 thousand).
(Accounting treatment of Branded Prescription Drug Fee
levied on sales)
As stated in Note 4 “Additional information,” in the U.S., the Group is
subject to the Patient Protection and Affordable Care Act enacted in
2010 and as such obligated to pay a so-called Branded Prescription
Drug Fee (“BPD Fee”).
On July 28, 2014, the U.S. Internal Revenue Service issued final
regulations for the BPD Fee which require expense recognition at the
time of sales, while the previous regulation required expenses to be
recognized based on sales in the preceding fiscal year.
As a result, an additional expense of ¥8,762 million (US$72,684
thousand) was recognized in selling, general and administrative
expenses, and accordingly, has led to a reduction of ¥8,762 million
(US$72,684 thousand) in “Pharmaceuticals” segment income.
25. Segment informationFor the fiscal years ended December 31, 2014 and March 31, 20141. Overview
The Group’s reporting segments are the constituent units of the Group
for which separate financial information is available and which are
subject to periodic reviews by the Board of Directors, in order to make
decisions on allocation of business resources and to evaluate the
business performances of the respective segments.
The Group’s core business is in healthcare and the Group categorizes
its business into four reporting segments: “Pharmaceuticals,”
“Nutraceuticals,” “Consumer products” and “Other” businesses.
The Group defines the reporting segments as follows:
• “Pharmaceuticals” comprises research and development,
manufacturing and sales of prescription drugs as well as clinical
nutrition, including intravenous solutions.
• “Nutraceuticals” comprises manufacturing and sales of functional
foods, over-the-counter drugs and supplements.
• “Consumer products” comprises manufacturing and sales of
mineral water, beverages, and food products.
• “Other” operations encompass logistics, warehousing,
manufacturing and sales of chemical products, evaluation
systems for LED displays and spectroanalysis devices.
2. Calculation methods for sales, profit (loss), assets, and other items
Methods of accounting procedures for reported business segments are
the same as those for statements in Note 3 “Summary of significant
accounting policies.” Income of reported segments is the figure based
on operating income. Intersegment profits or transfers are based on
market price.
(Change in the depreciation method and the useful life of
property, plant and equipment)
As stated in Note 3(h) “Property, plant and equipment,” the Company
and the majority of its consolidated domestic subsidiaries had previously
adopted the declining-balance method while consolidated subsidiaries
abroad adopted the straight-line method for the depreciation of
property, plant and equipment. From the beginning of this fiscal year,
the Company and its major consolidated domestic subsidiaries have
changed the depreciation method from the declining-balance method
to the straight-line method.
Along with the above change in depreciation method, the Company
and its major consolidated domestic subsidiaries changed useful lives of
some property, plant and equipment.
80
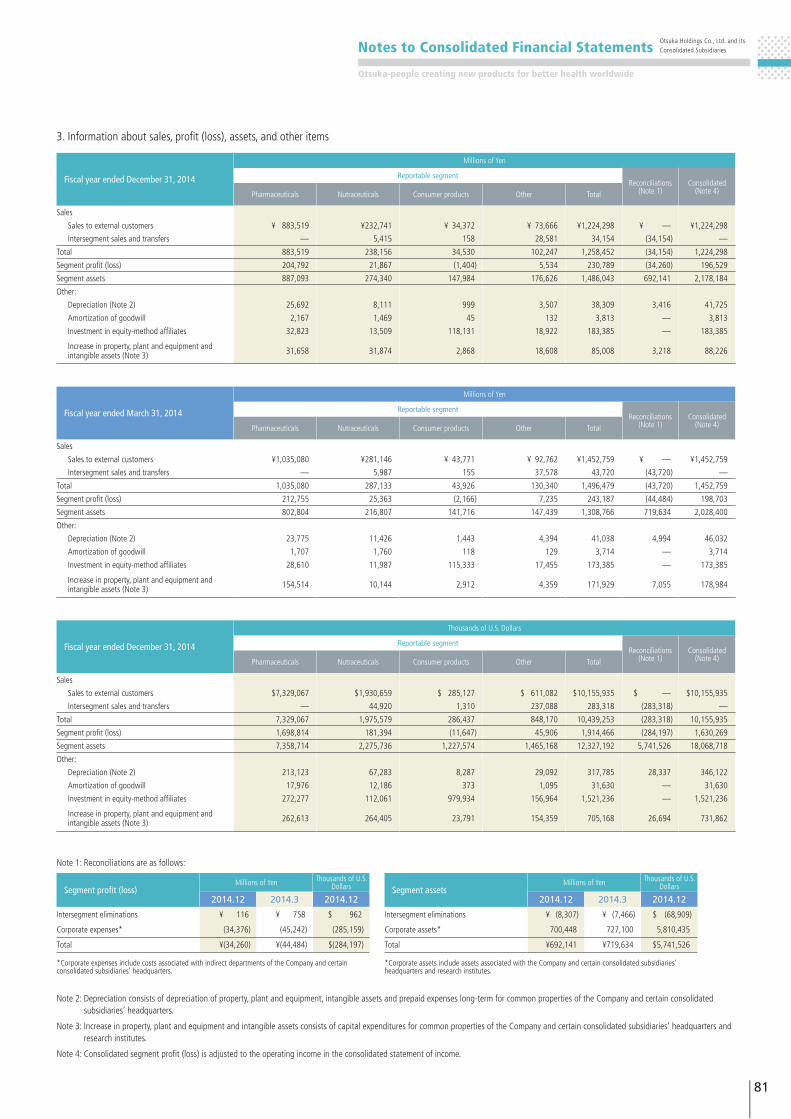
3. Information about sales, profit (loss), assets, and other items
Fiscal year ended December 31, 2014
Millions of Yen
Reportable segmentReconciliations
(Note 1)Consolidated
(Note 4)Pharmaceuticals Nutraceuticals Consumer products Other Total
Sales
Sales to external customers ¥ 883,519 ¥232,741 ¥ 34,372 ¥ 73,666 ¥1,224,298 ¥ — ¥1,224,298
Intersegment sales and transfers — 5,415 158 28,581 34,154 (34,154) —
Total 883,519 238,156 34,530 102,247 1,258,452 (34,154) 1,224,298
Segment profit (loss) 204,792 21,867 (1,404) 5,534 230,789 (34,260) 196,529
Segment assets 887,093 274,340 147,984 176,626 1,486,043 692,141 2,178,184
Other:
Depreciation (Note 2) 25,692 8,111 999 3,507 38,309 3,416 41,725
Amortization of goodwill 2,167 1,469 45 132 3,813 — 3,813
Investment in equity-method affiliates 32,823 13,509 118,131 18,922 183,385 — 183,385
Increase in property, plant and equipment and intangible assets (Note 3) 31,658 31,874 2,868 18,608 85,008 3,218 88,226
Fiscal year ended March 31, 2014
Millions of Yen
Reportable segmentReconciliations
(Note 1)Consolidated
(Note 4)Pharmaceuticals Nutraceuticals Consumer products Other Total
Sales
Sales to external customers ¥1,035,080 ¥281,146 ¥ 43,771 ¥ 92,762 ¥1,452,759 ¥ — ¥1,452,759
Intersegment sales and transfers — 5,987 155 37,578 43,720 (43,720) —
Total 1,035,080 287,133 43,926 130,340 1,496,479 (43,720) 1,452,759
Segment profit (loss) 212,755 25,363 (2,166) 7,235 243,187 (44,484) 198,703
Segment assets 802,804 216,807 141,716 147,439 1,308,766 719,634 2,028,400
Other:
Depreciation (Note 2) 23,775 11,426 1,443 4,394 41,038 4,994 46,032
Amortization of goodwill 1,707 1,760 118 129 3,714 — 3,714
Investment in equity-method affiliates 28,610 11,987 115,333 17,455 173,385 — 173,385
Increase in property, plant and equipment and intangible assets (Note 3) 154,514 10,144 2,912 4,359 171,929 7,055 178,984
Fiscal year ended December 31, 2014
Thousands of U.S. Dollars
Reportable segmentReconciliations
(Note 1)Consolidated
(Note 4)Pharmaceuticals Nutraceuticals Consumer products Other Total
Sales
Sales to external customers $7,329,067 $1,930,659 $ 285,127 $ 611,082 $10,155,935 $ — $10,155,935
Intersegment sales and transfers — 44,920 1,310 237,088 283,318 (283,318) —
Total 7,329,067 1,975,579 286,437 848,170 10,439,253 (283,318) 10,155,935
Segment profit (loss) 1,698,814 181,394 (11,647) 45,906 1,914,466 (284,197) 1,630,269
Segment assets 7,358,714 2,275,736 1,227,574 1,465,168 12,327,192 5,741,526 18,068,718
Other:
Depreciation (Note 2) 213,123 67,283 8,287 29,092 317,785 28,337 346,122
Amortization of goodwill 17,976 12,186 373 1,095 31,630 — 31,630
Investment in equity-method affiliates 272,277 112,061 979,934 156,964 1,521,236 — 1,521,236
Increase in property, plant and equipment and intangible assets (Note 3) 262,613 264,405 23,791 154,359 705,168 26,694 731,862
Note 2: Depreciation consists of depreciation of property, plant and equipment, intangible assets and prepaid expenses long-term for common properties of the Company and certain consolidated subsidiaries’ headquarters.
Note 3: Increase in property, plant and equipment and intangible assets consists of capital expenditures for common properties of the Company and certain consolidated subsidiaries’ headquarters and research institutes.
Note 4: Consolidated segment profit (loss) is adjusted to the operating income in the consolidated statement of income.
Note 1: Reconciliations are as follows:
Segment profit (loss)Millions of Yen Thousands of U.S.
Dollars
2014.12 2014.3 2014.12
Intersegment eliminations ¥ 116 ¥ 758 $ 962
Corporate expenses* (34,376) (45,242) (285,159)
Total ¥(34,260) ¥(44,484) $(284,197)
*Corporate expenses include costs associated with indirect departments of the Company and certain consolidated subsidiaries’ headquarters.
Segment assetsMillions of Yen Thousands of U.S.
Dollars
2014.12 2014.3 2014.12
Intersegment eliminations ¥ (8,307) ¥ (7,466) $ (68,909)
Corporate assets* 700,448 727,100 5,810,435
Total ¥692,141 ¥719,634 $5,741,526
*Corporate assets include assets associated with the Company and certain consolidated subsidiaries’ headquarters and research institutes.
Notes to Consolidated Financial StatementsOtsuka Holdings Co., Ltd. and its Consolidated Subsidiaries
Otsuka-people creating new products for better health worldwide
81

7. Information about impairment losses on fixed assets
2014.12Millions of Yen
Pharmaceuticals Nutraceuticals Consumer products Other Elimination/Corporate Total
Impairment losses ¥4,896 ¥ 176 ¥ 79 ¥1 ¥226 ¥5,378
2014.3Millions of Yen
Pharmaceuticals Nutraceuticals Consumer products Other Elimination/Corporate Total
Impairment losses ¥ 33 ¥2,844 ¥459 ¥8 ¥ 55 ¥3,399
2014.12Thousands of U.S. Dollars
Pharmaceuticals Nutraceuticals Consumer products Other Elimination/Corporate Total
Impairment losses $40,614 $1,460 $655 $8 $1,875 $44,612
2014.12Millions of Yen
ABILIFY Other Total
Sales to external customers ¥507,393 ¥716,905 ¥1,224,298
2014.3Millions of Yen
ABILIFY Other Total
Sales to external customers ¥575,732 ¥877,027 ¥1,452,759
2014.12Thousands of U.S. Dollars
ABILIFY Other Total
Sales to external customers $4,208,984 $5,946,951 $10,155,935
Millions of Yen
2014.12Japan North America Other Total
¥467,327 ¥545,329 ¥211,642 ¥1,224,298
Millions of Yen
2014.3Japan North America Other Total
¥628,317 ¥599,559 ¥224,883 ¥1,452,759
Thousands of U.S. Dollars
2014.12Japan North America Other Total
$3,876,624 $4,523,675 $1,755,636 $10,155,935
Millions of Yen
2014.12Japan North America Other Total
¥230,338 ¥42,950 ¥71,496 ¥344,784
Millions of Yen
2014.3Japan North America Other Total
¥217,048 ¥32,193 ¥65,944 ¥315,185
Thousands of U.S. Dollars
2014.12Japan North America Other Total
$1,910,726 $356,284 $593,081 $2,860,091
2014.12Millions of Yen
Net sales Segment
McKesson Corporation ¥167,228 Pharmaceuticals
Cardinal Health Inc. 126,234 Pharmaceuticals
2014.3Millions of Yen
Net sales Segment
McKesson Corporation ¥177,713 Pharmaceuticals
Cardinal Health Inc. 161,699 Pharmaceuticals
2014.12Thousands of U.S. Dollars
Net sales Segment
McKesson Corporation $1,387,209 Pharmaceuticals
Cardinal Health Inc. 1,047,151 Pharmaceuticals
6. Information about major customers
(2) Property, plant and equipment
5. Information about geographical areas
(1) Sales
Note: Sales are classified in countries or regions based on the location of customers.
4. Information about products and services
82
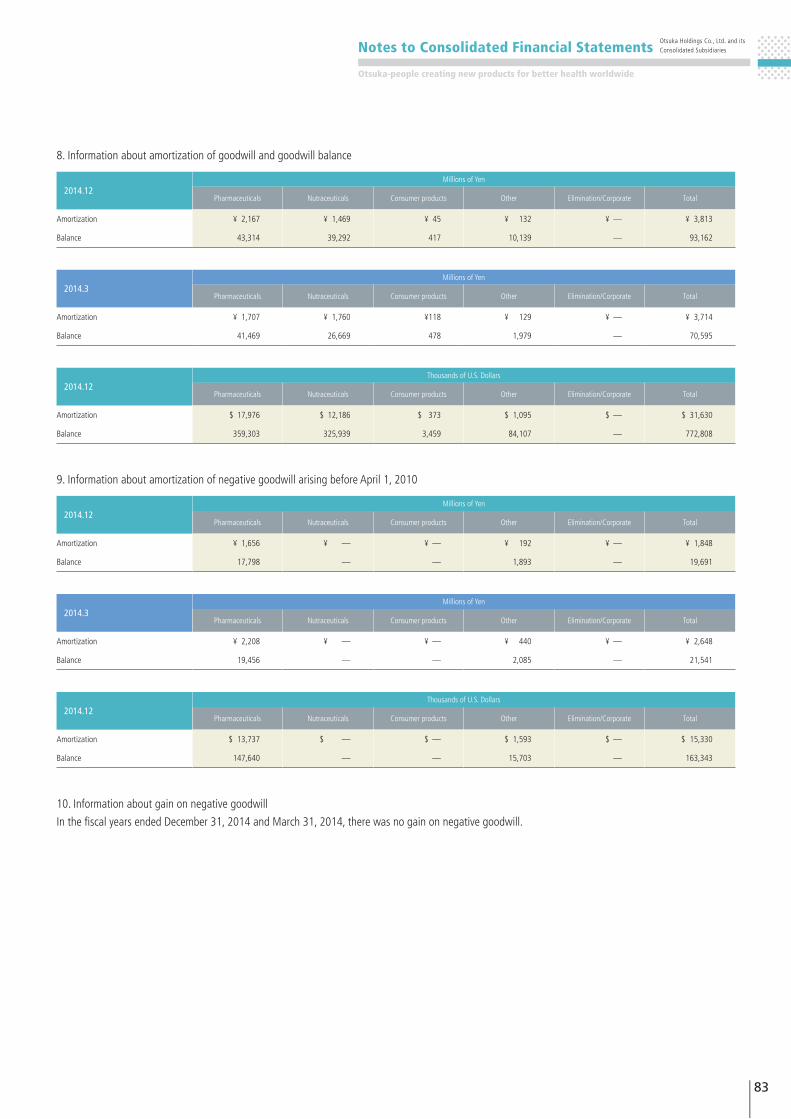
2014.12Millions of Yen
Pharmaceuticals Nutraceuticals Consumer products Other Elimination/Corporate Total
Amortization ¥ 2,167 ¥ 1,469 ¥ 45 ¥ 132 ¥ — ¥ 3,813
Balance 43,314 39,292 417 10,139 — 93,162
2014.3Millions of Yen
Pharmaceuticals Nutraceuticals Consumer products Other Elimination/Corporate Total
Amortization ¥ 1,707 ¥ 1,760 ¥118 ¥ 129 ¥ — ¥ 3,714
Balance 41,469 26,669 478 1,979 — 70,595
2014.12Thousands of U.S. Dollars
Pharmaceuticals Nutraceuticals Consumer products Other Elimination/Corporate Total
Amortization $ 17,976 $ 12,186 $ 373 $ 1,095 $ — $ 31,630
Balance 359,303 325,939 3,459 84,107 — 772,808
8. Information about amortization of goodwill and goodwill balance
2014.12Millions of Yen
Pharmaceuticals Nutraceuticals Consumer products Other Elimination/Corporate Total
Amortization ¥ 1,656 ¥ — ¥ — ¥ 192 ¥ — ¥ 1,848
Balance 17,798 — — 1,893 — 19,691
2014.3Millions of Yen
Pharmaceuticals Nutraceuticals Consumer products Other Elimination/Corporate Total
Amortization ¥ 2,208 ¥ — ¥ — ¥ 440 ¥ — ¥ 2,648
Balance 19,456 — — 2,085 — 21,541
2014.12Thousands of U.S. Dollars
Pharmaceuticals Nutraceuticals Consumer products Other Elimination/Corporate Total
Amortization $ 13,737 $ — $ — $ 1,593 $ — $ 15,330
Balance 147,640 — — 15,703 — 163,343
9. Information about amortization of negative goodwill arising before April 1, 2010
10. Information about gain on negative goodwill
In the fiscal years ended December 31, 2014 and March 31, 2014, there was no gain on negative goodwill.
Notes to Consolidated Financial StatementsOtsuka Holdings Co., Ltd. and its Consolidated Subsidiaries
Otsuka-people creating new products for better health worldwide
83