1 c ensus data for transportation planning transitioning to the american community survey may 11,...
TRANSCRIPT
1
Census Data for Transportation Planning
Transitioning to the American Community Survey
May 11, 2005Irvine, CA

2
Design Origins and Early Proposals
• Concept of “rolling sample design”
• Mid-decade census
• Proposed “Decade Census Program”
• Continuous measurement alternatives to the Census 2000 long form (ACS Design)

3
Consultations
• Congressional briefings • Technical workshops• User meetings (COMSIS ’94)• Advisory committee and oversight group
meetings • Information meetings with federal government
agencies (DOT first agency)

4
Consultations
• Resulted in additional changes to basic design
• Cost and accuracy tradeoffs debated (Benefit of current data versus slightly higher variances)

5
Full implementation
• Expanded to full sample in 2005
• ACS is in every county stateside
• ACS is in every municipio in Puerto Rico
• Plan to delay expansion until 2006 to include population living in places other than housing units (group quarters population)
• Critical for the ACS to continue to monitor quality and operational efficiency

6
Current Design
• Sample design • Data collection and capture• Data processing • Weighting and estimation• Data products

7
Sample Design
• Survey designed to include– U.S. Stateside and Puerto Rico – Population in both housing units and group
quarters (group quarters delayed until 2006)
• Survey designed to produce annually updated single-year and multi-year estimates

8
Sample Design• Initial sampling rate
– about 2.5% each year– about 12.5% over 5-year period
• Results in an initial sample of about – 250,000 addresses each month– 3 million addresses each year– 15 million addresses over 5-year period
9
Sample Design
• Variable sampling rates are used to ensure sufficient sample sizes in the smallest governmental units
• Initial sampling rates range from – about 1.7% to about 10% each year– about 8.5% to about 50% over a 5-year period

10
Sample Design
• About 2.2 million interviewed units expected per year due to– subsampling prior to personal visit interviewing– elimination of commercial or nonexistent
addresses from initial address sample– noninterviews
11
Sample Design
• Sample is cumulated over TIME to produce lowest levels of geographic detail to replace census sample
• Five years of data are required for areas with less than 20,000 population such as Traffic Analysis Zones

12
Sample Design
• Sample is cumulated over SPACE to produce:
– 3-year estimates for areas with populations of 20,000 or greater
– single-year estimates for areas with populations of 65,000 or greater
13
Sample Design• We project that the estimates of sampling
error for the 5-year ACS estimates will be about 1/3 higher than those from decennial census sample estimates
• Deemed a reasonable trade-off relative to the functional gain associated with obtaining annually updated estimates throughout the decade
14
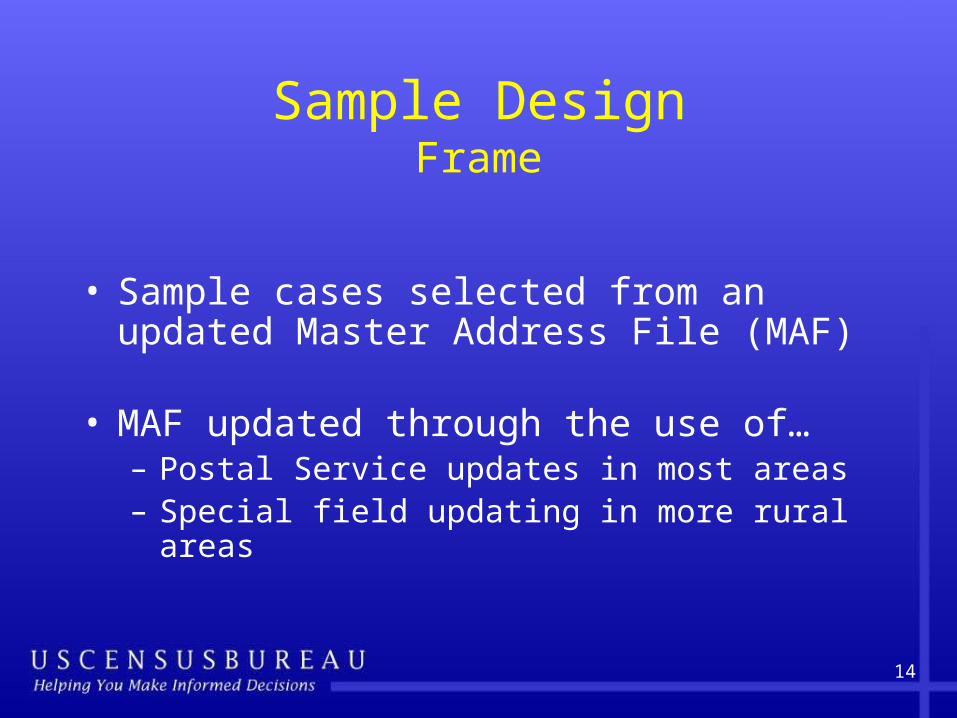
Sample DesignFrame
• Sample cases selected from an updated Master Address File (MAF)
• MAF updated through the use of…– Postal Service updates in most areas– Special field updating in more rural areas
15
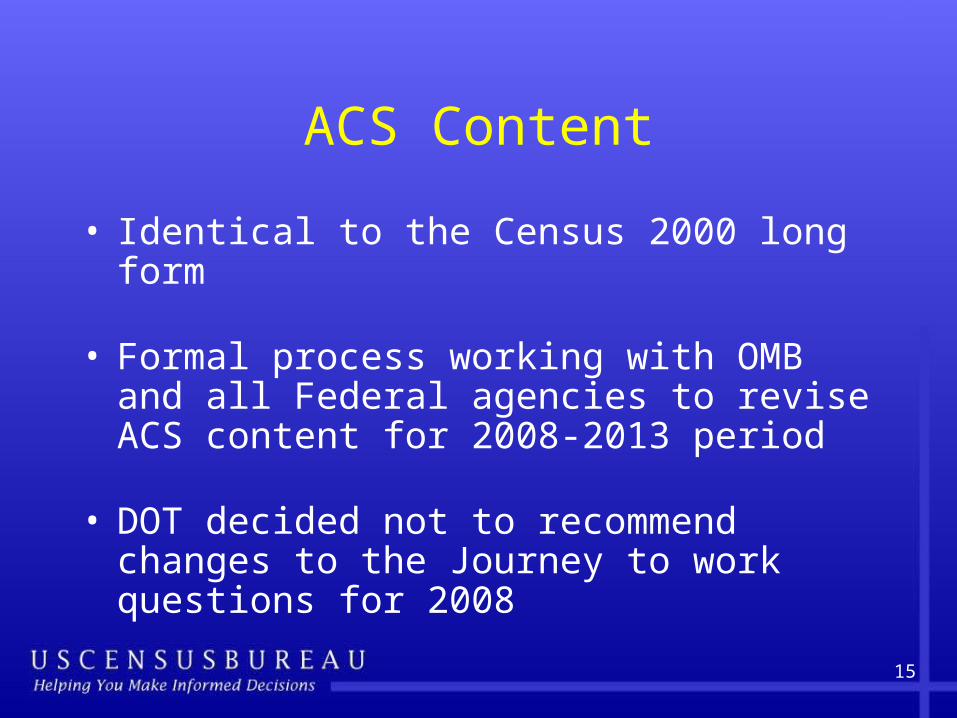
ACS Content
• Identical to the Census 2000 long form
• Formal process working with OMB and all Federal agencies to revise ACS content for 2008-2013 period
• DOT decided not to recommend changes to the Journey to work questions for 2008

16
Transportation Section
17
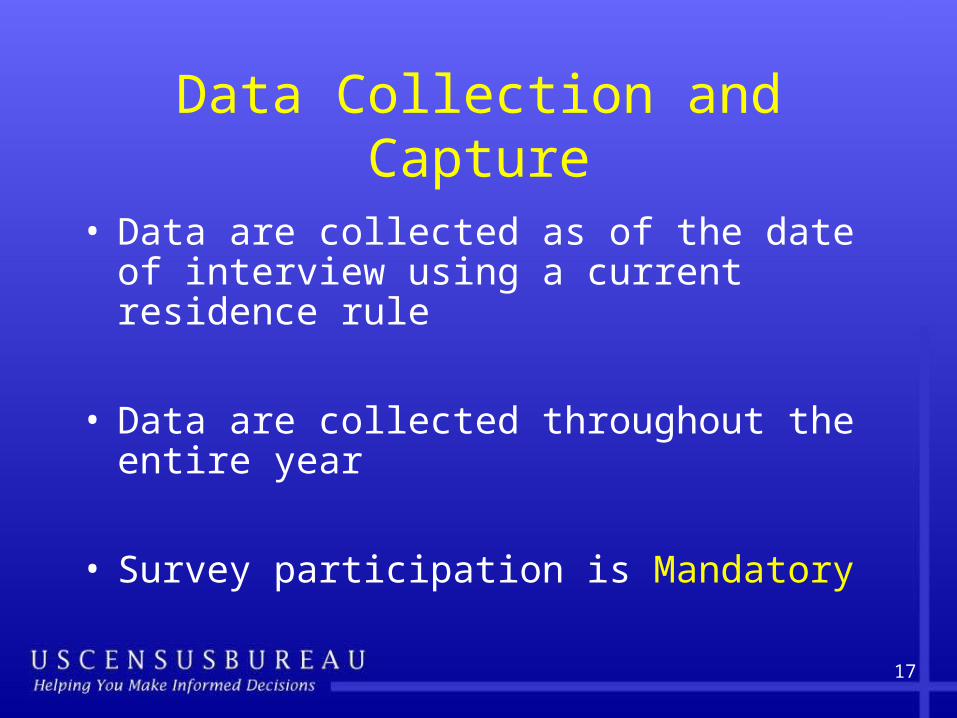
Data Collection and Capture
• Data are collected as of the date of interview using a current residence rule
• Data are collected throughout the entire year
• Survey participation is Mandatory

18
Data Collection and Capture
• Methodology based on best practices from decennial census and demographic surveys
• Monthly samples using overlapping multi-mode data collection methods– Mail– Telephone– Personal Visit
19
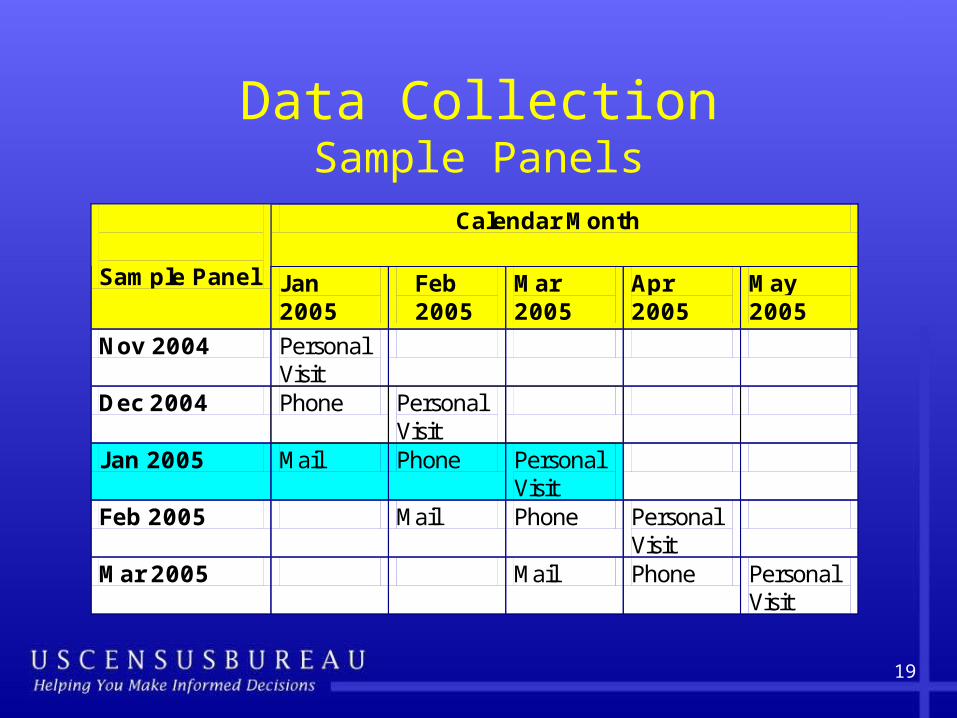
Data CollectionSample Panels
Calendar Month Sample Panel Jan
2005 Feb 2005
Mar 2005
Apr 2005
May 2005
Nov 2004 Personal Visit
Dec 2004 Phone Personal Visit
Jan 2005 Mail Phone Personal Visit
Feb 2005 Mail Phone Personal Visit
Mar 2005 Mail Phone Personal Visit

20
Data CollectionMonthly
Calendar Month Sample Panel Jan
2005 Feb 2005
Mar 2005
Apr 2005
May 2005
Nov 2004 Personal Visit
Dec 2004 Phone Personal Visit
Jan 2005 Mail Phone Personal Visit
Feb 2005 Mail Phone Personal Visit
Mar 2005 Mail Phone Personal Visit
21
Data Collection and CaptureMail
• Four mailings used to maximize mail response
• Over 95% of sample universe eligible for mailout
• Mail response rates average about 50% each month (Similar to Census 2000 mail response for long form)
22
Data Collection and CaptureMail
• Mailout in one language – U.S. stateside English – Puerto Rico Spanish
• Language forms available upon request
• Telephone assistance provided in English and Spanish
23
Data Collection and CaptureMail
• Current capture method involves keying data from paper questionnaires
• Research planned to convert to image capture and key-from-image technology
• Data are reviewed for completeness with telephone follow-up to resolve missing and inconsistent responses

24
Data Collection and CaptureTelephone
• About 5 weeks after the initial mailout, most mail returns have been received
• The nonresponse workload is identified for telephone follow-up
• Commercial vendors provide telephone numbers

25
Data Collection and CaptureTelephone
• 3 call centers conduct interviews using computer-assisted methods
• Telephone follow-up lasts about four weeks
• Survey instruments in English and Spanish
26
Data Collection and CapturePersonal Visit
• Two universes for personal visit followup – nonrespondents to the mailout and telephone – cases ineligible for mailout
• Subsample selected
• Personal visit followup conducted out of our 12 regional offices
27
Data Collection and CapturePersonal Visit
• Interviewers are experienced, continuously employed report to regional offices
• Supervised by Senior Interviewers with 3+ years experience
• Interviewers use laptops with English and Spanish translations
• Regional offices recruit bilingual staff to ensure data collection from non-English speaking households
28
Data CollectionResponse Rates
• These three sequential modes of data collection have been successful– response to the ACS is very high– true nationally and for all states
• ACS national-level response rates for 2000 - 2004 have all exceeded 95%
• Full implementation since January continues to achieve response rates above 95%
29
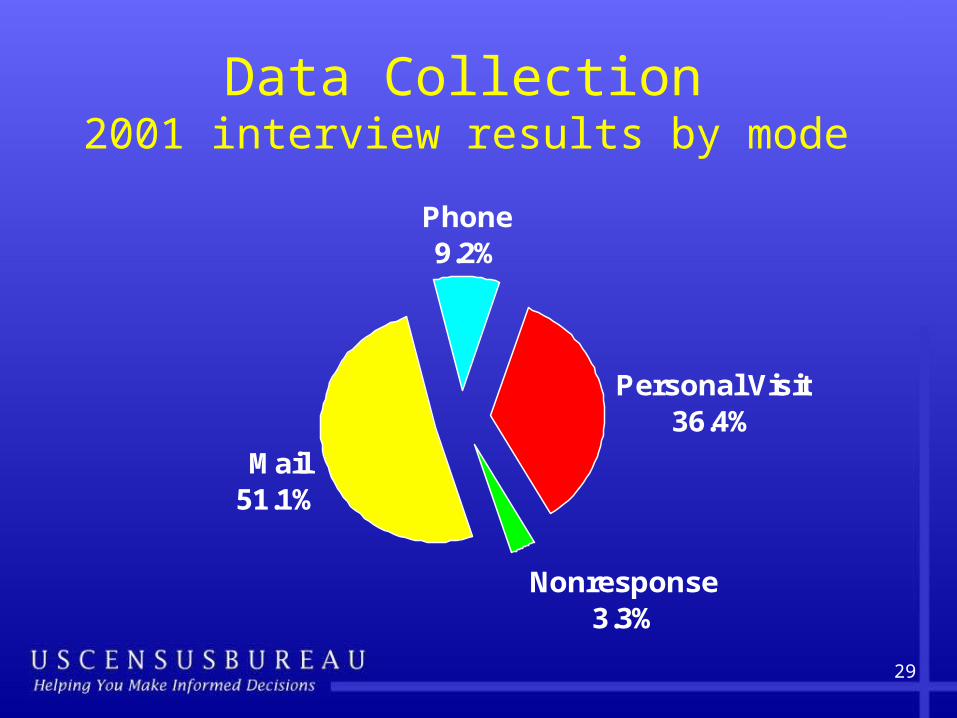
Data Collection 2001 interview results by mode
Mail51.1%
Phone9.2%
Personal Visit36.4%
Nonresponse3.3%

30
Group Quarters Population
• Developing best methods for adding group quarters population to the survey– Sampling– data collection– estimation
31
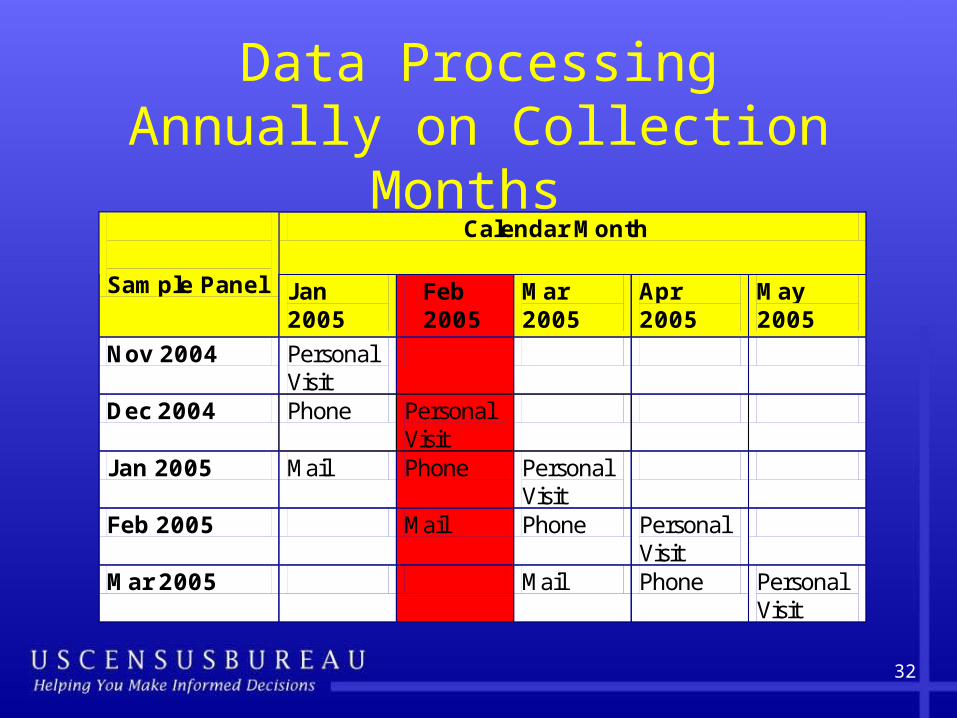
Data ProcessingAnnual accumulation
• All data collected in a given calendar year are used to produce the ACS estimates for that year
• Sample used for estimation is not the sum of the 12 sample panels for a given year
32
Data ProcessingAnnually on Collection Months
Calendar Month Sample Panel Jan
2005 Feb 2005
Mar 2005
Apr 2005
May 2005
Nov 2004 Personal Visit
Dec 2004 Phone Personal Visit
Jan 2005 Mail Phone Personal Visit
Feb 2005 Mail Phone Personal Visit
Mar 2005 Mail Phone Personal Visit
33
Data ProcessingAnnual Processing
• Coding
• Editing
• Imputation

34
Data ProcessingCoding
• Automated and clerical coding used for write-in entries such as– Race, Hispanic origin– Language– Place of work– Ancestry– Industry, occupation and class of worker
35
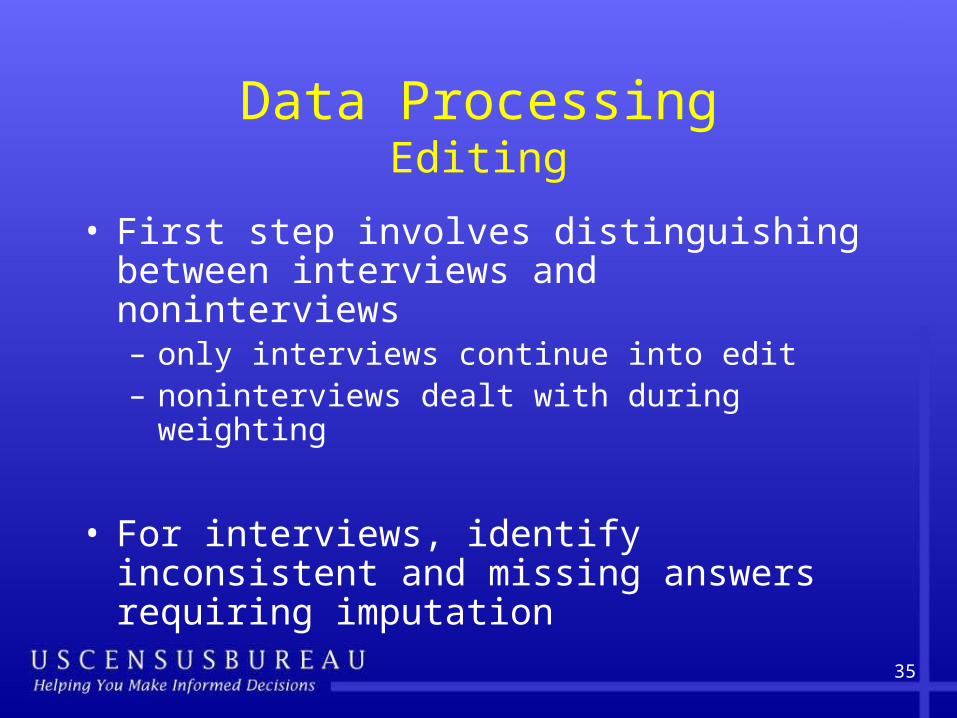
Data ProcessingEditing
• First step involves distinguishing between interviews and noninterviews– only interviews continue into edit– noninterviews dealt with during weighting
• For interviews, identify inconsistent and missing answers requiring imputation

36
Data ProcessingImputation
• Assignments – Rule based– Uses other reported information from the data
record
• Allocations – Nearest neighbor or hot-deck methods– Uses data from other data records
37
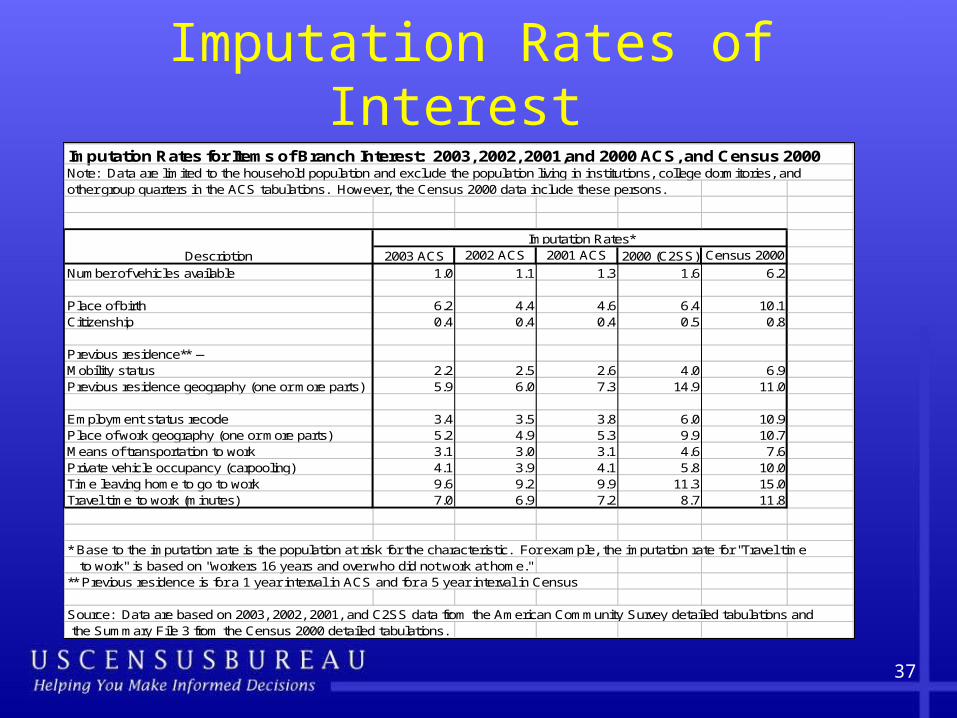
Imputation Rates of Interest Imputation Rates for Items of Branch Interest: 2003, 2002, 2001,and 2000 ACS, and Census 2000Note: Data are limited to the household population and exclude the population living in institutions, college dormitories, andother group quarters in the ACS tabulations. However, the Census 2000 data include these persons.
2003 ACS 2002 ACS 2001 ACS 2000 (C2SS) Census 2000
Number of vehicles available 1.0 1.1 1.3 1.6 6.2
Place of birth 6.2 4.4 4.6 6.4 10.1Citizenship 0.4 0.4 0.4 0.5 0.8
Previous residence** -- Mobility status 2.2 2.5 2.6 4.0 6.9Previous residence geography (one or more parts) 5.9 6.0 7.3 14.9 11.0
Employment status recode 3.4 3.5 3.8 6.0 10.9Place of work geography (one or more parts) 5.2 4.9 5.3 9.9 10.7Means of transportation to work 3.1 3.0 3.1 4.6 7.6Private vehicle occupancy (carpooling) 4.1 3.9 4.1 5.8 10.0Time leaving home to go to work 9.6 9.2 9.9 11.3 15.0Travel time to work (minutes) 7.0 6.9 7.2 8.7 11.8
* Base to the imputation rate is the population at risk for the characteristic. For example, the imputation rate for "Travel time to work" is based on "workers 16 years and over who did not work at home."** Previous residence is for a 1 year interval in ACS and for a 5 year interval in Census
Source: Data are based on 2003, 2002, 2001, and C2SS data from the American Community Survey detailed tabulations and the Summary File 3 from the Census 2000 detailed tabulations.
Imputation Rates*Description
38
Weighting and Estimation
• Initial weights reflect the probability of selection
• Adjust weights of interviewed households to account for noninterviews
• Adjust weights to independent housing unit and population estimates (controls)
39
Weighting and EstimationRatio Adjustments to Controls
• Post-census estimates are produced by updating the previous census results using various administrative records data
• In a multi-stage process, housing unit and population adjustment ratios are applied to the weights
• Applied at the county (or group of counties) level by race/ethnicity and age/sex groups
40
Weighting and EstimationSingle-year Estimation
• Estimates include
– population estimates
– rates
– medians

41
Weighting and EstimationSingle-year Estimates
• Percent of workers who carpool to work in year 1:
1
1
1
Population Worker Total
Carpool Number Who
Carpool oPercent Wh
T
N
P
42
Weighting and EstimationMulti-year Estimation
• Most multi-year estimates are generated by computing an average based on combining each years’ estimates

43
Weighting and EstimationMulti-year Estimates
• Three-year estimate of percent who carpool in years 1-3:
321
32131
TTT
NNNP

44
Weighting and EstimationMulti-year Estimation
• Medians are produced using combined data records from all years, not by averaging each year’s median

45
Data Review, Acceptance and Release
• Automated review tool
• Data released within 8 months of completion of data collection – August of year following data collection