1st department of ensus and statistics€¦ · sri lanka labour force survey 1st quarter - 2015...
TRANSCRIPT
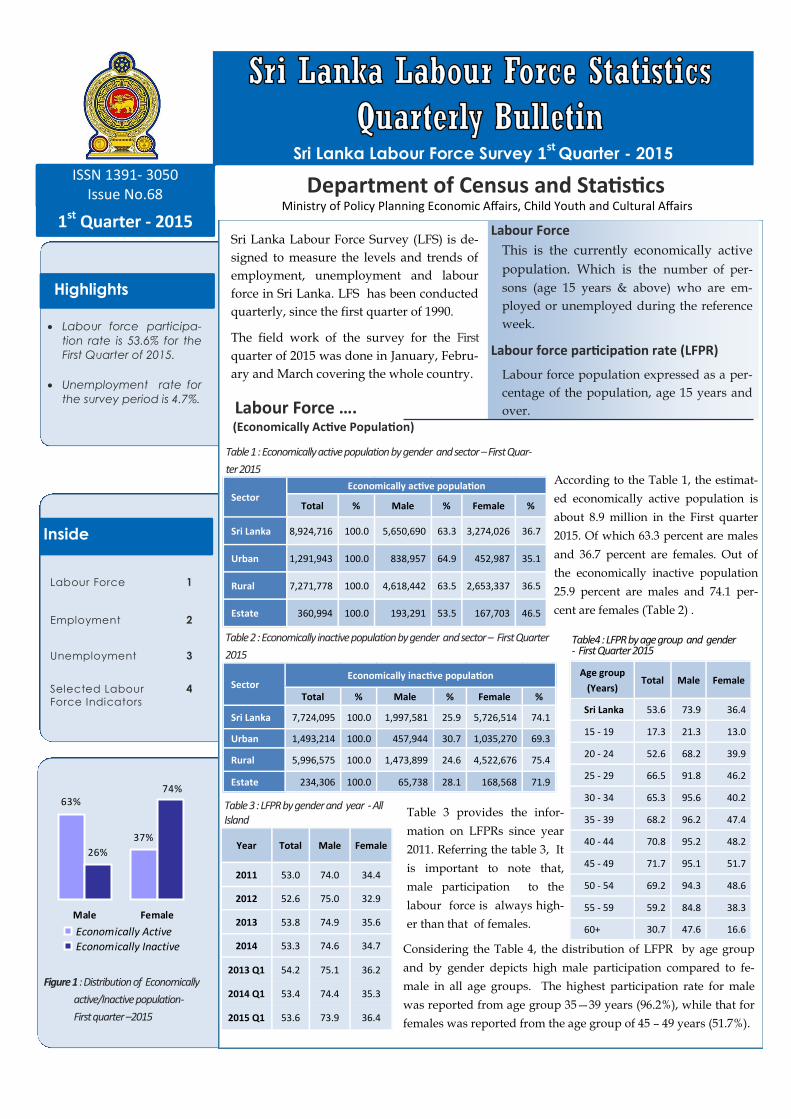
According to the Table 1, the estimat-
ed economically active population is
about 8.9 million in the First quarter
2015. Of which 63.3 percent are males
and 36.7 percent are females. Out of
the economically inactive population
25.9 percent are males and 74.1 per-
cent are females (Table 2) .
Table 1 : Economically active population by gender and sector – First Quar-
ter 2015
Sri Lanka Labour Force Survey 1st Quarter - 2015
Highlights
Department of Census and Statistics Ministry of Policy Planning Economic Affairs, Child Youth and Cultural Affairs
Labour Force ….
Sri Lanka Labour Force Survey (LFS) is de-
signed to measure the levels and trends of
employment, unemployment and labour
force in Sri Lanka. LFS has been conducted
quarterly, since the first quarter of 1990.
The field work of the survey for the First
quarter of 2015 was done in January, Febru-
ary and March covering the whole country.
Labour Force
This is the currently economically active
population. Which is the number of per-
sons (age 15 years & above) who are em-
ployed or unemployed during the reference
week.
Labour force participation rate (LFPR)
Labour force population expressed as a per-
centage of the population, age 15 years and
over.
Inside
Table 2 : Economically inactive population by gender and sector – First Quarter
2015
Labour Force 1
Employment 2
Unemployment 3
Selected Labour
Force Indicators
4
1st Quarter - 2015
ISSN 1391- 3050 Issue No.68
Table 3 provides the infor-
mation on LFPRs since year
2011. Referring the table 3, It
is important to note that,
male participation to the
labour force is always high-
er than that of females.
Figure 1 : Distribution of Economically
active/Inactive population-
First quarter –2015
63%
37%
26%
74%
Male Female
Economically ActiveEconomically Inactive
Sector Economically active population
Total % Male % Female %
Sri Lanka 8,924,716 100.0 5,650,690 63.3 3,274,026 36.7
Urban 1,291,943 100.0 838,957 64.9 452,987 35.1
Rural 7,271,778 100.0 4,618,442 63.5 2,653,337 36.5
Estate 360,994 100.0 193,291 53.5 167,703 46.5
Sector Economically inactive population
Total % Male % Female %
Sri Lanka 7,724,095 100.0 1,997,581 25.9 5,726,514 74.1
Urban 1,493,214 100.0 457,944 30.7 1,035,270 69.3
Rural 5,996,575 100.0 1,473,899 24.6 4,522,676 75.4
Estate 234,306 100.0 65,738 28.1 168,568 71.9
Table4 : LFPR by age group and gender - First Quarter 2015
Age group
(Years) Total Male Female
Sri Lanka 53.6 73.9 36.4
15 - 19 17.3 21.3 13.0
20 - 24 52.6 68.2 39.9
25 - 29 66.5 91.8 46.2
30 - 34 65.3 95.6 40.2
35 - 39 68.2 96.2 47.4
40 - 44 70.8 95.2 48.2
45 - 49 71.7 95.1 51.7
50 - 54 69.2 94.3 48.6
55 - 59 59.2 84.8 38.3
60+ 30.7 47.6 16.6
Considering the Table 4, the distribution of LFPR by age group
and by gender depicts high male participation compared to fe-
male in all age groups. The highest participation rate for male
was reported from age group 35—39 years (96.2%), while that for
females was reported from the age group of 45 – 49 years (51.7%).
Labour force participa-
tion rate is 53.6% for the
First Quarter of 2015.
Unemployment rate for
the survey period is 4.7%.
Table 3 : LFPR by gender and year - All Island
Year Total Male Female
2011 53.0 74.0 34.4
2012 52.6 75.0 32.9
2013 53.8 74.9 35.6
2014 53.3 74.6 34.7
2013 Q1 54.2 75.1 36.2
2014 Q1 53.4 74.4 35.3
2015 Q1 53.6 73.9 36.4
(Economically Active Population)
2
Employment ... Definition of Employed
Persons, who worked
at least one hour dur-
ing the reference peri-
od, as paid employees,
employers, own ac-
count workers or con-
tributing family work-
ers are said to be em-
ployed. This also in-
cludes persons with a
job but not at work
during the reference
period .
Reference Period :
Previous week of the sur-vey week
Employment Status Sri Lanka
Sector
Agriculture Non-Agriculture
No. % No. % No. %
Sri Lanka 8,502,270 100.0 2,500,322 29.4 6,001,949 70.6
Employee 4,691,304 100.0 750,210 16.0 3,941,094 84.0
Public 1,251,215 100.0 94,338 7.5 1,156,877 92.5
Private 3,440,089 100.0 655,872 19.1 2,784,217 80.9
Employer 231,761 100.0 27,441 11.8 204,320 88.2
Own Account Worker 2,809,633 100.0 1,197,314 42.6 1,612,319 57.4
Contributing Family
Worker 769,572 100.0 525,356 68.3 244,215 31.7
Table 5 shows the percentage distribution of employed pop-
ulation by main industry from First quarter 2014 to First
quarter 2015. During First quarter of 2015, the total number
of employed persons in Sri Lanka is estimated as about 8.5
million. Of which, about 44.7 percent engaged in Services
sector, 25.9 percent in Industries sector and 29.4 percent in
Agriculture sector.
Table 6 : Distribution of employed population by employment status and Agriculture/ Non- Agriculture sector – First
Quarter 2015
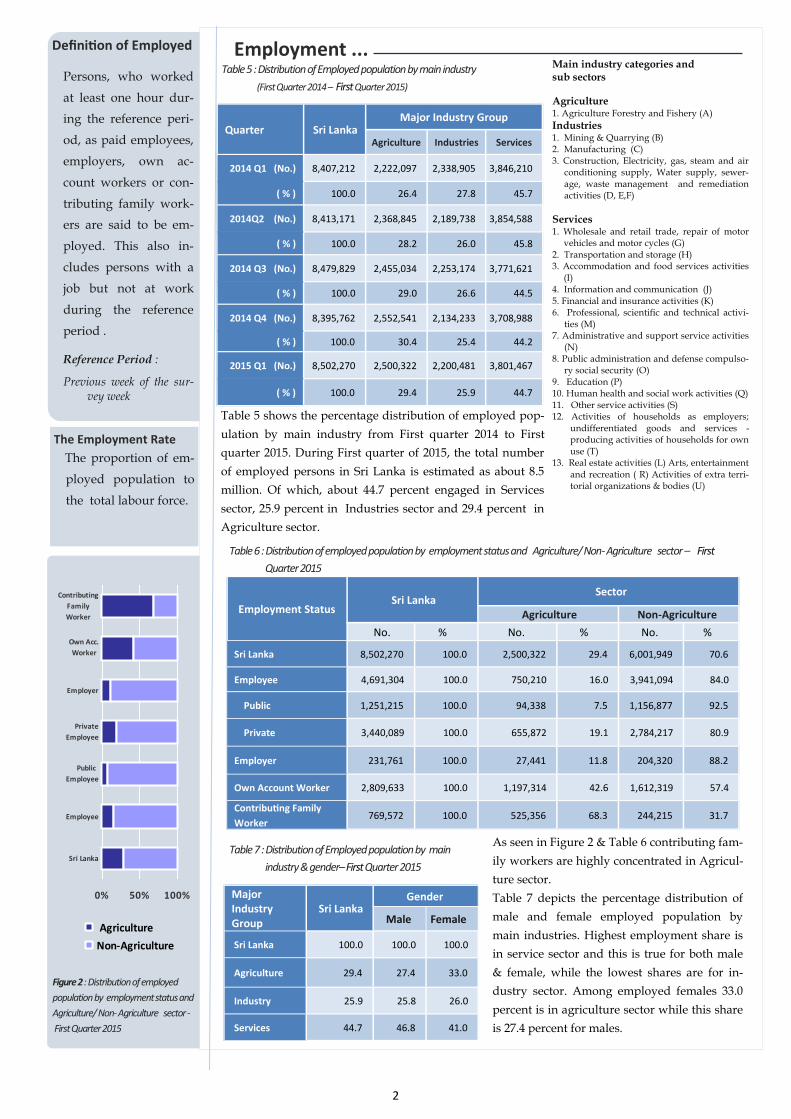
Figure 2 : Distribution of employed
population by employment status and
Agriculture/ Non- Agriculture sector -
First Quarter 2015
Major Industry Group
Sri Lanka Gender
Male Female
Sri Lanka 100.0 100.0 100.0
Agriculture 29.4 27.4 33.0
Industry 25.9 25.8 26.0
Services 44.7 46.8 41.0
Table 7 : Distribution of Employed population by main
industry & gender– First Quarter 2015
As seen in Figure 2 & Table 6 contributing fam-
ily workers are highly concentrated in Agricul-
ture sector.
Table 7 depicts the percentage distribution of
male and female employed population by
main industries. Highest employment share is
in service sector and this is true for both male
& female, while the lowest shares are for in-
dustry sector. Among employed females 33.0
percent is in agriculture sector while this share
is 27.4 percent for males.
Table 5 : Distribution of Employed population by main industry
(First Quarter 2014 – First Quarter 2015)
Quarter Sri Lanka Major Industry Group
Agriculture Industries Services
2014 Q1 (No.) 8,407,212 2,222,097 2,338,905 3,846,210
( % ) 100.0 26.4 27.8 45.7
2014Q2 (No.) 8,413,171 2,368,845 2,189,738 3,854,588
( % ) 100.0 28.2 26.0 45.8
2014 Q3 (No.) 8,479,829 2,455,034 2,253,174 3,771,621
( % ) 100.0 29.0 26.6 44.5
2014 Q4 (No.) 8,395,762 2,552,541 2,134,233 3,708,988
( % ) 100.0 30.4 25.4 44.2
2015 Q1 (No.) 8,502,270 2,500,322 2,200,481 3,801,467
( % ) 100.0 29.4 25.9 44.7
Main industry categories and sub sectors
Agriculture
1. Agriculture Forestry and Fishery (A)
Industries 1. Mining & Quarrying (B) 2. Manufacturing (C) 3. Construction, Electricity, gas, steam and air
conditioning supply, Water supply, sewer-age, waste management and remediation activities (D, E,F)
Services
1. Wholesale and retail trade, repair of motor vehicles and motor cycles (G)
2. Transportation and storage (H) 3. Accommodation and food services activities
(I) 4. Information and communication (J)
5. Financial and insurance activities (K) 6. Professional, scientific and technical activi-
ties (M) 7. Administrative and support service activities
(N) 8. Public administration and defense compulso-
ry social security (O) 9. Education (P) 10. Human health and social work activities (Q) 11. Other service activities (S) 12. Activities of households as employers;
undifferentiated goods and services - producing activities of households for own use (T)
13. Real estate activities (L) Arts, entertainment and recreation ( R) Activities of extra terri-torial organizations & bodies (U)
0% 50% 100%
Sri Lanka
Employee
Public
Employee
Private
Employee
Employer
Own Acc.
Worker
Contributing
Family
Worker
Agriculture
Non-Agriculture
The Employment Rate
The proportion of em-
ployed population to
the total labour force.

3
Figure 3 : Unemployment rates and it’s 95% confidence intervals (2013Q1 - 2015Q1)
Unemployment ... Definition of Unemployed
Persons available and/or
looking for work, and
who did not work and
taken steps to find a job
during last four weeks
and ready to accept a job
given a work opportuni-
ty within next two weeks
are said to be unem-
ployed.
The Unemployment Rate
The proportion of unem-
ployed population to the
total labour force.
The number of unem-
ployed persons is estimat-
ed as about 422,446 dur-
ing the First quarter 2015.
The unemployment rate
for the First quarter 2015
is 4.7 percent.
As shown in Figure 3, it is
very important to note
that, when sampling er-
ror1 is considered there
are no statistically signifi-
cant drops/increases of
unemployment rates re-
ported in different time
periods starting from First
quarter 2013 to First quar-
ter 2015.
Age group (Years)
Sri Lanka Gender
Male Female
Sri Lanka 4.7 2.9 7.9
15—24 21.7 15.3 31.2
25—29 8.7 4.1 15.9
Over 30 1.6 0.9 2.8
Table 8: Unemployment rate by age group and gender –
First Quarter 2015
Level of Education
Unemployment Rate (%)
Sri Lanka Male Female
Sri Lanka 4.7 2.9 7.9
Below GCE O/L 2.7 2.0 4.2
GCE O/L 6.6 4.5 10.6
GCE A/L & above 10.1 5.3 14.3
Table 9 : Unemployment rate by level of education – First Quarter 2015
This further shows that the problem of unemployment is more acute in the case of educated
females than educated males , which has been seen the same picture in previous survey re-
sults.
As can be seen from Table 8, overall un-
employment rate reported for female is
7.9 percent and it is 2.9 percent for male.
Youth unemployment rate 15 – 24 years
reported for the First quarter 2015 is 21.7
percent and that reports the highest un-
employment rate among all other age
groups. Further rates for both males and
females are 15.3 and 31.2 percent respec-
tively for age group 15—24.
Figure 4 : Unemployment rate by level of
education and gender – First
Quarter 2015
1Sampling error : When a sample, rather than the entire population, is sur-veyed, estimates differ from the true population values they represent. This difference, or sampling error, occurs by chance, and its variability is measured by the sampling error of the estimate.
For more details, please refer the explanatory note given under the labour force link in the DCS website; www.statistics.gov.lk
0 3 6 9 12 15
Sri Lanka
Below
GCE O/L
GCE O/L
GCE A/L
& above
Unemployment Rate (%)
Sri Lanka Male Female
Figure 3 : Unemployment rate by age group
and gender – First Quarter 2015
The survey results further revealed that the unemployment among females is higher than
that of males, in all age groups. Youth and female unemployment contribute more to the
overall unemployment of the country.
The highest unemployment
rate is reported from the G.C.E
(A/L) and above group which
is about 10.1 percent. Corre-
sponding percentages are 5.3
percent and 14.3 percent for
males and females respective-
ly. Female unemployment
rates are higher than those of
males in all levels of education.
4.6
4.44.4
4.14.1
4.54.2 4.4
4.7
2
3
4
5
6
2013Q1 2013Q3 2014Q1 2014Q3 2015Q1
Time Period
Une
mpl
oym
ent
Rat
e (%
)
95% confidance interva l (CI)Point estimete of unemployment rate
These figures are to be treated with caution as the corresponding CV
( Coefficient of variation ) values are high.
4
Department of Cen-
sus and Statistics
No.306/71
Polduwa Road,
Battaramulla.
Sri Lanka
Sample Surveys Divi-
sion
7th floor,
Sankyana Mandiraya
No.306/71
Polduwa Road,
Battaramulla.
Sri Lanka
Phone: 011-2147446
Fax: 011-2147447
E-mail:
sample.survey@statistics.
gov.lk
Vision of the
DCS
“To be the leader in
the region in produc-
ing timely statistical
information to
achieve the country’s
development goals.”
Mission of the
DCS
“Making contribution
in the socioeconomic
development of the
country by providing
accurate timely statis-
tics, more Effectively by
means of new technol-
ogy, and utilizing the
services of dedicated
staff under a strategic
leadership to become a
prosperous nation in
the globalized environ-
ment.”
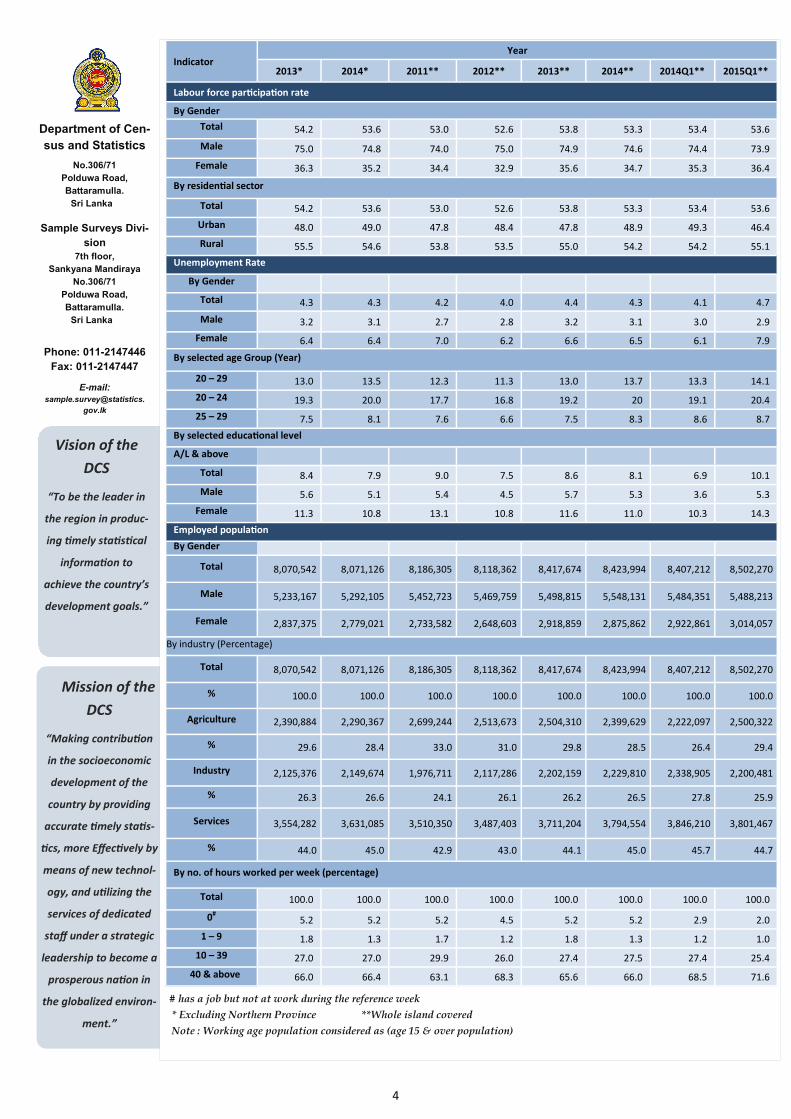
Selected Labour Force Indicators …
# has a job but not at work during the reference week
* Excluding Northern Province **Whole island covered
Note : Working age population considered as (age 15 & over population)
Indicator Year
2013* 2014* 2011** 2012** 2013** 2014** 2014Q1** 2015Q1**
Labour force participation rate
By Gender
Total 54.2 53.6 53.0 52.6 53.8 53.3 53.4 53.6
Male 75.0 74.8 74.0 75.0 74.9 74.6 74.4 73.9
Female 36.3 35.2 34.4 32.9 35.6 34.7 35.3 36.4
By residential sector
Total 54.2 53.6 53.0 52.6 53.8 53.3 53.4 53.6
Urban 48.0 49.0 47.8 48.4 47.8 48.9 49.3 46.4
Rural 55.5 54.6 53.8 53.5 55.0 54.2 54.2 55.1
Unemployment Rate
By Gender
Total 4.3 4.3 4.2 4.0 4.4 4.3 4.1 4.7
Male 3.2 3.1 2.7 2.8 3.2 3.1 3.0 2.9
Female 6.4 6.4 7.0 6.2 6.6 6.5 6.1 7.9
By selected age Group (Year)
20 – 29 13.0 13.5 12.3 11.3 13.0 13.7 13.3 14.1
20 – 24 19.3 20.0 17.7 16.8 19.2 20 19.1 20.4
25 – 29 7.5 8.1 7.6 6.6 7.5 8.3 8.6 8.7
By selected educational level
A/L & above
Total 8.4 7.9 9.0 7.5 8.6 8.1 6.9 10.1
Male 5.6 5.1 5.4 4.5 5.7 5.3 3.6 5.3
Female 11.3 10.8 13.1 10.8 11.6 11.0 10.3 14.3
Employed population
By Gender
Total 8,070,542 8,071,126 8,186,305 8,118,362 8,417,674 8,423,994 8,407,212 8,502,270
Male 5,233,167 5,292,105 5,452,723 5,469,759 5,498,815 5,548,131 5,484,351 5,488,213
Female 2,837,375 2,779,021 2,733,582 2,648,603 2,918,859 2,875,862 2,922,861 3,014,057
By industry (Percentage)
Total 8,070,542 8,071,126 8,186,305 8,118,362 8,417,674 8,423,994 8,407,212 8,502,270
% 100.0 100.0 100.0 100.0 100.0 100.0 100.0 100.0
Agriculture 2,390,884 2,290,367 2,699,244 2,513,673 2,504,310 2,399,629 2,222,097 2,500,322
% 29.6 28.4 33.0 31.0 29.8 28.5 26.4 29.4
Industry 2,125,376 2,149,674 1,976,711 2,117,286 2,202,159 2,229,810 2,338,905 2,200,481
% 26.3 26.6 24.1 26.1 26.2 26.5 27.8 25.9
Services 3,554,282 3,631,085 3,510,350 3,487,403 3,711,204 3,794,554 3,846,210 3,801,467
% 44.0 45.0 42.9 43.0 44.1 45.0 45.7 44.7
By no. of hours worked per week (percentage)
Total 100.0 100.0 100.0 100.0 100.0 100.0 100.0 100.0
0# 5.2 5.2 5.2 4.5 5.2 5.2 2.9 2.0
1 – 9 1.8 1.3 1.7 1.2 1.8 1.3 1.2 1.0
10 – 39 27.0 27.0 29.9 26.0 27.4 27.5 27.4 25.4
40 & above 66.0 66.4 63.1 68.3 65.6 66.0 68.5 71.6