1. call to order 2. public comment on items not listed …
TRANSCRIPT
PLANNING COMMISSION AGENDA City Commission Chambers - City Hall
625 Center Street, Oregon City, Oregon 97045 February 8, 2010 at 7:00 p.m.
The 2010 Planning Commission agendas, including staff reports, memorandums, and minutes are available
from the Oregon City Web site home page under meetings.(www.orcity.org)
1. CALL TO ORDER
2. PUBLIC COMMENT ON ITEMS NOT LISTED ON AGENDA
3. PLANNING COMMISSION HEARING
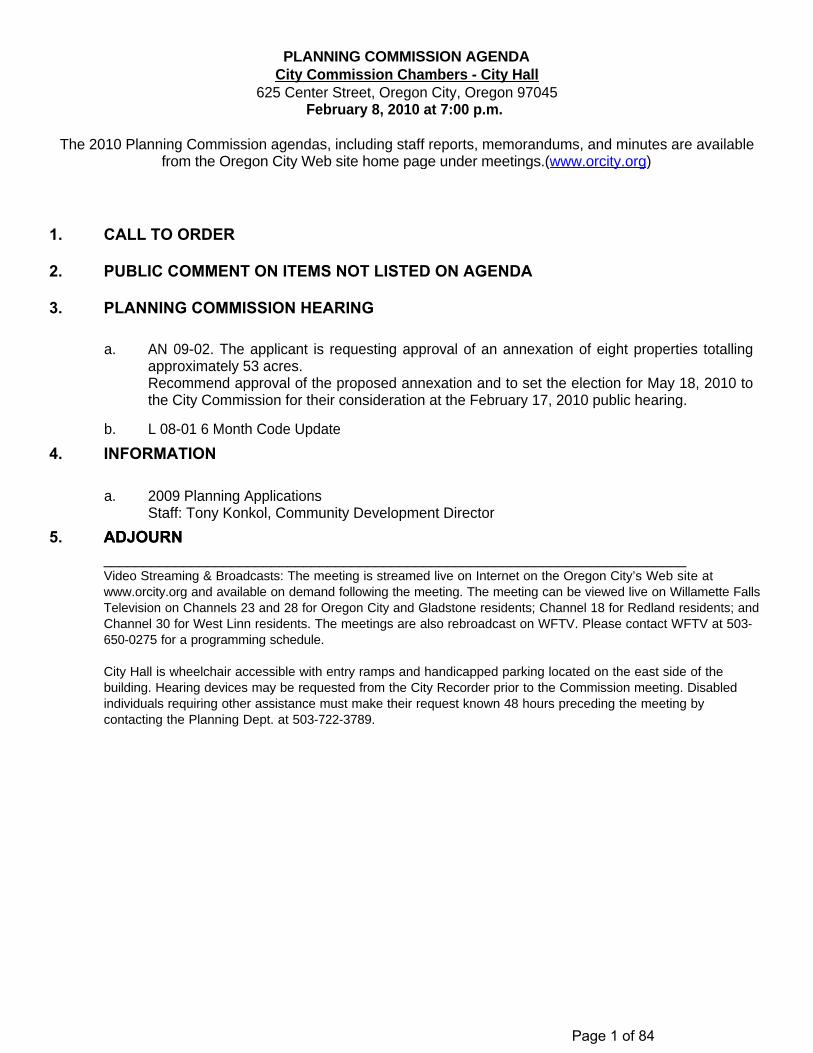
a. AN 09-02. The applicant is requesting approval of an annexation of eight properties totalling approximately 53 acres. Recommend approval of the proposed annexation and to set the election for May 18, 2010 to the City Commission for their consideration at the February 17, 2010 public hearing.
b. L 08-01 6 Month Code Update
4. INFORMATION
a. 2009 Planning Applications Staff: Tony Konkol, Community Development Director
5. ADJOURN_________________________________________________________________________ Video Streaming & Broadcasts: The meeting is streamed live on Internet on the Oregon City’s Web site at www.orcity.org and available on demand following the meeting. The meeting can be viewed live on Willamette Falls Television on Channels 23 and 28 for Oregon City and Gladstone residents; Channel 18 for Redland residents; and Channel 30 for West Linn residents. The meetings are also rebroadcast on WFTV. Please contact WFTV at 503-650-0275 for a programming schedule. City Hall is wheelchair accessible with entry ramps and handicapped parking located on the east side of the building. Hearing devices may be requested from the City Recorder prior to the Commission meeting. Disabled individuals requiring other assistance must make their request known 48 hours preceding the meeting by contacting the Planning Dept. at 503-722-3789.
ADJOURN
Page 1 of 84

Agenda Item No. 3b.
Meeting Date: 08 Feb 2010
COMMISSION REPORT: CITY OF OREGON CITY
TO: Planning Commission FROM: Tony Konkol, Community Development Director PRESENTER: Tony Konkol, Community Development Director SUBJECT: L 08-01 6-Month Code Update Agenda Heading: Public Hearing Approved by: Larry Patterson, City Manager
RECOMMENDED ACTION (Motion): Staff requests that the Planning Commission take public testimony from any citizen that wishes to speak and then continue the hearing to the February 22, 2010 Planning Commission hearing. BACKGROUND: The 6-month code update hearing was continued from the January 25, 2010 meeting to the February 8, 2010 meeting date to allow additional time for staff to address the issues that have been raised. Staff requests additional time to address the remaining outstanding issues and prepare the final document for review. BUDGET IMPACT: FY(s): Funding Source: ATTACHMENTS:
3b. L 08-01 6 Month Code Update
Page 76 of 84

Page 1 of 3
TO: Chair Powell and Planning Commission FROM: Tony Konkol, Community Development Director
Pete Walter, AICP, Associate Planner DATE: February 1, 2009 RE: AN 09-02 (Ziegler Annexation) Outstanding Issues
Dear Planning Commissioners, At the January 25, 2009 Planning Commission hearing, AN 09-02 was continued until February 8, 2010 to allow staff additional time to respond to the following concerns raised during the Planning Commission hearing. Park Place Neighborhood Association (PPNA) Tom Geil, Vice-Chair of the PPNA expressed the following concerns.
Approval of annexation prior to compliance with the Transportation Planning Rule (OAR 660-012-0060) Response: Staff has attached an email from John Replinger (Exhibit 1), city transportation engineer, regarding the adequacy of the Applicant’s Transportation Analysis Letter and compliance with the TPR.
Flooding / Storm concerns on Redland Road and access to and from Holcomb Boulevard. Response: Staff reviewed the 100-year, 500-year and 1996 Flood Inundation layers on the City’s floodplain overlay map (Exhibit 2). The map indicates that Redland Road floods as far up as the Holly Lane bridge during a 100-year flood event. Raising the elevation of Redland Road out of the floodplain, as suggested by Mr. Geil, would present enormous environmental and engineering challenges in a sensitive river corridor. The maps also indicate that while access to 213 from Holcomb Boulevard was cutoff in the 1996 flood, access to 213 / Clackamas River Drive was maintained.
Did the applicant’s TIA take the Rivers Development into account? Does the TIA take into account the 4-day work week and the unemployed? Response: The applicant is not required to provide this level of detailed traffic analysis with the annexation since no rezoning or development will occur. Allan Dunn, Traffic Engineer for the applicant, pointed out that the TIA takes into account approved “in-process” developments. Compliance with TPR requires a more detail analysis (See Exhibit 1), to be provided at the time of re-zoning. No application has been approved or submitted for the area anticipated for the Rivers Development. Finally, the Public Works Department is in the final design stages for the 213 / I 205 interchange improvements (See Exhibit 3), which includes phased
Community Development – Planning
221 Molalla Ave. Suite 200 | Oregon City OR 97045
Ph (503) 722-3789 | Fax (503) 722-3880
3a. AN 09-02. The applicant is requesting approval of an annexation of eight properties totalling approximately 53 acres. Page 3 of 84

2
How are new SDC’s going to be applied and what is the process for developing a proportional share analysis to address ODOT’s concerns with development of the annexation area?
The SDC question should be pretty straightforward and I’m getting information from Nancy Kraushaar on that, however I do not know to what extent the TPR can be satisfied with “proportional share” improvements. As you know, the city has approved proportional share for re‐zonings that affected failing intersections for subdivisions approved within existing city limits (for example the Hollow Point Estates (ZC 08‐02) and Parker Knoll subdivision (ZC 08‐03), and ODOT approved of the same approach for the re‐zoning from R‐10 to R‐6 of the former Centex property on Leland Road (ZC 07‐03). Please could you provide a brief discussion on that as well? Thanks, Pete
Pete Walter, AICP, Associate [email protected] Community Development Department Planning Division 221 Molalla Avenue, Ste. 200 Oregon City, Oregon 97045 503‐496‐1568 Direct 503‐722‐3789 Front Desk 503‐722‐3880 Fax Website: www.orcity.org
Need an answer? Did you know that our website can help you 24‐hours a day, 7‐days a week? Online, you have access to permit forms, applications, handouts, inspection results, codebooks, info on permits applied for since 2002, inspection information, application checklists, and much more. You can request inspections online, and if you are a contractor, you can even apply for permits online. Zoning and other Tax Lot Information ‐ Quickly and easily view, print, and save maps and reports of your property. Property Zoning Report
Online Mapping is available at OCWebMaps
Please consider the environment before printing PUBLIC RECORDS LAW DISCLOSURE: This e‐mail is subject to the State Retention Schedule and may be made available to the public. From: [email protected] [mailto:[email protected]] Sent: Wednesday, January 27, 2010 10:53 PM To: Pete Walter Subject: Ziegler Annexation AN 09-02 Pete: Questions have been raised about the traffic analysis procedures and requirements associated with the Ziegler Annexation request (AN 09-02). It is my opinion that the annexation by itself has no traffic impact. The parcels being considered for annexation currently have five dwelling units. There is no reason to expect the annexation into the city will result in any traffic increase from these dwellings. As such, no traffic analysis required for the annexation.
3a. AN 09-02. The applicant is requesting approval of an annexation of eight properties totalling approximately 53 acres. Page 7 of 84

Page 2 of 3
improvements to Redland Road and widening / restriping of OR 213 between I-205 and Redland Road to accommodate an additional north/south travel lane as recommended by ODOT. The TIA is based on vehicle trip generation by approved land use and actual traffic counts to provide the most reliable information based on accepted engineering methodologies.
Annexing neighbor concerns (Miller / Townsend)
Annexing neighbors expressed concerns about accidents and safety of the Holcomb Boulevard / Barlow Crest intersection, water run-off / drainage issues / Winston Pond, wildlife habitat and geotechnical review requirements. Response: Staff met with the Townsends and answered their questions. They did not indicate if they support or do not support the annexation proposal, but they have all of the information they requested. Transfer of jurisdiction of Holcomb Boulevard from the County to the City is controlled by the Urban Growth Management Agreement. Safety improvements for the applicant’s frontage will be reviewed at the time a development application is submitted for the annexation site. The Park Place Concept Plan defined sensitive habitat areas and geologic hazards and defined buildable land areas at the concept plan level. Development will also be reviewed for compliance with the Natural Resource Overly District OCMC 17.49 and any applicable wildlife habitat protections required. The applicant is responsible for compliance with the City’s stormwater drainage requirements and Geologic Hazard Overly District code OCMC 17.44 at the time of development.
System Development Charges (SDCs)
How are new SDC’s going to be applied and what is the process for developing a proportional share analysis to address ODOT’s concerns with development of the annexation area (TPR compliance)? Response: Transportation SDC updates (TSDCs) were adopted by the City Commission April 1, 2009 (Exhibit 6). The TSDC increases were based on updated Transportation System Plan Capital Improvement Plan (TSP CIP) roadway and bicycle / pedestrian project lists including the Park Place and Beavercreek Road Concept Plans. The TSDC methodology, analysis and new amounts are documented in the attached March 2009 report prepared by FCS Group (Exhibit 4). The new TSDC is applied at the time a building permit is applied for (See Exhibit 5). See city website http://www.orcity.org/publicworks/transportation-sdcs for more information. According to the City’s Transportation Consultant, John Replinger, there is not any specific formula that is generally recognized as a basis for the proportional share for TPR. Staff is working with ODOT to development an appropriate methodology, since ODOT is the agency whose facility will be affected by the regional growth of which the future development of the annexation are is a part. The City has established a formula applicable to the various improvements on OR 213 and used those for Red Soils and Clackamas Community College and will review those for possible application to the 213/Redland improvements. Due to the planned 213 / 205 improvements and with the new SDC fee schedule, which accounts for improvements to the ODOT system, staff will determine to what extent proportional share contributions by the developer of the annexing properties will be needed.
Clackamas River Water (CRW)
CRW was concerned that the City’s current service agreement with CRW (HOPP agreement) for properties above the 450’ pressure zone within the annexation area was not clarified in the Staff Report.
Response: Staff met with CRW staff to address their concerns. Staff has prepared draft revisions to the Staff Report (Exhibit 7). CRW is reviewing the draft clarifications and will be submitting comments into the record based on the incorporation of these revisions.
3a. AN 09-02. The applicant is requesting approval of an annexation of eight properties totalling approximately 53 acres. Page 4 of 84
Page 3 of 3
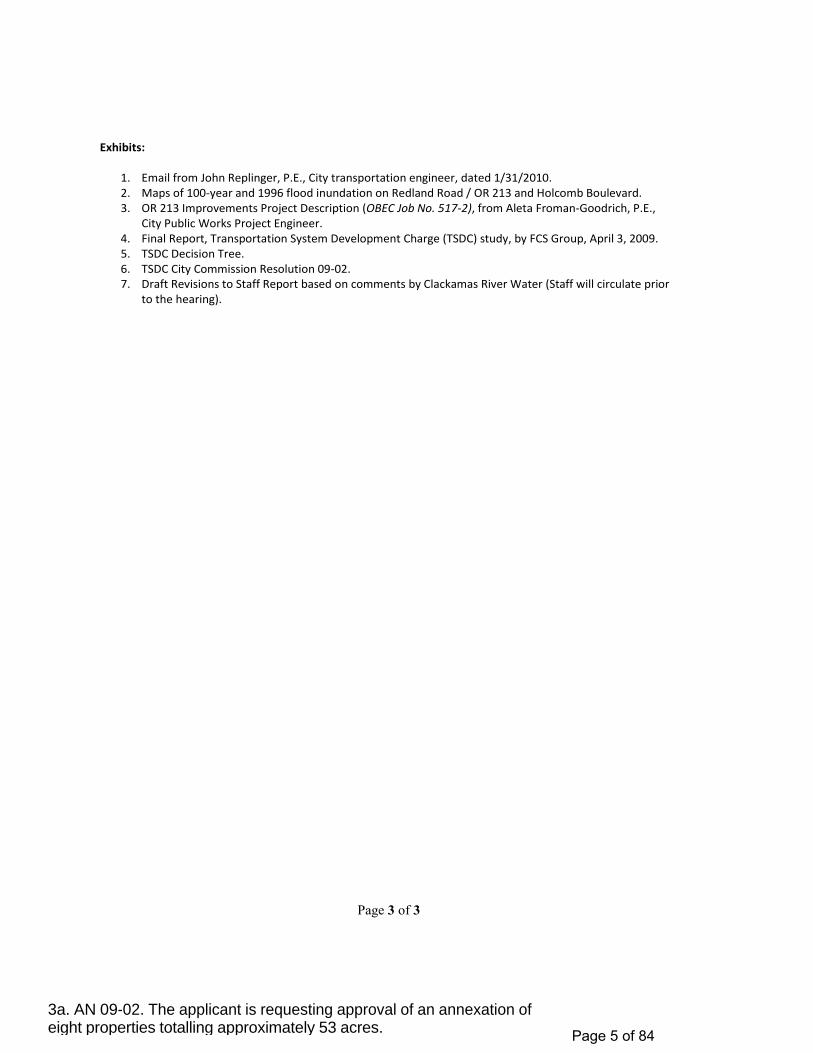
Exhibits:
1. Email from John Replinger, P.E., City transportation engineer, dated 1/31/2010. 2. Maps of 100-year and 1996 flood inundation on Redland Road / OR 213 and Holcomb Boulevard. 3. OR 213 Improvements Project Description (OBEC Job No. 517-2), from Aleta Froman-Goodrich, P.E.,
City Public Works Project Engineer. 4. Final Report, Transportation System Development Charge (TSDC) study, by FCS Group, April 3, 2009. 5. TSDC Decision Tree. 6. TSDC City Commission Resolution 09-02. 7. Draft Revisions to Staff Report based on comments by Clackamas River Water (Staff will circulate prior
to the hearing).
3a. AN 09-02. The applicant is requesting approval of an annexation of eight properties totalling approximately 53 acres. Page 5 of 84

1
Pete Walter
From: [email protected]: Sunday, January 31, 2010 9:23 PMTo: Pete WalterCc: Nancy Kraushaar; Tony KonkolSubject: Re: Ziegler Annexation AN 09-02
Pete: I don't think there is any specific formula that is generally recognized as a basis for the proportional share for TPR. I think the important thing is for us to develop what we think is appropriate and share that with ODOT, which is the agency whose facility will be affected by the regional growth of which this development is a part. We have established a formula applicable to the various improvements on OR 213 and used those for Red Soils and proposed the same for the Community College. I think we can review those for possible application to the 213/Redland improvements. With the new SDC fee schedule, which I understand accounts for improvements to the ODOT system, it may be that we no longer need to apply a specific proportional share for the Highway 213 corridor as we have in the past. A conference call to discuss this with Nancy, Tony, and Bill K. may be appropriate. If you have already figured that out and you simply want me to provide the explanation, the formula, and calculations based on the prevous examples, I can do that. I should be available by phone most of the week. Please let me know. John
John Replinger, PE Replinger & Associates LLC 6330 SE 36th Avenue Portland, OR 97202 503-719-3383 [email protected] ----- Original Message ----- From: "Pete Walter" <[email protected]> To: [email protected] Cc: "Nancy Kraushaar" <[email protected]>, "Tony Konkol" <[email protected]> Sent: Friday, January 29, 2010 9:50:34 AM GMT -08:00 US/Canada Pacific Subject: RE: Ziegler Annexation AN 09-02
John, There is one other thing the PC requested information on.
3a. AN 09-02. The applicant is requesting approval of an annexation of eight properties totalling approximately 53 acres. Page 6 of 84

3
I have a copy of the TIA prepared by Dunn Traffic relating to the possible development of the Ziegler property under zoning that would be applicable under the City jurisdiction. The analysis is complete with regard to short-term impacts, but based on issues raised by ODOT, some additional analysis will be required by the applicant to show compliance with the Transportation Planning Rule (TPR). This analysis will be required when the applicant seeks to rezone the property. I have not performed a detailed review of the TIA and recommend that be delayed until such time as the applicant makes application for rezoning or other actions that define a specific development proposal. As indicated above, some additional work related to TPR compliance will be required. I am prepared to work with you and the applicant's engineer to more clearly define the scope for additional analysis when a specific proposal is offered. Sincerely, John Replinger, PE Replinger & Associates LLC 6330 SE 36th Avenue Portland, OR 97202 503-719-3383 [email protected]
3a. AN 09-02. The applicant is requesting approval of an annexation of eight properties totalling approximately 53 acres. Page 8 of 84

02/01/2010
1996 and 100-yearfloods
4
Map created with OCMap 2010
3a. AN
09-02. The applicant is requesting approval of an annexation of
eight properties totalling approximately 53 acres.
Page 9 of 84

02/01/2010
1996 and 100-yearfloods
4
Map created with OCMap 2010
3a. AN
09-02. The applicant is requesting approval of an annexation of
eight properties totalling approximately 53 acres.
Page 10 of 84

02/01/2010
1996 and 100-yearfloods
4
Map created with OCMap 2010
3a. AN
09-02. The applicant is requesting approval of an annexation of
eight properties totalling approximately 53 acres.
Page 11 of 84

02/01/2010
1996 and 100-yearfloods
4
Map created with OCMap 2010
3a. AN
09-02. The applicant is requesting approval of an annexation of
eight properties totalling approximately 53 acres.
Page 12 of 84

Project Purpose and Need The purpose of the project is to improve operations and safety on OR 213 between the I-205 Interchange and the Redland Road overcrossing in order to:
• Maintain acceptable operational and safety levels on OR 213 and the I-205 Interchange. This section of OR 213 is designated as an expressway and serves as an important southeast Portland metropolitan area north-south transportation facility.
• Avoid or minimize instances of traffic on OR 213 backing up from the Washington Street/Clackamas River Drive intersection into the I-205 Interchange and the mainline freeway.
• Allow for continued development along and around this section of OR 213 and the surrounding area, which is within the city limits of Oregon City and the urban growth boundary of the Portland metropolitan area.
The project is needed for the following reasons:
• Current traffic demands frequently exceed the capacity of OR 213 through the project area. This creates traffic backups on OR 213 at both the Washington Street/Clackamas River Drive intersection and the Redland Road intersection, which occasionally extend into the I-205 Interchange and onto the freeway itself.
• Highway speeds (posted at 45 mph and 55 mph) combined with signalized intersections and high traffic volumes increase the risk of accidents. This section of highway has a Safety Investment Program (SIP) rating of 3. The signalized intersections of Washington Street/Clackamas River Drive and Redland Road are in the top 10 percent of Safety Priority Index System (SPIS) sites. See Appendix A for accident information.
• The area immediately adjacent to and surrounding this section of highway is within the city limits of Oregon City and the urban growth boundary of the Portland metropolitan area. This area has capacity for continued development, which will add to the traffic demands on OR 213.
Project Units and Phasing Plan The project team has developed this project under an assumption that long-term improvements along this section of OR 213 will be developed in a three-unit, three-phase approach. The three units are described below.
1. Unit 1 includes OR 213 from the south end of the Union Pacific Railroad (UPRR) Bridge, where Cascade Highway South begins, to the crossing of the unnamed tributary of Abernethy Creek. Unit 1 also includes Clackamas River Drive from approximately Melinda Street to OR 213; Washington Street from OR 213 to west of the Home Depot; and the two jughandle connectors.
2. Unit 2 includes OR 213 from the crossing of the unnamed tributary of Abernethy Creek to the
north end of the Redland Road Overcrossing, and Redland Road.
Final Design Acceptance Package OBEC Job No. 517-2 OR 213: I-205 - Redland Road Overcrossing (Oregon City) Page 2
3a. AN 09-02. The applicant is requesting approval of an annexation of eight properties totalling approximately 53 acres. Page 13 of 84

3. Unit 3 is the I-205 Interchange, which includes the I-205 Park Place Frontage Road and the I-205 ramps. The frontage road begins at the south end of the UPRR Bridge and runs north across I-205 on the interchange bridge.
The three proposed phases include the following:
1. The evaluation of the design and impacts of Phase 1 is described later in this DAP. Phase 1 includes the full build out of Unit 1, and minor changes within the Unit 3 interchange area to improve safety and operations until the entire interchange can be further upgraded. The complete build out of the Unit 3 interchange will be designed under a future project and DAP. The minor changes within Unit 3 included in Phase 1of this project are limited to striping changes, installation of median barrier, concrete island modifications, and rail upgrades to the UPRR Bridge and the I-205 Bridge. The partial build-out design changes will allow for the addition of a third northbound (NB) lane approaching the interchange, which will improve the operations of the interchange and OR 213. The third lane will be created by narrowing the median, travel lanes, and shoulders. Safety improvements within Unit 3 will include rail upgrades to the UPRR and I-205 Bridges.
2. The second phase includes a full build-out design for all of Unit 2. The evaluation of the
design and impacts, and more detailed information on the scope of Phase 2 can be found later in this DAP.
3. Phase 3 is not described in this DAP. Phase 3 includes recognized improvement needs within
the Unit 3 interchange area that have a high cost-to-benefit ratio and a high probability of not being compatible with future changes to the I-205 Interchange. The recognized needs include the widening or replacement of the UPRR and I-205 Bridges and the connecting roadways, which would allow for standard median, lane and shoulder widths through the interchange area under this project. The project team recommends that Phase 3 improvements be deferred until the scope of I-205 Interchange modifications is better defined. The full upgrade to the interchange should be included in the Phase 3 project.
The benefits of using this three-unit, three-phase approach include the following:
• Minimization of the risk of constructing a significant level of improvements during Phase 1and Phase 2 that do not fit the future reconstruction of the I-205 Interchange. Reconstruction of the interchange is likely to occur within the design life of facilities built as part of this project; however, the extent of future modifications is unknown. Therefore, it is not possible at this time to plan large-scale improvements within the interchange area to match future interchange reconstruction.
• Containment of costs and impacts of the Phase 1 and 2 projects so they can be completed as soon as possible at a budget commensurate with available funding. In addition, the two phases will be eligible for additional federal or state funding that may become available.
• Ability to make critical operational and safety improvements at the Washington Street and Redland Road intersections at this time while improvements to address less significant needs within the interchange area can be delayed. This will allow those changes to be better coordinated with the future interchange improvements and minimize the risk of constructing "throw away" improvements.
Phases of development and construction of the project are discussed in more detail below.
Final Design Acceptance Package OBEC Job No. 517-2 OR 213: I-205 - Redland Road Overcrossing (Oregon City) Page 3
3a. AN 09-02. The applicant is requesting approval of an annexation of eight properties totalling approximately 53 acres. Page 14 of 84

Phase 1 Phase 1 of the project, which is the only phase currently funded for construction, includes full build-out improvements within Unit 1 and minor improvements in the Unit 3 I-205 Interchange area. As mentioned above, full build-out improvements for Unit 3 will take place in Phase 3, which will be designed in a future project. Unit 1 Unit 1 improvements in Phase 1 include realignment of Washington Street and Clackamas River Drive to cross under OR 213 at a new bridge. The existing street connections will be modified so they connect OR 213 with the realigned Washington Street and Clackamas River Drive. These modifications combine to create a jughandle intersection configuration that eliminates left turns and east-west cross movements at the OR 213 intersection, reducing the number of signal phases from eight to two. Phase 1 also involves roadway widening and channelization changes on OR 213 to accommodate three travel lanes in each direction and right-turn lanes both southbound (SB) and NB at the jughandle intersection. The OR 213 roadway and the new bridge will be constructed to accommodate 12-foot travel lanes; 10-foot shoulder widths, including 2 feet shy distance; and an 8-foot-wide median. However, for Phase 1, striping and shoulder barrier will be used north of the jughandle intersection to taper lane widths to 11 feet and shoulder widths to 6 feet at the existing UPRR Bridge. This configuration will remain in place until the Unit 3 UPRR Bridge is replaced; the width of the new structure will match the width of the newly constructed Phase 1. The continued use of the existing UPRR structure to accommodate I-205/OR 213 movements will depend on future improvement of the I-205 Interchange. If a wider structure at the UPRR Bridge location does become part of the future interchange modifications, the Phase 1 striping would be modified and the shoulder barrier relocated to provide the 12-foot lanes, 10-foot shoulders, and 8-foot median used throughout the remainder of the design for the current project. Unit 3 Unit 3 improvements in Phase 1 will be limited to the work required to make channelization modifications to allow for the addition of a third NB lane between the UPRR Bridge and I-205 NB ramps, and to eliminate left turns and cross movements at the NB I-205 ramp terminals. The additional NB lane will be provided by reducing the median to 6 feet, the travel lanes to 11 feet, and the outside shoulders to 6 feet in width. The work included to make these channelization modifications include striping changes, installation of concrete median barrier, and alterations to concrete islands. As described under Unit 1, above, in the event the UPRR Bridge is replaced as a future Phase 3 project these reduced widths would be increased to an 8-foot median, 12 foot lanes, and 10 foot shoulders. The project team recommends that a decision on this issue be delayed until a design is developed for the I-205 Interchange. The Phase 1 work in Unit 3 will also include rail retrofits to the UPRR Bridge and the I-205 Bridge to increase the safety of these structures until they are replaced as part of a Phase 3 project. More detailed information about the scope of this Phase 1 work is found in later sections of this DAP and in the attached plans.
Final Design Acceptance Package OBEC Job No. 517-2 OR 213: I-205 - Redland Road Overcrossing (Oregon City) Page 4
3a. AN 09-02. The applicant is requesting approval of an annexation of eight properties totalling approximately 53 acres. Page 15 of 84

Phase 2 Phase 2 of the project includes full build-out improvements within Unit 2. Construction for Unit 2 is currently not funded; however, the City is pursuing funding for this phase of construction. It would be possible to split Phase 2 into sub-phases, as described in the Unit 2 section that follows. Unit 2 Phase 2 improvements are located entirely in Unit 2 and include widening OR 213 to accommodate the upgrade of the NB left-turn lane at the Redland Road intersection, the construction of a SB right-turn lane at the Redland Road intersection, and the addition of a third through travel lane in each direction. Phase 2 also includes widening and channelization changes on Redland Road. As described in Unit 1, above, the widening of OR 213 will accommodate 12-foot travel lanes and 10-foot shoulders, including 2 feet of shy distance. The median in this section of OR 213 will be 8 feet wide with a median barrier, except at the Redland Road intersection where it will be 20 feet wide to support a NB left-turn lane. Redland Road will be widened to provide two 12-foot travel lanes approaching OR 213, one 12-foot travel lane approaching Abernethy Road, a 14-foot median, and two 6-foot shoulders. Additional widening of Redland Road will be included at the Abernethy Road end of the alignment to provide a 12-foot-wide right-turn lane. Due to funding constraints, it is anticipated Unit 2 may need to be developed and constructed in two sub-phases (2A and 2B). The project team currently envisions Phase 2A to include construction on OR 213 for the SB right-turn lane, the third SB through travel lane, and the upgrade of the NB left-turn lane. Phase 2A would also include widening of Redland Road. Phase 2B would include the addition of the third NB through lane on OR 213. More detailed information about the scope of this work is found in later sections of this DAP and in the attached plans. Phase 3 Phase 3 improvements, not addressed in this DAP, are located in the Unit 3 I-205 Interchange area. The scope of the Phase 3 work cannot be fully defined at this time because of the unknown configuration of the future I-205 Interchange. The major cost items in Unit 3 that should be addressed in a future Phase 3 project are widening or replacing the UPRR Bridge; widening or replacing the I-205 Bridge; and widening the connecting roadway. These improvements have been separated into a future phase because the safety and operational benefits of addressing these substandard design elements are considered less significant than those gained by the Phase 1 and Phase 2 improvements included in this DAP. Design Exception approvals are being pursued for the substandard design elements for the Phase 1 and Phase 2 projects that are part of this DAP. Draft versions of the requests are included in Appendix B and further discussed in the Design Exceptions section of this report, below. Design Standards/Design Criteria ODOT facilities and facilities under ODOT jurisdiction will be developed using ODOT design standards. City and County facilities will be developed using local and American Association of State Highway Transportation Officials (AASHTO) design standards. Facilities include:
Final Design Acceptance Package OBEC Job No. 517-2 OR 213: I-205 - Redland Road Overcrossing (Oregon City) Page 5
3a. AN 09-02. The applicant is requesting approval of an annexation of eight properties totalling approximately 53 acres. Page 16 of 84

DEPARTMENT OF TRANSPORTATIONSTATE OF OREGON
PLANS FOR PROPOSED PROJECT
ST. HELENS
ASTORIA
MCMINNVILLE
ALBANYNEWPORT
CORVALLIS
HOODRIVER
DALLESTHE
MADRAS
PRINEVILLE
BEND
COQUILLE
GRANTSPASS
Ashland
BURNS
KLAMATH
FALLS
CONDON
MORO
PENDLETON
LA GRANDE
ENTERPRISE
VALE Ontario
PORTLAND
SALEM
MEDFORD
EUGENE
ROSEBURG
Athena
N. Powder
UnityDayville
Sisters
Juntura
Frenchglen
Burns Jct.
McDermitt
Paisley
La Pine
Crescent
Biggs
Lexington
HermistonBoardman
Ukiah
Arlington
Malin
Brookings
Coos Bay
Drain
Canyonvil le
Reedsport
Oakridge
GoshenFlorence
Lincoln City
Waldport
HomeSweet
DetroitAntelope
MaupinHebo
Cannon Beach
SeasideRainier
Milton-Freewater
30
26
101
20
99W
26 35 197
97
74
84
82
3
3951926
26
205
34
36
126
38
126
20
395
26
7
20
78
95
3953197
58
42
62
140
66
140
101
199
5
22
Bonanza
84
Junction City
BAKER CITY
HEPPNER
Copperfield
LakeSilver
JunctionCaveBEACH
GOLD
OrfordPort
82
LAKEVIEW
CANYONCITY
DayJohn
CITYOREGON
HILLSBORO
DALLAS
Redmond
Z
Z
Val leyJordan
205
LET’S ALL
WORK TOGETHER
TO MAKE THIS
JOB SAFE
SA
FETY
FIR
ST
SA
FETY
FIR
ST
SA
FETY
FIR
ST
SA
FETY
FIR
ST
SA
FETY
FIR
ST
SA
FETY
FIR
ST
SA
FETY
FIR
ST
SA
FETY
FIR
ST
SA
FETY
FIR
ST
SA
FETY
FIR
ST
SA
FETY
FIR
ST
SA
FETY
FIR
ST
SA
FETY
FIR
ST
SA
FETY
FIR
ST
SA
FETY
FIR
ST
SA
FETY
FIR
ST
SA
FETY
FIR
ST
SA
FETY
FIR
ST
SA
FETY
FIR
ST
SA
FETY
FIR
ST
SA
FETY
FIR
ST
SA
FETY
FIR
ST
SA
FETY
FIR
ST
SA
FETY
FIR
ST
ATTENTION:
Oregon Law Requires You To Follow Rules
Adopted By The Oregon Utility Notification
Center. Those Rules Are Set Forth In
OAR 952-001-0010 Through OAR 952-001-0090.
You May Obtain Copies Of The Rules By Calling
The Center. (Note: The Telephone Number For
The Oregon Utility Center Is (503) 232-1987.)
SHEET NO. DESCRIPTION
INDEX OF SHEETS
1
1A Index Of Sheets Cont’d. & Std. Drg. Nos.
Title Sheet
L:\Projects\517\517002\Roadway\Deliverables\517002f_1.ts1
1
PROJECT NUMBERFEDERAL HIGHWAY
ADMINISTRATION
SHEET
NO.
OREGON
DIVISION
PLANS PREPARED FOR
OREGON DEPARTMENT OF TRANSPORTATION
Corporate Office:
OREGON TRANSPORTATION COMMISSION
COMMISSIONER
COMMISSIONER
COMMISSIONER
VICE-CHAIRMichael Nelson
Alan Brown
Gail Achterman
Janice Wilson
David Lohman
Matthew L. Garrett DIRECTOR OF TRANSPORTATION
CHAIR
File No.
...
JOHN KALVELAGE - PROJECT MANAGER
CLACKAMAS COUNTY
CLACKAMAS COUNTY
Print name and title
Concurrence by ODOT Chief Engineer
Signature & date
These plans were developed using ODOT & AASHTO
design standards. Exceptions to these standards, if any,
have been submitted and approved by the ODOT
Chief Engineer or their delegated authority.
Approving Authority: ________________________________
________________________________
________________________________
JANUARY 2011
Overall Length Of Project - _____ Miles
DARTMOUTH
AVE.
AVE.
FORSYTHE
APOLLO
THURMANPOPE
ST.
FIRST
29
32
28
20
CLA
CK
AM
ETTE
AG
NES
ST.
ST.
PENN LN.
POLK
’B’
’C’
GAIN
CLEVELAND
ST.
ROCK
AV
E.
AV
E.
BEEMER
LIVESAY
LONGVIEW
WAYA
LD
RIC
H C
T.
McL
OU
GH
LIN
HOLLY
17TH
AV
E.
CT.
SOU
TH
CA
SCA
DE
ST.
BLVD.
POLK
ST.
W.
W.
W.
W.
W.
W.
E.
E.
RD.
WA
KE
-
BONN
NO
BL
E
JACOBS
DUNES
21399E
ST.
ST.
ARLINGTONBERKELEY
CLARENDON
FAIRFIELD
BA
RTO
N
BELLEVU
E
AVE.
EXETER
CLACKAMAS
BLVD.
AMES ST.
RIVERDALE
DR.
EXPLO
RER
MERCURY
ST.
ST.ST.
BRIDGEVIEW
LN.RD.
LN.
HU
NT
ER
AV
E.
AG
NE
SS
PAR
K P
LA
CE
CT
.
82ND
DR.
BLV
D.
APP
ER
SON HEN
RY
TAYLOR
AV
E.
LN.AVE.
ST.
HA
RLE
Y
2930
31 32 28
33
2120
29
19
30 29
MAIN
ST.
DR
.
ST.
ST.
ST.
ST.
ST.
ST.
ST.
ST.
ST.
ST.
ST.
ST.
ST.
ST.
ST.
ST.
ST.ST.
ST.
ST.
RD.
ST.
9TH
8TH
7TH
DAVIS
OGLESBYRD.
RD
.
DIV
ISION
ST.
HARRISON
VAN
ADAMS
Q.
ST.
ST.
ST.
ST.
ST.ST.
RD.
RD.
’D’
’A’
LA RAE
ST.
LITTLE
ST.
ST.
HIR
AM
SWA
N
AV
E.
AV
E.
BLV
D.
BLVD.
HOLCOMB WAY
FRO
NT
APP
ER
SON
REDLAND
PARK
ST.
DONOVAN
AVE.ST
.
CLA
CK
AM
AS
RIV
ERD
R.ST.
ST.
BUREN
McLOUGHLIN AVE.
BLV
D.
ST.
16TH
15TH
14TH
13TH
12TH
11TH
12TH
13TH
14TH
10TH
10TH
18TH
ABERNETHY
ST.
ST.
ST.
ST.15TH
11TH
HA
RL
EY
ANN
CLEVELAND
DR.
17TH
ST.
WA
YN
E
DR
.
GLA
DY
S
AV
E.
FRE
DE
RIC
K S
T.
REDLAND
RD.
BEAN CT.
CIR
.
TRIL
LIU
M
PARK
DR
.
SWORDFISH
CANYONCT.
HW
Y.
NO
. 160
PORTLAND
NO
. 64
16TH
FWY.
CLACKAMAS
ABERNETHYRD.
PIERCE
ST.
TAYLOR
ST.
HARRISON
ST.
ST.
ST.
ST.
ST.
ST.
BERKELEY
ARLINGTON
ST.
CREST LN.
RO
BIN
RD.
PRESC
OTT
ST.
WAY
DR
.
S.E. W
ASH
ING
TON
CASCADE HWY. SOUTH
CASCADE HWY. SOUTH
PROJECT LOCATION
OR213: I-205 - REDLAND ROAD O’XING. (OREGON CITY)
OR213: I-205 - REDLAND ROAD O’XING. (OREGON CITY)
GRADING, DRAINAGE, STRUCTURES, PAVING, SIGNING, ILLUMINATION & SIGNALS
N
T. 2 S., R. 2 E., W.M.ST.
205
(ANCHOR
WY.)
FINAL D
ESIGN
ACCEPTANCE PACKAGE
JANUARY 2
010
CLACKAMAS RIVER
WIL
LA
METTE R
IVER
EAST
OREGONCITY
Tour
Cre
ek
Creek
Abernethy
UNION
PACIFIC
R.R.
3a. AN
09-02. The applicant is requesting approval of an annexation of
eight properties totalling approximately 53 acres.
Page 17 of 84

l:\projects\517\517002\roadway\deliverables\517002f_1B.ts3File No.
04:01 PM1/5/2010
SHEET
NO.
OREGON DEPARTMENT OF TRANSPORTATION
Corporate Office:
"W
" 2
55+00
"W" 2
60+00
"W" 2
65+00
"W
" 2
70+
00
"W" 2
75+00
"W" 280+00
"W" 285+00
"W" 2
90+00
"W" 2
95+00
"W
" 3
00+00
"W" 3
05+00
"O
R" 6
5+
00
"O
R" 9
5+
00
"O
R" 6
0+
00
"O
R" 7
0+
00
"O
R" 7
5+
00
"O
R" 8
0+
00
"O
R" 8
5+
00
"O
R" 9
0+
00
"O
R" 1
00+
00
"O
R" 1
05+
00
"W
" 2
55+00
"W" 2
60+00
"W" 2
65+00
"W" 2
75+00
"W" 280+00
"W" 285+00
"W" 2
90+00
"W" 2
95+00
"W
" 3
00+00
"W" 3
05+00
"JW" 30+00"
OR
" 6
5+
00
"R" 10+00
"R" 1
5+00
"JE
" 6
05+
00
"JE" 610+
00
CLACKAMAS COUNTY
CASCADE HWY. SOUTH
Design Team Leader - John Kalvelage
Designed By - Chris Bores
Drafted By - Serban Dinca
OR213: I-205 - REDLAND ROAD O’XING. (OREGON CITY)
FINAL D
ESIGN
ACCEPTANCE PACKAGE
JANUARY 2
010
1B
"OR" LINE
SHEET LAYOUT PLAN
"R" LINE
"W" LINE
"JW" LINE
"JE" LINE(Easterly Jughandle)
(Westerly Jughandle)
(Redland Road)
(OR213)
(Clackamas River Drive
& Washington Street)
Design Team Leader - John Kalvelage
Designed By - Rick Garrison
Drafted By - Serban Dinca
Sheet 8 ("W" Line,
"W" 253+00 to
"W" 262+00)
Sheet 9 ("W" Line,
"W" 262+00 to
"W" 275+00)
("JE" Line, all)
Sheet 10 ("W" Line,
"W" 275+00 to
"W" 288+00)
Sheet 11 ("W" Line,
"W" 288+00 to
"W" 300+00)
Sheet 7 ("OR" Line,
"OR" 103+00 to
"OR" 109+89.26)
Sheet 6 ("OR" Line,
"OR" 92+00 to
"OR" 103+00)
("R" Line, all)
Sheet 5 ("OR" Line,
"OR" 80+00 to
"OR" 92+00)
Sheet 4 ("OR" Line,
"OR" 68+00 to
"OR" 80+00)
("JW" Line, all)
"O
R" 6
0+
00
"O
R" 6
5+
00
"O
R" 7
0+
00
"O
R" 7
5+
00
"O
R" 8
0+
00
"O
R" 8
5+
00
"O
R" 1
05+
00
"O
R" 1
00+
00"
OR
" 9
5+
00
"O
R" 9
0+
00
"W
" 2
55+00
"W" 2
60+00
"W" 2
65+00
"W
" 2
70+
00
"W" 2
75+00
"W" 280+00
"W" 285+00
"W" 2
90+00
"W" 2
95+00
"W
" 3
00+00
"R" 10+00
"R" 1
5+00
"JE
" 6
05+
00
"JE" 610+
00
"JW" 30+00
Sheet 3 ("OR" Line,
"OR" 55+60 to
"OR" 68+00)
3a. AN
09-02. The applicant is requesting approval of an annexation of
eight properties totalling approximately 53 acres.
Page 18 of 84

3a. AN
09-02. The applicant is requesting approval of an annexation of
eight properties totalling approximately 53 acres.
Page 19 of 84

CONSULTING SERVICES PROVIDED BY:
Oregon City, Oregon
Final Report for
TRANSPORTATION SYSTEM DEVELOPMENT CHARGE STUDY
April 3, 2009
www.fcsgroup.comThis entire report is made of readily recyclable materials, including the bronze wire binding and the front and back cover, which are made from post-consumer recycled plastic bottles.
WASHINGTON: Redmond Town Center 7525 166th Ave. NE, Suite D-215 Redmond, WA 98052 T: 425.867.1802 F: 425-867-1937 OREGON: 14020 SE Johnson Rd, Suite 205 Milwaukie, Oregon 97267 T: 503.353.7440 F: 503.353.7442 CALIFORNIA: 225 Bush Street, Suite 1825 San Francisco, California 94111 T: 415-445-8947 F: 415-398-1601
3a. AN 09-02. The applicant is requesting approval of an annexation of eight properties totalling approximately 53 acres. Page 20 of 84

City of Oregon City Transportation System Development Charge Study
Final Report Table of Contents
Section Description Page
I. Introduction 1
II. System Development Charge Methodology 1
III. TSDC Calculation 4
Issue Papers Appendix A
Technical Analysis Appendix B
3a. AN 09-02. The applicant is requesting approval of an annexation of eight properties totalling approximately 53 acres. Page 21 of 84

Oregon City, OR Transportation SDC Study
1
SECTION 1: INTRODUCTION In April 2008, the City of Oregon City contracted with Financial Consulting Solutions Group, Inc. (FCS GROUP), and its subconsultant DKS Associates, to perform a transportation system development charge (TSDC) study. Oregon City is a growing city experiencing increasing demands on its transportation infrastructure. The City’s latest transportation system plan identified a number of improvements that are needed to maintain and expand system capacity over the next two decades. With the study, the City wished to implement an equitable, adequate, and defensible transportation SDC that would generate funding to meet the needs of growth without unduly burdening existing residents and business owners.
Consistent with these objectives, the following general approach was used to calculate the City’s transportation SDC:
♦ Development of Policy Framework. In this step, we wrote issue papers defining key policy issues, describing alternatives, and providing recommendations for City staff and the Oregon City Transportation Advisory Committee (TAC). The result was a set of recommendations on key TSDC policy issues that provided guidance for the technical analysis and input for the City Commission to consider in its decision on adoption. The issue papers and resulting TAC recommendations are included as Appendix A.
♦ Conduct Technical Analysis. In this step, we worked with City staff and the project engineer to finalize the TSDC project lists, isolate the recoverable portion of existing and planned facility costs, and calculate proposed fees. The technical analysis is included as Appendix B.
♦ Assemble Documentation and Presentation. In this step, we wrote the report describing the recommended policies and resulting charges, and drafted the adopting resolution.
SECTION 2: SYSTEM DEVELOPMENT CHARGE METHODOLOGY A system development charge is a one-time fee imposed on new development (and some types of re-development) at the time of development. The fee is intended to recover growth’s fair share of the costs of existing and planned facilities that provide the necessary capacity to accommodate future development.
Oregon Revised Statute (ORS) 223.297 - 223.314 defines SDCs and specifies how they shall be calculated, applied, and accounted for. By statute, an SDC is the sum of two components:
♦ a reimbursement fee, designed to recover costs associated with capital improvements already constructed or under construction, and
♦ an improvement fee, designed to recover costs associated with capital improvements to be constructed in the future.
The reimbursement fee methodology must be based on “the value of unused capacity available to future system users or the cost of the existing facilities”, and must further consider prior contributions by existing users and gifted and grant-funded facilities. The calculation must also “promote the objective of future system users contributing no more than an equitable share to the cost of existing facilities.” Reimbursement fee
3a. AN 09-02. The applicant is requesting approval of an annexation of eight properties totalling approximately 53 acres. Page 22 of 84

Oregon City, OR Transportation SDC Study
2
proceeds may be spent on any capital improvements related to the systems for which the SDC is applied – i.e., transportation SDCs must be spent on transportation improvements.
The improvement fee methodology must include only the cost of projected capital improvements or portions of improvements needed to increase system capacity for future users. In other words, the cost(s) of planned projects or portions of projects that correct existing deficiencies, or do not otherwise increase capacity for future users, may not be included in the improvement fee calculation. Improvement fee proceeds may be spent only on capital improvements, or portions thereof, which increase the capacity of the systems for which they were applied.
A. REIMBURSEMENT FEE METHODOLOGY The calculation of the reimbursement fee, described in detail in Section III, is fairly straightforward under the approach taken. In short, it is the dollar cost of unused, available, system capacity divided by the capacity it will serve. The unit of capacity used becomes the basis of the fee. In addition to the cost or value of the system, Oregon law (ORS 223.304) requires that the reimbursement fee methodology also incorporate the following:
♦ “Ratemaking principles employed to finance publicly owned capital improvements”, taken to mean that the fees must be calculated to equitably recover appropriate costs;
♦ “Prior contributions by existing users”, taken to mean that the cost of contributed assets should not be included in the reimbursement fee basis;
♦ “Gifts or grants from federal or state government or private persons”, taken to mean that gifted or grant-funded assets should not be included in the reimbursement fee basis; and
♦ “Other relevant factors identified by the local government imposing the fee”.
Finally, the methodology must promote the objective of future system users contributing no more than an equitable share to the cost of existing facilities.
Most of the City’s arterial and collector streets were once County roads or State highways, which were ultimately funded through general tax sources. When considering deducting tax-funded infrastructure costs from the fee basis, it is most important to acknowledge that all transportation system users pay taxes – whether or not their properties are developed. Hence, a developer can argue that he / she has already paid for a share of that portion of the transportation system that has been constructed with tax revenues. This is unlike a water, sewer, or stormwater service, in which there are usually ratepayers to catch up with and reimburse, and is a strong argument for reducing the reimbursement fee cost basis by the corresponding portion of system value that has been funded by tax sources – including system infrastructure that was once part of the County or State system.
On the other hand, a strong argument can be made that previously paid SDCs need not be deducted from the reimbursement fee cost basis. If the previously paid charges have funded facilities that still have unused capacity available for growth, then the cost of that capacity must be included in the reimbursement fee cost basis in order for new customers to pay for a full share of the capacity that will serve them.
Therefore, we recommend that the City base the TSDC reimbursement fee entirely on the cost of unused capacity provided by infrastructure constructed using previously collected SDCs. This recommendation is further discussed in Issue Paper #1, provided in Appendix A.
3a. AN 09-02. The applicant is requesting approval of an annexation of eight properties totalling approximately 53 acres. Page 23 of 84

Oregon City, OR Transportation SDC Study
3
B. IMPROVEMENT FEE METHODOLOGY The improvement fee calculation, like that of the reimbursement fee, is straightforward. In short, it is the eligible dollar cost of capacity-increasing capital projects divided by the capacity they will serve. Again, the unit of capacity used becomes the basis of the fee. The overriding issue to consider in the improvement fee calculation is the identification and separation of capacity-increasing capital costs.
We recommend that the City utilize the “capacity” method to allocate costs to the improvement fee basis. Under the capacity approach, the cost of a given project is allocated to growth proportionately by the capacity made available for growth. As an example, assume we are allocating the $1 million cost of adding a lane to an existing roadway to meet existing demand as well as the needs of growth. If the new lane provides capacity for 500 trips and 200 meet an existing deficiency and 300 are for growth, then the allocation to the improvement fee basis would be 300 / 500 = 60% of $1 million, or $600,000. This recommendation is further discussed in Issue Paper #2, provided in Appendix A.
C. CALCULATION SUMMARY In general, an SDC is calculated by adding the applicable reimbursement fee component to the applicable improvement fee component. Each separate component is calculated by dividing the eligible cost by the appropriate measure of growth in capacity. The unit of capacity used becomes the basis of the charge. A sample calculation is shown below.
Reimbursement Fee Improvement Fee SDC
Eligible cost of capacity in
existing facilities
+
Eligible cost of planned capacity-increasing
capital improvements
=
SDC ($ / unit)
Growth in system capacity demand
Growth in system capacity demand
D. SDC (IMPROVEMENT FEE) CREDITS The law requires that credits be provided against the improvement fee for the construction of qualified public improvements. Oregon Revised Statute 223.304 states that, at a minimum, credits be provided against the improvement fee for
“the construction of a qualified public improvement. A ‘qualified public improvement’ means a capital improvement that is required as a condition of development approval, identified in the plan and list adopted pursuant to ORS 223.309 and either:
(a) Not located on or contiguous to property that is the subject of development approval; or
(b) Located in whole or in part on or contiguous to property that is the subject of development approval and required to be built larger or with greater capacity than is necessary for the particular development project to which the improvement fee is related.”
The law further states that credits
“may be granted only for the cost of that portion of such improvement that exceeds the local government’s minimum standard facility size or capacity needed to serve the particular development project or property.”
3a. AN 09-02. The applicant is requesting approval of an annexation of eight properties totalling approximately 53 acres. Page 24 of 84

Oregon City, OR Transportation SDC Study
4
The challenge is to craft a credit approach that meets statutory requirements and the City’s assumed general objectives for cash flow, prioritization of capital projects, and orderly but sustained development. It must be noted that we believe it is important for the City to retain as much control as possible over the prioritization and implementation of its capital plan(s). These plans are created to address total system needs – not just the needs of growth. Without control over how and when those needs are addressed, the re-prioritization of projects over time can leave important City needs unmet. To avoid this outcome, credits should:
♦ be only for the portion of the agreed-upon or planned cost of capacity in excess of that needed to serve the particular development;
♦ not be transferable to other developers;
♦ be for planned projects only; and
♦ be provided only upon completion of a “qualified public improvement”.
We recommend that the City maintain its current SDC credit policy, which is in compliance with statutory requirements and incorporates our recommended guidelines. This recommendation is further discussed in Issue Paper #3, provided in Appendix A.
It is important to note that the possession of credits does not necessarily obligate the City to provide cash redemption for SDC credits. In order to provide full compensation to developers while also minimizing the financial risk to the City, we recommend that the City’s credit policy include cash reimbursement only from SDCs generated by the build out of the development in question. As a result, the City will have the ability to choose the timing and the improvements from a healthy cash position. This recommendation is further discussed in Issue Paper #4, provided in Appendix A.
E. INDEXING CHARGE FOR INFLATION Oregon law (ORS 223.304) allows for the periodic indexing of system development charges for inflation, as long as the index used is
“(A) A relevant measurement of the average change in prices or costs over an identified time period for materials, labor, real property or a combination of the three;
(B) Published by a recognized organization or agency that produces the index or data source for reasons that are independent of the system development charge methodology; and
(C) Incorporated as part of the established methodology or identified and adopted in a separate ordinance, resolution or order.”
We recommend that Oregon City continue to index its TSDC to the Engineering News Record (ENR) Construction Cost Index (CCI) for the City of Seattle, and adjust the charge annually as per that index.
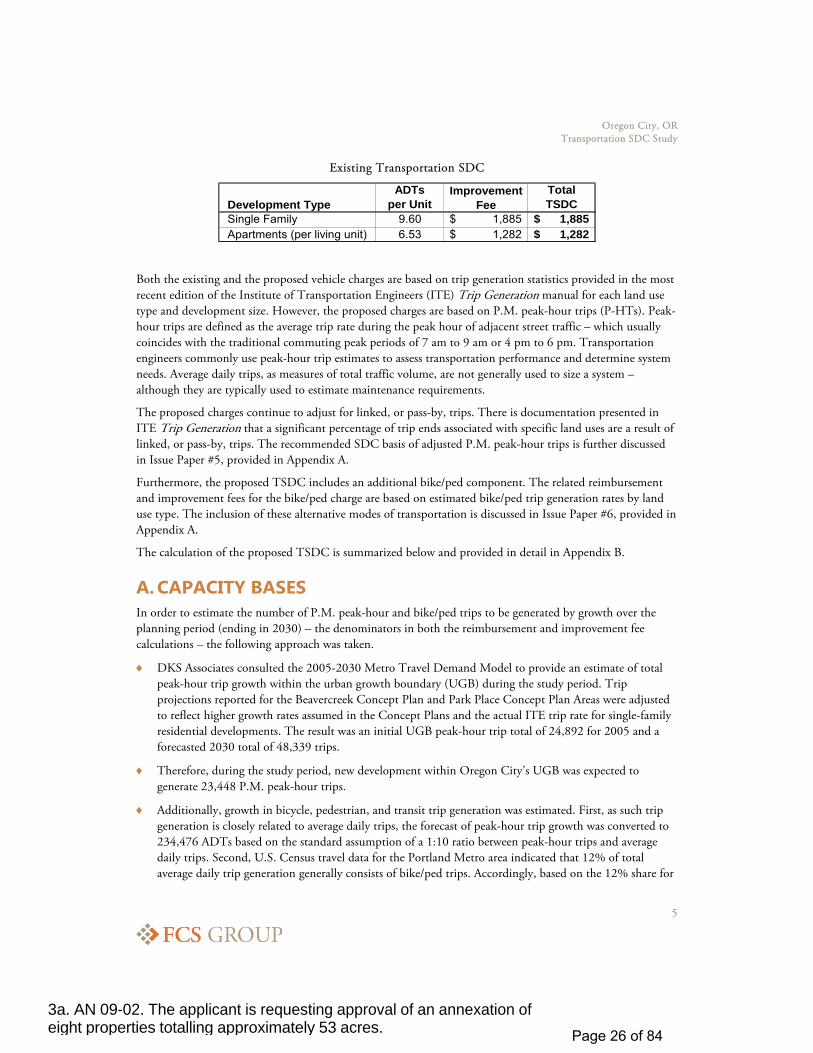
SECTION 3: TSDC CALCULATION The City’s existing transportation SDC is based on projected trip generation by land use. Specifically, new development is charged by added average daily trips (ADTs). Existing residential transportation SDCs are provided below: [Commercial charges vary by land use type.]
3a. AN 09-02. The applicant is requesting approval of an annexation of eight properties totalling approximately 53 acres. Page 25 of 84
Oregon City, OR Transportation SDC Study
5
Existing Transportation SDC
Development TypeADTs
per UnitImprovement
FeeTotal TSDC
Single Family 9.60 1,885$ 1,885$ Apartments (per living unit) 6.53 1,282$ 1,282$
Both the existing and the proposed vehicle charges are based on trip generation statistics provided in the most recent edition of the Institute of Transportation Engineers (ITE) Trip Generation manual for each land use type and development size. However, the proposed charges are based on P.M. peak-hour trips (P-HTs). Peak-hour trips are defined as the average trip rate during the peak hour of adjacent street traffic – which usually coincides with the traditional commuting peak periods of 7 am to 9 am or 4 pm to 6 pm. Transportation engineers commonly use peak-hour trip estimates to assess transportation performance and determine system needs. Average daily trips, as measures of total traffic volume, are not generally used to size a system – although they are typically used to estimate maintenance requirements.
The proposed charges continue to adjust for linked, or pass-by, trips. There is documentation presented in ITE Trip Generation that a significant percentage of trip ends associated with specific land uses are a result of linked, or pass-by, trips. The recommended SDC basis of adjusted P.M. peak-hour trips is further discussed in Issue Paper #5, provided in Appendix A.
Furthermore, the proposed TSDC includes an additional bike/ped component. The related reimbursement and improvement fees for the bike/ped charge are based on estimated bike/ped trip generation rates by land use type. The inclusion of these alternative modes of transportation is discussed in Issue Paper #6, provided in Appendix A.
The calculation of the proposed TSDC is summarized below and provided in detail in Appendix B.
A. CAPACITY BASES In order to estimate the number of P.M. peak-hour and bike/ped trips to be generated by growth over the planning period (ending in 2030) – the denominators in both the reimbursement and improvement fee calculations – the following approach was taken.
♦ DKS Associates consulted the 2005-2030 Metro Travel Demand Model to provide an estimate of total peak-hour trip growth within the urban growth boundary (UGB) during the study period. Trip projections reported for the Beavercreek Concept Plan and Park Place Concept Plan Areas were adjusted to reflect higher growth rates assumed in the Concept Plans and the actual ITE trip rate for single-family residential developments. The result was an initial UGB peak-hour trip total of 24,892 for 2005 and a forecasted 2030 total of 48,339 trips.
♦ Therefore, during the study period, new development within Oregon City’s UGB was expected to generate 23,448 P.M. peak-hour trips.
♦ Additionally, growth in bicycle, pedestrian, and transit trip generation was estimated. First, as such trip generation is closely related to average daily trips, the forecast of peak-hour trip growth was converted to 234,476 ADTs based on the standard assumption of a 1:10 ratio between peak-hour trips and average daily trips. Second, U.S. Census travel data for the Portland Metro area indicated that 12% of total average daily trip generation generally consists of bike/ped trips. Accordingly, based on the 12% share for
3a. AN 09-02. The applicant is requesting approval of an annexation of eight properties totalling approximately 53 acres. Page 26 of 84

Oregon City, OR Transportation SDC Study
6
bike/ped trips and the 234,476 ADT growth estimate in vehicle trips, total average daily trip growth – including bike/ped trips – during the period was estimated to total 266,450.
♦ Therefore, during the study period, new development within the UGB was expected to generate 31,974 bike/ped trips per day.
B. REIMBURSEMENT FEE CALCULATION In order to estimate the cost of unused capacity in the existing transportation system – the numerator in the reimbursement fee calculation for the vehicle charge – the following approach was taken.
♦ It is important to first recall that the City’s transportation infrastructure has been largely contributed and/or funded by general tax sources, leaving only unused capacity in SDC-funded infrastructure eligible for reimbursement. FCS GROUP found $7,775,416 of historical transportation SDC (improvement fee only) expenditures from FY 1993 through FY 2001. Current unused capacity was calculated by reducing the SDC expenditure total for each year proportionally by the estimated trip growth that has occurred since that year. The resulting total of unused capacity in the existing system was $6,208,392.
♦ Based on forecasted growth of 23,448 P.M. peak-hour trips, the resulting reimbursement fee was $264.78 per peak-hour vehicle trip.
C. IMPROVEMENT FEE CALCULATIONS The following approach was taken to determine the cost of capacity-increasing capital improvements for inclusion in the improvement fee cost bases.
♦ DKS Associates provided the 2008 list of capital projects needed to increase vehicle capacity within the UGB. The sum of this list of project costs in current dollars was $312,918,784, of which the City was expected to be responsible for $244,939,884.
♦ DKS Associates then determined the extent to which each improvement provided capacity for future development. The preferred basis for these TSDC allocations was growth's share of total future peak-hour trips at the site of improvement. When such data was unavailable, baseline projections of vehicle/capacity (V/C) ratios were utilized to determine existing system deficiencies. The resulting total of eligible costs was $158,455,615.
♦ Finally, the beginning FY 2007 transportation SDC fund balance – $1,614,627 – was deducted from the eligible cost total to (1) recognize that the fund balance is available for spending on the project list and (2) prevent new users from paying for those project costs twice. The resulting net total of $156,840,988 was the improvement fee cost basis.
♦ Based on forecasted growth of 23,448 P.M. peak-hour trips, the resulting improvement fee was $6,689.01 per peak-hour vehicle trip.
♦ Additionally, DKS Associates provided a 2008 list of capital projects needed to increase bike/ped capacity within the UGB. The sum of this list of project costs in current dollars was $13,260,367.
♦ To assign project costs to the bike/ped TSDC cost basis, an allocation equal to growth’s share of future vehicle trip generation – 48.5% – was applied. The sum of each project’s growth allocation resulted in a total $6,432,131 of improvement fee-eligible costs.
3a. AN 09-02. The applicant is requesting approval of an annexation of eight properties totalling approximately 53 acres. Page 27 of 84

Oregon City, OR Transportation SDC Study
7
♦ Based on forecasted growth of 31,974 bike/ped trips, the resulting improvement fee was $201.17 per bike/ped trip.
D. RECOMMENDED SYSTEM DEVELOPMENT CHARGE The recommended TSDC of $7,000 per peak-hour vehicle trip and $202.51per bike/ped trip is the sum of the related reimbursement fees and improvement fees, adjusted by an administrative cost recovery factor of 0.67%, or $46 per vehicle trip and $1.34 per bike/ped trip. The administrative cost recovery factor was derived by dividing projected annual TSDC accounting and administrative costs, including the amortized cost of this study, by forecasted annual vehicle and bike/ped TSDC revenues. The resulting recommended TSDCs for a comprehensive list of land uses are provided immediately following this section.
Note that given the relatively small amount of data on bicycle and pedestrian trip generation by land use, it is recommended that the following bike/ped trip groupings be utilized to assess the bike/ped SDC:
Daily Bike/Ped Trip Generation and SDC (Per Unit of Development)
Group Trips per Unit
SDC per Unit
Group 1 0.1 $ 20.25
Group 2 0.2 $ 40.50
Group 3 0.4 $ 81.00
Group 4 0.6 $ 121.51
Group 5 1.0 $ 202.51
Group 6 2.0 $ 405.02 Assignments to each group are made by land use designation, as shown in the Bike / Ped TSDC schedule following this section.
E. SDC IMPLEMENTATION There are two transit and limited-parking corridors or areas within the City – the designated regional center and Molalla Avenue. Such corridors are suitable for higher residential densities, high-volume non-residential uses, and mixed use properties. Traffic modeling has shown that developments in such areas have lower vehicle trip generation rates.
To account for the expected reduction in residential vehicle trip generation, we recommend that the City provide a 10% discount on the TSDC for residential developments within these areas. Similarly, non-residential developments in such areas should be assessed a TSDC for the lesser of either their estimated trip generation rate or the trip rate for the Shopping Center land use. This recommendation is further discussed in Issue Paper #7, provided in Appendix A.
Finally, in July 2007, the Portland area metropolitan service district (Metro) published a report detailing the various approaches to crafting system development charges (SDCs) that promote full and equitable cost recovery. The report noted that the validity of each approach varied by jurisdiction. As such, to the extent practical, the City’s TSDC was designed to be consistent with the five key SDC practices and policies recommended in the report:
♦ full cost recovery,
3a. AN 09-02. The applicant is requesting approval of an annexation of eight properties totalling approximately 53 acres. Page 28 of 84

Oregon City, OR Transportation SDC Study
8
♦ impact-based SDCs,
♦ recognition of cost variations by location,
♦ green design,
♦ and technical vs. policy-based solutions.
These recommendations are further discussed in Issue Paper #8, provided in Appendix A.
3a. AN 09-02. The applicant is requesting approval of an annexation of eight properties totalling approximately 53 acres. Page 29 of 84

Oregon City, OR Transportation SDC Study
9
Vehicle TSDC (1)
ITE Code Customer Type Land Use Description Peak-Hour
Trips
Pass-By Trip
Factor
Adjusted P-H Ts TSDC Units
110 General Light Industrial
Typically less than 500 employees, free standing and single use. Examples: Printing plants, material testing laboratories, data processing equipment assembly, power stations.
0.98 1 0.98 6,860$ KSF
130 Industrial Park Industrial Park areas that contain a number of industrial and/or related facilities (mix of manufacturing, service, and warehouse). 0.86 1 0.86 6,020$ KSF
140 Manufacturing Facilities that convert raw materials into finished products. Typically have related office, warehouse, research, and associated functions. 0.74 1 0.74 5,180$ KSF
151 Mini-WarehouseStorage Units or Vaults rented for storage of goods. Units are physically separate and access through an overhead door or other common access point. Example: U-Store-It.
0.26 1 0.26 1,820$ KSF
210 SF Detached Single family detached housing. 1.01 1 1.01 7,070$ DU
220 Apartment Rental Dwelling Units within the same building. At least 4 units in the same building. Examples: Quadplexes and all types of apartment buildings. 0.62 1 0.62 4,340$ DU
230 Condo/Townhouse Residential Condominium/Townhouses under single-family ownership. Minimum of two single family units in the same building structure. 0.52 1 0.52 3,640$ DU
240 Mobile Home Trailers or Manufactured homes that are sited on permanent foundations. Typically the parks have community facilities (laundry, recreation rooms, pools).
0.59 1 0.59 4,130$ DU
253 Elderly HousingRestricted to senior citizens. Contains residential units similar to apartments or condos. Sometimes in self-contained villages. May also contain medical facilities, dining, and some limited, supporting retail.
0.17 1 0.17 1,190$ DU
310 Hotel Lodging facility that may include restaurants, lounges, meeting rooms, and/or convention facilities. Can include a large motel with these facilities. 0.59 1 0.59 4,130$ Room
320 Motel Sleeping accommodations and often a restaurant. Free on-site parking and little or no meeting space. 0.47 1 0.47 3,290$ Room
430 Golf CourseIncludes 9, 18, 27, and 36 hole municipal and private country clubs. Some have driving ranges and clubhouses with pro shops, restaurants, lounges. Many of the muni courses do not include such facilities.
2.74 1 2.74 19,180$ Hole
435 Multipurpose Recreation Facility
Multi-purpose recreational facilities contain two or more of the following land uses at one site: mini-golf, batting cages, video arcade, bumper boats, go-carts, and driving ranges.
5.77 1 5.77 40,390$ Acre
437 Bowling Alley Recreational facilities with bowling lanes which may include a small lounge, restaurant or snack bar. 3.54 1 3.54 24,780$ Lane
493 Athletic ClubPrivately owned with weightlifting and other facilities often including swimming pools, hot tubs, saunas, racquet ball, squash, and handball courts. 5.76 1 5.76 40,320$ KSF
495 Recreational Community Center
Recreational community centers are facilities similar to and including YMCAs, often including classes, day care, meeting rooms, swimming pools, tennis racquetball, handball, weightlifting equipment, locker rooms, & food service. 1.64 1 1.64 11,480$ KSF
520 * Elementary School Public. Typically serves K-6 grades. 0.28 1 0.28 1,960$ Student
522 Middle School Public. Serves students that completed elementary and have not yet entered high school. 0.15 1 0.15 1,050$ Student
530 High School Public. Serves students that completed middle or junior high school. 0.14 1 0.14 980$ Student
540 Junior/Community College
Two-year junior colleges or community colleges. 0.12 1 0.12 840$ Student
560 Church Contains worship area and may include meeting rooms, classrooms, dining area and facilities. 0.66 1 0.66 4,620$ KSF
565 * Day Care 13.18 0.33 4.35 30,450$ KSF0.82 0.33 0.27 1,890$ Student
590 Library Public or Private. Contains shelved books, reading rooms or areas, sometimes meeting rooms. 7.09 1 7.09 49,630$ KSF
591 Lodge/Fraternal Organization
Includes a club house with dining and drinking facilities, recreational and entertainment areas, and meeting rooms. 0.03 1 0.03 210$ Member
710 General OfficeOffice building with multiple tenants. Mixture of tenants can include professional services, bank and Loan institutions, restaurants, snack bars, and service retail facilities.
1.49 1 1.49 10,430$ KSF
715 Single Tenant Office Building
Single tenant office building. Usually contains offices, meeting rooms, file storage areas, data processing, restaurant or cafeteria, and other service functions.
1.73 1 1.73 12,110$ KSF
720 Medical-Dental Office
Provides diagnosis and outpatient care on a routine basis. Typically operated by one or more private physicians or dentists. 3.72 1 3.72 26,040$ KSF
750 Office ParkPark or campus-like planned unit development that contains office buildings and support services such as banks & loan institutions, restaurants, service stations.
1.5 1 1.5 10,500$ KSF
760 Research & Development Center
Single building or complex of buildings devoted to research & development. May contain offices and light fabrication facilities. 1.08 1 1.08 7,560$ KSF
770 Business Park
Group of flex-type or incubator 1 - 2 story buildings served by a common roadway system. Tenant space is flexible to accommodate a variety of uses. Rear of building usually served by a garage door. Typically includes a mix of offices, retail & wholesale.
1.29 1 1.29 9,030$ KSF
Facility for pre-school children care primarily during daytime hours. May include classrooms, offices, eating areas, and playgrounds.
3a. AN 09-02. The applicant is requesting approval of an annexation of eight properties totalling approximately 53 acres. Page 30 of 84

Oregon City, OR Transportation SDC Study
10
Vehicle TSDC (2)
ITE Code Customer Type Land Use Description Peak-Hour
Trips
Pass-By Trip
Factor
Adjusted P-H Ts TSDC Units
812 Building Materials & Lumber
Small, free standing building that sells hardware, building materials, and lumber. May include yard storage and shed storage areas. The storage areas are not included in the GLA needed for trip generation estimates.
4.49 1 4.49 31,430$ KSF
813 Discount Super Store
A free-standing discount store that also contains a full service grocery dept. under one roof. 3.87 0.718 2.78 19,460$ KSF
814 Specialty RetailSmall strip shopping centers containing a variety of retail shops that typically specialize in apparel, hard goods, services such as real estate, investment, dance studios, florists, and small restaurants.
2.71 1 2.71 18,970$ KSF
815 Discount Store
A free-standing discount store that offers a variety of customer services, centralized cashiering, and a wide range of products under one roof. Does not include a full service grocery dept. like Land Use 813, Free-standing Discount Superstore.
5.06 0.475 2.4 16,800$ KSF
816 Hardware/Paint Store
Typically free-standing buildings with off-street parking that sell paints and hardware. 4.84 0.450 2.18 15,260$ KSF
817 Nursery/Garden Center
Free-standing building with yard containing planting or landscape stock. May have large green houses and offer landscape services. Typically have office, storage, and shipping facilities. GLA is Building GLA, not yard and storage GLA.
3.8 1 3.8 26,600$ KSF
820 Shopping Center
Integrated group of commercial establishments that is planned, developed, owned, and managed as a unit. Provides enough on-site parking to serve its own parking demand. May include non-merchandising facilities such as office buildings, movie theatres, restaurants, post offices, health clubs, and recreation like skating rinks and amusements.
3.75 0.393 1.47 10,290$ KSF Leasable
841 New Car Sales New Car dealership with sales, service, parts, and used vehicles 2.64 1 2.64 18,480$ KSF
848 Tire Store Primary business is tire sales and repair. Generally does not have a large storage or warehouse area. 4.15 0.617 2.56 17,920$ KSF
850 Supermarket Free-standing grocery store. May also contain ATMs, photo centers, pharmacies, video rental areas. 10.45 0.265 2.76 19,320$ KSF
851 Convenience Market Sells convenience foods, newspapers, magazines, and often Beer & Wine. Does not have gas pumps. 52.41 0.282 14.8 103,600$ KSF
880 Pharmacy w/o drive through
Facilities that fulfill medical Prescriptions 8.42 0.327 2.75 19,250$ KSF
881 Pharmacy w/ drive through
Facilities that fulfill medical Prescriptions 8.62 0.383 3.3 23,100$ KSF
890 Furniture Store Sells furniture, accessories, and often carpet/floor coverings. 0.46 0.157 0.07 490$ KSF
911 * Walk-In Bank Usually a Free-standing building with a parking lot. Does not have drive-up windows. May have ATMs. 33.15 0.270 8.95 62,650$ KSF
912 Drive-In Bank Provides Drive-up and walk-in bank services. May have ATMs. 45.74 0.270 12.35 86,450$ KSF
931 Quality Restaurant High quality eating establishment with slower turnover rates (more than one hour). 7.49 0.288 2.15 15,050$ KSF
932 High Turnover Sit-Down Rest.
Sit-Down eating establishment with turnover rates of less than one hour. 10.92 0.315 3.44 24,080$ KSF
933 * Fast Food w/o Drive-Thru
Fast Food but no drive-through window 26.15 0.265 6.94 48,580$ KSF
934 Fast Food With Drive-Thru
Fast Food with drive-through window 34.64 0.265 9.2 64,400$ KSF
936 * Drinking Place Contains a bar where alcoholic beverages and snacks are serviced and possibly some type of entertainment such as music, games, or pool tables 11.34 0.315 3.58 25,060$ KSF
944 Gas Station Sell gasoline and may also provide vehicle service and repair. Does not have Convenience Market and/or Car Wash. 13.86 0.235 3.26 22,820$ Fueling
Position
945Gas/Service Station with Convenience Market
Selling gas and Convenience Market are the primary business. May also contain facilities for service and repair. Does not include Car Wash. 13.38 0.123 1.65 11,550$ Fueling
Position
946 *Gas/Service Station with Convenience Market, Car Wash
Selling gas, Convenience Market, and Car Wash are the primary business. May also contain facilities for service and repair. 13.33 0.382 5.09 35,630$ Fueling
Position
947 Self-Service Car Wash
Allows manual cleaning of vehicles by providing stalls for the driver to park and wash. 5.54 1 5.54 38,780$ Wash
Stall
NOTES:Source: Institute of Transportation Engineers, Trip Generation , Seventh Edition.Peak-Hour Trips: Weekday, peak-hour of adjacent street traffic. Most often, one hour between 4 and 6 p.m.Pass-By Trip Factor reflects diverted linked trips in addition to pass-by trips.ITE codes identified with asterisks (*) include information derived from the ITE manual (e.g., the pass-by factor is derived from pass-by counts for a similar land use or are as estimated by traffic engineers).
Land Use Units:KSF = 1,000 gross square feet building areaDU = dwelling unitRoom = number of rooms for rentFueling Positions = maximum number of vehicles that can be served simultaneouslyStudent = number of full-time equivalent students enrolledHole = number of individual putting holes that are paired with driving teesAcre = 43,560 square feet of park spaceLane = number of bowling lanes
Residential developments within designated regional centers and the Molalla Avenue area receive a 10% discount on the TSDC.Non-residential developments within such areas will be assessed for the lesser of their estimated trip generation rate, based on land use, or 1.47 P-HTs per KSF.
3a. AN 09-02. The applicant is requesting approval of an annexation of eight properties totalling approximately 53 acres. Page 31 of 84

Oregon City, OR Transportation SDC Study
11
Bike/Ped TSDC (1)
ITE Code Customer Type Land Use Description Bike/Ped
GroupBike/Ped
TripsBike/Ped
SDC Units
110 General Light Industrial
Typically less than 500 employees, free standing and single use. Examples: Printing plants, material testing laboratories, data processing equipment assembly, power stations.
1 0.1 20.25$ KSF
130 Industrial Park Industrial Park areas that contain a number of industrial and/or related facilities (mix of manufacturing, service, and warehouse). 1 0.1 20.25$ KSF
140 Manufacturing Facilities that convert raw materials into finished products. Typically have related office, warehouse, research, and associated functions. 2 0.2 40.50$ KSF
151 Mini-WarehouseStorage Units or Vaults rented for storage of goods. Units are physically separate and access through an overhead door or other common access point. Example: U-Store-It.
1 0.1 20.25$ KSF
210 SF Detached Single family detached housing. 5 1 202.51$ DU
220 Apartment Rental Dwelling Units within the same building. At least 4 units in the same building. Examples: Quadplexes and all types of apartment buildings. 4 0.6 121.51$ DU
230 Condo/Townhouse Residential Condominium/Townhouses under single-family ownership. Minimum of two single family units in the same building structure. 4 0.6 121.51$ DU
240 Mobile Home Trailers or Manufactured homes that are sited on permanent foundations. Typically the parks have community facilities (laundry, recreation rooms, pools).
3 0.4 81.00$ DU
253 Elderly HousingRestricted to senior citizens. Contains residential units similar to apartments or condos. Sometimes in self-contained villages. May also contain medical facilities, dining, and some limited, supporting retail.
3 0.4 81.00$ DU
310 Hotel Lodging facility that may include restaurants, lounges, meeting rooms, and/or convention facilities. Can include a large motel with these facilities. 3 0.4 81.00$ Room
320 Motel Sleeping accommodations and often a restaurant. Free on-site parking and little or no meeting space. 2 0.2 40.50$ Room
430 Golf CourseIncludes 9, 18, 27, and 36 hole municipal and private country clubs. Some have driving ranges and clubhouses with pro shops, restaurants, lounges. Many of the muni courses do not include such facilities.
1 0.1 20.25$ Hole
435 Multipurpose Recreation Facility
Multi-purpose recreational facilities contain two or more of the following land uses at one site: mini-golf, batting cages, video arcade, bumper boats, go-carts, and driving ranges.
6 2 405.02$ Acre
437 Bowling Alley Recreational facilities with bowling lanes which may include a small lounge, restaurant or snack bar. 3 0.4 81.00$ Lane
493 Athletic ClubPrivately owned with weightlifting and other facilities often including swimming pools, hot tubs, saunas, racquet ball, squash, and handball courts. 5 1 202.51$ KSF
495 Recreational Community Center
Recreational community centers are facilities similar to and including YMCAs, often including classes, day care, meeting rooms, swimming pools, tennis racquetball, handball, weightlifting equipment, locker rooms, & food service.
6 2 405.02$ KSF
520 * Elementary School Public. Typically serves K-6 grades. 3 0.4 81.00$ Student
522 Middle School Public. Serves students that completed elementary and have not yet entered high school. 2 0.2 40.50$ Student
530 High School Public. Serves students that completed middle or junior high school. 1 0.1 20.25$ Student
540 Junior/Community College
Two-year junior colleges or community colleges. 1 0.1 20.25$ Student
560 Church Contains worship area and may include meeting rooms, classrooms, dining area and facilities. 3 0.4 81.00$ KSF
565 * Day Care 1 0.1 20.25$ KSF1 0.1 20.25$ Student
590 Library Public or Private. Contains shelved books, reading rooms or areas, sometimes meeting rooms. 6 2 405.02$ KSF
591 Lodge/Fraternal Organization
Includes a club house with dining and drinking facilities, recreational and entertainment areas, and meeting rooms. 4 0.6 121.51$ Member
710 General OfficeOffice building with multiple tenants. Mixture of tenants can include professional services, bank and Loan institutions, restaurants, snack bars, and service retail facilities.
6 2 405.02$ KSF
715 Single Tenant Office Building
Single tenant office building. Usually contains offices, meeting rooms, file storage areas, data processing, restaurant or cafeteria, and other service functions.
6 2 405.02$ KSF
720 Medical-Dental Office
Provides diagnosis and outpatient care on a routine basis. Typically operated by one or more private physicians or dentists. 1 0.1 20.25$ KSF
750 Office ParkPark or campus-like planned unit development that contains office buildings and support services such as banks & loan institutions, restaurants, service stations.
4 0.6 121.51$ KSF
760 Research & Development Center
Single building or complex of buildings devoted to research & development. May contain offices and light fabrication facilities. 2 0.2 40.50$ KSF
770 Business Park
Group of flex-type or incubator 1 - 2 story buildings served by a common roadway system. Tenant space is flexible to accommodate a variety of uses. Rear of building usually served by a garage door. Typically includes a mix of offices, retail & wholesale.
1 0.1 20.25$ KSF
Facility for pre-school children care primarily during daytime hours. May include classrooms, offices, eating areas, and playgrounds.
3a. AN 09-02. The applicant is requesting approval of an annexation of eight properties totalling approximately 53 acres. Page 32 of 84

Oregon City, OR Transportation SDC Study
12
Bike/Ped TSDC (2)
ITE Code Customer Type Land Use Description Bike/Ped
GroupBike/Ped
TripsBike/Ped
SDC Units
812 Building Materials & Lumber
Small, free standing building that sells hardware, building materials, and lumber. May include yard storage and shed storage areas. The storage areas are not included in the GLA needed for trip generation estimates.
1 0.1 20.25$ KSF
813 Discount Super Store
A free-standing discount store that also contains a full service grocery dept. under one roof. 1 0.1 20.25$ KSF
814 Specialty RetailSmall strip shopping centers containing a variety of retail shops that typically specialize in apparel, hard goods, services such as real estate, investment, dance studios, florists, and small restaurants.
6 2 405.02$ KSF
815 Discount Store
A free-standing discount store that offers a variety of customer services, centralized cashiering, and a wide range of products under one roof. Does not include a full service grocery dept. like Land Use 813, Free-standing Discount Superstore.
1 0.1 20.25$ KSF
816 Hardware/Paint Store
Typically free-standing buildings with off-street parking that sell paints and hardware. 1 0.1 20.25$ KSF
817 Nursery/Garden Center
Free-standing building with yard containing planting or landscape stock. May have large green houses and offer landscape services. Typically have office, storage, and shipping facilities. GLA is Building GLA, not yard and storage GLA.
1 0.1 20.25$ KSF
820 Shopping Center
Integrated group of commercial establishments that is planned, developed, owned, and managed as a unit. Provides enough on-site parking to serve its own parking demand. May include non-merchandising facilities such as office buildings, movie theatres, restaurants, post offices, health clubs, and recreation like skating rinks and amusements.
2 0.2 40.50$ KSF Leasable
841 New Car Sales New Car dealership with sales, service, parts, and used vehicles 1 0.1 20.25$ KSF
848 Tire Store Primary business is tire sales and repair. Generally does not have a large storage or warehouse area. 1 0.1 20.25$ KSF
850 Supermarket Free-standing grocery store. May also contain ATMs, photo centers, pharmacies, video rental areas. 1 0.1 20.25$ KSF
851 Convenience Market Sells convenience foods, newspapers, magazines, and often Beer & Wine. Does not have gas pumps. 6 2 405.02$ KSF
880 Pharmacy w/o drive through
Facilities that fulfill medical Prescriptions 3 0.4 81.00$ KSF
881 Pharmacy w/ drive through
Facilities that fulfill medical Prescriptions 3 0.4 81.00$ KSF
890 Furniture Store Sells furniture, accessories, and often carpet/floor coverings. 1 0.1 20.25$ KSF
911 * Walk-In Bank Usually a Free-standing building with a parking lot. Does not have drive-up windows. May have ATMs. 1 0.1 20.25$ KSF
912 Drive-In Bank Provides Drive-up and walk-in bank services. May have ATMs. 1 0.1 20.25$ KSF
931 Quality Restaurant High quality eating establishment with slower turnover rates (more than one hour). 1 0.1 20.25$ KSF
932 High Turnover Sit-Down Rest.
Sit-Down eating establishment with turnover rates of less than one hour. 3 0.4 81.00$ KSF
933 * Fast Food w/o Drive-Thru
Fast Food but no drive-through window 6 2 405.02$ KSF
934 Fast Food With Drive-Thru
Fast Food with drive-through window 6 2 405.02$ KSF
936 * Drinking Place Contains a bar where alcoholic beverages and snacks are serviced and possibly some type of entertainment such as music, games, or pool tables 1 0.1 20.25$ KSF
944 Gas Station Sell gasoline and may also provide vehicle service and repair. Does not have Convenience Market and/or Car Wash. 1 0.1 20.25$ Fueling
Position
945Gas/Service Station with Convenience Market
Selling gas and Convenience Market are the primary business. May also contain facilities for service and repair. Does not include Car Wash. 1 0.1 20.25$ Fueling
Position
946 *Gas/Service Station with Convenience Market, Car Wash
Selling gas, Convenience Market, and Car Wash are the primary business. May also contain facilities for service and repair. 1 0.1 20.25$ Fueling
Position
947 Self-Service Car Wash
Allows manual cleaning of vehicles by providing stalls for the driver to park and wash. 1 0.1 20.25$ Wash
Stall
NOTES:Land Use Units:
KSF = 1,000 gross square feet building areaDU = dwelling unitRoom = number of rooms for rentFueling Positions = maximum number of vehicles that can be served simultaneouslyStudent = number of full-time equivalent students enrolledHole = number of individual putting holes that are paired with driving teesAcre = 43,560 square feet of park spaceLane = number of bowling lanes
Residential developments within designated regional centers and the Molalla Avenue area receive a 10% discount on the TSDC.Non-residential developments within such areas will be assessed for the lesser of their estimated trip generation rate, by land use, or 1.47 P-HTs per KSF.
3a. AN 09-02. The applicant is requesting approval of an annexation of eight properties totalling approximately 53 acres. Page 33 of 84

Appendix A
Appendix A
Issue Papers
3a. AN 09-02. The applicant is requesting approval of an annexation of eight properties totalling approximately 53 acres. Page 34 of 84

Telephone (425) 867-1802 Page 1 F:\Oregon City\XXXTransportationSDC2008\Documentation\Issue Paper 1 - Reimbursement Fee - Final.doc
ISSUE PAPER #1
Reimbursement Fee Cost Basis
ISSUE Oregon Revised Statute 223.304 states that the reimbursement fee calculation methodology must be based on:
(A) “Ratemaking principles employed to finance publicly owned capital improvements;
(B) Prior contributions by existing users; (C) Gifts or grants from federal or state government or private persons; (D) The value of unused capacity available to future system users or the
cost of the existing facilities; and (E) Other relevant factors identified by the local government imposing
the fee.”
This issue paper addresses two questions regarding the application of this language to reimbursement fees for the City’s transportation system. First, what is an appropriate measure of the “cost of the existing facilities” -- or the related “value of unused capacity” available for growth? Second, how should one consider in the calculation prior contributions by existing users, and gifts or grants?
ALTERNATIVES Regarding the first question of considering the cost and related value of (unused capacity in) the system, there are several alternative approaches for establishing the initial reimbursement fee cost basis:
Original cost less depreciation. Use the original cost of existing facilities less the accumulated depreciation on those facilities as a measure of value.
Original cost. Use the original cost of existing facilities at the time they were constructed.
Replacement cost less depreciation. Use the replacement cost of existing facilities less the accumulated depreciation on those facilities as a measure of value.
Replacement cost. Use the escalated cost of existing facilities as a measure of what they would currently cost to construct.
ANALYSIS In considering these alternatives, it is important to note that the purpose of the reimbursement fee is not to fund the replacement of the system. System replacement is commonly funded through taxes and/or rates. Rather, the purpose of the fee is to pay back those who funded construction of the system for their investment in available capacity. The reimbursement fee represents a “buy-in” to the cost of unused capacity in the existing system, to catch up with those who funded the existing system.
The original cost less depreciation approach recognizes that the value of
3a. AN 09-02. The applicant is requesting approval of an annexation of eight properties totalling approximately 53 acres. Page 35 of 84

Oregon City Transportation SDC Study August 20, 2008
Telephone (425) 867-1802 Page 2 F:\Oregon City\XXXTransportationSDC2008\Documentation\Issue Paper 1 - Reimbursement Fee - Final.doc
the system to the new user may be better reflected by depreciated cost, because the new user is connecting to assets of diminishing useful lives. However, this approach discounts the investment made by existing system users. Existing customers have borne the full cost burden of building excess capacity for future needs, with little benefit to themselves, and should recover those costs. If depreciated cost is used, then existing customers are not fully reimbursed for their investments in excess capacity.
The original cost approach simply requires the new user to reimburse existing users for their investment in the system – in terms of the invested cost. This “buy-in” puts them at par with the existing user. Further, by using unadjusted original cost, it protects the new user from paying both a full share of the existing system plus a full share of the cost of expanding the system. It is clearly an approach that considers the “cost” of the existing system.
A perhaps valid alternative would be to use replacement cost less depreciation. In order to address the issue of value, both to an existing user and to a connecting customer, replacement cost provides a valid measure. The current replacement cost of the system must be appropriately discounted for depreciation in order to incorporate the concurrent reduced useful life of the asset. This approach clearly considers the “value” of the existing system.
The replacement cost approach (unadjusted for depreciation), while an adequate measure of the cost of replacing the system, certainly overstates the value of the system to the new user. We do not recommend this approach, because it does not “promote the objective of future system users contributing no more than an equitable share to the cost of existing facilities” – as also required by Oregon Revised Statute. Rather, it ignores the fact that users of the system pay for the replacement of the system as needed in ongoing taxes and/or rates. It should not be new development’s responsibility to pay for the replacement value of a system if taxes and/or rates also are being used for system replacement.
Once the system valuation approach is chosen, it is next necessary to consider in the calculation prior contributions by existing users, and gifts or grants. It seems clear that gifted or grant-funded facilities were provided at generally no direct cost to existing users. As such, their costs should be deducted from the reimbursement fee cost basis.
Prior contributions by existing users are a more complicated issue. Prior contributions by existing users of the transportation system consist primarily of taxes paid over time and previously paid SDCs. Most of the City’s arterial and collector streets were once County roads or State highways, funded ultimately through general tax sources. When considering deducting tax-funded infrastructure costs from the fee basis, it is most important to acknowledge that all transportation system users pay taxes – whether or not their properties are developed. Hence, a developer can argue that he / she has already paid for a share of that portion of the transportation system that has been constructed with tax revenues. This is unlike a water, sewer, or
3a. AN 09-02. The applicant is requesting approval of an annexation of eight properties totalling approximately 53 acres. Page 36 of 84

Oregon City Transportation SDC Study August 20, 2008
Telephone (425) 867-1802 Page 3 F:\Oregon City\XXXTransportationSDC2008\Documentation\Issue Paper 1 - Reimbursement Fee - Final.doc
stormwater service, in which there are usually ratepayers to catch up with and reimburse, and is a strong argument for reducing the reimbursement fee cost basis by the corresponding portion of system value that has been funded by tax sources – including system infrastructure that was once part of the County or State system.
On the other hand, a strong argument can be made that previously paid SDCs need not be deducted from the reimbursement fee cost basis. If previously paid charges have resulted in a fund balance, then that balance is earmarked for future projects and has nothing to do with the amount that should be reimbursed to existing users. If the previously paid charges have funded facilities that still have unused capacity available for growth, then the cost of that capacity must be included in the reimbursement fee cost basis in order for new customers to pay for a full share of the capacity that will serve them.
RECOMMENDATIONS We recommend that the City base the TSDC reimbursement fee entirely on the cost of unused capacity in infrastructure constructed using previously collected SDCs. This approach acknowledges that the original cost of the transportation system less both the cost of gifted or grant-funded facilities and the cost of those facilities or portions of facilities funded with tax revenues is effectively equal to SDC-funded infrastructure.
3a. AN 09-02. The applicant is requesting approval of an annexation of eight properties totalling approximately 53 acres. Page 37 of 84

Telephone (425) 867-1802 Page 1 F:\Oregon City\XXXTransportationSDC2008\Documentation\Issue Paper 2 - Improvement Fee - Final.doc
ISSUE PAPER #2
Improvement Fee Cost Basis
ISSUE Oregon Revised Statute 223.304 states that the improvement fee calculation methodology must consider the cost of projected capital improvements “needed to increase the capacity of the systems to which the fee is related.” The law further requires that the fee “be calculated to obtain the cost of capital improvements for the projected need for available system capacity for future users.” In this issue paper, we evaluate a number of approaches that can be used to identify and allocate the growth-related portion of a project cost to the fee basis.
ALTERNATIVES Three alternative approaches to determining the capacity-increasing, growth-related, portion of planned project costs are provided below:
The “capacity” method. The cost of a given project is allocated to the fee basis proportionately by the capacity made available for growth.
The “incremental cost” method. The cost of the project being considered is first estimated as if it were to be constructed to meet existing needs only, then the difference between that amount and the project total is allocated to the fee basis as a measure of the incremental additional cost of sizing a project to meet the needs of growth.
The “causation” method. If construction of a project is “caused” by growth, then the entire project cost is allocated to the fee basis.
ANALYSIS Under the “capacity” approach, the cost of a given project is allocated to growth proportionately by the capacity made available for growth. As an example, assume we are allocating the $1 million cost of adding a lane to an existing street to meet existing demand as well as the needs of growth. If the new lane provides capacity for 500 trips and 200 meet the existing deficiency and 300 are for growth, then the allocation to the improvement fee basis would be 300 / 500 = 60% of $1 million, or $600,000.
Ideally, the most directly applicable measure of capacity demand would be used as the basis for allocation. For allocating transportation projects, estimated growth in daily or peak-hour trips is commonly used. It is also acceptable to use a reasonable and understandable substitute for such information, if the demand measure is not readily available in a complete, accurate, and usable form.
Under the “incremental cost’ approach, the cost of the project being considered is first estimated as if it were to be constructed to meet existing needs only. The estimated added cost of sizing it to meet the needs of growth is the portion of the project cost allocated to the improvement fee basis. Using the example above, it might be that the cost of adding the lane
3a. AN 09-02. The applicant is requesting approval of an annexation of eight properties totalling approximately 53 acres. Page 38 of 84

Oregon City Transportation SDC Study August 20, 2008
Telephone (425) 867-1802 Page 2 F:\Oregon City\XXXTransportationSDC2008\Documentation\Issue Paper 2 - Improvement Fee - Final.doc
would be $800,000, if it were needed only to meet the existing deficiency. The incremental additional cost to meet the needs of growth would be only $200,000. So, using the incremental cost approach, only $200,000 would be allocated to growth as part of the improvement fee basis.
Under the “causation” approach, a second step is added to the allocation process, after first determining that the project being considered has a capacity-increasing element. In the second step, we ask the question “would the project be necessary if not for growth?” If the answer to this question is “no”, then we would allocate 100% of the project cost to growth and the improvement fee cost basis under the rationale that growth is causing the project to be constructed. If the answer is “yes”, then we would use either the incremental cost or the capacity method to allocate the project cost between existing development and growth to determine the project cost share to be included in the improvement fee cost basis.
Of the three allocation methods, the causation method most aggressively allocates costs to growth. It is potentially the most difficult to defend because it, in essence, allocates the cost of non-capacity increasing portions of projects to the improvement fee cost basis if growth causes them to be constructed. While a logical approach, it may be open to challenge due to the specific language contained in ORS 223.
The incremental cost approach, while easily defensible, very conservatively assigns costs to growth. It will usually result in the smallest allocation to the improvement fee cost basis. The capacity approach, easily defensible and commonly used, is easy to understand and apply. While less aggressive than the causation method, it usually results in an appropriately higher allocation to the improvement fee basis than the incremental cost approach.
RECOMMENDATIONS We recommend that the City utilize the “capacity” method to allocate costs to the improvement fee basis. Although many communities in Oregon have considered the causation approach, most use the capacity approach or a variation to allocate costs to the improvement fee basis.
It is worth pointing out that even within the capacity approach, there are several ways to perform the allocation, including incorporating volume or maximum demand in lieu of current capacity.
3a. AN 09-02. The applicant is requesting approval of an annexation of eight properties totalling approximately 53 acres. Page 39 of 84
Telephone (425) 867-1802 Page 1 F:\Oregon City\XXXTransportationSDC2008\Documentation\Issue Paper 3 - Credits - Final.doc
ISSUE PAPER #3
Credits / Adjustments
ISSUE Oregon Revised Statute 223.304 states that, at a minimum, credits be provided against SDC improvement fees for
“the construction of a qualified public improvement. A ‘qualified public improvement’ means a capital improvement that is required as a condition of development approval, identified in the plan and list adopted pursuant to ORS 223.309 and either: (a) Not located on or contiguous to property that is the subject of development approval; or (b) Located in whole or in part on or contiguous to property that is the subject of development approval and required to be built larger or with greater capacity than is necessary for the particular development project to which the improvement fee is related.”
The law further states that credits
“may be granted only for the cost of that portion of such improvement that exceeds the local government’s minimum standard facility size or capacity needed to serve the particular development project or property.”
Finally, the law [223.304(5)(d)] also specifies that credits must be used within ten years of issuance.
Given these legal guidelines, what is a reasonable SDC credit approach that meets statutory requirements and the City’s general objectives for cash flow, prioritization of capital projects, and orderly but sustained development?
ALTERNATIVES Oregon law effectively establishes the minimum that a public agency must do with regard to SDC credits. However, the following language in ORS 223.304(5)(c) has opened the door for cities to offer more than the legal minimum.
“This subsection does not prohibit a local government from providing a greater credit, or from establishing a system providing for the transferability of credits, or from providing a credit for a capital improvement not identified in the plan and list adopted pursuant to ORS 223.309, or from providing a share of the cost of such improvement by other means, if a local government so chooses.”
There are two primary issues related to the provision of SDC credits. These and their associated policy alternatives are provided below.
3a. AN 09-02. The applicant is requesting approval of an annexation of eight properties totalling approximately 53 acres. Page 40 of 84

Oregon City Transportation SDC Study August 20, 2008
Telephone (425) 867-1802 Page 2 F:\Oregon City\XXXTransportationSDC2008\Documentation\Issue Paper 3 - Credits - Final.doc
1. How much should be credited?
The amount of the current project improvement fee;
The full actual cost of excess capacity even if greater than the improvement fee;
The full cost of excess capacity even if greater than the improvement fee as a portion of the planned project cost.
2. How should the City handle requests for credits for the construction of public improvements that are not in the adopted capital improvement plan and list?
Do not provide credits for construction of improvements that are not in the adopted capital improvement plan and list;
Provide credits for the excess capacity in improvements constructed that are not in the adopted capital plan and list;
Provide credits for the excess capacity in improvements constructed that are not in the adopted capital plan and list, but only in special circumstances.
ANALYSIS System development charge credits for development make sense as they encourage private enterprise to help solve, on a prospective basis, community needs. However, to the extent that the City provides credits in excess of minimum legal requirements, the practice may lead to a loss of institutional control over the construction of projects in the capital plan.
By constructing projects for credits (and/or cash reimbursement), a developer is imposing a construction schedule on the City, which may be in conflict with the City’s established priorities. Due to such credit practices, SDC funds may not accrue as expected and the schedule of the CIP may be inverted or shuffled. This may be acceptable in some cases however it may not be acceptable in others. It may result in the equivalent of building floors before pouring a foundation.
The fundamental choice the City faces is to either grant full credit – potentially in excess of the legal minimum and acknowledge that this will lead to occasional re-ordering of CIP projects – or to constrain the credit policy to the legal minimum. In this context, analysis on the specific questions raised above is provided below.
1. How much should be credited? The City’s existing credit policy allows for privately-provided construction cost estimates and receipts to supersede planned project expenditures. The result is that SDC credits may exceed the SDC revenues that the City will ultimately collect for the project. It is our interpretation that the legal minimum would require a city only to grant a credit up to the amount of the improvement fee that would have been paid, while the extra capacity portion of the cost of constructing a qualified public improvement might be substantially more than that. In this case, the full cost of that
3a. AN 09-02. The applicant is requesting approval of an annexation of eight properties totalling approximately 53 acres. Page 41 of 84

Oregon City Transportation SDC Study August 20, 2008
Telephone (425) 867-1802 Page 3 F:\Oregon City\XXXTransportationSDC2008\Documentation\Issue Paper 3 - Credits - Final.doc
extra capacity is truly a saved cost to the city in question. One way to prevent cost over-runs from impacting city resources for other projects would be to credit the over-sizing cost – but as determined by the lesser of the actual cost and the city-planned cost. The credit amount could also be set through mutual agreement between a city and developer in order to protect a developer from being held to outdated project cost estimates. [This is essentially the City’s current practice.]
2. How should the City handle requests for credits for the construction of public improvements that are not on the adopted plan and list? Granting credits for the construction of projects that are not on the project list used to calculate the SDC jeopardizes the ability of a city to fully recover remaining SDC-eligible project costs. Done on a routine basis, this practice would make it almost impossible for a city to construct its planned projects with SDC revenues.
RECOMMENDATIONS We recommend that the City maintain its current credit policy, particularly with respect to the need to limit credits to the planned or agreed-upon cost of the “qualified public improvement” constructed by the developer. We believe that it is important for the City to retain as much control as possible over the prioritization and implementation of its capital plan(s). These plans are created to address total system needs – not just the needs of growth. Without control over how and when those needs are addressed and at what cost, the reprioritization of projects over time can leave important needs unmet while depleting the City’s ability to fund necessary improvements. To avoid this outcome, credits should:
be for the portion of the agreed-upon or planned cost of capacity in excess of that needed to serve the particular development. It is important to note that while credits under this approach could exceed the amount of the improvement fee, they are only “paper” credits. The issue of cash redemption of those credits is addressed in Issue Paper #4;
not be transferable to other developers;
be for planned projects only; and
be provided only upon completion of a “qualified public improvement”.
3a. AN 09-02. The applicant is requesting approval of an annexation of eight properties totalling approximately 53 acres. Page 42 of 84

Telephone (425) 867-1802 Page 1 F:\Oregon City\XXXTransportationSDC2008\Documentation\Issue Paper 4 - Cash Credit Redemption - Final.doc
ISSUE PAPER #4
Cash Redemption of Credits
ISSUE Oregon Revised Statute 223.304 requires that credits be provided against the improvement fee component of system development charges (SDCs). Although required by statute to allow credits to be applied to future system improvement fees, some cities also allow SDC credits to be redeemed for cash. Should Oregon City provide for the cash redemption of SDC credits?
ALTERNATIVES There are several alternative policies that the City may adopt regarding the cash redemption of credits. The following is a list of potential options:
Allow credits to be redeemed for cash from SDCs generated from the subsequent build out of the development in question;
Allow for credits granted to be redeemed for cash, if fund balances allow;
Provide cash redemption for a portion of the total credit issued;
Provide cash credits at a fraction of full value, reducing the amount of the total credit issued;
Grant only non-cash credits, redeemable to reduce future SDC improvement fees – per current policy.
ANALYSIS ORS 223.304 requires that credits be granted to a developer only for the “cost” of that portion of an improvement that exceeds the capacity needed to serve that particular development (up to the amount of the improvement fee). There is no provision for cash reimbursement. The statute does allow for “providing a share of the cost of such improvement by other means, if a local government so chooses.”
We understand that the City does not currently provide cash credits. Instead, developers may apply credits to reduce the improvement fee component of their SDC. In those cases where a developer has SDC credits remaining after paying off their improvement fee, the developer may apply excess credits in the future if additional SDCs are incurred within five years or they may allow the credits to expire.
If the City allows credits to be redeemable for cash, there exists the potential for cash balances intended to fund near-term capital projects to be paid out as cash credits on low-priority developer-provided improvements. Furthermore, in those cases where developers have excess SDC credits, a cash redemption policy will result in immediate impacts to the City’s cash position, rather than deferring such impacts until such time that developers have incurred additional improvement fees.
Policies that limit the availability of cash redemption of credits can minimize these impacts. Such policies may provide credits with any of the following
3a. AN 09-02. The applicant is requesting approval of an annexation of eight properties totalling approximately 53 acres. Page 43 of 84

Oregon City Transportation SDC Study August 20, 2008
Telephone (425) 867-1802 Page 2 F:\Oregon City\XXXTransportationSDC2008\Documentation\Issue Paper 4 - Cash Credit Redemption - Final.doc
limitations: (1) only from SDCs generated by the build out of the development in question; (2) only when fund balances allow, after taking into account near-term project needs; (3) redeemable for only a portion of the total credit issued; or (4) redeemable at a fraction of the full credit value.
Of the four options noted above, the best compromise could be to provide cash redemptions from SDCs generated by the build out of the development in question. This would provide full cash compensation to developers for the cost of improvements while protecting the City’s cash position and limiting the disruption that the City experiences when projects are built out of preferred order.
RECOMMENDATIONS In general, providing cash credits will likely diminish City cash flows, and limit the City’s ability to prioritize and construct capital projects as scheduled. The likelihood of such problems is directly linked to the extent that the City cash reimburses developers for credits. Accordingly, the City can minimize the risk of depleting its ability to fund necessary improvements by including limitations in its cash redemption policy.
In order to provide full compensation to developers while also minimizing the financial risk to the City, we recommend that the City’s credit policy include cash reimbursement only from SDCs generated by the build out of the development in question. As a result, the City will have the ability to choose the timing and the improvements from a healthy cash position.
Although other cities apply similar policies, the City may find that implementation of the recommended approach requires too much manual tracking and coordination among departments (e.g., building, public works, and finance) to be feasible.
3a. AN 09-02. The applicant is requesting approval of an annexation of eight properties totalling approximately 53 acres. Page 44 of 84

Telephone (425) 867-1802 Page 1 F:\Oregon City\XXXTransportationSDC2008\Documentation\Issue Paper 5 - Charge Basis - Final.doc
ISSUE PAPER #5
Basis of Charging
ISSUE Oregon Revised Statute 223.301 states that system development charges cannot be
“determined by the number of employees of an employer without regard to new construction, new development or new use of an existing structure by the employer.”
There are a number of different, valid, bases for transportation system development charges (TSDCs) that meet the above criterion. Given the data available and the objectives of the City, what is the best charging basis to use for its transportation SDCs?
ALTERNATIVES The following are the most commonly used and accepted bases for transportation SDCs:
Average daily vehicle trips. Average daily vehicle trips are defined as the average 24-hour total of all vehicle trips to and from a site. [Average daily trips provide the City’s current TSDC basis.]
Peak-hour vehicle trips. Peak-hour trips are defined as the average trip rate for the peak hour of adjacent street traffic, usually during the traditional commuting peak periods of 7 am to 9 am (AM peak) and/or 4 pm to 6 pm (PM peak).
There are also a number of adjustments that can be appropriately applied to either of these bases.
ANALYSIS The Institute of Transportation Engineers (ITE) publishes a detailed compilation of trip generation estimates by land use derived from survey data. This data can be used to calculate average daily and peak-hour vehicle trip generation rates by customer using available information such as land use and building square footage.
Transportation engineers commonly use PM peak-hour trip estimates to assess transportation performance and determine system needs. Average daily trips, as measures of total traffic volume, are not generally used to size a system. The number of average daily trips might determine the need for road maintenance, but PM peak-hour estimates more directly determine the necessary size of the system and its roadways.
Potential Adjustments
Pass-By or Linked Trips
There is documentation presented in the ITE Trip Generation handbook, 7th Edition, that a significant percentage of trip ends associated with specific land uses are a result of linked, or pass-by, trips. Linked trips are interim stops between the trip origin and the final destination. Such stops count as
3a. AN 09-02. The applicant is requesting approval of an annexation of eight properties totalling approximately 53 acres. Page 45 of 84

Oregon City Transportation SDC Study August 20, 2008
Telephone (425) 867-1802 Page 2 F:\Oregon City\XXXTransportationSDC2008\Documentation\Issue Paper 5 - Charge Basis - Final.doc
trip ends for each interim destination, but the impact on the system is as a single trip from the trip origin to the final destination. It would be reasonable to incorporate linked-trip adjustments into the revised SDC structure – particularly for retail land uses, for which there exists the greatest amount of pass-by trip data.
Trip Length
Some jurisdictions apply transportation SDCs that incorporate vehicle miles traveled. In these cases, the estimated trip generation rate applied to a development, for assessment purposes, is adjusted by the average length of those trips – as compared to the average length of all trips systemwide. The reasoning is that even if two given types of land use both generate the same number of trips, if the average trip length associated with one development is twice as long as the average trip length for the second development, the land use with the longer trip length uses more of the transportation system and it should therefore pay a higher transportation charge.
The average trip length of vehicles originating from a development is a valid factor to take into account when evaluating a user’s utilization of roadway capacity. Data shows that some land uses generate longer or shorter trips than others, thereby impacting more or less of the roadway system.
Our research found average trip lengths for 45 common land uses. Excluding residential land uses, the average trip factor of the remaining 38 land uses was 0.684, with a maximum trip length factor of 1.37 (industrial and manufacturing land uses) and a minimum of 0.26 (gas station). The full list of available trip length factors for non-residential land uses is provided below.
3a. AN 09-02. The applicant is requesting approval of an annexation of eight properties totalling approximately 53 acres. Page 46 of 84

Oregon City Transportation SDC Study August 20, 2008
Telephone (425) 867-1802 Page 3 F:\Oregon City\XXXTransportationSDC2008\Documentation\Issue Paper 5 - Charge Basis - Final.doc
Land Use Code and TitleTrip Length
Factor110 - General Light Industrial 1.37130 - Industrial Park 1.37140 - Manufacturing 1.37151 - Mini-Warehouse 0.54493 - Athletic Club 0.85520 - Elementary School 0.66522 - Middle School 0.66530 - High School 0.66540 - Junior/Community College 1.06560 - Church 0.68565 - Day Care 0.68590 - Library 0.57710 - General Office 0.89715 - Single Tenant Office Building 0.89720 - Medical-Dental Office 0.89750 - Office Park 0.89760 - Research & Development Center 0.89770 - Business Park 0.89812 - Building Materials & Lumber 0.49813 - Discount Super Store 0.38814 - Specialty Retail 0.59815 - Discount Store 0.38816 - Hardware/Paint Store 0.49817 - Nursery/Garden Center 1.06820 - Shopping Center 0.38841 - New Car Sales 0.81848 - Tire Store 0.63850 - Supermarket 0.37851 - Convenience Market 0.37880 - Pharmacy w/o drive through 0.37881 - Pharmacy w/ drive through 0.37890 - Furniture Store 1.06911 - Walk-In Bank 0.42912 - Drive-In Bank 0.42931 - Quality Restaurant 0.54932 - High Turnover Sit-Down Rest. 0.52934 - Fast Food With Drive-Thru 0.28944 - Gas Station 0.26
Residential / Commercial Zones
Similar to the utilization of average trip length factors, another approach to differentiating transportation impacts beyond simple trip generation is to allocate roadway costs to broad customer classes by roadway type.
For example, in its development of a transportation utility fee structure, the City assigned all roadways one of four categories: Collector, Residential / Local, Arterial, and Other. The City determined that residential customers would bear 100% of the burden of maintaining residential / local and
3a. AN 09-02. The applicant is requesting approval of an annexation of eight properties totalling approximately 53 acres. Page 47 of 84

Oregon City Transportation SDC Study August 20, 2008
Telephone (425) 867-1802 Page 4 F:\Oregon City\XXXTransportationSDC2008\Documentation\Issue Paper 5 - Charge Basis - Final.doc
“other” streets, 50% of the burden of maintaining collector streets, and none of the burden of maintaining arterial streets.
If the City incorporated this approach into its SDC methodology, it could apply the above residential allocations to transportation improvements on the City’s SDC project list. SDC-eligible improvement costs would then be classified as residential or non-residential, and each cost would be recovered from its corresponding customer/development type.
With the City’s transportation maintenance utility, nearly 75% of the annual revenue needs were designated for recovery from residential customers. If the City’s planned transportation improvements were similarly weighted to serve residential users, the TSDC for non-residential developments would be reduced 50% while residential TSDCs would increase by 50%.
RECOMMENDATIONS System development charges are intended to recover from growth the share of the capacity needed to serve it. Based on this general understanding, we recommend the use of PM peak-hour trips as the basis for charging transportation SDCs. It is important to note that certain development types may be required to make local improvements to mitigate their impacts on the transportation system during AM or off-peak hours. These requirements would be over and above the system development charge due.
We also recommend that the City make adjustments to the trip generation estimates for retail land uses, if not all non-residential land uses, in order to recognize and account for the impact of pass-by trips. Estimates for such trips, specific to land use, are reported in the ITE manual.
Although a part of the City’s existing charge structure, we recommend foregoing a trip-length factor for the proposed TSDC. The City’s roadway system, although expanding, may not be large enough to warrant the SDC differentials that would result from the use of these factors.
Likewise, we recommend foregoing a commercial / residential split based on street type. Such an approach would require additional tracking and complexity, while providing arguable additional TSDC equity.
3a. AN 09-02. The applicant is requesting approval of an annexation of eight properties totalling approximately 53 acres. Page 48 of 84

Telephone (425) 867-1802 Page 1 F:\Oregon City\XXXTransportationSDC2008\Documentation\Issue Paper 6 - Alternative Transportation - Final.doc
ISSUE PAPER #6
Inclusion of Alternative Modes of Transportation
ISSUE Oregon Revised Statute (ORS) 223.299 defines a system development charge (SDC) as a fee for costs related to
“facilities or assets used for the following: (A) Water supply, treatment and distribution; (B) Waste water collection, transmission, treatment and disposal; (C) Drainage and flood control; (D) Transportation; or (E) Parks and recreation.”
Furthermore, ORS 223.304 requires that the improvement fee basis include only the cost of projects “needed to increase the capacity of the systems to which the fee is related”. Additionally, ORS 223.307 limits the expenditure of improvement fee proceeds to capital improvements that increase system capacity, specifying that such an increase may be established if a capital improvement “increases the level of performance or service provided by existing facilities or provides new facilities.”
Several different types of assets comprise a transportation system. The core of such systems has typically consisted of roadways, traffic signals, bridges, and State highways – facilities designed for vehicle capacity. However, transportation systems clearly now include facilities designed to support “alternative” modes of transportation, such as walking, biking, and public transportation (transit). Given the above statutory requirements, should the costs of alternative transportation facilities be included in the City’s transportation SDC?
ALTERNATIVES The City’s current TSDC does not include the costs of alternative mode improvements. Therefore, the City has three options:
1. Retain the existing approach and include only facilities serving automobile transportation.
2. Include the cost of facilities serving alternative transportation modes.
3. Include the costs of selected alternative mode facility types.
ANALYSIS As stated previously, alternative transportation modes funded by TSDC revenues can include bicycle and pedestrian facilities, transit capital improvements (buses, shelters, and terminals), bus pull-outs, park and ride lots, signage programs, and light rail facilities.
When considering including planned project costs for a given type of
3a. AN 09-02. The applicant is requesting approval of an annexation of eight properties totalling approximately 53 acres. Page 49 of 84

Oregon City Transportation SDC Study August 20, 2008
Telephone (425) 867-1802 Page 2 F:\Oregon City\XXXTransportationSDC2008\Documentation\Issue Paper 6 - Alternative Transportation - Final.doc
alternative mode facility within the improvement fee component of the TSDC, one prevailing question must be answered – does the alternative mode facility increase system capacity to meet the needs of future users? This can be a particularly difficult question to answer when a city’s minimum standards (e.g., for sidewalks) may effectively mean that a system is deficient against the standard as applied to its existing customer base.
Often, the determination of how much of each project’s cost is eligible for inclusion in the improvement fee basis is made by estimating the percentage reduction in vehicle trips due to the presence of the alternative transportation mode. This generally results in a relatively small allocation to growth, but is entirely consistent with the way the TSDC is based and charged – on peak-hour vehicle trips. Charging a new customer for improvements to the street system based on peak-hour trips and then adding the full or even proportional cost of alternate modes also based on peak-hour vehicle trips could essentially overcharge for each vehicle trip. The approach used to allocate alternate mode facilities to growth must acknowledge and account for this potential issue.
Generally, including the cost of alternative mode facilities in a TSDC is most relevant when there is a demonstrated direct relationship between the need for such facilities and development. On a policy level, the issue is more a question of “who pays”. As alternative modes of transportation become more desired, and often required, by cities, the need for funding those facilities increases. If they are not included in the TSDC cost basis, then the funding liability remains, and other sources must be relied upon.
Furthermore, TSDC revenues dedicated to alternative mode facilities can be used as local matching funds for State and federal funding for such facilities. Also, TSDC revenues could be used to help pay for debt service if such facilities were funded with bonds.
RECOMMENDATIONS We recommend that the City include the cost of facilities serving alternative modes of transportation within its TSDC, and equitably allocate the cost of such facilities to growth.
3a. AN 09-02. The applicant is requesting approval of an annexation of eight properties totalling approximately 53 acres. Page 50 of 84

Telephone (425) 867-1802 Page 1 F:\Oregon City\XXXTransportationSDC2008\Documentation\Issue Paper 7 - Transit Corridors - Final.doc
ISSUE PAPER #7
Development in Transit and Limited-Parking Areas (i.e., the Regional Center & Molalla Avenue)
ISSUE Oregon Revised Statute 223.297 states that the purpose of system development charges is to provide a uniform framework for the “equitable funding” of capital improvements. With respect to transportation system development charges (TSDCs), it is generally accepted that an equitable TSDC must be roughly proportionate to each property’s relative use of transportation capacity.
Transit and limited-parking corridors, such as the City’s designated regional center and Molalla Avenue, are areas suitable for higher residential densities, high-volume non-residential uses, and mixed use properties. Such areas/corridors are centered along major bus routes and/or existing or planned train lines. Traffic modeling has shown that developments in such areas have lower vehicle trip generation rates.
Given the City’s objective to fully utilize both its regional center and Molalla Avenue, is there a basis for distinguishing development there when assessing TSDCs that also maintains the equitable nature of the charge?
ALTERNATIVES In assessing its TSDC to development in the regional center and Molalla Avenue, the City has three basic options:
Provide a distinction for development within the regional center and Molalla Avenue.
Provide a distinction for development within the regional center and Molalla Avenue, and restrict such development to high-density uses.
Make no distinction between development inside and outside the regional center or Molalla Avenue.
ANALYSIS The regional center is a transit and limited-parking area. In this designated area, the City is building capacity for alternative modes of transportation – such as walking, biking, and busing. One purpose of the regional center is to reduce vehicle congestion, improve air quality, increase the utilization of alternative transportation infrastructure, and reduce the overall cost and the amount of land required to meet transportation demand.
High-density development near and within transit corridors like Molalla Avenue can result in reduced trip lengths (due to the proximity of destinations) and decreased trip counts (resulting from increased utilization of transit facilities). In the long run, development clustered in transit corridors could result in a significant reduction in the amount of roadway capacity needed to serve City needs. Traffic modeling conducted by some municipalities has shown that transit and limited-parking corridors can
3a. AN 09-02. The applicant is requesting approval of an annexation of eight properties totalling approximately 53 acres. Page 51 of 84

Oregon City Transportation SDC Study August 20, 2008
Telephone (425) 867-1802 Page 2 F:\Oregon City\XXXTransportationSDC2008\Documentation\Issue Paper 7 - Transit Corridors - Final.doc
extend the service life of current roadway capacity by 20 or even 30 years.
In the short-term, the most reliable data of the information we reviewed indicates that a combination of urban development and transit availability can reduce residential vehicle trips between six to seven percent and fifteen percent (from “Trip Reductions for Residential or Mixed Use Developments within ¼ Mile of a Transit Center”, ITE Trip Generation).
In addition to the reduced trip generation of residential developments, there is also a cost-of-service basis for a TSDC credit for non-residential developments. The higher density of development in mixed use areas and transit corridors should allow visitors to park only once to visit more than one commercial establishment. Accordingly, in such areas, the unit cost of meeting transportation demand should be lower. This could serve as a basis for lower transportation system development charges for non-residential developments in the area.
RECOMMENDATIONS To account for the expected reduction in vehicle trips generated by residential developments within areas like the regional center and Molalla Avenue, we recommend that the City provide a discount for such developments in the amount of 10% of its TSDC.
Given the close proximity of non-residential establishments in high-density areas, we recommend that non-residential developments in the regional center be assessed a TSDC for the lesser of either their estimated trip generation rate or the trip rate for the Shopping Center land use.
Finally, in order to ensure that the developments within the regional center or on applicable sections of Molalla Avenue experience the reduction in vehicle trips that is embedded within the TSDC charge structure, the City should consider a policy of providing the above-mentioned TSDC adjustments only for permitted uses in the regional center or on Molalla Avenue. It should be the responsibility of the property owner to notify the City of their eligibility for such TSDC adjustments.
3a. AN 09-02. The applicant is requesting approval of an annexation of eight properties totalling approximately 53 acres. Page 52 of 84

Telephone (425) 867-1802 Page 1 F:\Oregon City\XXXTransportationSDC2008\Documentation\Issue Paper 8 - Metro Consistency - Final.doc
ISSUE PAPER #8
Metro Consistency
ISSUE In July 2007, the Portland area metropolitan service district (Metro) published a report detailing the various approaches to crafting system development charges (SDCs) that promote full and equitable cost recovery. The report noted that the validity of each approach varies by jurisdiction. Given the development characteristics and improvement needs within Oregon City, which recommendations identified in “Promoting Vibrant Communities with System Development Charges” could appropriately be incorporated into the City’s transportation system development charge (TSDC)?
ALTERNATIVES The Metro report recommends five SDC practices/policies that are consistent with regional objectives:
full cost recovery, impact-based SDCs, recognition of cost variations by location, green design, and technical vs. policy-based solutions.
ANALYSIS Full Cost Recovery
The 2007 Metro report recommends that local governments provide for full cost recovery in SDCs by:
basing each charge on a recently adopted capital improvements plan projecting needs for at least 10 years,
including a reimbursement fee component to recover the cost of capacity in existing facilities serving growth,
incorporating the planning and financing costs associated with improvements as well as the costs of calculating SDCs and accounting for their expenditures and revenues,
adjusting fees annually to account for changes in costs, including land and materials.
The City is currently updating a 20-year capital improvements plan, developed for the 2001 Transportation System Plan. The updated list will serve as the basis for the improvement fee, absent financing costs. Additionally, as the City has previous TSDC revenues with which it has funded capacity improvements, we have recommended that a reimbursement fee component be incorporated into the City’s updated TSDC. Similarly, the proposed TSDC methodology would incorporate the costs of calculating the TSDC and accounting for revenues and expenditures. Also, the City does adjust its fees annually according to
3a. AN 09-02. The applicant is requesting approval of an annexation of eight properties totalling approximately 53 acres. Page 53 of 84

Oregon City Transportation SDC Study September 24, 2008
Telephone (425) 867-1802 Page 2 F:\Oregon City\XXXTransportationSDC2008\Documentation\Issue Paper 8 - Metro Consistency - Final.doc
changes in a regional construction cost index.
Impact-Based SDCs
In order to reflect the true costs of serving different types of development and land uses, the Metro report recommends:
differentiating TSDCs by type of dwelling and type of non-residential land use;
varying residential TSDCs by house size to reflect the fact that “dwelling size is a potential indicator of the number of occupants,” which relates to trip generation;
varying residential TSDCs by the number of units per lot in recognition that high-density development has less impact on roadways and is less costly to serve per unit.
The proposed TSDC methodology differentiates the charge according to type of land use, however distinctions related to housing size and homes per lot have yet to be considered. Relatedly, the City’s current TSDC structure includes an adjustment for the average length of the vehicle trips generated by the various types of development.
Recognition of Cost Variations By Location
Since the location of a development is an important factor of the relative cost of serving it, the Metro Report recommends that local governments consider location-based SDCs, especially if development is expected in an area with limited transportation infrastructure relative to projected demand.
A location-based TSDC would result in lower or discounted charges in the downtown core, mixed use areas, and transit and limited-parking corridors in recognition of the fact that developments in such areas generate fewer and shorter vehicle trips.
The TSDC methodology proposed for the City’s updated charge provides discounts for developments within high-density areas. Also, individual high-density residential developments could be eligible for a discounted TSDC after providing documentation of their reduced vehicle trip generation rates.
Green Design
The Metro Report notes that adopting green design standards has led to a reduced need for additional infrastructure improvements. The Report also recommends discounting TSDCs for green design features: transportation demand management measures and site designs that may reduce vehicle trip generation (for example, bicycle parking structures or reduced parking).
Although the City has yet to adopt design standards that would reduce the capacity demand of future development, sites that incorporate green design features are eligible for a discounted TSDC after providing documentation of their reduced vehicle trip generation rates.
3a. AN 09-02. The applicant is requesting approval of an annexation of eight properties totalling approximately 53 acres. Page 54 of 84

Oregon City Transportation SDC Study September 24, 2008
Telephone (425) 867-1802 Page 3 F:\Oregon City\XXXTransportationSDC2008\Documentation\Issue Paper 8 - Metro Consistency - Final.doc
Technical vs. Policy-Based Solutions
The Metro Report notes that either a technical or a policy basis can support differences in the total TSDC assessed to a particular development. Both bases reflect the infrastructure impact of development characteristics such as land use, density, location, and design elements. However, policy-based differences often have less supporting documentation and typically result in a decrease in SDC revenues that must be funded from other governmental revenues. On the other hand, technically-based charge variations can be incorporated into the TSDC methodology to ensure full cost recovery. It is our belief that such “technical” or cost-based variations are consistent with the statutory requirement that ratemaking principles be used to develop the SDC, or more specifically, the reimbursement fee.
RECOMMENDATIONS Full Cost Recovery
In order to ensure full recovery of costs required to meet the capacity demands of growth, we recommend that the City use the 20-year project list under development. The City should also update its capital improvement plans as often as necessary to ensure that they are comprehensive in their identification of required improvements to serve growth.
Additionally, the City should ensure that the construction cost index utilized to annually adjust the TSDC is the most effective measure of changes in the City’s cost of building transportation infrastructure.
Impact-Based SDCs
We recommend that the City continue to vary its TSDC by land use type, without incorporating distinctions related to specific housing size and/or homes per lot.
Recognition of Cost Variations By Location
We recommend that location-based considerations in the allocation of planned transportation improvement costs be limited to dedicated high-density areas for development (the Regional Center and Molalla Avenue).
Green Design
We recommend that the City provide for the use of alternative methodologies to calculate individual TSDCs. Such a process would allow documented site-specific trip generation estimates to supersede the Institute of Transportation Engineers (ITE) estimates used to initially calculate the applicable charge. For example, if it could be shown that the inclusion of physical features like bicycle racks or parking limitations support reduced trip generation rates, then that green design practice would be charged for the lower trip generation. In addition, the TSDC adopting ordinance should explicitly encourage green design and the resulting reduction in trip generation.
Technical vs. Policy-Based Solutions
3a. AN 09-02. The applicant is requesting approval of an annexation of eight properties totalling approximately 53 acres. Page 55 of 84

Oregon City Transportation SDC Study September 24, 2008
Telephone (425) 867-1802 Page 4 F:\Oregon City\XXXTransportationSDC2008\Documentation\Issue Paper 8 - Metro Consistency - Final.doc
Finally, we concur with the recommendation that technically-based considerations in the TSDC be given preference over policy-based approaches. Although there is sound reasoning underlying assumptions in lower or greater vehicle trip rates and cost of service based on specific development characteristics, distinctions in the transportation charge should be supported by documented variations.
3a. AN 09-02. The applicant is requesting approval of an annexation of eight properties totalling approximately 53 acres. Page 56 of 84

Appendix B
Appendix B
Technical Analysis
3a. AN 09-02. The applicant is requesting approval of an annexation of eight properties totalling approximately 53 acres. Page 57 of 84

Oregon CityTransportation SDC StudyTransportation Fee Calculation
Table 1
Reimbursement Fee Roadway Improvements Bike / Ped Improvements
Cost of Net Unused Capacity 6,208,392$ -$
Citywide Growth to End of Planning Period 23,448 Peak-Hour Trips 31,974 Bike / Ped Trips
Reimbursement Fee 264.78$ per P-HT -$ per Bike/Ped Trip
Improvement Fee
Capacity Expanding Projects 156,840,988$ 6,432,131$
Citywide Growth to End of Planning Period 23,448 Peak-Hour Trips 31,974 Bike / Ped Trips
Improvement Fee 6,689.01$ per P-HT 201.17$ per Bike/Ped Trip
Total System Development Charge
Reimbursement Fee 264.78$ per P-HT -$ per Bike/Ped TripImprovement Fee 6,689.01$ per P-HT 201.17$ per Bike/Ped TripTSDC Subtotal 6,953.78$ per P-HT 201.17$ per Bike/Ped Tripplus: Administrative Cost Recovery 0.67% 46.25$ per P-HT 1.34$ per Bike/Ped Trip
Total TSDC 7,000$ per P-HT 202.51$ per Bike/Ped Trip
FINAL
FCS GROUP(425) 867-1802 Trans SDC Model 040309 FINAL 4/3/2009
3a. AN
09-02. The applicant is requesting approval of an annexation of
eight properties totalling approximately 53 acres.
Page 58 of 84
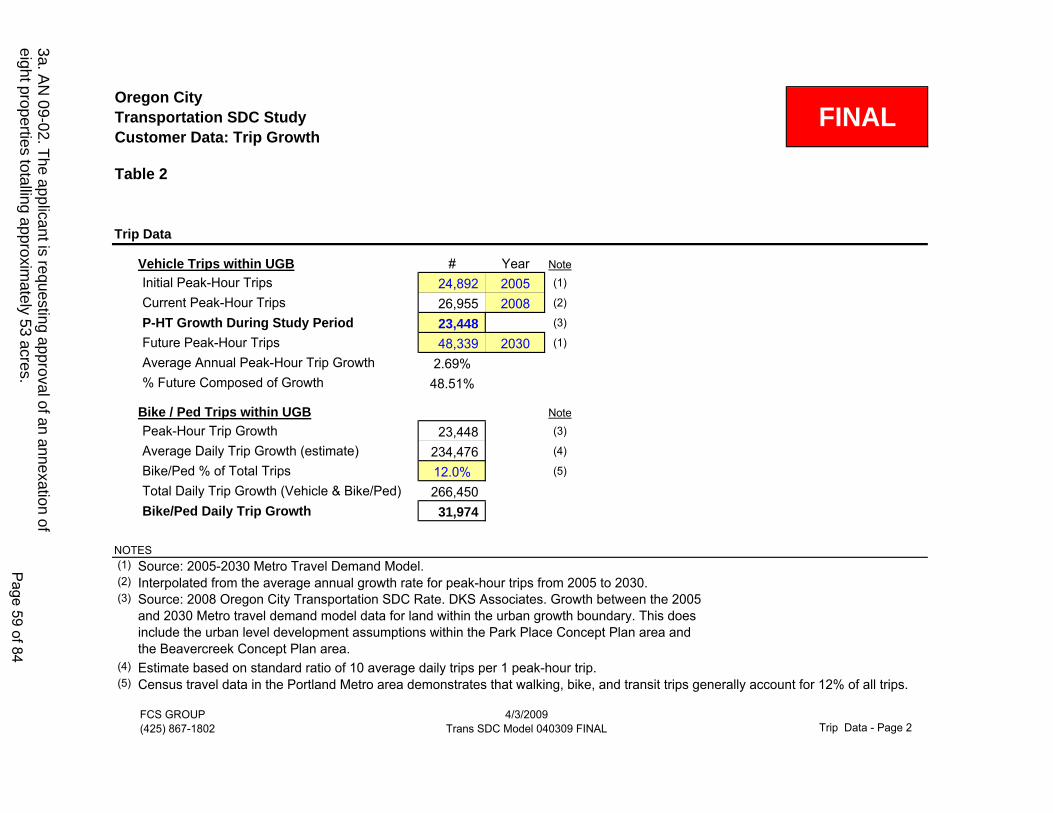
Oregon CityTransportation SDC StudyCustomer Data: Trip Growth
Table 2
Trip Data
Vehicle Trips within UGB # Year Note
Initial Peak-Hour Trips 24,892 2005 (1)
Current Peak-Hour Trips 26,955 2008 (2)
P-HT Growth During Study Period 23,448 (3)
Future Peak-Hour Trips 48,339 2030 (1)
Average Annual Peak-Hour Trip Growth 2.69%% Future Composed of Growth 48.51%
Bike / Ped Trips within UGB Note
Peak-Hour Trip Growth 23,448 (3)
Average Daily Trip Growth (estimate) 234,476 (4)
Bike/Ped % of Total Trips 12.0% (5)
Total Daily Trip Growth (Vehicle & Bike/Ped) 266,450 Bike/Ped Daily Trip Growth 31,974
NOTES(1) Source: 2005-2030 Metro Travel Demand Model.(2) Interpolated from the average annual growth rate for peak-hour trips from 2005 to 2030.(3)
(4) Estimate based on standard ratio of 10 average daily trips per 1 peak-hour trip.(5) Census travel data in the Portland Metro area demonstrates that walking, bike, and transit trips generally account for 12% of all trips.
Source: 2008 Oregon City Transportation SDC Rate. DKS Associates. Growth between the 2005 and 2030 Metro travel demand model data for land within the urban growth boundary. This does include the urban level development assumptions within the Park Place Concept Plan area and the Beavercreek Concept Plan area.
FINAL
FCS GROUP(425) 867-1802
4/3/2009Trans SDC Model 040309 FINAL Trip Data - Page 2
3a. AN
09-02. The applicant is requesting approval of an annexation of
eight properties totalling approximately 53 acres.
Page 59 of 84

Oregon CityTransportation SDC StudyExisting Infrastructure Costs for TSDC
Table 3
Capacity Unused UsedDescription Related Capacity Capacity
Historical TSDC Expenditures (1) 7,775,416$ 6,208,392$ 1,567,025$
NOTES(1)
Unused Capacity of Assets Funded by TSDC Expenditures
Construction Year FY 1993 FY 1994 FY 1995 FY 1996 FY 1997 FY 1998 FY 1999 FY 2000 FY 2001
Improvement Fee Expenditures [Note A] 12,444.45$ 5,162.59$ 507,848.58$ 714,934.89$ 136,329.78$ 607,437.68$ 349,194.47$ 2,150,624.00$ 3,291,440.00$
Percentage For Capacity Increasing Projects 100% 100% 100% 100% 100% 100% 100% 100% 100%
Applicable TSDC Expenditures 12,444$ 5,163$ 507,849$ 714,935$ 136,330$ 607,438$ 349,194$ 2,150,624$ 3,291,440$
Beginning Trip Total [Note B] 18,101 18,588 19,088 19,601 20,129 20,670 21,226 21,797 22,384
Current Trip Total (FY 2008) [Note B] 26,955 26,955 26,955 26,955 26,955 26,955 26,955 26,955 26,955
Ending Trip Total for Study Period (FY 2030) [Note B] 48,339 48,339 48,339 48,339 48,339 48,339 48,339 48,339 48,339
% of Capacity Used by Growth to FY 2008 29.3% 28.1% 26.9% 25.6% 24.2% 22.7% 21.1% 19.4% 17.6%
Cost of Unused Capacity 8,800$ 3,711$ 371,258$ 531,986$ 103,340$ 469,458$ 275,410$ 1,732,696$ 2,711,733$
Note [A]. Source: FY1991 - FY2001 Street SDC report of revenues and expenditures (Program 401).Note [B]. Source: Historical peak-hour trips derived from rate of growth implied in 2005-2030 trip forecast.
Unused Capacity of Assets Funded by TSDC Expenditures. To date, the charge has not had a reimbursement fee component (source: 1997 Transportation System Development Charge update).
FINAL
FCS GROUP(425) 867-1802 Trans SDC Model 040309 FINAL 4/3/2009
3a. AN
09-02. The applicant is requesting approval of an annexation of
eight properties totalling approximately 53 acres.
Page 60 of 84

Oregon CityTransportation SDC StudyTSDC Project List -- Road Improvements
Table 4Eligible Serving
Project Yr of Cost Capacity Existing City Funding Project SDC# Source (1) Estimate Project Title (1) Increasing % (2) Deficiency Responsibility (3) Cost (1) Eligible Cost
State Facility Projects (All Sources)
PP-1 2008 List 2008 HWY 213 Corridor Improvements ( I-205 to Oregon City UGB) 0.0% 100.0% 30.0% R-37, R-51, R-52, R-53, R-77, R-88, R-105
See Related Project Costs
R-37 2008 List 2008 HWY 213: I-205 to Redland Rd 17.3% 82.7% 30.0% PP-1, R-51, R-52, R-53, R-77, R-88
See Related Project Costs
R-38 2008 List 2008 HWY 213: Molalla Ave to Henrici Rd 23.8% 76.2% 30.0% R-54, R-55, R-56, P-51 See Related Project Costs
R-48 2008 List 2008 HWY 99E/I-205 SB Ramps 93.0% 7.0% 30.0% 762,000 212,598 R-49 2008 List 2008 HWY 99E/I-205 NB Ramps 0.0% 100.0% 30.0% 783,000 - R-50 2008 List 2008 HWY 99E/Main Street 38.8% 61.2% 30.0% 422,000 49,159 R-52 2008 List 2008 HWY 213/Washington Street 83.0% 17.0% 30.0% 20,000,000 4,980,000 R-53 2008 List 2008 Hwy 213/Redland Road 99.0% 1.0% 40.0% 10,600,000 4,197,600 R-54 2008 List 2008 HWY 213/Molalla Avenue 54.0% 46.0% 30.0% 1,450,000 235,026 R-55 2008 List 2008 HWY 213/Glen Oak Road/Caufield Road 79.0% 21.0% 30.0% 340,000 80,580 R-56 2008 List 2008 HWY 213/Henrici Road 62.8% 37.2% 30.0% 720,000 135,574 R-77 2008 List 2008 Redland Rd/Abernethy Rd 84.0% 16.0% 30.0% 450,000 113,400 R-88 2008 List 2008 Redland Rd extension between Abernethy Rd & Washington St 39.2% 60.8% 30.0% 13,100,000 1,540,959 R-105 2008 List 2008 Hwy 213/Beavercreek Road (improvement for existing deficiency) 0.0% 100.0% 30.0% 50,000,000 -
Beavercreek Concept Plan-BRBR-1 2008 List 2008 Beavercreek Rd: Marjorie Ln to Clairmont Dr (CCC Entrance) 51.6% 48.4% 100.0% 6,300,000 3,251,502
BR-2 2008 List 2008 Beavercreek Rd: Clairmont Dr (CCC Entrance) to UGB (not Henrici) 54.0% 46.0% 100.0% 10,995,000 5,940,487
BR-3 2008 List 2008 Clairmont Drive: Beavercreek Road to Center Parkway 100.0% 0.0% 100.0% 2,400,000 2,400,000 BR-4 2008 List 2008 Loder Road: Beavercreek Road to Center Parkway 54.8% 45.2% 100.0% 1,400,000 766,610 BR-5 2008 List 2008 Loder Road: Center Parkway to East Site Boundary 100.0% 0.0% 100.0% 4,200,000 4,200,000 BR-6 2008 List 2008 Meyers Road: Beavercreek Road to Ridge Parkway 100.0% 0.0% 100.0% 3,500,000 3,500,000 BR-7 2008 List 2008 Glen Oak Road: Beavercreek Road to Ridge Parkway 100.0% 0.0% 100.0% 3,400,000 3,400,000 BR-8 2008 List 2008 Center Parkway: Old Acres Ln to Thayer Road 100.0% 0.0% 100.0% 17,700,000 17,700,000 BR-9 2008 List 2008 Ridgeway Parkway: Old Acres Ln to North Site Boundary 100.0% 0.0% 100.0% 9,800,000 9,800,000 BR-10 2008 List 2008 Beavercreek Road/Maplelane Road 53.4% 46.6% 100.0% 250,000 133,444 BR-11 2008 List 2008 Beavercreek Road/Meyers Road 53.1% 46.9% 100.0% 5,000,000 2,654,172
Park Place Concept Plan-PPPP-2 2008 List 2008 Redland Road: Abernethy/Holcomb to Swan Ave (Holly Ln) 39.6% 60.4% 100.0% 11,500,000 4,558,791 PP-3 2008 List 2008 Holly Lane: Redland to Maplelane Road 54.4% 45.6% 100.0% 1,000,000 544,218 PP-4 2008 List 2008 Livesay Road: Swan Ext to Holly Ext 76.3% 23.7% 100.0% 1,800,000 1,373,333 PP-5 2008 List 2008 Donovan Road: Holly Lane to Ogden Middle School 62.8% 37.2% 100.0% 1,200,000 753,191 PP-6 2008 List 2008 Swan Ave Extension: Existing Swan Ave S to Holcomb Blvd 100.0% 0.0% 100.0% 1,100,000 1,100,000 PP-8 2008 List 2008 Swan Ave Extension: Redland Rd to Holly Ln 100.0% 0.0% 100.0% 9,300,000 9,300,000
FINAL
FCS GROUP(425) 867-1802 Trans SDC Model 040309 FINAL 4/3/2009
3a. AN
09-02. The applicant is requesting approval of an annexation of
eight properties totalling approximately 53 acres.
Page 61 of 84

Eligible ServingProject Yr of Cost Capacity Existing City Funding Project SDC
# Source (1) Estimate Project Title (1) Increasing % (2) Deficiency Responsibility (3) Cost (1) Eligible Cost
PP-9 2008 List 2008 Holly Lane Extension: Redland Rd to Holcomb Blvd 100.0% 0.0% 100.0% 17,400,000 17,400,000 PP-10 2008 List 2008 Anchor Way/Redland 70.0% 30.0% 100.0% 2,900,000 2,030,000 PP-11 2008 List 2008 Holly Ln/Redland Rd 65.0% 35.0% 100.0% 2,000,000 1,300,000 PP-12 2008 List 2008 Holly Ln/Maplelane Rd 65.0% 35.0% 100.0% 1,600,000 1,040,000 PP-13 2008 List 2008 Swan Ave/Holcomb Blvd 69.2% 30.8% 100.0% 300,000 207,468
Roadway System Plan-R (City Streets)R-10 2008 List 2008 Washington Street/12th Street 29.9% 70.1% 100.0% 510,000 152,696 R-11 2008 List 2008 Anchor Way: 18th St to Redland Rd 40.0% 60.0% 100.0% 445,000 178,000 R-12 2008 List 2008 Beavercreek Road: CCC to Glen Oak Rd 0.0% 100.0% 100.0% See cost for BR-2. - R-13 2008 List 2008 Boynton Street: Warner Parrot Rd to Buol St 40.0% 60.0% 100.0% 445,000 178,000 R-14 2008 List 2008 Central Point Road: Roundtree Dr to UGB 40.0% 60.0% 100.0% 940,000 376,000 R-15 2008 List 2008 Forsythe Rd: Clackamas River Dr to Swan Ave 40.0% 60.0% 100.0% 1,200,000 480,000 R-16 2008 List 2008 Gaffney Lane: Molalla Ave to Meyers Rd 40.0% 60.0% 100.0% 1,635,000 654,000 R-17 2008 List 2008 Glen Oak Road: HWY 213 to Beavercreek Rd 100.0% 0.0% 100.0% 825,000 825,000 R-18 2008 List 2008 Holcomb Road: Redland Rd to UGB 40.0% 60.0% 100.0% 2,710,000 1,084,000 R-19 2008 List 2008 Holmes Lane-Hilda St: Linn Ave to Alden St 40.0% 60.0% 100.0% 1,090,000 436,000 R-20 2008 List 2008 Leland Rd: McCord Rd to UGB 100.0% 0.0% 100.0% 1,616,000 1,616,000 R-21 2008 List 2008 Maplelane Road: Beavercreek Rd to UGB 40.0% 60.0% 100.0% 1,360,000 544,000 R-22 2008 List 2008 McCord Road: Central Point Rd to Leland Rd 40.0% 60.0% 100.0% 740,000 296,000 R-23 2008 List 2008 Partlow Road: South End Rd to Central Point Rd 40.0% 60.0% 100.0% 1,700,000 680,000 R-24 2008 List 2008 Pease Road: Leland Rd to McCord Rd 40.0% 60.0% 100.0% 1,070,000 428,000 R-25 2008 List 2008 Redland Rd: Holly Ln to UGB 100.0% 0.0% 100.0% 2,212,000 2,212,000 R-26 2008 List 2008 South End Road: Partlow Rd to UGB 100.0% 0.0% 100.0% 1,445,000 1,445,000 R-27 2008 List 2008 Swan Avenue: Holcomb Rd to Forsythe Rd 40.0% 60.0% 100.0% 851,000 340,400 R-28 2008 List 2008 Thayer Road: Maplelane Rd to UGB 40.0% 60.0% 100.0% 902,000 360,800 R-29 2008 List 2008 Washington St-Clackamas River Drive: Abernethy Rd to UGB 100.0% 0.0% 100.0% 1,750,000 1,750,000 R-30 2008 List 2008 Holcomb Road/Front St/Beemer Jacobs Way 52.5% 47.5% 100.0% 1,130,000 593,690 R-31 2008 List 2008 Leland Rd/Pease Rd 72.6% 27.4% 100.0% 250,000 181,513 R-34 2008 List 2008 Warner Milne Rd/Molalla Ave 30.7% 69.3% 100.0% 1,614,000 496,228 R-35 2008 List 2008 Warner Milne/Warner Parrott Rd/Leland/Linn Ave/Central Point Rd 42.8% 57.2% 100.0% 2,000,000 856,924 R-40 2008 List 2008 Washington Street: 12th St to 7th St 35.4% 64.6% 100.0% 1,340,000 474,768
R-42 2008 List 2008 Molalla Avenue: Holmes Lane to HWY 213 31.9% 68.1% 100.0% See related project costs. -
R-44 2008 List 2008 Warner Milne Road: Beavercreek Rd to Leland/Linn Ave 28.6% 71.4% 100.0% 7,500,000 2,148,058 R-61 2008 List 2008 Main Street/14th Street 65.0% 35.0% 100.0% 515,000 334,750 R-62 2008 List 2008 Main Street/10th Street 65.0% 35.0% 100.0% 515,000 334,750 R-63 2008 List 2008 Molalla Avenue/Barclay Hills Dr 32.3% 67.7% 100.0% 60,000 19,394 R-64 2008 List 2008 Molalla Avenue/Clairmont Way 23.5% 76.5% 100.0% 400,000 94,068 R-65 2008 List 2008 Molalla Avenue/Gaffney Lane 23.6% 76.4% 100.0% 450,000 106,354 R-66 2008 List 2008 Beavercreek Rd/Warner Milne Rd 27.4% 72.6% 100.0% 440,000 120,402 R-69 2008 List 2008 Beavercreek Rd/Glen Oak Rd 54.0% 46.0% 100.0% See cost for BR-7. - R-70 2008 List 2008 Warner Parrott Rd/South End Rd 65.0% 35.0% 100.0% 1,553,580 1,009,827 R-71 2008 List 2008 Warner Parrott Rd/Central Point Rd 42.5% 57.5% 100.0% See R-35 - R-72 2008 List 2008 Warner Milne Rd/Linn-Leland Ave 42.9% 57.1% 100.0% See R-35 -
FCS GROUP(425) 867-1802 Trans SDC Model 040309 FINAL 4/3/2009
3a. AN
09-02. The applicant is requesting approval of an annexation of
eight properties totalling approximately 53 acres.
Page 62 of 84

Eligible ServingProject Yr of Cost Capacity Existing City Funding Project SDC
# Source (1) Estimate Project Title (1) Increasing % (2) Deficiency Responsibility (3) Cost (1) Eligible Cost
R-73 2008 List 2008 South End Rd/High Street/S 2nd St 65.0% 35.0% 100.0% 1,367,604 888,943 R-75 2008 List 2008 Linn Ave/Davis Rd/Ethel St 86.0% 14.0% 100.0% 510,300 438,858 R-76 2008 List 2008 Leland Rd/Clairmont Way/Meyers Rd 67.9% 32.1% 100.0% 510,300 346,493 R-79 2008 List 2008 Spring Valley Dr: Partlow Rd to Salmonberry Dr 0.0% 100.0% 100.0% N/A - R-80 2008 List 2008 Shenandoah Dr: Central Point to Pease Rd & Pease to Leland Rd 28.6% 71.4% 100.0% N/A - R-83 2008 List 2008 South Douglas Loop (CCC) to Glen Oak Road 23.7% 76.3% 100.0% 3,120,000 739,518 R-84 2008 List 2008 Coquille Drive Extension 49.7% 50.3% 100.0% 5,200,000 2,586,347 R-86 2008 List 2008 Meyers Road to Caufield Road 65.8% 34.2% 100.0% N/A - R-91 2008 List 2008 SE 82nd Drive crossing of Clackamas River 24.9% 75.1% 100.0% N/A - R-92 2008 List 2008 Fir Street Extension: Highway 213 to Beavercreek Road 51.5% 48.5% 100.0% 18,750,000 9,660,883 R-93 2008 List 2008 Ethel St to May St (south of Holmes Lane) 44.5% 55.5% 100.0% N/A - R-94 2008 List 2008 Laurel Lane Extension: May St to Warner Milne Rd 42.7% 57.3% 100.0% N/A - R-95 2008 List 2008 Roosevelt St Extension: Molalla Ave to Linn Ave 45.6% 54.4% 100.0% N/A - R-96 2008 List 2008 12th Street Extension: Taylor St to Grant St 40.3% 59.7% 100.0% N/A - R-97 2008 List 2008 Skellenger Way to Meyers Road/Clairmont Way 40.4% 59.6% 100.0% N/A - R-98 2008 List 2008 Meyers Road Extension: Highway 213 to High School Lane 54.2% 45.8% 100.0% 10,000,000 5,415,282 R-102 2008 List 2008 Parrish Road Extension 100.0% 0.0% 100.0% 4,000,000 4,000,000 R-104 2008 List 2008 Molalla Avenue/Taylor/Division 34.2% 65.8% 100.0% 1,000,000 341,998 R-106 2008 List 2008 Agnes Street: Main Street to Highway 213 61.4% 38.6% 100.0% 13,575,000 8,332,559
Total 58.1% 41.9% 78.3% 312,918,784$ 158,455,615$ less: Beginning FY2007 Transportation SDC Fund Balance (4) 1,614,627$ Total Future Capital Projects for SDC Calculation 156,840,988$
NOTES(1) 2008 List = Primary sources were the 2001 Transportation System Plan and the Beavercreek Road and Park Place Concept Plans.
Original cost estimates in 2001 TSP were updated to 2008 dollars.(2) Projects were allocated based on growth's share of total future peak-hour trips. When such data was unavailable, baseline projections
of vehicle/capacity (V/C) ratios were utilized to determine existing system deficiencies.(3) Minimum 10% City match for State project costs. The City anticipates potential City contribution of at least 30% and up to 40%.(4) Source: FY2007 City budget.
FCS GROUP(425) 867-1802 Trans SDC Model 040309 FINAL 4/3/2009
3a. AN
09-02. The applicant is requesting approval of an annexation of
eight properties totalling approximately 53 acres.
Page 63 of 84

Oregon CityTransportation SDC StudyTSDC Project List -- Bike/Ped Improvements
Table 5Eligible Serving
Project Yr of Cost Capacity Existing Project SDC# Source (1) Estimate Project Title (1) Increasing % (2) Deficiency Cost (1) Eligible Cost
Bicycle System Improvements-BB-2 2008 Bike/Ped 2008 Beavercreek Road (Maplelane to UGB) 48.5% 51.5% 55,080$ 26,717$ B-3 2008 Bike/Ped 2008 Molalla Avenue (Beavercreek to Hwy 213) 48.5% 51.5% 29,160 14,144 B-4 2008 Bike/Ped 2008 Singer Hill (Hwy 99E to 7th St) 48.5% 51.5% N/A - B-5 2008 Bike/Ped 2008 South End Road (Barker Avenue to UGB) 48.5% 51.5% 2,360,897 1,145,187 B-6 2008 Bike/Ped 2008 Warner Milne Road (Linn Ave to Molalla Ave) 48.5% 51.5% 23,328 11,316 B-7 2008 Bike/Ped 2008 Washington Street (11th Street to 5th Street) 48.5% 51.5% 12,960 6,286 B-8 2008 Bike/Ped 2008 Highway 99E (S 2nd Street to South UGB) 48.5% 51.5% 133,650 64,829 B-9 2008 Bike/Ped 2008 Highway 213 (I-205 to Molalla Ave) 48.5% 51.5% 12,960 6,286
B-10 2008 Bike/Ped 2008 5th Street (High street to Jackson street) 48.5% 51.5% 7,128 3,458 B-11 2008 Bike/Ped 2008 Anchor Way (Redland Road to Division Street) 48.5% 51.5% See cost for R-11. - B-12 2008 Bike/Ped 2008 Central Point Road (Warner Parrott to UGB) 48.5% 51.5% 125,388 60,821 B-13 2008 Bike/Ped 2008 Division Street (Anchor Way to Molalla Ave) 48.5% 51.5% 33,048 16,030 B-14 2008 Bike/Ped 2008 Gaffney Lane (Molalla Avenue to Meyers Road) 48.5% 51.5% See cost for R-16. - B-15 2008 Bike/Ped 2008 Holmes Lane (Telford Road to Molalla Avenue) 48.5% 51.5% 9,720 4,715 B-16 2008 Bike/Ped 2008 Leland Road (Warner Milne Road to UGB) 48.5% 51.5% 2,195,988 1,065,195 B-17 2008 Bike/Ped 2008 Main Street Extension 48.5% 51.5% 346,874 168,256 B-18 2008 Bike/Ped 2008 Monroe Street (12th Street to 5th Street) 48.5% 51.5% 7,290 3,536 B-19 2008 Bike/Ped 2008 Partlow Road (South End Road to Central Point Road) 48.5% 51.5% See cost for R-23. - B-20 2008 Bike/Ped 2008 12th Street (99E to Taylor St) 48.5% 51.5% 45,360 22,003 B-21 2008 Bike/Ped 2008 15th Street (Washington St to Division St) 48.5% 51.5% 11,340 5,501 B-22 2008 Bike/Ped 2008 Barker Ave (South End Rd to Telford Ave) 48.5% 51.5% 8,100 3,929 B-24 2008 Bike/Ped 2008 Center Street (7th St to Telford Ave) 48.5% 51.5% 31,104 15,087 B-25 2008 Bike/Ped 2008 Clackamette Drive (Main St Extension to Highway 99E) 48.5% 51.5% 19,440 9,430 B-26 2008 Bike/Ped 2008 Front Avenue (Forsythe Rd to Holcomb Rd) 48.5% 51.5% 21,384 10,373 B-28 2008 Bike/Ped 2008 High Street (7th St to S 2nd St) 48.5% 51.5% 8,586 4,165
B-29 2008 Bike/Ped 2008 Hilda St/Alden St/Barclay Hills Dr-Molalla Ave to Newell Ridge Dr 48.5% 51.5% 6,480 3,143
B-30 2008 Bike/Ped 2008 Holcomb Boulevard (Abernethy Rd to UGB) 48.5% 51.5% 65,448 31,746 B-31 2008 Bike/Ped 2008 Jackson Street (15th St to 12th St) 48.5% 51.5% 6,480 3,143 B-32 2008 Bike/Ped 2008 Main Street (Main Extension to Singer Hill) 48.5% 51.5% 11,340 5,501 B-33 2008 Bike/Ped 2008 Meyers Road (Highway 213 to Beavercreek Rd) 48.5% 51.5% See cost for R-98. - B-34 2008 Bike/Ped 2008 Railroad Avenue (Main St to Hwy 99E) 48.5% 51.5% 4,860 2,357 B-35 2008 Bike/Ped 2008 Swan Avenue (Forsythe Rd to Holcomb Blvd) 48.5% 51.5% 8,910 4,322 B-36 2008 Bike/Ped 2008 Telford Road (Center St to Holmes Lane) 48.5% 51.5% 8,100 3,929
FINAL
FCS GROUP(425) 867-1802 Trans SDC Model 040309 FINAL 4/3/2009
3a. AN
09-02. The applicant is requesting approval of an annexation of
eight properties totalling approximately 53 acres.
Page 64 of 84

Eligible ServingProject Yr of Cost Capacity Existing Project SDC
# Source (1) Estimate Project Title (1) Increasing % (2) Deficiency Cost (1) Eligible CostB-37 2008 Bike/Ped 2008 Taylor Street (12th St to 7th St) 48.5% 51.5% 10,368 5,029 B-38 2008 Bike/Ped 2008 Canemah Road (Telford Road to Warner Parrott Road) 48.5% 51.5% 3,564 1,729 B-39 2008 Bike/Ped 2008 Davis Road (Telford Road to Linn Avenue) 48.5% 51.5% 5,994 2,907 B-40 2008 Bike/Ped 2008 Cleveland Street (Front Street to Swan Avenue) 48.5% 51.5% 10,692 5,186 B-41 2008 Bike/Ped 2008 Clackamas River Drive (Hwy 213 to UGB) 48.5% 51.5% 27,540 13,359 B-42 2008 Bike/Ped 2008 Abernethy Road (Washington Street to Redland Road) 48.5% 51.5% 17,172 8,330 B-43 2008 Bike/Ped 2008 Fir Street (Molalla Avenue to Beavercreek Road) 48.5% 51.5% 29,160 14,144 B-44 2008 Bike/Ped 2008 Melinda Street (Clackamas River Drive to Front Street) 48.5% 51.5% 4,212 2,043
Recommended Pedestrian ImprovementsP-1 2008 Ped List Highway 213 (Molalla Avenue to UGB) 48.5% 51.5% - - P-2 2008 Ped List Highway 99E (Clackamas River Br to Dunes Drive) 48.5% 51.5% - - P-4 2008 Ped List Highway 99E (Tumwater Drive to Hedges Street) 48.5% 51.5% - - P-5 2008 Ped List Abernethy-Holcomb Blvd (Washington Street to Winston Drive) 48.5% 51.5% See cost for R-18. - P-6 2008 Ped List Abernethy-Holcomb Blvd (Redland Road to Winston Drive) 48.5% 51.5% See cost for R-18. -
P-10 2008 Ped List Beavercreek Road (Maplelane Road to UGB) 48.5% 51.5% See costs for BR-1 & BR-2. -
P-11 2008 Ped List Berta Drive (Clairmont Way to Gaffney Lane) 48.5% 51.5% 116,640 56,578 P-12 2008 Ped List Berta Drive (Gaffney Lane to End) 48.5% 51.5% 77,760 37,719 P-13 2008 Ped List Boynton Street (warner Parrott Road to Buol street) 48.5% 51.5% See cost for R-13. - P-14 2008 Ped List Center Street (S 2nd Street to Telford Road) 48.5% 51.5% 388,800 188,593 P-15 2008 Ped List Central Point Road (Roundtree Drive to Partlow Road) 48.5% 51.5% See cost for R-14. - P-16 2008 Ped List Central Point Road (Skellenger Way to UGB) 48.5% 51.5% See cost for R-14. - P-17 2008 Ped List Central Point Road (Roundtree Drive to UGB) 48.5% 51.5% See cost for R-14. - P-18 2008 Ped List Clackamas River Drive (Hwy 213 to UGB) 48.5% 51.5% See cost for R-29. - P-19 2008 Ped List Clairmont Way (Southwood Drive to Leland Road) 48.5% 51.5% 291,600 141,445 P-20 2008 Ped List Clairmont Way (Molalla Avenue to Leland Road) 48.5% 51.5% 388,800 188,593 P-21 2008 Ped List Division Street (Selma Street to 12th Street) 48.5% 51.5% 58,320 28,289 P-22 2008 Ped List Division Street (Gilman Park Drive to Anchor Way) 48.5% 51.5% 194,400 94,296 P-23 2008 Ped List Division Street (15th Street to Anchor Way) 48.5% 51.5% 71,604 34,733 P-24 2008 Ped List Forsythe Road (Clackamas River Dr to UGB) 48.5% 51.5% See cost for R-15. - P-25 2008 Ped List Front Avenue (Forsythe Road to Holcomb Blvd) 48.5% 51.5% 264,141 128,125 P-26 2008 Ped List Gaffney Lane (Meyers Road to Lazy Creek Lane) 48.5% 51.5% See cost for R-16. - P-27 2008 Ped List Glen Oak Road (Hwy 213 to Beavercreek Road) 48.5% 51.5% 486,648 236,056 P-28 2008 Ped List Holmes Lane (Molalla Avenue to Linn Avenue) 48.5% 51.5% 213,840 103,726 P-29 2008 Ped List Holmes Lane (Laurel Lane to Reliance Lane) 48.5% 51.5% See cost for R-19. - P-30 2008 Ped List Leland Road (Warner Milne Road to Whitcomb Drive) 48.5% 51.5% See cost for R-20. - P-31 2008 Ped List Leland Road (Haven Road to UGB) 48.5% 51.5% See cost for R-20. - P-32 2008 Ped List Leland Road (Hiefield Court to UGB) 48.5% 51.5% See cost for R-20. - P-33 2008 Ped List Linn Ave (Jackson Street to Oak Street) 48.5% 51.5% 97,200 47,148 P-34 2008 Ped List Linn Ave (Charman Street to Holmes Lane) 48.5% 51.5% 155,520 75,437
FCS GROUP(425) 867-1802 Trans SDC Model 040309 FINAL 4/3/2009
3a. AN
09-02. The applicant is requesting approval of an annexation of
eight properties totalling approximately 53 acres.
Page 65 of 84

Eligible ServingProject Yr of Cost Capacity Existing Project SDC
# Source (1) Estimate Project Title (1) Increasing % (2) Deficiency Cost (1) Eligible CostP-35 2008 Ped List Linn Ave (Jackson street to Holmes Lane) 48.5% 51.5% 349,920 169,734 P-36 2008 Ped List Maplelane Road (Beavercreek Road to Country Village Drive) 48.5% 51.5% See cost for R-21. - P-37 2008 Ped List McCord Road (Daybreak Court to Leland Road) 48.5% 51.5% See cost for R-22. - P-38 2008 Ped List McCord Road (Central Point Road to Leland Road) 48.5% 51.5% See cost for R-22. - P-39 2008 Ped List Meyers Road (Leland Road to Highway 213) 48.5% 51.5% 514,026 249,336 P-40 2008 Ped List Meyers Road (Leland Road to Gaffney Lane) 48.5% 51.5% 291,600 141,445 P-41 2008 Ped List Partlow Road (South End Road to Central Point Road) 48.5% 51.5% See cost for R-23 - P-42 2008 Ped List Redland Road (Highway 213 to Abernethy Road) 48.5% 51.5% See cost for R-25. - P-43 2008 Ped List Redland Road (Abernethy Road to UGB) 48.5% 51.5% See cost for R-25. - P-44 2008 Ped List South End Road (Warner Parrott Road to UGB) 48.5% 51.5% See cost for R-26. - P-45 2008 Ped List South End Road (Barker Road to Warner Parrott Rd) 48.5% 51.5% 116,640 56,578 P-46 2008 Ped List South End Road (Barker Road to 2nd Street) 48.5% 51.5% 855,360 414,905 P-47 2008 Ped List Swan Avenue (Forsythe Road to Holcomb Blvd) 48.5% 51.5% See cost for R-27. - P-48 2008 Ped List Telford Road (Center Street to Davis Road) 48.5% 51.5% 445,176 215,939 P-49 2008 Ped List Thayer Road (Maplelane Road to UGB) 48.5% 51.5% See cost for R-28. - P-50 2008 Ped List Warner Parrott Road (Linn Ave to South End Road) 48.5% 51.5% 316,467 153,507 P-51 2008 Ped List Washington Street (Abernethy Road to Hwy 213) 48.5% 51.5% See cost for R-29. - P-52 2008 Ped List S 2nd Street (Tumwater Drive to Center Street) 48.5% 51.5% 77,760 37,719 P-53 2008 Ped List 15th Street (Highway 99E to Taylor Street) 48.5% 51.5% 816,480 396,045 P-55 2008 Ped List Hood Street (Linn Ave to Gardiner Middle School) 48.5% 51.5% 116,640 56,578 P-56 2008 Ped List Ethel Street (Linn Ave to Gardiner Middle School) 48.5% 51.5% 174,960 84,867 P-57 2008 Ped List Jackson Street (16th Street to Atkinson Park) 48.5% 51.5% 77,760 37,719 P-58 2008 Ped List Park Drive (Linn Avenue to Rivercrest Park) 48.5% 51.5% 194,400 94,296 P-59 2008 Ped List Hilda Street (Molalla Avenue to Mountain View Cem.) 48.5% 51.5% 194,400 94,296 P-60 2008 Ped List Warner Street (Molalla Avenue to St. John's Cem.) 48.5% 51.5% 194,400 94,296
Total 48.5% 51.5% 13,260,367$ 6,432,131$
NOTES(1) 2008 Bike/Ped = Project list provided as an appendix to 2008 Oregon City Transportation SDC Rate memo. DKS Associates.
2008 Ped List = Pedestrian System Plan Sidewalk Projects.(2) Based on growth's share of total future peak-hour trips (2005-2030).
FCS GROUP(425) 867-1802 Trans SDC Model 040309 FINAL 4/3/2009
3a. AN
09-02. The applicant is requesting approval of an annexation of
eight properties totalling approximately 53 acres.
Page 66 of 84

Oregon CityTransportation SDC StudyAdministrative Cost Recovery Calculation
Table 6
Net Annual Administrative Cost related to Transportation SDC (1) 30,000$ Amortization of SDC Study Cost over 5 years (2): 21,239
Net Annual Transportation SDC Administrative Cost: 51,239$
Estimated Annual Proposed SDC Revenues before Admin. CostRevenues from Roadway Improvements Charge: 7,411,335$ Revenues from Bike/Ped Improvements Charge: 292,370
7,703,705$
Admin. Cost / Total Annual Transportation SDC Revenues: 0.67% on all SDCs
NOTES
(1) Source: City staff.(2) Cost of: 97,270$
at: 3.0%over: 5 years
FINAL
FCS GROUP(425) 867-1802 Trans SDC Model 040309 FINAL 4/3/2009
3a. AN
09-02. The applicant is requesting approval of an annexation of
eight properties totalling approximately 53 acres.
Page 67 of 84

Oregon CityTransportation SDC StudyTSDC by Land Use
Table 7 TSDC 7,000$ per P-HT
ITE Code Customer Type Land Use Description Peak-Hour
TripsPass-By
Trip FactorAdjusted P-H Ts TSDC Units
110 General Light IndustrialTypically less than 500 employees, free standing and single use. Examples: Printing plants, material testing laboratories, data processing equipment assembly, power stations.
0.98 1 0.98 6,860$ KSF
130 Industrial Park Industrial Park areas that contain a number of industrial and/or related facilities (mix of manufacturing, service, and warehouse). 0.86 1 0.86 6,020$ KSF
140 Manufacturing Facilities that convert raw materials into finished products. Typically have related office, warehouse, research, and associated functions. 0.74 1 0.74 5,180$ KSF
151 Mini-WarehouseStorage Units or Vaults rented for storage of goods. Units are physically separate and access through an overhead door or other common access point. Example: U-Store-It.
0.26 1 0.26 1,820$ KSF
210 SF Detached Single family detached housing. 1.01 1 1.01 7,070$ DU
220 ApartmentRental Dwelling Units within the same building. At least 4 units in the same building. Examples: Quadplexes and all types of apartment buildings.
0.62 1 0.62 4,340$ DU
230 Condo/TownhouseResidential Condominium/Townhouses under single-family ownership. Minimum of two single family units in the same building structure. 0.52 1 0.52 3,640$ DU
240 Mobile Home Trailers or Manufactured homes that are sited on permanent foundations. Typically the parks have community facilities (laundry, recreation rooms, pools).
0.59 1 0.59 4,130$ DU
253 Elderly Housing
Restricted to senior citizens. Contains residential units similar to apartments or condos. Sometimes in self-contained villages. May also contain medical facilities, dining, and some limited, supporting retail. 0.17 1 0.17 1,190$ DU
310 HotelLodging facility that may include restaurants, lounges, meeting rooms, and/or convention facilities. Can include a large motel with these facilities. 0.59 1 0.59 4,130$ Room
320 Motel Sleeping accommodations and often a restaurant. Free on-site parking and little or no meeting space. 0.47 1 0.47 3,290$ Room
430 Golf Course
Includes 9, 18, 27, and 36 hole municipal and private country clubs. Some have driving ranges and clubhouses with pro shops, restaurants, lounges. Many of the muni courses do not include such facilities. 2.74 1 2.74 19,180$ Hole
435 Multipurpose Recreation FacilityMulti-purpose recreational facilities contain two or more of the following land uses at one site: mini-golf, batting cages, video arcade, bumper boats, go-carts, and driving ranges.
5.77 1 5.77 40,390$ Acre
437 Bowling Alley Recreational facilities with bowling lanes which may include a small lounge, restaurant or snack bar. 3.54 1 3.54 24,780$ Lane
493 Athletic ClubPrivately owned with weightlifting and other facilities often including swimming pools, hot tubs, saunas, racquet ball, squash, and handball courts.
5.76 1 5.76 40,320$ KSF
495 Recreational Community Center
Recreational community centers are facilities similar to and including YMCAs, often including classes, day care, meeting rooms, swimming pools, tennis racquetball, handball, weightlifting equipment, locker rooms, & food service.
1.64 1 1.64 11,480$ KSF
520 * Elementary School Public. Typically serves K-6 grades. 0.28 1 0.28 1,960$ Student
522 Middle School Public. Serves students that completed elementary and have not yet entered high school. 0.15 1 0.15 1,050$ Student
530 High School Public. Serves students that completed middle or junior high school. 0.14 1 0.14 980$ Student540 Junior/Community College Two-year junior colleges or community colleges. 0.12 1 0.12 840$ Student
560 Church Contains worship area and may include meeting rooms, classrooms, dining area and facilities. 0.66 1 0.66 4,620$ KSF
565 * Day Care 13.18 0.33 4.35 30,450$ KSF0.82 0.33 0.27 1,890$ Student
590 Library Public or Private. Contains shelved books, reading rooms or areas, sometimes meeting rooms. 7.09 1 7.09 49,630$ KSF
591 Lodge/Fraternal Organization Includes a club house with dining and drinking facilities, recreational and entertainment areas, and meeting rooms. 0.03 1 0.03 210$ Member
710 General OfficeOffice building with multiple tenants. Mixture of tenants can include professional services, bank and Loan institutions, restaurants, snack bars, and service retail facilities.
1.49 1 1.49 10,430$ KSF
715 Single Tenant Office BuildingSingle tenant office building. Usually contains offices, meeting rooms, file storage areas, data processing, restaurant or cafeteria, and other service functions.
1.73 1 1.73 12,110$ KSF
720 Medical-Dental Office Provides diagnosis and outpatient care on a routine basis. Typically operated by one or more private physicians or dentists. 3.72 1 3.72 26,040$ KSF
750 Office ParkPark or campus-like planned unit development that contains office buildings and support services such as banks & loan institutions, restaurants, service stations.
1.5 1 1.5 10,500$ KSF
760 Research & Development Center Single building or complex of buildings devoted to research & development. May contain offices and light fabrication facilities. 1.08 1 1.08 7,560$ KSF
770 Business Park
Group of flex-type or incubator 1 - 2 story buildings served by a common roadway system. Tenant space is flexible to accommodate a variety of uses. Rear of building usually served by a garage door. Typically includes a mix of offices, retail & wholesale.
1.29 1 1.29 9,030$ KSF
Facility for pre-school children care primarily during daytime hours. May include classrooms, offices, eating areas, and playgrounds.
FINAL
FCS GROUP(425) 867-1802 Trans SDC Model 040309 FINAL 4/3/2009
3a. AN 09-02. The applicant is requesting approval of an annexation of eight properties totalling approximately 53 acres. Page 68 of 84

ITE Code Customer Type Land Use Description Peak-Hour
TripsPass-By
Trip FactorAdjusted P-H Ts TSDC Units
812 Building Materials & Lumber
Small, free standing building that sells hardware, building materials, and lumber. May include yard storage and shed storage areas. The storage areas are not included in the GLA needed for trip generation estimates. 4.49 1 4.49 31,430$ KSF
813 Discount Super Store A free-standing discount store that also contains a full service grocery dept. under one roof. 3.87 0.718 2.78 19,460$ KSF
814 Specialty RetailSmall strip shopping centers containing a variety of retail shops that typically specialize in apparel, hard goods, services such as real estate, investment, dance studios, florists, and small restaurants.
2.71 1 2.71 18,970$ KSF
815 Discount Store
A free-standing discount store that offers a variety of customer services, centralized cashiering, and a wide range of products under one roof. Does not include a full service grocery dept. like Land Use 813, Free-standing Discount Superstore.
5.06 0.475 2.4 16,800$ KSF
816 Hardware/Paint Store Typically free-standing buildings with off-street parking that sell paints and hardware. 4.84 0.450 2.18 15,260$ KSF
817 Nursery/Garden Center
Free-standing building with yard containing planting or landscape stock. May have large green houses and offer landscape services. Typically have office, storage, and shipping facilities. GLA is Building GLA, not yard and storage GLA.
3.8 1 3.8 26,600$ KSF
820 Shopping Center
Integrated group of commercial establishments that is planned, developed, owned, and managed as a unit. Provides enough on-site parking to serve its own parking demand. May include non-merchandising facilities such as office buildings, movie theatres, restaurants, post offices, health clubs, and recreation like skating rinks and amusements.
3.75 0.393 1.47 10,290$ KSF Leasable
841 New Car Sales New Car dealership with sales, service, parts, and used vehicles 2.64 1 2.64 18,480$ KSF
848 Tire Store Primary business is tire sales and repair. Generally does not have a large storage or warehouse area. 4.15 0.617 2.56 17,920$ KSF
850 Supermarket Free-standing grocery store. May also contain ATMs, photo centers, pharmacies, video rental areas. 10.45 0.265 2.76 19,320$ KSF
851 Convenience Market Sells convenience foods, newspapers, magazines, and often Beer & Wine. Does not have gas pumps. 52.41 0.282 14.8 103,600$ KSF
880 Pharmacy w/o drive through Facilities that fulfill medical Prescriptions 8.42 0.327 2.75 19,250$ KSF881 Pharmacy w/ drive through Facilities that fulfill medical Prescriptions 8.62 0.383 3.3 23,100$ KSF890 Furniture Store Sells furniture, accessories, and often carpet/floor coverings. 0.46 0.157 0.07 490$ KSF
911 * Walk-In Bank Usually a Free-standing building with a parking lot. Does not have drive-up windows. May have ATMs. 33.15 0.270 8.95 62,650$ KSF
912 Drive-In Bank Provides Drive-up and walk-in bank services. May have ATMs. 45.74 0.270 12.35 86,450$ KSF
931 Quality Restaurant High quality eating establishment with slower turnover rates (more than one hour). 7.49 0.288 2.15 15,050$ KSF
932 High Turnover Sit-Down Rest. Sit-Down eating establishment with turnover rates of less than one hour. 10.92 0.315 3.44 24,080$ KSF
933 * Fast Food w/o Drive-Thru Fast Food but no drive-through window 26.15 0.265 6.94 48,580$ KSF934 Fast Food with Drive-Thru Fast Food with drive-through window 34.64 0.265 9.2 64,400$ KSF
936 * Drinking PlaceContains a bar where alcoholic beverages and snacks are serviced and possibly some type of entertainment such as music, games, or pool tables 11.34 0.315 3.58 25,060$ KSF
944 Gas Station Sell gasoline and may also provide vehicle service and repair. Does not have Convenience Market and/or Car Wash. 13.86 0.235 3.26 22,820$ Fueling
Position
945 Gas/Service Station with Convenience Market
Selling gas and Convenience Market are the primary business. May also contain facilities for service and repair. Does not include Car Wash. 13.38 0.123 1.65 11,550$ Fueling
Position
946 * Gas/Service Station with Convenience Market, Car Wash
Selling gas, Convenience Market, and Car Wash are the primary business. May also contain facilities for service and repair. 13.33 0.382 5.09 35,630$ Fueling
Position
947 Self-Service Car Wash Allows manual cleaning of vehicles by providing stalls for the driver to park and wash. 5.54 1 5.54 38,780$ Wash
Stall
NOTES:Source: Institute of Transportation Engineers, Trip Generation , Seventh Edition.Peak-Hour Trips: Weekday, peak-hour of adjacent street traffic. Most often, one hour between 4 and 6 p.m.Pass-By Trip Factor reflects diverted linked trips in addition to pass-by trips.ITE codes identified with asterisks (*) include information derived from the ITE manual (e.g., the pass-by factor is derived from pass-by counts for a similar land use or are as estimated by traffic engineers).
Land Use Units:KSF = 1,000 gross square feet building areaDU = dwelling unitRoom = number of rooms for rentFueling Positions = maximum number of vehicles that can be served simultaneouslyStudent = number of full-time equivalent students enrolledHole = number of individual putting holes that are paired with driving teesAcre = 43,560 square feet of park spaceLane = number of bowling lanes
Residential developments within designated regional centers and the Molalla Avenue area receive a 10% discount on the TSDC.Non-residential developments within such areas will be assessed for the lesser of their estimated trip generation rate, based on land use, or 1.47 P-HTs per KSF.
FCS GROUP(425) 867-1802 Trans SDC Model 040309 FINAL 4/3/2009
3a. AN 09-02. The applicant is requesting approval of an annexation of eight properties totalling approximately 53 acres. Page 69 of 84

Oregon CityTransportation SDC StudyBicycle/Pedestrian Trip Generation Groups
Table 8 Bike/Ped SDC 202.51$ per bike/ped trip
Group 1 0.1 Group 4 0.6Group 2 0.2 Group 5 1.0Group 3 0.4 Group 6 2.0
ITE Code Customer Type Land Use Description Bike/Ped
GroupBike/Ped
SDC Units
110 General Light IndustrialTypically less than 500 employees, free standing and single use. Examples: Printing plants, material testing laboratories, data processing equipment assembly, power stations.
1 20.25$ KSF
130 Industrial Park Industrial Park areas that contain a number of industrial and/or related facilities (mix of manufacturing, service, and warehouse).
1 20.25$ KSF
140 Manufacturing Facilities that convert raw materials into finished products. Typically have related office, warehouse, research, and associated functions.
2 40.50$ KSF
151 Mini-WarehouseStorage Units or Vaults rented for storage of goods. Units are physically separate and access through an overhead door or other common access point. Example: U-Store-It.
1 20.25$ KSF
210 SF Detached Single family detached housing. 5 202.51$ DU
220 ApartmentRental Dwelling Units within the same building. At least 4 units in the same building. Examples: Quadplexes and all types of apartment buildings.
4 121.51$ DU
230 Condo/TownhouseResidential Condominium/Townhouses under single-family ownership. Minimum of two single family units in the same building structure. 4 121.51$ DU
240 Mobile Home Trailers or Manufactured homes that are sited on permanent foundations. Typically the parks have community facilities (laundry, recreation rooms, pools).
3 81.00$ DU
253 Elderly Housing
Restricted to senior citizens. Contains residential units similar to apartments or condos. Sometimes in self-contained villages. May also contain medical facilities, dining, and some limited, supporting retail.
3 81.00$ DU
310 HotelLodging facility that may include restaurants, lounges, meeting rooms, and/or convention facilities. Can include a large motel with these facilities.
3 81.00$ Room
320 Motel Sleeping accommodations and often a restaurant. Free on-site parking and little or no meeting space.
2 40.50$ Room
430 Golf Course
Includes 9, 18, 27, and 36 hole municipal and private country clubs. Some have driving ranges and clubhouses with pro shops, restaurants, lounges. Many of the muni courses do not include such facilities.
1 20.25$ Hole
435 Multipurpose Recreation FacilityMulti-purpose recreational facilities contain two or more of the following land uses at one site: mini-golf, batting cages, video arcade, bumper boats, go-carts, and driving ranges.
6 405.02$ Acre
437 Bowling Alley Recreational facilities with bowling lanes which may include a small lounge, restaurant or snack bar.
3 81.00$ Lane
493 Athletic ClubPrivately owned with weightlifting and other facilities often including swimming pools, hot tubs, saunas, racquet ball, squash, and handball courts.
5 202.51$ KSF
495 Recreational Community Center
Recreational community centers are facilities similar to and including YMCAs, often including classes, day care, meeting rooms, swimming pools, tennis racquetball, handball, weightlifting equipment, locker rooms, & food service.
6 405.02$ KSF
520 * Elementary School Public. Typically serves K-6 grades. 3 81.00$ Student
522 Middle School Public. Serves students that completed elementary and have not yet entered high school.
2 40.50$ Student
530 High School Public. Serves students that completed middle or junior high school. 1 20.25$ Student540 Junior/Community College Two-year junior colleges or community colleges. 1 20.25$ Student
560 Church Contains worship area and may include meeting rooms, classrooms, dining area and facilities.
3 81.00$ KSF
565 * Day Care 1 20.25$ KSF1 20.25$ Student
590 Library Public or Private. Contains shelved books, reading rooms or areas, sometimes meeting rooms.
6 405.02$ KSF
591 Lodge/Fraternal Organization Includes a club house with dining and drinking facilities, recreational and entertainment areas, and meeting rooms.
4 121.51$ Member
710 General OfficeOffice building with multiple tenants. Mixture of tenants can include professional services, bank and Loan institutions, restaurants, snack bars, and service retail facilities.
6 405.02$ KSF
715 Single Tenant Office BuildingSingle tenant office building. Usually contains offices, meeting rooms, file storage areas, data processing, restaurant or cafeteria, and other service functions.
6 405.02$ KSF
720 Medical-Dental Office Provides diagnosis and outpatient care on a routine basis. Typically operated by one or more private physicians or dentists.
1 20.25$ KSF
750 Office ParkPark or campus-like planned unit development that contains office buildings and support services such as banks & loan institutions, restaurants, service stations.
4 121.51$ KSF
760 Research & Development Center Single building or complex of buildings devoted to research & development. May contain offices and light fabrication facilities.
2 40.50$ KSF
Facility for pre-school children care primarily during daytime hours. May include classrooms, offices, eating areas, and playgrounds.
FINAL
FCS GROUP(425) 867-1802 Trans SDC Model 040309 FINAL 4/3/2009
3a. AN 09-02. The applicant is requesting approval of an annexation of eight properties totalling approximately 53 acres. Page 70 of 84

ITE Code Customer Type Land Use Description Bike/Ped
GroupBike/Ped
SDC Units
770 Business Park
Group of flex-type or incubator 1 - 2 story buildings served by a common roadway system. Tenant space is flexible to accommodate a variety of uses. Rear of building usually served by a garage door. Typically includes a mix of offices, retail & wholesale.
1 20.25$ KSF
812 Building Materials & Lumber
Small, free standing building that sells hardware, building materials, and lumber. May include yard storage and shed storage areas. The storage areas are not included in the GLA needed for trip generation estimates.
1 20.25$ KSF
813 Discount Super Store A free-standing discount store that also contains a full service grocery dept. under one roof.
1 20.25$ KSF
814 Specialty RetailSmall strip shopping centers containing a variety of retail shops that typically specialize in apparel, hard goods, services such as real estate, investment, dance studios, florists, and small restaurants.
6 405.02$ KSF
815 Discount Store
A free-standing discount store that offers a variety of customer services, centralized cashiering, and a wide range of products under one roof. Does not include a full service grocery dept. like Land Use 813, Free-standing Discount Superstore.
1 20.25$ KSF
816 Hardware/Paint Store Typically free-standing buildings with off-street parking that sell paints and hardware.
1 20.25$ KSF
817 Nursery/Garden Center
Free-standing building with yard containing planting or landscape stock. May have large green houses and offer landscape services. Typically have office, storage, and shipping facilities. GLA is Building GLA, not yard and storage GLA.
1 20.25$ KSF
820 Shopping Center
Integrated group of commercial establishments that is planned, developed, owned, and managed as a unit. Provides enough on-site parking to serve its own parking demand. May include non-merchandising facilities such as office buildings, movie theatres, restaurants, post offices, health clubs, and recreation like skating rinks and amusements.
2 40.50$ KSF Leasable
841 New Car Sales New Car dealership with sales, service, parts, and used vehicles 1 20.25$ KSF
848 Tire Store Primary business is tire sales and repair. Generally does not have a large storage or warehouse area.
1 20.25$ KSF
850 Supermarket Free-standing grocery store. May also contain ATMs, photo centers, pharmacies, video rental areas.
1 20.25$ KSF
851 Convenience Market Sells convenience foods, newspapers, magazines, and often Beer & Wine. Does not have gas pumps.
6 405.02$ KSF
880 Pharmacy w/o drive through Facilities that fulfill medical Prescriptions 3 81.00$ KSF881 Pharmacy w/ drive through Facilities that fulfill medical Prescriptions 3 81.00$ KSF890 Furniture Store Sells furniture, accessories, and often carpet/floor coverings. 1 20.25$ KSF
911 * Walk-In Bank Usually a Free-standing building with a parking lot. Does not have drive-up windows. May have ATMs.
1 20.25$ KSF
912 Drive-In Bank Provides Drive-up and walk-in bank services. May have ATMs. 1 20.25$ KSF
931 Quality Restaurant High quality eating establishment with slower turnover rates (more than one hour).
1 20.25$ KSF
932 High Turnover Sit-Down Rest. Sit-Down eating establishment with turnover rates of less than one hour. 3 81.00$ KSF
933 * Fast Food w/o Drive-Thru Fast Food but no drive-through window 6 405.02$ KSF934 Fast Food with Drive-Thru Fast Food with drive-through window 6 405.02$ KSF
936 * Drinking PlaceContains a bar where alcoholic beverages and snacks are serviced and possibly some type of entertainment such as music, games, or pool tables
1 20.25$ KSF
944 Gas Station Sell gasoline and may also provide vehicle service and repair. Does not have Convenience Market and/or Car Wash.
1 20.25$ Fueling Position
945 Gas/Service Station with Convenience Market
Selling gas and Convenience Market are the primary business. May also contain facilities for service and repair. Does not include Car Wash. 1 20.25$ Fueling
Position
946 * Gas/Service Station with Convenience Market, Car Wash
Selling gas, Convenience Market, and Car Wash are the primary business. May also contain facilities for service and repair. 1 20.25$ Fueling
Position
947 Self-Service Car Wash Allows manual cleaning of vehicles by providing stalls for the driver to park and wash. 1 20.25$ Wash
Stall
NOTES:Land Use Units:
KSF = 1,000 gross square feet building areaDU = dwelling unitRoom = number of rooms for rentFueling Positions = maximum number of vehicles that can be served simultaneouslyStudent = number of full-time equivalent students enrolledHole = number of individual putting holes that are paired with driving teesAcre = 43,560 square feet of park spaceLane = number of bowling lanes
Residential developments within designated regional centers and the Molalla Avenue area receive a 10% discount on the TSDC.Non-residential developments within such areas will be assessed for the lesser of their estimated trip generation rate, based on land use, or 1.47 P-HTs per KSF.
FCS GROUP(425) 867-1802 Trans SDC Model 040309 FINAL 4/3/2009
3a. AN 09-02. The applicant is requesting approval of an annexation of eight properties totalling approximately 53 acres. Page 71 of 84

TRANSPORTATION SDC IMPLEMENTATIONApplicant submits
building permit requiring an
SDC calculation
Determine category
New Development initiated after May 1, 2009
Existing Residential Land Use & Limited Land Use
Decision beforeApril 1, 2009
Building Permit applied for???
Before February 1, 2013??
After February 1, 2013??
Use adjusted Component 1
($7000)
NOTE:All TSDCs shall be annually on Jan 1
adjusted per Seattle ENR CCI
Use Res 97-56 as adjusted by ENR times 1.15
Use Res 97-56 as adjusted per ENR times 1.15
Existing ResidentialLot of Record as of April 1, 2009
Building Permit applied for???
Before February 1, 2011
After February 1, 2011
Use adjusted Component 1
($7000)
Submission Date to Planning or
BuildingBefore
February 1, 2011 TSDC is $3500 as adjusted by ENR
After February 1, 2011
TSDC is $7000 as adjusted by ENR
Before May 1, 2009
Use Res 97-56 as adjusted per
ENR
New Tran Bike & Ped fee applies to all new permits
as of May 1, 2009
Before May 1, 2009??
Use Res 97-56 as adjusted by
ENR
3a. AN 09-02. The applicant is requesting approval of an annexation of eight properties totalling approximately 53 acres. Page 72 of 84

RESOLUTION NO. 09-02
A RESOLUTION REPEALING RESOLUTION 97-56, ADOPTING A METHODOLOGY, PROJECT LISTS, AND AMOUNTS FOR THE CITY'S TRANSPORTATION SYSTEM
DEVELOPMENT CHARGE AND ESTABLISHING EFFECTIVE DATES
WHEREAS, state law (ORS 223) authorizes the City to charge new development for full new growth impact costs to infrastructure;
WHEREAS, City code, Chapter 13.20 (System Development Charge (SDC) for Capital Improvements) implements the statutory authority to impose SDCs on new development and specifically authorizes the City Commission to adopt and modify the amount of the charges and the amount of the charges and the methodology upon which such charges are based; and
WHEREAS, the City's Transportation SDC (TSDC) was last amended in 1997 through Resolution No. 97-56; and
WHEREAS, the costs estimated to accommodate the impacts of new development on the Oregon City transportation system in 2009 exceed the funding potential derived from the previous TSDC calculation; and
WHEREAS, the City has updated Transportation System Plan Capital Improvement Plan (TSP CIP) roadway and bicyclelpedestrian project lists for use in calculating the updated TSDC; and
WHEREAS, the City has updated the TSDC methodology and calculated a new amount in accordance with Oregon Revised Statutes 223.297-31 5 and Oregon City Municipal Code 13.20; and
WHEREAS, the results of the updated TSP CIP project lists, TSDC methodology, and calculated amount are documented in the attached March 2009 report prepared by FCS Group, Exhibit 1, adopted and incorporated herein.
NOW, THEREFORE, BE IT RESOLVED by the City Commission that:
Section 1 -Action
A. Resolution 97-56, enacted on November 19, 1997, is hereby repealed in its entirety and its directions are replaced by this Resolution No. 09-02.
B. A new TSDC methodology and charge per pm peak hour trip and charge per bikelped trip are adopted based on the transportation system improvements, trip projections, calculations, and conclusions presented in the FCS Group report (Exhibit 1).
Section 2 - TSDC Details
A. The new TSDC has two components and is hereby adopted and made applicable to all new development within the city limits of Oregon City.
Resclvljon Xc. 09.02 Effective Date: April 1. 2039
3a. AN 09-02. The applicant is requesting approval of an annexation of eight properties totalling approximately 53 acres. Page 73 of 84

Component 1 : Roadway lmprovements Project List = $7,000 per peak hour trip. For outright uses within the Mixed Use Downtown zone and along the 7th Street and Molalla Avenue Corridor, a ten percent reduction will be used for residential development and the lesser of the Shopping Center trip generation rate or the non-residential development's estimated trip generation rate will be used.
Component 2: BicycleIPedestrian lmprovements Project List = $202.51 per bikelped trip
B. Each cost component for individual developments will be calculated based on peak hour trip generation (Roadway lmprovements Project List) and trip generation groups (BikeIPed lmprovements Project List) for the land use and the development size. See Exhibit 1 for these trip generation factors for representative land uses.
C. The City Engineer may use alternative data when, in the City Engineer's opinion, the alternative data are more reliable and realistic for a particular development than are the trip factors set forth in Exhibit 1.
Section 3 - Effective Dates and Annual Adiustment
A. Component 1 for the Roadway lmprovements Project List described in Section 2 above applies to future development and building permit applications and shall be implemented in two equal increments as follows: Effective 30 davs after Resolution No. 09-02 adoption: $3500 per peak hour trip. Effective February I, 201 1 : $7,000 per peak hour trip (plus annual adjustment as described in Section 3E below).
B. Component 2 for the BikeIPed lmprovements Project List described in Section 2 above applies to future development and building permit applications and shall become effective 30 days after Resolution No. 09-02 adoption.
C. For lots or parcels lawfully created prior to adoption of this resolution and situated in a residential zone, the former TSDC defined by Resolution No. 97-56 shall increase by a factor of 1 .I 5 effective 30 days after Resolution No. 09-02 adoption. Component 1 with appropriate annual adjustment shall become effective on February 1, 201 1.
D. For lots or parcels in a residential zone approved by a land use or limited land use decision prior to adoption of this resolution, the former TSDC defined by Resolution No. 97-56 shall increase by a factor of 1 .I 5 effective 30 days after Resolution No. 09-02 adoption. Component 1 shall become effective February 1, 201 3. Anytime after February 1, 201 1, the City Commission may review the status of the construction market and consider an earlier Component 1 effective date.
E. All TSDCs described above shall be annually adjusted on January 1 based on the Seattle Engineering News Record (ENR) Construction Cost Index (CCI).
3a. AN 09-02. The applicant is requesting approval of an annexation of eight properties totalling approximately 53 acres. Page 74 of 84

Adopted, signed and approved this 1st day of April 2009.
Comprising the City Commission of Oregon City, Oregon
Effective Date: April 1. 20'39
3a. AN 09-02. The applicant is requesting approval of an annexation of eight properties totalling approximately 53 acres. Page 75 of 84