1 camden central school district proposed 2011-2012 2011-2012 general fund budget budget
TRANSCRIPT

1
CAMDEN CENTRAL SCHOOL DISTRICT
PROPOSED PROPOSED
2011-20122011-2012
GENERAL FUNDGENERAL FUND
BUDGETBUDGET

2
The Budget ProcessThe Budget ProcessBegan with the review of the current aid picture once the Began with the review of the current aid picture once the State 2010-2011 budget was passed August 24, 2010 with State 2010-2011 budget was passed August 24, 2010 with for us a $1,913,050 deficit reduction. (Patterson)for us a $1,913,050 deficit reduction. (Patterson)Next in November 2010 with a review of a mid-year cut Next in November 2010 with a review of a mid-year cut for FMAP of $217,077 for FMAP of $217,077
December 2010 with defining needs for 2011-2012December 2010 with defining needs for 2011-2012Initial input to define needs from:Initial input to define needs from:
Instructional staffInstructional staffSupport staffSupport staff
Building administrationBuilding administrationCentral Office administrationCentral Office administration

3
Board ProcessBoard Process
In March 2011 the Board participated in In March 2011 the Board participated in three workshopsthree workshops
Heard requests as related to:Heard requests as related to:Improving student performanceImproving student performanceImproving quality of campus life Improving quality of campus life Meeting Board goalsMeeting Board goalsStudent count 2001-2002 (Student count 2001-2002 (2,786 ) 2,786 ) 2011-2012 2011-2012
(2(2,365) 17 positions, no RIF,365) 17 positions, no RIF

4

5

6
Important Dates:Important Dates:
• April 5, 2011 Administration presented April 5, 2011 Administration presented Tentative Budget Tentative Budget
• April 12, 2011 BOE adopted proposed budgetApril 12, 2011 BOE adopted proposed budget• April 18, 2011 Petition for 3 BOE seats due April 18, 2011 Petition for 3 BOE seats due • May 3, 2011 Official Public HearingMay 3, 2011 Official Public Hearing
• May 17, 2011 Statewide Vote 12p.m.-May 17, 2011 Statewide Vote 12p.m.-9p.m. HS Lobby9p.m. HS Lobby
• General Fund Budget $43,893,200General Fund Budget $43,893,200• 3 BOE Seats -for 3 years3 BOE Seats -for 3 years

7
2011-2012 Budget = $43,893,2001.03% decrease
Expenditures presented in 3-partsExpenditures presented in 3-parts Administrative 7.89% ($3,466,316)Administrative 7.89% ($3,466,316) Program 74.01% ($32,484,980)Program 74.01% ($32,484,980) Capital 18.10% ($7,941,904)Capital 18.10% ($7,941,904) RevenueRevenue State Aid 63.10 % ($27,696,794)State Aid 63.10 % ($27,696,794) Other revenues 13.64% ($5,985,225)Other revenues 13.64% ($5,985,225) Local Share 23.26% ($10,211,181)Local Share 23.26% ($10,211,181)

8
Administrative Budget The Administrative component sustains the educational process.
This area includes expenses related to:
Board of Education, district clerk & meetings, superintendent, business & treasurers' offices, tax collection,
Purchasing, legal, personnel, public information, central mailing, printing, copiers & data processing, postage, insurance,
Memberships, BOCES administrative charges, school supervision, curriculum development-writing & mapping, research,( Power Curriculum, k-12 for Social Studies, Math Science, Physics, and Response to Intervention),
Mentoring, research, planning,
Related employee benefits.

9
CURRENT PROPOSED 2010-2011 2011-2012 % Chg.
A1010 BOARD OF EDUCATION $14,590 $12,988 -10.98%A1040 DISTRICT CLERK $2,750 $2,350 -14.55%A1060 DISTRICT MEETING $3,375 $2,875 -14.81%A1240 SUPERINTENDENT'S OFFICE $199,255 $190,848 -4.22%A1310 BUSINESS OFFICE & BOCES SERVICES $228,803 $230,788 0.87%A1320 AUDITING $38,455 $39,700 3.24%A1325 TREASURER'S OFFICE $48,660 $45,512 -6.47%A1330 TAX COLLECTION $25,848 $25,274 -2.22%A1345 PURCHASING $53,580 $24,252 -54.74%A1380 FISCAL AGENT FEES $13,500 $12,800 -5.19%A1420 LEGAL SERVICES $26,673 $27,545 3.27%A1430 PERSONNEL OFFICE $190,626 $181,885 -4.59%A1480 PUBLIC INFORMATION $6,300 $6,300 0.00%A1670 CENTRAL MAILING AND PRINTING $102,356 $113,150 10.55%A1680 CENTRAL DATA PROCESSING $106,933 $117,303 9.70%A1910 INSURANCE/APPRAISAL $121,172 $127,850 5.51%A1920 SCHOOL ASSOCIATION DUES & FEES $1,000 $1,000 0.00%A1981 BOCES-ADMINISTRATIVE/DEBT CHARGES $391,773 $413,678 5.59%A2010CURRICULUM DEVELOPMENT &MENTORING $83,995 $83,995 0.00%A2020 SUPERVISION $1,276,779 $1,197,291 -6.23%A2060 RESEARCH EVALUATION PLANNING $3,400 $3,900 14.71%A9080 EMPLOYEE BENEFITS $594,592 $605,032 1.76%
$3,534,415 $3,466,316 -1.93%ADMINISTRATIVE BUDGET TOTAL
ADMINISTRATIVE BUDGET

10
PROGRAM BUDGET The Program portion of the budget is the heart of the educational
process. Program related expenses include:
Teacher in-service training, regular school instruction, pupil with disabilities education.
Occupational education, CHOICE, summer school, library & media centers, computer assisted instruction, pupil attendance.
Guidance, health & psychological services, co-curricular & interscholastic sports, transportation (5 Buses).
Support of Camden and Osceola libraries, and related employee benefits.
2011-2012 No SRO, SPFY, Program Coaches, reduced BOCES- bilingual, Occ.ed., SPED services, Links,

11
Program Budget Proposed program Budget allows us to continue:Proposed program Budget allows us to continue:
5-year instructional technology plan ($200,000)5-year instructional technology plan ($200,000) Co- and extra-curricular activitiesCo- and extra-curricular activities Maintain full interscholastic sports programs ( No equipment)Maintain full interscholastic sports programs ( No equipment) Full SWD services (1 less UCP Residential- $55,000)Full SWD services (1 less UCP Residential- $55,000) Summer Driver EducationSummer Driver Education Odyssey of the Mind & Science OlympiadOdyssey of the Mind & Science Olympiad Syracuse University Project AdvanceSyracuse University Project Advance MVCC Pre-Calc, Psych, Chem,& BusinessMVCC Pre-Calc, Psych, Chem,& Business MVCC Engineering courses: Engineering MVCC Engineering courses: Engineering
Drawing, Computer Aided design (CAD), Drawing, Computer Aided design (CAD), Digital ElectronicsDigital Electronics
C.H.O.I.C.E. C.H.O.I.C.E. After School Programs (3After School Programs (3rdrd-8-8thth ELA, Math Clubs) ELA, Math Clubs) Enrichment Summer Classes, Itech (thru BOCES with aid)Enrichment Summer Classes, Itech (thru BOCES with aid) M.S.Web, H.S. LinkM.S.Web, H.S. Link

12
CURRENT PROPOSED
2010-2011 2011-2012 % Chg.
A2070 INSERVICE TRAINING $173,160 $148,244 -14.39%
A2110 INSTRUCTIONAL-REGULAR SCHOOL $11,153,115 $11,185,477 0.29%
A2250 PUPILS WITH DISABILITIES $4,691,153 $4,349,546 -7.28%
A2280 OCCUPATIONAL EDUCATION $1,217,035 $1,232,951 1.31%
A2330 SPECIAL SCHOOLS $611,251 $425,098 -30.45%
A2610 LIBRARY & MEDIA CENTERS $520,606 $515,912 -0.90%
A2630 COMPUTER ASSISTED INSTRUCTION $365,184 $399,886 9.50%
A2805 ATTENDANCE $80,792 $81,637 1.05%
A2810 GUIDANCE $965,165 $873,724 -9.47%A2815 HEALTH SERVICES $296,364 $295,864 -0.17%
A2820 PSYCHOLOGICAL SERVICES $146,065 $150,512 3.04%
A2850 CO-CURRICULAR ACTIVITIES $189,500 $190,675 0.62%
A2855 INTERSCHOLASTIC SPORTS $499,003 $463,098 -7.20%
A5510 TRANSPORTATION $2,315,311 $2,331,686 0.71%
A9901
TRANSFER TO SPEC. AID SUMMER HANDICAP 4408
DEBT SERVICE $423,000 $35,000 -91.73%
A8060 CIVIC ACTIVITIES $1,800 $1,350 -25.00%
A8070 CENSUS $6,000 $0 -100.00%
A9080 EMPLOYEE BENEFITS $9,438,754 $9,804,320 3.87%
$33,093,258 $32,484,980 -1.84%PROGRAM BUDGET TOTAL
PROGRAM BUDGET
13
CURRENT PROPOSED 2010-2011 2011-2012 % Chg.
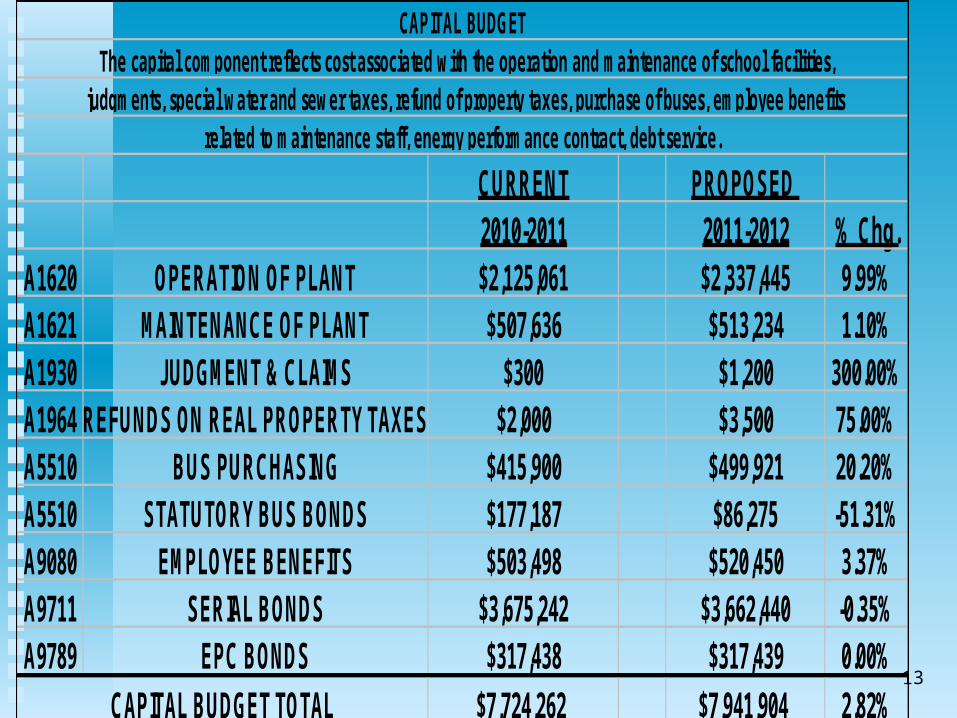
A1620 OPERATION OF PLANT $2,125,061 $2,337,445 9.99%A1621 MAINTENANCE OF PLANT $507,636 $513,234 1.10%A1930 JUDGMENT & CLAIMS $300 $1,200 300.00%A1964 REFUNDS ON REAL PROPERTY TAXES $2,000 $3,500 75.00%A5510 BUS PURCHASING $415,900 $499,921 20.20%A5510 STATUTORY BUS BONDS $177,187 $86,275 -51.31%A9080 EMPLOYEE BENEFITS $503,498 $520,450 3.37%A9711 SERIAL BONDS $3,675,242 $3,662,440 -0.35%A9789 EPC BONDS $317,438 $317,439 0.00%
$7,724,262 $7,941,904 2.82%CAPITAL BUDGET TOTAL
CAPITAL BUDGET The capital component reflects cost associated with the operation and maintenance of school facilities,
judgments, special water and sewer taxes, refund of property taxes, purchase of buses, employee benefitsrelated to maintenance staff, energy performance contract, debt service.
14
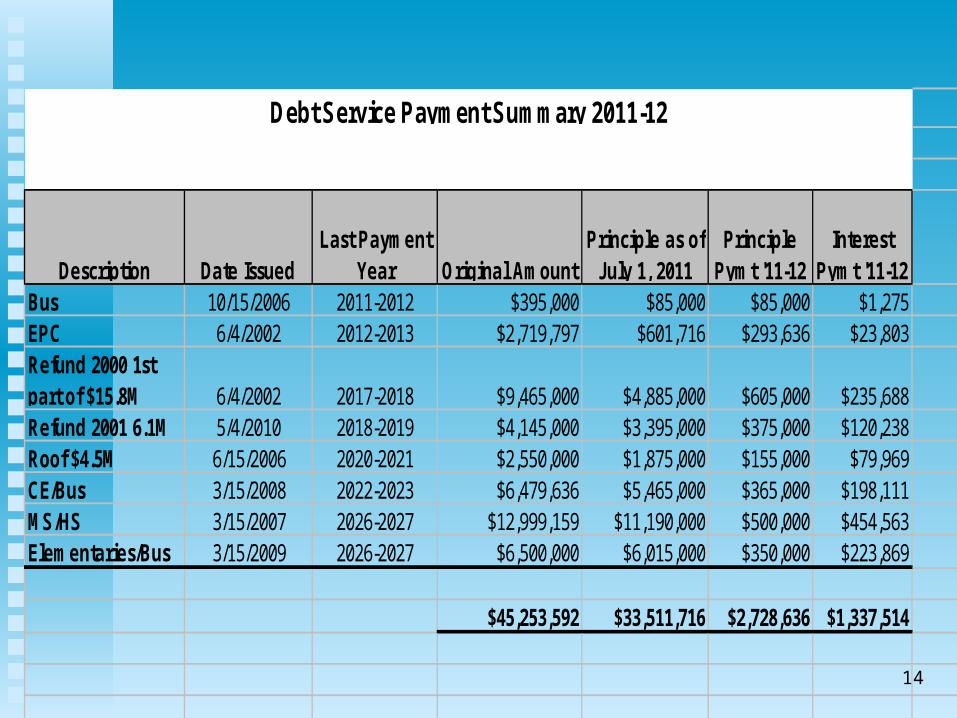
Description Date IssuedLast Payment
Year Original AmountPrinciple as of
July 1, 2011Principle
Pymt '11-12Interest
Pymt '11-12Bus 10/15/2006 2011-2012 $395,000 $85,000 $85,000 $1,275EPC 6/4/2002 2012-2013 $2,719,797 $601,716 $293,636 $23,803Refund 2000 1st part of $15.8M 6/4/2002 2017-2018 $9,465,000 $4,885,000 $605,000 $235,688Refund 2001 6.1M 5/4/2010 2018-2019 $4,145,000 $3,395,000 $375,000 $120,238Roof $4.5M 6/15/2006 2020-2021 $2,550,000 $1,875,000 $155,000 $79,969CE/Bus 3/15/2008 2022-2023 $6,479,636 $5,465,000 $365,000 $198,111MS/HS 3/15/2007 2026-2027 $12,999,159 $11,190,000 $500,000 $454,563Elementaries/Bus 3/15/2009 2026-2027 $6,500,000 $6,015,000 $350,000 $223,869
$45,253,592 $33,511,716 $2,728,636 $1,337,514
Debt Service Payment Summary 2011-12

15
1620 - Operations Custodial Equipment, slight decrease to $2,550Custodial Equipment, slight decrease to $2,550 Heating oil -180,000 gallons, increased from $468,000 Heating oil -180,000 gallons, increased from $468,000
to $675,000to $675,000 Electricity - 3,300,000 kwhr, increased from $542,500 Electricity - 3,300,000 kwhr, increased from $542,500
to $610,000 to $610,000 Drinking & waste water - $46,000Drinking & waste water - $46,000 Phone service $36,000Phone service $36,000 Cleaning Supplies, wax, soaps, paper products,Cleaning Supplies, wax, soaps, paper products, Custodian FTECustodian FTE
HS-9.5, MS-8,CE-4,HS-9.5, MS-8,CE-4, ANN-2.75,MCV-2.5,NB-2.5ANN-2.75,MCV-2.5,NB-2.5 430,000 SQFT/29.25=14,700 (adding 14,000 H.S. in 430,000 SQFT/29.25=14,700 (adding 14,000 H.S. in
11-12)11-12)

16
1621 Maintenance Equipment Pickup with Plow and Cube vanEquipment Pickup with Plow and Cube van Maintain -Security, Fire, Energy Controls, Maintain -Security, Fire, Energy Controls,
Elevators, phones, boilers, clocks,Elevators, phones, boilers, clocks, Parking lot -limited sealing, sidewalks, Parking lot -limited sealing, sidewalks,
plumbing, salt, sand, fields, windows, plumbing, salt, sand, fields, windows, heating heating
5 year Building Condition survey King & 5 year Building Condition survey King & King $21,000 in 2010-2011 not 11-12King $21,000 in 2010-2011 not 11-12

17
Major Fixed Costs in 2011-2012 Budget TRS RateTRS Rate - 8.62% to 11.11% (up $441,500 to $1.8 million) - 8.62% to 11.11% (up $441,500 to $1.8 million) ERS RateERS Rate - 11.30% to 15.7% (up $156,500 to $.5 million) - 11.30% to 15.7% (up $156,500 to $.5 million) Health Ins. RateHealth Ins. Rate - up 5% with Federal age 26 requirement - up 5% with Federal age 26 requirement 601 plans (up $302,600 to $6 million)601 plans (up $302,600 to $6 million) D.W. SalariesD.W. Salaries – Down $974,000 to $18.8 million – Down $974,000 to $18.8 million Debt ServiceDebt Service – down $100,000 to $4 million – down $100,000 to $4 million BusesBuses – up $84,000 to $499,921 – up $84,000 to $499,921 BOCESBOCES – down $500,000 to $3.9 million – down $500,000 to $3.9 million Heat, Bus Fuel, Electricity- Heat, Bus Fuel, Electricity- up $357,350 to $1.8 millionup $357,350 to $1.8 million FICA FICA – Down $76,500 to $1.4 million– Down $76,500 to $1.4 million

18
ESTIMATED REVENUES
* ARRA America Recovery and Reinvestment Act
* FEJ Federal Education Jobs
March 30, 2011 on time budget still with $2,961,485 GEA
2010-2011 STAR Savings to district taxpayers
equaled $1,907,051 or 19%, Basic $350, Enhanced $850
2011-2012 $100,000 house $1,482 before STAR
2009-2010 2010-2011 2011-2012 % Chg.ESTIMATED STATE AID WITH ARRA or FEJ* $29,775,510 $29,908,180 $27,696,794 -7.39%APPROPRIATED FUND BALANCE $1,600,000 $2,596,266 $4,097,175 57.81%LOCAL SHARE $9,820,445 $10,014,889 $10,211,181 1.96%MISCELLANEOUS REVENUE $1,482,967 $1,832,600 $1,888,050 3.03%
$42,678,922 $44,351,935 $43,893,200 -1.03%

19
STATE AID for 2011-2012 Our district is budgeting to receive 63.1 % of our Our district is budgeting to receive 63.1 % of our
revenues from State or Federal Aid down from 67.4% in revenues from State or Federal Aid down from 67.4% in 2010-2011. No ARRA in 2011-2012 only $543,646 in 2010-2011. No ARRA in 2011-2012 only $543,646 in Federal Education Jobs funds. Federal Education Jobs funds.
This is a result of a Gap Elimination Adjustments to all This is a result of a Gap Elimination Adjustments to all categorical reimbursement aids for Transportation, categorical reimbursement aids for Transportation, BOCES, Special Education, and also on Foundation aid BOCES, Special Education, and also on Foundation aid for a total deduct of Gov.$3,149,070, Leg. $2,916,485.for a total deduct of Gov.$3,149,070, Leg. $2,916,485.
Additional Foundation Formula aid based on need.(Free Additional Foundation Formula aid based on need.(Free & reduced 3 yr. avg. 52.62%, Sparsity 330.9 sq.miles = & reduced 3 yr. avg. 52.62%, Sparsity 330.9 sq.miles = 7.8 student/sq. mile, Adirondack 369.5 sq.miles, SPED 7.8 student/sq. mile, Adirondack 369.5 sq.miles, SPED Population 1.43%, Combined wealth .386) However, Population 1.43%, Combined wealth .386) However, frozen for 2011-2012, 2012-2013 at 2009-2010 levelfrozen for 2011-2012, 2012-2013 at 2009-2010 level

20
Historical data –Tax on TrueProperty Tax
Date Local Share
Year to YearIncrease
In Local sharePILOT
RevenueDistrict Tax
Levy
Year to YearIncreaseIn Levy
DistrictTax On
True
Year to YearIncrease
In Tax On True
DistrictTaxable
Full Value
Year to Year
IncreaseIn Value
Sept. 1, 1996 $6,654,614 N/A $162,000 $6,492,614 N/A $15.94 N/A $409,332,255 N/A
Sept. 1, 1997 $6,884,855 3.46% $165,000 $6,719,855 3.50% $16.17 1.44% $411,562,808 0.54%
Sept. 1, 1998 $7,033,695 2.16% $168,000 $6,865,695 2.17% $16.33 0.99% $420,434,476 2.16%
Sept. 1, 1999 $6,791,820 -3.44% $172,000 $6,619,820 -3.58% $16.49 0.98% $418,444,511 -0.47%
Sept. 1, 2000 $7,030,348 3.51% $178,290 $6,852,058 3.51% $16.29 -1.21% $420,586,854 0.51%
Sept. 1, 2001 $7,325,733 4.20% $180,273 $7,145,460 4.28% $16.91 3.81% $422,516,359 0.46%
Sept. 1, 2002 $7,872,530 7.46% $216,472 $7,656,058 7.15% $17.73 4.85% $431,516,359 2.13%
Sept. 1, 2003 $8,376,370 6.40% $219,262 $8,157,108 6.54% $17.99 1.47% $465,865,383 7.96%
Sept. 1, 2004 $8,731,167 4.24% $228,362 $8,502,805 4.24% $17.68 -1.72% $493,872,450 6.01%
Sept. 1, 2005 $9,299,882 6.51% $232,731 $9,067,150 6.64% $17.74 0.34% $524,330,751 6.17%
Sept. 1, 2006 $9,299,882 0.00% $226,624 $9,073,258 0.07% $16.49 -7.03% $563,890,384 7.54%
Sept. 1, 2007 $9,557,779 2.77% $221,607 $9,336,172 2.90% $15.12 -8.29% $631,931,308 12.07%
Sept. 1, 2008 $9,936,267 3.96% $239,235 $9,697,032 3.87% $14.65 -3.12% $678,090,667 7.30%
Sept. 1, 2009 $9,820,445 -1.17% $100,077 $9,720,368 0.24% $13.90 -5.17% $706,741,477 4.23%
Sept. 1, 2010 $10,014,889 1.98% $107,953 $9,906,936 1.92% $14.54 4.61% $688,999,813 -2.51%Estimated / Proposed
For Sept. 1, 2011 $10,211,181 1.96% $110,112 $10,101,069 1.96% $14.82 1.96% $688,999,813 0.00%
Preceding 14 year Avg. 3.00% 3.10% -0.58% 3.86%
21
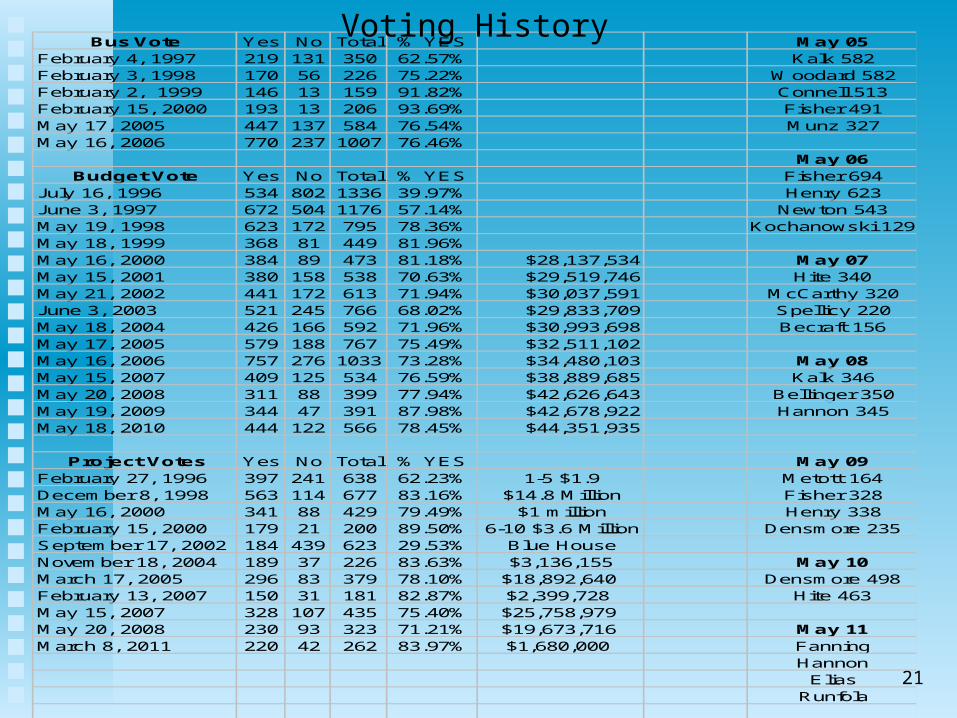
Bus Vote Yes No Total % YES May 05February 4, 1997 219 131 350 62.57% Kalk 582February 3, 1998 170 56 226 75.22% Woodard 582February 2, 1999 146 13 159 91.82% Connell 513February 15, 2000 193 13 206 93.69% Fisher 491May 17, 2005 447 137 584 76.54% Munz 327May 16, 2006 770 237 1007 76.46%
May 06Budget Vote Yes No Total % YES Fisher 694
July 16, 1996 534 802 1336 39.97% Henry 623June 3, 1997 672 504 1176 57.14% Newton 543May 19, 1998 623 172 795 78.36% Kochanowski 129May 18, 1999 368 81 449 81.96%May 16, 2000 384 89 473 81.18% $28,137,534 May 07May 15, 2001 380 158 538 70.63% $29,519,746 Hite 340May 21, 2002 441 172 613 71.94% $30,037,591 McCarthy 320June 3, 2003 521 245 766 68.02% $29,833,709 Spellicy 220May 18, 2004 426 166 592 71.96% $30,993,698 Becraft 156May 17, 2005 579 188 767 75.49% $32,511,102May 16, 2006 757 276 1033 73.28% $34,480,103 May 08May 15, 2007 409 125 534 76.59% $38,889,685 Kalk 346May 20, 2008 311 88 399 77.94% $42,626,643 Bellinger 350May 19, 2009 344 47 391 87.98% $42,678,922 Hannon 345May 18, 2010 444 122 566 78.45% $44,351,935
Project Votes Yes No Total % YES May 09February 27, 1996 397 241 638 62.23% 1-5 $1.9 Metott 164December 8, 1998 563 114 677 83.16% $14.8 Million Fisher 328May 16, 2000 341 88 429 79.49% $1 million Henry 338February 15, 2000 179 21 200 89.50% 6-10 $3.6 Million Densmore 235September 17, 2002 184 439 623 29.53% Blue HouseNovember 18, 2004 189 37 226 83.63% $3,136,155 May 10March 17, 2005 296 83 379 78.10% $18,892,640 Densmore 498February 13, 2007 150 31 181 82.87% $2,399,728 Hite 463May 15, 2007 328 107 435 75.40% $25,758,979May 20, 2008 230 93 323 71.21% $19,673,716 May 11March 8, 2011 220 42 262 83.97% $1,680,000 Fanning
HannonElias
Runfola
Voting History

22
Summary The original 2007-2008 State Aid amount utilizing a The original 2007-2008 State Aid amount utilizing a
Foundation Aid formula with a 4 year phase-in plan Foundation Aid formula with a 4 year phase-in plan recognized the higher costs associated with our large recognized the higher costs associated with our large geographical rural district, with poverty and high need geographical rural district, with poverty and high need students as well as a community having a limited ability students as well as a community having a limited ability to pay. to pay.
The State is currently not funding at the original phase in The State is currently not funding at the original phase in plan, now 10 years. ARRA saved Districts in 2009-2010 plan, now 10 years. ARRA saved Districts in 2009-2010 and in 2010-2011, for us a total of $2.4 million. In 2011-and in 2010-2011, for us a total of $2.4 million. In 2011-2012 Federal Education Job funding of $543,646.2012 Federal Education Job funding of $543,646.
This budget yields a 1.96% increase to the local share.This budget yields a 1.96% increase to the local share. With the current flat trend in the local real property With the current flat trend in the local real property
market we estimate that the proposed impact on the market we estimate that the proposed impact on the district-wide tax on true to be increased to $14.54/$1,000 district-wide tax on true to be increased to $14.54/$1,000 to $14.82/$1,000. to $14.82/$1,000.

23
CONTINGENT BUDGET CAP WORKSHEET2010-2011 Adopted Budget $44,351,935
Less: (base year exclusions) - Budgeted expenditures of gifts, grants in aid or insurance proceeds $300 - Budgeted expenditures resulting from a tax certiorari proceeding - Budgeted expenditures resulting from a court order or judgment against the district $2,000 - Budgeted expenditures certified by the Commissioner as necessary as a result of damage to, or destruction of, a school building or school equipment - Budgeted capital expenditures resulting from construction, acquisition, reconstruction, rehabilitation or improvement of school facilities, including debt service and lease expenditures, subject to the approval of the qualified voters where required by law $4,169,867 - Non-recurring expense(s)
Adjusted base year adopted budget $40,179,768
2011-12 Contingency Budget 2010-11 adjusted base year x CPI (1.6% *120% = 1.92%) (max. 4%)
Grow Budget $771,452 40,951,220$ Add: (subsequent year exclusions)
$1,200 - Budgeted expenditures resulting from a tax certiorari proceeding - Budgeted expenditures resulting from a court order or judgment against the district $3,500 - Budgeted expenditures certified by the Commissioner as necessary as a result of damage to, or destruction of, a school building or school equipment - Budgeted capital expenditures resulting from construction, acquisition, reconstruction, $4,066,154 rehabilitation or improvement of school facilities, including debt service and lease expenditures, subject to the approval of the qualified voters where required by law - one less bus payment - Budget expenditures attributable to projected increases in public school enrollment -
Proposed budget VS Contingent budget $43,893,200 45,022,074$ Required cuts (1,128,874)$ Non-contingency items,e.g. Student supplies Community use of buildings and grounds Equipment - (5 Buses @ $499,921) (Maintenance @ $62,550) (Building $52,550)(Technology $200,000)
CPI2005 3.4% 2007 2.8% 2009 -.4 (1953) Second Vote June 21, 20112006 3.2% 2008 3.8% 2010 1.6%
- Budgeted expenditures of gifts, grants in aid or insurance proceeds