1 communication-efficient online detection of network-wide anomalies ling huang* xuanlong nguyen*...
TRANSCRIPT

1
Communication-Efficient Online Detection of
Network-Wide AnomaliesLing Huang* XuanLong Nguyen*
Minos Garofalakis§ Joe Hellerstein*
Michael Jordan* Anthony Joseph* Nina Taft§
*UC Berkeley §Intel Research

Today: Distributed Monitoring & Centralized Computation Stream-based data collection Periodically evaluate detection function over collected data Doesn’t scale well in network size or timescale
Our contribution: Decentralized Detection Continuously evaluate detection function in a decentr. way Low-overhead, rapid response, accurate and scalable Detection accuracy controllable by a “tuning knob”
Provable guarantees on detection error (false alarm rate) Flexible tradeoff between overhead and accuracy
Towards Decentralized Detection

Detection Problems in Enterprise Network
Do machines in my network participate in a Botnet to attack
other machines?
victim
command& control
Send at rate .95*allowed
to victim X
V
Operation Center
Coordinated Detection!
Data: Byte rate on a network
link.
CAN’T AFFORD TO DO THE DETECTION CONTINUOUSLY !For efficient and scalable detection, push data processing to the
edge of network!
Approximate but accurate detection!

Detection of Network-wide Anomalies A volume anomaly is a sudden change in
an Origin-Destination flow (i.e., point to point traffic)
Given link traffic measurements, detect the volume anomalies
H1
H2
The backbone network
Regional network 1Regional network 2
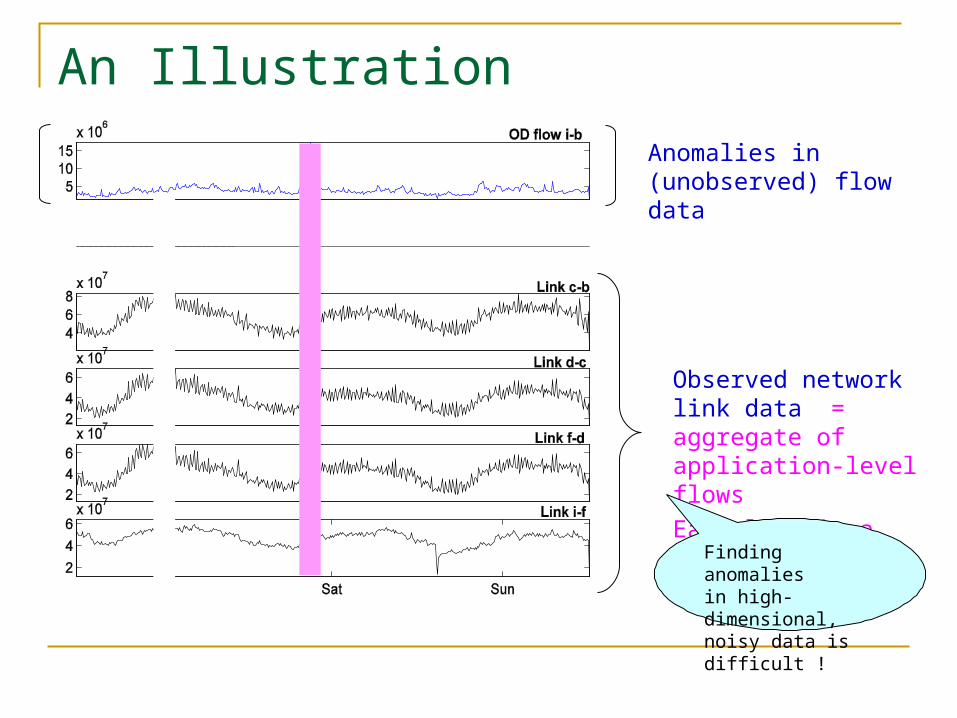
An Illustration
Observed network link data = aggregate of application-level flows
Each link is a dimension
Anomalies in (unobserved) flow data
Finding anomalies in high-dimensional, noisy data is difficult !

The Subspace Method (Lakhina’04) An approach to separate normal from anomalous
traffic based on Principal Component Analysis (PCA) Normal Subspace : space spanned by the top k
principal components Anomalous Subspace : space spanned by the
remaining components Then, decompose traffic on all links by projecting
onto and to obtain:
Traffic vector of all links at a particular point in time
Normal trafficvector
Residual trafficvector

Detection Illustration
Value ofover time (all traffic)
over timeValue of
αQ
Red dots: anomalies Blue curve: traffic data
Datm
(timestep)
n (nodeID)
Operation center
Y
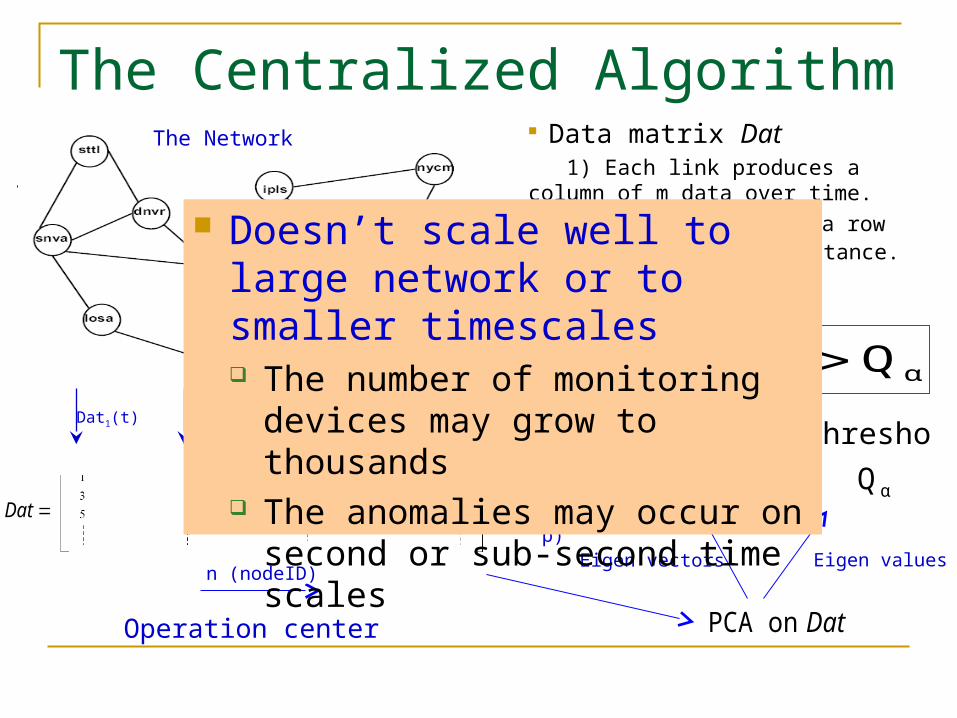
The Centralized Algorithm
Daton PCA
The Network
Eigen values
αQ
Threshold
Eigen vectors
abC
Projection
Data matrix Dat 1) Each link produces a column of m data over time.
2) n links produces a row data y at each time instance.
α
2
ab QyC
The detection is:
Dat1(t) Dat2(t) Dat3(t) Datn(t)
Periodically
Doesn’t scale well to large network or to smaller timescales The number of monitoring devices
may grow to thousands The anomalies may occur on
second or sub-second time scales
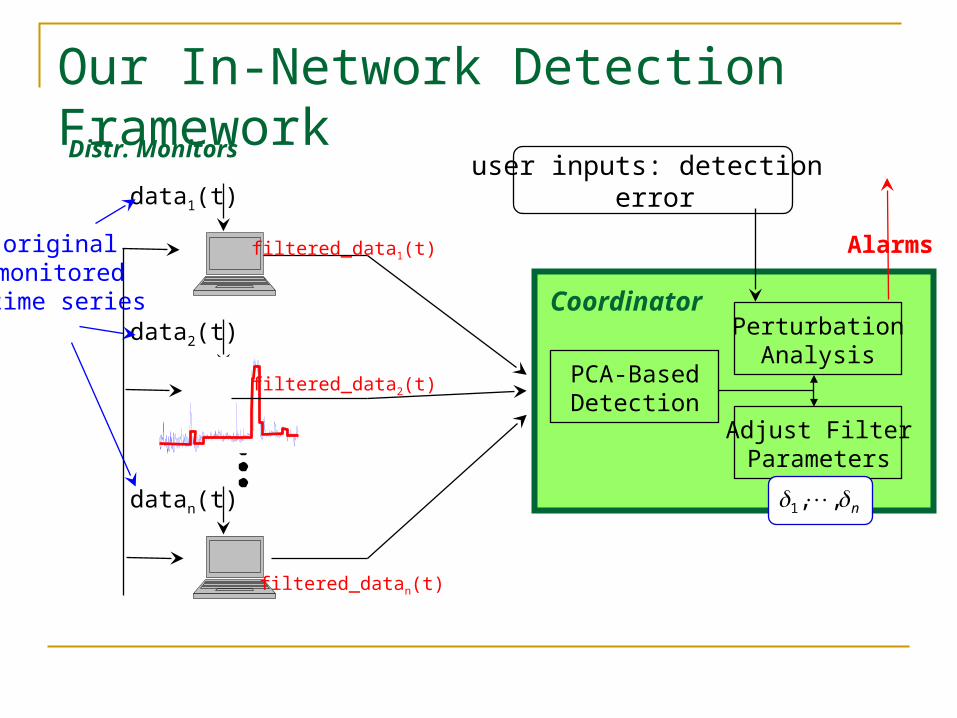
PCA-BasedDetection
Our In-Network Detection Framework
data1(t)
data2(t)
datan(t)
PerturbationAnalysis
Adjust FilterParameters
original monitored time series
filtered_data1(t)
filtered_data2(t)
filtered_datan(t)
Coordinator
Alarms
user inputs: detection error
n ,,1
Distr. Monitors

The Protocol At Monitors
Monitor i updates information if
are the filtering parameters can be based on any prediction model
built on historical data e.g., the average of last 5 signal values observed
locally Simple but enough to achieve 10x data reduction
iii tt )(Mod)(Dat *
n ,,1
)(Mod *ti)(Mod *t
)(Dat t
iii tt )(Mod)(Dat *

The Communication and Error Tradeoff
α
2
ab QyC
data(t)
12 9 457
24 31
63
72
Dat=
filtered_data(t)
atD
PCA on Dat
α
2
ab QyC
Full Info.
PCA on atDApproximate Info.
Difference?
The coordinator computes a set of good 1, …, n to manage this
difference.

Parameter Design and Error Control (I) Users specify an upper bound on false alarm rate, then
we determine the filtering parameters ’s
α
2
abα
2
ab QyC vs.QyC
αabαab Q ,C vs.Q ,C
Data vs. Model
Monte Carlo and fast binary search
Stochastic Matrix Perturbation Theory
Eigen error: L2 norm of the difference between the approximate eigenvalues and the actual ones
Actual Approximate

Parameter Design and Error Control (II) Detection Error Eigen-Error
Mont Carol simulation to find the mapping from to
For the given using fast binary search to find an Eigen-Error Filtering parameters ’s
3
2i
9
4i

Evaluation Given user-specified false alarm rate,
evaluate the actual detection accuracy and communication overhead
Experiment setup Abilene backbone network data Traffic matrices of size 1008 X 41 Set uniform slack for all monitors

Performance
Missed Detections False Alarms Data Reduction
Week 1 Week 2 Week 1 Week 2 Week 1 Week 2
0.01 0 0 0 0 75% 70%
0.03 0 1 1 0 82% 76%
0.06 0 1 0 0 90% 79%
Data Used: Abilene traffic matrix, 2 weeks, 41 links.
error tolerance = upper bound on error
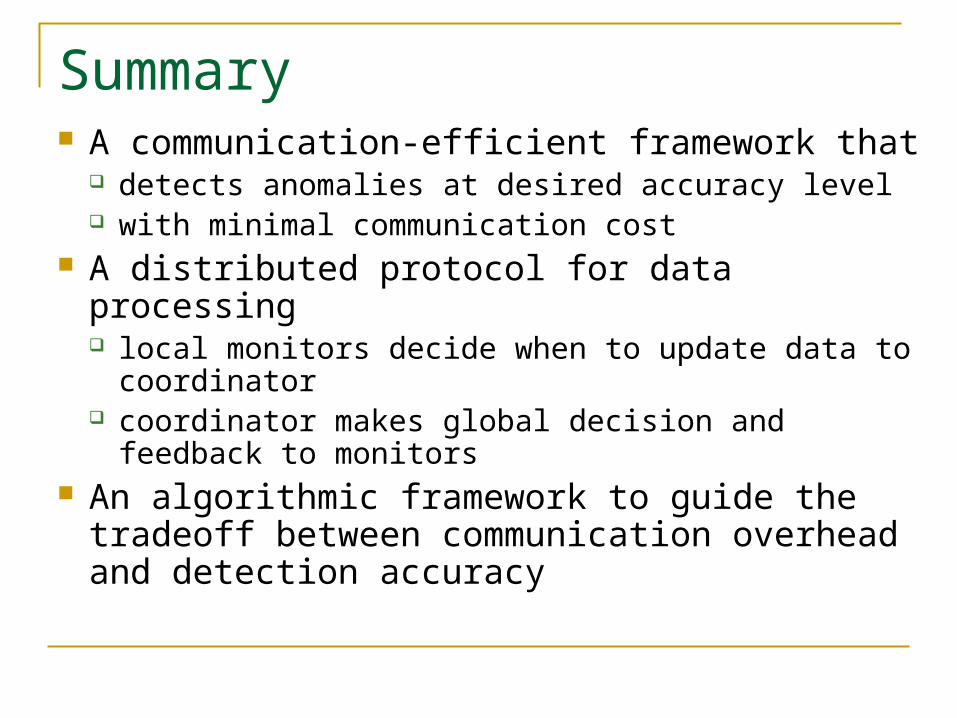
Summary A communication-efficient framework that
detects anomalies at desired accuracy level with minimal communication cost
A distributed protocol for data processing local monitors decide when to update data to
coordinator coordinator makes global decision and feedback to
monitors An algorithmic framework to guide the tradeoff
between communication overhead and detection accuracy
ReferenceReference[Lakhina’04][Lakhina’04] Diagnosing Network-Wide Traffic Anomalies. Diagnosing Network-Wide Traffic Anomalies. A. Lakhina, M. Crovella and C. A. Lakhina, M. Crovella and C. Diot. In SIGCOMM '04.Diot. In SIGCOMM '04.
[Huang’06][Huang’06] In-Network PCA and Anomaly Detection. In-Network PCA and Anomaly Detection. L. Huang, X. Nguyen, M. Garofalakis, L. Huang, X. Nguyen, M. Garofalakis, M. Jordan, A. Joseph and N. Taft. In NIPS 19, 2006.M. Jordan, A. Joseph and N. Taft. In NIPS 19, 2006.
[Huang’07][Huang’07] Communication-Efficient Online Detection of Network-Wide Anomalies. Communication-Efficient Online Detection of Network-Wide Anomalies. L. L. Huang, X. Nguyen, M. Garofalakis, J. Hellerstein, M. Jordan, A. Joseph and N. Taft. To Huang, X. Nguyen, M. Garofalakis, J. Hellerstein, M. Jordan, A. Joseph and N. Taft. To appear in INFOCOM'07. appear in INFOCOM'07.
Questions

18
Backup Slides

Operation Center
Traditional Distributed Monitoring Large-scale network monitoring and detection systems
Distributed and collaborative monitoring boxes Continuously generating time series data
Existing research focuses on data streaming Centrally collect, store and
aggregate network state Well suited to answering
approximate queries and continuously recording system state
Incur high overhead!
Monitor 1
Monitor 2
Monitor 3
Local Network 2
Local Network 3
Local Network 1
Bandwidth
Bottleneck! Overloaded!
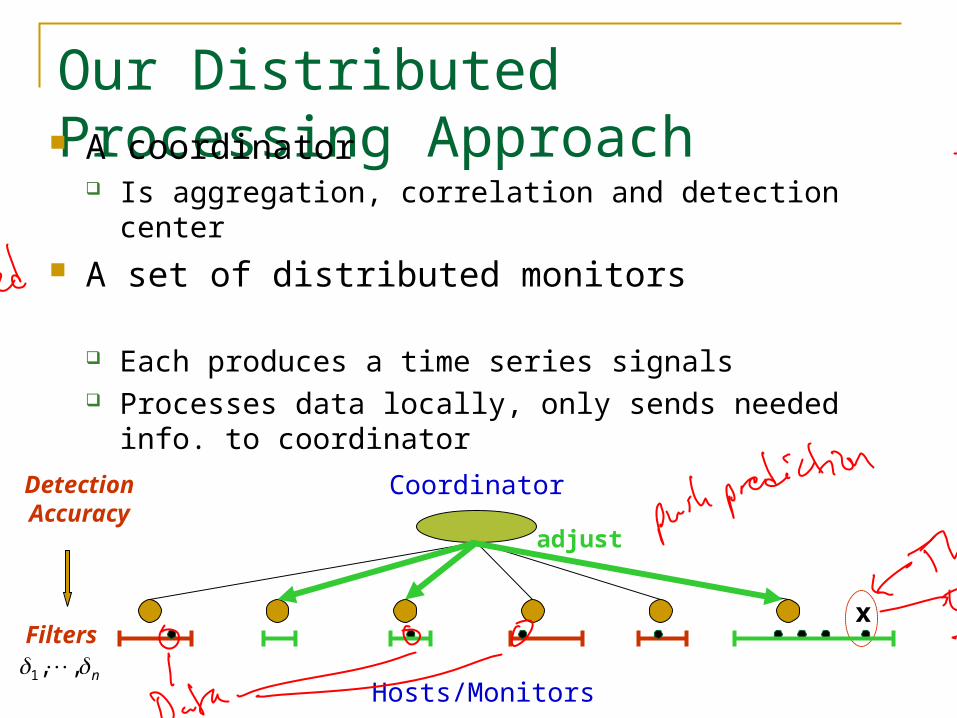
Our Distributed Processing Approach A coordinator
Is aggregation, correlation and detection center A set of distributed monitors
Each produces a time series signals Processes data locally, only sends needed info. to coordinator No communication among monitors Coordinator tells monitors the level of accuracy for signal
updates
Filtersx
“push”
Filtersx
adjust
Hosts/Monitors
CoordinatorDetectionAccuracy
n ,,1
Traffic on Link 1
Tra
ffic
on
Link
2
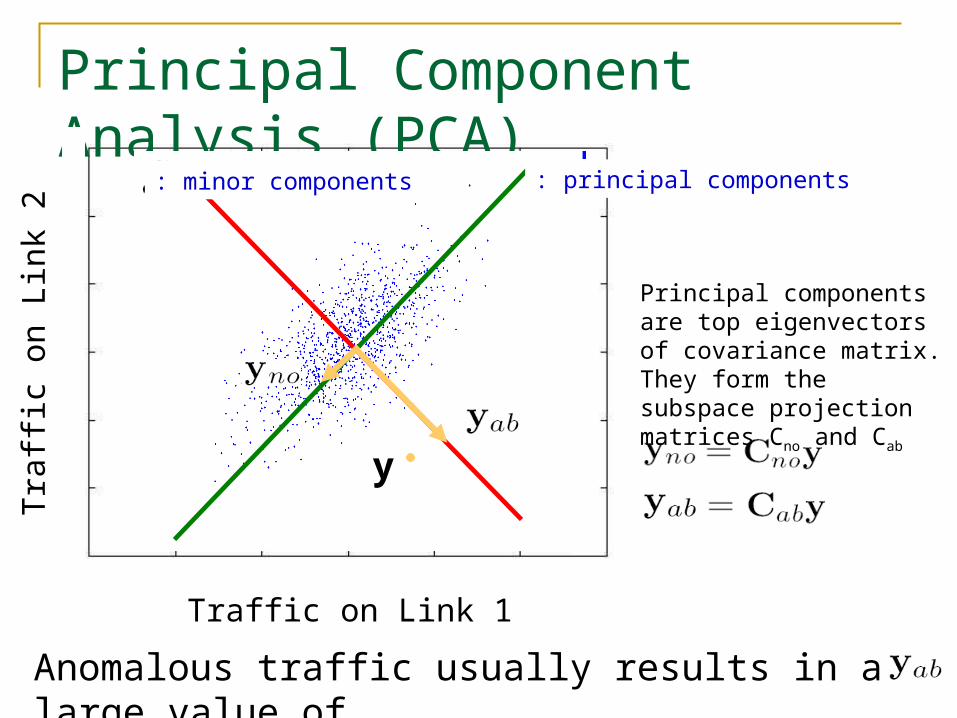
Principal Component Analysis (PCA)
y
Anomalous traffic usually results in a large value of
: principal components: minor components
Principal components are top eigenvectors of covariance matrix. They form the subspace projection matrices Cno and Cab