1-coversheet 17-a 2009 - crown equities, inccrownequitiesinc.com/pdfs/cei_17a_dec2009.pdf · the...
TRANSCRIPT

Company's Address: No./Street/City/Town/Province
899-0455 Company's Telephone Number
December 31 Calendar Year Ending (Annual Meeting) (Month & Day)
N/A
LCU
Cashier DTU
A1996-38745 S.E.C. Registration No.
Central Receiving Unit File Number
Document I.D.
COVER SHEET
(Company's Full Name)CROWN EQUITIES, INC.
SEC Form 17-A
4th Floor Crown Center, 158 N. GarciaCorner Jupiter Street, Makati City
Form Type
Amended Designation (If Aplicable)
Secondary License Type and File Number

SECURITIES AND EXCHANGE COMMISSION
SEC FORM 17-A
ANNUAL REPORT PURSUANT TO SECTION 17 OF THE SECURITIES REGULATION CODE AND SECTION 141
OF THE CORPORATION CODE OF THE PHILIPPINES 1. For the fiscal year ended: December 31, 2009
2. SEC Identification Number: 38745 3. BIR Tax Identification No.: 002-837-461 4. Exact name of registrant as specified in its charter: CROWN EQUITIES, INC. 5. Philippines 6. (SEC Use Only) Province, Country or other jurisdiction of
incorporation or organization Industry Classification Code:
7. 4th Floor Crown Center, 158 N. Garcia corner Jupiter Street, Makati City 1209 Address of principal office Postal Code 8. 899-04-55 Registrant's telephone number, including area code 9. 12/F Equitable Bank Tower, 8751 Paseo de Roxas Ave., Makati City Former name, former address, and former fiscal year, if changed since last report. 10. Securities registered pursuant to Sections 8 and 12 of the SRC, or Sections 4 and 8 of the RSA
Title of Each Class
Number of Shares of Common Stock Outstanding and Amount of Debt Outstanding
Common shares 13,599,999,960 shares 11. Are any or all of these securities listed on the Philippine Stock Exchange. Yes [ X ] No [ ] 12. Check whether the registrant: (a) has filed all reports required to be filed by Section 17 of the SRC and SRC Rule 17.1 thereunder or Section 11 of the Revised Securities Act (RSA) and RSA Rule 11(a)-1 thereunder, and Sections 26 and 141 of The Corporation Code of the Philippines during the preceding 12 months (or for such shorter period that the registrant was required to file such reports); Yes [ X ] No [ ] (b) has been subject to such filing requirements for the past 90 days. Yes [ X ] No [ ]

PART I - BUSINESS AND GENERAL INFORMATION Item 1. Business (1) Business Development
Crown Equities, Inc. (CEI or the Corporation) was incorporated on October 24, 1969 to engage in, among others, the exploration, development and mining of mineral claims, under the original corporate name of Leyte Base Metal Corporation, Inc. In 1993, when a new set of shareholders assumed control, the corporate name was changed to Pacific Rim Oil and Resources Corporation. On May 22, 1995, the stockholders and the Board of Directors approved the strategic shift in the Corporation’s primary business activity from oil exploration to investment holding. The corporate name was further changed to Southeast Pacific Rim Resources and Development Corporation. Finally, to deliberately focus on the Corporation’s investing activities, the corporate name was changed to Crown Equities, Inc. in 1996. The Corporation eventually divested its remaining interests in oil exploration and focused its resources on other fields of investment. The Corporation started its healthcare business by opening its ambulatory care clinics in Makati City in 1997 and in Sta. Rosa, Laguna in 1998. Also in 1998, the development of a property in Binan, Laguna into a middle-class residential subdivision commenced. In 1999, the Corporation acquired interest in a toll road project, which was eventually disposed of in 2005. Also in 2005, the development of a property in Taguig City into a medium rise residential condominium was started. At present, the Corporation maintains its investments in the healthcare business and pursues its real estate businesses in joint venture with major companies in this field.
(2) Business of Issuer
The Corporation is a Filipino-owned publicly listed investment holding corporation. The Corporation, through its subsidiaries, acquired various real estate properties to be developed into commercial, industrial, residential, or mixed-use areas. The Corporation also has investments in healthcare business particularly in two medical ambulatory care clinics. Except for Healthcare Systems of Asia Philippines, Inc. and Crown Central Properties Corp., the subsidiaries of the Corporation are still in the pre-operating stage.
Being the parent company, the Corporation’s business activities are minimal at its level. The Corporation employs two technical personnel and five administrative and accounting staff handling the Corporation’s and its subsidiaries’ transactions and books. There is no existing Collective Bargaining Agreement between the Corporation and its employees. There are no supplemental benefits or incentive arrangements with the employees, aside from those provided by law. Property development businesses involve significant risks including the risks that construction may not be completed on schedule or within the allocated budget; and that such projects may not achieve the anticipated sales. In addition, real estate development projects typically require substantial capital expenditure during construction and it may take years before the projects generate cash flows.

a. Real Estate and Property Development
1. Crown Central Properties Corporation
Crown Central Properties Corporation (CCPC) was incorporated on September 3, 1996 as a result of a joint venture agreement between the Corporation and Solid Share Holdings, Inc., an affiliate of a major banking group. In October 2003, CCPC entered into a Memorandum of Agreement (MOA) with Sta. Lucia Realty and Development, Inc. whereby the former shall contribute land and its improvements while the latter shall be responsible for completing the development of the subdivision. The agreement calls for a 60%-40% sharing in favor of CCPC. The project has secured the necessary clearances and permits including environmental compliance certificate from the Department of Environment and Natural Resources (DENR). A monetary penalty of Php50 thousand and/or suspension or cancellation of the certificate would result from non-compliance of the terms and conditions of the permit. The project was completed and marketing was started in May 2004. The subdivision, named Palma Real Residential Estates is strategically located near the boundary of Sta. Rosa and Binan, in the province of Laguna, a few meters away from exclusive schools such as Don Bosco, De La Salle University and St. Scholastica’s College. Among middle class residential subdivisions, Palma Real is the nearest to these educational institutions, next to San Jose Village. Although competition is considered tight given the number of residential subdivisions within its five-kilometer radius, the Palma Real enjoys considerable advantage given its proximity to the schools, the industrial park, the booming commercial district in the area, and the access road from the Mamplasan exit of the South Luzon Expressway connecting to the Sta. Rosa-Tagaytay highway.
2. CEI Development Corp.
CEI Development Corp. (CEIDC) was incorporated on July 10, 1996 primarily to acquire, develop and sell real estate properties. A wholly-owned subsidiary of the Corporation, CEIDC owns over 40 hectares of real estate property in Sto. Tomas, Batangas. Some of the properties are still in the process of titling. The properties are mostly located in Brgy. San Miguel, Sto. Tomas, Batangas, about 43 kilometers from the central business district of Makati City. It is accessible by any land transport from Manila via the South Luzon Expressway and the Maharlika highway.
3. CEI Properties, Inc.
Incorporated on July 10, 1996, CEI Properties, Inc. (CEIPI) was organized to invest in, purchase or acquire, own and hold, use, sell or dispose property of every kind and description. CEIPI owns over a hectare piece of land in Taguig City, Metro Manila. CEIPI has not started its commercial operation and has no significant business development during the last three years. CEIPI has also no intention to develop the properties within the next twelve months.
4. Parkfield Land Holdings, Inc.
Parkfield Land Holdings, Inc. (PLHI), a 75%-owned subsidiary of the Corporation, was incorporated on April 11, 2001 primarily to acquire, develop, and sell real estate properties. PLHI owns 92 hectares of land located in San Jose
del Monte, Bulacan. PLHI has not started its commercial operations and has no significant business developments involving the properties. PLHI is studying a joint venture for a low cost or medium cost housing development.
5. Ceres Property Venture, Inc.
Ceres Property Venture, Inc. (CPVI) was organized primarily to acquire, develop and sell real estate properties. It was incorporated in March 24, 1999 and has not yet started commercial operations. CPVI is a wholly-owned subsidiary of Ceres Holdings, Inc. (CHI), the latter being a 100%-owned subsidiary of CEI. CPVI owns properties located in Taguig City, Metro Manila, covering a total area of almost two hectares which are intended to be developed into a commercial site. Titles to some of the properties are still in the process of being transferred to the name of CPVI. CPVI has no significant business developments during the last three years and has no intention to develop the project within the next twelve months.
6. Sky Leisure Properties, Inc.
Sky Leisure Properties, Inc. (SLPI), a 50% owned associate of the Corporation, was incorporated on August 26, 1998 as a result of a joint venture between the Corporation and Perfect Sites, Inc. primarily to acquire, develop and sell real estate properties. SLPI owns land with a total area of 107 hectares which are near but higher in altitude than the Tagaytay Highlands in Tagaytay City, Cavite. SLPI has not yet started its commercial operations and has no significant business developments during the last three years. It has also no intention to develop the project within the next twelve months.
b. Healthcare
1. Healthcare System of Asia Phils., Inc.
Healthcare System of Asia, Phils. (HSAPI), Inc. was established on July 26, 1996 to deliver medical and health care services and healthcare systems, in general. Presently, HSAPI has two operational ambulatory care clinics: the Fortmed Medical Clinics – Makati, which started operations in 1997, and Fortmed Medical Clinics – Sta. Rosa, which started operations in 1998. The two Fortmed Clinics provide a wide range of medical services at reasonable costs. These clinics house state-of-the-art diagnostic and ambulatory treatment apparatus including the recent imaging techniques, modern laboratory equipment and with up-to-date cardio-pulmonary testing capabilities, contemporary day surgery, trauma and emergency care, and full-service consultation rooms. The Fortmed Clinics have in-house pharmacies with ample supply of medicines available to patients. Competition in this type of business is generally dictated by factors such as the reputation of doctors associated with and actually practicing in the clinic, availability of highly effective facilities, and the level of professional service.

Location and accessibility are also critical competitive factors. The Fortmed Clinics have a group of competent doctors who are prominent in their respective fields of expertise. It boasts of a wide range of sophisticated diagnostic apparatus, including a 4-D ultrasound equipment. Fortmed-Makati is strategically located within the vicinity of Bel-Air Village, which is easily accessible to both residents and workers in the Makati business district, while Fortmed-Sta. Rosa is in Paseo de Sta. Rosa, a booming commercial district in the vicinity of Ayala Laguna Technopark – a light industrial park which is home to multinational companies producing light vehicles and computer components. Fortmed-Makati enjoys a substantial share of the Makati residents and employees market. This is attributed to what the Fortmed Clinics offer: state-of-the-art facilities, top caliber medical specialists and staff, and hassle-free service delivery system bereft of long queue that is common to hospitals. Fortmed-Sta. Rosa has an advantage of accessibility from various locations in the neighboring industrial estates. Its patients include foreign expatriates and factory workers located within the industrial park. The Fortmed Clinics are accredited by the Department of Health (DOH) and such accreditation is renewed annually with a minimal fee. Environmental Compliance Certificate (ECC) issued to the clinics requires, among others, agreement with a waste management contractor to handle disposal and treatment of the clinics’ waste. Noncompliance with the ECC provisions will subject the clinics to monetary penalties amounting to fifty thousand pesos (Php50,000) per violation and/or suspension/cancellation of permit to operate. Necessary licenses have been secured from the DOH to operate the different x-ray facilities of the clinics, while the laboratory facilities are licensed by the Dangerous Drug Board (DDB). For the pharmacies, annual license to operate is secured from the Bureau of Food and Drugs of the DOH. The clinics employ at least 66 medical and administrative personnel composed of 47 medical/operations staff and 19 administrative and marketing employees. There is no existing Collective Bargaining Agreement between management and the employees. There are no supplemental benefits or incentive arrangements with the employees, aside from those provided by law.
2. Fort Bonifacio Medical Center, Inc.
Fort Bonifacio Medical Center, Inc. (FBMCI), a wholly owned subsidiary of the Corporation, was incorporated on October 21, 1997. Currently, its primary business purpose is to provide medical and health care delivery services and systems in general. FBMCI owns a parcel of land near Circumferential Road 5 in Brgy. Fort Bonifacio, Taguig City, Metro Manila. FBMCI entered into a joint venture with DM Consunji, Inc. wherein the latter shall develop medium-rise residential condominium complex on the 3,969 square meters property, with a provision for an ambulatory care clinic on one of its buildings. The joint venture has completed construction of what is now called the Cypress Towers. FBMCI has not yet started commercial operations and has no significant business developments during the last three years.

Item 2. Properties Aside from the properties owned by the Corporation’s subsidiaries described in Item 1 above, the Corporation owns 6,748 square meters of land in Brgy. Fort Bonifacio, Taguig City Metro Manila. This property, together with that of FBMCI is being developed in joint venture with DM Consunji, Inc. into a residential condominium complex known as the Cypress Towers. The Corporation started realizing sales from the project in 2008. Some of the properties owned by certain subsidiaries of the Corporation are still in the process of titling and are free from liens or mortgages. The Corporation does not intend to acquire any other property in the next twelve months except to complete the consolidation of its existing land bank. The Corporation purchased in April 2007 a property located in Jupiter, Makati City. A building is now standing on the property and serves as the main business address of the Corporation. Item 3. Legal Proceedings There is no material pending legal proceeding which involves the Corporation or any of its subsidiaries or affiliates. Item 4. Submission of Matters to a Vote of Security Holders There is no matter submitted to a vote of security holders during the fourth quarter of the fiscal year covered by this report.
PART II - OPERATIONAL AND FINANCIAL INFORMATION Item 5. Market for Issuer's Common Equity and Related Stockholder Matters (1) Market Information
The Corporation’s securities are traded only in the Philippine Stock Exchange and no market for the shares is expected to be developed outside the Philippines. For the last two years, the highs and lows of stock market prices for Crown Equities, Inc.’s equity shares are as follows:
HIGH LOW 2009 2008
October – December July – September April – June January – March October – December
0.0410 0.0350 0.0320 0.0280
0.0600
0.0550 0.0525 0.0460 0.0380
0.0170
July – September 0.0825 0.0500 April – June 0.0875 0.0500 January – March 0.0850 0.0600

For the period January 1, 2010 through March 31, 2010 the shares recorded a high price of Php0.0450 per share and a low of Php0.0350 per share.
(2) Holders
There were 405 shareholders of CEI as of December 31, 2009 and 405 shareholders as of March 31, 2010, majority of whom are Filipinos. The top 20 stockholders on record as of March 31, 2010 are as follows:
Name of Shareholder
Number of Shares
Pct. To Total
1 PCD Nominee Corp. (Filipino) 8,036,444,936 59.09% 2 Guild Securities Inc. (Filipino) 2,935,984,888 21.59% 3 First Orient Securities Inc. (Filipino) 706,727,592 5.20% 4 PCD Nominee Corp. (Non-Filipino) 367,676,000 2.70% 5 Marie Louise Y. Tong (Filipino) 223,550,000 1.64% 5 Robin Y. Tong (Filipino) 223,550,000 1.64% 5 Wellington Y. Tong (Filipino) 223,550,000 1.64% 6 Patrick D. Go (Filipino) 136,008,000 1.00% 7 Rene Daniel S. Rieza (Filipino) 80,000,000 0.59% 8 Ginafe Dela Cruz 62,816,960 0.46% 9 Armando O. Raquel-Santos 41,600,000 0.31%
10 Andres N. Borja 40,000,000 0.29% 10 Tony Yu Ang &/or Rosemarie F. Ang 40,000,000 0.29% 11 Chito M. Franco III 31,200,000 0.23% 12 Rosario S. Lopez 28,800,000 0.21% 13 David Go Securities Corp. 28,000,000 0.21% 13 Nicanor M. Mayoralgo 28,000,000 0.21% 14 GCV Management & Consulting Corp 21,896,000 0.16% 15 Arlene H. Crisostomo &/or Fe H. Crisostomo 20,800,000 0.15% 15 Carolyn H. Crisostomo &/or Fe H. Crisostomo 20,800,000 0.15% 16 Wilfrido V. Vergara 19,296,000 0.14% 17 Jerome H. Crisostomo &/or Fe H. Crisostomo 19,200,000 0.14% 18 Emmanuel E. Acuna 18,376,000 0.13% 19 Alberto A. Linco 15,905,440 0.12% 20 Trans-Asia Securities, Inc. 12,868,000 0.09%
(3) Dividends
(a) No dividends have been declared on common shares for the last two years. (b) There is no restriction that limits the ability of the Corporation to pay dividends on
common equity and no such restriction is expected to arise in the future. (4) Recent Sales of Unregistered Securities
No sale of unregistered securities has been made by the Corporation within the period covered by this report.

Item 6. Management's Discussion and Analysis The Corporation has adopted all the relevant Philippine Financial Reporting Standards (PFRS) in its financial statements, with January 1, 2004 as its transition date. The transition from the previous generally accepted accounting principles (GAAP) in the Philippines to PFRSs has been made in accordance with PFRS 1, First-time Adoption of Philippine Financial Reporting Standards for year 2006. The Corporation’s financial statements for 2008 and the comparatives presented for 2007 comply with all presentation and disclosure requirements of the relevant PFRSs applicable for accounting periods commencing on or after January 1, 2005. Management’s discussion of the Corporation’s financial condition and results of operation presented below should be read in conjunction with the attached audited consolidated financial statements of CEI and its subsidiaries.
(1) Financial Position and Changes in Financial Position As of December 31, 2009, total assets decreased by 1% or P11.56 million from P1.894 billion as of 2008 to P1.883 billion as of 2009. The decrease was due primarily to the amount of cash used in operating activities and the repayment of short-term liabilities during the period. As of December 31, 2008, total assets increased by 3% or P59.88 million from P1.834 billion as of 2007 to P1.894 billion as of 2008. The increase was due primarily to the increase in receivables resulting from sales. Total current assets decreased by 15% or P90.22 million from P614.72 million as of 2008 to P524.50 million as of 2009. This was attributable to the decrease in cash and cash equivalents amounting to P135.30 million during the period. The amount of cash was used mainly to finance the cost of additional property and equipment and to pay outstanding liabilities. The cash was also used to cover overhead expenses. The increase in receivables and advances of P29.22 million resulting from receivables from rendering of medical services; the increase in inventory of P18.72 million due to re-classification of investment property to saleable inventories; and the increase in the market value of financial assets at fair value through profit or loss of P6.04 million were able to mitigate the impact of the decline in cash and inventories. In 2008, total current assets increased by 5% or P30.20 million from P584.53 million as of 2007 to P614.72 million as of 2008. This was attributed mainly to the increase in inventories of P59.49 million which pertains to the cost of condominium units from Cypress Towers and cost of medical supplies of the clinics. The increase in installment contract receivables of P23.95 million, which was caused by sales of condominium units from Cypress Towers and continuing sales of lots from Palma Real, also contributed to the increase in total current assets. However, cash and cash equivalents decreased by P65.35 million during the period. Total non-current assets increased by 6% or P78.66 million from P1.280 billion as of 2008 to P1.358 billion as of 2009. This was largely attributable to the increase in property and equipment amounting to P93.55 million. This pertains to the cost of construction of the Crown Center building in Makati City that houses CEI’s and most of its subsidiaries’ office. This also includes the cost of construction of the building in Laguna that houses the ambulatory care clinic of Fortmed. Total non-current assets increased by 2% or P29.68 million from P1.250 billion as of 2007 to P1.280 billion as of 2008. The acquisition of additional investment in HSAPI in 2008 resulted to CEI having control over HSAPI and the recognition of goodwill amounting to P21.74 in the same
year. As of December 31, 2009, total liabilities decreased by 5% or P13.01 million from P254.28 million as of 2008 to P231.16 million as of 2009. This was attributable to the decrease in accounts payable and other liabilities amounting to P14.19 million. This mainly pertains to payment of outstanding balance of purchase price of land properties and repayment of due to related parties. As of December 31, 2008, total liabilities increased by 24% or P49.42 million from P204.86 million as of 2007 to P254.28 million as of 2008. The increase was due to an increase in accounts payable and other liabilities amounting to P58.69 million representing the unpaid portion of price of the land property purchased in Taguig and additional customers’ deposit received on sold lots and condominium units. On the other hand, due to related party decreased by P11.00 million resulting from payments made to related party during the same period. The continuous increase in total equity during the years 2009 and 2008 was due to the net income earned amounting to P1.59 million in 2009 and P9.63 million in 2008.
(2) Results of Operation Net income declined by 84% in 2009. This was generally the effect of the negative result of operations of the healthcare business. However, the positive result of the real estate operation mitigated the healthcare’s impact on the consolidated statements. The acquisition of additional investment in HSAPI resulted to consolidation of the clinics’ operation. In 2009, the clinic operation earned revenue of P43.86 million from sales of medical goods and services and registered a gross profit of P19.83 million. However, this was not able to cover total costs and expenses incurred during the year. Employee benefits which pertain to salaries of medical and administrative personnel amounted to P11.39 million while professional fees paid to doctors and consultants amounted to P3.08 million. Rentals incurred on leased office and clinic premises amounted to P3.29 million while depreciation on leasehold improvements and medical equipments amounted to P2.03 million. These and other overhead costs resulted to a net loss of P9.64 million for the clinic operation.
The real estate operation registered a net income of P11.23 million in 2009 from the 2008 net income of P9.63 million. Gross profit from sales of lots and condominium units decreased by 25% or P8.10 million during the year. Interest income earned on cash and cash equivalents declined by 59% or P6.67 million as a result of the decrease in cash in bank and short-term placements during the year. On the other hand interest on installment contract receivables rose by 198% or P4.32 million. Also, a recovery on the market value of marketable securities amounting to P5.47 million was recognized during the year as compared to a P8.45 million decline in market value in 2008. Expenses incurred by the real estate operation such as professional fees and commissions declined by P1.62 million and P1.85 million, respectively. In 2008, net income declined by 68% from P30.44 million in 2007 to P9.63 million in 2008. This decline was merely the result of the gain on sale of investment in stocks of MTDME amounting to P26.20 million and the realized gain from trading securities amounting to P12.60 million both recognized in 2007. In fact, gross profit from real estate operations improved by P27.06 million in 2008 which was attributable to revenues recognized from the Cypress Towers. Expenses such as professional fees and commissions increased by P2.92 million and P4.27 million, respectively. Impairment

loss on investment in an associate amounting to P6.28 million was recognized during the year. Also, P5.83 million representing share in net loss of an associate was recognized.
(3) Key Performance Indicators
The Corporation measures its performance based on the utilization of assets and the return on its investments. Only Crown Central Properties Corporation and Healthcare System of Asia Philippines, Inc. were in operation during 2009 and 2008. Most of the Corporation’s investments are in ventures that are still at pre-operating stage.
As of
Indicator Dec 2009
Dec 2008
Formula
Investments Ratio
0.53
0.55
Total Investment and Advances
Total Assets
Current Ratio
2.21
2.45
Current Assets
Current Liabilities
Debt Ratio
0.12
0.13
Total Liabilities Total Assets
Twelve-Month Period Dec
2009 Dec 2008
Return on Assets
0.004
0.008
EBIT
Total Assets
Earnings Per Share
0.00001
0.0003
Net Income
Total Shares Subscribed Investment ratio, which indicates the proportion of total assets invested in various ventures including land banking, went up down .55 at the end 2008 to .53 as of December 31, 2009. This was due to conversion of land held previously as investment property to saleable units carried as inventories. Current ratio decreased from 2.45 at the end of 2008 to 2.21 as of December 31, 2009 due to the amount of cash and short-term placements used to finance the construction of the buildings in Makati and Laguna, and to cover overhead expenses. The payments of liabilities, particularly accounts payable arising from purchase of land properties, resulted to a lower debt ratio of 0.12 as of December 31, 2009 compared to 0.13 as of the end of 2008. Return on assets declined from 0.008 at the end of 2008 to 0.007 as of December 31, 2009 due to the decrease in result of operation in 2009 brought largely by the clinic operations. Earnings per share declined from 0.0003 at the end of 2008 to 0.00001 as of December 31, 2009. This was due to the decline in the share of CEI on the net income.

(4) Past and Future Financial Condition with Particular Emphasis on the Prospects for the Future
The Corporation continues to generate revenues from its real estate projects particularly Palma Real Residential Estates and the Cypress Towers. The combined revenues from real estate sales amounted to P55 million. In addition, the healthcare business is now part of the consolidated statement of income with revenue reaching almost P44 million in 2009. Cypress Towers remains a significant contributor to total revenues. Sales, although affected by the recent international economic slowdown, still look promising. The first building was completed in 2008 and started generating revenues in the same year. The condominium project which is composed of three condominium buildings was completed in early 2010 with Altiva Tower being ready for occupancy at the end of the first quarter in 2010. The revenue stream from this project is expected to continue over the next few years. The Palma Real Residential Estates likewise is expected to continue generating revenues with the re-launching of the project in 2010. The project has started marketing house and lot packages. The strategy was intended to promote the build-up of a community in the project. Future sales are expected to improve as the Palma Real is now accessible both from the Sta. Rosa-Tagaytay road and from the Mamplasan exit of the South Luzon Expressway. Meanwhile, the healthcare business is given a fresh start with the completion of new clinic locations. Fortmed Makati moved to the new Crown Center while Fortmed Sta. Rosa is now housed in a new building along United Boulevard in the Greenfield Business Park in Sta. Rosa, a few meters from where it was before. Although the clinics suffered losses in 2009, it may be considered as temporary. The clinics’ operations were disrupted by the movement of important medical equipment from the old clinic location to the new building. Patients were likewise adversely affected by the transitions. In the meantime, the Corporation’s current operating cash requirements are administrative in nature and do not require material funding. The Corporation has no known trends, demands, commitments, events or uncertainties in the present operations of the Corporation that is likely to result in the Corporation’s liquidity increasing or decreasing in any material way nor it is aware of any events that will trigger direct or contingent financial obligation that is material to the Corporation, including any default or acceleration of an obligation and there are no material off- balance sheet transactions, arrangements, obligations (including contingent obligation), and other relationships of the Corporation with unconsolidated entities or other persons created during the year. The Corporation has no plans at present of raising additional permanent funds in the next twelve months. Neither has it plans for a significant change in the number of employees. As of this report, the Corporation has no material commitment for capital expenditure. Management is not aware of any trends, events or uncertainties that have or will have material impact on net sales or revenues or income from continuing operations neither of its operating subsidiaries nor of any seasonal aspects that had a material effect on the financial condition or results of operation of the Corporation. The Corporation is not in default of any loans or lease or financing arrangement and there are no significant amounts of trade payables which have not been paid within the stated trade terms. The Corporation foresees a satisfactory business outcome in the succeeding year and does not anticipate having within the next twelve months any cash flow or liquidity problems.

The Corporation and its subsidiaries have neither issued nor invested in any financial instruments or complex foreign securities that will make them susceptible to the effects of the global financial conditions. They have neither foreign currency denominated nor local peso denominated loans. The Corporation’s financial risk exposure is limited to its investments in the local equities market reported as “Financial Assets at Fair Value Through Profit and Loss” in its balance sheet. But this exposure is insignificant being less than one percent of the Corporation’s total asset base. Moreover, these investments in the local stock market are always marked to market thus reflecting the most verifiable values available. The Corporation’s risk management policies are religiously observed and fair values of investments are reviewed by the Executive Committee on a weekly basis.
Item 7. Financial Statements The audited financial statements of the Corporation are included in this report as Annex A. Item 8. Changes in and Disagreements with Accountants on Accounting and Financial
Disclosure During the stockholders’ meeting held on June 30, 2009, the firm of Manabat Sanagustin & Co. was appointed as auditor for the year 2009. The auditing firm is also being considered to handle the independent audit of the Corporation for year 2010. There were no disagreements with the previous independent auditor on accounting and financial disclosures. The decision to appoint a new independent auditor was made based purely on commercial reasons. For the audit of the Corporation’s financial statements, the aggregate fees billed by the independent auditors were P650 thousand and P1.0 million for years 2009 and 2008, respectively. There were no other professional fees billed by the independent auditors during the year. The Audit Committee reviews all proposals for services to be rendered by the independent auditor.
PART III - CONTROL AND COMPENSATION INFORMATION Item 9. Directors and Executive Officers of the Registrant a. Directors and Executive Officers Mr. George L. Go, 68 years old, Filipino, is presently the Chairman of the Board of Directors and President of the Company. He is a Director of the Company since 1995. Mr. Go is also the Chairman of the following companies: Healthcare Systems of Asia Philippines, Inc., Asian Alliance Holdings and Development Corp., and GLG Crown Holdings, Corp.. Mr. Go is a Director of both Shang Properties, Inc. (formerly Kuok Philippine Properties Inc.) and Universal LRT Corporation. He held the foregoing positions within the last five years. Mr. Go earned a Bachelor of Arts in Economics degree from Youngstown University, U.S.A. and has completed an Advance Management Program from Harvard Business School, U.S.A. Mr. Wilfrido V. Vergara, 65 years old, Filipino, is the Vice-Chairman of the Board of Directors of the Company since May 2002. He is likewise the Chairman of the Nomination Committee and of the Compensation and Remuneration Committee since 2003. He was formerly President and Chief Executive Officer and Director of Equitable PCI Bank and most
of its subsidiaries from May 01, 1995 until his retirement in April 17, 2001. Mr. Vergara obtained his degree of Bachelor of Science in Economics from Ateneo de Manila University. Mr. Ramon A. Recto, 77 years old, Filipino, is an independent director of the Company since May 2002. He is the Chairman of the Audit Committee and a member of the Nomination Committee since May 2003. Mr. Recto is currently the Chairman/President of CME Technologies, Inc. and the President of Supply Oilfield Services, Inc. and S.O.S. Transport and Brokerage, Inc.. He was formerly the President of Lepanto Consolidated Mining Corporation. Mr. Recto obtained a Bachelor of Science degree both in Electrical and in Mechanical Engineering from University of the Philippines. He also earned his Masters Degree in Industrial Management from the same university. Mr. Victor C. Macalincag, 74 years old, Filipino, is an Independent Director of Crown Equities, Inc. since May 27, 2003. He currently holds directorship in Semirara Mining Corporation, Republic Glass Holdings Corp, Universal LRT Corp. and Finman Rural Bank. Mr. Macalincag was the President of Trade & Investment Development Corporation of the Philippines presently known as PHIL EXIM (formerly PhilGuarantee) from 1991 until his resignation in 2001. He was Deputy Minister of Finance from 1981 to 1986 and Undersecretary of Finance from 1986 to 1991. He concurrently held the position of National Treasurer from 1981 to 1988. Other positions he held until year 2001 were as follows: Director of Home Guaranty Corporation and Philippine Overseas Construction Board; Executive Committee Member of the Export Industry Modernization of the Technology and Livelihood Resource Center, Review Committee Member of Industrial Guarantee and Loan Fund; and Executive Committee Member of the Industry Development Council. He was also a director of Philippine Long Distance Telephone Co. (PLDT) from 1988 to 1995 and National Power Corporation from 1978 to 1986. Mr. Macalincag is a Certified Public Accountant. He has a Bachelor of Science degree in Business Administration from University of the East. He has completed the academic requirements for Master of Arts in Economics also from the same university. He finished a fellowship program conducted by the Economic Development Institute of the World Bank, Washington D.C. in 1971. Mr. Antonio B. Alvarez, 66 years old, Filipino, is a member of the Board of Directors since 1995 and the Treasurer of the Company since 1997. He is also a member of the Nomination Committee and of the Compensation and Remuneration Committee since May 2003. Mr. Alvarez is the President of Guild Securities, Inc. He is also a member of the Board of Directors of Healthcare Systems of Asia Phils., Inc. Mr. Alvarez was formerly the Executive Vice President of Securities Specialists, Inc. He graduated with a degree of Bachelor of Science in Commerce major in Accounting from the Far Eastern University. Mr. Andres N. Borja, 66 years old, Filipino, is a member of the Board of Directors of Crown Equities, Inc. since May 27, 2003. He is a member of the Nomination Committee. Mr. Borja is currently the President and Director of the following companies: Crown Central Properties Corp., CEI Development Corporation, Manros Properties, Inc. and Jadeite Properties, Inc. He was formerly the President and director of Arbor Realty and Development Corp., Almaciga Realty and Development Corp., Mark Securities, Inc. and Cedar Realty and Development Corporation. Mr. Borja earned his Bachelor of Science degree in Political History from Ateneo de Manila University and has an Institute of Banking Diploma from City of London College. Mr. Conrado G. Marty, 64 years old, Filipino, is a member of the Board of Directors of Crown Equities, Inc.. He is the President of Universal LMS Finance and Leasing Corp. and Luxor Properties and Development Corporation. He is likewise the Vice Chairman of Hyundai Asia Resources, Inc. Mr. Marty holds a degree in Bachelor in Business Administration major in Accounting, cum laude, from University of the East and likewise earned his Master’s Degree in Business Administration from Wharton School, University of

Pennsylvania. Mr. Edilberto V. Javier, 63 years old, Filipino, is a member of the Board of Directors of the Company since October 2001. He is a member of the Nomination Committee and of the Compensation and Remuneration Committee since May 2003. He is the Chairman of EVJ Holdings, Inc. and a member of the Board of Directors of the following companies: Healthcare Systems of Asia Philippines, Inc., Philippine Hoteliers, Inc. (Dusit Hotel), DTV Realty Development, Inc., and Sedgewick Holdings, Inc. He was formerly Senior Executive Vice President and Chief Operating Officer of Equitable PCI Bank and a director/officer of most of its subsidiaries from 1995 until his resignation in 2001. Mr. Javier earned a Bachelor of Arts degree in Economics from the Ateneo de Manila University. Mr. Isidro A. Consunji, 61 years old, Filipino, is a member of the Board of Directors of D.M. Consunji Inc. (DMCI), Semirara Mining Corporation and Crown Equities, Inc. He is the Chairman of the Board of DMCI Project Developers Inc., and President of DMCI Holdings Inc., Dacon Corporation, Beta Electric Corp. Mr. Consunji was born in Manila on January 15, 1949 with three children. He graduated from the University of the Philippines where he earned a degree in Bachelor of Science in Engineering. He also took up Master of Business Economics from the Center for Research & Communication and Master of Business Management from the Asian Institute of Management. He became the President of Philippine Constructors Association from 1999 – 2000 & Philippine Chamber of Coal Mines, Inc. (May 1999 – January 2002). Mr. Consunji is an active member of the U.P. Beta Epsilon Fraternity, Asian Institute of Management Alumni Association, U.P. Alumni Engineers, and U.P. Aces Alumni Association. Mr. Patrick D. Go, 42 years old, Filipino, has been a Director of Crown Equities, Inc. since 1995 and the Compliance Officer since 2008. Mr. Go is also the Managing Director of Healthcare Systems of Asia Phils., Inc.. He held the foregoing position from August 2009. He was Vice President at Banco Universal Bank from 2001 to 2009. He graduated with Bachelor of Science degree in Finance and Real Estate from San Francisco State University, U.S.A. in 1992. He is the son of Mr. George L. Go. Mr. Eugene B. Macalalag, 41 years old, Filipino, is a member of the Board of Directors of Crown Equities, Inc. since May 2003. He is the Vice President for Finance and Administration of the Company. Mr. Macalalag is also a member of the Board of Directors of Healthcare Systems of Asia Philippines, Inc. and Crown Central Properties Corporation. He joined Crown Equities, Inc. in April 1996 and has since served several positions. Mr. Macalalag earned his Master’s degree in Business Administration from the De La Salle University, Manila. Mr. David O. Chua, 41 years old, Filipino, is a member of the Board of Director of Crown Equities, Inc. since 2007. He is the President of Cathay Pacific Steel Corporation and Asia Pacific Capital Equities and Securities Corporation. He is currently a Director of Philippine Stock Exchange, Advisory Board Member of Metropolitan Bank and Trust Company, Vice President of the Federation of the Filipino Chinese Chambers of Commerce and Industry Inc., Director of the Hardware Foundation of the Phils., and Galleria Corporate Center Condominium Corp. He is also a Trustee of University of the East and University of the East Ramon Magsaysay Memorial Medical Center. He held the foregoing positions within the last five years. Mr. Chua is also the President of the Philippine Steelmakers Association and Kellogg/Northwestern University Alumni Association of the Philippines. He was formerly a Director of the Philippine Savings Bank (PSB), First Metro Investments Corp., Chairman of Philippine Institute of Quezon City (PIQC) and Chairman of 2008 National Employer’s Conference Employers Confederation of the Philippines (ECPO) Mr. Chua has a BS Financial Services Management, Honors degree from St. Mary's College in California, USA and a Masters in Business Administration (MBA) from the Kellogg School of Business of

Northwestern University, Evanston, Illinois, USA and the Graduate School of Business of the Hong Kong University of Science and Technology. Mr. Romuald U. Dy Tang, 58 years old, Filipino, is a member of the Board of Director of Crown Equities, Inc. in 2008. He is a director of DTV Realty & Development, Inc., Kok Tay Trading Corporation and Sedgewick Holdings, Inc. He was Executive Vice President and Treasurer of Equitable PCI Bank and a Director of various subsidiaries of Equitable PCI Bank. Mr. Dy Tang earned his Bachelor of Science in Business Administration major in Management from De La Salle University, Manila b. Significant Employees The Corporation has no employee who is not an executive officer but is expected to make a significant contribution to the business. c. Family Relationships Except for Mr. Patrick D. Go who is the son of Mr. George L. Go, no other directors or executive officers are presently related either by consanguinity or affinity. The Corporation has no controlling or parent company. d. Involvement in Certain Legal Proceedings The Corporation has no knowledge of the involvement of the current directors and executive officers, in any legal proceedings as defined in the Securities Regulation Code for the last five years up to the date of this report. Item 10. Executive Compensation In 2009, the Vice-President for Finance and Administration and Vice-President for Subsidiaries/Operations were remunerated with a compensation package comprising of twelve months pay and regular benefits required by law. The aggregate compensation paid or incurred during the last two fiscal years and estimated to be paid in the ensuing fiscal year to the Executive Officers and Directors of the Corporation are as follows:
COMPENSATION OF DIRECTORS AND EXECUTIVE OFFICERS Name and Principal Position Year Salary/Fees Others Total
Compensation of Executive Officer Eugene B. Macalalag, Vice President for Finance & Admin. Andres N. Borja, Vice President for Subsidiaries/Operations
2010*
1.8 million
-
1.8 million 2009 1.8 million - 1.8 million 2008 1.7 million - 1.7 million Total Compensation of Officers and Directors**
2010*
2.5 million -
2.5 million
2009 2.5 million - 2.5 million 2008 2.7 million - 2.7 million
* Estimate ** No substantial compensation was made to directors during the last two years

Compensation of Directors The members of the Board of Directors who are not executive officers are elected for a term of one year. As provided for under the Corporation’s By-Laws, directors shall receive a reasonable per diem allowance for their attendance at each meeting. Further, as compensation, the Board shall receive and allocate an amount of not more than ten percent (10%) of the net income before income tax of the Corporation during the preceding year. Such compensation shall be determined and apportioned among the directors in such manner as the Board may deem proper, subject to the approval of shareholders representing at least a majority of the outstanding capital stock at a regular or special meeting of the stockholders. Except for a Php5,000 per diem per meeting for each director which started in August 2007, no other payment for directors’ per diem, allowance or payment for their compensation had been made during the last two fiscal years. The Corporation does not anticipate any directors’ compensation other than the regular per diem within the next twelve months. Other Arrangements On May 2, 2002, the Board authorized the implementation of a stock option plan for any or all directors and executive officers of the Corporation as maybe designated by the Board. The stockholders subsequently approved the stock option plan during the Corporation’s annual stockholders meeting on May 31, 2002. On March 27, 2007, the Board approved the extension of the vesting period for another five (5) years, or until May 31, 2012.The terms and conditions under which such stock option plan will be granted to designated participants are as follows: Title of securities underlying the stock option Shares of Common Stock Amount of securities underlying the stock option 300,000,000 shares Participants Any or all directors and executive officers
of the Corporation as may be designated by the Board
Grant of Stock Options Stock Options shall be awarded to participants based on satisfaction of performance requirements and other restrictions and conditions as may be imposed by the Board and subject, in all cases, to the full discretion of the Board.
Exercise Price Par value or book value whichever is higher Entitlement Date May 31, 2002 (the “Entitlement Date”) Vesting/Expiration The option shares shall be subject to vesting
according to such schedule as shall be approved by the Board; provided, that the vesting shall lapse after five (5) years from Entitlement Date; provided further, that with respect to executive officers, options shall expire upon their resignation.
Adjustment in Number of Option Shares and Exercise Price
The number of underlying common shares in respect of outstanding options and/or the exercise price shall be correspondingly adjusted in the event of any stock dividend declaration, stock split, merger, consolidation or other similar or analogous

change in the corporation structure or capitalization of the Corporation.
Amendment at the Board of Directors’ Discretion Terms and conditions of the stock option plan may be amended by resolution of the Board, except for any increase in the maximum number of shares or for any decrease in the exercise price which shall require the approval of stockholders representing at least two-thirds (2/3) of the outstanding capital stock. No consideration will be received by the Corporation for the grant or extension of the option.
Market value of the common shares as of March 31, 2010
Php0.0370 per share.
Total number of participants awarded as of December 31, 2009.
None.
Total no. of participants designated by the Board as of December 31, 2009.
None.
Item 11. Security Ownership of Certain Record and Beneficial Owners and Management (1) Security Ownership of Certain Record and Beneficial Owners
As of March 31, 2010, the following stockholders own more than 5% of the Corporation’s outstanding capital stocks:
Title of Class
Name and Address of Stockholders
Amount of shares [Record (r)/Beneficial
(b) Ownership]
%
Ownership Common shares
PCD Nominee Corp. ¹ 37/F Tower 1 Enterprise Center Ayala Ave. cor. Paseo de Roxas, Makati City
8,036,444,936 (r) 59.09%
Common shares
Guild Securities, Inc. (Filipino) Unit 1215 Tower One and Exchange Plaza, Ayala Avenue, Makati City
2,935,984,888 (r) 21.58%
Common shares
First Orient Securities, Inc. (Filipino) Unit 1201 Tower One and Exchange Plaza, Ayala Avenue, Makati City
706,727,592 (r) 5.20%
¹ - PCD Nominee Corp. (PCD), a wholly-owned subsidiary of Philippine Central Depository, Inc., is
the registered owner of certain shares in the books of the Corporation’s transfer agents in the Philippines. The beneficial owners of such shares are PCD’s participants, who hold shares on their behalf or in behalf of their clients. PCD is a private Corporation organized by the major institutions actively participating in the Philippine capital markets to implement an automated book-entry system of handling securities transactions in the Philippines. The beneficial owners of PCD shares that owns 5% and above are indicated as follows:
Guild Securities, Inc. (Filipino) 3,215,326,264 23.64% Unit 1215 Tower One and Exchange Plaza Ayala Avenue, Makati City
BDO Securities Corp. (Filipino) 1,213,024,976 8.92%

27/F Tower One and Exchange Plaza Ayala Avenue Makati City
Marian Securities, Inc. (Filipino) 1,031,616,000 7.59% 2232 Pasong Tamo Ext. Makati City
The following have the right to vote or direct the voting or disposition of the CEI shares beneficially held by the Corporations they respectively represent: Antonio B. Alvarez for Guild Securities, Inc. and Conrado G. Marty for Marian Securities, Inc..
To the best knowledge of the Corporation, no security holder has created a voting trust for the purpose of conferring upon a trustee the right to vote pertaining to shares of stock of the Corporation. (2) Security Ownership of Directors and Management
As of March 31, 2010, the individual directors and executive officers of the Corporation who are holders of the Corporation’s shares of stock are as follows:
Title of Class
Name of Beneficial Owner
Amount of Beneficial Shares Held .
Percentage of ownership
A. Directors
Common Shares Common Shares Common Shares Common Shares Common Shares Common Shares Common Shares Common Shares Common Shares Common Shares Common Shares Common Shares Common Shares
Edilberto V. Javier George L. Go Antonio B. Alvarez Ramon A. Recto Victor C. Macalincag Wilfrido V. Vergara Patrick D. Go Conrado G. Marty Isidro A. Consunji Eugene B. Macalalag Andres N. Borja David O. Chua Romualdo Dy Tang
4,008,000 db1
128,000,800 db2
177,600 d
56,800,000 db3
10,000,080 db4
19,296,000 d
171,220,000 db5
80,008 d
8,000 d
6,800,080 db6
40,000,000 d
400,000 d
76,720,000 db7
0.03% 0.94%
nil 0.42% 0.07% 0.14% 1.25%
nil nil
0.05% 0.29%
nil 0.56%
B. Executive Officers
C. Directors and Officers As a
Group 513,510,568
3.78%
d – these are directly owned by the aforementioned director or officer db1 – 4,000,000 of these are registered in one of the PCD member companies but beneficially owned by the director db2 – 124,000,000 of these are registered in one of the PCD member companies but beneficially owned by the director db3 – 55,920,000 of these are registered in one of the PCD member companies but beneficially owned by the director db4 – 10,000,000 of these are registered in one of the PCD member companies but beneficially owned by the director db5 – 35,212,000 of these are registered in one of the PCD member companies but beneficially owned by the director db6 – 6,800,000 of these are registered in one of the PCD member companies but beneficially owned by the director db7 – 76,700,000 of these are registered in one of the PCD member companies but beneficially owned by the director

(3) Voting Trust Holders of 5% or More
No persons known to the registrant hold more than 5% of the common shares under a voting trust or similar agreement.
(4) Changes in Control
There is no arrangement which may result in a change in control of the registrant. Item 12. Certain Relationships and Related Transactions During the last two years, there were no transactions or series of similar transactions with or involving the Corporation or any of its subsidiaries in which a director, executive officer, nominee for election as a director or stockholder owning ten percent (10%) or more of total outstanding shares and members of their immediate family, had or is to have a direct or indirect material interest.
PART IV – CORPORATE GOVERNANCE Item 13. Corporate Governance Since its implementation of its Manual on Corporate Governance in 2003, compliance with it has been satisfactory and no sanction has been imposed on any member of the organization for deviating from the Manual. The Corporation adopted and implemented its Manual on Corporate Governance in 2003 to institutionalize the principles of good corporate governance in the entire organization and to supplement its By-Laws. The Corporation maintains two independent directors in its Board and has designated a Compliance Officer to oversee the implementation of the Manual. Pursuant to the Manual, the Corporation created a Nomination Committee to pre-screen and shortlist all candidates nominated to become a member of the Board. A Compensation and Remuneration Committee was also formed to develop policies on executive remuneration; and an Audit Committee to check all financial reports and to provide oversight on financial management functions. In addition to the foregoing committees, the Corporation has a five-member Executive Committee that regularly meets to discuss the Corporation’s day-to-day operation. As certified by the Compliance Officer, there was no material deviation in compliance with the Manual for the year 2009.
PART V - EXHIBITS AND SCHEDULES Item 14. Exhibits and Reports on SEC Form 17-C (1) Exhibits
Audited Financial Statements Annex A
(2) Reports on SEC Form 17-C from January 01 to Dec 31, 2009
a. Board of Directors’ Approval of Change in Business Address
During the regular meeting of the Board of Directors of CEI on September 29, 2009, the Board of Directors approved the transfer of the Corporation’s business address from 12th Floor Equitable Bank Tower, 8751 Paseo de Roxas, Makati City to 4th Floor Crown Center, 158 N. Garcia corner Jupiter Street, Makati City.
b. Board of Directors’ Approval of New Independent Auditor
During the regular meeting of the Board of Directors of CEI on April 28, 2009, the Board of Directors appointed Manabat Sanagustin & Co. as the independent auditors of the Corporation for the year 2009.

ANNEX A
Company's Address: No./Street/City/Town/Province
899-0455 Company's Telephone Number
December 31 Calendar Year Ending (Annual Meeting) (Month & Day)
N/A
LCU
Cashier DTU
A1996-38745 S.E.C. Registration No.
Central Receiving Unit File Number
Document I.D.
COVER SHEET
(Company's Full Name)CROWN EQUITIES, INC.
Annual Audited Financial Statements
4th Floor Crown Center, 158 N. GarciaCorner Jupiter Street, Makati City
Form Type
Amended Designation (If Aplicable)
Secondary License Type and File Number


CROWN EQUITIES, INC. AND SUBDSIDIARIES
CONSOLIDATED FINANCIAL STATEMENTS December 31, 2009
(With Comparative Figures for 2008 and 2007)

CROWN EQUITIES, INC. AND SUBSIDIARIES CONSOLIDATED STATEMENT OF FINANCIAL POSITION
DECEMBER 31, 2009 (With Comparative Figures for 2008)
Note 2009 2008
ASSETS Current Assets Cash and cash equivalents 6 P76,148,102 P211,448,536Financial assets at fair value through profit or loss 7 14,750,636 8,710,098Installment contracts receivable 18 33,046,206 38,950,397Receivables and advances 8 75,038,518 45,817,373Inventories 9 316,853,261 298,129,384Other current assets 18 8,667,628 11,667,022
Total Current Assets 524,504,351 614,722,810
Non-current Assets Installment contracts receivable 18 54,551,459 39,884,868Investments in and advances to associates - net 10 335,624,568 330,396,702Investment properties - net 11 656,266,314 702,038,003Property and equipment - net 12 243,193,130 149,639,989Goodwill 10 21,740,604 21,740,604Other non-current assets 13 46,878,564 35,895,563
Total Non-current Assets 1,358,254,639 1,279,595,729
P1,882,758,990 P1,894,318,539
LIABILITIES AND EQUITY Current Liabilities Accounts payable and other current liabilities 14 P114,831,250 P129,021,124Due to a related party 17 80,202,613 80,153,569Subscriptions payable 15 42,158,700 42,158,700
Total Current Liabilities 237,192,563 251,333,393Non-current Liability Retirement benefit obligation 22 3,941,003 2,948,259
Total Liabilities 241,270,553 254,281,652
Equity 16 Attributable to Parent Company shareholders 1,498,017,304 1,497,767,591Attributable minority interest 143,408,348 142,269,296
Total Equity 1,641,625,424 1,640,036,887
P1,882,758,990 P1,894,318,539
See Notes to the Consolidated Financial Statements.

CROWN EQUITIES, INC. AND SUBSIDIARIES CONSOLIDATED STATEMENT OF COMPREHENSIVE INCOME
FOR THE YEAR ENDED DECEMBER 31, 2009 (With Comparative Figures for 2008 and 2007)
Note 2009 2008 2007
REVENUES Real estate sales 18 P54,943,931 P78,860,497 P32,719,997Rendering of services 43,855,265 - - Interest income
Cash in banks and short-term placements 6 4,684,473 11,343,198 11,148,326
Installment contracts receivable 18 6,489,154 2,184,550 2,305,414Other income 19 7,264,767 19,244,645 46,653,926 117,237,590 111,632,890 92,827,663
EXPENSES Cost of real estate sales 9 30,004,084 45,819,968 26,739,985Cost of sales and services 20 24,028,275 - - Employee benefits 22 15,000,714 4,169,698 3,979,644Professional fees 7,021,730 5,566,264 2,642,731Rent 5,019,872 1,635,793 1,349,830Commission 18 3,932,039 5,777,912 1,503,907Depreciation and amortization 12 3,947,195 2,441,923 2,089,303Equity in net loss of an associate 3,524,831 5,833,770 - Taxes and licenses 1,732,377 520,245 2,501,217Meetings and seminars 1,707,422 1,685,507 1,360,170Impairment loss on advances to
associates 10 - 6,282,869 - Decline in value of financial
assets at FVPL 7 - 8,450,967 304,464Other operating expenses 21 14,449,740 7,954,447 15,457,886 110,368,278 96,139,363 57,929,137
RESULTS FROM OPERATING ACTIVITIES 6,869,312 15,493,527 34,898,526
INCOME TAX EXPENSE 23 5,280,774 5,859,566 4,454,053NET INCOME / TOTAL
COMPREHENSIVE INCOME P1,588,538 P9,633,961 P30,444,476
Attributable to: Parent Company shareholders P249,713 P4,988,979 P30,724,985Minority interest 1,338,825 4,644,982 (280,512) P1,588,538 P9,633,961 P30,444,473
Basic/Diluted Earning Per Share 24 P0.00002 P0.00037 P0.00226
See Notes to the Consolidated Financial Statements.

CROWN EQUITIES, INC. AND SUBSIDIARIES CONSOLIDATED STATEMENT OF CHANGES IN EQUITY FOR THE YEAR ENDED DECEMBER 31, 2009 (With Comparative Figures for 2008 and 2007)
Attributable to Equity Holders of the Parent Company
Note Capital Stock Additional
Paid-in Capital Retained Earnings Total Non-controlling
Interest Total Equity Balance at January 1, 2009 P1,330,146,816 P118,570,274 P49,050,501 P1,497,767,591 P142,269,295 P1,640,036,886 Total comprehensive income for the year - Net income for the year - 249,713 249,713 1,338,825 1,588,538
Balance at December 31, 2009 P1,330,146,816 P118,570,274 P49,300,214 P1,498,017,304 P143,608,120 P1,641,625,424
Balance at January 1, 2008 P1,330,146,816 P118,570,274 P44,061,522 P1,492,778,612 P136,806,226 P1,629,584,838 Total comprehensive income for the year - Net income for the year - - 4,988,979 4,988,979 4,644,982 9,633,961 Transactions with owners, directly recorded
Minority interest of acquired subsidiary during the year
- - - - (4,181,913)
(4,181,913)
Minority interest’s additional capital stock - - - - 5,000,000 5,000,000
Balance at December 31, 2008 P1,330,146,816 P118,570,274 P49,050,501 P1,497,767,591 P142,269,295 P1,640,036,886
Balance at January 1, 2007 P1,699,999,995 P407,269,879 (P615,363,067) P1,491,906,807 P137,086,738 P1,628,993,545 Subscription receivable (29,853,180) - - (29,853,180) - (29,853,180) Total comprehensive income for the year - Net income for the year - - 30,724,985 30,724,985 (280,512) 30,444,473 Transactions with owners, directly recorded
Reduction of deficit through capital restructuring
16 (339,999,999) (288,699,605) 628,699,604 - - -
Balance at December 31, 2007 P1,330,146,816 P118,570,274 P44,061,522 P1,492,778,612 P136,806,226 P1,629,584,838
See Notes to the Consolidated Financial Statements.

CROWN EQUITIES, INC. AND SUBSIDIARIES CONSOLIDATED STATEMENT OF CASH FLOWS
FOR THE YEAR ENDED DECEMBER 31, 2009 (With Comparative Figures for 2008 and 2007)
Note 2009 2008 2007
CASH FLOWS FROM OPERATING ACTIVITIES
Income before tax P6,869,312 P15,493,527 P34,898,526Adjustments for:
Interest income 6 (11,187,741) (13,738,959) (13,453,740)Unrealized (gain) loss in the
change in value of financial assets at FVPL 7 (5,468,385) 8,450,967 304,464
Retirement Expense Reversal of allowance for
decline in value of investment property - (7,270,500) (6,685,246)
Impairment loss on advances to an associate 10 1,072,489 6,282,869 -
Recovery on impairment losses (317,142) Equity in net loss of an associate 10 5,833,770 - Depreciation and amortization 12 5,517,159 2,441,923 2,089,303Unrealized foreign exchange loss 107,211 (719,211) 844,054Gain on sale of property and
equipment - (214,286) - Retirement benefit cost 992,743 1,738,301 249,756Gain on disposal of investment 19 - - (26,200,000)
Operating income (loss) before working capital changes (2,414,354) 16,560,100 (8,202,639)
Decrease (increase) in receivables and advances (17,290,157) (6,656,106) 4,175,151
Decrease (increase) in inventories 29,983,048 35,909,210 26,739,984Decrease (increase) in other current
assets (832,391) (4,690,623) 5,469,543Decrease (increase) in installment
contracts receivable (8,762,400) (18,148,755) (12,468,975)Increase in other non-current assets (472,555) (7,638,668) (11,265,674)Increase (decrease) in accounts
payable and other current liabilities (19,406,517) 43,852,609 (20,946,041)Cash generated from (absorbed by)
operations (19,195,326) 60,926,068 (16,248,895)Cash paid for income taxes (2,286,519) (2,214,937) (4,454,053)Net cash from (used in) operating
activities (21,481,845) 58,711,131 (20,702,948)Forward

Note 2009 2008 2007
CASH FLOWS FROM INVESTING ACTIVITIES
Decrease (increase) in financial assets at fair value through profit or loss (572,153) (P5,444,658) P2,132,262
Decrease (increase) in investments in and advances to associates (92,606,400) (55,500) 28,458,617
Acquisitions of property and equipment - net of disposal (99,070,300) (59,174,273) (3,704,540)
Acquisition of investment property (10,136,147) (67,846,564) (61,812,470)Iincrease in other assets (8,339,373) (7,638,668) (11,265,674)Interest received 5,857,805 13,738,959 10,814,075Net cash used in investing activities (204,866,568) (126,420,704) (35,377,730)
CASH FLOWS FROM FINANCING ACTIVITIES
Increase in due to a related party 17 91,155,190 (11,000,000) (14,341,120)Proceeds from issuance of capital
stock to minority interest - 5,000,000 - Net cash used in financing activities 91,155,190 (6,000,000) (14,341,120)
EFFECT OF FOREIGN CURRENCY EXCHANGE RATES ON CASH AND CASH EQUIVALENTS (107,211) 719,211 (844,054)
NET INCREASE (DECREASE) IN CASH AND CASH EQUIVALENTS (135,300,434) (65,351,694) (60,000,178)
CASH AND CASH EQUIVALENTS AT BEGINNING OF YEAR 211,448,536 276,800,230 336,800,408
CASH AND CASH EQUIVALENTS AT END OF YEAR P76,148,102 P211,448,536 P276,800,230
See Notes to the Consolidated Financial Statements.

- 1 -
CROWN EQUITIES, INC. AND SUBSIDIARIES NOTES TO THE CONSOLIDATED FINANCIAL STATEMENTS
(With Comparative Figures for 2008 and 2007) 1. Reporting Entity
Crown Equities, Inc. (the “Parent Company”) was incorporated in the Philippine in October 1969. The Parent Group’s primary business activity is investment holding. The Parent Company’s registered office address is located at the 4th Floor, Crown Center, 158 Jupiter corner N. Garcia Streets, Makati City. The Parent Company and its subsidiaries (the “Group”) operate within the Philippines and are mainly involved in investment holding, real estate business and healthcare services. As of December 31, 2009, the Parent Company holds interests in the following companies, all incorporated in the Philippines:
Percentage of
Ownership Note 2009 2008 Subsidiaries: CEI Development Corp. (CEIDC)* 100% 100% CEI Properties, Inc. (CEIPI)* 100% 100% Ceres Holdings, Inc. (CHI) 100% 100%
Ceres Property Venture, Inc. (CPVI)* 100% 100% Fort Bonifacio Medical Center, Inc, (FBMCI)* 100% 100% Parkfield Land Holdings, Inc. (PHLI)* 74% 74% Healthcare Systems of Asia Phils., Inc. (HSAPI) 74% 74%
Fortmed Medical Clinics Makati, Inc. (FMCMI) 74% 74% Fortmed Medical Clinics Sta. Rosa, Inc. (FMSCRI) 74% 74% HCS Medical Care Center Cavite, Inc. (HMCCCI)* 74% 74%
Crown Central Properties, Corp. (CCPC) 48% 48% Associates: Sky Leisure Properties, Inc. (SLPI) 50% 50% e*Hermes, Inc. (e*Hermes)* 40% 40% Asian Alliance Holdings and Development
Corporation (AAHDC)
23% 23% * has not yet started commercial operations
Most of the Parent Company’s subsidiaries and associates have not started commercial operations. These subsidiaries and associates hold substantial investment properties and have incurred substantial amount of pre-operating expenses which resulted in significant deficit. While impairment losses have been recognized by the Group on such investment properties (see Note 11) and on investments in and advances to related parties (see Note 10), the recoverability of the remaining carrying values of these accounts is dependent upon the ability of the respective entities to successfully execute and implement their projects and, ultimately, to attain profitable operations. The consolidated financial statements do not include any additional adjustments to reflect the possible future effects on the recoverability and classification of the assets or the amounts and classification of

- 2 -
the liabilities that may result from the outcome of this uncertainty.
2. Basis of Preparation
Statement of Compliance The consolidated financial statements have been prepared in compliance with Philippine Financial Reporting Standards (PFRS). The consolidated financial statements of the Group for the year ended December 31, 2009 (including the comparatives for the years ended December 31, 2008 and 2007) were authorized for issue by the Parent Company’s Board of Directors on March 30, 2010. Basis of Measurement The consolidated financial statements have been prepared on the historical cost basis except for financial assets at fair value through profit or loss which are measured at fair value. Functional and Presentation Currency The consolidated financial statements are presented in Philippine peso, which is also the Parent Company’s functional currency. All financial information presented in Philippine Peso has been rounded to the nearest peso, except when otherwise stated. Basis of Consolidation The Group obtains and exercises control through voting rights. The Group’s consolidated financial statements comprise the accounts of the Parent Company, and its subsidiaries as enumerated in Note 1, after the elimination of material intercompany transactions. All intercompany balances and transactions with subsidiaries, including income, expenses and dividends, are eliminated full. Unrealized profits and losses from intercompany transactions that are recognized in assets are also eliminated in full. Intercompany losses that indicate an impairment is recognized in the consolidated financial statements. The financial statements of subsidiaries are prepared for the same reporting period as the Parent Company, using consistent accounting principles. Use of Estimates and Judgments The Group’s financial statements prepared in accordance with PFRS requires management to make judgments, estimates and assumptions that affect amounts reported in the financial statements and related notes, at the reporting date. However, uncertainty about these estimates and assumptions could result in outcome that could require a material adjustment to the carrying amount of the affected asset or liability in the future. Judgments In the process of applying the Group’s accounting policies, management has made the following judgments, apart from those involving estimations, which have the most significant effect on the amounts recognized in the financial statements: Determination of Functional Currency Based on the economic substance of the underlying circumstances relevant to the Group, the functional currency of the Group has been determined to be the Philippine peso. It is the currency of the primary economic environment in which the Group operates and the currency that mainly influences its revenue and expenses.

- 3 -
Distinction between Investment Properties and Owner-occupied Properties. The Group determines whether a property qualifies as investment property. In making its judgment, the Group considers whether the property generates cash flows largely independently of the other assets held by an entity. Owner-occupied properties generate cash flows that are attributable not only to property but also to other assets used in the production or supply process.
Some properties comprise a portion that is held to earn rental or for capital appreciation and another portion that is held for use in the supply of services or for administrative purposes. If these portions can be sold separately (or lease out separately under finance lease), the Group accounts for the portions separately. If the portion cannot be sold separately, the property is accounted for as investment property only if an insignificant portion is held for use in the production or supply of goods or service of for administrative purposes. Judgment is applied in determining whether ancillary services are so significant that a property does not qualify as investment property. The Group considers each property separately in making its judgment. Assessing Lease Agreements. The Group has entered into various lease agreements as a lessee. The Group has determined that the lessor retains all significant risks and rewards incidental to ownership of these properties which are leased out; hence, accounted for as operating lease. Rent expenses charged to profit or loss amounted to P8.34 million, P1.64 million and P1.05 million as of December 31, 2009, 2008 and 2007, respectively. Estimates The key estimates and assumptions used in the financial statements are based on management’s evaluation of relevant facts and circumstances as of the date of the Group’s financial statements. Actual results could differ from such estimates.
Estimating Impairment Losses on Financial Assets. Allowance is made for specific and groups of accounts, where objective evidence of impairment exists. The Group evaluates these accounts based on available facts and circumstances, including, but not limited to, the length of the Group’s relationship with the debtors, the current credit status based on third party credit reports, if any, and known market forces, average age of accounts, collection experience and historical loss experience.
As of December 31, 2009 and 2008, the Group has recognized a total allowance for impairment loss from investment in and advances to associates amounting to P192.95 million (see Note 10).
Estimating Useful Lives of Property and Equipment. The Group estimates the useful lives of property and equipment based on the period over which the assets are expected to be available for use. The estimated useful lives of property and equipment are reviewed periodically and are updated if expectations differ from previous estimates due to physical wear and tear, technical or commercial obsolescence and legal or other limits on the use of the assets. In addition, estimation of the useful lives of property and equipment is based on collective assessment of industry practice, internal technical evaluation and experience with similar assets. It is possible, however, that future results of operations could be materially affected by changes in estimates brought about by changes in factors mentioned above. The amounts and timing of recorded expenses for any period would be affected by changes in these factors and circumstances. A reduction in the estimated

- 4 -
useful lives of property and equipment would increase recorded cost of goods sold and administrative expenses and decrease noncurrent assets. Accumulated depreciation of property and equipment amounted to P14.03 million and P8.86 million as of December 31, 2009 and 2008, respectively. Property and equipment, net of accumulated depreciation, amounted to P178.04 million and P84.49 million as of December 31, 2009 and 2008, respectively (Note 12).
Realizability of Deferred Tax Assets. The Group reviews its deferred tax assets at each reporting date and reduces the carrying amount to the extent that it is no longer probable that sufficient taxable profit will be available to allow all or part of the deferred tax asset to be utilized. The Group’s assessment on the recognition of deferred tax assets on deductible temporary difference and carryforward benefits of MCIT and NOLCO is based on the projected taxable income within the prescription period.
The Group did not recognize the deferred tax assets as of December 31, 2009 and 2008 since management does not expect to have sufficient taxable profit that will be available against which the deferred tax assets can be utilized within the prescription period.
Impairment of Non-financial Assets. PFRS require that an impairment review be performed on property, plant and equipment when events or changes in circumstances indicate that the carrying value may not be recoverable. Determining the net recoverable value of assets requires the estimation of cash flows expected to be generated from the continued use and ultimate disposition of such assets. While it is believed that the assumptions used in the estimation of fair values reflected in the financial statements are appropriate and reasonable, significant changes in these assumptions may materially affect the assessment of recoverable values and any resulting impairment loss could have a material adverse impact on the results of operations and cash flows. Present Value of Defined Benefit Obligation. The present value of the retirement obligation depends on a number of factors that are determined on an actuarial basis using a number of assumptions. These assumptions are described in Note 23 to the financial statements and include discount rate, expected return on plan assets and salary increase rate. Actual results that differ from the assumptions are accumulated and amortized over future periods and therefore, generally affect the recognized expense and recorded obligation in such future periods. The assumption of the expected return on plan assets is determined on a uniform basis, taking into consideration the long-term historical returns, asset allocation and future estimates of long-term investment returns. The Group determines the appropriate discount rate at the end of each year. It is the interest rate that should be used to determine the present value of estimated future cash outflows expected to be required to settle the retirement obligations. In determining the appropriate discount rate, the Group considers the interest rates on government bonds that are denominated in the currency in which the benefits will be paid. The terms to maturity of these bonds should approximate the terms of the related retirement liability. Other key assumptions for retirement obligations are based in part on current market conditions. While it is believed that the Group’s assumptions are reasonable and appropriate, significant differences in actual experience or significant changes in assumptions may materially affect the Group’s retirement and other retirement obligations.

- 5 -
The Group has retirement liability of P3.94 million and P2.95 million as of December 31, 2009 and 2008, respectively (Note 22).
3. Summary of Significant Accounting Policies Adoption of New or Revised Standards, Amendments to Standards and Interpretations The FRSC approved the adoption of new or revised standards, amendments to standards, and interpretations as part of PFRS. Accordingly, the Company changed its accounting policies in the following areas:
Adopted effective January 1, 2009 Revised PAS 1, Presentation of Financial Statements (2007): introduces the term
total comprehensive income, which represents changes in equity during a period other than those changes resulting from transactions with owners in their capacity as owners. Total comprehensive income may be presented in either a single statement of comprehensive income (effectively combining both the statement of income and all non-owner changes in equity in a single statement), or in a statement of income and a separate statement of comprehensive income. The Group applied Revised PAS 1, which became effective as of January 1, 2009. The Group presented all non-owner changes in equity in the statements of comprehensive income and statements of changes in equity. Comparative information has been re-presented so that it is in conformity with the revised standard.
Amendments to PFRS 7, Financial Instruments: Disclosures - Improving Disclosures about Financial Instruments, require disclosures relating to fair value measurements using a three-level fair value hierarchy that reflects the significance of the inputs used in measuring fair values and provide more direction on the form of quantitative disclosures about fair value measurements and require information to be disclosed in a tabular format unless another format is more appropriate. In addition, the amendments clarify and enhance the existing requirements for the disclosure of liquidity risk. Effective January 1, 2009, the said new required disclosures have been included in Note 4 to the financial statements. Also, as allowed by the amendments, in the first year of application, comparative information is not required to be disclosed.
Improvements to PFRS 2008 - various standards (except as related to PFRS 5 Non-current Assets Held for Sale and Discontinued Operations), discuss 35 amendments and is divided into two parts: a) Part I includes 24 amendments that result in accounting changes for presentation, recognition or measurement purposes; and b) Part II includes 11 terminology or editorial amendments that the International Accounting Standards Board expects to have either no or only minimal effects on accounting. These improvements are effective for annual periods beginning on or after January 1, 2009.
The adoption of these foregoing revised standards and amendments to standards did not have a material effect on the Group’s consolidated financial statements.

- 6 -
New or Revised Standards, Amendments to Standards and Interpretations Not Yet Adopted
The Group will adopt the following new or revised standards, amendments to standards and interpretations in the respective effective dates: Effective in 2010 Revised PAS 27, Consolidated and Separate Financial Statements (2008), effective
for annual periods beginning on or after July 1, 2009, requires accounting for changes in ownership interests by the Company in a subsidiary, while maintaining control, to be recognized as an equity transaction. When the Company loses control of a subsidiary, any interest retained in the former subsidiary will be measured at fair value with the gain or loss recognized in profit or loss.
Philippine Interpretation IFRIC 17, Distributions of Non-cash Assets to Owners,
provides guidance on the accounting for non-reciprocal distributions of non-cash assets to owners acting in their capacity as owners. It also applies to distributions in which the owners may elect to receive either the non-cash asset or a cash alternative. The liability for the dividend payable is measured at fair value of the assets to be distributed.
Improvements to PFRS 2009, include 15 amendments to 12 standards. Some of the these amendments may have significant implications for current practice, in particular the amendments to PAS 17, Leases, may affect the classification of leases of land and buildings, particularly in jurisdictions in which such leases often are for a long period of time.
Philippine Interpretation IFRIC-19 Extinguishing Financial Liabilities with Equity Instruments, addresses issues in respect of the accounting by the debtor in a debt for equity swap transaction. It clarifies that equity instruments issued to a creditor to extinguish all or part of a financial liability in a debt for equity swap are consideration paid in accordance with PAS 39 paragraph 41.
Effective in 2011
Revised PAS 24 Related Party Disclosures (2009), amends the definition of a related party and modifies certain related party disclosure requirements for government-related entities. The revised standard is effective for annual periods beginning on or after January 1, 2011.
Effective in 2012
Philippine Interpretation IFRIC 15, Agreements for the Construction of Real Estate, applies to the accounting for revenue and associated expenses by entities that undertake the construction of real estate directly or through subcontractors. It provides guidance on the recognition of revenue among real estate developers for sales of units, such as apartments or houses, ‘off plan’; i.e., before construction is completed. It also provides guidance on how to determine whether an agreement for the construction of real estate is within the scope of PAS 11, Construction Contracts, or PAS 18, Revenue, and the timing of revenue recognition.

- 7 -
Effective in 2013 PFRS 9 Financial Instruments, is the first standard issued as part of a wider project
to replace PAS 39. PFRS 9 retains but simplifies the mixed measurement model and establishes two primary measurement categories for financial assets: amortized cost and fair value. The basis of classification depends on the entity’s business model and contractual cash flow characteristics of the financial asset. The guidance in PAS 39 on impairment of financial assets and hedge accounting continues to apply.
The Group will assess the impact of the new or revised standards, amendments to standards and interpretations on the consolidated financial statements upon adoption. Investments in Associates The Parent Company’s investments in associates are accounted for under the equity method of accounting. An associate is an entity in which the Group has significant influence and which is neither a subsidiary nor a joint venture. Under the equity method, the investment in an associate is carried in the consolidated statements of financial position at cost plus post-acquisition changes in the Group’s share in net assets of the associate. Goodwill relating to an associate is included in the carrying amount of the investment and is not amortized. After application of the equity method, the Group determines whether it is necessary to recognize any additional impairment loss with respect to the Group’s net investment in the associate. The consolidated statements of comprehensive income reflect the share in the profit or loss of the associate. Where there has been a change which was recognized directly in the equity of the associate, the Group recognizes its share in any changes and discloses this, when applicable, in the consolidated statements of changes in equity. Profits and losses resulting from transactions between the Group and the associate are eliminated to the extent of the interest in the associate. Financial Assets and Liabilities Date of Recognition. The Group recognizes a financial asset or a financial liability in the statements of financial position when it becomes a party to the contractual provisions of the instrument. In the case of a regular way purchase or sale of financial assets, recognition is done using settlement date accounting. Initial Recognition of Financial Instruments. Financial instruments are recognized initially at fair value of the consideration given (in case of an asset) or received (in case of a liability). The initial measurement of financial instruments, except for those designated at fair value through profit and loss (FVPL), includes transaction costs. Subsequent to initial recognition, the Group classifies its financial assets in the following categories: held-to-maturity (HTM) investments, AFS financial assets, FVPL financial assets and loans and receivables. The Company classifies its financial liabilities as either FVPL financial liabilities or other liabilities. The classification depends on the purpose for which the investments are acquired and whether they are quoted in an active market. Management determines the classification of its financial assets and financial liabilities at initial recognition and, where allowed and appropriate, re-evaluates such designation at every reporting date.

- 8 -
Determination of Fair Value. The fair value for financial instruments traded in active markets at the reporting date is based on their quoted market price or dealer price quotations (bid price for long positions and ask price for short positions), without any deduction for transaction costs. When current bid and asking prices are not available, the price of the most recent transaction provides evidence of the current fair value as long as there has not been a significant change in economic circumstances since the time of the transaction. For all other financial instruments not listed in an active market, the fair value is determined by using appropriate valuation techniques. Valuation techniques include the discounted cash flow method, comparison to similar instruments for which market observable prices exist, options pricing models and other relevant valuation models. Financial Assets Financial Assets at FVPL. Financial assets at FVPL include financial assets held for trading and financial assets designated upon initial recognition at FVPL and those classified under this category through the fair value option. Derivative instrument (including embedded derivatives), except those covered by hedge accounting relationships, are classified under this category. Financial assets are classified as held for trading if they are acquired for the purpose of selling in the near term. Financial assets may be designated by management at initial recognition at FVPL or reclassified under this category through fair value option, when any of the following criteria is met:
the designation eliminates or significantly reduces the inconsistent treatment that would otherwise arise from measuring the assets or recognizing gains or losses on a different basis; or
the assets and liabilities are part of a group of financial assets, financial liabilities or both which are managed and their performance are evaluated on a fair value basis, in accordance with a documented risk management or investment strategy; or
the financial instrument contains an embedded derivative, unless the embedded derivative does not significantly modify the cash flows or it is clear, with little or no analysis, that it would not be separately recognized.
The Company carries financial assets at FVPL using the fair values. Fair value changes and realized gains and losses are recognized as part of profit or loss. Any interest earned shall be recognized as part of “Other income (expenses)” in profit or loss. Any dividend income from equity securities classified as FVPL shall be recognized in profit or loss when the right of payment has been established. The Company’s marketable securities are classified under this category. The carrying values of financial assets under this category amounted to P14.75 million and P8.71 million as of December 31, 2009 and 2008, respectively (Note 7). Loans and Receivables. Loans and receivables are non-derivative financial assets with fixed or determinable payments and maturities that are not quoted in an active market. They are not entered into with the intention of immediate or short-term resale and are not

- 9 -
designated as AFS or financial asset at FVPL. Subsequent to initial measurement, loans and receivables are carried at amortized cost using the effective interest rate method, less any impairment in value. Amortized cost is calculated by taking into account any discount or premium on acquisition and fees that are integral part of the effective interest rate. Gains or losses are recognized in profit or loss when loans and receivables are derecognized or impaired, as well as through the amortization process. The Group’s cash and cash equivalents, installment contract receivables, receivables and advances and deposits are included in this category. The combined carrying values of financial assets under this category amounted to P490.29 million and P543.85 million as of December 31, 2009 and 2008, respectively (Note 4). HTM Investments. HTM investments are quoted non-derivative financial assets with fixed or determinable payments and fixed maturities for which the Company’s management has the positive intention and ability to hold to maturity. Where the Company sells other than an insignificant amount of HTM investments, the entire category would be tainted and classified as AFS financial assets. After initial measurement, these investments are measured at amortized cost using the effective interest rate method, less impairment in value. Any interest earned on the HTM investments shall be recognized as part of “Other income (expense) - net” in profit or loss on an accrual basis. Amortized cost is calculated by taking into account any discount or premium on acquisition and fees that are integral part of the effective interest rate. The periodic amortization is also included as part of “Other income (expense) - net” in profit or loss. Gains or losses are recognized in profit or loss when the HTM investments are derecognized or impaired, as well as through the amortization process. The Group has no investments accounted for under this category as of December 31, 2009 and 2008. AFS Financial Assets. AFS financial assets are non-derivative financial assets that are either designated in this category or not classified under any of the other financial asset categories. Subsequent to initial recognition, AFS financial assets are carried at fair value in the consolidated statements of financial position. The effective yield component of AFS debt securities is reported in profit or loss. Any interest earned on AFS debt securities shall be recognized in profit or loss on an accrual basis. Dividends earned on holding AFS equity securities are recognized as “Dividend income” when the right of collection has been established. Any unrealized gains or losses for the period arising from the fair valuation of AFS financial assets are reported as part of other comprehensive income, while the accumulated unrealized gains or losses are reported as a separate component of the Group’s equity. When individual AFS financial assets are either derecognized or impaired, the related accumulated unrealized gains or losses previously reported in equity are transferred to and recognized in profit or loss. AFS financial assets also include unquoted equity instruments with fair values which cannot be reliably determined. These instruments are carried at cost less impairment in value, if any. The Group has no investments accounted for under this category as of December 31, 2009 and 2008.

- 10 -
Financial Liabilities Financial Liabilities at FVPL. Financial liabilities at FVPL are classified under this category through the fair value option. Derivative instruments (including embedded derivatives) with negative fair values, except those covered by hedge accounting relationships, are also classified under this category. The Group carries financial liabilities at FVPL using their fair values and recognize fair value changes in profit or loss. Fair value changes from derivatives accounted for as part of an effective accounting hedge are recognized in profit or loss. Any interest expense incurred shall be recognized as part of “Finance costs” in profit or loss. This category includes the Group’s derivative liabilities. The Group has no liability accounted for under this category as of December 31, 2009 and 2008. Other Financial Liabilities. This category pertains to non-derivative financial liabilities that are not designated or classified as at FVPL. After initial measurement, other financial liabilities are carried at amortized cost using the effective interest rate method. Amortized cost is calculated by taking into account any premium or discount and any transaction costs that are considered an integral part of the effective interest rate of the liability. The Group’s accounts payable and other current liabilities are included in this category. The carrying values of financial liabilities under this category amounted to P115.7 million and P129.0 million as of December 31, 2009 and 2008, respectively (Note 14). Jointly Controlled Operations A jointly controlled operation is a joint venture carried on by each venturer using its own assets in pursuit of joint operations. The financial statements include the assets that the Group controls, the liabilities it incurs in the course of pursuing the joint operation and the expenses that the Group incurs and its share of the income that it earns from the joint operation. Inventories Saleable Slots This pertains to the remaining balance of the land and improvements which CCPC, a subsidiary, contributed to a joint venture with a third party. The joint venture is engaged in developing and marketing a real estate project. CCPC used the cost of land contributed to the joint ventures as cost of the inventory divided by the total square meters of the CCPC’s share in lots. Saleable Condominium Units and Parking Slots This pertains to the share in the joint venture allocated by DM Consunji, Inc, (DMCI) to the Parent Company in respect of the joint venture agreement. The Parent Company used the cost of land contributed to the joint venture as cost of the inventory divided by the total square meters of the units and parking slots allocated. Medical Supplies This pertains to the medical, laboratory and pharmacy supplies of FMCMI and FMCSRI. Costs represents purchase price determined using first-in, first-out method. Net realizable value is the estimated selling price in the ordinary course of business, less

- 11 -
the estimated costs of completion and the estimated costs necessary to make the sale. Property and Equipment Property and equipment are stated at cost net of accumulated depreciation and any impairment losses. The cost of an asset comprises its purchase price and directly attributable costs of bringing the asset to working condition for its intended use. Expenditures for additions, major improvements and renewals are capitalized; expenditures for repairs and maintenance are charged to expense as incurred. When assets are sold, retired or otherwise disposes of, their cost and related accumulated depreciation and impairment losses are removed from the accounts and any resulting gain or loss is recognized in profit or loss. Depreciation is computed on the straight-line basis over the estimated useful lives of the assets as follows:
Number of Years Building 30 Medical equipment 5 - 7 Transportation equipment 5 Office equipment, furniture and fixtures 3 - 5
Leasehold improvements are amortized over the estimated useful lives of the improvements of ten years or the term of the lease, whichever is lower. Construction in progress represents properties under construction and is stated at cost. This includes cost of construction and other direct costs. The account is not depreciated until such time that the assets are completed and available for use. An asset’s carrying amount is written down immediately to its recoverable amount if the asset’s carrying amount is greater that its estimated recoverable amount. The residual values and estimated useful lives of property and equipment are reviewed, and adjusted if appropriate, at each reporting date. An item of property and equipment is derecognized upon disposal or when no future economic benefits are expected to arise from the continued use of the asset. Any gain or loss arising on derecognition of the asset (calculated as the difference between the net disposal proceeds and the carrying amount of the item) is included in profit or loss in the year the item is derecognized. Investment Property Investment property is a property held either to earn rental or for capital appreciation or for both, but not for sale in the ordinary course of business, use in the production and supply of goods and services or for administrative purposes. Investment property is accounted for at cost, less impairment loss, if any. When the use of a property changes such that it is reclassified as property and equipment, its fair value at the date of reclassification become its cost for subsequent accounting. Capital Stock Ordinary shares are classified as equity. Incremental costs directly attributable to the issue of ordinary shares are recognised as a deduction from equity, net of any tax effects.

- 12 -
Provisions Provisions are recognized only when the Group has (a) a present obligation (legal or constructive) as a result of past event; (b) it is probable (i.e., more likely than not) that an outflow of resources embodying economic benefits will be required to settle the obligation; and (c) a reliable estimate can be made of the amount of the obligation. If the effect of the time value of money is material, provisions are determined by discounting the expected future cash flows at a pre-tax rate that reflects current market assessment of the time value of money and, where appropriate, the risks specific to the liability. Where discounting is used, the increase in the provision due to the passage of time is recognized as interest expense. Where the Group expects a provision to be reimbursed, the reimbursement is recognized as a separate asset but only when the receipt of the reimbursement is virtually certain. Revenue and Cost Recognition Revenue is recognized to the extent that it is probable that the economic benefits will flow to the Group and the revenue can be reliably measured. Interest - Income is recognized using the effective interest method. Real Estate Sale - Revenue is recognized using the full accrual method. Under this method, sale is recognized upon collection of 25% of the total contract price.
If the criterion under the full accrual method is not met, the deposit method is applied. Under this method, cash received from buyers are shown as Customers’ Deposits in the statement of financial position.
For tax reporting purposes, the Group uses the installment method wherein the gross profit on the installment payments actually received during the taxable year is subjected to income tax except for accounts whose collections have reached 25% of the total selling price in the year of sale, in which case, these would be taxable in full.
Gain on Sale of Assets - Gain on sale of assets is recognized when the risk and rewards of ownership of the goods have passed to the buyer. It is measured as the excess of the fair value of consideration received or receivable over the carrying value of the asset sold.
Dividend - Revenue is recognized when the Group’s right to receive the payment is established. Revenue is measured by reference to the fair value of consideration received or receivable by the Company for goods supplied and services provided, excluding value-added tax (VAT) and discounts. Cost and expenses are recognized in profit or loss upon utilization of the service or at the date these are incurred. Lease Payments Operating lease payments are recognized as expense in profit or loss on a straight-line basis over the lease term. Lease incentive received, if any, is considered an integral part of minimum lease payment over the term of the lease. Business Combination Business acquisitions are accounted for using the purchase method of accounting.
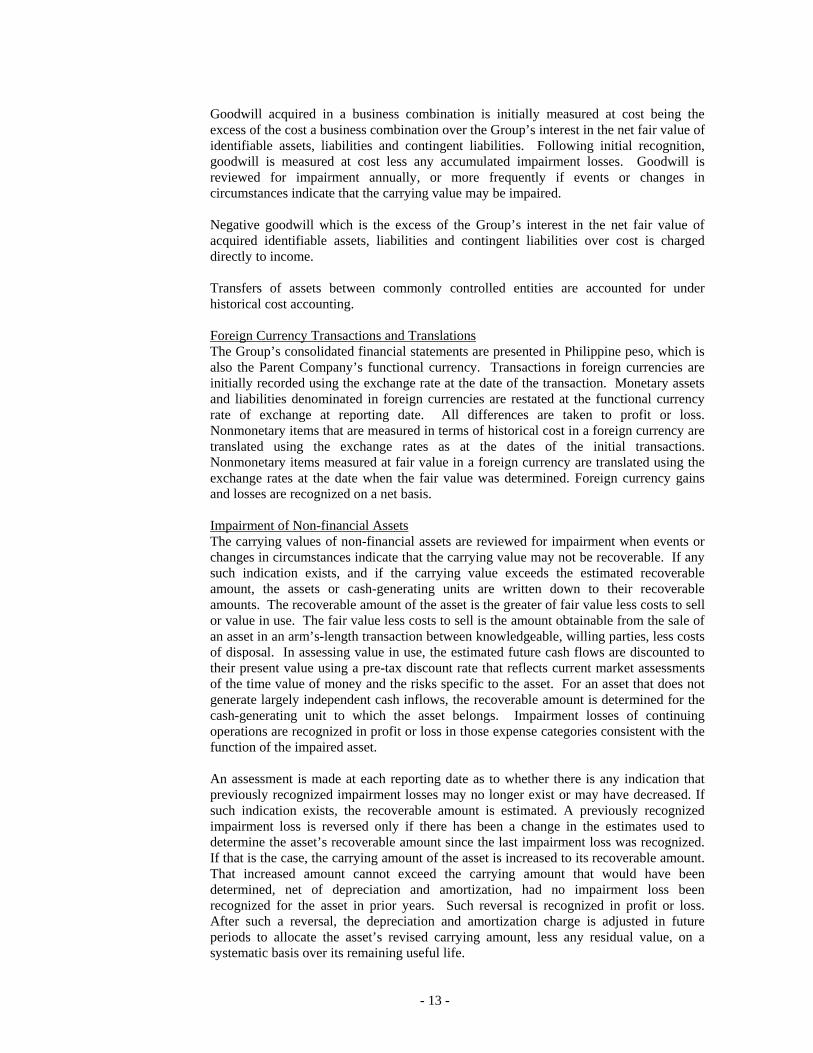
- 13 -
Goodwill acquired in a business combination is initially measured at cost being the excess of the cost a business combination over the Group’s interest in the net fair value of identifiable assets, liabilities and contingent liabilities. Following initial recognition, goodwill is measured at cost less any accumulated impairment losses. Goodwill is reviewed for impairment annually, or more frequently if events or changes in circumstances indicate that the carrying value may be impaired. Negative goodwill which is the excess of the Group’s interest in the net fair value of acquired identifiable assets, liabilities and contingent liabilities over cost is charged directly to income. Transfers of assets between commonly controlled entities are accounted for under historical cost accounting. Foreign Currency Transactions and Translations The Group’s consolidated financial statements are presented in Philippine peso, which is also the Parent Company’s functional currency. Transactions in foreign currencies are initially recorded using the exchange rate at the date of the transaction. Monetary assets and liabilities denominated in foreign currencies are restated at the functional currency rate of exchange at reporting date. All differences are taken to profit or loss. Nonmonetary items that are measured in terms of historical cost in a foreign currency are translated using the exchange rates as at the dates of the initial transactions. Nonmonetary items measured at fair value in a foreign currency are translated using the exchange rates at the date when the fair value was determined. Foreign currency gains and losses are recognized on a net basis. Impairment of Non-financial Assets The carrying values of non-financial assets are reviewed for impairment when events or changes in circumstances indicate that the carrying value may not be recoverable. If any such indication exists, and if the carrying value exceeds the estimated recoverable amount, the assets or cash-generating units are written down to their recoverable amounts. The recoverable amount of the asset is the greater of fair value less costs to sell or value in use. The fair value less costs to sell is the amount obtainable from the sale of an asset in an arm’s-length transaction between knowledgeable, willing parties, less costs of disposal. In assessing value in use, the estimated future cash flows are discounted to their present value using a pre-tax discount rate that reflects current market assessments of the time value of money and the risks specific to the asset. For an asset that does not generate largely independent cash inflows, the recoverable amount is determined for the cash-generating unit to which the asset belongs. Impairment losses of continuing operations are recognized in profit or loss in those expense categories consistent with the function of the impaired asset. An assessment is made at each reporting date as to whether there is any indication that previously recognized impairment losses may no longer exist or may have decreased. If such indication exists, the recoverable amount is estimated. A previously recognized impairment loss is reversed only if there has been a change in the estimates used to determine the asset’s recoverable amount since the last impairment loss was recognized. If that is the case, the carrying amount of the asset is increased to its recoverable amount. That increased amount cannot exceed the carrying amount that would have been determined, net of depreciation and amortization, had no impairment loss been recognized for the asset in prior years. Such reversal is recognized in profit or loss. After such a reversal, the depreciation and amortization charge is adjusted in future periods to allocate the asset’s revised carrying amount, less any residual value, on a systematic basis over its remaining useful life.

- 14 -
Retirement Costs The Group has an unfunded retirement liability based on the provisions of Republic Act (R.A.) No. 7641, The Philippine Retirement Law, covering substantially all of its employees.
The Group’s net obligation in respect of its retirement obligation is calculated by estimating the amount of future benefit that employees have earned in return for their service in the current and prior periods; that benefit is discounted to determine its present value, and the fair value of any plan assets, if any, is deducted. The discount rate is the yield at the reporting date of long-term government bonds that have maturity dates approximating the terms of the Group’s plan. The calculation is performed by a qualified actuary using the projected unit credit method. Actuarial gains and losses to the extent that any cumulative unrecognized actuarial gain or loss exceeds ten percent of the present value of the defined benefit obligation, that portion is recognized in profit or loss over the expected average working lives of the employees. Otherwise, the actuarial gain or loss is not recognized. Income Taxes Income tax expense comprises of current and deferred tax. Current and deferred tax are recognized in profit or loss except to the extent that it relates to items recognized directly to equity or in other comprehensive income. Current Tax. Current tax assets and liabilities are measured at the amount expected to be recovered from or paid to the taxation authorities. The tax rates used to compute the amount are those that are enacted or substantively enacted at reporting date. Deferred Tax. Deferred tax is recognized in respect of temporary differences between the carrying amount of assets and liabilities for financial reporting purposes and the amounts used for taxation purposes. Deferred tax assets are recognized for all deductible temporary differences, carryforward benefits of unused tax credits - Minimum Corporate Income Tax (MCIT) and unused tax losses - Net Operating Loss Carry Over (NOLCO), to the extent that it is probable that taxable profit will be available against which the deductible temporary differences, and the carryforward benefits of MCIT and NOLCO can be utilized. The carrying amount of deferred tax assets is reviewed at each reporting date and reduced to the extent that it is no longer probable that sufficient taxable profit will be available to allow all or part of the deferred tax asset to be utilized. Unrecognized deferred tax assets are reassessed at each reporting date and are recognized to the extent that it has become probable that future taxable profit will allow the deferred tax asset to be recovered. Deferred tax assets and liabilities are measured at the tax rates that are expected to apply in the year when the asset is realized or the liability is settled, based on tax rates that have been enacted or substantively enacted at reporting date. Deferred tax assets and deferred tax liabilities are offset, if there is a legally enforceable right to offset current tax assets against current tax liabilities and they relate to income taxes levied by the same tax authority.

- 15 -
Related Parties Parties are considered to be related if one party has the ability, directly or indirectly, to control the other party or exercise significant influence over the other party in making financial and operating decisions. Parties are also considered to be related if they are subject to common control or common significant influence. Related parties may be individuals or corporate entities. Contingencies Contingent liabilities are not recognized in the financial statements. They are disclosed unless the possibility of an outflow of resources embodying economic benefits is remote. Contingent assets are not recognized in the financial statements but are disclosed in the notes to the financial statements when an inflow of economic benefits is probable. Earning Per Share Earnings per share is computed by dividing net income by the weighted average number of common shares outstanding during the year, after retroactive adjustment for stock dividend declared in the current year, if any. Events after the Reporting Date Post-year end events that provide additional information about the Company’s position at reporting date (adjusting events) are reflected in the financial statements. Post-year end events that are not adjusting events are disclosed in the notes to the financial statements when material.
4. Risk Management Objectives and Polices Objectives and Policies The Company has significant exposure to the following financial risks primarily from its use of financial instruments:
• credit risk • liquidity risk • market risk
This note presents information about the Company’s exposure to each of the foregoing risks, the Company’s objectives, policies and processes for measuring and managing these risks, and the Company’s management of capital. The Company’s risk management is coordinated with the BOD, and focuses on actively securing the Company’s short-to-medium-term cash flows by minimizing the exposure to financial markets. Long-term financial investments are managed to generate lasting returns. The Company does not actively engage in the trading of financial assets for speculative purposes nor does it write options. Also, the Company has low exposure to interest rate risk since the Company’s existing financial assets have fixed interest risks to which the Company is exposed to are described below. Credit Risk Credit risk is the risk of financial loss to the Company if a customer or counterparty to a financial instrument fails to meet its contractual obligations, and arises principally from the Company’s trade receivables and investment securities.

- 16 -
Generally, the maximum credit risk exposure of financial assets is the carrying amount of the financial assets as shown on the face of the statement of financial position (or in the detailed analysis provided in the notes to the financial statements), as summarized below:
Note 2009 2008Cash and cash equivalents 6 P76,148,102 P211,448,536Installment contacts receivable 18 87,597,665 78,835,265Receivables and advances 8 75,038,518 45,817,373Financial assets at FVPL 7 14,750,636 8,710,098Advances to associates - net 10 255,863 1,691,887 P253,790,784 P346,503,159
The Group continuously monitors defaults of customers and other counterparties, identified either individually or by group, and incorporate this information into its credit risk controls. Where available at a reasonable cost, external credit ratings and/or reports on customers and other counterparties are obtained and used. The Group’s policy is to deal only with creditworthy counterparties. The Group’s installment contracts receivables, which are secured by land titles, are actively monitored to avoid significant concentration of credit risk. The table below shows the credit quality by class of financial assets as of December 31, 2009.
Neither Past Due nor Specifically Impaired Past Due or
High
Grade Standard
Grade Substandard
Grade Individually
Impaired Total Cash and cash equivalents P76,148,102 P - P - P - P76,148,102 Installment contracts receivable - - 87,597,665 - 87,597,665 Receivable and advances - - 75,175,504 - 75,175,504 Financial assets at FVPL - 14,750,636 - - 14,750,636 Advances to related parties - - 255,861 11,824,306 12,080,167 P265,752,074
This compares with the credit quality by class of financial assets as of December 31, 2008.
Neither Past Due nor Specifically Impaired Past Due or
High
Grade Standard
Grade Substandard
Grade Individually
Impaired Total Cash and cash equivalents P211,448,536 P - P - P - P211,448,536 Installment contracts receivable - 78,835,265 - - 78,835,265 Receivable and advances - 35,317,595 10,499,778 P8,048,013 53,865,386 Financial assets at FVPL - 8,710,098 - - 8,710,098 Advances to related parties - - 1,691,887 10,325,400 12,017,287 P211,448,536 P122,862,958 P12,191,665 P18,373,413 P364,876,572
None of the financial assets are secured by collateral or other credit enhancements. Liquidity Risk Liquidity risk pertains to the risk that the Company will encounter difficulty in meeting obligations associated with financial liabilities that are settled by delivering cash or another financial asset. The Company maintains cash to meets its liquidity requirements for up to 60-day periods. Excess cash are invested in short-term placements or equity securities.

- 17 -
As at December 31, the Company’s financial liabilities have maturities which are presented below:
2009 Within
6 months 6 - 12
Months Total Accounts payable and other current
liabilities P31,537,137 P83,294,113 P114,831,250 Due to a related party - 80,083,737 80,083,737 P31,537,137 P163,377,850 P194,914,987
2008 Within
6 months 6 – 12
Months Total Accounts payable and other current
liabilities P26,687,665 P102,333,459 P129,021,124 Due to a related party - 80,153,569 80,153,569 P26,687,665 P182,487,028 P209,174,693
The above contractual maturities reflect the gross cash flows, which may differ from the carrying values of the liabilities at the balance sheet dates. The contractual maturities of financial liabilities do not include subscriptions payable to SLPI, an associate, amounting to P42,158,700 in 2009 and 2008 (see Note 16), which do not bear interest and which are intended for the settlement of amounts due to the Group. Market Price Risk Market risk is the risk that changes in market prices, such as interest rates and other market prices will affect the Company’s income or the values of its holdings of financial instruments. The objective of market risk management is to manage and control market risk exposures within acceptable parameters, while optimizing return. The Group’s market risk is limited to its investments carried at fair value through profit or loss. The Group manages its risk arising from changes in market price by monitoring the changes in the market price of the investments. Fair value hierarchy The table below analyses financial instruments carried at fair value, by valuation method. The different levels have been defined as follows:
• Level 1: quoted prices (unadjusted) in active markets for identical assets or liabilities
• Level 2: inputs other than quoted prices included within Level 1 that are observable for the asset or liability, either directly (i.e., as prices) or indirectly (i.e., derived from prices)
• Level 3: inputs for the asset or liability that are not based on observable market data (unobservable inputs).
2009 Level 1 Level 2 Level 3 TotalFinancial Assets Financial assets at FVPL P14,750,636 P - P - P14,750,636
During the year, there were no transfers between Level 1 and Level 2 fair value measurements, and no transfers into and out of Level 3 fair value measurements.

- 18 -
Capital Management The Group sets the amount of capital in proportion to its overall financing structure, i.e., equity and financial liabilities. The Group manages the capital structure and makes adjustments thereon in the light of changes in economic condition and the risk characteristics of the underlying assets. In order to maintain or adjust the capital structure, the Group applied for capital restructuring to SEC, which had been approved on January 10, 2008, to reduce its deficit by the Group’s capital stock and additional paid in capital (APIC) (see Note 16). The Group monitors capital on the basis of the carrying amount of equity as presented on the face of the consolidated statement of financial position. Capital for the reporting periods under review is summarized as follows:
2009 2008Total liabilities P231,164,710 P254,281,652Total equity 1,648,689,349 1,497,767,591Debt-to-equity ratio 0.14:1 0.17:1
5. Segment Reporting Business Segments For management purposes, the Group is organized into three major business segments, namely real estate, investment holdings and healthcare services. These are also the basis of the Group in reporting its primary segment information. (a) The real estate segment involves acquisition of land, planning and developing
residential communities such as development and sale of condominium units and parking slots, residential lots and housing units. This segment includes the Group’s transactions with joint ventures.
(b) The investment holding creates project investments and later disposes these
investments after creating value. This also includes acquisition and sale of equity securities. This is the main operation of the Parent Group. Included in this segment are the Group’s transactions on investments in associates and trading of financial assets at fair value through profit and loss.
(c) Healthcare services involves in delivering outpatient health care service through
ambulatory care centers. This is the operation of the newly acquired subsidiaries of the Group.
Segment Assets and Liabilities Segment assets include all operating assets used by a segment and consist principally of operating cash, receivables, inventories and property and equipment, net of allowances and provision. Segment liabilities include all operating liabilities and consist principally of accounts, wages, taxes currently payable and accrued liabilities.

- 19 -
The following tables present revenue and profit information regarding business segments of the Group for the years ended December 31, 2009 and 2008 (except for Healthcare Services since this segment was only acquired in December 24, 2008) and certain assets and liability information regarding industry segments at December 31, 2009 and 2008 (in thousands).
Real
Estate Investment
Holdings Healthcare
Services Consolidated 2009 REVENUES P54,944 P19,112 P42,847 P116,903
RESULTS Segment results P6,733 P4,721 (P9,645) P1,809
Interest income 5,389 5,783 1 11,173 Decline in value of financial
assets - (5,468) - (5,468)Tax expense - - - (5,222)Net income P2,292
Attributable to: Parent Group’s shareholders P251 Minority interest 232
Net income P483
ASSETS AND LIABILITIES Segment assets P1,046,519 P1,978,543 P139,969 P3,165,031 Intangible assets - - - 28,236 Total assets P1,046,519 P1,978,543 P139,969 P3,193,267
Segment liabilities P721,091 P521,976 P252,850 P1,495,917
OTHER SEGEMENT INFORMATION
Depreciation (12) (1,926) (1,290) (3,228)Capital expenditure in property
and equipment - 99,070 - 99,070 Capital expenditure in
investment property 10,136 - - 10,136 Investment and advances in
associates - net - 367,788 - 367,788 Reversal of allowance for
decline in value of investment property 7,271 - - 7,271
Equity share in net losses - (3,525) - (3,525)
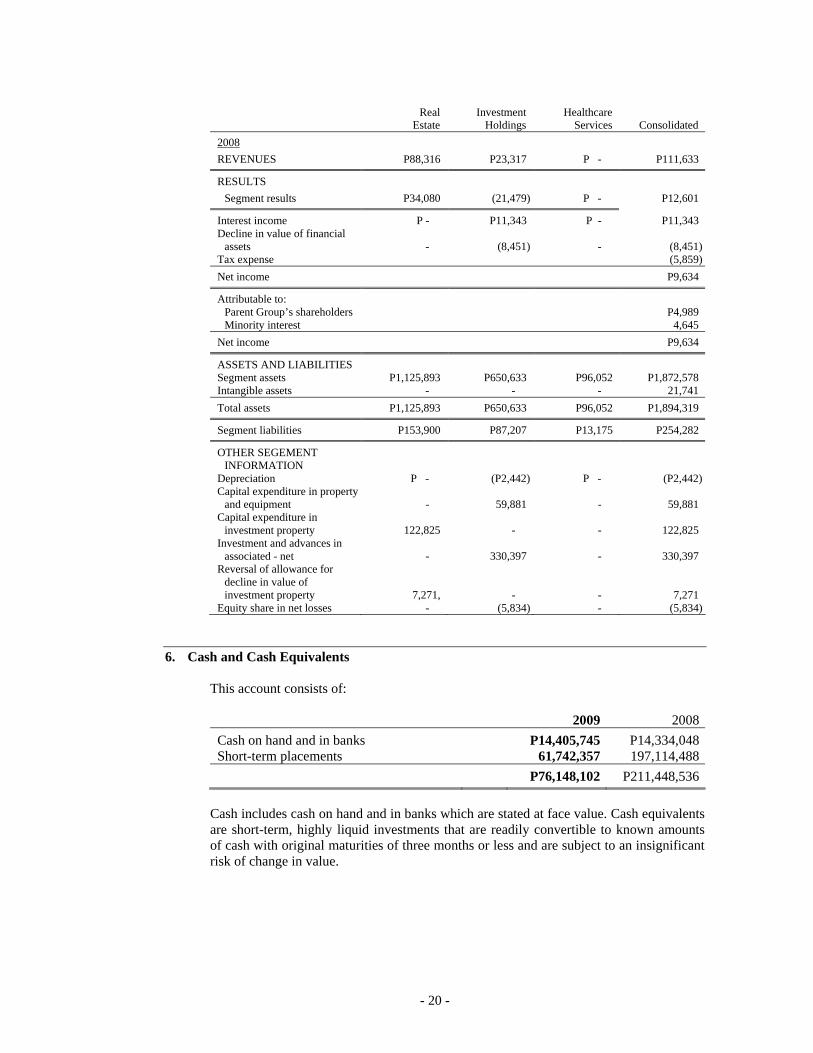
- 20 -
Real
Estate Investment
Holdings Healthcare
Services Consolidated 2008 REVENUES P88,316 P23,317 P - P111,633
RESULTS Segment results P34,080 (21,479) P - P12,601
Interest income P - P11,343 P - P11,343 Decline in value of financial
assets - (8,451) - (8,451)Tax expense (5,859)Net income P9,634
Attributable to: Parent Group’s shareholders P4,989 Minority interest 4,645
Net income P9,634
ASSETS AND LIABILITIES Segment assets P1,125,893 P650,633 P96,052 P1,872,578 Intangible assets - - - 21,741 Total assets P1,125,893 P650,633 P96,052 P1,894,319
Segment liabilities P153,900 P87,207 P13,175 P254,282
OTHER SEGEMENT INFORMATION
Depreciation P - (P2,442) P - (P2,442)Capital expenditure in property
and equipment - 59,881 - 59,881 Capital expenditure in
investment property 122,825 - - 122,825 Investment and advances in
associated - net - 330,397 - 330,397 Reversal of allowance for
decline in value of investment property 7,271, - - 7,271
Equity share in net losses - (5,834) - (5,834)
6. Cash and Cash Equivalents This account consists of:
2009 2008Cash on hand and in banks P14,405,745 P14,334,048Short-term placements 61,742,357 197,114,488 P76,148,102 P211,448,536
Cash includes cash on hand and in banks which are stated at face value. Cash equivalents are short-term, highly liquid investments that are readily convertible to known amounts of cash with original maturities of three months or less and are subject to an insignificant risk of change in value.

- 21 -
Cash accounts with the banks generally earn interest at rates based on daily bank deposit rates. Short-term placements are made for varying periods of between 30 to 35 days and earn effective interest ranging from 1% to 4.5% per annum in 2009 and 5% to 6.25% per annum in 2008. Total interest earned on cash in bank and short-term placements in 2009, 2008 and 2007 amounted to P4,684,473, P11,343,198 and P11,148,326, respectively, and presented as Interest Income account in profit or loss.
7. Financial Assets at Fair Value through Profit or Loss This account consists of equity securities listed and traded in the Philippine Stock Exchange. The fair values have been determined based on closing bid prices at reporting date. The Group recognized an increase (a decrease) in value of these financial assets of P5.47 million, (P8.45) million and (P0.30) million in 2009, 2008 and 2007, respectively, which are presented as unrealized gain (loss) in change in value of financial assets at FVPL. Actual gains (losses) from the sale of these securities amounted to (P0.33) million, (P0.24) million and P12.60 million in 2009, 2008 and 2007, respectively.
8. Receivables and Advances This account consists of:
Note 2009 2008Accounts receivables P28,344,635 P7,829,033Due from a developer 23,465,860 13,391,244Advances to Guild Securities, Inc. 17 11,191,211 12,064,318Advances to MTD Manila Expressway,
Inc. (MTDME) 7,429,374 7,429,374Loan receivable from FMCMI 2,891,904 - Construction bond 1,037,900 2,033,000Others 677,634 3,070,404 P75,038,518 P45,817,373
Trade receivables pertains to the sales proceeds from the sale of condominium units and parking slots not yet remitted by DMCI to the Parent Company (see Note 18), are non-interest bearing and are generally on a 30-day term. The Due from a Developer account pertains to the collection from installment contracts receivable which is not yet remitted by Sta. Lucia Realty and Development, Inc. (SLRDI). The unremitted collection arise since collection of payment of buyers is done by the Developer and then later deposits the collection to the joint bank account of the Group and SLRDI. The advances to Guild Securities, Inc. a stockbrokerage firm and also a stockholder of the Parent Company, relate to non interest bearing advances for purchases of trading securities, net of proceeds from related sales (see Note 17). The advances to MTDME is unsecured, non-interest bearing and with no definite repayment date.

- 22 -
The advances to FMCMI is unsecured, non-interest bearing and collectible within 12 months. Due to their short-term nature, the carrying amounts of the above financial assets approximate their fair value. No allowance for impairment losses on receivables and advances was recognized in 2009 and 2008.
9. Inventories This account consists of:
2009 2008Saleable lots P199,941,604 P218,870,499Saleable condominium unit and parking lots 114,956,889 76,600,041Medical supplies 1,954,768 2,658,844 P316,853,261 P298,129,384
Saleable lots pertains to the land located in Biñan, Laguna which is currently being sold and developed by SLRDI into Palma Real Residential Estates project, under a venture agreement with CCPC, a subsidiary. The balance of the saleable lots is equivalent to the cost of the unsold portion of the land. The movement of the saleable lots follows:
2009 2008
Lots in
square meters Amount Lots in
square meters Amount Saleable lots at beginning of
year 64,811 P218,870,499 73,252 P238,644,200 Cancelled contracts - - 542 1,793,315 Saleable house - 725,113 - 1,257,443 Other cost - - - 6,860,000 64,811 219,595,612 73,794 248,554,958 Cost of real estate sold (5,950) (19,654,008) (8,983) (29,684,459)Saleable lots at end of year 58,861 P199,941,604 64,811 P218,870,499
Saleable condominium units and parking slots pertains to the unsold portion of the Parent Company’s share of units and parking slots from the joint venture by DMCI. The movement of the saleable condominium units and parking slots follow:
2009 2008
Note
Area (Square Meters) Amount
Area (Square Meters) Amount
Cost of saleable condominium units and parking slots 11 4,016 P76,600,041 4,862 P92,735,550
Transfer from investment property 2,920 48,706,924 - - Cost of saleable condominium units
and parking slots sold during the year (537) (10,350,076) (846) (16,135,509)
Saleable condominium units and parking slots at end of year 6,399 P114,956,889 4,016 P76,600,041
The Group’s inventories are stated at cost.

- 23 -
10. Investments in and Advances to Associates
The breakdown of this account follows:
2009 2008Investment in associates P92,240,332 P95,702,285Deposit for future stock subscription 243,128,373 233,002,530Advances to associates 255,863 1,691,887 P335,624,568 P330,396,702
The breakdown of the Group’s investment in associates follows:
Amount
Accumulated Equity
in Net Losses Net Amount 2009 Investment at equity
SLPI P100,000,000 (P100,000,000) P - AAHDC 101,536,055 (9,358,601) 92,177,454 e*Hermes 800,000 (737,122) 62,878
P202,336,055 (P110,095,723) P92,240,332
Amount
Accumulated Equity
in Net Losses Net Amount 2008 Investment at equity
SLPI P100,000,000 (P100,000,000) P - AAHDC 101,536,055 (5,833,770) 95,702,285 e*Hermes 800,000 (800,000) -
P202,336,055 (P106,633,770) P95,702,285 On December 24, 2008, the Group made additional investment amounting to P31,707,877, in HSAPI resulting to an increase in the Group’s ownership from 47% in 2007 to 74% in 2008 and which earned the Group’s control over HSAPI (see Note 1). The acquisition resulted to a goodwill amounting to P21,740,604, representing the excess of cost amounting to P31,707,877 over the fair value of net assets of HSAPI amounting P9,967,273 at the time of acquisition. The Group recognized equity share in net loss form AAHDC amounting to P3,524,831 and P5,833,770 as of December 31, 2009 and 2008, respectively.

- 24 -
The breakdown of the Group’s deposit for future stock subscription and advances in associates follow:
Note Amount Allowance for Impairment Net Amount
2009 Deposit for future stock
subscription of SLPI P317,688,141 (P74,559,768) P243,128,373
Advance to associates: e*Hermes P10,388,278 (P10,388,278) P - SLPI 1,436,026 (1,436,026) - AAHDC 255,863 - 255,863
P12,080,167 (P11,824,304) P255,863
Note Amount Allowance for
Impairment Net Amount 2008 Deposit for future stock
subscription of SLPI P317,688,141 (P84,685,611) P233,002,530
Advance to associates: e*Hermes P10,325,400 (P10,325,400) P - SLPI 1,436,026 - 1,436,026 AAHDC 255,861 - 255,861
18 P12,017,287 (P10,325,400) P1,691,887
The unabsorbed net loss of the respective associates follows:
2009 2008SLPI P9,129,587 P46,633,205e*Hermes 57,659 4,937,801 P9,187,246 P51,571,006
A reconciliation of the allowance for impairment at beginning and end as of December 31, 2009, 2008 and 2007 are shown below:
2009 2008 2007Balance at beginning of year:
Allowance for impairment on deposit for future stock subscription of SLPI P84,685,611 P84,685,611 P84,685,611
Allowance for impairment on advance to associates 10,325,400 25,912,171 25,912,171
95,011,011 110,597,782 110,597,782Eliminated impairment loss on
advances to newly acquired subsidiary (HSAPI) - (21,869,640) -
Impairment loss on advances to associates during the year 1,498,904 6,282,869 -
Balance at end of year P96,509,915 P95,011,011 P110,597,782

- 25 -
The following summarizes the financial position and financial performance of the Group’s associates as of December 31:
Total Assets Total liabilities Net Income
(Loss)2009
SLPI P593,544,949 P86,595,266 P18,259,173 AAHDC 278,360,198 6,737,272 (15,325,352)e*Hermes 21,207 10,388,278 (57,569)
2008 SLPI P571,345,921 P9,435,826 (P3,030,274)AAHDC 335,112,724 31,755,776 (25,364,220)e*Hermes 15,898 35,000 (85,978)
11. Investment Properties The Group’s investment properties pertain to certain parcels of land held for future development and land subject of the joint venture agreements, which are accounted for by the Group using the cost model. The changes to the carrying amounts can be summarized as follow as of December 31:
2009 2008Cost P720,049,888 P765,821,577Allowance for impairment (63,783,574) (63,783,574) P656,266,314 P702,038,003
The land in Barangay Fort Bonifacio, Taguig City is the subject of the joint venture agreement entered into by the Parent Company and FBMCI, a subsidiary and DMCI in 2005 for the development, construction and sale of three condominium buildings which shall be called Cypress Project. In 2008, the Parent Group reclassified the units and cost of investment properties amounting to P92,735,550 as saleable condominium units and parking slots since there was already an allocation of units for the share of the Parent Company in the joint venture (see Note 18). A reconciliation of the carrying values of investment properties at beginning and end as of December 31 are shown below:
Note 2009 2008Balance at beginning of year P765,721,577 P800,887,257Additions 69,285,200 122,824,578Reclassified to property and equipment - (65,154,708)Reclassified to saleable condominium
units and parking slots 9 (114,956,889) (92,735,550)Balance at end of year P720,049,888 P765,721,577

- 26 -
A reconciliation of the allowance for impairment at beginning and end as of December 31 are shown below:
2009 2008Balance at beginning of year P63,783,574 P71,054,074Reversal of allowance for impairment - (7,270,500)Balance at end of year P63,783,574 P63,783,574
The Group recognized a recovery in value of the land held for future development amounting to P7,270,500 in 2008. The total appraised values of the Group’s investment properties in 2009 and 2008 amounted to P833,830,100 and P914,710,208 as determined by independent appraisers. The appraised values were determined through the inspection of property and investigation of local market condition with consideration to the extent, character and utility of property, sales and holding prices of similar land and highest and best use of the property.

- 27 -
12. Property and Equipment The movements in this account are as follows:
Land
Building Medical
Equipment
Office Equipment,
Furniture and Fixtures
Transportation Equipment
Leasehold Improvements
Construction in Progress Total
Cost January 1, 2008 P - P - P - P1,572,759 P13,135,659 P - P - P14,708,418 Additions 65,154,708 - 9,164,769 2,056,966 - 109,067 68,504,301 144,989,811 Disposals - - - - (1,200,000) - - (1,200,000)December 31, 2008 65,154,708 - 9,164,769 3,629,725 11,935,659 109,067 68,504,301 158,498,229 Additions - 27,248,974 1,224,369 874,914 12,521,342 57,200,660 99,070,259 Disposals - - - - (350,000) - - (350,000)December 31, 2009 65,154,708 27,248,974 10,389,138 4,504,639 11,585,659 12,630,409 125,704,961 257,218,487
Accumulated depreciation January 1, 2008 - - - 1,465,309 5,651,009 - - 7,116,318 Additions - - - 84,791 2,357,132 - - 2,441,923 Disposals - - - - (700,000) - - (700,000)December 31, 2008 - - - 1,550,100 7,308,141 - - 8,858,241 Additions - 181,660 2,107,214 939,200 1,880,314 408,728 - 5,517,116 Disposals - - - - (350,000) - - (350,000)December 31, 2009 - 181,660 2,107,214 2,489,300 8,838,455 408,728 - 14,025,357
Carrying amount: December 31, 2008 P65,154,708 P - P9,164,769 P2,079,627 P4,627,518 P109,067 P68,504,301 P149,636,989
December 31, 2009 P65,154,708 P27,067,314 P8,281,923 P2,015,340 P2,747,204 P 12,221,681 P 125,704,961 P 243,193,130
Construction in progress pertains to the construction of building in Bel-Air Village, Makati City which is expected to be completed in January 2010. Part of the building is intended to be used as the new administrative office of the Company and the other areas will be held for lease.

- 28 -
13. Other Non-current Assets This account consists of:
2009 2008Input Value Added Tax (VAT) P42,020,838 P33,373,887Others 4,857,726 2,521,676 P46,878,564 P35,895,563
14. Accounts Payable and Other Current Liabilities This account consists of:
2009 2008Payable on purchase of land P19,513,781 P55,193,064Accrued expenses 15,794,217 19,980,097Customers’ deposits 28,789,760 18,739,180Trade payables 13,177,620 11,993,459Due to DMCI 15,742,920 6,707,566Due to GCV Management 6,003,035 6,006,095Other current liabilities 15,809,917 10,401,663 P114,831,250 P129,021,124
Due to their short duration, the carrying amounts of accounts payable and other current liabilities recognized in the balance sheets represent reasonable approximation of their fair values. Customers’ deposits pertain to payments received from buyers of condominium units and parking slots which had not reached the 25% of the total contract price. In 2008, the Group made reversals of other payables amounting to P10,305,437 since it had ascertained that these are no longer demandable.
15. Subscription Payable Subscription payable refers to the unpaid subscriptions (with no specific payment date, bears no interest, and callable anytime) of the Group to SLPI, an associate, as of December 31, 2009 and 2008.
16. Equity Capital Restructuring In June and August 2007, the Group’s BOD and stockholders, respectively, approved a capital restructuring requiring the application of the Group’s APIC to the outstanding deficit as of December 31, 2006 amounting to P628,699,604. This capital restructuring was approved by the SEC on January 10, 2008. To conform with the substance of the capital restructuring, the Group effected the same at the end of 2007.

- 29 -
The effects of the capital restructuring on the Group’s equity as of December 31, 2007 follow: (a) Decrease in authorized capital stock from P3,000,000,000 dividend into
3,000,000,000 shares with par value of P1 each to P2,400,000,000 dividend into 2,400,000,000 shares with par value of P1 each.
(b) Decrease in subscribed capital stock from P1,699,999,995 to P1,359,999,996, which
resulted in the P339,999,999 decrease in the paid up capital from P1,670,146,815 to P1,330,1460,816.
(c) The P339,999,999 decrease in the paid up capital and the existing APIC of
P407,269,879 was applied against the December 31, 2006 deficit of P628,699,604, resulting to a remaining APIC of P118,570,274. The remaining APIC of P118,570,214 shall not be used to wipe out losses that may be incurred in the future without prior approval of the SEC.
(d) Reduction of par value per share from P1 to P0.10 resulting in the following (i) the
increase in number of authorized common shares from 2,400,000,000 to 24,000,000,000; (ii) the increase in the number of subscribed common shares from 1,359,999,996 to 13,599,999,960; and (iii) the increase in the number of paid up common shares from 1,330,146,816 to 13,301,468,160.
(e) With the approval of the decrease in authorized capital and the capital restructuring, a
stockholder who owns one common share with par value of P1 each will now have eight common shares with par value of P0.10 each. For resulting fractional shares, however, the Group has adopted the policy of rounding-up each fractional share.
Stock Option Plan The Group has a stock option plan, which entitles directors and executive officers of the Group to purchase shares of stock of the Parent Company at par value or book value, whichever is higher. The underlying shares subject to the stock option plan covers 2,400,000,000 common shares representing 10% of the authorized capital stock of the Parent Company. The option shares shall be subject to vesting according to such schedule as shall be approved by the BOD, provided that vesting shall lapse after five years from entitlement date, and provided further that with respect to executive officers, vesting shall expire upon their resignation from the Group. The number of underlying common shares in respect of outstanding options and/or the exercise price shall be correspondingly adjusted in the event of any stock dividend declaration, stock split, merger, consolidation, or the similar or analogous change in the corporate structure or capitalization of the Group. The terms and conditions of the stock option plan may be amended by the resolution of the BOD, except that any increase in the maximum number of shares or any decrease in the exercise price shall require the approval of stockholders representing at least two-thirds of the outstanding capital stock. No stock option was granted from the time the plan was approved.

- 30 -
17. Related Party Transactions The Group’s related parties included its associates, the Group’s key management, and others as described below. Due to a Related Party This account represent mainly the amount payable to Solid Share Holdings, Inc. (SSHI), a shareholder of CCPC, pertaining to cash advances amounting to P80,202,613 and P80,153,569 as of December 31, 2009 and 2008, respectively, used by CCPC to finance the acquisition and development of the land located in Biñan, Laguna and for payments of various administrative expenses. Total payments to SSHI amounted to P7,668,040 in 2009 and P11,000,000 in 2008. These advances are non-interest bearing and do not have specific repayment terms. Advances to Guild Securities Guild Securities, Inc., a stockholder is also the Parent Company’s broker in its trading of equity securities. The Group provides advances for future purchases of investment which is later netted from the proceeds in the trading of equity securities. This account was included under Receivable and advances in the consolidated statement of financial position. The movements in the advances are shown below.
Note 2009 2008Balance at beginning of year P12,064,318 P18,732,758Buying transactions (4,432,265) (15,079,048)Selling transactions 3,563,982 8,352,442Others (4,824) 58,166Balance at end of year 8 P11,191,211 P12,064,318
Advances to Related Parties In the normal course of business, the Parent Company grants advances to its related companies for working capital requirements, and for the payment of pre-operating expenses with no specific repayment terms. This account was included under Investments in and advances to associates in the consolidated statement of financial position. The movements of advances follow:
Note 2009 2008Balance at beginning of year P12,017,288 P131,296,522Additions 62,879 55,502Reclassification - (119,334,736)Balance at end of year 11 P12,080,167 P12,017,288

- 31 -
Key Management Personnel Compensation Salaries and other benefits given to key management personnel are as follows:
2009 2008 2007Salaries and wages P925,200 P925,200 P925,20013th month and other bonuses 37,032 37,032 37,032Social security services and
other contributions 16,365 16,365 16,365 P978,597 P978,597 P978,597
18. Jointly Controlled Operation Joint Venture with DMCI In 2005, the Parent Company entered into a Memorandum of Agreement (the Agreement) with DMCI wherein the Parent Company together with FBMCI shall contribute land where DMCI will develop and construct three condominium buildings to be called The Cypress Project. DMCI shall be responsible for completion of the project and for all expenditure and liabilities that may arise upon the course of the project. The initial agreement had been subject to changes as transactions were negotiated. To date, the parties have thus far agree that (a) the Parent Company and FBMCI shall contribute the land; (b) DMCI shall be responsible for the development, construction and sale of condominium units; and (c) the Parent Company and FBMCI share in the project is equivalent to 9.3% and 6.3%, respectively, of the total saleable condominium units and parking slots. Sales were made from the allocated units to the Parent Company and FBMCI, however, it had been mutually agreed that all proceeds of sales will be recognized by the Parent Company first before FBMCI will receive its share. The Parent Company recognized in its 2009 and 2008 financial statements its share of the assets, liabilities, revenues and expenses in the joint venture in accordance with the Agreement. Joint Venture Agreement with SLRDI On October 23, 2003, the CCPC entered into a Memorandum of Agreement (the Agreement) with the SLRDI (the Developer) wherein the CCPC shall contribute land and the improvements thereon, while the Developer shall be responsible for completing the development of the Palma Real Residential Estates project in Biñan, Laguna (the Project) and for all expenses necessary in preparing the lots into its saleable unit (see Note 11). The Agreement has the following significant provisions, among others: a. The Developer shall be solely liable for any and all expenses to be incurred in the
construction and development to be introduced by SLRDI on the Project SLRDI shall also shield the CCPC from any claim that may be raised by any government agency, sub-contractor, supplier or third party in connection with the development of the Project.
b. The CCPC shall be paid 60% of the sales proceeds while SLRDI shall be paid 40%
of the sales proceeds. The CCPC and SLRDI shall shoulder the corresponding taxes on their respective share of proceeds;
c. The proceeds from the sale of lots shall be deposited in the joint bank account of the
CCPC and SLRDI; and

- 32 -
d. The CCPC and SLRDI shall nominate a marketing manager that will handle the sale
of lots in the Project. The marketing manager shall present a marketing plan to the CCPC and SLRDI.
The Project started selling lots in 2004. The Group recognized in its 2008 and 2007 consolidated financial statements its share of the assets, liabilities, revenues and expenses in the joint venture in accordance with the Agreement. The Group paid P3,932,039, P5,777,912 and P1,503,907 (amounts net of VAT) to the Marketing Managers for the years ended December 31, 2009 and 2008, respectively, representing the latter’s share in the marketing management fee, which is shown as Commission in profit or loss. Commissions paid to the Marketing Managers amounting to P3,932,039 in 2009 and P5,025,335 in 2008 on accounts which were not classified as sales and regarded only as customer’s deposit were recorded as prepaid commission which was included in the Other Current Assets in the consolidated statement of financial position. The Group’s earned revenues from joint ventures follow:
Joint Venture
with SLRDIJoint Venture
with DMCI Total2009 Real estate sales P32,766,991 P22,176,940 P54,943,931Interest income 5,388,936 1,100,218 6,489,154 P38,155,927 P23,277,158 P61,433,085
Joint Venture
with SLRDIJoint Venture
with DMCI Total2008 Real estate sales P47,813,926 P31,046,571 P78,860,497Interest income 2,120,616 63,934 2,184,550 P49,934,542 P31,110,505 P81,045,047
Joint Venture
with SLRDIJoint Venture
with DMCI Total2007 Real estate sales P32,719,977 P - P32,719,977Interest income 2,305,414 - 2,305,414 P35,025,391 P - P35,025,391
The Group’s receivable arising from real estate sales with these joint ventures follow:
Joint Venture
with SLRDIJoint Venture
with DMCI Total2009 Installment contracts receivable
Current P27,587,840 P5,458,366 P33,046,206Non-current 43,116,311 11,435,148 54,551,459
P70,704,151 P16,893,514 P87,597,665

- 33 -
Joint Venture
with SLRDIJoint Venture
with DMCI Total2008 Installment contracts receivable
Current P34,578,699 P4,371,698 P38,950,397Non-current 33,364,993 6,519,875 39,884,868
P67,943,692 P10,891,573 P78,835,265 As of December 31, 2009, there were no outstanding contingent liabilities and commitments with respect to the joint venture agreement.
19. Other Income This account consists of:
Note 2009 2008 2007Unrealized gain (loss) in
net change in value of financial assets at FVPL P5,468,385 P - P -
Reversal of other payables - 10,305,437 - Unrealized foreign
exchange gain (loss) (107,211) 719,211 (844,054)Reversal of impairment
loss on investment property - 7,270,500 6,685,246
Gains on sale of investment in stocks of MTDME - - 26,200,000
Gain (loss) from trading securities (325,863) (239,468) 12,601,730
Others 2,229,456 1,188,965 2,011,004 P7,264,767 P19,244,645 P46,653,926
In February 2007, the Group invested in stocks of MTDME for P170.0 million. This was pursuant to the agreement with MTD Equity Sdn Bhd (MTDE) in 2005, granting the Group an option to subscribe to a maximum of five percent (5%) of the equity of MTDME. In October 2007, the investment was subsequently sold to MTD Bahrain Holding Group WLL for P196.2 million, resulting to a gain of P26.2 million. Capital gains tax paid related to the sale of the investment amounted to P2.6 million. Capital gains tax paid related to the sale of the investment amounted to P2.6 million and is included as part of Income Tax Expense account in the 2007 statement of income.

- 34 -
20. Cost of Sales and Services This account consists of:
2009 2008 2007Materials, supplies and facilities P5,203,913 P - P - Rent 6,076,415 - - Salaries and employee benefits 5,432,992 - - Depreciation and amortization 2,286,281 - - Others 5,028,674 - - P24,028,275 P - P -
21. Other Operating Expenses Other operating expenses incurred include the following:
2009 2008 2007Communication, light and water P1,139,608 P508,234 P420,142Impairment losses on receivables 1,072,490 - - Supplies 799,153 295,479 145,003Transportation and travel 768,513 697,853 832,351Repairs and maintenance 544,138 499,464 59,558Security services 338,838 616,071 667,410Association dues 286,122 288,230 249,354Listing fees - 1,520,000 200,000Impairment loss on land held for
future development - net of recovery - - 9,285,871
Unrealized foreign exchange loss - - 844,054Others 9,500,879 3,529,116 2,754,143 P14,449,741 P7,954,447 P15,457,886
22. Employee Benefits Expenses recognized for employee benefits are presented below:
2009 2008 2007Salaries and wages P9,749,262 P3,007,642 P2,692,647Social security costs 1,259,193 160,644 138,57613th month and other bonuses 1,241,954 266,070 229,181Retirement benefit expense 992,744 276,093 249,756Compensated absences 308,164 28,583 67,890Other benefits 1,449,397 430,666 601,594 P15,000,714 P4,169,698 P3,979,644

- 35 -
The amounts of retirement benefit obligation recognized in the consolidated balance sheets are determined as follows:
2009 2008Present value of the obligation P4,003,194 P3,019,196Net unrecognized actuarial gains (loss) (62,191) (70,937)Retirement benefit obligation P3,941,003 P2,948,259
The amounts of retirement benefit expense recognized in the consolidated profit or loss are as follows:
2009 2008 2007Current service costs P660,331 P140,541 P137,483Interest costs 323,668 123,995 97,710Net actuarial loss recognized
during the year 8,744 11,557 14,563 P992,743 P276,093 P249,756
The movements in the retirement benefit obligation recognized in the books are as follows:
2009 2008Balance at beginning of year P2,948,260 P1,209,958Retirement benefit obligation of acquired
subsidiary - 1,462,208Expense recognized 992,743 276,093Balance at end of year P3,941,003 P2,948,259
In determining the retirement benefit obligation, the following actuarial assumptions were used:
2009 2008 2007 Discount rates 9.79% 9.79% 7.37% Expected rate of salary increases 5.00% 5.00% 5.00%
23. Taxes The major components of tax expense in the consolidated profit or loss for the years ended December 31 are as follows:
2009 2008 2007Current tax expense:
Final tax at 20% and 7.5% P274 P2,214,937 P4,316,732MCIT at 2% - 652,337 137,321Regular corporate income tax
(RCIT) at 35% 5,280,500 3,270,530 - Benefit from application of
MCIT against RCIT - (278,238) - Tax expense reported in the
consolidated profit or loss P5,280,774 P5,859,566 P4,454,053

- 36 -
The reconciliation of tax on pretax income computed at the applicable statutory rates to tax expense attributable to continuing operations is as follows:
2009 2008 2007Income before income tax P6,869,312 P15,493,527 P34,898,526
Tax on pretax income at 35% P4,221,067 P5,422,735 P12,214,484Adjustments for income subjected
to lower income tax rates - (1,672,215) (12,241,904)Tax effects of:
Unrecognized deferred tax assets (liabilities) 4,697,629 (2,736,085) 4,386,744
Benefit from previously unrecognized net operating loss carry-over (NOLCO) (67,342) (110,269) 148,835
Expired NOLCO 345,272 - - Expired MCIT 186,515 - - Applied MCIT (1,029,847) - - Interest Income subject to Final
Tax (1,409,165) - - Non-taxable income (1,781,204) (131,730) (78,372)Non-deductible expenses 117,849 5,087,130 24,266
Tax expense reported in the consolidated statement of income P5,280,774 P5,859,566 P4,454,053
The Group did not recognize the deferred tax assets relating to temporary differences as of December 31, 2009 and 2008 since management does not expect the Group have sufficient taxable profit that will be available against which the deferred tax assets can be utilized. The amounts of the deferred tax assets arising from deductible temporary differences that were not recognized by the Group as of December 31 are shown below:
2009 2008 Amount Tax Effect Amount Tax Effect Allowance for impairment
on advances to related parties P363,422,150 P109,026,645 P195,811,008 P58,743,302
Unamortized pre-operating expenses - - 141,062,483 42,318,745
Allowance for impairment on receivables 27,759,835 8,327,951 19,969,486 5,990,846
Unrealized gross profit from installment sales 15,509,935 4,652,981 8,894,170 2,668,251
NOLCO 26,691,583 8,007,475 8,007,750 2,402,325 Retirement benefit
obligation 3,637,462 1,091,239 3,137,359 941,208 MCIT 341,530 341,530 1,144,081 1,144,081 Accrued Rent Income (195,566) (58,670) - - Unrealized foreign
exchange gain 107,211 32,163 (719,210) (215,763) P437,274,140 P131,421,314 P377,307,127 P113,992,995

- 37 -
The Group is subject only to final tax in 2007, tax expense represents MCIT in 2008 and 2006 which is computed at 2% of gross income, as defined under the tax regulations. The Group’s MCIT, which can be applied as a deduction from income tax payable up to three years, is as follows:
Year Amount Valid Until 2008 P652,337 2011 2007 171,189 2010
P823,526 Total NOLCO applied by the Group to taxable income amounted to P11,712,948. The breakdown of the Group’s remaining NOLCO, which can be claimed as a deduction from future taxable income within three years from the year the taxable loss was incurred is shown below:
Year Amount Valid Until 2009 P10,688,786 2012 2008 3,165,836 2011 2007 3,642,129 2010
P17,496,751 On May 24, 2005, Republic Act No. 9337 entitled “An Act Amending the National Internal Revenue Code, as Amended, with Salient Features” (Act), was passed into a law effective November 1, 2005. Among others, the Act includes the following significant revisions to the rules of taxation: a. Change in the corporate income tax rates from 32% to 35% starting November 1,
2005 and 30% starting January 1, 2009 and onwards; b. Change in interest expense disallowed as deductible expense by an amount
equivalent to a certain percentage of the interest income subjected to final tax as follows: 42% starting November 1, 2005 and 33% starting January 1, 2009 and onwards; and
c. Grant of authority to the Philippine President to increase the 10% VAT rate to 12%
effective February 1, 2006, subject to compliance with certain economic conditions.
24. Basic/Diluted Earnings Per Share Basic/diluted earnings per share amounts are computed as follows:
Note 2009 2008 2007 Net income attributable to
shareholders P249,713 P4,988,979 P30,734,985 Divided by weighted average
number of outstanding common shares 16 13,599,999,960 13,599,999,960 13,599,999,960
Basic/diluted earnings per share P0.00002 P0.00037 P0.00226

- 38 -
For comparative purpose, the effects of the capital restructuring at the end 2007 was retroactively applied in the computation of the Group’s basic earnings per share. As a result of the capital restructuring, the par value per share decreased from P1.00 to P0.10 and the total number of outstanding common shares increased from 1,699,999,995 shares to 13,599,999,960 (see Note 17). The Group does not have dilutive or potential dilutive shares as of December 31, 2009, 2008 and 2007.

1
COVER SHEET S.E.C. Registration Number
C R O W N E Q U I T I E S , I N C . A N D
S U B S I D I A R I E S
(Group's Full Name)
4 t h F l o o r , C r o w n C e n t e r ,
1 5 8 J u p i t e r c o r n e r N . G a r c i a
S t r e e t s , M a k a t i C i t y
1 2 2 6 P h i l i p p i n e s (Business Address : No. Street Group / Town / Province)
Eugene Macalalag Contact Person Group Telephone Number
1 2 3 1 A A F F S Month Day FORM TYPE Month Day
Annual Meeting
Secondary License Type, If Applicable
Dept. Requiring this Doc. Amended Articles Number/Section
Total Amount of Borrowings
Total No. of Stockholders Domestic Foreign
To be accomplished by SEC Personnel concerned
File Number LCU
Document I.D. Cashier
S T A M P S
Remarks = pls. use black ink for scanning purposes.
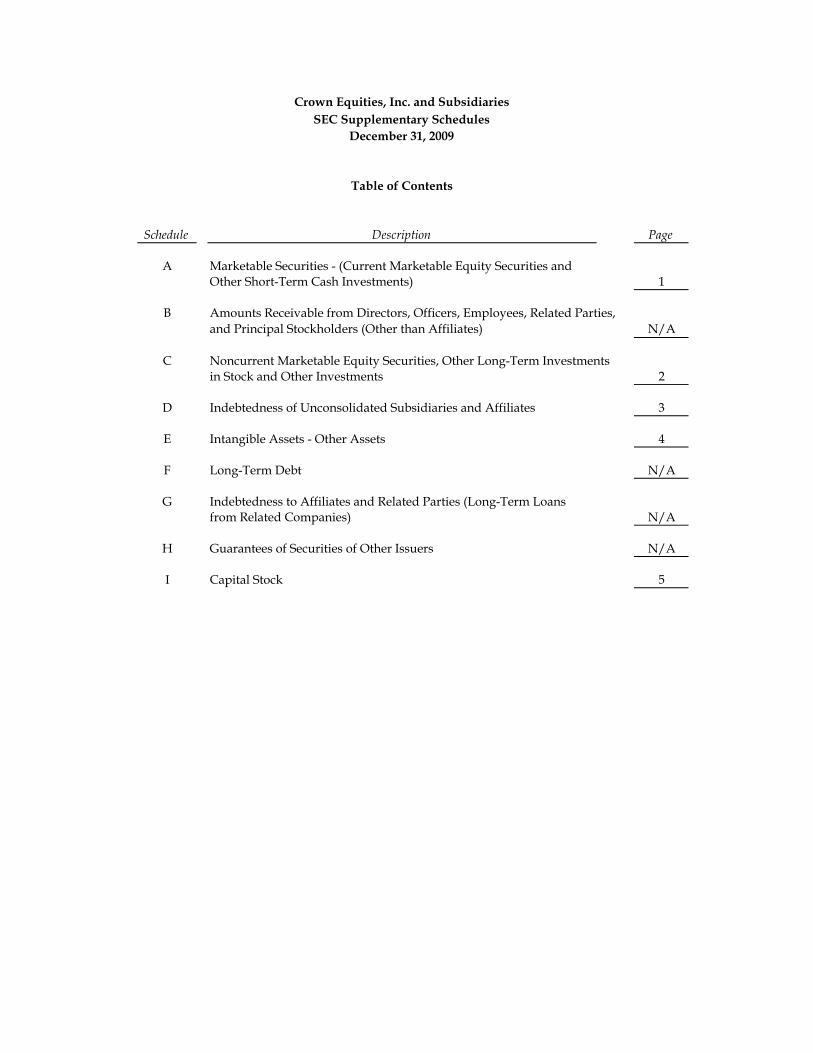
Crown Equities, Inc. and SubsidiariesSEC Supplementary Schedules
December 31, 2009
Table of Contents
Schedule Description Page
A Marketable Securities - (Current Marketable Equity Securities and Other Short-Term Cash Investments) 1
B Amounts Receivable from Directors, Officers, Employees, Related Parties,and Principal Stockholders (Other than Affiliates) N/A
C Noncurrent Marketable Equity Securities, Other Long-Term Investmentsin Stock and Other Investments 2
D Indebtedness of Unconsolidated Subsidiaries and Affiliates 3
E Intangible Assets - Other Assets 4
F Long-Term Debt N/A
G Indebtedness to Affiliates and Related Parties (Long-Term Loansfrom Related Companies) N/A
H Guarantees of Securities of Other Issuers N/A
I Capital Stock 5

Schedule A - Marketable Securities(Current Marketable Equity Securities and Other Short-Term Cash Investments)
Name of issuing Amount shown entity & association Number of on the balance
of each issue shares sheet*
Ayala Corp - Preferred Shares 4,000 428,000.00Ajo Net Holdings, Inc. 15,100,000 664,400.00Asiatrust Development Bank 10,000 53,000.00BDO Leasing and Finance, Inc. 190,000 250,800.00Basic Energy Corp. 3,333 516.62Southeast Asia Cement 9,999 8,599.14Digital Telecom 170,000 234,600.00Export and Industry Bank, Inc. 3,310,000 860,600.00Empire East Land Inc. 4,900,000 2,107,000.00Filinvest Land Inc. 1,524,000 1,371,600.00Holcim Philippines, Inc. 50,000 240,000.00Metropolitan Bank & Trust Co. 10,000 450,000.00Manila Water Company, Inc. 85,000 1,338,750.00National Reinsurance Corp 1,145,000 1,786,200.00Oriental Petroleum & Mineral “A” 64,600,000 904,400.00Oriental Petroleum & Mineral “B” 19,600,000 274,400.00Philippine Estate Corporation 1,000,000 105,000.00Philippine National Bank 19,000 460,750.00Shang Properties, Inc. 307,000 540,320.00Suntrust Home Developers 1,690,000 811,200.00Swift Foods, Inc. 1,100,000 159,500.00Union Bank of the Phils 25,000 925,000.00Vulcan Industrial 1,100,000 682,000.00Vista Land & Lifescapes Inc 50,000 94,000.00
14,750,636P
*Shown in the balance sheet as Financial Assets at fair value through profit or loss Values are based on market quotation at balance sheet date
Crown Equities, Inc. and Subsidiaries
December 31, 2009

Equity in net Excess of Dividends received Name of issuing Number of shares losses of equity in Number of shares from investments
entity & the or principal amount Amount investee for the net loss or principal amount Amount not accounted by description of investment of securities in pesos period over cost Others of securities in pesos* equity method
Investments at equity:Sky Leisure Prop., Inc. 50.00% - - - - 50.00% - - e*Hermes, Inc. 40.00% - - - 62,878 P 40.00% 62,878 - Asian Alliance Holdings & Development Corporation 23.00% 95,702,285 3,524,831 P - - 23.00% 92,177,454 -
95,702,285 P 3,524,831 P - 62,878 P 92,240,332 P -
* Amount shown is part of Investments in and Advances to Related Parties account in the balance sheet.
Crown Equities, Inc. and SubsidiariesSchedule C - Non-Current Marketable Equity Securities, Other Long-Term Investments in Stock, and Other Investments
December 31, 2009
Additions/(Deductions) Ending Balance Beginning balance
P P
P
P

Name of Related Parties Balance at beginning of year
Balance at end of year
Sky Leisure Properties, Inc. 1,436,026 P 1,436,026 P Asian Alliance Holdings & Dev't Corp. 255,861 255,861 e*Hermes, Inc. 10,325,400 10,388,278
12,017,287 12,080,165 Allowance for impairment 10,325,400 )( 11,824,304 )(
1,691,887 P 255,861 P * *Amount shown is part of Investments in and Advances to Related Parties account in the balance sheet
Crown Equities, Inc. and SubsidiariesSchedule D
December 31, 2009
Indebtedness of Unconsolidated Subsidiariesand Related Parties (Other than Affiliates)
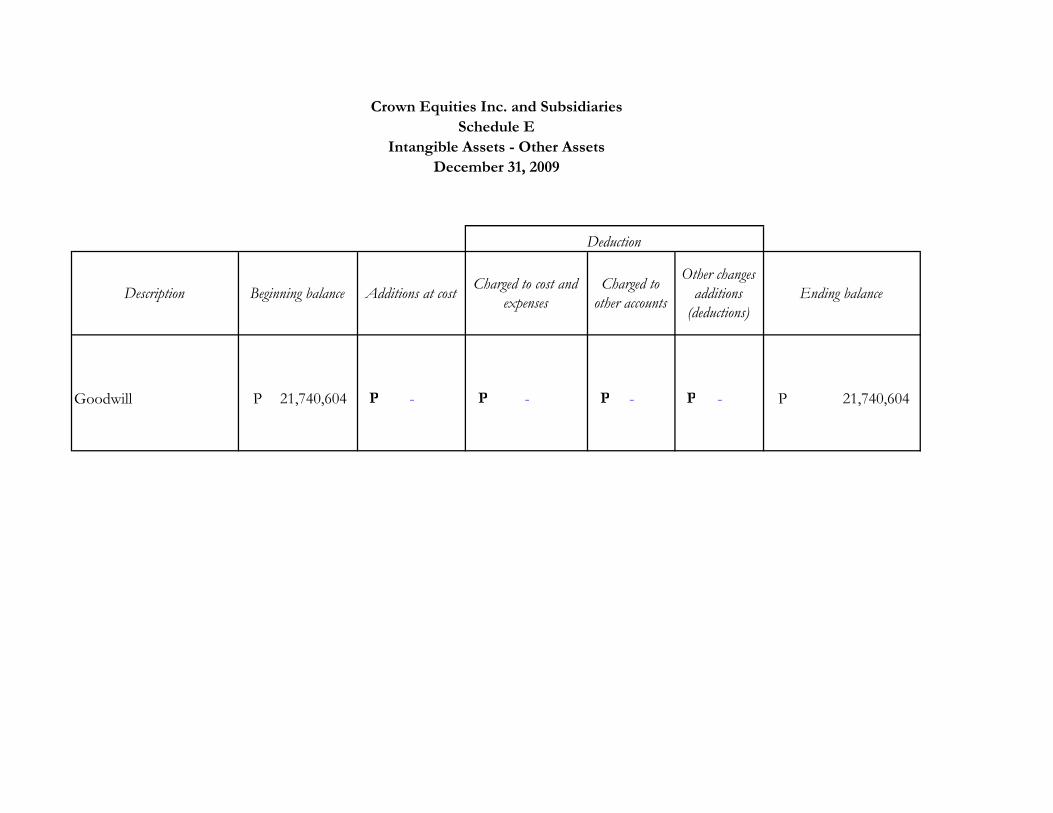
Description Beginning balance Additions at cost Charged to cost and expenses
Charged to other accounts
Other changes additions
(deductions)Ending balance
Goodwill 21,740,604 P - - - - 21,740,604 P
Crown Equities Inc. and Subsidiaries
December 31, 2009Intangible Assets - Other Assets
Schedule E
Deduction
P P PP

Title of Issue Number of shares authorized
Number of shares issued and outstanding as shown under the related balance
sheet caption
Number of shares reserved for options,
warrants, coversion and other rights
Related parties Directors, officers and employees* Others
Common Stock 24,000,000,000 13,599,999,960 - - 513,510,568 13,086,489,392
* includes indirectly held but beneficially owned shares
Crown Equities, Inc. and SubsidiariesSchedule I - Capital Stock
December 31, 2009
Number of shares held by