1 effect of temperature low temperature –enzymatic reactions too slow; enzymes too stiff –lipid...
Post on 21-Dec-2015
227 views
TRANSCRIPT

1Effect of temperature
• Low temperature– Enzymatic reactions too slow; enzymes too stiff– Lipid membranes no longer fluid
• High temperature– Enzymes denature, lose shape and stop functioning– Lipid membranes get too fluid, leak– DNA denatures
• As temperature increases, reactions and growth rate speed up; at max, critical enzymes denature.

2Bacteria and temperature
• Bacteria have temperature ranges (grow between 2 temperature extremes), and an optimal growth temperature. Both are used to classify bacteria.
• As temperature increases, so do metabolic rates.• At high end of range, critical enzymes begin to
denature, work slower. Growth rate drops off rapidly with small increase in temperature.

3Classification of bacteria based on temperature

4Terms related to temperature
• Special cases:– Psychrotrophs: bacteria that grow at “normal”
(mesophilic) temperatures (e.g. room temperature” but can also grow in the refrigerator; responsible for food spoilage.
– Thermoduric: more to do with survival than growth; bacteria that can withstand brief heat treatments.

5pH Effects
• pH = -log[H+]
• Lowest = 0 (very acid); highest = 14 (very basic) Neutral is pH 7.
• Acidophiles/acidotolerant grow at low pH
• Alkalophiles/alkalotolerant grow at high pH
• Most bacteria prefer a neutral pH– What is pH of human blood?
• Some bacteria create their preferred conditions– Lactobacillus creates low pH environment in vagina

6Low water activity:halophiles, osmophiles, and xerotolerant
• Water is critical for life; remove some, and things can’t grow. (food preservation: jerky, etc.)
• Halophiles/halotolerant: relationship to high salt.– Marine bacteria; archaea and really high salt.
• Osmophiles: can stand hypertonic environments whether salt, sugar, or other dissolved solutes– Fungi very good at this; grandma’s wax over jelly.
• Xerotolerant: dry. Subject to desiccation. Fungi best– Bread, dry rot of wood– Survival of bacterial endospores.

7Miscellaneous conditions
• Radiation (solar, UV, gamma)– Can all damage cells; bacteria have pigments to
absorb energy and protect themselves.– Endospores are radiation resistant.– Deinococcus radiodurans: extremely radiation
resistant• Extremely efficient DNA repair, protection against
dessication damage to DNA.
• Barophiles/barotolerant: microbes from deep sea
– Baro- means pressure. Actually require high pressure as found in their environment.

8Bacterial growth defined
• Since individual cells double in size, then divide into two, the meaningful increase is in the population size.
• Binary fission: cell divides into two cells. No nucleus, so no mitosis.
• Cells do not always fully detach; produce pairs, clusters, chains, tetrads, sarcina, etc.
• “GROWTH” = increase in number of bacteria

9Mathematics of bacterial growth
• Because bacteria double in number at regular intervals, they grow exponentially:
• N = N0 x 2n where N is the number of cells after n number of doublings and N0
is the starting number of cells.
• Thus, a graph of the Log of the number of bacteria vs. time is a straight line.

10The Bacterial Growth Curve
• Bacteria provided with an abundant supply of nutrients will increase in number exponentially, but eventually run out of nutrients or poison themselves with waste products.
0
2
4
6
8
1 0
1 2
1 4
1 6
0 2 4 6 8 1 0 1 2 1 4 1 6 1 8 2 0
time
log
(#
of
bac
teri
a)
1
23 4
1. Lag phase2. Exponential or
Log phase3. Stationary
phase4. Decline or
Deathphase.

11Growth curve (continued)
• Lag phase: growth lags; cells are acclimating to the medium, creating ribosomes prior to rapid growth.
• Log phase: cells doubling at regular intervals; linear graph when x-axis is logarithmic.
0
2
4
6
8
1 0
1 2
1 4
1 6
0 2 4 6 8 1 0 1 2 1 4 1 6 1 8 2 0
time
log
(# o
f bac
teria
)
•Stationary phase: no net increase in cell numbers, some divide, some die. Cells preparing for survival.•Decline phase: highly variable, depends on type of bacteria and conditions. Death may be slow and exponential.

12More about Growth
• The Growth curve is true under ideal conditions; in reality, bacteria are subject to starvation, competition, and rapidly changing conditions.
• Generation time: the length of time it takes for the population to double.
0
5
10
15
20
25
30
35
1 2 3 4 5 6
•Growth of bacteria is nonsynchronous, not every bacterium is dividing at the same time.
•Instead of stepwise curve, smooth curve

13Measurement of growth
• Direct methods: cells actually counted.– Petroff-Hausser
counting chamber (right), 3D grid. Count the cells, multiply by a conversion factor.
– Dry a drop of cells of known volume, stain, then count.
• Coulter-counter: single-file cells detected by change in electric current.
14Measurement of growth -2
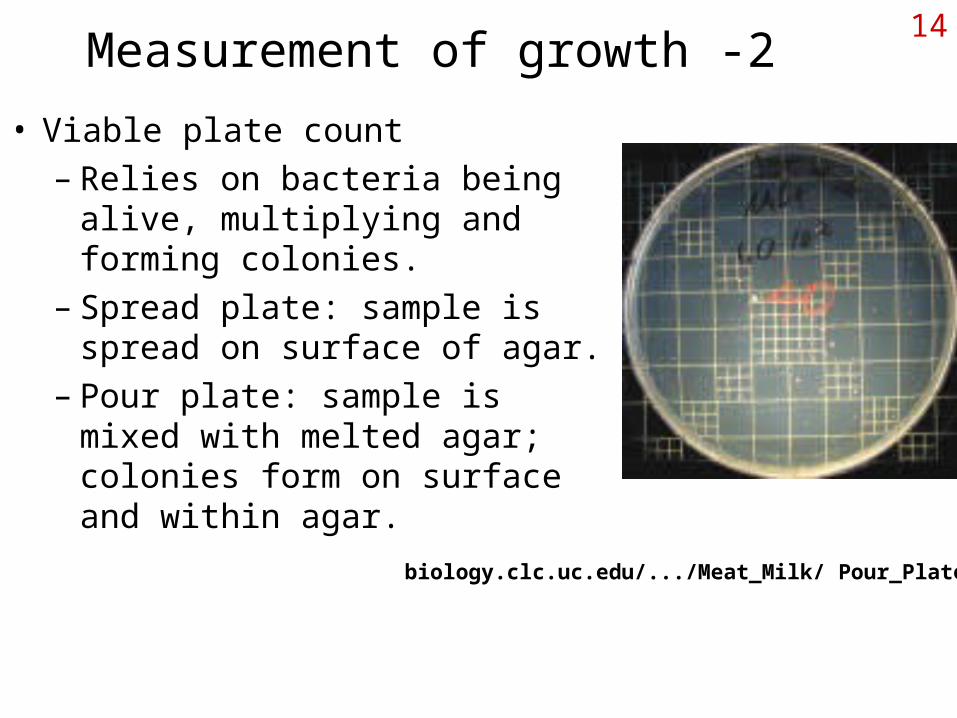
• Viable plate count– Relies on bacteria being alive,
multiplying and forming colonies.
– Spread plate: sample is spread on surface of agar.
– Pour plate: sample is mixed with melted agar; colonies form on surface and within agar.
biology.clc.uc.edu/.../Meat_Milk/ Pour_Plate.htm

Coulter Counter15
Coulter-counter: single-file cells detected by change in electric current.

16Filtration:
http://dl.clackamas.cc.or.us/wqt111/coliform-8.jpg
http://www.who.int/docstore/water_sanitation_health/labmanual/p25bs.jpg
•Membrane filters are very thin with a defined pore size, e.g. 0.45 µm.
•Bacteria from a dilute sample are collected on a filter; filter placed on agar plate, colonies counted.

17Spectrophotometry
• Bacteria scatter light, making a turbid (cloudy) suspension.
• Turbidity is usually read on the Absorbance scale– Not really absorbance, but Optical Density (OD)
• More bacteria, greater the turbidity (measured as OD)
Based on www.umr.edu/~gbert/ color/spec/Aspec.html

18More about Spectrophotometry
– Does NOT provide an actual number unless a calibration curve (# of bacteria vs. O.D.) is created.• Indirect counting method
– Quick and convenient, shows relative change in the number of bacteria, useful for determining growth (increase in numbers).
– Does NOT distinguish between live and dead cells. To create a calibration curve, best to plot OD vs. number of cells determined with microscope (not plate count).

Exponential growth
• “Balanced growth”– Numbers of bacteria are doubling at regular
intervals.– All components of bacteria are increasing in amount
at the same rate• 2x as many bacteria = 2x as much protein, 2x as
much peptidgolycan, 2x as much LPS, etc.– During exponential growth, bacteria are not limited
for any nutrients, i.e. they are not short of anything.
19

20Biomass: • Measure the total mass of cells or amount of any
component such as protein, PS, DNA, KDO.• Especially when cells are doubling,
the amounts of all the components of a cell are increasing at the same rate, so any could be measured.– Not so in stationary phase.
In this example, total biomass increases exponentially over time.
http://www.pubmedcentral.nih.gov/pagerender.fcgi?artid=242188&pageindex=10#page