1 energy efficiency program performance metrics workshop california public utilities commission...
TRANSCRIPT

1
Energy Efficiency Program Performance Metrics Workshop
California Public Utilities Commission
Energy Division
June 19th, 2009
2
Agenda1. Purpose of Workshop & Introductions2. Purpose of Measuring IOU Program Performance3. Definition & Characteristics of Performance Metrics4. Process for Designing Performance Metrics - Emerging Technologies
Program Case Study5. Energy Division Model for IOU Performance Metrics Design6. Developing Performance Metrics for Integrated Demand Side Programs -
Group Exercise7. Energy Division Proposed Process for Review & Approval of IOU
Program Performance Metrics8. Summary Table of 2009-11 IOU Proposed Program Performance Metrics9. Discussion & Summary10. Next Steps
PURPOSE OF THE WORKSHOPSection 1
3
Purpose of Workshop
Obtain stakeholder feedback concerning:• Model for IOU designing of program
performance metrics system• Internal process for CPUC review and approval
of IOU proposed EE program performance metrics
• Purpose for developing program performance metrics
4

PURPOSE OF MEASURING IOU PROGRAM PERFORMANCE
Section 2
5

Why Performance Measurement?
Identify program performance metrics against which to measure if the IOUs programs are moving towards the "defined end points" of the short term steps, milestones and objectives adopted in the California Energy Efficiency Strategic Plan (CEESP).
6

Strategic Plan Decision (D. 08-09-040)"The Commission will take action by the end
of 2009, or when the IOU 2009-2011 portfolio's are approved, whichever is sooner, on the remaining issues that need to be addressed in market transformations. This includes, at a minimum, identifying the process to track progress towards defined end points for program efforts and progress metrics." (p.10)
7
October 30, 2008 Ruling in Application Proceeding 08-07-021
“We now require the utilities to revise the 2009-2011 energy efficiency program applications with significantly enhanced or new program designs and strategies that clearly identify utility actions for all Strategic Plan near term strategies and action steps for which a utility role is identified as appropriate.”
8
October 30, 2008 Ruling in Application Proceeding 08-07-021 (Cont.)
“The utilities shall also demonstrate that their 2009-2011 energy efficiency programs reflect the short-term steps and milestones laid out in the Strategic Plan for the programmatic initiatives identified in D. 07-01-032 and for each sector or cross-cutting action area.”(p.19)
9

Purpose of Measuring Performance Metrics
Performance Metrics are intended to produce objective, relevant information on program performance that can be used to:
• Strengthen Management• Inform Decision Making• Achieve Results• Improve Overall Performance• Increase Accountability
10

Purpose of Program Performance Metrics (Cont.)
Program Performance Metrics can be used internally and externally for:
• Program Monitoring and Reporting• Strategic Planning• Budgeting and Financial Management• Program Management and Evaluation
• Performance Management• Quality Improvement / Process Improvement• Contract Management• External Benchmarking• Public Communication
11
DEFINITION & SUCCESS CRITERIA OF PROGRAM PERFORMANCE METRICS
Section 3
12

13
Definition of Program Performance Metrics
•Performance metrics are objective, quantitative indicators of various aspects of the performance of public programs or agencies. •Performance measurements are incorporated
into the process of defining, observing, and using such metrics.
14
Types of Performance MetricsQuality performance metrics allow for the collection of meaningful data for trending and analysis of rate-of-change over time. Examples are:
• Trending against known standards:
The standards may come from either internal or external sources and may include benchmarks
• Trending with standards to be established:
Usually this type of metric is used in conjunction with establishing a baseline
• Milestones achieved

15
Types of Performance Metrics - (Cont.)• Yes/No metrics are used in certain situations usually
involving establishing trends, baselines, or targets, or in start-up cases. Because there is no valid calibration of the level of performance for this type of measure, the should be used sparingly. Examples are:
Establish/implement a system Reporting achieved (without analyses) System is in place (without regard to effectiveness) Analysis performed (without criteria)

16
• Valid and Reliable• Meaningful and Understandable• Balanced and Comprehensive• Clear Regarding Preferred Direction of Movement• Timely and Actionable• Resistant to Goal Displacement• Cost-Sensitive (Non-Redundant)
Success Criteria for Program Performance Metrics
17
Determining the Quality of Performance Metrics
The following questions serve as a checklist to determine the quality of the performance metrics that have been defined:
• Is the metric objectively measurable?
• Does the metric include a clear statement of the end results expected?
• Does the metric support program requirements, including compliance issues where appropriate?
• Does the metric focus on effectiveness and/or efficiency of the system being measured?
• Does the metric allow for meaningful trend or statistical analysis?

18
Determining the Quality of Performance Metrics - Cont.• Have appropriate industry or other external standards been
considered?• Does the metric include milestones and/or indicators to
express qualitative criteria?• Are the metrics challenging but at the same time attainable?• Are assumptions and definitions specified for what constitutes
satisfactory performance?• Have those who are responsible for the performance being
measured been fully involved in the development of this metric or at least made aware of them?

• Performance indicators are performance measures defined operationally in terms of how the measure is actually taken or how the data are collected.
• Reliability is a matter of how objective, precise, and defendable they are.
• Validity concerns appropriateness to the extent to which an indicator is directly related to and representative of the performance dimension of interest.
Determining the Quality of Performance Metrics - Cont.
Validity and Reliability
19

Determining the Quality of Performance Metrics - Cont.
Validity of Performance Indicators
• Face validity• Consensual validity• Correlation validity• Predictive validity
20

PROCESS FOR DESIGNING PROGRAM PERFORMANCE METRICS
Section 4
21

Designing Program Performance Metrics The Process
The first step in developing performance metrics is to involve the people who are responsible for the work to be measured because they are the most knowledgeable about the work. Once these people are involved:
•Identify critical work processes and program requirements•Identify critical results desired and align them to program design and requirements (CEESP, BBEES, CPUC EE Goals)•Develop measurements for the critical work processes and critical result•Establish performance goals, standards, or benchmarks
22

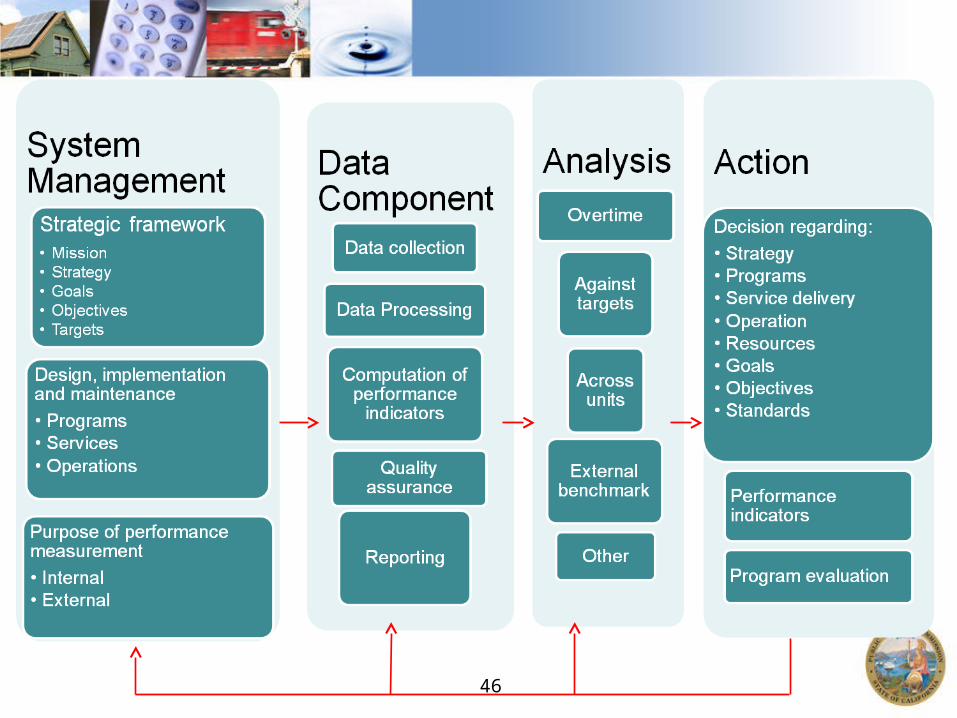
Designing Performance Metrics
23

Linking Objectives & Strategies: CEESP & EE Programs
24

Program Mission
Refers to the basic purpose of a program, its reason for being, and the general means through which it will accomplishes its purpose
25

ETP Mission
The mission of the Emerging Technologies Program (ETP) is to support increased energy efficiency market demand and technology supply (the term supply encompassing breadth, depth, and efficacy of product offerings) by contributing to development and deployment of new and underutilized energy efficiency (EE) measures (that is, technologies, practices, and tools), and by facilitating their adoption as measures supporting California’s aggressive energy and demand savings goals.
26

Program Goals
General statements about the results to be produced by the program
27
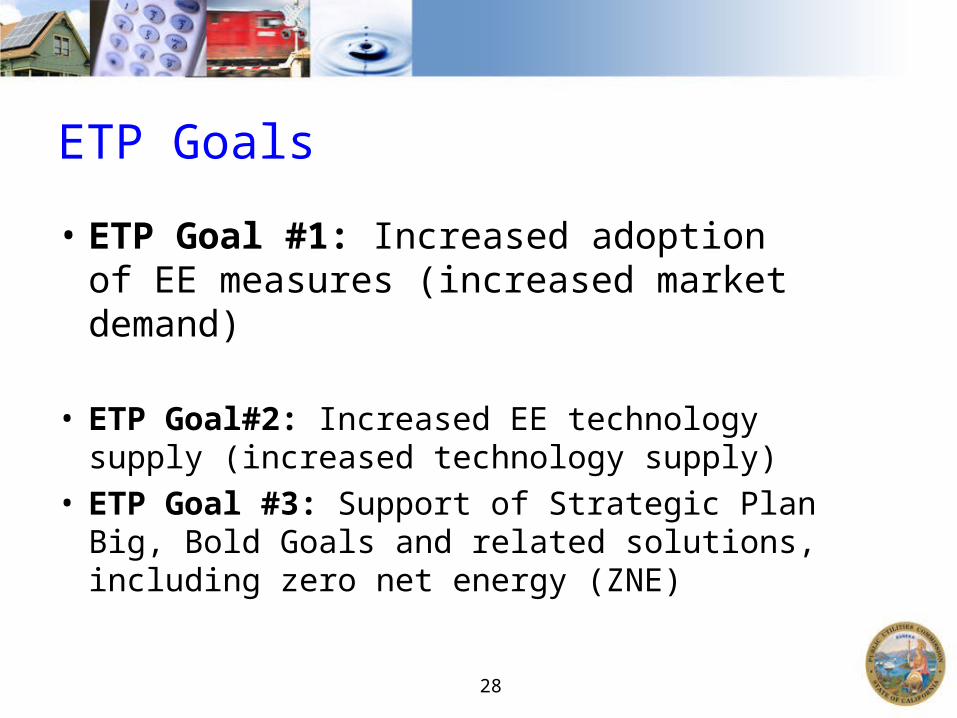
ETP Goals
• ETP Goal #1: Increased adoption of EE measures (increased market demand)
• ETP Goal#2: Increased EE technology supply (increased technology supply)
• ETP Goal #3: Support of Strategic Plan Big, Bold Goals and related solutions, including zero net energy (ZNE)
28

Program Objectives
• Specific milestones/targets to be achieved in order to accomplish the goals
• SMART convention• Specific in terms of the results to be achieved• Measurable• Ambitious• Realistic• Time-bound
29
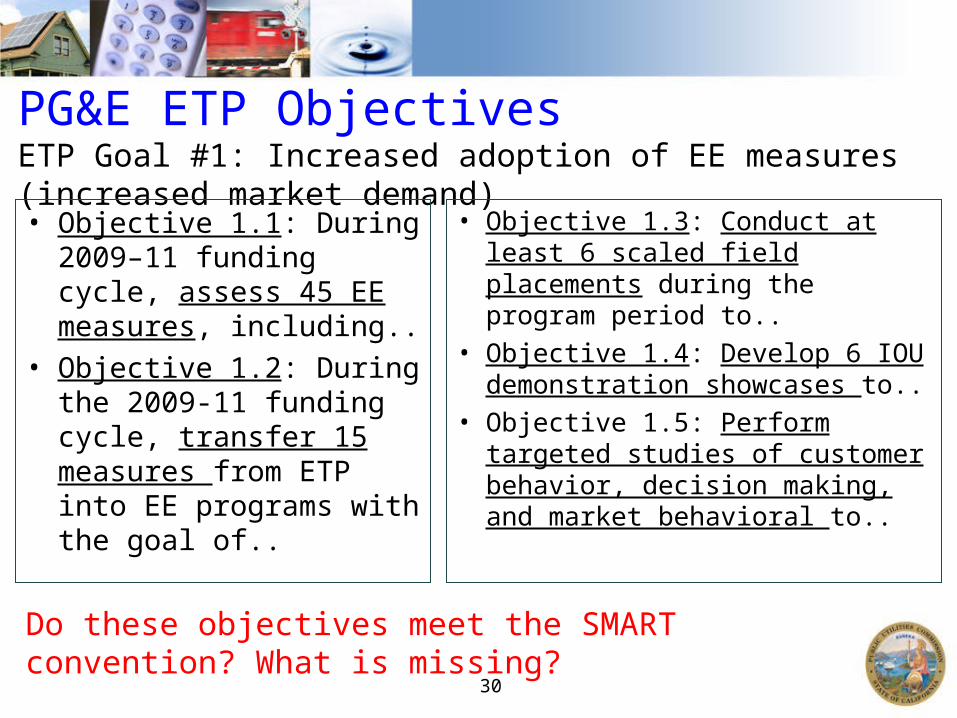
PG&E ETP ObjectivesETP Goal #1: Increased adoption of EE measures (increased market demand) • Objective 1.1: During
2009–11 funding cycle, assess 45 EE measures, including..
• Objective 1.2: During the 2009-11 funding cycle, transfer 15 measures from ETP into EE programs with the goal of..
• Objective 1.3: Conduct at least 6 scaled field placements during the program period to..
• Objective 1.4: Develop 6 IOU demonstration showcases to..
• Objective 1.5: Perform targeted studies of customer behavior, decision making, and market behavioral to..
Do these objectives meet the SMART convention? What is missing?
30

Program Theory & Logic Model (PT/LM)
31
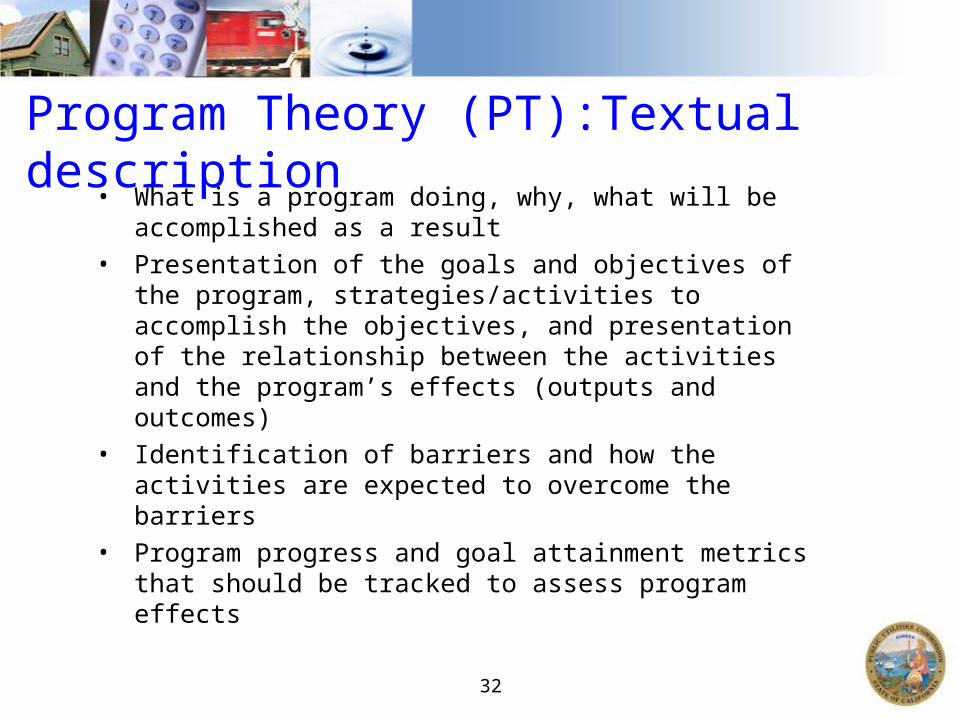
Program Theory (PT):Textual description• What is a program doing, why, what will be
accomplished as a result• Presentation of the goals and objectives of the
program, strategies/activities to accomplish the objectives, and presentation of the relationship between the activities and the program’s effects (outputs and outcomes)
• Identification of barriers and how the activities are expected to overcome the barriers
• Program progress and goal attainment metrics that should be tracked to assess program effects
32

Logic Model (LM): Graphical Representation of PT • LM shows the flow between program
activities, their outputs, and subsequent short-term, intermediate, and long-term outcomes
• Flow presented by arrows linking these elements
• Display of external influences
33

Outputs versus Outcomes• Outputs represent what a program actually
does • High-quality and efficient• Critical for achieving intended outcomes• Example: amount of work performed or volume of
activities completed
• Outcomes represent what results a program produce • Effectiveness and success• Short-term, intermediate and long-term• Program effects• External influences 34

2006-2008 Emerging Technologies Program Logic Model
Final PG&E Model 07/11/08
Ou
tpu
tsS
ho
rt T
erm
O
utc
om
es
Mid
Te
rm
Ou
tco
me
sL
on
g T
erm
O
utc
om
es
Act
iviti
es Phase II
Opportunity Assessment
(ETOS - Screening)
Phase I Opportunity Assessment (Scanning)
Prioritized List of Potential New
Technologies
Portfolio of Planned Assessments Aligned with Market Segment and Technology Goals
Assess New/Underutilized Technology
(Assessment)
Technology Assessment
Document(s)
Increased IOU Knowledge and Reduced Perceived Performance
Uncertainties about Technology
Disseminate Information about
Technology Assessment (Transfer)
Increased Intent to Purchase
Technology
Per-capita Energy Use of Californians
Remains Flat or Is Reduced
Increased Number of Measures
Installed through EE Programs
Marketing Materials and Rebates for New
Measures in EE Programs
Decreased Market Barriers
EE programs
1
2
3 4 5
6
8
9
10
11
12 13
14
15 16
7
Ext
ern
al I
nflu
ence
s: M
one
y fo
r re
ba
tes,
cu
rre
nt
eco
no
my,
kn
ow
led
ge
ab
out
glo
bal w
arm
ing
, g
as
price
s, is
sue
of th
e d
ay
(in
th
at it
take
s a
wa
y th
e f
ocu
s fr
om
ene
rgy)
, w
eath
er,
atte
ntio
n to
th
e s
upp
ly s
ide
, co
de
s/st
an
dard
s –
b
oth
cu
rre
nt a
nd
fu
ture
Key1 - 16 ---- Link identification for program theory discussion. Numbers have no intrinsic meaning other than identification. Links in large/bold are planned to be evaluated.
ETP program
Increased Use of Technology by
Customers
Energy and Demand Impacts
Increased Awareness, Knowledge, and Changed
Attitudes about Technology in Customers
ETP / EE HandoffETP / EE
Consultation
EE and ETP programs 35
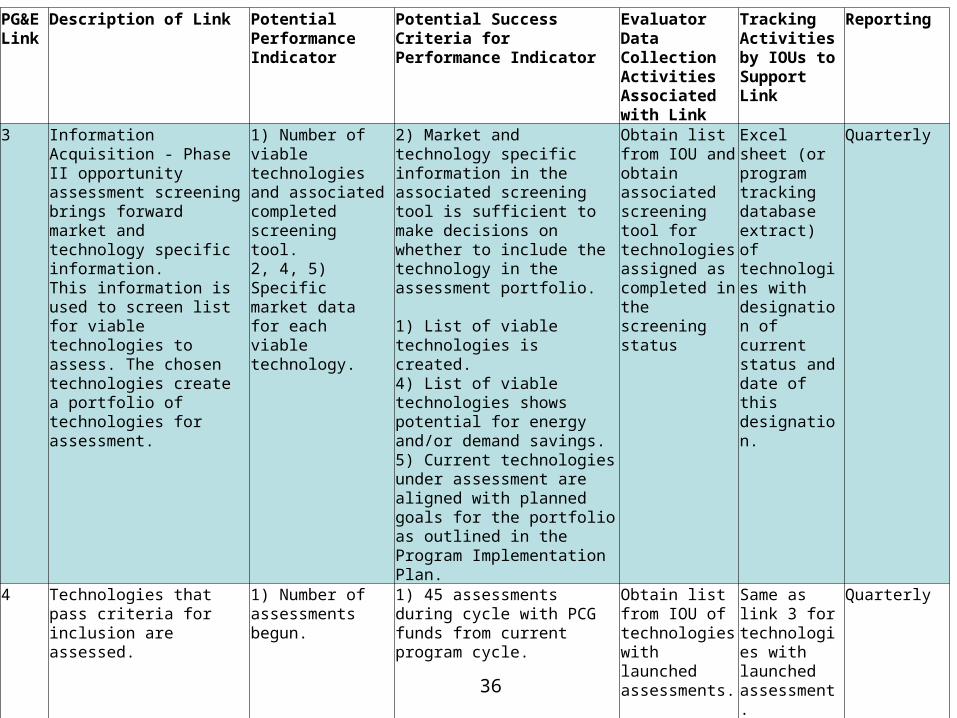
PG&E Link
Description of Link Potential Performance Indicator
Potential Success Criteria for Performance Indicator
Evaluator Data Collection Activities Associated with Link
Tracking Activities by IOUs to Support Link
Reporting
3 Information Acquisition - Phase II opportunity assessment screening brings forward market and technology specific information. This information is used to screen list for viable technologies to assess. The chosen technologies create a portfolio of technologies for assessment.
1) Number of viable technologies and associated completed screening tool. 2, 4, 5) Specific market data for each viable technology.
2) Market and technology specific information in the associated screening tool is sufficient to make decisions on whether to include the technology in the assessment portfolio. 1) List of viable technologies is created.4) List of viable technologies shows potential for energy and/or demand savings.5) Current technologies under assessment are aligned with planned goals for the portfolio as outlined in the Program Implementation Plan.
Obtain list from IOU and obtain associated screening tool for technologies assigned as completed in the screening status
Excel sheet (or program tracking database extract) of technologies with designation of current status and date of this designation.
Quarterly
4 Technologies that pass criteria for inclusion are assessed.
1) Number of assessments begun.
1) 45 assessments during cycle with PCG funds from current program cycle.
Obtain list from IOU of technologies with launched assessments.
Same as link 3 for technologies with launched assessment.
Quarterly
5 Assessment of technologies results in a document of findings.
1) Number of assessment reports created.
1) 100% of completed assessments have assessment report.2) For those assessment that are terminated / cancelled, a document is created that indicated thereason.
Obtain assessment reports from IOUs for completed assessment.
Same as link 3 for which projects have assessment reports.
Quarterly
36

PG&E Link
Description of Link Potential Performance Indicator
Potential Success Criteria for Performance Indicator
Evaluator Data Collection Activities Associated with Link
Tracking Activities by IOUs to Support Link
Reporting
6 Knowledge Creation - Assessment report provides information about technology to internal IOU staff.
1) Quality of the report.
1) 100% of assessment reports are complete, well written, highlight knowledge gained, and has sufficient details to enable decisions about the technology by the IOU.
Would have collected this data under link 5Interviews with internal EE staff
None None
7 Information Dissemination - Assessment report (or fact sheet based upon the report) is used as the basis for passing on knowledge about successful technologies (i.e., those that validated by the assessment process)
1) Availability of report to internal EE staff.
1) Reports, summary data, or fact sheets are readily available to internal IOU staff (i.e., staff know that they exist, where they are, when they are available, and can access them easily)
None - would have collected this data under link 6
None None
8 Assessment report or fact sheet is used to create audience-specific marketing documents as well as informing appropriate rebate levels.
1) Number of emerging technologies integrated into EE portfolio.2) Quality of content of different collateral pieces produced 3) Data available to support rebate / incentive calculations
1) Successful technologies are integrated into the EE portfolio.2) Marketing documents accurately describe attributes of successful technology in terms understood by all targeted audiences.3) Reasonable and sufficient data used for incentive and rebate calculations.
Obtain collateral and tracking activity data for this link from IOU. Focus group(s) of targeted audiences.
Excel sheet with number of collateral pieces produced, mapping of collateral to technology, and date of production.
None
37

PG&E Link
Description of Link Potential Performance Indicator
Potential Success Criteria for Performance Indicator
Evaluator Data Collection Activities Associated with Link
Tracking Activities by IOUs to Support Link
Reporting
13 A customer's intention to purchase a technology that was transferred from ETP will be followed up by actual behavior.
1) Impact of technologies that were transferred from ETP and were installed through EE programs.
1) The number of installations/adoptions for technologies from ETP in the EE portfolio increase annually, calibrating for measures that move to Codes & Standards.2) The lifecycle energy gross savings for technologies transferred from ETP to the EE portfolio increase annually.
EE paid measures from all IOUs by year
Create and maintain measure value to enable direct mapping of measure from ETP
Annually
38

Discussion• What are the characteristics of performance metrics
for:1. Resource Acquisition EE programs
2. Non-resource Acquisition EE programs• Who should design performance metrics? • How will the performance metrics be used?• How often should the performance metrics be
updated?• What format should be used to measure performance
metrics, where should the data be collected and reported? 39

ENERGY DIVISION MODEL FOR IOU PERFORMANCE METRICS (INDICATORS) DESIGN
Section 5
40

Step (1)Program Strategic Framework:
2009-11 EE Programs• Secure management commitment to design,
implement, and utilize the performance measurement system
• Identify the section in the CEESP that applies to the program
• Map out the relevant CEESP near-term (2009-11) objectives and strategies to align with each program’s objectives and strategies.
41

Step (2) (Cont.)• Define program mission, goals and
objectives (SMART)• Develop Program Theory and Logic Models
including program strategies/activities to meet the objectives, outputs, short-term intermediate outcomes, and long-term outcomes
• Define Performance Metrics (Indicators)
42

Balance!
43

Guidelines for Defining Performance Indicators• Work directly from PT/LM including goals, objectives, program
activities, outputs, outcomes to define performance indicators• Attempt to develop a balanced set of performance indicators while
avoiding redundancy or only tangentially related measures• Reject proposed indicators that will not be meaningful to managers,
policy makers and other relevant stakeholders• Define indicators with high degree of face validity to intended users
and external audience• Examine the validity and reliability of proposed measures• Define indicators for which a clear “data trail” can be gathered in order
to allow for effective quality assurance procedures• Provide clear definition of data sources and data collection procedures
to facilitate uniform reporting from decentralized procedures • Consider the trade-offs between the quality of performance indicators
versus the cost of collecting the data44

Step 3: System Design
• Organize and clarify the system development process• Define, evaluate, and select indicators• Develop data collection procedure
• Provide quality assurance• Specify the system design
• Identify reporting frequency and channels• Determine the analytical and reporting formats• Develop software applications• Assign responsibilities for maintaining the system
• Implement full-scale system• Use, evaluate, and modify the system as appropriate
45
46

Discussion
• Do parties agree with this proposal?• What is missing?• Other issues/suggestions?
47

DEVELOPING PERFORMANCE METRICS FOR IDSM
GROUP EXERCISE
Section 6
48

Developing Performance Metrics - Integrated Demand Side Program Exercise
IDSM Strategic Planning Vision:“Energy efficiency, energy conservation, demand response, advanced metering, and distributed generation technologies are offered as elements of an integrated solution that supports energy and carbon reduction goals immediately, and eventually water and other resource conservation goals in the future” -
California Energy Efficiency Strategic Plan, p. 71.
49

IDSM Strategies to Achieve Strategic Vision• Pilot Programs
• Designed to inform future program and policy submissions regarding value and best methods and targets of integration
• Offer bundled products that include elements of EE and conservation, consumer generation, demand response, and the best available AMI technologies.
• Offer different forms of delivery (including 3rd party and local govt platforms) and information access.
• Stakeholder Coordination• Work with outside stakeholders to develop and implement a comprehensive,
coordinated long-term approach to effective utilization of energy resources while also achieving GHG emissions reductions, water conservation, waste disposal, and air quality requirements.
• New Technologies• A major effort is needed to develop new technologies and systems that
enable multiple DSM options and provide synergy across program types.• Coordinated IDSM Marketing
• Program administrators should streamline and integrate the marketing of DSM programs in conjunction with smart meter deployment.
50
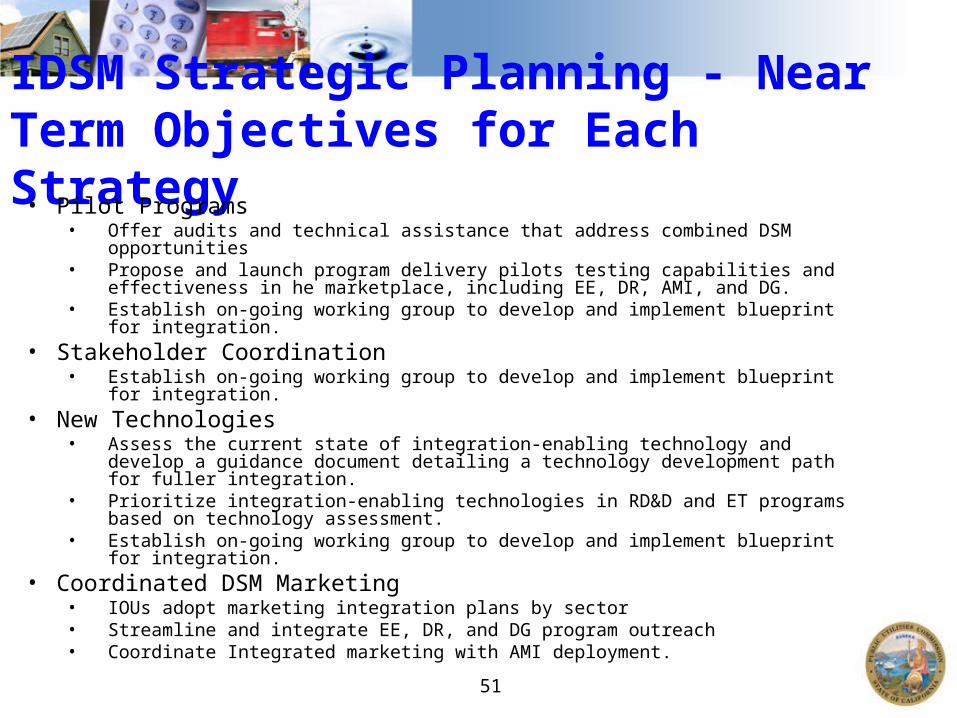
IDSM Strategic Planning - Near Term Objectives for Each Strategy
• Pilot Programs• Offer audits and technical assistance that address combined DSM opportunities• Propose and launch program delivery pilots testing capabilities and effectiveness in he
marketplace, including EE, DR, AMI, and DG.• Establish on-going working group to develop and implement blueprint for integration.
• Stakeholder Coordination• Establish on-going working group to develop and implement blueprint for integration.
• New Technologies• Assess the current state of integration-enabling technology and develop a guidance
document detailing a technology development path for fuller integration.• Prioritize integration-enabling technologies in RD&D and ET programs based on
technology assessment.• Establish on-going working group to develop and implement blueprint for integration.
• Coordinated DSM Marketing• IOUs adopt marketing integration plans by sector• Streamline and integrate EE, DR, and DG program outreach• Coordinate Integrated marketing with AMI deployment.
51

ENERGY DIVISION PROPOSED PROCESS FOR REVIEW & APPROVAL OF IOU PROGRAM PERFORMANCE METRICS
Section 7
52

Energy Division Process for Reviewing & Approving Performance Metrics• Step 1: IOUs submit publicly filed Advice Letter
indicating proposed performance metrics; one AL for each statewide program.
• Step 2: Parties to the Service List have 30 days to submit a protest if applicable.
• Step 3: Energy Division reviews and approves or rejects the Advice Letter based on internal review and any potential party objections.• ED may require supplemental Advice Letter or
issue data requests to obtain missing information necessary to adequately review the AL.
53
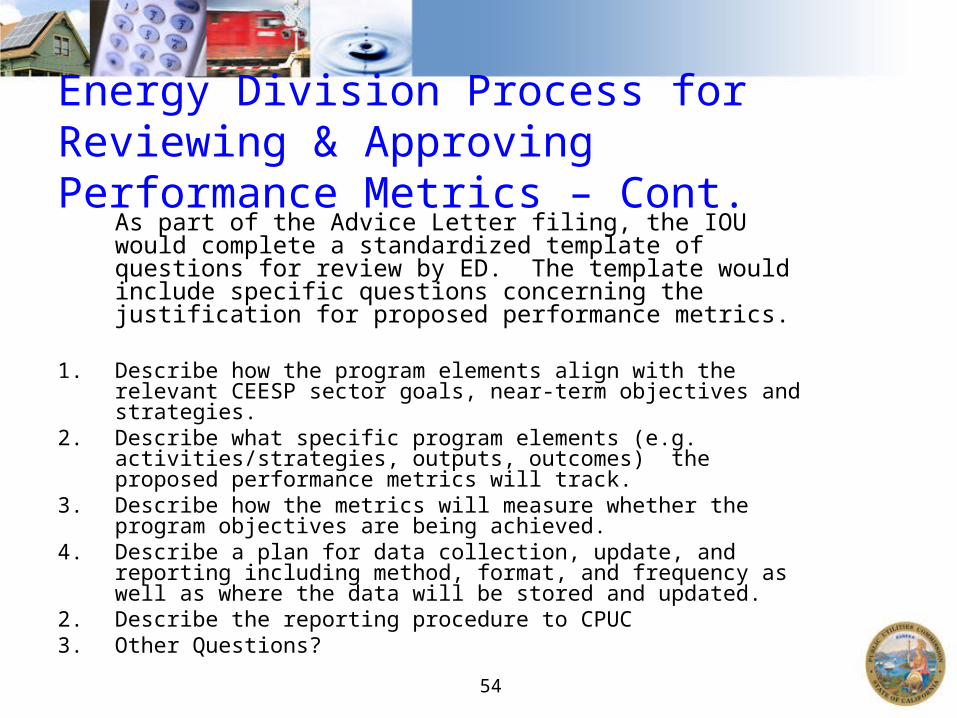
Energy Division Process for Reviewing & Approving Performance Metrics – Cont.
As part of the Advice Letter filing, the IOU would complete a standardized template of questions for review by ED. The template would include specific questions concerning the justification for proposed performance metrics.
1. Describe how the program elements align with the relevant CEESP sector goals, near-term objectives and strategies.
2. Describe what specific program elements (e.g. activities/strategies, outputs, outcomes) the proposed performance metrics will track.
3. Describe how the metrics will measure whether the program objectives are being achieved.
4. Describe a plan for data collection, update, and reporting including method, format, and frequency as well as where the data will be stored and updated.
2. Describe the reporting procedure to CPUC3. Other Questions?
54
SUMMARY TABLE OF 2009-11 IOU PROPOSED PROGRAM PERFORMANCE METRICS
Section 8
55
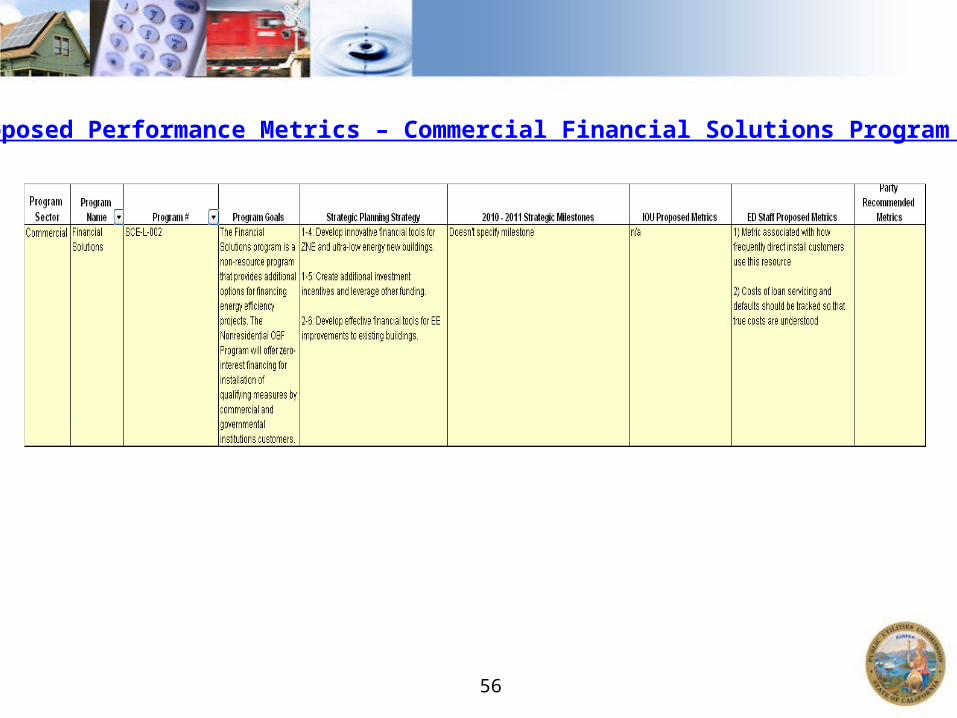
Proposed Performance Metrics – Commercial Financial Solutions Program
56

Performance Metrics Needed – Sustainable Communities Program
57
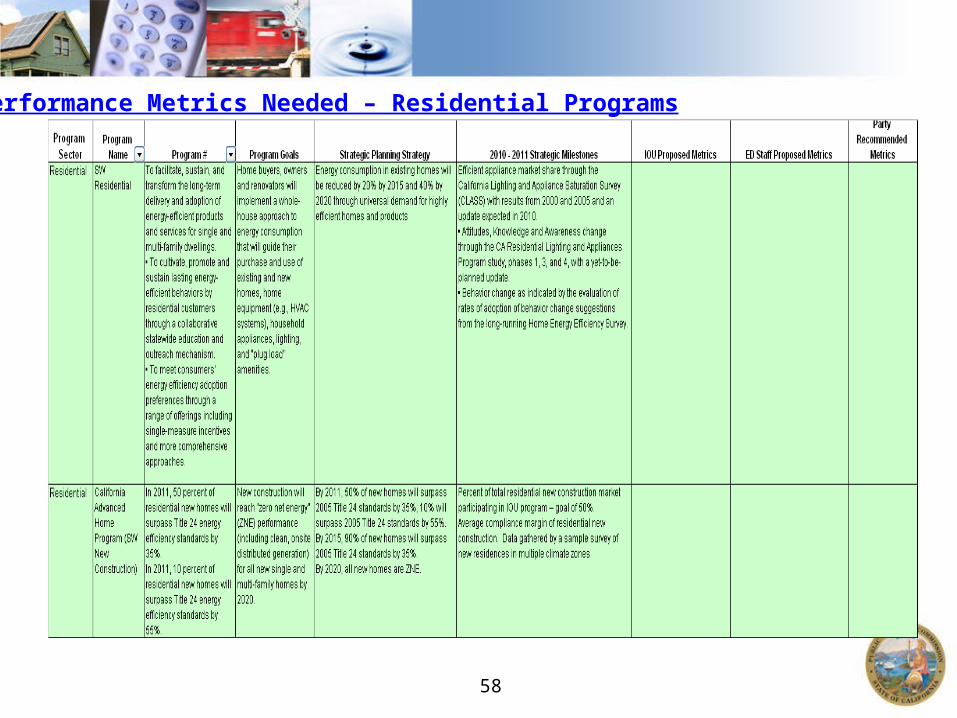
Performance Metrics Needed – Residential Programs
58
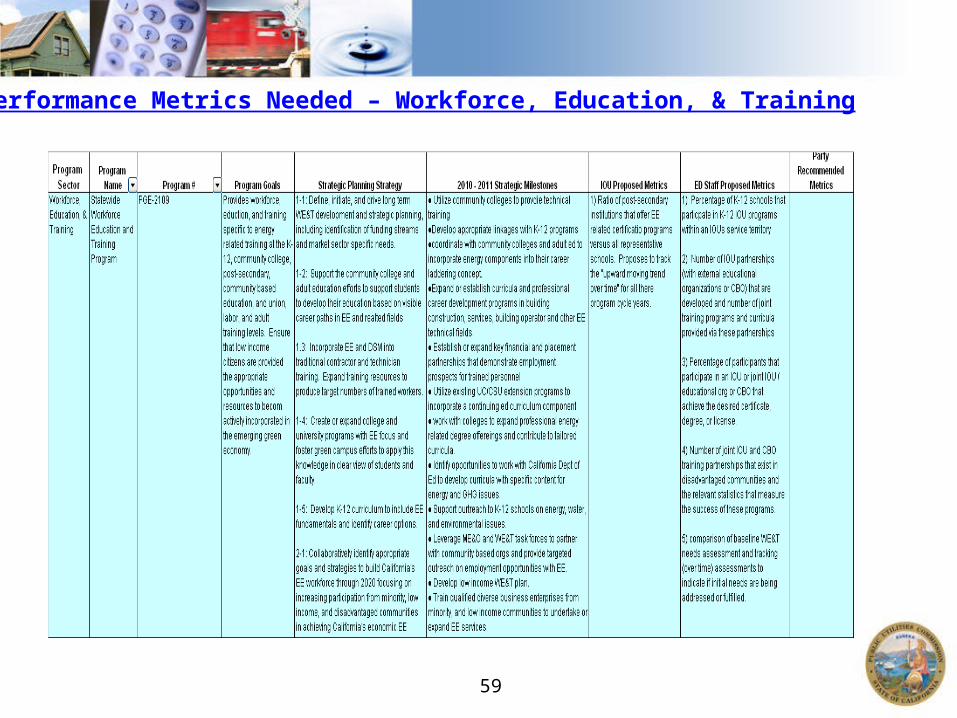
Performance Metrics Needed – Workforce, Education, & Training
59

DISCUSSIONSection 9
60

NEXT STEPSSection 10
61
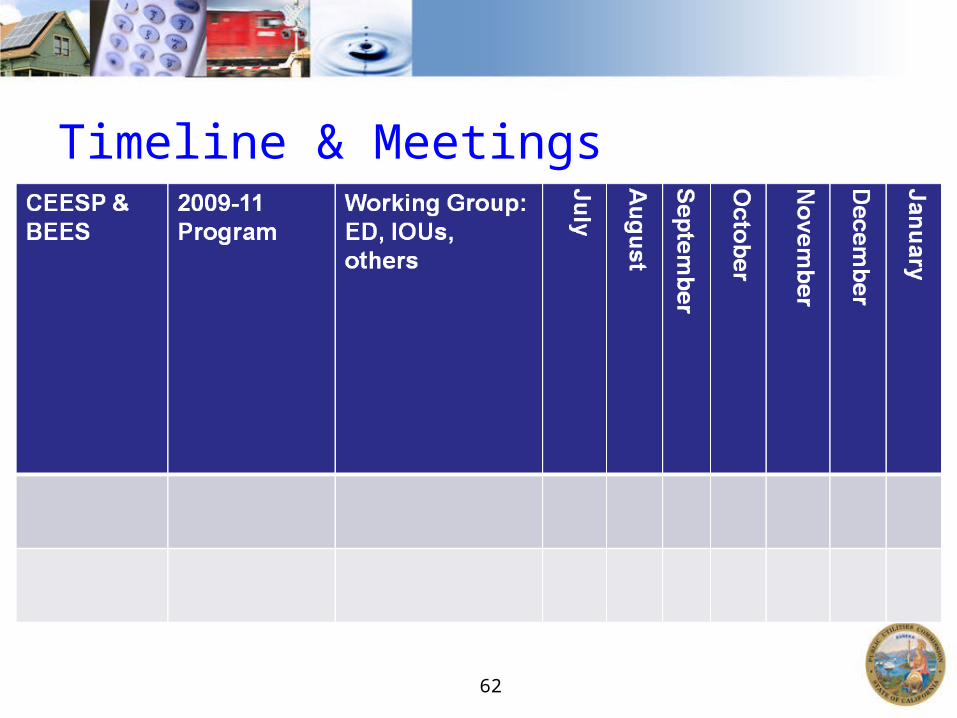
Timeline & Meetings
62

Adjourn
Thank You!
63
References
• CPUC, September 2008. California Energy Efficiency Strategic Plan.
• CPUC, 2008. Strategic Plan Decision. D. 08-09-040• CPUC, October 30, 2008. Ruling in Application
Proceeding 08-07-021• PG&E 2009-11 Energy Efficiency Portfolio, Program
Implementation Plan, Statewide Program, Demand Side Management Coordination and Integration, PG&E 2111.
64
References (Cont.)
• PG&E 2009-11 Energy Efficiency Portfolio, Program Implementation Plan, Statewide Program, Emerging Technologies, PG&E 2108.
• TecMarket Works Framework Team, June 2004. The California Evaluation Framework.
• Thedore H. Poister, 2003. Measuring Performance in Public and Non Profit Organizations. John Wiley & Sons Inc.
65