1 improving the accuracy of ir-level fault injection
TRANSCRIPT

1
Improving the Accuracy of IR-level Fault InjectionLucas Palazzi, Member, IEEE, Guanpeng Li, Member, IEEE, Bo Fang, Member, IEEE,
and Karthik Pattabiraman, Senior Member, IEEE
Abstract—Fault injection (FI) is a commonly used experimental technique to evaluate the resilience of software techniques fortolerating hardware faults. Software-implemented FI can be performed at different levels of abstraction in the system stack; FIperformed at the compiler’s intermediate representation (IR) level has the advantage that it is closer to the program being evaluatedand is hence easier to derive insights from for the design of software fault-tolerance mechanisms. Unfortunately, it is not clear howaccurate IR-level FI is vis-a-vis FI performed at the assembly code level, and prior work has presented contradictory findings. In thispaper, we perform a comprehensive evaluation of the accuracy of IR-level FI across a range of benchmark programs and compileroptimization levels. Our results show that IR-level FI is as accurate as assembly-level FI for silent data corruption (SDC) probabilityestimation across different benchmarks and optimization levels. Further, we present a machine-learning-based technique for improvingthe accuracy of crash probability measurements made by IR-level FI, which takes advantage of an observed correlation betweenprogram crash probabilities and instructions that operate on memory address values. We find that the machine learning techniqueprovides comparable accuracy for IR-level FI as assembly code level FI for program crashes.
Index Terms—Resilience, fault injection, IR-level fault injection, intermediate representation, machine learning, LLVM, PIN
F
1 INTRODUCTION
Hardware faults are becoming more common in commoditycomputer systems due to the effects of process scaling andmanufacturing variations [1], [2], [3]. This has led to aconcomitant increase in the rates of hardware faults thatare exposed to the software running on these systems. Thisis because techniques to mask all hardware faults fromsoftware, such as full duplication in hardware, consume toomuch energy, making their use challenging in commoditysystems. Therefore, researchers have proposed various soft-ware techniques to detect and recover from hardware faultsexposed to the software, with low performance and energyoverheads [4], [5], [6].
An important consideration for deploying any softwaretechnique is a quantitative evaluation of its coverage, i.e.,the technique’s ability to detect (or recover from) hardwarefaults. When proposing such a technique, researchers typi-cally use fault injection tools to evaluate its coverage. Faultinjection (FI)1 is the process of systematically introducingerrors into the program and observing the outcome. Becausethe injection space is very large, many FI tools use the MonteCarlo method to sample the space of potential injectiontargets to obtain a statistical estimate of the techniques’coverage (other space reduction strategies are also possible).
A key design consideration in a FI tool is the level ofabstraction at which it operates. The higher the level ofabstraction, the easier it is to draw meaningful insights fromthe tool, as the findings can be directly translated to thedesign of software mechanisms. However, raising the levelof abstraction often comes with a cost in the accuracy ofthe FI process, as hardware faults occur in the lower levelsof the system stack, and modeling them at higher levels ischallenging.
1. We refer primarily to Software Implemented Fault Injection(SWiFI) techniques when we say FI in this paper.
To alleviate this difficulty, researchers have proposedimplementing FI tools at the intermediate representation(IR) of modern compilers such as LLVM/Clang [7], [8]. Themain advantages of this approach are (1) many softwareprotection techniques are implemented at the IR level, andit is straightforward to use the results of the evaluation toimprove the coverage of these techniques, and (2) IR-levelinjections typically abstract the effects of the machine archi-tecture such as instruction encodings and register file sizes,thereby making the results applicable to a wide variety ofhardware platforms. Further, the IR of LLVM includes IR-level program type information, which is useful in guidingthe software techniques towards more vulnerable parts ofthe program. Consequently, a wide range of software fault-tolerance techniques use IR-level injections to validate theirresults [9], [10], [11].
However, there has been little work on validating theresults of IR-level FI with respect to FI performed at theassembly code level, which is arguably more accurate as itis closer to the hardware. This is concerning, as many ofthe insights used in software fault-tolerance techniques arederived from IR-level fault injections, and inaccuracies inthe latter call into question the efficacy of these techniques.Further, the dominant platform for IR-level studies, LLVM,has significant differences with x86-64 assembly languageon which many of these studies are based, so it is not clearhow well the results of FI performed at the IR-level matchthose of FI performed at the assembly language level.
In the conference version of this paper [12], we pre-sented an analysis of the contradictory prior work [13],[14] that has examined the accuracy of IR-level FI withrespect to assembly-level FI, showing that IR-level FI is infact as accurate as assembly-level FI with respect to SDCprobability measurements. We further supported this resultby conducting a thorough comparison study between IR-and assembly-level FI, which we include in this paper (Sec-tion 4). We showed empirically that IR-level FI is as accurate

2
as assembly-level FI when measuring the SDC probabilityof a program; however, the accuracy of crash probabilitymeasurements depends on the amount of optimizationsused to compile the program.
This paper then expands on these findings by discussingmemory address instructions, which we define as assemblyor IR instructions that operate on register values that areeventually used as the address operand in a memory load orstore instruction. The dominant cause of application crashesis errors propagating to memory operations [15], [16], i.e.,a load or store instruction attempting to read or write toa memory location that is “out of bounds”. We find thatthe program crash probabilities measured by IR-level andassembly level FI are correlated with the program’s memoryaddress instruction percentage, supporting this intuition.Because back end optimizations typically affect an appli-cation’s memory operations, a program’s IR code can bedifferent from its assembly code with respect to memoryaddress instructions. We present a machine-learning-basedtechnique that takes advantage of the correlations betweencrash probability measurements and memory address in-struction percentages to improve the accuracy of crash prob-ability measurements made using IR-level FI. The techniqueallows accurate crash probability estimates for a programusing only IR-level FI experiments, offering both the benefitsof IR-level FI and the accuracy of assembly-level FI.
Our contributions are as follows:• By conducting an empirical study using rigorous sta-
tistical tests, we find that IR-level FI is as accurate asassembly-level FI for emulating hardware errors thatcause SDCs, as well as in measuring the relative rankingof program SDC probabilities, at all optimization levels(Section 4.2.1).
• We find that for crash-causing errors, IR-level FI is onlycomparable to assembly-level FI at the lowest optimiza-tion level, -O0, but not at higher optimization levels, -O1to -O3, suggesting that IR-level FI becomes less accuratewith respect to crashes when (more) compiler optimiza-tions are applied (Section 4.2.2).
• Based on the observed correlation between the crash prob-abilities and the amounts of instructions executed thatoperate on memory address values, we present a machine-learning-based approach to obtain crash probability mea-surements that are as accurate as those when measuredusing assembly-level FI, while only requiring IR-level FIexperiments to be conducted, thus improving the accu-racy of IR-level FI crash probability measurements.
2 BACKGROUND
In this section, we provide some relevant definitions anddescribe the general notions of code compilation, fault in-jection, and machine learning as they pertain to this study.
2.1 Definitions• Fault injection (FI): The process of systematically in-
troducing faults/errors2 into a program to observe pro-gram behaviour under fault/error conditions, e.g., to test
2. We use the Laprie et al. [17] terminology to distinguish faults fromerrors. Though we are injecting errors, we refer to the process as faultinjection for historical reasons, unless otherwise specified.
a program’s robustness and error-handling capabilities.Though FI has many uses, we use it to assess errorcoverage/resilience in this paper.
• Intermediate representation (IR): A code representationof a program typically used internally by a compiler (e.g.,LLVM) between the source code and target language (e.g.,assembly), independent of both the source language andtarget architecture.
• Compiler optimization: A code transformation appliedby the compiler with the goal of improving the programin some way (e.g., decrease runtime, reduce memoryaccesses, etc.). Many mainstream compilers will oftenpackage multiple individual optimizations together in onepass for convenience (e.g., the -O# flags used in LLVM andGCC).
• Fault: A defect in the computer system that may or maynot end up being read by the program.
• Error: A fault that has been activated (i.e., read by theprogram) and has resulted in some deviation of systembehaviour from a fault-free run. This may or may not beobservable as the error may only affect inconsequentialsystem states, or be corrected by fault-tolerance mecha-nisms.
• Benign error: An error that does not cause an observabledeviation from the expected system behaviour (i.e., theerror was either masked or handled by the program).
• Failure: An error has resulted in an observable deviationfrom expected system behaviour (e.g., crash, SDC).
• Silent data corruption (SDC): A failure that causes theprogram to produce an incorrect output, but with noindication that the failure has occurred.
• Crash: A failure that causes the program to throw anexception or execute an exit statement (e.g., due to anincorrect branch), and as a result the program terminatesbefore completing its expected execution.
• Hang: A failure causes an infinite loop or a longer-than-usual execution that triggers termination based on a settimeout. See Section 2.3 for how hangs are handled in ourexperiments.
• Program SDC/crash probability: The probability of anerror causing an SDC/crash for a given program andinput (other work uses a similar definition [13], [18], [19],[20], [21], [22], [23]).
• Error Resilience: The error resilience of an applicationis its ability to withstand hardware faults if they occur,without leading to an SDC or crash.
2.2 Code CompilationIn the context of this paper, we consider the compilation of aprogram in the structure shown in Figure 1; this is the struc-ture that is pertinent to the LLVM/Clang compiler [24]. Thefront end processes the program’s source code (e.g., C/C++code) and generates an intermediate representation (IR) ofthe program, while the middle and back ends performplatform-independent and platform-specific optimizationson the code, respectively.
2.3 Fault Injection (FI) and Fault ModelFault injection (FI) is a software testing technique used toevaluate a program’s error coverage. A typical FI exper-iment will consist of many individual FI runs (typically

3
Fig. 1: LLVM/Clang code compilation flow
hundreds), each run being a single execution of the programwith an error introduced. Once an error is introduced inthe program, it can result in a failure, which is either anSDC, crash, or benign output. In this paper, we considerprogram hangs as part of the crash category; we set theexecution timeout for each benchmark to be sufficientlylong so as to allow the program to complete most longer-than-usual executions. As a result, we observe a negligiblepercentage of hang outcomes in our experiments (less than0.5% of all fault injection outcomes). Once the FI runs havecompleted, we obtain a statistical estimate of the SDC/crashprobabilities.
In this paper, we are interested in emulating transienthardware errors (i.e., soft errors) caused by cosmic ray oralpha particle strikes affecting flip flops and logic elements.These errors typically manifest in the form of bit-flips, andthus in our FI experiments, a single bit-flip is injected perFI run. We consider errors that occur in the processor’scomputation units, e.g., arithmetic operations and addresscomputations for load and store instructions. However,errors in memory components such as caches are not con-sidered, since these components are usually protected at thearchitectural level using ECC or parity. We do not considererrors in the control logic of the processor as this is a smallportion of the processor area, nor do we consider errors inthe instruction encoding, as these can be handled throughcontrol-flow checking techniques [25]. Related work hasmade similar assumptions [9], [26], [27], [28], [29].
2.3.1 Instruction samplingIn each FI run, a dynamic instruction needs to be determinedas the FI target. Since soft errors occur randomly, we choosea dynamic instruction at random among the total executedsequence of instructions in the program with a uniformdistribution. Thus, if the program has N total dynamicinstructions in the execution, each dynamic instruction has1/N probability to be sampled in each FI run. This sam-pling methodology makes an implicit assumption that eachinstruction takes approximately the same amount of timeto execute. This is because we are performing the injectionat the program level, where we do not have detailed in-formation about the microarchitectural or cache state of theinstruction. This is a common assumption in program-levelFI techniques.
2.3.2 Bit samplingOnce a dynamic instruction is chosen as the FI target, asingle bit within the destination register of that instructionneeds to be selected as the target of injection. As in theinstruction sampling, a register bit is randomly selectedto be the target. Since we are interested in the programbehaviour given that an error has occurred (as our goal is to
measure error resilience), we only consider activated faults(i.e., errors). Thus, we only sample from bits in the destina-tion register that are used by the program. For example, ifan instruction writes a 64-bit value to a 128-bit destinationregister, only the 64 bits corresponding to the written valueare sampled from, with each bit having a probability of 1/64to be sampled.
2.3.3 Assembly-level FI
FI can be conducted at different levels of abstraction, in-cluding at the IR and assembly code levels. Assembly-levelFI tools utilize dynamic binary instrumentation (e.g., PIN,DynamoRIO and Valgrind) to access the assembly codefor FI. They are considered to be accurate for studyinghardware faults, such as soft errors, since assembly code isclose to hardware [14], [30]. Common assembly-level faultinjectors include BIFIT [31], PINFI [13], FITgrind [32] andothers [33], [34]. The main drawbacks of assembly-level FIare that (1) it has limited portability because it operatesat the platform-specific assembly code level, and (2) it isdifficult to obtain insights for software design, since IR-level code abstractions (e.g., loops and data structures) arenot available at the assembly level. Therefore, it is difficultto map FI locations back to the source code for furtherinvestigation. In this paper, we use PINFI to implementassembly-level FI experiments.
2.3.4 IR-level FI
IR-level FI uses compiler techniques to inject errors into thecompiler’s intermediate representation (IR) code. PopularIR-level fault injectors are LLFI [8], KULFI [29], VULFI [35],and FlipIt [7]. In addition to its high platform portability, theIR level preserves the information of the program sourcecode. Hence, it is easier to map the FI locations back tothe source code. It also allows the injection of errors intospecific code structures (e.g., loops and data structures).Moreover, the IR level is where significant program anal-ysis tools are available. Therefore, IR-level FI makes thepost-analysis much easier compared to assembly-level FI.However, the main concern is accuracy, as there are variousback end optimizations performed on the code that are notavailable to the IR. For example, since the IR is platform-independent and assumes an infinite number of availableregisters, register allocation is not performed until the backend compilation stage, and hence there can be a mismatchbetween the number of memory operations in the IR andassembly code. In this paper, we use LLFI to implement IR-level FI experiments.
2.4 Machine Learning
In this study, we use supervised machine learning (ML) tomake predictions on the data collected in our experiments.We provide some definitions of relevant terminology below.Features: The inputs of the ML model. Each data example
in the data set has a feature vector containing the valuesof each feature for that given data example.
Labels: The outputs of the ML model. When given a set offeatures, the model will give a prediction/estimate ofthe label for that set of feature values.

4
Training: The process of fitting a model to a set of data;this is the stage where the model “learns” the patternsin input-output relationships that exist in the trainingdata set.
Training data set: A set of data examples that are used totrain the ML model. In supervised machine learning,the training data is labeled with the expected outputsof each data example.
Test data set: A separate set of labeled data examples thatare used to test how well the model performs on datait has not seen before. The test data set is never used totrain the model.
3 RELATED WORK
3.1 Fault Injection for Measuring Error Resilience
There is a large body of work on using fault injection tomeasure the error resilience of computer programs, usingboth hardware and software techniques.
The injection of software faults is a common use case forsoftware-implemented fault injection, and has been doneat the assembly/binary level in prior research [36], [37],[38], [39]. For example, Cotroneo et al. address the accuratemutation of binary code for injecting software errors whenthe source code of the target is unavailable [36]. While suchpapers address fault injections at the binary/assembly level,we are instead concerned with emulating transient hardwarefaults (i.e., soft errors), albeit at the software level.
Initially, most studies that investigated error resilienceto transient hardware errors relied on hardware FI, whichinvolves injecting faults through the hardware layer eitherwith or without physical contact [40]. On the other hand, theuse of software techniques to emulate transient hardwareerrors has seen increased interest over the last decade, as itdoes not require expensive hardware and is more flexible[41]. It is important to note however that, while softwaretechniques offer improvements in cost, flexibility, and porta-bility, it is often difficult or impossible to inject faults intolocations that are inaccessible to software [41]. For example,a paper by Cho et al. found that assembly-level FI can onlycapture a subset of system-level behaviour caused by softerrors [42]. However, our focus is on the subset of errorsthat make their way to the application and can therefore bemodeled using higher-level FI techniques.
IR-level FI techniques that operate at the compiler levelhave become especially popular in recent years, as theyare portable and allow injections into IR-level source codeabstractions. Many studies have adopted such techniques tostudy transient hardware faults that cause SDCs. Thomasand Pattabiraman used LLFI to evaluate their techniquefor detecting SDC-causing errors [9]. Calhoun et al. usedFlipIt [7], an LLVM-based FI tool, to investigate how SDCspropagate through a specific HPC computation kernel [10].Chen et al. introduced LADR, an application-level SDCdetector that was evaluated using IR-level FI experiments[43]. Finally, Li et al. used LLFI to estimate program SDCprobabilities [11]. Studies such as these use IR-level FI underthe implicit assumption that it is as accurate as assembly-level FI in measuring SDCs.
3.2 Comparison of IR-level and Assembly-level FI
Two prior papers directly compare the accuracy of IR-levelFI with that of assembly-level FI [13], [14]. Wei et al. comparethe accuracy of IR-level FI with that of assembly-level FI foremulating hardware errors, and find that “LLFI is accuratefor emulating hardware errors that cause Silent Data Corruption(SDCs), but not crashes” [13]. Georgakoudis et al. also inves-tigates the accuracy of IR-level FI with respect to assembly-level FI for emulating hardware errors, however they findthat IR-level FI is significantly less accurate than assembly-level FI, claiming the inaccuracies are due to assembly-level dynamic binary instructions and back end compileroptimizations that are not available at the IR level [14].
Clearly, these two studies have come to contradictoryconclusions, and it is unclear to a reader whether FI per-formed at the IR level is as accurate as assembly-levelinjection for evaluating SDC-causing hardware errors. Weiet al. [13] claim that IR-level FI is accurate for emulatingSDC-causing hardware errors, while Georgakoudis et al.claim otherwise [14]. This contradiction is especially pecu-liar considering both papers claim to use the same FI tools(i.e., LLFI and PINFI) and similar experimental setups.
In the conference version of this paper, published in [12],we perform an analysis of these two studies to find the rootcause of the inconsistent findings. Our findings show thata modification made by Georgakoudis et al. [14] to the bit-sampling model used in PINFI caused a disparity in thetypes of faults that were injected by the two tools (i.e.,only activated faults vs. unactivated faults), which we foundsignificantly alters the SDC probability measurements madeby PINFI. Since the modified PINFI bit selection methodused in Georgakoudis et al. [14] is inconsistent with thebit selection method used by LLFI, the paper’s comparisonbetween LLFI and PINFI is invalid. Thus, our prior workin [12] shows that IR-level FI is indeed as accurate asassembly-level FI, with respect to SDC errors.
3.3 Machine Learning for Fault Outcome Estimation
Numerous studies have been published at the intersectionof program error resilience and machine learning. In thissection, we focus on studies that use machine learning forevaluating program resilience and/or vulnerability.
Many studies use machine learning or statistical mod-els to estimate the resilience and/or vulnerability of soft-ware components, identifying those with high-risk prop-erties [44], [45], [46], [47], [48]. These studies are largelyfocused on identifying high-risk components within specificcomputing systems and do not directly apply to generalcomputing applications. Further these approaches do notestimate resilience or crash probability within the context ofIR-level fault injection as is the case in our work.
Farahani et al. propose a learning-based reliability pre-diction technique to estimate resilience to transient faults,using features at both the architecture and microarchitecturelevels [49]. Our work differs from this in that we focus onpredicting program-level tolerance to transient faults. A pa-per by Lu et al. uses machine-learning-based techniques todetect SDC-causing errors in programs [50]. However, thiswork uses machine learning to quantify the SDC proneness

5
of individual program variables while our work attempts toevaluate the overall fault coverage of a program.
More recently, a paper by Kalra et al. [51] investigates theuse of machine learning and statistical methods for predict-ing the resiliency of GPU applications. Their tool, PRISM,extracts features that characterize program resiliency allow-ing them to predict error outcomes without running faultinjection campaigns. While similar to our work in this study,their work is limited to GPU applications and focused onpredicting SDC outcomes while our work applies to thecrash probabilities of CPU applications.
4 END-TO-END COMPARISON: IR-LEVEL VS.ASSEMBLY-LEVEL FIIn this section, we conduct an extensive set of FI experi-ments to evaluate the accuracy of IR-level FI with respect toassembly-level FI. We first describe the experimental setupin terms of the benchmarks, FI tools, platforms, and mea-surement metrics used for our experiments. We then presentour results for both SDC and crash outcomes, finishing thesection with a discussion of our findings.
4.1 Experimental Setup
4.1.1 OverviewThe experiments presented in this section are conductedaccording to the following process:
• We choose 25 benchmark programs on which to per-form fault injection experiments using both IR-level(LLFI) and assembly-level (PINFI) FI respectively.
• Four separate sets of fault injections are performedfor each benchmark, each one with the benchmarkcompiled using a different compiler optimization level(-O0, -O1, -O2, and -O3).
• We measure the SDC and crash probabilities for eachset of FI experiment outcomes (i.e., each benchmark-optimization pair).
• We apply a variety of statistical tests and analyses tocompare the results, and use these to draw conclusionson the accuracy of IR-level FI measurements comparedto assembly-level FI.
4.1.2 BenchmarksIn our experiments, we choose a total of 25 different bench-marks from 7 publicly available benchmark suites. Theirdetails are shown in Table 1. We choose these benchmarksbecause they are (1) from a broad selection of applicationdomains, (2) open source and compatible with both faultinjection tools, and (3) used in the two related FI studies [13],[14] discussed in Section 3.2. The benchmarks that wereincluded in [13], [14] are indicated as such in Table 1, aswell as whether the program is the CPU or memory-bound(if such information was available ) [52], [53], [54], [55], [56].
We include all of the benchmarks used in Wei et al. [13],and all but three of the benchmarks used in Georgakoudis etal. [14]; AMG2013, lulesh, and miniFE are not used becausethey are either (1) not compatible with the platform usedfor our experiments, or (2) not compatible with LLFI whencompiled using some of the pertinent optimization levels.
TABLE 1: Benchmark Details (Section 4)
Benchmark Suite Input
blackscholes1 PARSEC 1 in_16K.txt output.txtfluidanimate1 PARSEC 1 10 in_5K.fluid out.fluidlud1 Rodinia -v -i 512.datbackprop1 Rodinia 65536kmeans2 Rodinia -i 819200.txt -k 1bfs Rodinia 1 graph1MW_6.txtbzip22† SPEC -1kvv image.jpglibquantum2† SPEC 33 5hmmer1† SPEC --seed 10000000 ig.hmmmcf2† SPEC inp.inocean1† SPLASH-2 -p1 -oraytrace1† SPLASH-2 -p1 -m64 inputs/car.envCoMD‡ Mantevo -x 10 -y 10 -z 10 -N 50HPCCG‡ Mantevo 64 64 64XSBench1‡ CESAR -s smallBT1‡ NPB SCG2‡ NPB SDC2‡ NPB 10000000 ADC.parEP1‡ NPB WFT2‡ NPB WIS2 NPB SLU2‡ NPB WMG2 NPB SSP1‡ NPB WUA2‡ NPB W†Benchmark used in Wei et al. [13]‡Benchmark used in Georgakoudis et al. [14]1CPU bound program2Memory bound program
In addition to those taken from [13], [14], we also includeseveral benchmarks not used in the two prior studies.
We use the default inputs included in the benchmarksuites, or example inputs where the former are not available.Finally, each benchmark is compiled four times, each oneusing a different compiler optimization level (-O0, -O1, -O2,and -O3); separate FI experiments are conducted for each ofthe four optimization levels.
4.1.3 Fault injection tools and platformTo conduct our FI experiments, we again use LLFI3 andPINFI4 as our IR-level and assembly-level FI tools, respec-tively. This is to be consistent with the studies discussedin Section 3.2. In addition, these FI tools are (1) flexible: LLFIand PINFI are fully open source and configurable to conductFI experiments with customized setups, and (2) popular: bothtools have wide adoption in both industry and academia.
All experiments are conducted on 64-bit Intel x86-64machines, and the benchmarks are all executed on singlethreads. LLVM/Clang 3.4 is used to compile from the bench-marks’ C/C++ source code to their respective LLVM IR (.ll)files and executables. PINFI uses Intel PIN 3.5 to access andinstrument the compiled machine code of the benchmarks.
For each set of FI experiments (i.e., each benchmark ateach optimization level), we randomly perform 1,000 faultinjection runs using both LLFI and PINFI respectively. Thus,we perform a total of 100, 000 fault injection runs (= 25 * 4 *1000) for each tool.
4.1.4 Measurements of accuracyTo evaluate the accuracy of the SDC and crash probabilitiesmeasured using IR-level and assembly-level FI, we apply
3. https://github.com/DependableSystemsLab/LLFI4. https://github.com/DependableSystemsLab/pinfi

6
a multitude of visual and statistical tests. We first show agraphical overview of the results for each benchmark to vi-sually compare the outcomes of FI execution for each FI tool,with calculated errors bars representing a 95% confidenceinterval for 1,000 FI runs. We then apply three different typesof statistical analyses to quantify the difference betweenIR-level and assembly-level FI: (1) least squares regressionanalysis; (2) paired sample t-test; and (3) Spearman’s rankcorrelation test. We describe the details of these tests below.
Least squares regression analysis: The first statisticalanalysis we apply is based on a least squares regressionmodel [57]. The analysis is performed for each optimizationlevel across the set of benchmarks. The method of leastsquares is a standard approach in regression analysis toobtain the line of best fit for a set of data points. The reasonfor using this approach is to measure the linear relation-ship between the respective SDC and crash probabilitiesobtained using LLFI and those using PINFI. The modelplots the PINFI probabilities (y-axis) against those of LLFI(x-axis). We have verified that our datasets meet all theassumptions needed for applying a linear regression modeli.e., (1) normality of residuals (verified manually), (2) littleto no auto-correlation (using Durbin-Watson test), and (3)homoscedasticity (visual test).
In the ideal situation where LLFI produces the exactsame measurements as PINFI (i.e., LLFI is exactly as accu-rate as PINFI), these data points would form a straight linewith a slope of 1 and y-intercept of 0 (i.e., having a linearequation of y = x). For example, if for a given benchmarkand optimization level the SDC probability measurementsobtained from LLFI and PINFI fall on the line y = x,it indicates that LLFI and PINFI measure the same SDCprobability (for that benchmark and optimization level).
Thus, the linear equation and the corresponding R2
value obtained from this analysis provide an indication ofhow close the data points are to the ideal situation. Note thatR2 values close to 1 indicate a high correlation. We estimatethe slope and y-intercept parameters with a 95% confidenceinterval.
Paired sample t-test: We use a paired sample t-testto compare the SDC and crash probability measurementsmade by LLFI and PINFI. The paired sample t-test is usedto determine whether the mean difference between two setsof measurements is zero. We verified that our dataset meetsall the t-test assumptions.
Our null hypothesis states that the mean differencebetween the probabilities measured using LLFI and thosemeasured using PINFI is zero. In other words, if the nullhypothesis were to hold true, all observable differenceswould be explained by random variation, thus implyingthat the measurements made by LLFI and PINFI are notsignificantly different. We use a two-tailed alternative hy-pothesis that assumes the mean difference is not equal tozero, which would imply that there is non-random variationin the measurements.
We perform the paired sample t-test for each optimiza-tion level using the whole set of 25 benchmarks, so thatwe can compare the significance of the results at eachoptimization. The p-values calculated using the test give usthe probability of observing the experiment results underthe null hypothesis (i.e., a high p-value indicates increased
support for the null hypothesis). We use a significance levelof 0.05, which corresponds to a 95% confidence level. Ifthe p-value is less than 0.05, we reject the null hypothesis andconclude that the measurements made using LLFI and PINFI are(statistically) significantly different. Otherwise, we do not rejectthe null hypothesis.
Spearman’s rank correlation test: Program SDC andcrash probabilities are application-specific. This is becausedifferent programs have different characteristics of prop-agating SDC- and crash-causing errors. Often developersneed to use FI to find which applications produce higherSDC probabilities than others to make design choices amongthem (these include different versions of the same appli-cation protected with different fault tolerance techniques).Therefore, a fault injection technique needs to be sensitiveto the relative rankings of the SDC probabilities.
To examine the sensitivity of the measurements madeusing both injectors, we conduct a Spearman’s rank correla-tion test. This test is used to assess whether the relationshipbetween two variables is monotonic, i.e., if one value in-creases or decreases, the other does the same. A Spearman’srank correlation coefficient close to 1 indicates a strongmonotonic relationship. In our case, this would mean thatLLFI and PINFI are equally sensitive in distinguishing theranking of program SDC/crash probabilities. Note that theSpearman’s rank correlation test does not assume normalityof the measurement errors unlike the above two tests, andis hence more robust to non-normal variations.
4.1.5 Research QuestionsIn this study, we are interested in comparing the accuraciesof IR-level FI and assembly-level FI, and further measuringhow this accuracy differs when different compiler opti-mizations are applied. We focus on measuring both SDCand crash probabilities. By injecting faults into a set ofbenchmarks compiled with different optimization levels,we get a complete analysis of the accuracies of IR-leveland assembly-level FI, and can thereby determine if anyinaccuracies in the SDC or crash measurements can beattributed to the applied compiler optimizations.
We therefore ask the following two research questions:RQ1 Does IR-level FI provide significantly different mea-
surements of program SDC probability as assembly-level FI, across compiler optimizations?
RQ2 Does IR-level FI provide significantly different mea-surements of program crash probability as assembly-level FI, across compiler optimizations?
4.2 Results and FindingsIn this section, we present our experimental results based onfault injection experiments conducted on the 25 benchmarkslisted in Table 1, separating the results based on optimiza-tion level.
4.2.1 Program SDC probabilitiesFigure 2 shows the SDC probabilities obtained using LLFIand PINFI for each benchmark. We present the numericalresults using bar graphs with error bars (95% confidenceinterval for 1,000 runs) for visual comparison. The leastsquares regression analysis results are shown in Table 2,

7
(a) With -O0 Optimization
(b) With -O1 Optimization
(c) With -O2 Optimization
(d) With -O3 Optimization
Fig. 2: Program SDC probabilities measured by LLFI and PINFI
TABLE 2: Least Squares Regression Analysis Results
slope, m y-intercept, b R2
SDC -O0 0.9948± 0.0689 0.0060± 0.0188 0.9732-O1 1.1197± 0.1426 −0.0177± 0.0445 0.9147-O2 1.0381± 0.1463 −0.0024± 0.0495 0.8975-O3 1.0472± 0.1431 −0.0084± 0.0485 0.9030
Crash -O0 0.8129± 0.2264 0.0398± 0.0956 0.6915-O1 0.5216± 0.3562 0.0842± 0.1179 0.2716-O2 0.5191± 0.2565 0.0619± 0.0823 0.4160-O3 0.4867± 0.2436 0.0637± 0.0796 0.4099
while the t-test and Spearman’s rank test results are shownin Table 3.
Visual comparison: Figure 2 shows that the SDC proba-bilities measured by PINFI and LLFI are close to each other,
TABLE 3: Statistical Test Results
-O0 -O1 -O2 -O3
p-value† SDC 0.4210 0.3920 0.6208 0.7834Crash 0.0217 0.0215 0.0031 0.0016
Correlation coeff.‡ SDC 0.9636 0.9400 0.9285 0.9354Crash 0.8398 0.6154 0.6672 0.6659
†Measured using paired sample t-test (Section 4.1.4)‡Measured using Spearman’s rank test (Section 4.1.4)
with the error bars overlapping between the two for themajority of the benchmarks. This observation is consistentacross all four optimization levels. The mean absolute errorsbetween the SDC probability measurements from LLFI andPINFI are 2.192%, 4.988%, 4.796%, and 4.428% for -O0 to
8
(a) With -O0 Optimization (b) With -O1 Optimization
(c) With -O2 Optimization (d) With -O3 Optimization
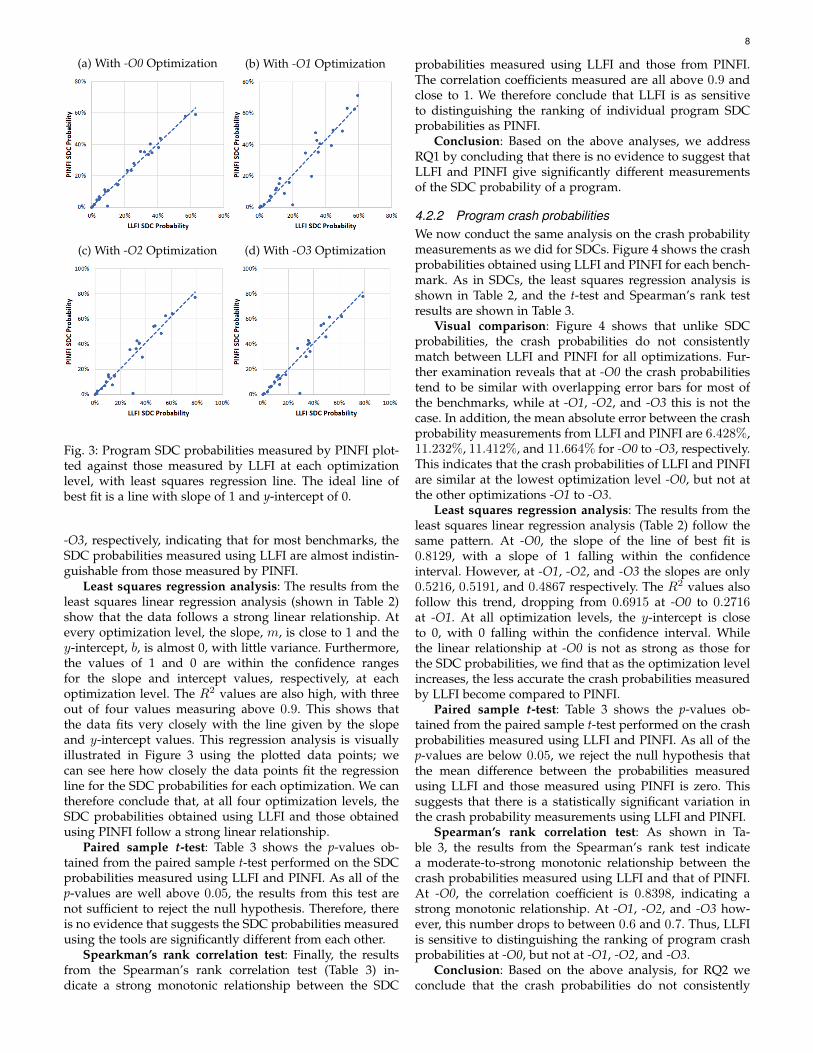
Fig. 3: Program SDC probabilities measured by PINFI plot-ted against those measured by LLFI at each optimizationlevel, with least squares regression line. The ideal line ofbest fit is a line with slope of 1 and y-intercept of 0.
-O3, respectively, indicating that for most benchmarks, theSDC probabilities measured using LLFI are almost indistin-guishable from those measured by PINFI.
Least squares regression analysis: The results from theleast squares linear regression analysis (shown in Table 2)show that the data follows a strong linear relationship. Atevery optimization level, the slope, m, is close to 1 and they-intercept, b, is almost 0, with little variance. Furthermore,the values of 1 and 0 are within the confidence rangesfor the slope and intercept values, respectively, at eachoptimization level. The R2 values are also high, with threeout of four values measuring above 0.9. This shows thatthe data fits very closely with the line given by the slopeand y-intercept values. This regression analysis is visuallyillustrated in Figure 3 using the plotted data points; wecan see here how closely the data points fit the regressionline for the SDC probabilities for each optimization. We cantherefore conclude that, at all four optimization levels, theSDC probabilities obtained using LLFI and those obtainedusing PINFI follow a strong linear relationship.
Paired sample t-test: Table 3 shows the p-values ob-tained from the paired sample t-test performed on the SDCprobabilities measured using LLFI and PINFI. As all of thep-values are well above 0.05, the results from this test arenot sufficient to reject the null hypothesis. Therefore, thereis no evidence that suggests the SDC probabilities measuredusing the tools are significantly different from each other.
Spearkman’s rank correlation test: Finally, the resultsfrom the Spearman’s rank correlation test (Table 3) in-dicate a strong monotonic relationship between the SDC
probabilities measured using LLFI and those from PINFI.The correlation coefficients measured are all above 0.9 andclose to 1. We therefore conclude that LLFI is as sensitiveto distinguishing the ranking of individual program SDCprobabilities as PINFI.
Conclusion: Based on the above analyses, we addressRQ1 by concluding that there is no evidence to suggest thatLLFI and PINFI give significantly different measurementsof the SDC probability of a program.
4.2.2 Program crash probabilitiesWe now conduct the same analysis on the crash probabilitymeasurements as we did for SDCs. Figure 4 shows the crashprobabilities obtained using LLFI and PINFI for each bench-mark. As in SDCs, the least squares regression analysis isshown in Table 2, and the t-test and Spearman’s rank testresults are shown in Table 3.
Visual comparison: Figure 4 shows that unlike SDCprobabilities, the crash probabilities do not consistentlymatch between LLFI and PINFI for all optimizations. Fur-ther examination reveals that at -O0 the crash probabilitiestend to be similar with overlapping error bars for most ofthe benchmarks, while at -O1, -O2, and -O3 this is not thecase. In addition, the mean absolute error between the crashprobability measurements from LLFI and PINFI are 6.428%,11.232%, 11.412%, and 11.664% for -O0 to -O3, respectively.This indicates that the crash probabilities of LLFI and PINFIare similar at the lowest optimization level -O0, but not atthe other optimizations -O1 to -O3.
Least squares regression analysis: The results from theleast squares linear regression analysis (Table 2) follow thesame pattern. At -O0, the slope of the line of best fit is0.8129, with a slope of 1 falling within the confidenceinterval. However, at -O1, -O2, and -O3 the slopes are only0.5216, 0.5191, and 0.4867 respectively. The R2 values alsofollow this trend, dropping from 0.6915 at -O0 to 0.2716at -O1. At all optimization levels, the y-intercept is closeto 0, with 0 falling within the confidence interval. Whilethe linear relationship at -O0 is not as strong as those forthe SDC probabilities, we find that as the optimization levelincreases, the less accurate the crash probabilities measuredby LLFI become compared to PINFI.
Paired sample t-test: Table 3 shows the p-values ob-tained from the paired sample t-test performed on the crashprobabilities measured using LLFI and PINFI. As all of thep-values are below 0.05, we reject the null hypothesis thatthe mean difference between the probabilities measuredusing LLFI and those measured using PINFI is zero. Thissuggests that there is a statistically significant variation inthe crash probability measurements using LLFI and PINFI.
Spearman’s rank correlation test: As shown in Ta-ble 3, the results from the Spearman’s rank test indicatea moderate-to-strong monotonic relationship between thecrash probabilities measured using LLFI and that of PINFI.At -O0, the correlation coefficient is 0.8398, indicating astrong monotonic relationship. At -O1, -O2, and -O3 how-ever, this number drops to between 0.6 and 0.7. Thus, LLFIis sensitive to distinguishing the ranking of program crashprobabilities at -O0, but not at -O1, -O2, and -O3.
Conclusion: Based on the above analysis, for RQ2 weconclude that the crash probabilities do not consistently

9
(a) With -O0 Optimization
(b) With -O1 Optimization
(c) With -O2 Optimization
(d) With -O3 Optimization
Fig. 4: Program crash probabilities measured by LLFI and PINFI
match between LLFI and PINFI for all optimization levels.Further, the accuracy of the crash probability measurementsis influenced by the compiler optimizations applied to theprogram, especially going from -O0 to -O1.
4.3 DiscussionWhen a program is compiled using a specified optimizationlevel, optimization passes are applied to the code at boththe IR level and in the compiler back end. As a result,the compiled IR of a program only has some of the opti-mizations applied, while the corresponding executable ofthe program will have the rest of the optimizations as well(those applied in the compiler back end). While IR-leveloptimization passes typically apply platform-independentcode transformations that affect the data flow of the pro-gram, back end optimizations often target platform-specific
transformations such as those involving register allocationand memory operations.
We observed that the SDC probabilities are measuredaccurately by IR-level FI when compared with assembly-level FI. This observation makes sense, considering SDCs(i.e., incorrect outputs) can be mostly attributed to errorsin a program’s data flow, which is relatively unaffected byback end optimizations. On the other hand, we found thatthe accuracy of crash probability measurements noticeablysuffers when more optimizations are applied to the pro-gram. A program’s IR and assembly code share commonfront and middle end compilations, but have differing backend compilations due to optimizations not visible at the IRlevel. Thus, the accuracy of crash probability measurementsseem to be affected by back end optimizations (Section 5).

10
5 EFFECTS OF MEMORY ADDRESS INSTRUCTIONS
Section 4 presents us with some useful insights into theaccuracy of IR-level FI with respect to assembly-level FI.We observed that while IR-level FI can provide SDC proba-bility measurements as accurately as assembly-level FI evenwith all of the standard optimizations applied, it does notprovide the same level of accuracy in its crash probabilitymeasurements when those optimizations are applied.
In this section, we expand on our insights as to whythis might be the case by introducing the concept of memoryaddress instructions. We then illustrate how the patternsobserved in the crash probability measurements in Section 4are correlated with a program’s percentage of memoryaddress instructions. This section provides the basis for ourmachine-learning-based prediction technique in Section 6.
5.1 Overview of Memory Address Instructions
We begin this section with an introduction to what wecall memory address instructions. In short, a memory addressinstruction is an instruction whose output (i.e., the value inits destination register) is a memory address value that iseventually used by a load or store instruction that reads orwrites to memory.
A major cause for crashes is segmentation faults [15],[16], which occur when a memory load or store instructiontries to read from or write to an “illegal” memory location.This can happen when an error propagates to the memoryinstruction operand, such as the address of load or storeinstructions. The fault that may cause such an error canoccur in the memory instruction itself, or any previousinstruction that operates on the stored value of the memoryaddress used.
Many back end optimizations operate on a program’sinteractions with memory; for example, a register allocationoptimization pass (typically applied in the compiler backend) determines how the compiler assigns program vari-ables to the target architecture’s limited number of registers,and when it is necessary to spill the excess data to memory.Thus, it is likely that the inaccuracies in crash probabilitymeasurements at higher optimization levels are correlatedwith how the optimizations influence the amount of thesememory address instructions.
To illustrate this concept, consider the x86-64 assemblycode segment in Figure 5, which is taken from the backpropbenchmark compiled at -O3 optimization. The instructionsin lines (1) and (2) add 0x4 to the values in registers rsiand rdx, respectively. Several instructions later, in lines (8)and (9), the values in each of the respective registers areused as memory addresses for load operations. We thereforeconsider the instructions in lines (1) and (2) to be memoryaddress instructions; if an error were injected into the des-tination register of one of these instructions, the error willpropagate to the address of a memory instruction. Note thatwe only consider errors that occur in an instruction’s desti-nation register, as per our fault model. Thus, instructions (8)and (9) are not considered memory address instructions asan injection into one of these instructions would not affectany memory address values.
Fig. 5: x86-64 assembly code segment from the backpropbenchmark; instructions 1 and 2 are considered memoryaddress instructions
5.2 Measuring Memory Address Instruction Percent-ages
We develop a tool that, given a set of programs compiledto both IR and assembly, measures the amount of memoryaddress instructions executed dynamically at both the IRand assembly level. Our tool profiles memory address in-structions from the dynamic execution of the program, butonly counts instructions whose return values are used asaddresses in subsequent load or store instructions within thesame basic block as the instruction in question.
This is because tracing memory dependencies acrossbasic blocks through the entire execution of the programincurs very high overhead, and for large programs (suchas the types of applications typically tested using faultinjection) the time required to perform this analysis wouldbe much too high. That being said, while limiting theprofiling to only memory dependencies within basic blocksexclude instructions that propagate memory dependenciesbetween basic blocks, it does capture most of the crash-causing errors; most crashes occur within the same basicblock as the faulty instruction [20], [58].
We use the standard definition of a basic block: a setof consecutive instructions with no branches/jumps in orout of the middle of the block. At the IR level, identifyingthe boundaries of the basic blocks is trivial as LLVM IRcode is already structured in basic blocks [24]. For assemblycode, we determine this programmatically as part of ourprofiling tool; we parse the compiled assembly code andidentify the boundaries of the blocks based on branch/jumpinstructions. Note that there may be some corner cases thatare not covered by our tool at the assembly code level(e.g., indirect branches that jump to the middle of a basicblock). However, these cases are rare in practice, and can beaddressed by using a more sophisticated disassembler [59].
Our tool follows the following process at both the IR andassembly levels:
1) We first obtain a sampling of the instructions executed.Sampling, as opposed to using the entire set of executedinstructions, provides us with a low-overhead methodof obtaining a statistical estimate of the frequency ofinstruction execution. For example, sampling took atmost a few hours on each of the benchmarks, whileanalyzing the entire set of instructions took severaldays even for our smallest benchmark. Furthemore, thesampling methodology is consistent with that used forselecting fault injection targets.• IR-level: We use the FI logs produced by LLFI to pro-
11
vide us with a sampling of the dynamically executedinstructions.
• Assembly-level: We use a PIN-based instructionsampling tool to sample instructions as they areexecuted dynamically. Further, our tool borrows codefrom PINFI to limit the selection of the instructionsampling to only those instructions that are relevantto the chosen fault model (i.e., the chosen PINFIconfiguration). This is to keep our tool’s analysisconsistent with the IR-level analysis and with thefault model in question.
2) Using the static IR and disassembled x86-64 assemblycode respectively, we parse the sets of static instructionsand record which instructions are memory addressinstructions with respect to their basic blocks.
3) We obtain the total amounts of memory address in-structions executed dynamically by counting the fre-quency of each recorded instruction in the sampling.
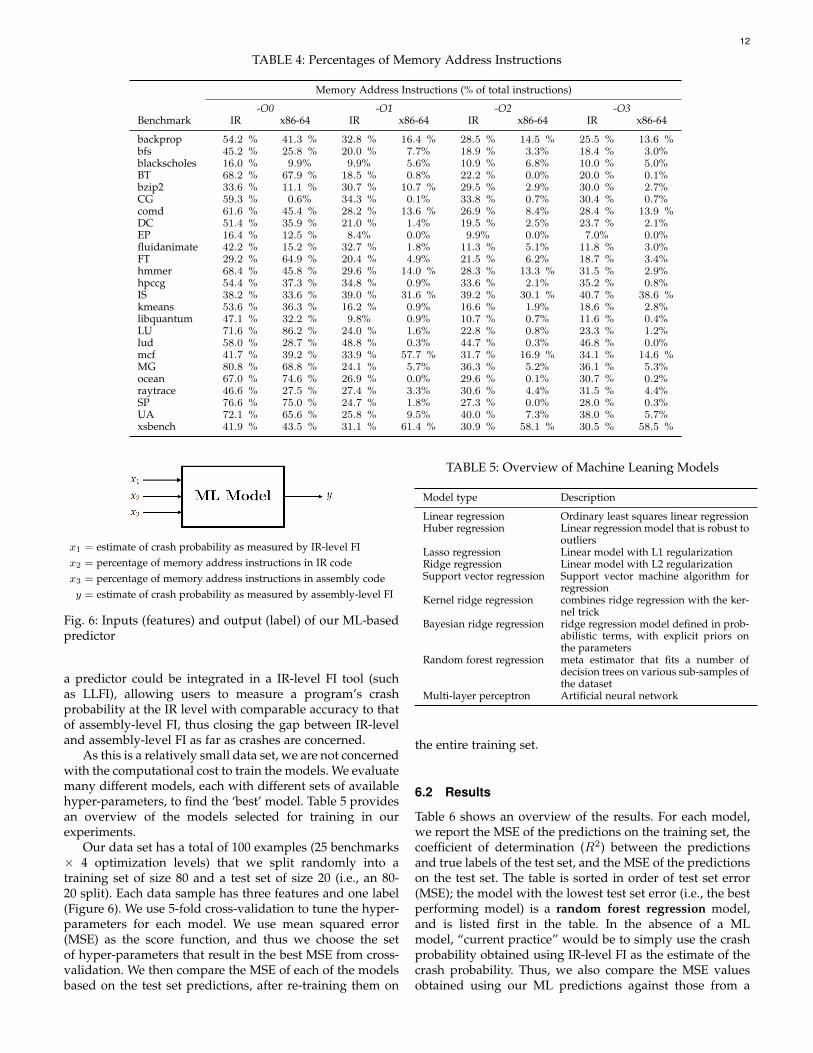
We peform this analysis across the set of benchmarks andoptimization levels, obtaining the amounts of both IR- andassembly-level memory address instructions as percentagesof the total number of instructions sampled. For each bench-mark and optimization level, we show the correspondingpercentages measured by our tool in Table 4.
5.3 Correlation with Crash ProbabilitiesTable 4 shows the measured percentages of memory ad-dress instructions for each benchmark, at both the IR andassembly level. At -O0, we observe that at the IR andassembly level the values change little compared to theother optimization levels; however, at -O0 the average ratiobetween the two values (x86-64/IR) is 0.7914 compared to0.3479, 0.2806, 0.2573 at -O1, -O2, and -O3 respectively. InSection 4.2.2, we observe a similar pattern in the measuredcrash probabilities. Thus, in this section we investigate howthese ratios correlate with those of the crash probabilitymeasurements.
To investigate this, we first calculate (1) the ratio of crashprobabilities measured by PINFI over that of LLFI, and (2)the ratio of percentage of memory address instructions forassembly code over that of IR. In effect, these ratios are the“gain” applied by the compiler back end optimizations foreach respective metric, i.e., the factor by which the compilerback end increases (or decreases) either the crash probabilityor the percentage of memory-depenent instructions whenback end optimizations are applied.
Next, we ask the question: is the gain in the memoryaddress instruction percentage correlated with the gain in thecrash probability measurement? To answer this question, wecalculate the correlation coefficient of the set of ratios at eachoptimization level. A strong correlation (i.e., close to ±1)would indicate that any change we see from IR to assemblyin the measured crash probability is correlated with thechange in percentage of memory address instructions.
We find that at -O0 the correlation coefficient is −0.01296while at -O1, -O2, and -O3 the coefficients are 0.41205,0.71066, and 0.64522 respectively. A correlation coefficientabove 0.5 typically indicates a moderately strong correla-tion. The dramatic change in the correlation from -O0 to thehigher levels of optimization suggests that the inaccuracies
in the crash rate can be explained by the relative percentagesof memory address instructions at -O1 to -O3, but not at -O0()as there is no optimization applied to the program).
6 CRASH PROBABILITY ESTIMATION USING MLIn Section 4, we observed that IR-level FI is not as accurateas assembly-level FI for measuring the crash probabilityof programs due to transient hardware faults. Given thesignificant advantages of IR-level FI over assembly-level FIhighlighted in Section 2.3, e.g., easier analysis with respectto the source code and portability, a more accurate measure-ment using IR-level FI would prove useful.
In Section 5, we found that when optimizations areapplied, there is a correlation between the change in theamount of memory address instructions, and the change inmeasured crash probabilities from a program’s IR to as-sembly level code. In other words, there appears to bea correlation between how compiler optimizations affectmeasured crash probabilities (at the respective levels), andhow they affect the percentages of memory address instruc-tions. Further, it is clear from Table 4 that the applicationof back end optimizations (i.e., not at -O0) have a muchmore significant effect on memory address instructions thanwhen no optimization (i.e., -O0) is applied. This is in linewith our intuition since we have observed in Section 4 thatcrash probability measurements are also affected by backend optimizations.
These are useful insights as measuring a program’s per-centage of memory address instructions at both the IR-leveland assembly-level is fairly straightforward. Even moreimportantly however, is that the process is much quickerthan performing thousands of fault injections in order toobtain both the IR- and assembly-level crash probabilities.Therefore, it is worthwhile to pursue the implementation ofa technique that uses memory address instruction percent-ages to supplement IR-level fault injection experiments toprovide a program’s crash probability estimations that arecloser to that of assembly-level FI (without performing anyassembly-level FI experiments).
In this section, we present a ML-based crash probabil-ity prediction technique that effectively “closes the gap”between IR- and assembly-level FI with respect to crash-causing errors. We evaluate several different ML algorithmson the data gathered in prior sections (i.e., FI experimentresults and memory address instruction percentages) andcompare the resulting estimations against the original IR-level crash probability measurements.
6.1 Experimental Setup
We evaluate a variety of supervised ML models to deter-mine which would best fit the data. The types of ML modelswe evaluate are limited to regression, as we want to map ourinputs to a continuous-valued output. Our goal is to finda model, or a handful of models, that can predict a givenprogram’s crash probability as accurately as with assembly-level FI within a reasonable degree of confidence.
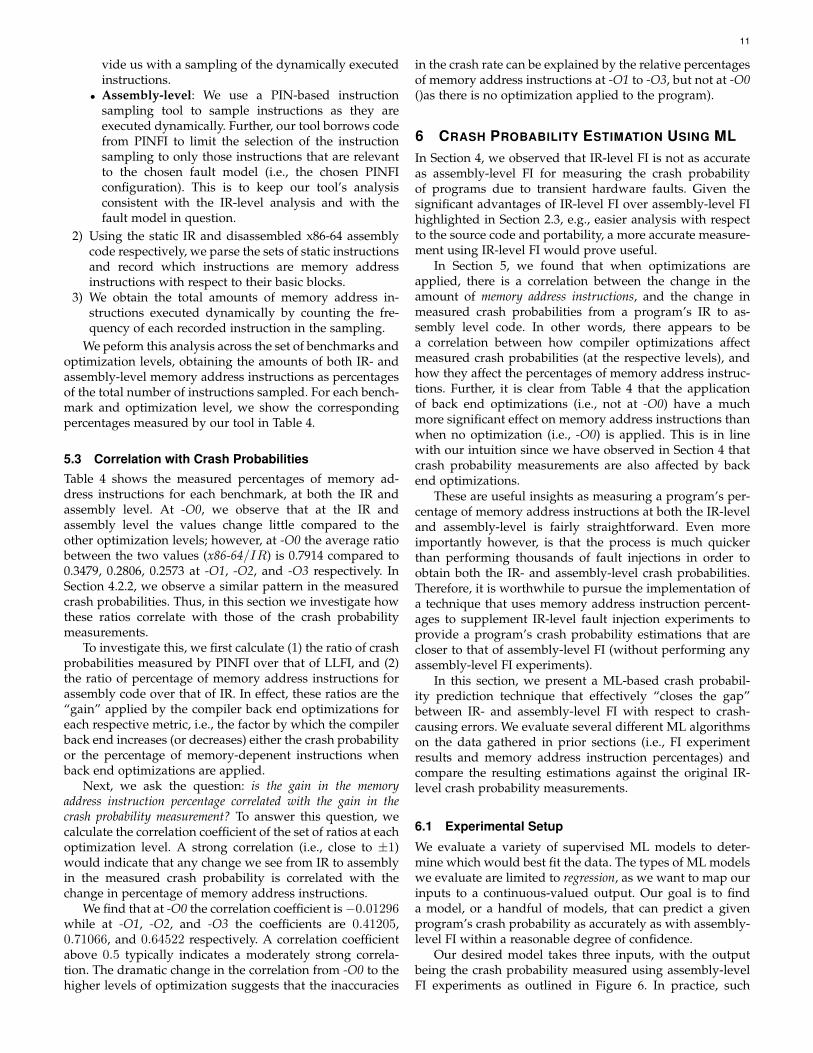
Our desired model takes three inputs, with the outputbeing the crash probability measured using assembly-levelFI experiments as outlined in Figure 6. In practice, such
12
TABLE 4: Percentages of Memory Address Instructions
Memory Address Instructions (% of total instructions)
-O0 -O1 -O2 -O3Benchmark IR x86-64 IR x86-64 IR x86-64 IR x86-64
backprop 54.2 % 41.3 % 32.8 % 16.4 % 28.5 % 14.5 % 25.5 % 13.6 %bfs 45.2 % 25.8 % 20.0 % 7.7% 18.9 % 3.3% 18.4 % 3.0%blackscholes 16.0 % 9.9% 9.9% 5.6% 10.9 % 6.8% 10.0 % 5.0%BT 68.2 % 67.9 % 18.5 % 0.8% 22.2 % 0.0% 20.0 % 0.1%bzip2 33.6 % 11.1 % 30.7 % 10.7 % 29.5 % 2.9% 30.0 % 2.7%CG 59.3 % 0.6% 34.3 % 0.1% 33.8 % 0.7% 30.4 % 0.7%comd 61.6 % 45.4 % 28.2 % 13.6 % 26.9 % 8.4% 28.4 % 13.9 %DC 51.4 % 35.9 % 21.0 % 1.4% 19.5 % 2.5% 23.7 % 2.1%EP 16.4 % 12.5 % 8.4% 0.0% 9.9% 0.0% 7.0% 0.0%fluidanimate 42.2 % 15.2 % 32.7 % 1.8% 11.3 % 5.1% 11.8 % 3.0%FT 29.2 % 64.9 % 20.4 % 4.9% 21.5 % 6.2% 18.7 % 3.4%hmmer 68.4 % 45.8 % 29.6 % 14.0 % 28.3 % 13.3 % 31.5 % 2.9%hpccg 54.4 % 37.3 % 34.8 % 0.9% 33.6 % 2.1% 35.2 % 0.8%IS 38.2 % 33.6 % 39.0 % 31.6 % 39.2 % 30.1 % 40.7 % 38.6 %kmeans 53.6 % 36.3 % 16.2 % 0.9% 16.6 % 1.9% 18.6 % 2.8%libquantum 47.1 % 32.2 % 9.8% 0.9% 10.7 % 0.7% 11.6 % 0.4%LU 71.6 % 86.2 % 24.0 % 1.6% 22.8 % 0.8% 23.3 % 1.2%lud 58.0 % 28.7 % 48.8 % 0.3% 44.7 % 0.3% 46.8 % 0.0%mcf 41.7 % 39.2 % 33.9 % 57.7 % 31.7 % 16.9 % 34.1 % 14.6 %MG 80.8 % 68.8 % 24.1 % 5.7% 36.3 % 5.2% 36.1 % 5.3%ocean 67.0 % 74.6 % 26.9 % 0.0% 29.6 % 0.1% 30.7 % 0.2%raytrace 46.6 % 27.5 % 27.4 % 3.3% 30.6 % 4.4% 31.5 % 4.4%SP 76.6 % 75.0 % 24.7 % 1.8% 27.3 % 0.0% 28.0 % 0.3%UA 72.1 % 65.6 % 25.8 % 9.5% 40.0 % 7.3% 38.0 % 5.7%xsbench 41.9 % 43.5 % 31.1 % 61.4 % 30.9 % 58.1 % 30.5 % 58.5 %
x1 = estimate of crash probability as measured by IR-level FIx2 = percentage of memory address instructions in IR codex3 = percentage of memory address instructions in assembly codey = estimate of crash probability as measured by assembly-level FI
Fig. 6: Inputs (features) and output (label) of our ML-basedpredictor
a predictor could be integrated in a IR-level FI tool (suchas LLFI), allowing users to measure a program’s crashprobability at the IR level with comparable accuracy to thatof assembly-level FI, thus closing the gap between IR-leveland assembly-level FI as far as crashes are concerned.
As this is a relatively small data set, we are not concernedwith the computational cost to train the models. We evaluatemany different models, each with different sets of availablehyper-parameters, to find the ‘best’ model. Table 5 providesan overview of the models selected for training in ourexperiments.
Our data set has a total of 100 examples (25 benchmarks× 4 optimization levels) that we split randomly into atraining set of size 80 and a test set of size 20 (i.e., an 80-20 split). Each data sample has three features and one label(Figure 6). We use 5-fold cross-validation to tune the hyper-parameters for each model. We use mean squared error(MSE) as the score function, and thus we choose the setof hyper-parameters that result in the best MSE from cross-validation. We then compare the MSE of each of the modelsbased on the test set predictions, after re-training them on
TABLE 5: Overview of Machine Leaning Models
Model type Description
Linear regression Ordinary least squares linear regressionHuber regression Linear regression model that is robust to
outliersLasso regression Linear model with L1 regularizationRidge regression Linear model with L2 regularizationSupport vector regression Support vector machine algorithm for
regressionKernel ridge regression combines ridge regression with the ker-
nel trickBayesian ridge regression ridge regression model defined in prob-
abilistic terms, with explicit priors onthe parameters
Random forest regression meta estimator that fits a number ofdecision trees on various sub-samples ofthe dataset
Multi-layer perceptron Artificial neural network
the entire training set.
6.2 Results
Table 6 shows an overview of the results. For each model,we report the MSE of the predictions on the training set, thecoefficient of determination (R2) between the predictionsand true labels of the test set, and the MSE of the predictionson the test set. The table is sorted in order of test set error(MSE); the model with the lowest test set error (i.e., the bestperforming model) is a random forest regression model,and is listed first in the table. In the absence of a MLmodel, “current practice” would be to simply use the crashprobability obtained using IR-level FI as the estimate of thecrash probability. Thus, we also compare the MSE valuesobtained using our ML predictions against those from a

13
“current practice” model that predicts y = x1, shown inTable 6.
In addition to reporting the MSE and R2 values for eachtrained model, we provide the predicted crash probabilitiesand perform the same statistical analyses on the predictions,as was done in Section 4, for the “best” model (i.e., therandom forest regression model). The crash probability pre-dictions are plotted for each benchmark and optimizationlevel in Figure 8, alongside the measurements made byPINFI for comparison.
The least squares regression analysis results are shownin Table 7, and the t-test p-values and Spearman’s rankcorrelation coefficients are shown in Table 8. Plots of themeasurements with least squares regression lines are shownin Figure 7.
TABLE 6: ML Model Results
Training MSE Test MSE Test R2
Random Forest Model1 0.000876 0.001824 0.8754Neural Net Model 0.001522 0.003803 0.7597SVR Model 0.009554 0.007247 0.5421Lasso Model 0.008206 0.007309 0.5381Bayesian Ridge Model 0.008168 0.007404 0.5322Huber Model 0.008468 0.007486 0.5270Ridge Model 0.008153 0.007644 0.5170LR Model 0.008152 0.007682 0.5146Kernel Model 0.002118 0.022943 -0.4497
Current practice2 0.01595 0.01651 0.41144
Models are sorted in order of increasing test set MSE(i.e., the best performing models are listed first)
1 Model with lowest test MSE2 Using model that simply predicts y = x1
(a) LLFI estimations (b) ML estimations
Fig. 7: Program Crash probabilities measured by PINFIplotted against those measured by LLFI (a) and those pre-dicted using a random forest regression model (b), with leastsquares regression line. The ideal line of best fit is a line withslope of 1 and y-intercept of 0.
TABLE 7: Least Squares Regression Analysis Comparison(LLFI vs. ML Crash Probability Estimates)
slope, m y-intercept, b R2
LLFI estimates 0.7405± 0.1536 0.1313± 0.0447 0.4868ML estimates 0.9022± 0.0442 0.0265± 0.0129 0.9446
We find that for all models apart from the kernel model,both the training and test MSE of the supervised ML models
TABLE 8: Statistical Test Result Comparison (LLFI vs. MLCrash Probability Estimates)
LLFI estimates ML estimates
p-value† 6.036e−8 0.70127
Correlation coeff.‡ 0.73321 0.97171
†Measured using paired sample t-test (Section 4.1.4)‡Measured using Spearman’s rank test (Section 4.1.4)
are much lower than that of IR-level FI (i.e., current prac-tice). The coefficient of determination R2 (taken betweenthe actual and predicted labels of the test set) ranges from0.4497 to 0.8754, indicating a wide range of explanatorypower depending on the model; a R2 close to 1 indicates astrong explanation of variability in the model, while a valueclose to 0 indicates a weak explanation.
A better indicator of a good ML model than R2 is itstest error. The model that results in the best test error isa random forest regression model with 16 decision trees and 3maximum features per tree. This model offers a test MSE that ismuch smaller than most other models at 0.001824, and over9 times smaller than IR-level FI on its own (this is roughlyan order of magnitude better). Random forest regression isan algorithm that produces a number of decision trees onrandom subsets of the dataset, a very different process fromthe other models that are mostly different versions of linearregression models. Our results indicate that a decision tree-based model is best suited to making predictions on thistype of dataset, with a multi-layer perceptron model (i.e., aneural network) coming a close second.
Next, we compare the predictions made using the ran-dom forest regression model with the LLFI crash probabilitymeasurements using the least squares regression analysisand paired sample t-test (Section 4). We notice a sizeableimprovement in the least squares regression analysis fromLLFI to the ML predictions (Figure 7). With respect to thepaired sample t-test, the p-value for the LLFI measurementsis notably smaller than the cutoff of 0.05 while the p-valuefor the ML predictions is much higher at 0.70127. Thistells us that while we can reject the null hypothesis forLLFI crash probability measurements (i.e., LLFI and PINFIcrash probability measurements are significantly different),we cannot reject the null hypothesis for the ML predictions(i.e., the ML predictions are not significantly different fromPINFI crash probability measurements).
The Spearman’s rank correlation test gives us similarfindings: the ranked correlation coefficient for the ML pre-dictions is much closer to 1 than that of the LLFI measure-ments. In fact, we see that the correlation coefficient for theML predictions is very nearly 1 with a value of 0.97171.We therefore conclude that the predictions made using therandom forest regression model are extremely sensitive tothe relative rankings of program crash probabilities.
Based on these results, we conclude that supervised MLis a reasonable approach to estimating a more accurate pro-gram crash probability measurement with only IR-level FIexperiments. ML is able to take advantage of the correlationsbetween the percentage of memory address instructions in aprogram and its crash probability, giving us a more accurateestimate of the latter using only IR-level FI. This allows

14
(a) With -O0 Optimization
(b) With -O1 Optimization
(c) With -O2 Optimization
(d) With -O3 Optimization
Fig. 8: Program crash probabilities estimated by LLFI improved with the random-forest regression model vs. PINFI
practitioners to reap the benefits of performing FI at theIR level while still obtaining comparable measurements of aprogram’s crash probability as assembly-level FI.
7 CONCLUSION AND FUTURE WORK
7.1 Conclusion
As random bit-flips caused by transient hardware errors arebecoming more common, researchers and software design-ers are relying more on fault injection (FI) to evaluate theresilience of software techniques in vulnerable systems. Inthis study, we investigated the accuracy of IR-level FI, i.e.,fault injection that is performed at the IR level of a program.IR-level FI has benefits over assembly-level FI, includingeasier portability and mapping to the original source code.
In this paper, we first performed an extensive com-parison study to re-examine the accuracy of the statisticalestimates of coverage derived from FI studies at the IR levelwith respect to FI performed at the assembly level. Specifi-cally, we compared the results of FI performed at the LLVM
IR level with those at the x86-64 assembly level, as these arethe dominant platforms used by prior work in this area. Ourfindings showed that IR-level FI provides measurementsof program SDC probabilities that are as accurate as thosemeasured using assembly-level FI, however the same is nottrue for crash probability measurements.
Further, based on an observed correlation between mea-sured crash probabilities and the amount of executed in-structions that operate on memory address values, we pro-posed a machine-learning-based approach to improving theaccuracy of crash probability measurements using IR-levelFI. We trained a variety of different algorithms, and findthat the “best” model (i.e., the one with the best test seterror) resulted in a test set error that is over 9 times smallerthan that of the raw IR-level FI measurements.
7.2 Future WorkThere are two potential directions for future work.
1. Extending the comparison to other platforms: Wefocused on evaluating the accuracy of LLVM IR-level FI

15
with respect to x86-64 assembly-level FI. While these twoplatforms are popular and are commonly used in bothresearch and industry, it would be useful to conduct thesame comparisons on other common platforms.
2. Improving the machine learning study Our machinelearning study can be improved by (1) adding additionalfeatures to improve prediction capabilities, (2) implement-ing feature selection techniques to identify the most andleast important features, and (3) improving the size andquality of the training data set.
All the data and tools in this paper are available at:https://github.com/DependableSystemsLab/ISSRE19We have also released the crash rate estimator tool at:https://github.com/DependableSystemsLab/LLFI-CrashRateEstimator
ACKNOWLEDGEMENT
This research was partially supported by the NaturalSciences and Engineering Research Council of Canada(NSERC) through the Discovery Grants and Strategic ProjectGrants (SPG) Programmes. We thank the anonymous re-viewers of TDSC for their insightful comments.
REFERENCES[1] M. Snir, R. W. Wisniewski, J. A. Abraham, S. V. Adve,
S. Bagchi, P. Balaji, J. Belak, P. Bose, F. Cappello, B. Carlson,A. A. Chien, P. Coteus, N. A. Debardeleben, P. C. Diniz,C. Engelmann, M. Erez, S. Fazzari, A. Geist, R. Gupta, F. Johnson,S. Krishnamoorthy, S. Leyffer, D. Liberty, S. Mitra, T. Munson,R. Schreiber, J. Stearley, and E. V. Hensbergen, “Addressingfailures in exascale computing,” Int. J. High Perform. Comput.Appl., vol. 28, no. 2, pp. 129–173, May 2014. [Online]. Available:http://dx.doi.org/10.1177/1094342014522573
[2] S. Borkar, “Designing reliable systems from unreliable compo-nents: the challenges of transistor variability and degradation,”IEEE Micro, vol. 25, no. 6, pp. 10–16, Nov 2005.
[3] C. Constantinescu, “Intermittent faults and effects on reliability ofintegrated circuits,” in 2008 Annual Reliability and MaintainabilitySymposium, Jan 2008, pp. 370–374.
[4] K. Constantinides, O. Mutlu, T. Austin, and V. Bertacco, “A flex-ible software-based framework for online detection of hardwaredefects,” IEEE Transactions on Computers, vol. 58, no. 8, pp. 1063–1079, Aug 2009.
[5] Y. Zhang, S. Ghosh, J. Huang, J. W. Lee, S. A. Mahlke,and D. I. August, “Runtime asynchronous fault tolerance viaspeculation,” in Proceedings of the Tenth International Symposiumon Code Generation and Optimization, ser. CGO ’12. NewYork, NY, USA: ACM, 2012, pp. 145–154. [Online]. Available:http://doi.acm.org/10.1145/2259016.2259035
[6] C. Weaver, J. Emer, S. S. Mukherjee, and S. K. Reinhardt,“Techniques to reduce the soft error rate of a high-performance microprocessor,” SIGARCH Comput. Archit. News,vol. 32, no. 2, pp. 264–, Mar. 2004. [Online]. Available:http://doi.acm.org/10.1145/1028176.1006723
[7] J. Calhoun, L. Olson, and M. Snir, “Flipit: An LLVM based faultinjector for HPC,” in Euro-Par 2014: Parallel Processing Workshops -Euro-Par 2014 International Workshops, Porto, Portugal, August 25-26,2014, Revised Selected Papers, Part I, 2014, pp. 547–558.
[8] Q. Lu, M. Farahani, J. Wei, A. Thomas, and K. Pattabiraman,“Llfi: An intermediate code-level fault injection tool for hardwarefaults,” in 2015 IEEE International Conference on Software Quality,Reliability and Security, Aug 2015, pp. 11–16.
[9] A. Thomas and K. Pattabiraman, “Error detector placementfor soft computation,” in Proceedings of the 2013 43rd AnnualIEEE/IFIP International Conference on Dependable Systems andNetworks (DSN), ser. DSN ’13. Washington, DC, USA:IEEE Computer Society, 2013, pp. 1–12. [Online]. Available:http://dx.doi.org/10.1109/DSN.2013.6575353
[10] J. Calhoun, M. Snir, L. Olson, and M. Garzaran, “Understandingthe propagation of error due to a silent data corruption in a sparsematrix vector multiply,” in 2015 IEEE International Conference onCluster Computing, Sept 2015, pp. 541–542.
[11] G. Li, K. Pattabiraman, S. K. S. Hari, M. Sullivan, and T. Tsai,“Modeling soft-error propagation in programs,” in 2018 48th An-nual IEEE/IFIP International Conference on Dependable Systems andNetworks (DSN), June 2018, pp. 27–38.
[12] L. Palazzi, G. Li, B. Fang, and K. Pattabiraman, “A tale of twoinjectors: End-to-end comparison of IR-level and assembly-levelfault injection,” in 2019 IEEE 30th International Symposium onSoftware Reliability Engineering (ISSRE), Oct 2019.
[13] J. Wei, A. Thomas, G. Li, and K. Pattabiraman, “Quantifyingthe accuracy of high-level fault injection techniques for hardwarefaults,” in 2014 44th Annual IEEE/IFIP International Conference onDependable Systems and Networks (DSN), vol. 00, June 2014, pp.375–382.
[14] G. Georgakoudis, I. Laguna, D. S. Nikolopoulos, andM. Schulz, “Refine: Realistic fault injection via compiler-based instrumentation for accuracy, portability and speed,” inProceedings of the International Conference for High PerformanceComputing, Networking, Storage and Analysis, ser. SC ’17. NewYork, NY, USA: ACM, 2017, pp. 29:1–29:14. [Online]. Available:http://doi.acm.org/10.1145/3126908.3126972
[15] B. Fang, Q. Lu, K. Pattabiraman, M. Ripeanu, and S. Gurumurthi,“epvf: An enhanced program vulnerability factor methodologyfor cross-layer resilience analysis,” in 2016 46th Annual IEEE/IFIPInternational Conference on Dependable Systems and Networks (DSN),June 2016, pp. 168–179.
[16] Weining Gu, Z. Kalbarczyk, and R. K. Iyer, “Error sensitivity of thelinux kernel executing on powerpc g4 and pentium 4 processors,”in International Conference on Dependable Systems and Networks, 2004,June 2004, pp. 887–896.
[17] J.-C. Laprie, “Dependable computing and fault tolerance: Con-cepts and terminology,” in Twenty-Fifth International Symposium onFault-Tolerant Computing, 1995,. IEEE, 1985, p. 2.
[18] S. Feng, S. Gupta, A. Ansari, and S. Mahlke, “Shoestring: Prob-abilistic soft error reliability on the cheap,” in Proceedings of theFifteenth Edition of ASPLOS on Architectural Support for ProgrammingLanguages and Operating Systems, ser. ASPLOS XV. New York, NY,USA: ACM, 2010, pp. 385–396.
[19] S. K. S. Hari, R. Venkatagiri, S. V. Adve, and H. Naeimi, “Ganges:Gang error simulation for hardware resiliency evaluation,” in 2014ACM/IEEE 41st International Symposium on Computer Architecture(ISCA), June 2014, pp. 61–72.
[20] G. Li, Q. Lu, and K. Pattabiraman, “Fine-grained characterizationof faults causing long latency crashes in programs,” in 2015 45thAnnual IEEE/IFIP International Conference on Dependable Systems andNetworks, June 2015, pp. 450–461.
[21] B. Fang, P. Wu, Q. Guan, N. DeBardeleben, L. Monroe, S. Blan-chard, Z. Chen, K. Pattabiraman, and M. Ripeanu, “Sdc is in theeye of the beholder: A survey and preliminary study,” in 2016 46thAnnual IEEE/IFIP International Conference on Dependable Systems andNetworks Workshop (DSN-W), June 2016, pp. 72–76.
[22] B. Fang, Q. Guan, N. Debardeleben, K. Pattabiraman, andM. Ripeanu, “Letgo: A lightweight continuous framework for hpcapplications under failures,” in Proceedings of the 26th InternationalSymposium on High-Performance Parallel and Distributed Computing,ser. HPDC ’17. New York, NY, USA: ACM, 2017, pp. 117–130.[Online]. Available: http://doi.acm.org/10.1145/3078597.3078609
[23] B. Fang, H. Halawa, K. Pattabiraman, M. Ripeanu, andS. Krishnamoorthy, “Bonvoision: Leveraging spatial datasmoothness for recovery from memory soft errors,” in Proceedingsof the ACM International Conference on Supercomputing, ser. ICS ’19.New York, NY, USA: ACM, 2019, pp. 484–496. [Online]. Available:http://doi.acm.org/10.1145/3330345.3330388
[24] C. Lattner and V. Adve, “LLVM: A Compilation Framework forLifelong Program Analysis & Transformation,” in Proceedings of the2004 International Symposium on Code Generation and Optimization(CGO’04), Palo Alto, California, Mar 2004.
[25] N. Oh, P. P. Shirvani, and E. J. McCluskey, “Error detection by du-plicated instructions in super-scalar processors,” IEEE Transactionson Reliability, vol. 51, pp. 63–75, 2002.
[26] M. de Kruijf, S. Nomura, and K. Sankaralingam, “Relax: An archi-tectural framework for software recovery of hardware faults,” inProceedings of the 37th Annual International Symposium on Computer

16
Architecture, ser. ISCA ’10. New York, NY, USA: ACM, 2010, pp.497–508.
[27] S. K. S. Hari, S. V. Adve, and H. Naeimi, “Low-cost program-leveldetectors for reducing silent data corruptions,” in DSN, pp. 181–188.
[28] J. Cong and K. Gururaj, “Assuring application-level correctnessagainst soft errors,” in IEEE International Conference on Computer-Aided Design, 2011, pp. 150–157.
[29] V. C. Sharma, A. Haran, Z. Rakamaric, and G. Gopalakrishnan,“Towards formal approaches to system resilience,” in 2013 IEEE19th Pacific Rim International Symposium on Dependable Computing,Dec 2013, pp. 41–50.
[30] G. A. Kanawati, N. A. Kanawati, and J. A. Abraham, “Ferrari:a flexible software-based fault and error injection system,” IEEETransactions on Computers, vol. 44, no. 2, pp. 248–260, Feb 1995.
[31] D. Li, J. S. Vetter, and W. Yu, “Classifying soft error vulnerabilitiesin extreme-scale scientific applications using a binary instrumen-tation tool,” in SC ’12: Proceedings of the International Conference onHigh Performance Computing, Networking, Storage and Analysis, Nov2012, pp. 1–11.
[32] U. Schiffel and C. Fetzer, “Hardware fault injection using dynamicbinary instrumentation: Fitgrind,” in Proceedings Supplemental Vol-ume of EDCC-6, 01 2006.
[33] B. Fang, K. Pattabiraman, M. Ripeanu, and S. Gurumurthi,“A systematic methodology for evaluating the error resilienceof gpgpu applications,” IEEE Trans. Parallel Distrib. Syst.,vol. 27, no. 12, pp. 3397–3411, Dec. 2016. [Online]. Available:https://doi.org/10.1109/TPDS.2016.2517633
[34] B. Fang, K. Pattabiraman, M. Ripeanu, and S. Gurumurthi, “Gpu-qin: A methodology for evaluating the error resilience of gpgpuapplications,” in 2014 IEEE International Symposium on PerformanceAnalysis of Systems and Software (ISPASS), March 2014, pp. 221–230.
[35] S. K. Vishal Chandra Sharma, Ganesh Gopalakrishnan, “Towardsreseiliency evaluation of vector programs,” in 21st IEEE Work-shop on Dependable Parallel, Distributed and Network-Centric Systems(DPDNS), 2016.
[36] D. Cotroneo, A. Lanzaro, and R. Natella, “Faultprog: Testing theaccuracy of binary-level software fault injection,” IEEE Transac-tions on Dependable and Secure Computing, vol. 15, no. 1, pp. 40–53,Jan 2018.
[37] J. A. Duraes and H. S. Madeira, “Emulation of software faults: Afield data study and a practical approach,” IEEE Transactions onSoftware Engineering, vol. 32, no. 11, pp. 849–867, Nov 2006.
[38] H. Madeira, D. Costa, and M. Vieira, “On the emulation of soft-ware faults by software fault injection,” in Proceeding InternationalConference on Dependable Systems and Networks. DSN 2000, June2000, pp. 417–426.
[39] D. Cotroneo, A. Lanzaro, R. Natella, and R. Barbosa, “Experi-mental analysis of binary-level software fault injection in complexsoftware,” in 2012 Ninth European Dependable Computing Conference,May 2012, pp. 162–172.
[40] J. Arlat, Y. Crouzet, J. Karlsson, P. Folkesson, E. Fuchs, and G. H.Leber, “Comparison of physical and software-implemented faultinjection techniques,” IEEE Transactions on Computers, vol. 52, no. 9,pp. 1115–1133, Sept 2003.
[41] M.-C. Hsueh, T. K. Tsai, and R. K. Iyer, “Fault injection techniquesand tools,” Computer, vol. 30, no. 4, pp. 75–82, April 1997.
[42] H. Cho, S. Mirkhani, C.-Y. Cher, J. A. Abraham, andS. Mitra, “Quantitative evaluation of soft error injectiontechniques for robust system design,” in Proceedings ofthe 50th Annual Design Automation Conference. New York,NY, USA: ACM, 2013, pp. 101:1–101:10. [Online]. Available:http://doi.acm.org/10.1145/2463209.2488859
[43] C. Chen, G. Eisenhauer, M. Wolf, and S. Pande, “Ladr: Low-cost application-level detector for reducing silent output corrup-tions,” in Proceedings of the 27th International Symposium on High-Performance Parallel and Distributed Computing, ser. HPDC ’18.New York, NY, USA: ACM, 2018, pp. 156–167.
[44] A. A. Porter and R. W. Selby, “Empirically guided software de-velopment using metric-based classification trees,” IEEE Software,vol. 7, no. 2, pp. 46–54, March 1990.
[45] L. C. Briand, V. R. Brasili, and C. J. Hetmanski, “Developinginterpretable models with optimized set reduction for identifyinghigh-risk software components,” IEEE Transactions on SoftwareEngineering, vol. 19, no. 11, pp. 1028–1044, Nov 1993.
[46] F. Lanubile, A. Lonigro, and G. Vissagio, “Comparing models for
identifying fault-prone software components.” in SEKE, 1995, pp.312–319.
[47] N. Ohlsson, M. Zhao, and M. Helander, “Application of multivari-ate analysis for software fault prediction,” Software Quality Journal,vol. 7, no. 1, pp. 51–66, Mar 1998.
[48] C. Catal and B. Diri, “A systematic review of software faultprediction studies,” Expert systems with applications, vol. 36, no. 4,pp. 7346–7354, 2009.
[49] B. Farahani and S. Safari, “A cross-layer approach to onlineadaptive reliability prediction of transient faults,” in 2015 IEEEInternational Symposium on Defect and Fault Tolerance in VLSI andNanotechnology Systems (DFTS). IEEE, 2015, pp. 215–220.
[50] Q. Lu, G. Li, K. Pattabiraman, M. S. Gupta, and J. A. Rivers,“Configurable detection of sdc-causing errors in programs,” ACMTrans. Embed. Comput. Syst., vol. 16, no. 3, pp. 88:1–88:25, Mar. 2017.
[51] C. Kalra, F. Previlon, X. Li, N. Rubin, and D. Kaeli, “Prism: Pre-dicting resilience of gpu applications using statistical methods,” inProceedings of the International Conference for High Performance Com-puting, Networking, Storage, and Analysis, ser. SC’18. Piscataway,NJ, USA: IEEE, 2018, pp. 69:1–69:14.
[52] A. Merkel and F. Bellosa, “Memory-aware scheduling for energyefficiency on multicore processors.” HotPower, vol. 8, pp. 123–130,2008.
[53] A. Jaleel, “Memory characterization of workloads usinginstrumentation-driven simulation,” Web Copy: http://www. glue.umd. edu/ajaleel/workload, 2010.
[54] D. H. Bailey, E. Barszcz, J. T. Barton, D. S. Browning, R. L. Carter,L. Dagum, R. A. Fatoohi, P. O. Frederickson, T. A. Lasinski,R. S. Schreiber et al., “The nas parallel benchmarks summary andpreliminary results,” in Supercomputing’91: Proceedings of the 1991ACM/IEEE conference on Supercomputing. IEEE, 1991, pp. 158–165.
[55] N. Gholkar, F. Mueller, and B. Rountree, “Uncore powerscavenger: A runtime for uncore power conservation on hpcsystems,” in Proceedings of the International Conference for HighPerformance Computing, Networking, Storage and Analysis, ser. SC’19. New York, NY, USA: ACM, 2019, pp. 27:1–27:23. [Online].Available: http://doi.acm.org/10.1145/3295500.3356150
[56] S. C. Woo, M. Ohara, E. Torrie, J. P. Singh, and A. Gupta,“The splash-2 programs: Characterization and methodologicalconsiderations,” in Proceedings of the 22Nd Annual InternationalSymposium on Computer Architecture, ser. ISCA ’95. NewYork, NY, USA: ACM, 1995, pp. 24–36. [Online]. Available:http://doi.acm.org/10.1145/223982.223990
[57] F. A. Morrison, “Obtaining uncertainty measures on slopeand intercept of a least squares fit with excel’s linest,” 2014.[Online]. Available: http://pages.mtu.edu/∼fmorriso/cm3215/UncertaintySlopeInterceptOfLeastSquaresFit.pdf
[58] G. Li, K. Pattabiraman, C. Cher, and P. Bose, “Experience report:An application-specific checkpointing technique for minimizingcheckpoint corruption,” in 2015 IEEE 26th International Symposiumon Software Reliability Engineering (ISSRE), Nov 2015, pp. 141–152.
[59] D. Andriesse, X. Chen, V. Van Der Veen, A. Slowinska, and H. Bos,“An in-depth analysis of disassembly on full-scale x86/x64 bina-ries,” in 25th {USENIX} Security Symposium ({USENIX} Security16), 2016, pp. 583–600.
Lucas Palazzi is a former MASc student at the University of BritishColumbia (UBC), having graduated the program in 2019. He receivedhis BASc in Electrical Engineering at the University of Windsor in 2017.Lucas’s research interests include fault tolerance and fault injectiontechniques and methodologies.Bo Fang received his bachelor’s from Wuhan University, China in 2006and MASc and PhD from the University of British Columbia (UBC)in 2014 and 2020 respectively. He is now a research associate atPacific Northwest National Laboratory. Bo’s research interests includefault tolerance applications and systems, compilers, machine learningaccelerators, and quantum computing.Guanpeng Li received his BASc (2014) and PhD (2019) degrees fromthe University of British Columbia, and has recently joined the Depart-ment of Computer Science at the University of Iowa as an assistant pro-fessor. Guanpeng’s research interests include error resilient systems,compilers, and software testing.Karthik Pattabiraman received his MS and PhD degrees from theUniversity of Illinois at Urbana-Champaign (UIUC) in 2004 and 2009 re-spectively. After a post-doctoral stint at Microsoft Research (Redmond),Karthik joined the University of British Columbia (UBC) as an assistantprofessor of electrical and computer engineering. Karthik’s researchinterests include building error resilient software systems, software en-gineering, and security.